Article

Surface Activation of Sugarcane Bagasse via Nanobubble Water for Enhanced Liquefaction Kinetics


1
Graduate School of Science and Engineering, Saitama University, 255 Shimo-Okubo, Sakura-ku, Saitama 338-8570, Japan
2
Graduate School of Engineering, The University of Tokyo, 7-3-1 Hongo, Bunkyo-ku, Tokyo 113-8656, Japan
*
Author to whom correspondence should be addressed.
Physchem 2026, 6(3), 45; https://doi.org/10.3390/physchem6030045
Submission received: 30 April 2026 / Revised: 9 July 2026 / Accepted: 11 July 2026 / Published: 17 July 2026
(This article belongs to the Section Surface Science)

Abstract

Most research on Nanobubble Water (NBW) for lignocellulose conversion has focused on anaerobic digestion, with relatively few studies examining direct pretreatment methods such as liquefaction. In this study, we explored the potential of NBW as a pretreatment method for bagasse meal liquefaction. Bagasse meal was treated with oxygen, nitrogen, and carbon dioxide NBW. Changes in component composition ratio, crystallinity, total crystallinity index (TCI), lateral order index (LOI), pyrolysis peak temperature (Tmax), and apparent activation energy (Ea′) were investigated. For the liquefaction process, changes in residue content, apparent liquefaction reaction rate constant (k′), average molecular weight, hydroxyl value, functional group information, and Tmax of the liquefied residue were examined. Results showed a 2.0–3.0% decrease in cellulose and a 1.0–4.0% decrease in lignin. Crystallinity increased by 5.8–12%, TCI decreased by 6.7–13%, and LOI increased by 4.7–9.8%. Tmax decreased by 1.6–3.5 °C, and Ea′ decreased by 1.9–2.8%, both reaching their lowest values with carbon dioxide NBW. At this time, the residue content decreased by 6.3–19%, and k′ increased by 50%. These findings indicate that NBW pretreatment is a promising approach for liquefying bagasse meal under laboratory conditions. Future investigations will be directed towards its scalability and economic viability.

1. Introduction

Global warming has been progressing rapidly in recent years. To curb climate change, breaking away from dependence on fossil resources and promoting sustainable resources have become urgent priorities [1]. Among these, plant-derived waste lignocellulosic biomass is expected to serve as a renewable alternative resource, as it absorbs carbon dioxide through photosynthesis and can be produced semi-permanently using sunlight and water. Sugarcane is one of the world’s largest crops by gross production volume, grown primarily in tropical and subtropical regions including Asia, South America, and Oceania, with production volumes increasing annually [2]. This crop accounts for approximately 86% of global sugar production [3] and is the world’s second most important biofuel source [4]. The residue left after sugarcane is pressed is called bagasse. The sugar production process generates about 300 kg of bagasse per ton of raw material [5,6]. This amount constitutes approximately 80% of the total waste generated at sugar mills [7]. While much of the bagasse is burned as fuel at the mills, about 50% of the total generated bagasse may be accumulated as a surplus resource [8]. This surplus bagasse is often processed through inefficient combustion or open burning, contributing to environmental pollution from particulate matter dispersion and ash landfill, as well as health hazards such as respiratory diseases [9,10]. Despite being a vast source of lignocellulosic biomass waste, much of it is improperly managed. Therefore, establishing effective utilization technologies to enhance the value of bagasse is essential from the perspective of reducing environmental impact and promoting resource circulation. Liquid conversion technology, which chemically transforms lignocellulose, is a useful method for decomposing high-molecular-weight solid components into low-molecular-weight liquids [11,12,13,14] to obtain resin precursors. Our laboratory has actively pursued the production of lignocellulose-based polyurethane foam [15,16], epoxy resin [17], and polyurea [18]. However, these technologies remain confined to the laboratory scale. Simultaneously, the robust refractory nature of the raw material poses a significant barrier when applying liquefaction technology to lignocellulose. Lignocellulose consists of cellulose containing crystalline domains [19], branched hemicellulose [20], and aromatic polymeric lignin [21], which are intricately intertwined to form a highly complex three-dimensional network. Particularly, the strong lignin-carbohydrate (LCC) bonds and the presence of crystalline regions inevitably inhibit the solvent-assisted decomposition reaction. Pretreatments such as instantaneous catapult steam explosion (2.0 MPa, 5 min) [22], sodium hydroxide pretreatment (140 °C, 280 min) [23], N-methylmorpholine-N-oxide pretreatment (120 °C, 1 h) [24], and autoclave pretreatment using dilute sulfuric acid, dilute potassium hydroxide, or ethanol (4 bar, 80–120 °C, 15–45 min) [25] have been employed to address this issue. However, these physical and chemical approaches involve energy costs and equipment costs associated with maintaining high pressure and high temperature, as well as environmental burdens from chemical usage. Against this backdrop, there is a demand for creating low-cost, low-environmental-impact pretreatment technologies.
Nanobubbles (NBs) are ultrafine gas bubbles present in a liquid phase with a volume-equivalent diameter of less than 1 μm [26]. Although their distribution varies depending on generation methods and liquid properties, typically they have diameters of 100–400 nm and zeta potentials ranging from neutral to −10 to −30 mV, and they can persist in water for several days to weeks, and in some cases, up to several months [27,28,29,30]. Leveraging these properties, NBs are widely utilized primarily in water treatment [31], biomedical applications [32], and agriculture [33]; recent studies have also explored their role in lignocellulose conversion. Specifically, NBW has been shown to promote the anaerobic digestion of lignocellulose [34,35,36,37,38,39,40]. The addition of air, carbon dioxide, or oxygen to NBW accelerated the decrease in cellulose crystallinity by 14–21% and increased methane yield by 10–30% [34,35], an effect attributed to enhanced hydrolysis caused by the high water-molecule mobility within the NBW. In contrast, nitrogen NBW increased lignin degradation rates by 10–13% and improved biomethane yields by 17–22% [36,37], which was thought to be due to OH radicals generated from the NBW promoting lignin depolymerization. In a study adding hydrogen NBW to corn stalks, the degradation rates of cellulose and hemicellulose increased by 33% and 25.7%, respectively, and the biomethanation yield increased by 25.29% [38]. In a two-stage anaerobic water-added digestion of rice straw, carbon dioxide NBW decomposed amorphous components, improving biogas methane yield by 7.79–21.4% [39,40]. This was attributed to pH reduction by weak acids promoting hydrolysis and acidification. These results demonstrate that NBW can assist with lignocellulose conversion, strongly supporting the economic and environmental advantages of this technology. Therefore, the authors proposed the following hypotheses regarding the modification effects of NBW on bagasse meal: (i) NBW can decompose amorphous components, (ii) NBW can amorphize crystalline regions, and (iii) NBW can relax hydrogen bonds and aromatic networks. With this: Despite these advances, the underlying structural modification mechanisms of NBW on lignocellulosic substrates, particularly at the molecular and supramolecular levels, remain insufficiently understood. Specifically, there is limited clarity on how NBW influences the interplay between amorphous and crystalline domains, disrupts hydrogen bonding networks, and alters aromatic lignin structures in complex biomass such as bagasse. To address this gap, this study focuses on elucidating the role of NBW in: (i) decomposing amorphous components, (ii) inducing structural transformation of crystalline regions, and (iii) weakening intermolecular interactions, including hydrogen bonding and aromatic network stability.
Previous research applying NBW to lignocellulose liquefaction [18] revealed that ozone NBW decomposes amorphous components in woody biomass. As a result, liquefaction time was halved, the hydroxyl value of the product increased from 341 to 581 mg KOH/g, and viscosity decreased from 684 to 264 cP. This was attributed to ozone NBW unraveling tightly entangled molecular chains and relaxing hydrogen bonds between cellulose molecules. However, the effect on liquefaction of milder gas NBW, excluding ozone, remains unclear. This study was carried out to clarify the effects of oxygen, nitrogen, and carbon dioxide NBW on the composition and crystalline state of bagasse meal. Furthermore, one gas NBW from among the three types that showed the most excellent modification effect was selected and applied to the liquefaction process. Through this application, the effects of NBW pretreatment on the liquefaction content of bagasse meal and the molecular weight and chemical structure of the liquefaction product were clarified. Ultimately, guidelines for low-cost, low-environmental-impact lignocellulose pretreatment technology were presented, with the aim of contributing to the spread of bio-products and the further development of green chemistry.

2. Materials and Methods

2.1. Materials

Bagasse was provided by the Okinawa Prefectural Agricultural Cooperative (Okinawa, Japan). All reagents were purchased from FUJIFILM Wako Pure Chemical Corporation (Osaka, Japan) and used without further purification. For characterization of bagasse meal, analytical reagent-grade (purity > 99.5%) reagents, including acetone, methanol, sodium chlorite, acetic acid, sodium hydroxide, and sulfuric acid, were used. Polyethylene glycol 400, glycerin, and sulfuric acid were used in the liquefaction process. Methanol and 0.1 M and 1 M sodium hydroxide solutions were used for filtration and neutralization after liquefaction. Tetrahydrofuran, 1,4-dioxane, phthalic anhydride, imidazole, and 1 M sodium hydroxide solution were used for characterizing the liquefaction products.

2.2. Preparation of Bagasse Meal

The supplied bagasse was spread thinly and thoroughly dried under atmospheric pressure beforehand. It was coarsely ground using a blender (YBS, AS ONE, Osaka, Japan), then finely ground using a continuous mill (MF 10.2, IKA, Staufen, Germany). Sieve separation was performed using an electric vibrating sieve shaker (AS200 Digit, Retsch GmbH, Haan, Germany), yielding bagasse meal with a particle size of 250 μm or less.

2.3. Nanobubble Water Pretreatment of Bagasse Meal

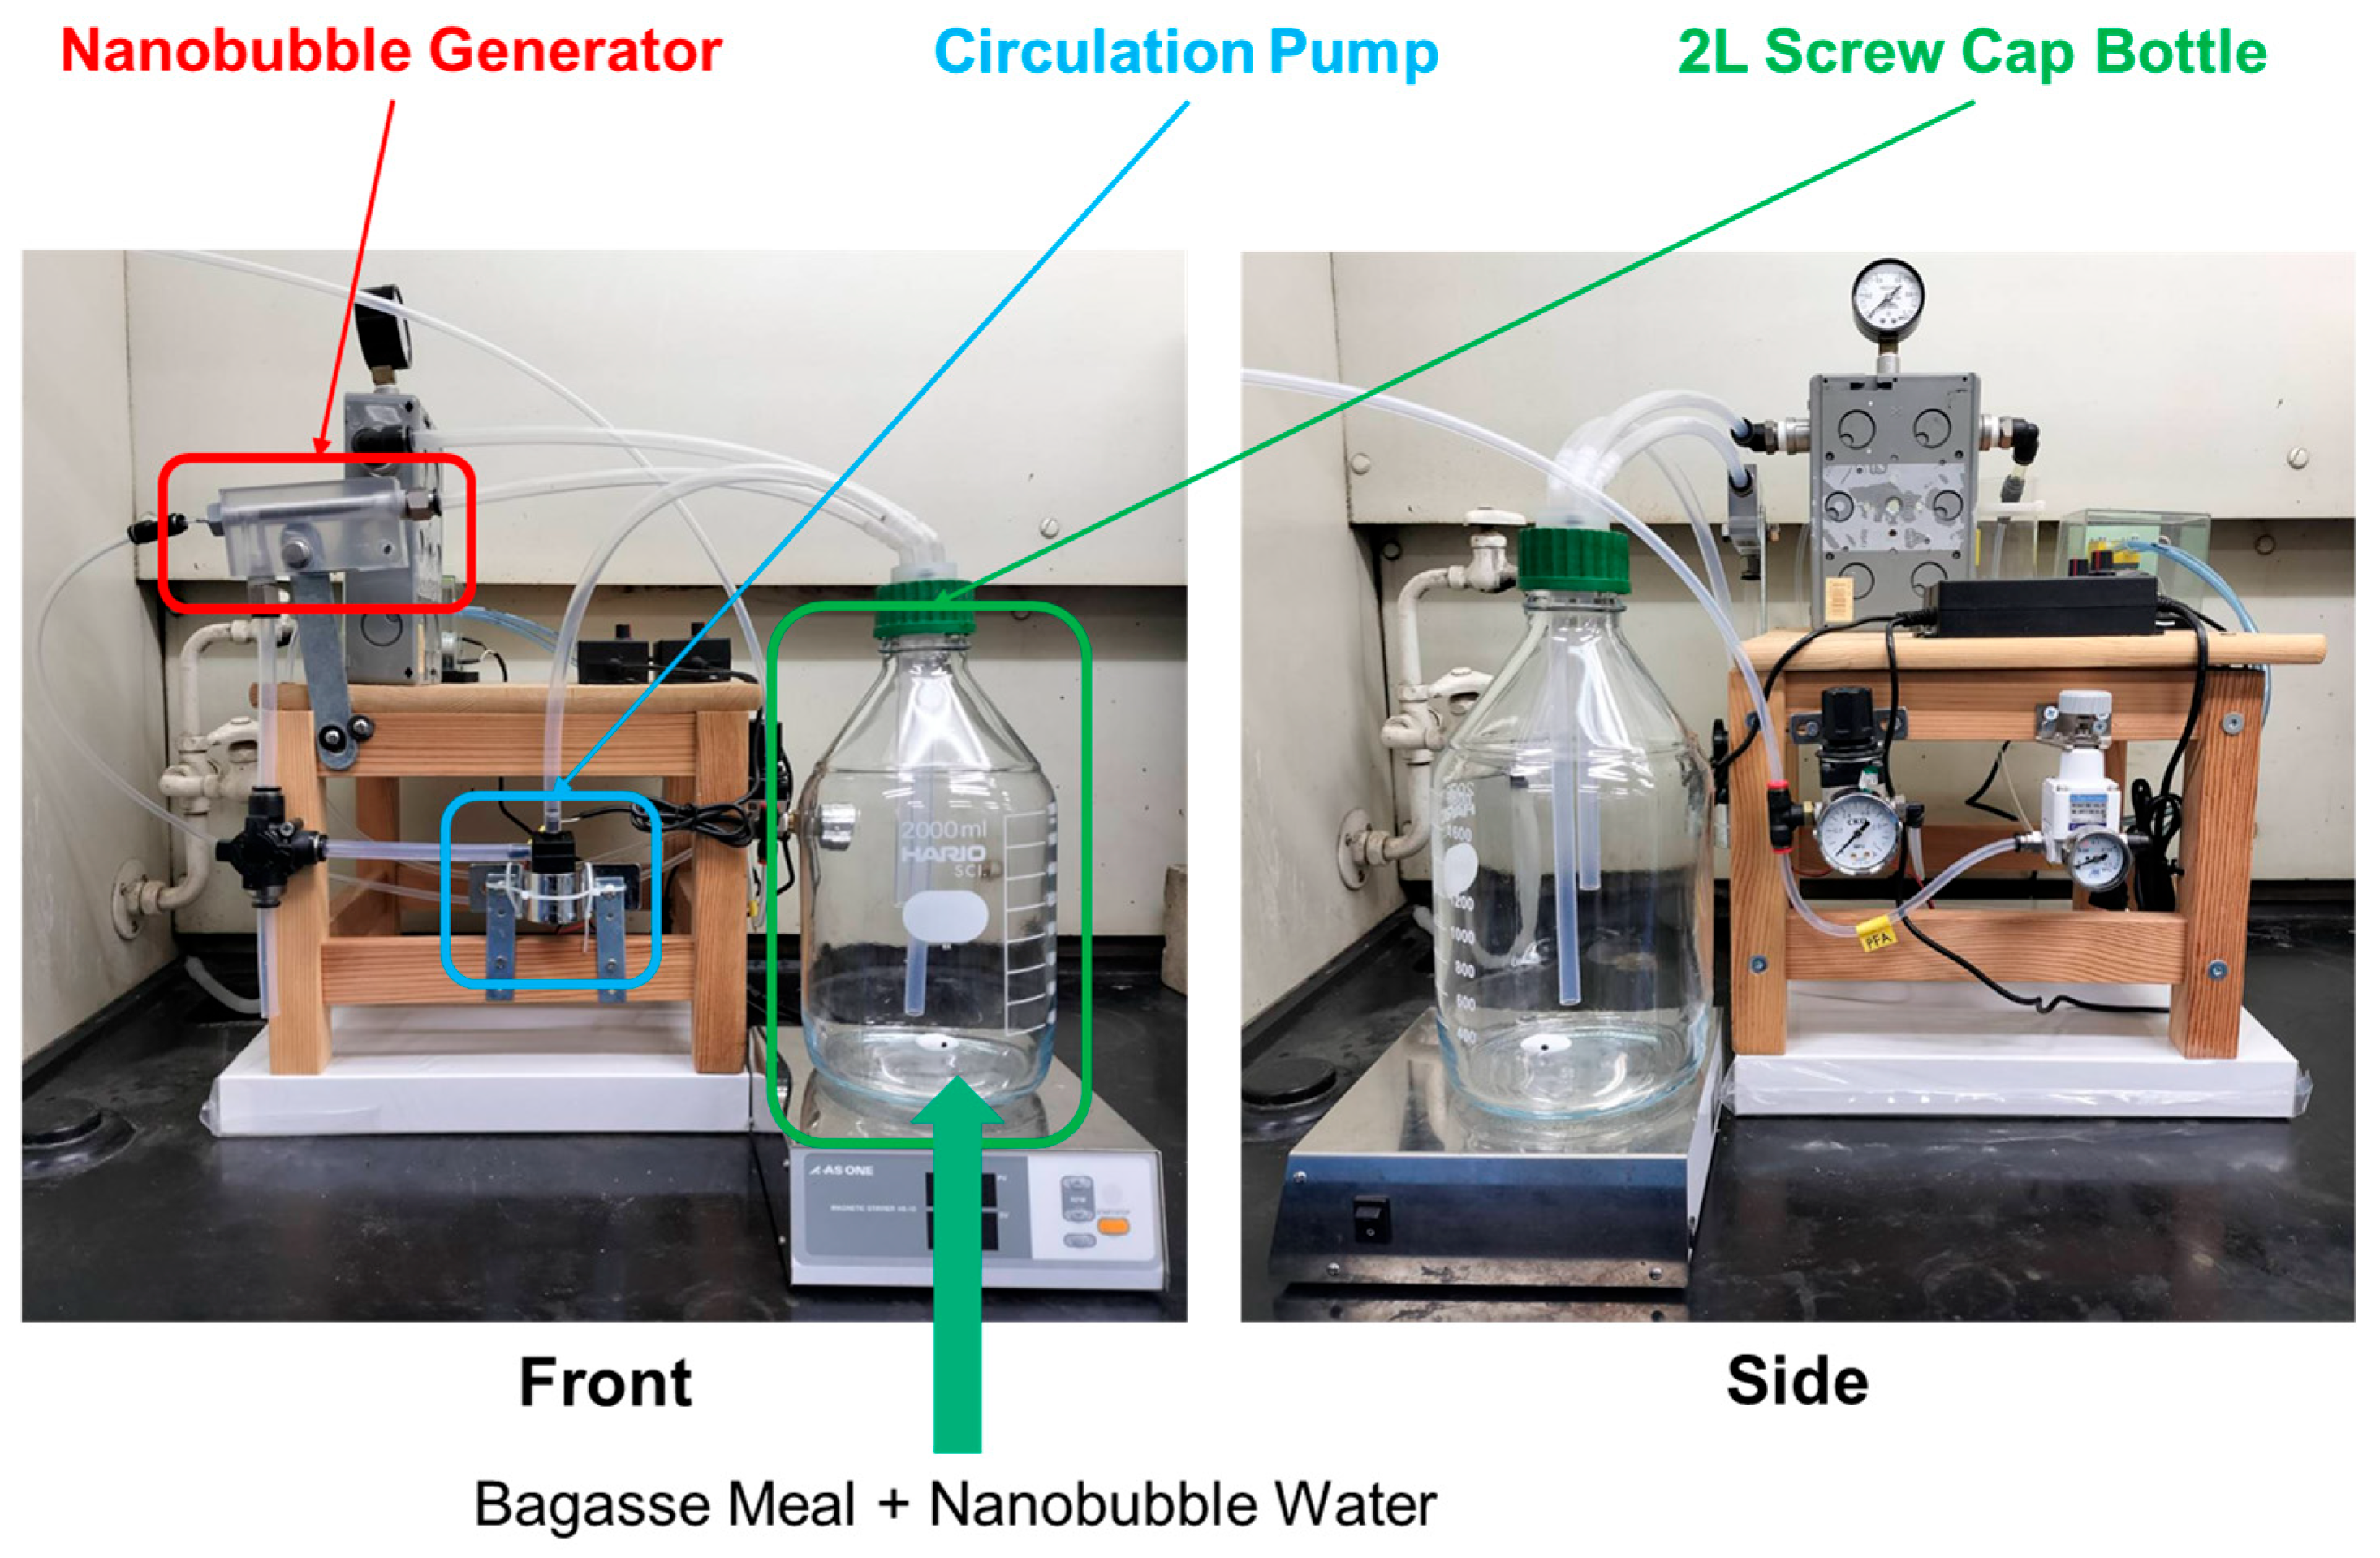
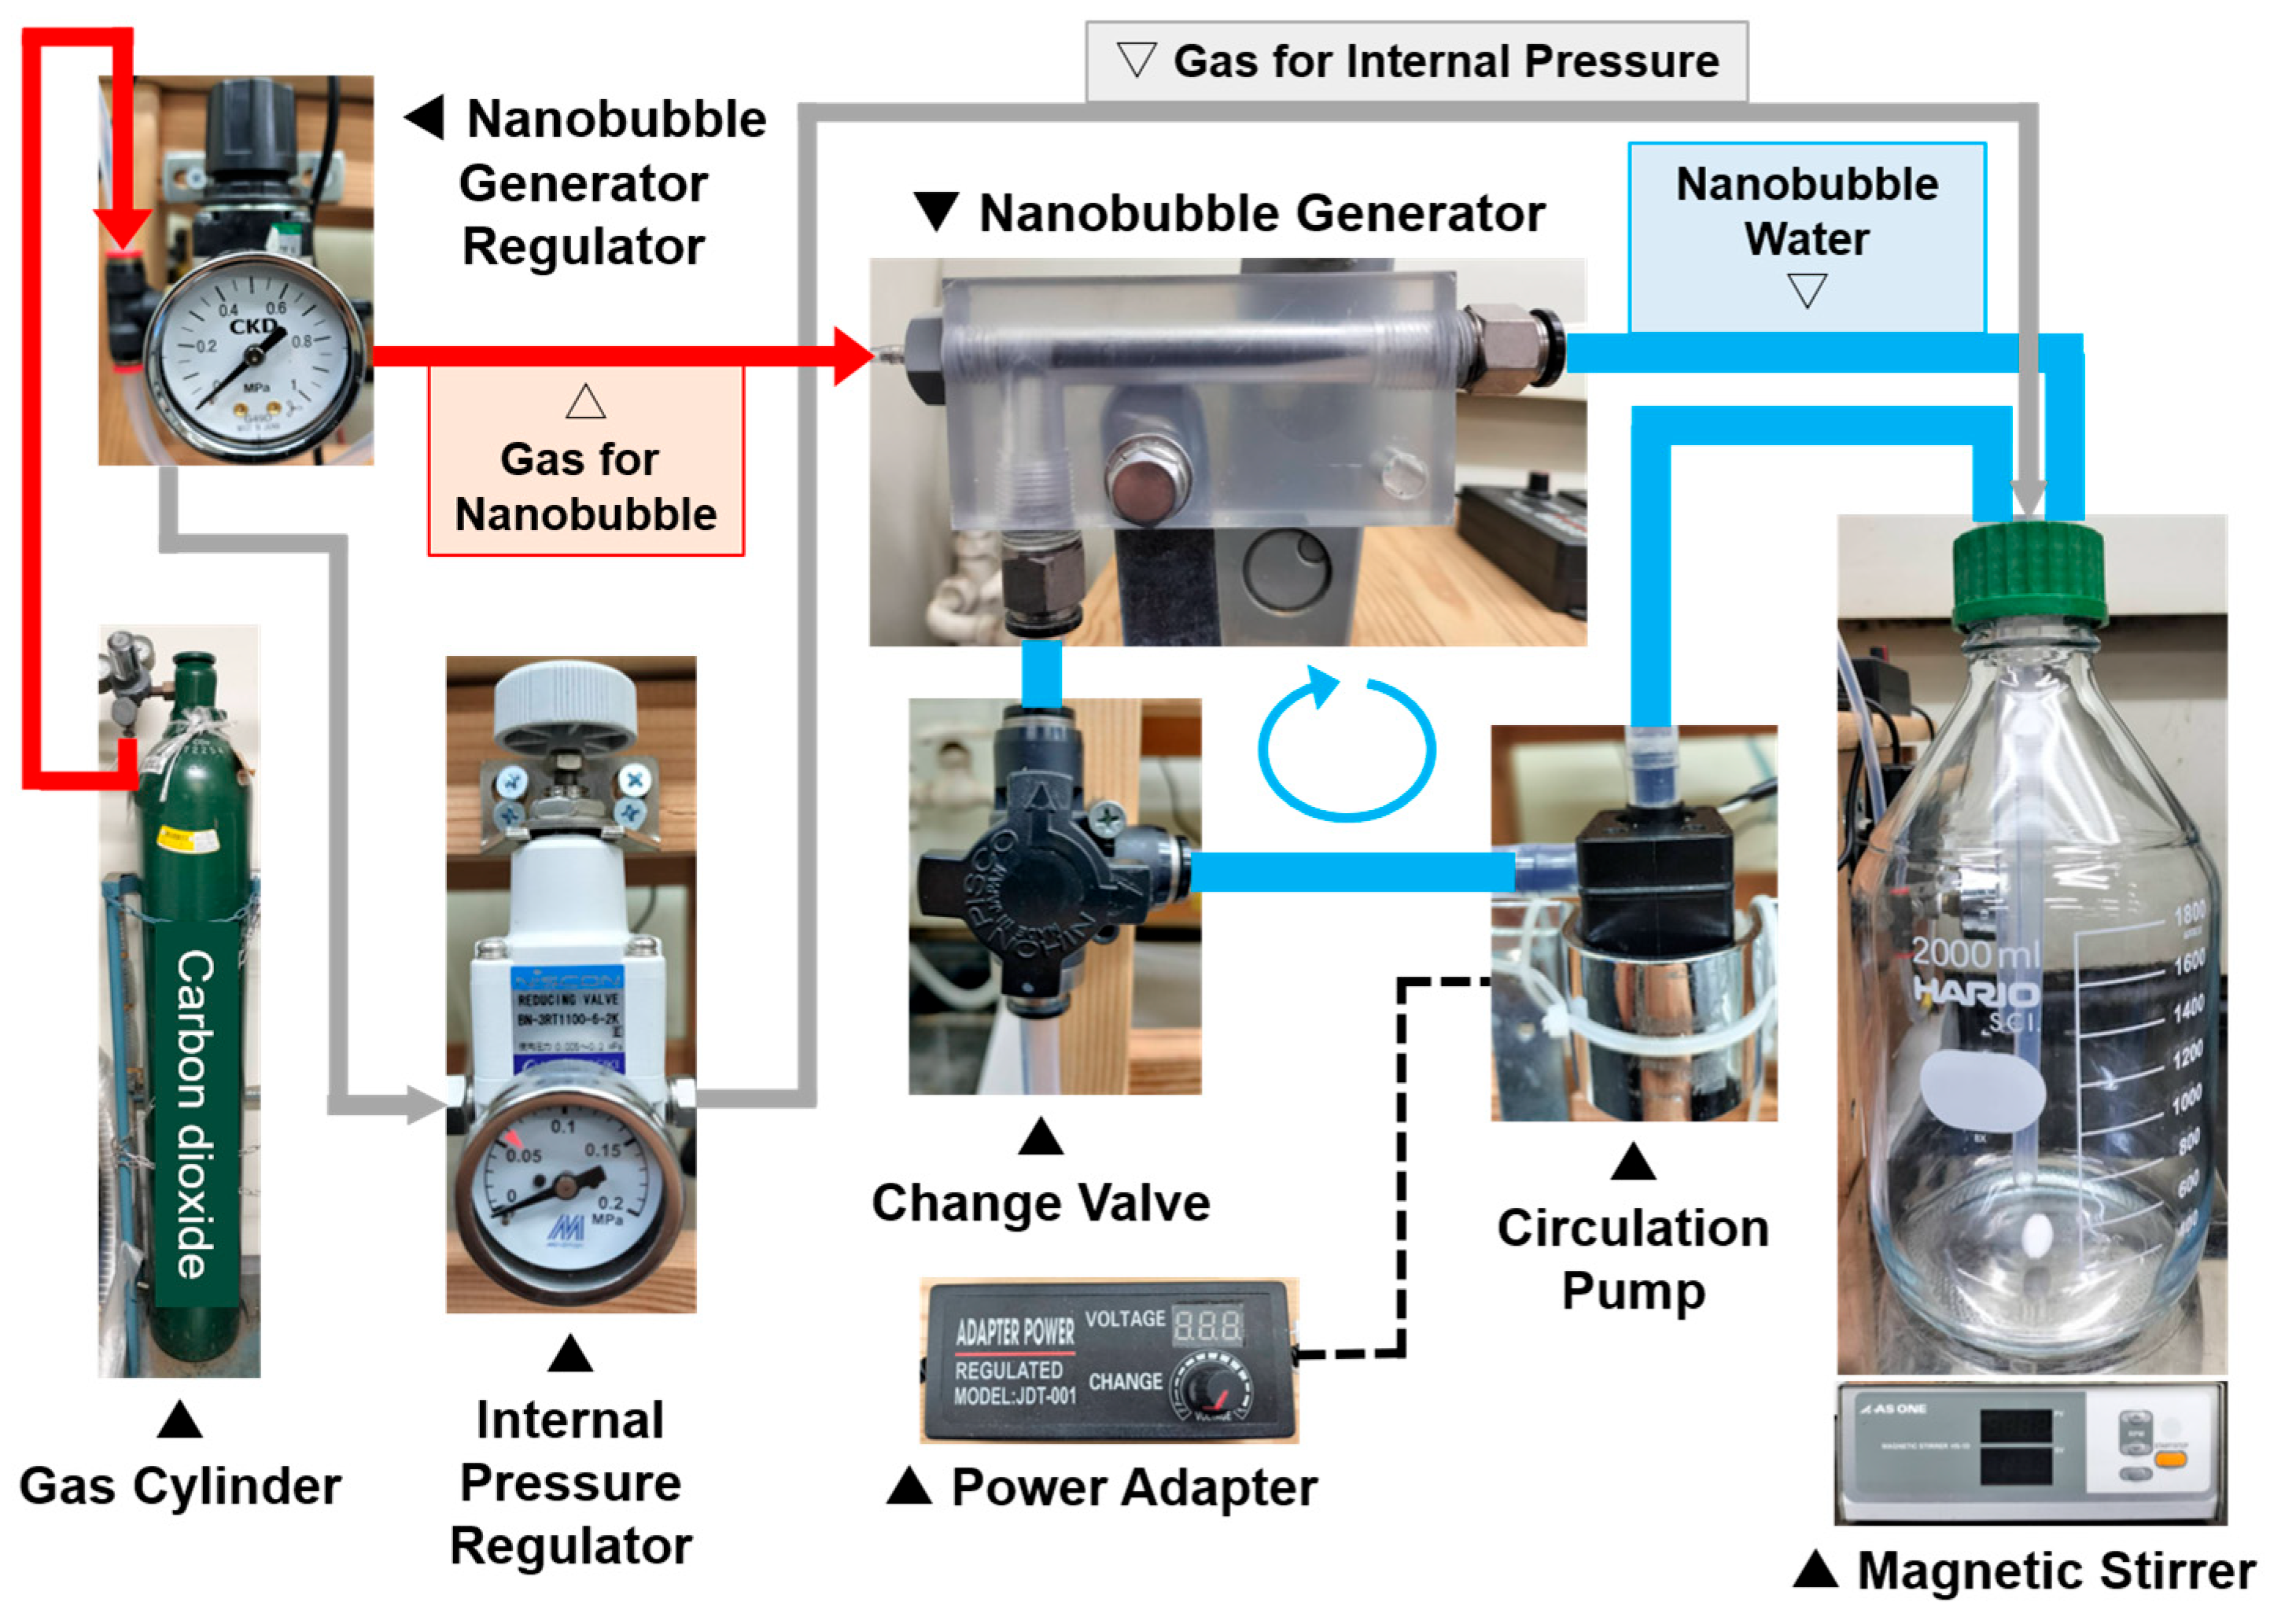
The NBW pretreatment system was constructed and operated as illustrated in Figure 1 and Figure 2. Briefly, 1.5 L of ultrapure water and 15 g of bagasse meal were placed into a 2 L screw-cap bottle (NBO-2L-SCI, HARIO, Tokyo, Japan), and the bottle was tightly sealed using a screw cap (BL80036, ISIS, Osaka, Japan). NBs were generated using an NB generator (AzNano10^10 [41], Anzai Kanetsu, Kanagawa, Japan), which was individually supplied with oxygen (O2), nitrogen (N2), or carbon dioxide (CO2) gas at a pressure of 0.2 MPa (atmospheric pressure + 0.1 MPa). The generated NBs were continuously introduced into the ultrapure water–bagasse mixture through a connected tube system linking the NB generator, circulation pump, and screw-cap bottle.
To initiate circulation of the NBW, the system was temporarily pressurized, and an internal pressure regulator was used only during the initial circulation step. After circulation was established, the pretreatment was conducted under ambient conditions (25 ± 2 °C) for 4 h with continuous mixing using a magnetic stirrer (HS-1D, AS ONE, Osaka, Japan). At the end of the pretreatment process, the pH of the treated water was measured as 4.2 for both oxygen- and nitrogen-generated NBW, while carbon dioxide-generated NBW resulted in a slightly lower pH of 4.0. A control group was prepared using untreated bagasse meal by excluding only the NBW generation and supply steps while maintaining the same experimental conditions. After pretreatment, the bagasse meal was separated by filtration, thoroughly dried in an oven at 105 °C, and subsequently used for further experiments. The principle and mechanism of NBW generation by the NBW generator employed in this study have been described in previous research [18]. In all experiments, NBW pretreatment was performed once under each gas condition.

2.4. Characterization of Pre-Treated Bagasse Meal

Component analysis was conducted to understand changes in bagasse meal composition. Organic-soluble matter was extracted using organic solvents. To defat, 2.5 g of thoroughly dried bagasse meal and 75 mL of acetone: methanol (1:1) were added to a round-bottom flask and stirred at room temperature for 24 h. The bagasse meal was filtered from the defatted solution and dried in an oven at 105 °C. The organic-soluble matter was quantified based on the weight loss of the defatted bagasse meal. The holocellulose and lignin content in the defatted bagasse meal were quantified using the Klason method and the Wise method, respectively. Referring to previous research [42], the scale was reduced by half for this experiment. Specifically, for the lignin quantification, 0.5 g of defatted bagasse meal was immersed in 7.5 mL of 72% sulfuric acid and allowed to stand for 4 h; then, 2800 mL of ultrapure water was added, and the mixture was heated and refluxed at 110 °C for 4 h. The solid remaining after filtering the mixture was quantified as lignin. Additionally, to isolate holocellulose, 1.25 g of defatted bagasse meal was immersed in 75 mL of ultrapure water containing 0.5 g of sodium chlorite and 0.1 mL of acetic acid and heated at 75 °C for a total of 5 h. Every hour, for a total of four times, 0.5 g of sodium chlorite and 0.1 mL of acetic acid were newly added. The solid remaining after filtering the mixture was obtained as holocellulose. The cellulose content in the extracted holocellulose was quantified using alkali [43]. Briefly, 0.5 g of the obtained holocellulose was immersed in 12.5 mL of a 17.5 wt% sodium hydroxide solution and left to stand at room temperature for 30 min, after which it was neutralized with 20 mL of 10 wt% acetic acid. The solid remaining after filtration of the mixture was cellulose. The proportion of hemicellulose was calculated by subtracting the proportion of cellulose from the proportion of holocellulose. Component analysis for lignocellulose and hemicellulose was conducted twice for each sample, and the mean value and standard error were calculated. To infer changes in the crystalline state of bagasse meal, the degree of crystallinity, total crystallinity index (TCI), and lateral order index (LOI) were calculated. FT-IR spectroscopy was measured once for each sample in the pretreatment section. The degree of crystallinity was calculated by X-ray diffraction (XRD) using an Ultima III (Rigaku, Tokyo, Japan). The measurement conditions followed those of a previous study [18]. XRD analysis was measured once for each sample. TCI and LOI were calculated by Fourier transform infrared spectroscopy (FT-IR) using an FT-IR 6100 (JASCO, Tokyo, Japan). Absorbance was measured using the attenuated total reflection (ATR) method with a measurement range of 4000–500 cm−1, 512 accumulations, and an interval of 4.0 cm−1. TCI is the absorbance ratio of the peaks appearing at 1370 cm−1 (A1370) and 2900 cm−1 (A2900), as expressed by Equation (1) [44]. TCI is considered proportional to the crystallinity of cellulose. LOI is the absorbance ratio of the peaks appearing at 1423 cm−1 (A1423) and 897 cm−1 (A897), as expressed by Equation (2) [44]. LOI is considered to represent the lateral order and orientation quality of cellulose.
T C I = A 1370 A 2900
L O I = A 1423 A 897
To comprehensively evaluate structural changes in bagasse meal, the pyrolysis temperature was determined, and the apparent activation energy was calculated. The pyrolysis temperature was identified using thermogravimetric analysis with a DTG-60 (Shimadzu, Kyoto, Japan). Approximately 10 mg of bagasse meal was placed in a platinum pan, with an argon gas flow rate of 100 mL/min and a heating rate of 2.5 °C/min. TGA was measured once for each sample in the pretreatment section. The activation energy was calculated based on the weight loss data using the Friedman method [45] and the Starink method [46]. The Friedman method is classified as a differential equal transformation method, while the Starink method is classified as an integral equal transformation method. Both are used as major model-free methods that do not assume a specific reaction model [47]. Measurements were performed under four heating rate conditions: 2.5, 5, 10, and 20 °C/min. Other measurement conditions were as described above. The final form of the Friedman method is expressed as Equation (3), and the final form of the Starink method is expressed as Equation (4).
l n ( d α d t ) = C o n s t .   E α R T α
l n ( β T α 1.92 ) = C o n s t .   1.0008 ( E α R T α )
α is the conversion rate, Eα is the activation energy at a specific conversion rate α, R is the gas constant, and Tα is the absolute temperature at a specific conversion rate α. Eα can be calculated by plotting four points on a graph with ln (/dt) or ln (β/Tα1.92) on the vertical axis and 1/Tα on the horizontal axis, then fitting a straight line. The apparent activation energy (Ea′) was calculated by averaging the activation energies at each conversion rate. In line with the number of TGA measurements, activation energy was calculated once for each condition.

2.5. Liquefaction of Bagasse Meal

Accordingly, 10 g of bagasse meal was added to a 500 mL three-neck flask equipped with a stirrer and reflux condenser, immersed in a 150 °C oil bath. PEG400-glycerol (60 g) and 1.2 g (2%) sulfuric acid catalyst were added to a second flask immersed in the same oil bath. The heated mixture was promptly poured into the flask containing the meal to initiate the reaction. Next, 0.8 mL of the liquefied product was collected at 15, 30, 45, 60, 90, and 120 min after the start of the liquefaction reaction and placed into a 10 mL vial for residue content calculation. Additionally, 2.4 mL was collected at the same time points and placed in 5 mL vials for FT-IR and gel permeation chromatography (GPC). Furthermore, the entire liquefied product after 120 min was collected and placed in 50 mL vials for hydroxyl value determination and TGA. To stop the liquefaction reaction, all vials were rapidly cooled in a freezer for 15 min. Filtration and neutralization were performed using methanol and sodium hydroxide solution as described in previous studies [16].

2.6. Characterization of Bagasse Meal Liquefaction Products and Residues

To investigate changes in the liquefaction behavior of bagasse meal, the residue content was calculated. The calculation method followed previous research [18]. The mean value and standard error for the residue content were calculated based on these three measurements. The changes in the liquefaction reaction rate of bagasse meal, the apparent liquefaction reaction rate constant, were calculated. Generally, the liquefaction process (solvent decomposition) of lignocellulose in the presence of polyhydric alcohols is considered an irreversible bimolecular reaction [48,49]. Therefore, the following assumptions were made [50,51]: (i) The polyol solvent is in excess relative to the sample, so the solvent concentration remains constant during the liquefaction reaction. (ii) The catalyst concentration remains constant during the liquefaction reaction. (iii) The liquefaction reaction rate depends only on the liquefied residue content and is independent of temperature.
In this case, the liquefaction reaction rate is expressed by Equation (5) and is ultimately transformed into Equation (6) [52].
d α d t = k f ( α ) = k α n
ln ( d α d t ) = n ln α + ln k
By plotting five data points on a graph with the vertical axis labeled ln (−/dt) and the horizontal axis labeled ln α, and fitting a straight line to the data, the order of the liquefaction reaction, n, can be determined from the slope of the line.
From the residue content data obtained experimentally for each liquefaction time, k′ can be calculated by plotting 1/α on the vertical axis and t on the horizontal axis, then fitting a straight line. The changes in the molecular weight of the liquefied product were estimated using GPC [18]. GPC analysis was measured once for each sample. The hydroxyl value of the liquefied product was determined by titration using a phthalating reagent and 1 M sodium hydroxide solution [53]. The mean value and standard error for the hydroxyl value were calculated based on these two measurements. FT-IR was performed to investigate changes in the chemical structure of the liquefied product. Transmittance was measured with 64 accumulations. Other measurement conditions were as described above. FT-IR spectroscopy was measured once for each sample in the liquefaction section. TGA was performed to investigate changes in the pyrolysis temperature of the liquefied residue. Measurement conditions were as described above. TGA was measured once for each sample in the liquefaction section.

3. Results and Discussion

3.1. Effect of Nanobubble Water Pretreatment on Bagasse Meal

3.1.1. Changes in Component Composition

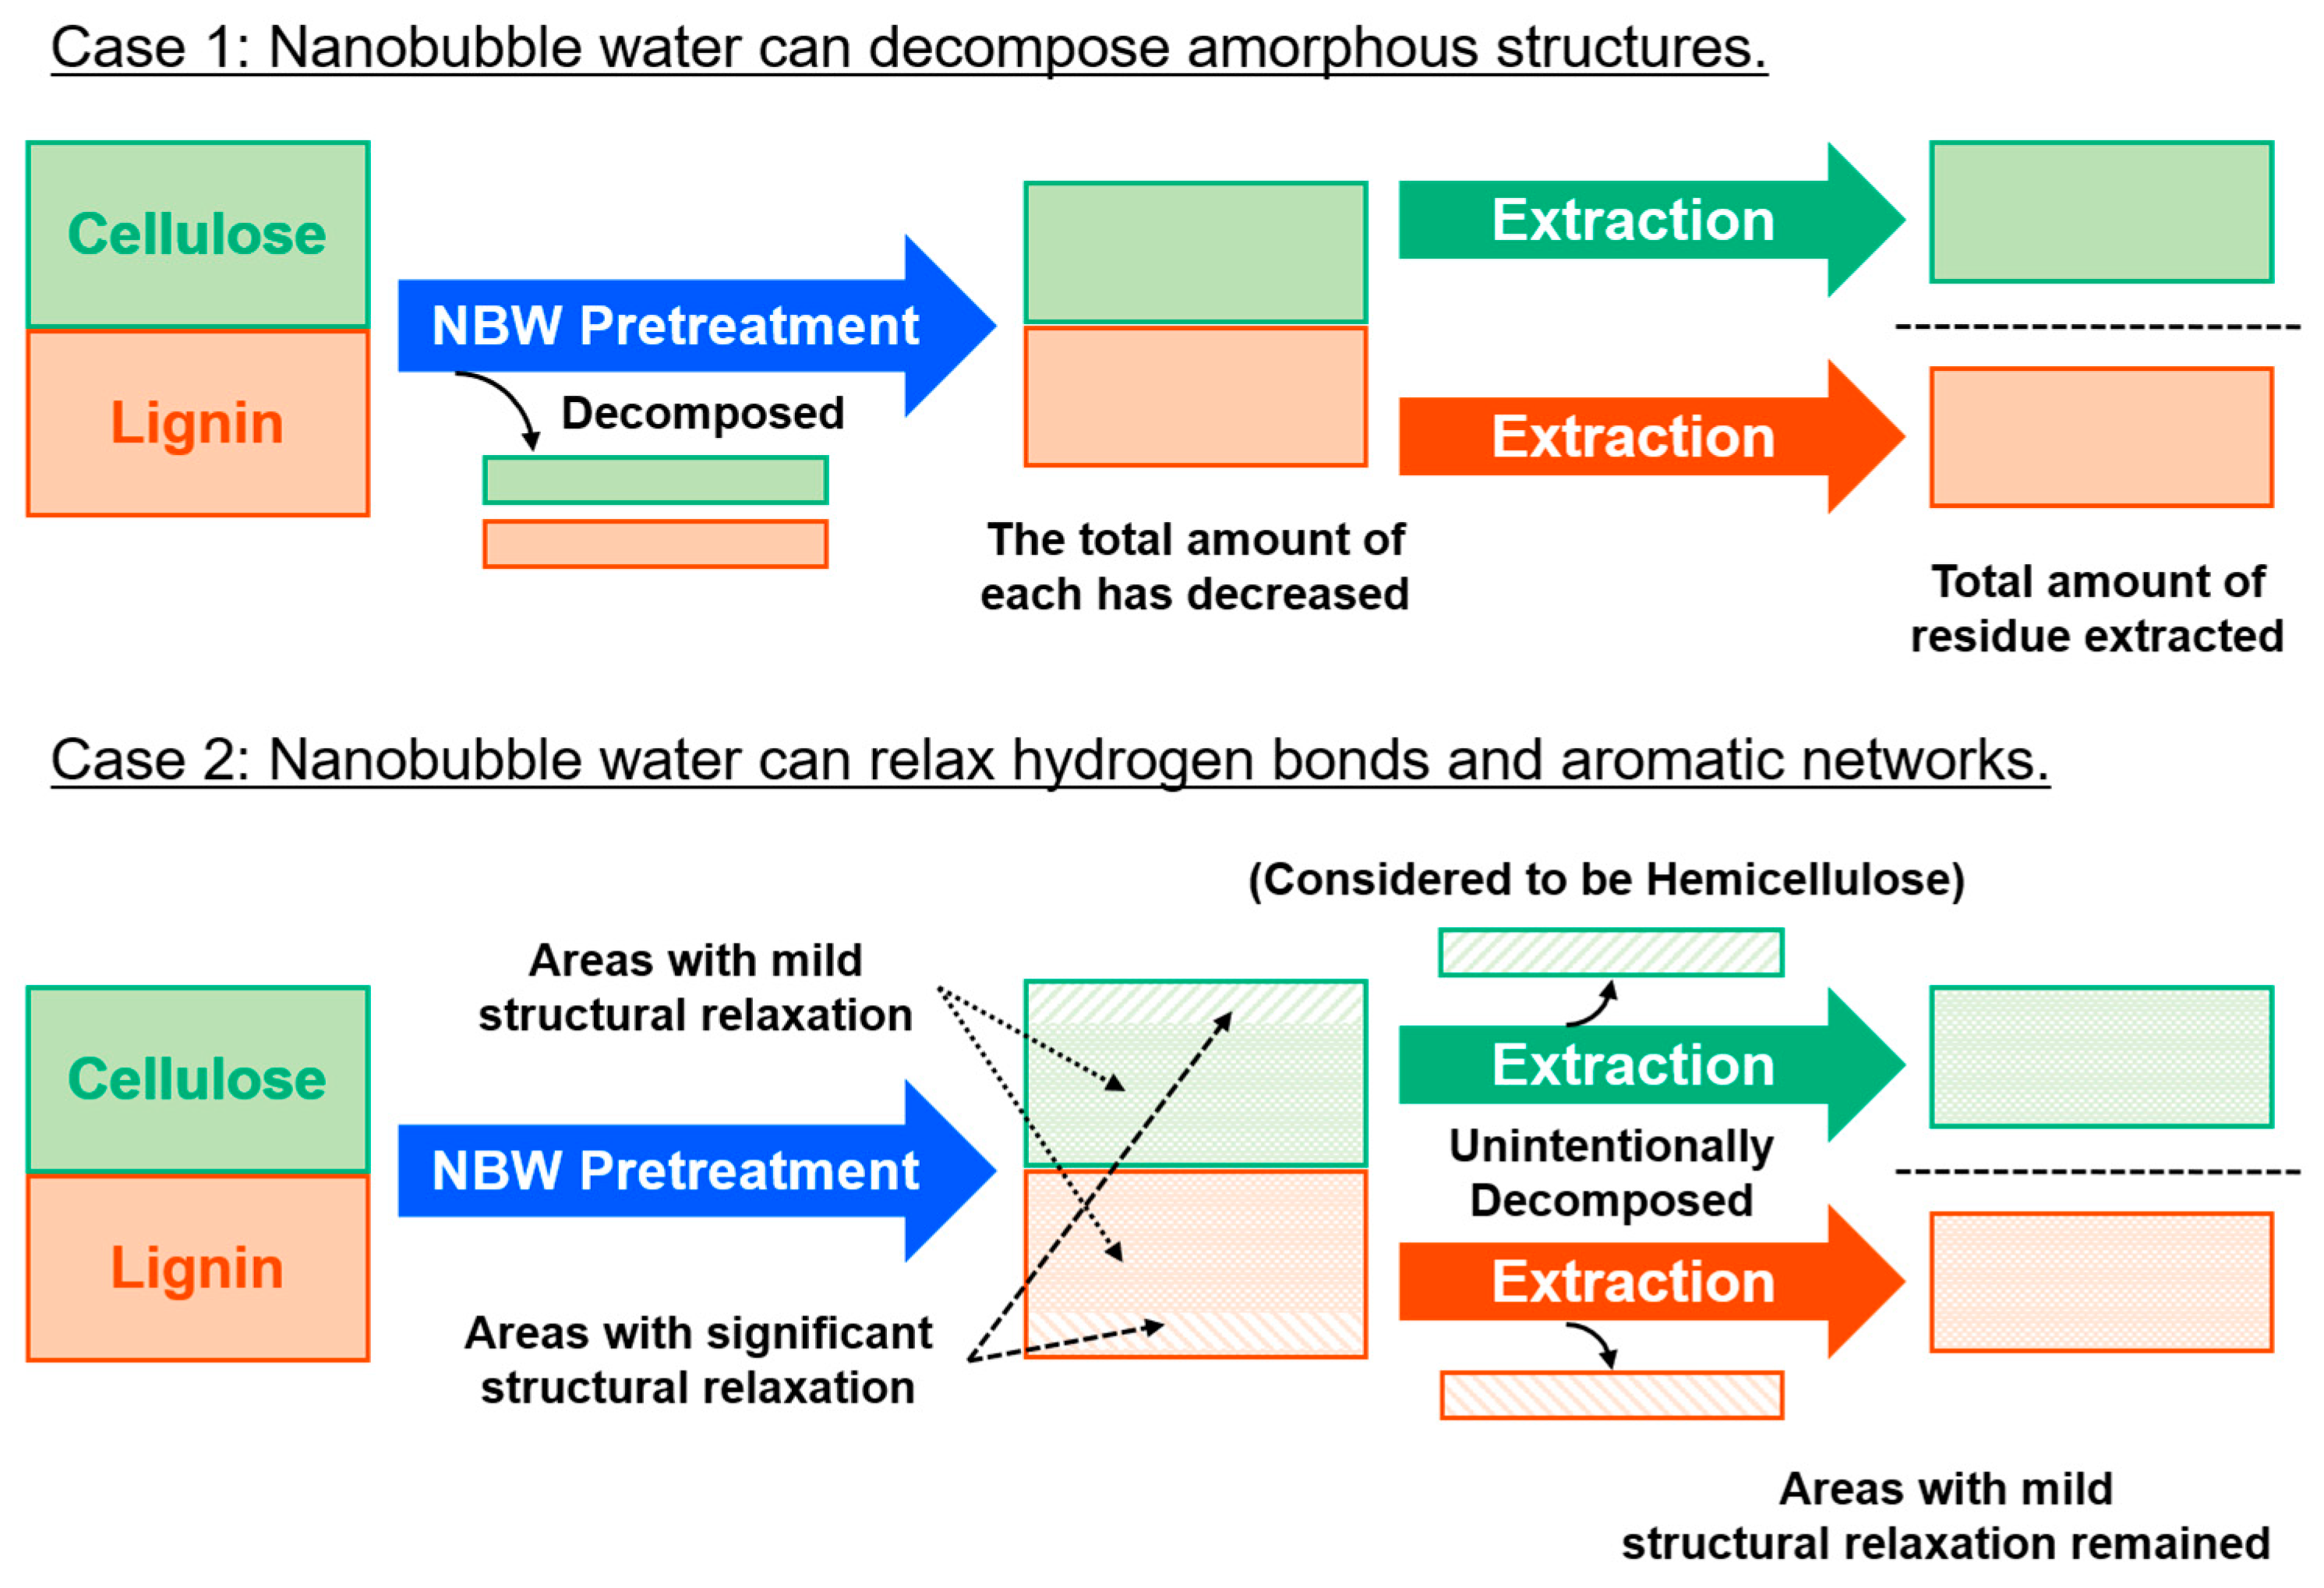
The proportion of cellulose decreased by 2.0–3.0%, while lignin content declined by 1.0–4.0% (Table 1). These reductions are consistent with the hypothesis of NBW-induced structural and chemical modifications of lignocellulosic components (Scheme 1). One plausible explanation is the potential direct partial decomposition of both cellulose and lignin, where oxygen, nitrogen, and carbon dioxide NBW might facilitate the breakdown of amorphous cellulose prior to alkali extraction and partially degrade lignin before Klason analysis, thereby lowering their measured proportions (Case 1). In addition, the observed changes may arise from indirect structural disruption mechanisms. It is conceivable that NBW weakens intermolecular interactions, including hydrogen bonding within cellulose and aromatic network stability in lignin, rendering these components more susceptible to degradation or solubilization during subsequent extraction processes. As a result, fractions that would typically remain intact may instead be removed, contributing to the observed decrease (Case 2). In contrast, structural transformation limited to crystalline-to-amorphous conversion of cellulose alone would not be expected to alter the overall cellulose content. Therefore, such an effect cannot fully account for the reductions observed in this study.
In this case, the cellulose proportion decreased by 3.0% with oxygen NBW, higher than the decrease rates (2.0%) observed with nitrogen and carbon dioxide NBW. These results may indicate that oxygen NBW possesses a high capacity to decompose or modify cellulose, although further evidence is required to confirm this mechanism. The lignin content decreased by 4.4% and 4.2% for carbon dioxide and oxygen NBW, respectively, which was higher than the decrease observed with nitrogen NBW alone (1.0%). This trend suggests the possibility that both carbon dioxide and oxygen NBW have a high capacity to decompose or modify lignin. The series of results indicates that hydroxyl radical generation was highest when oxygen NBW was used [54,55], which may have promoted the decomposition or modification of cellulose and lignin. Additionally, the slight acidification caused by carbon dioxide NBs may have promoted the degradation or modification of lignin [39,40]. However, given that the values vary due to the heterogeneity of the bagasse meal, it does not appear possible to identify a statistically significant difference attributable to the differences in NB gas. Since these remain merely possibilities, it will be necessary to conduct control experiments under conditions where NBW is absent. Meanwhile, the hemicellulose content decreased by 3.2–4.0%. Generally, hemicellulose is more susceptible to degradation than cellulose or lignin. Nevertheless, the decrease was observed only in cellulose and lignin, likely due to cellulose modification. It is thought that the partial weakening of the cellulose structure led to its decomposition during the alkali extraction process, making the hemicellulose content appear higher (Scheme 1).
The organic-soluble fraction increased by 5.1–48%. Previous research [18] pretreating wood with ozone NBW confirmed that ozone NBW reduced the organic-soluble fraction in wood. Generally, organic-soluble fractions should be easily extractable with organic solvents. Therefore, if chemically decomposed or physically separated by ozone NBW, the proportion of the organic-soluble fraction in the treated material would be expected to decrease, and this was indeed the case. However, the results of this study contradicted this prior research. Although the oxygen, nitrogen, and carbon dioxide NBW used possessed the ability to reduce the proportions of cellulose and lignin, they did not act to reduce the organic-soluble components, which are more readily decomposed. The reason for their increase rather than decrease is thought to be that cellulose and lignin underwent depolymerization or fragmentation into low-molecular-weight lipophilic components, and consequently, the amount of these generated components exceeded the reduction in the originally present organic-soluble components.

3.1.2. Changes in Crystalline State

The degree of crystallinity was calculated from the obtained XRD spectrum (Figure S1) (Table 2). Additionally, the total crystallinity index (TCI) and lateral order index (LOI) were calculated from the FT-IR spectrum (Figure S2) (Table 2). The LOI, representing the ratio of crystalline to amorphous regions in cellulose, increased by 4.7–9.8%, consistent with previous studies [39,40] in which rice straw was pretreated with NBW. This suggests that NBW decomposed amorphous cellulose. The decrease in cellulose content (Table 1) was attributed to the decomposition of amorphous cellulose. The degree of crystallinity increased by 5.8–12%, consistent with previous studies [18] that pretreated woody biomass with ozone NBW. This resulted from the decomposition of amorphous cellulose and lignin, leading to a relatively higher proportion of crystalline cellulose. Despite the decomposition of amorphous cellulose and the resulting increase in crystallinity, the TCI, which is proportional to cellulose crystallinity, decreased by 6.7–13%. These results suggest that the decomposition of amorphous cellulose and the amorphization of crystalline cellulose occurred simultaneously.

3.1.3. Changes in Thermal Stability

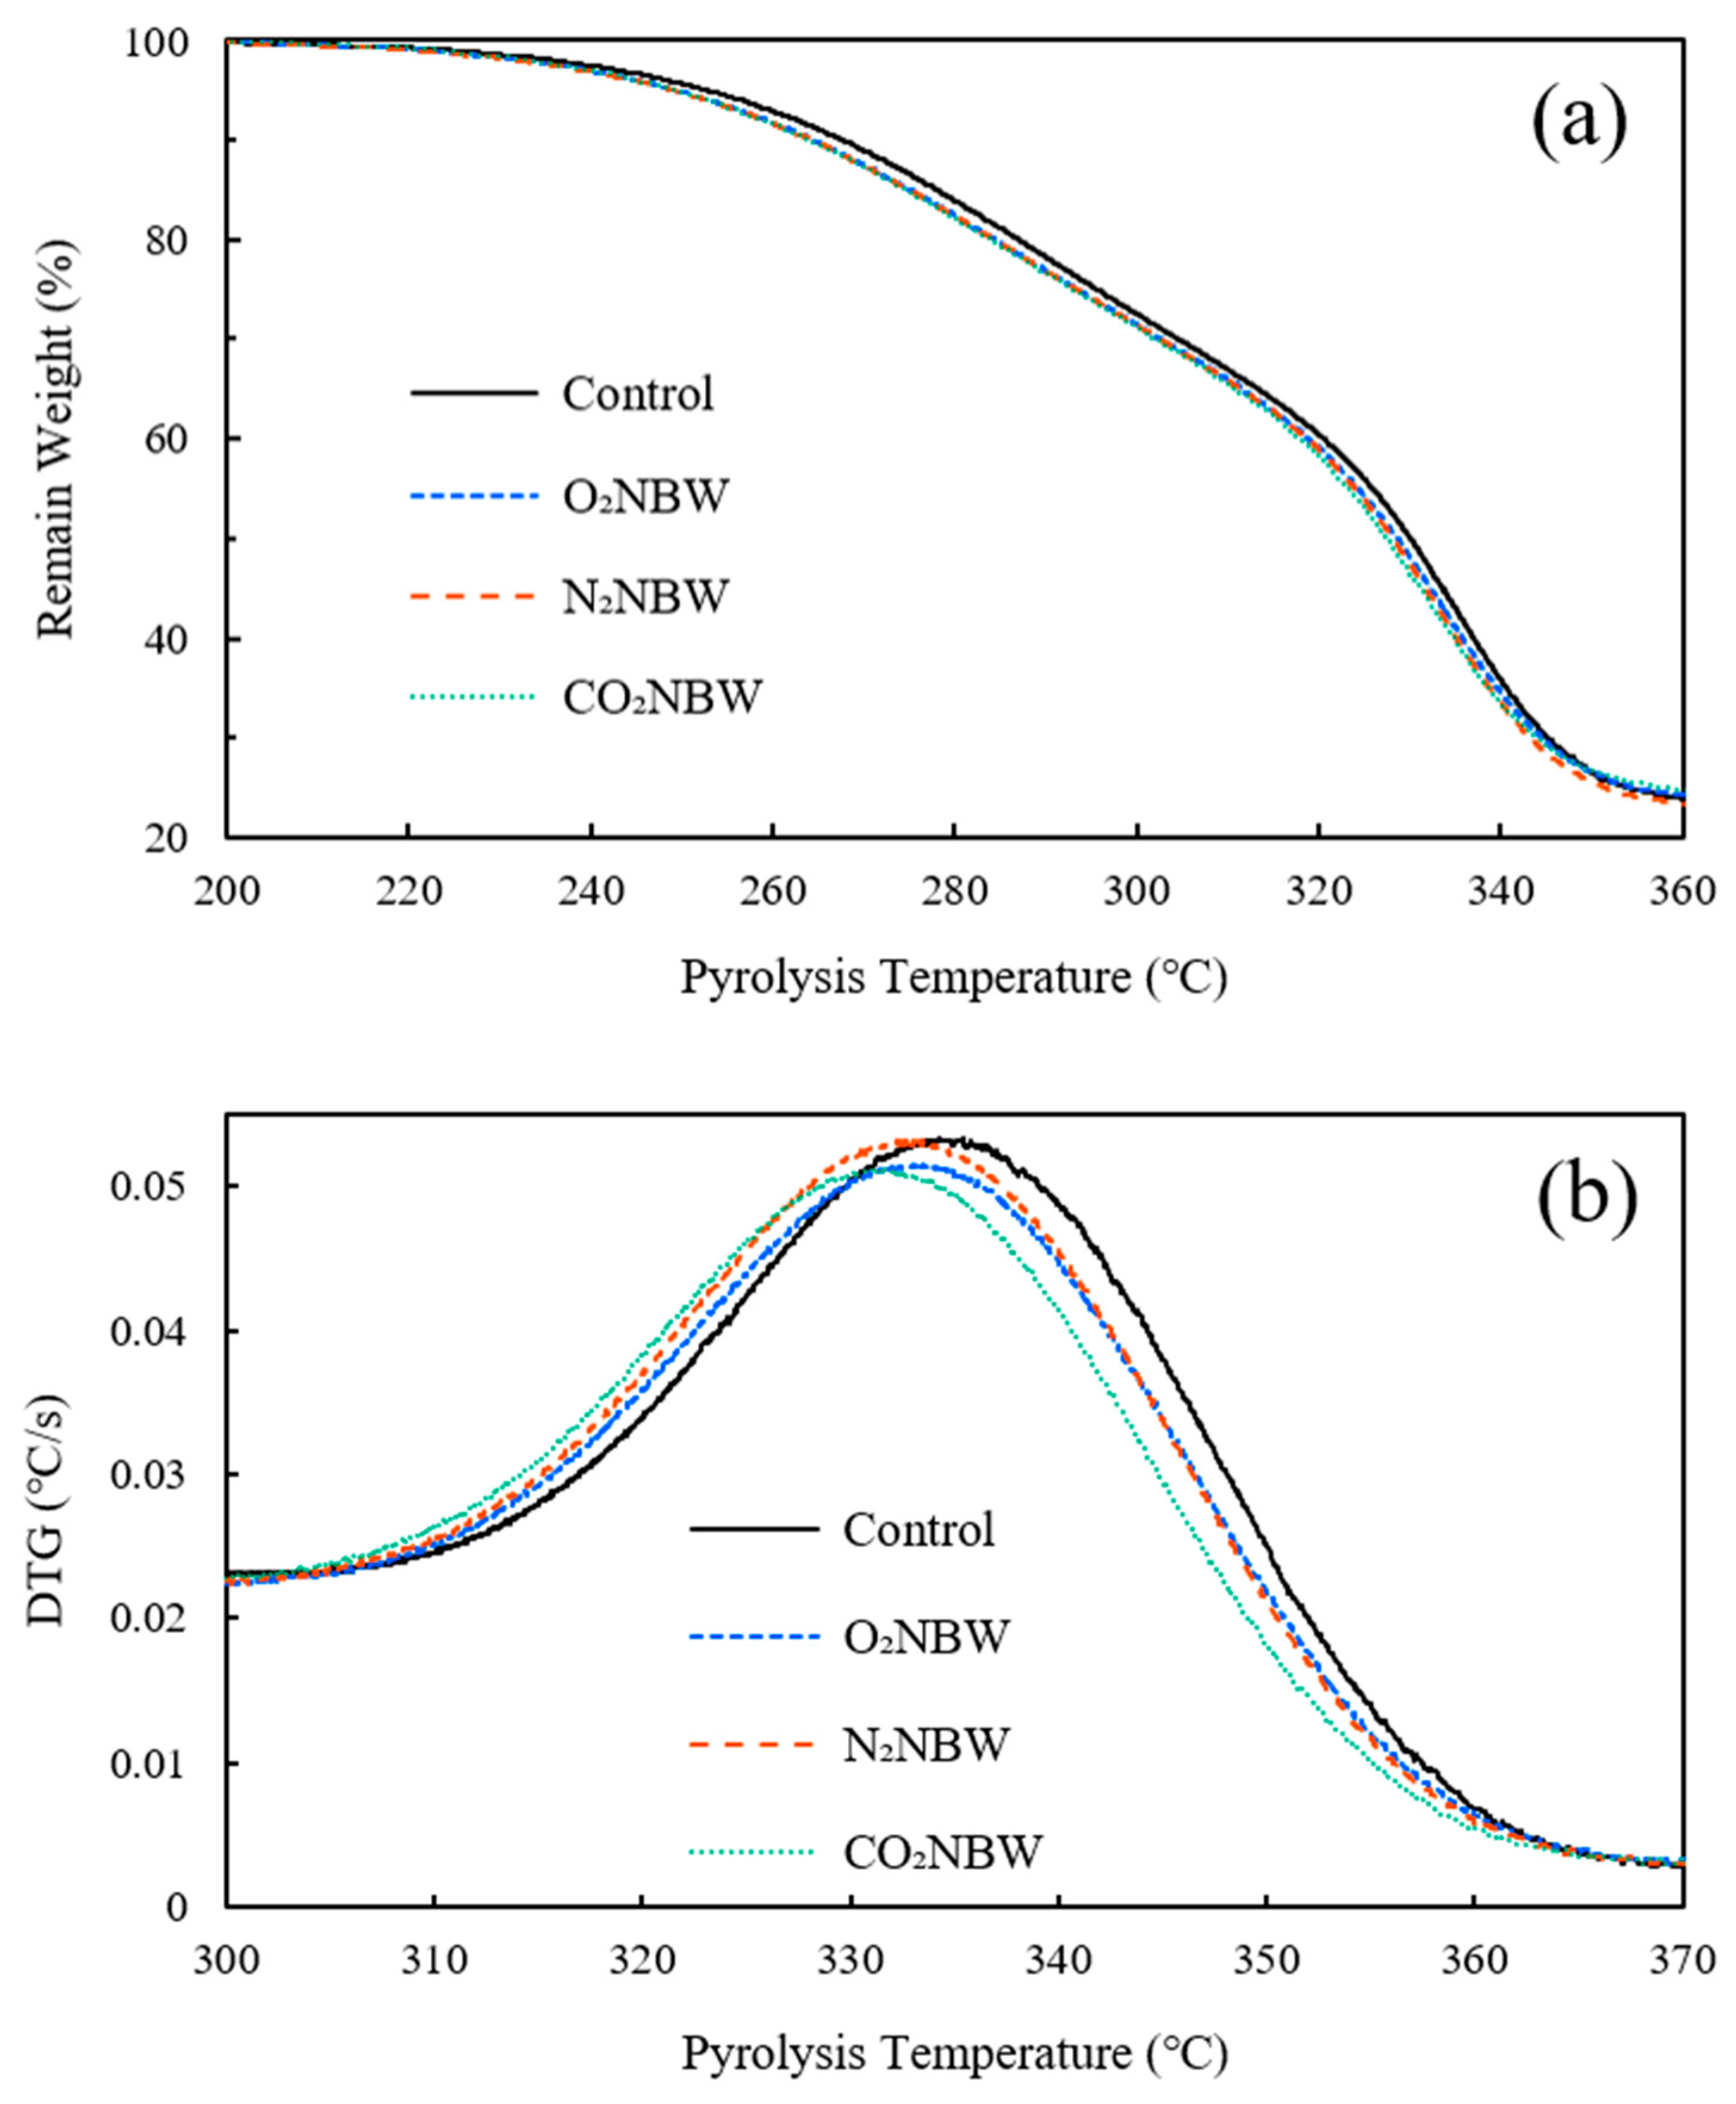
As a preliminary step for comprehensively evaluating the modification effect, we focused on the pyrolysis temperature. Analysis of the obtained TG curve (Figure 3a) revealed that the curve appears to shift toward lower temperatures during the initial pyrolysis stage.
Furthermore, it was observed that the maximum peak of the DTG curve (Figure 3b), derived from the differential analysis, also showed a slight shift toward lower temperatures. Both shifts potentially suggest a decrease in the thermal stability of the decomposition products.
To further examine this trend, we identified the temperatures corresponding to 5%,10%, and 50% decreases (T5%, T10%, T50%), as well as the maximum peak temperature (Tmax) (Table 3). These results tentatively suggest that NBW might modify bagasse meal and reduce its thermal stability.
The temperatures at which the samples lost 5% and 10% of their weight (T5% and T10%) showed a minor, consistent decrease of approximately 4 °C. This weight loss is primarily associated with the decomposition of hemicellulose, some lignin, and other extractives [56]. Therefore, it can be hypothesized that NBW pretreatment might have relaxed the aromatic networks, exposing hemicellulose and subsequently affecting its initial thermal stability. The lack of significant differences between NB gases suggests that the degree of hemicellulose exposure due to aromatic network relaxation was not substantially different, provided these minor variations reflect actual material trends.
The 50% reduction temperature (T50%) decreased by 1.5–2.6 °C, and the maximum peak temperature (Tmax) decreased by 1.6–3.5 °C. Both, especially the latter, originate from cellulose [56]. Generally, amorphous cellulose has lower thermal stability than crystalline cellulose; thus, removing amorphous regions via NBW pretreatment could potentially increase cellulose thermal stability. Nevertheless, the observed trend of a decrease in both temperatures might suggest that the modification effects outweighed the concentration of crystalline cellulose resulting from the reduction in amorphous cellulose. That is, these preliminary findings could imply that the benefits from the decrease in TCI (amorphization of crystalline regions and hydrogen bond relaxation) outweigh the disadvantages from the increase in LOI (concentration of crystalline regions), although further statistical replication is required to firmly establish these structural changes.

3.1.4. Changes in Activation Energy

As the second material for comprehensively evaluating the reforming effects, activation energy was incorporated. Since activation energy represents the minimum energy required to initiate a chemical reaction, it is expected to decrease as the overall reforming effect increases. Therefore, it serves as a useful parameter for discussing the amorphization of crystalline structures, the decomposition of amorphous structures, and the complex interplay of hydrogen bonds and aromatic networks, enabling a comparison of their respective degrees of influence. Ultimately, this allows for a thermodynamically sound decision on which NBW is most suitable for subsequent liquefaction reactions. During calculations, the pyrolysis region shifted toward higher temperatures as the heating rate increased (Figure S3), due to delayed heat conduction at higher speeds. Consequently, the conversion region also shifted toward higher temperatures (Figure S4). Since the shift occurred at regular intervals within the conversion rate range of 0.1–0.8, it was determined that the pyrolysis reaction mechanism does not depend on the heating rate within this range. An Arrhenius plot was created at 0.05 intervals for the conversion rate range of 0.05–0.9. Among these, the plots for the conversion rate range of 0.1–0.8, where the reaction mechanism was considered constant, are shown for each method (Figure S5). The coefficients of determination for the fitted lines are also shown (Table S1a,b). The significant decrease in the coefficient of determination to 0.90 is due to the slow decomposition and carbonization of lignin and lignin-derived char, highlighting the limitations of the model-free method. Focusing on the conversion rate range of 0.1–0.8, the minimum coefficient of determination was 0.995 for the Friedman method and 0.996 for the Starink method. These values demonstrate that the obtained approximation lines exhibit high linearity and simultaneously prove the validity of each method for calculating the activation energy of bagasse milling.
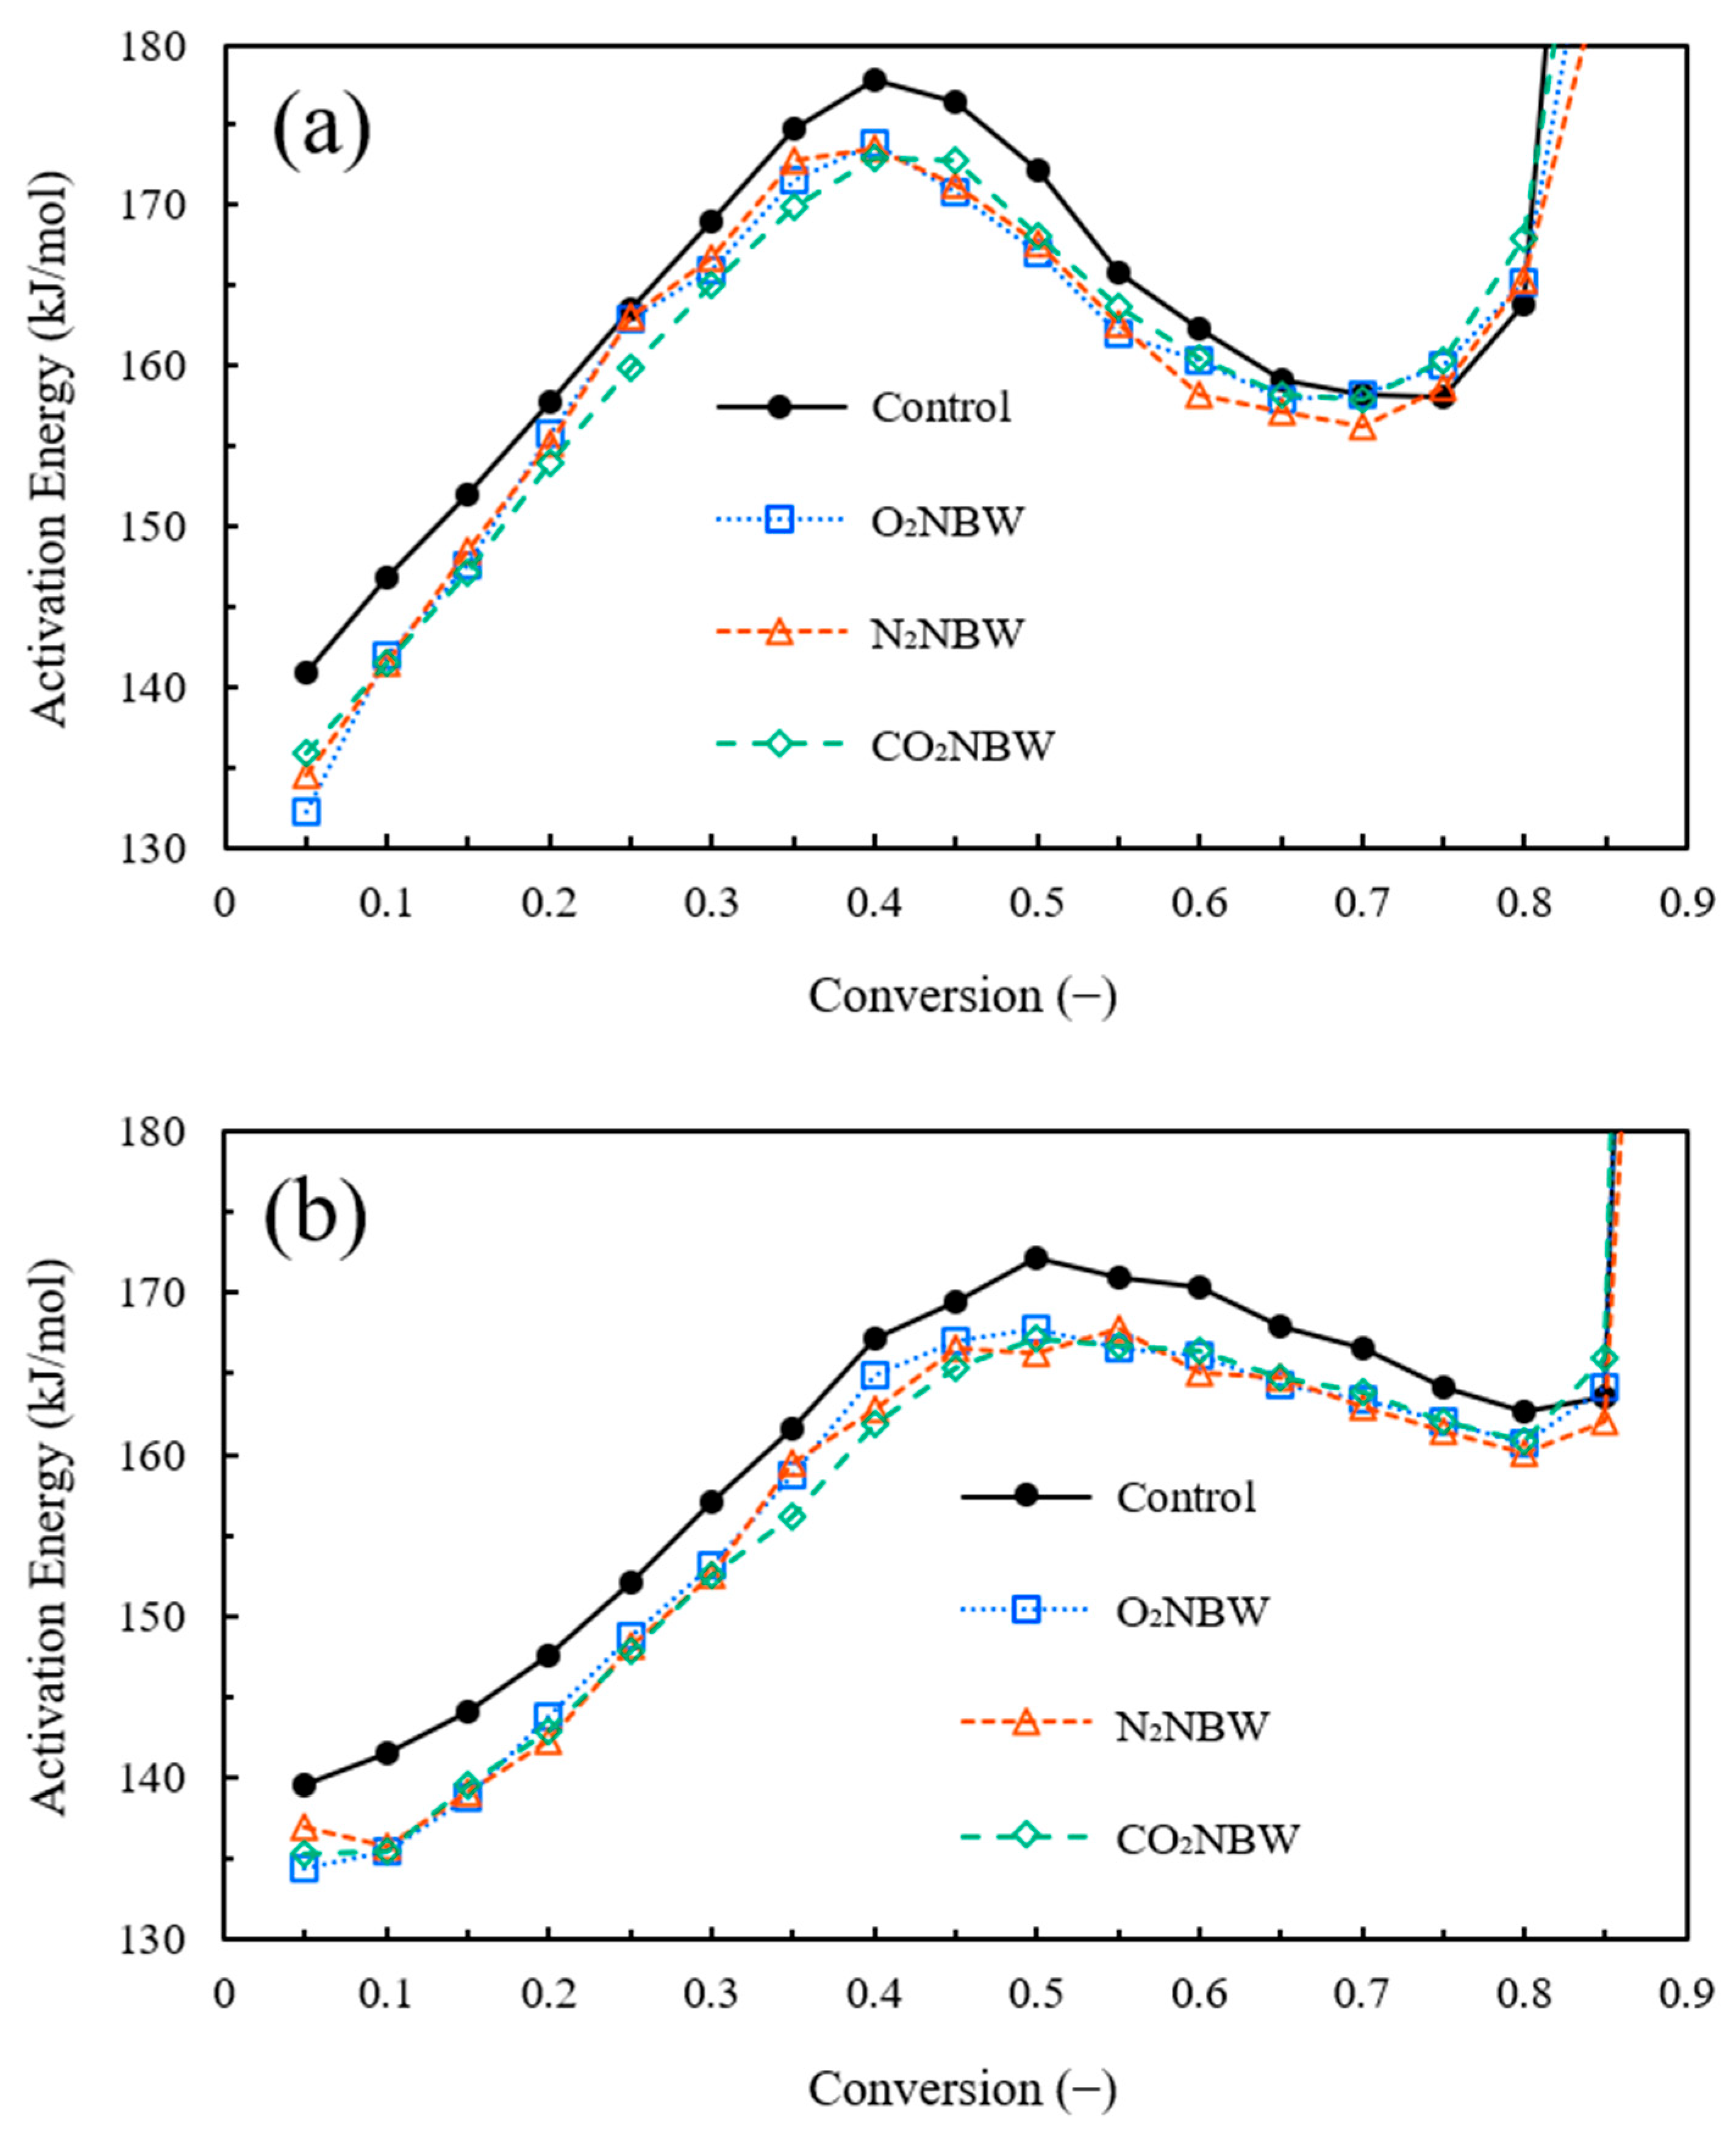
The conversion rate range (α = 0.1–0.7) used for calculating the apparent activation energy (Ea′) was determined based on the variation trend of Ea′ with increasing conversion rate (Figure 4a,b). A conversion rate of 0.05 was excluded because the initial degradation stage is generally associated with components that are more easily pyrolyzed than the major structural polymers, including low-degree-of-polymerization hemicellulose, extractives, and terminal groups of cellulose and lignin [57,58]. Therefore, the Ea′ obtained at this stage may not represent the intrinsic degradation behavior of the main polymeric components.
In addition, higher conversion regions were carefully evaluated to avoid contributions from secondary degradation reactions. For the Starink method, an unexpected increase in Ea′ was observed when α increased from 0.80 to 0.85, suggesting a change in the dominant degradation mechanism. Similarly, in the Friedman method, Ea′ showed an increasing trend when α increased from 0.70 to 0.75 and 0.80. This behavior is attributed to the progressive depletion of cellulose and the increasing contribution of lignin decomposition, char formation, and complex secondary reactions at higher conversion stages [57,58]. The conversion rate of 0.90 was excluded based on the same consideration discussed previously, as the degradation mechanism at this stage differs significantly from the primary pyrolysis process. Therefore, α = 0.1–0.7 was selected as the most representative conversion range for comparing the intrinsic thermal degradation behavior.
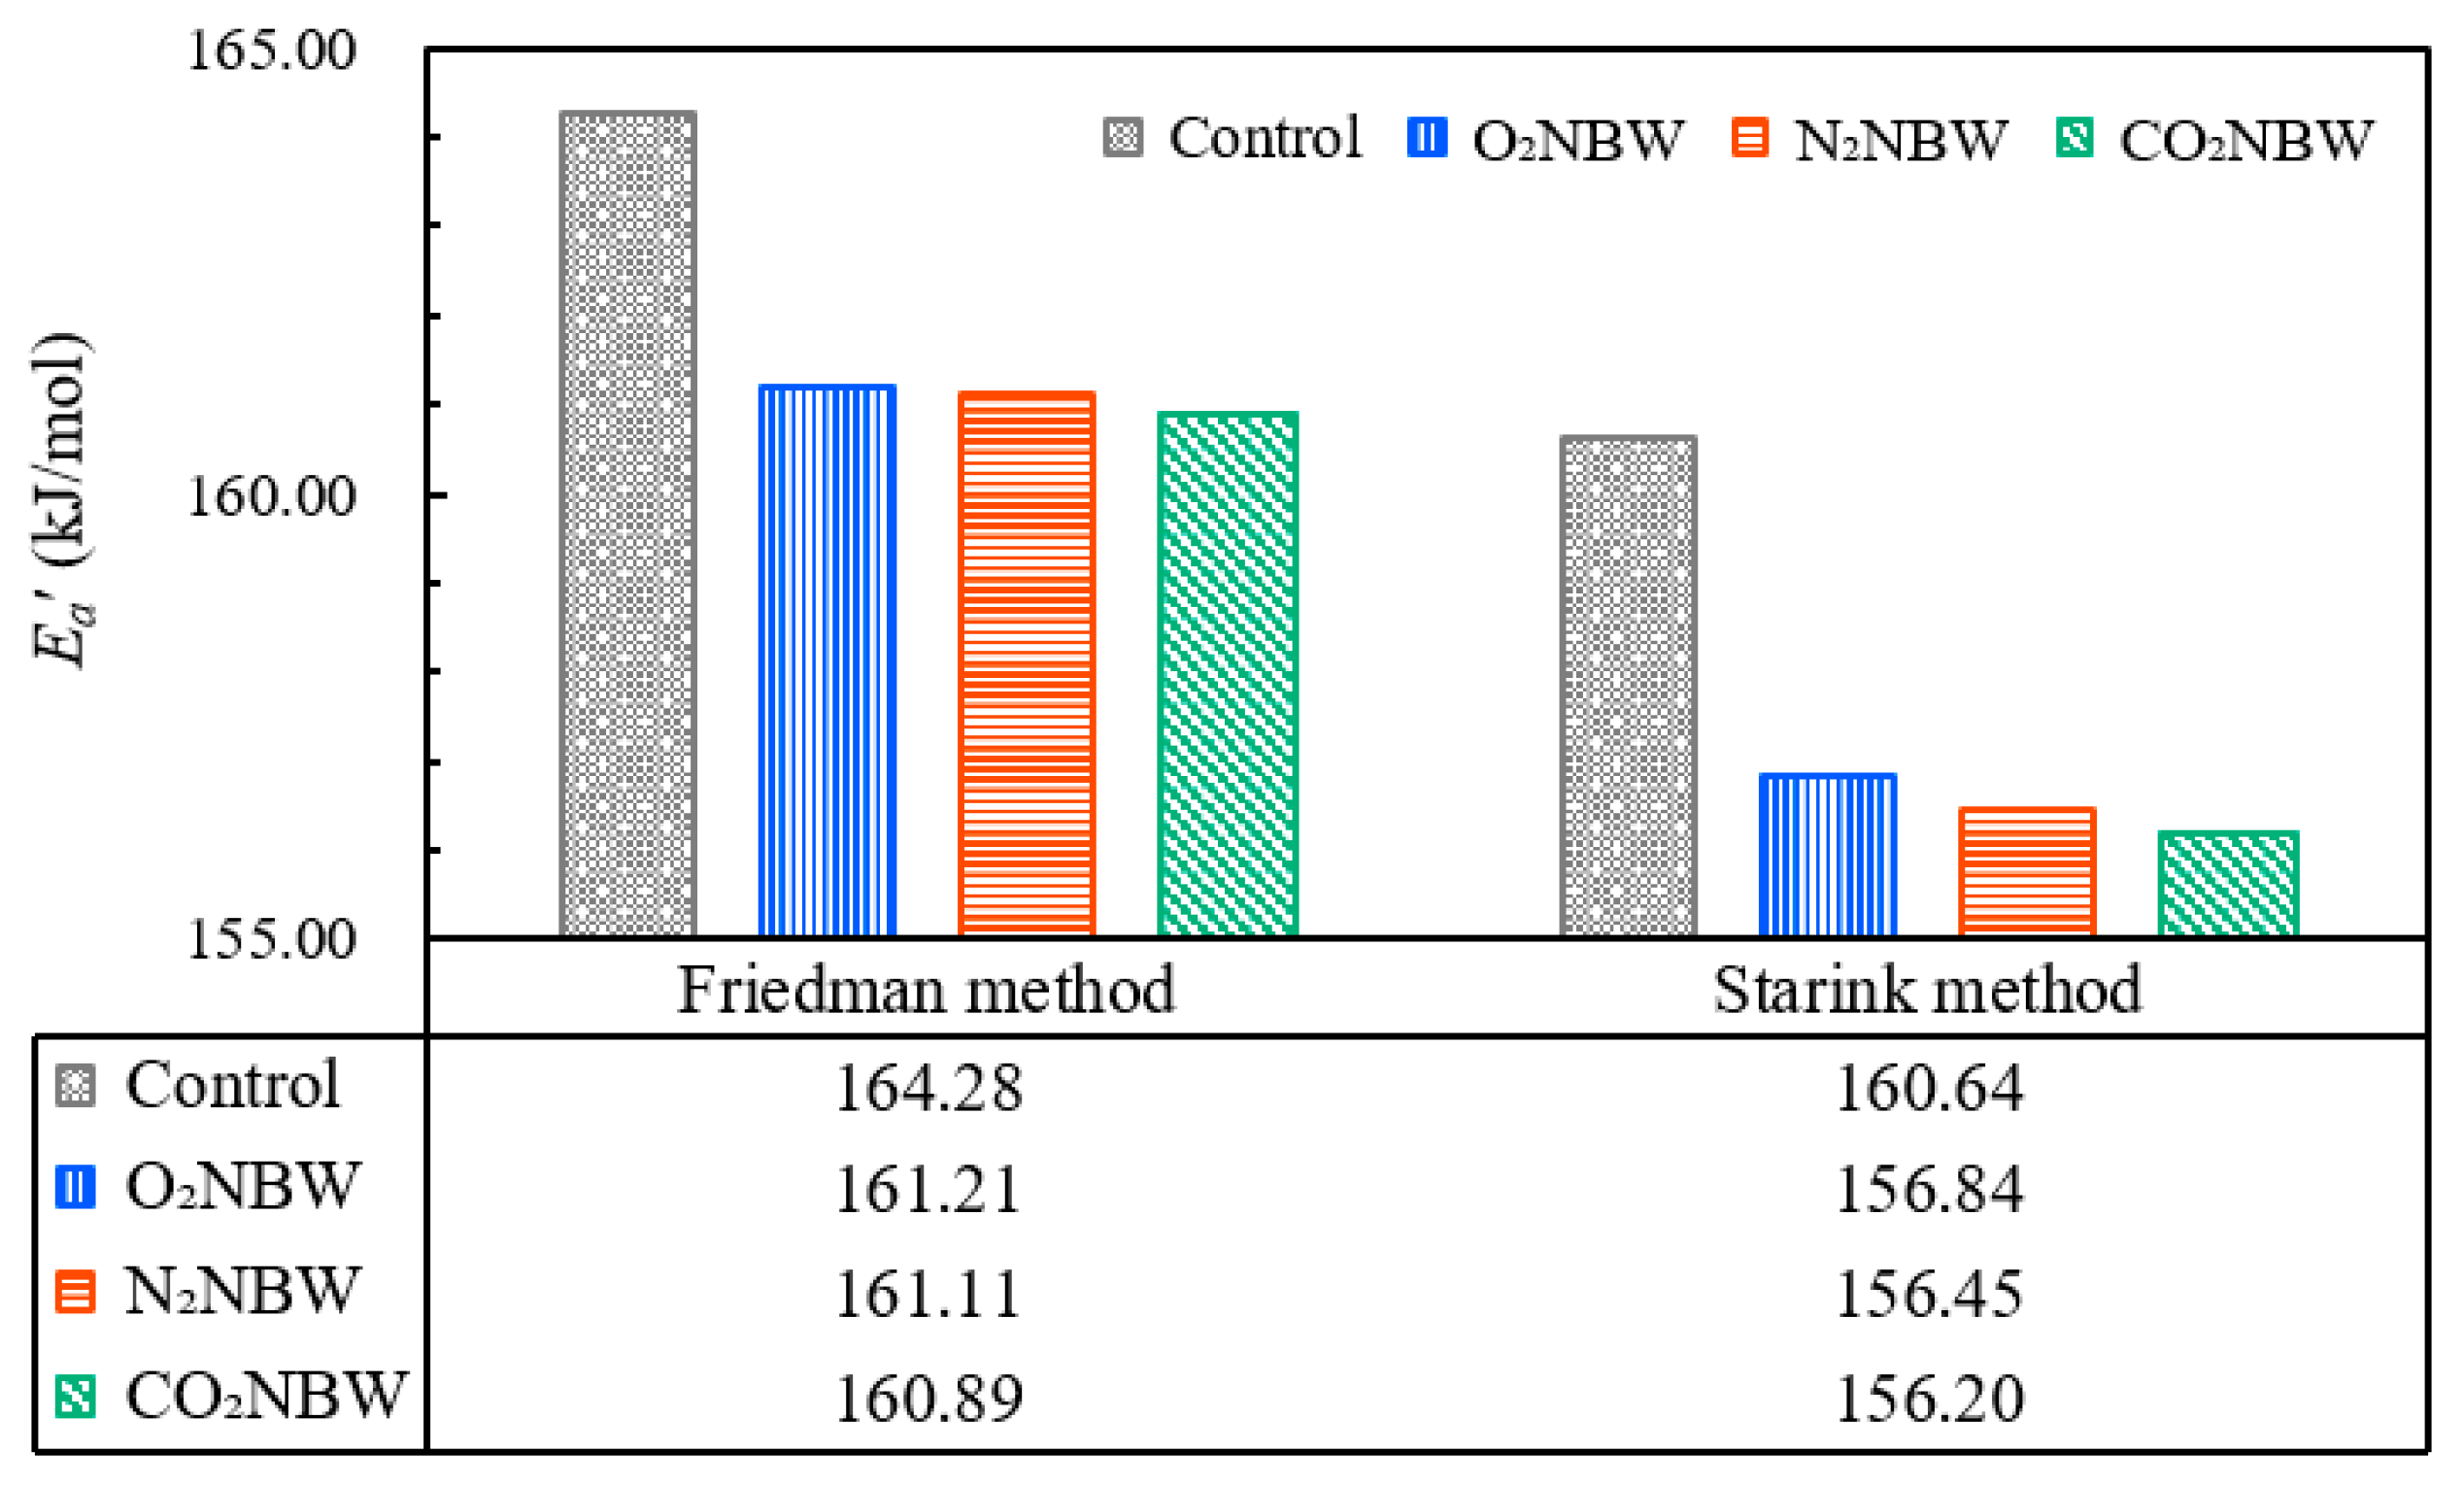
To further verify the reliability of the selected conversion range, statistical analysis of Ea′ values was performed within α = 0.1–0.7 for both the Starink and Friedman methods (Table 4). The Ea′ values exhibited relatively stable variation within this conversion interval, whereas larger deviations were observed outside this range, which may be associated with changes in the dominant degradation mechanisms and the involvement of secondary reactions. For the Starink method, the average Ea′values were 160.64, 156.45, 156.84, and 156.20 kJ mol−1 for Control, N2NBW, O2NBW, and CO2NBW, respectively. Compared with the control sample, the corresponding reductions were 2.61%, 2.37%, and 2.76%, respectively. For the Friedman method, the average Ea′ values were 164.28, 161.11, 161.21, and 160.89 kJ mol−1, corresponding to reductions of 1.93%, 1.87%, and 2.06%, respectively. Although the magnitude of Ea′ variation was relatively small, the consistent decrease observed using two independent kinetic approaches confirms that NBW treatment produced a reproducible influence on the thermal degradation behavior.
Within the α = 0.1–0.7 range, Ea′ generally decreased after modification. The maximum Ea′ values were observed around α = 0.4 for the Friedman method and α = 0.5 for the Starink method, corresponding to the main cellulose degradation region [57,58]. The decrease in Ea′ within this region (approximately 1.9–2.1% for Friedman and 2.4–2.8% for Starink) suggests that NBW treatment modified cellulose-associated structures, potentially through disruption of crystalline ordering and relaxation of hydrogen-bond interactions. This interpretation is consistent with the previous characterization results, where the formation of amorphous cellulose (increase in LOI) occurred together with a reduction in crystalline cellulose contribution (decrease in TCI).
At higher conversion regions (α = 0.6–0.7 for Friedman and α = 0.7–0.8 for Starink), cellulose decomposition is largely completed, and lignin-related reactions become increasingly important [57,58]. Within these regions, the Friedman method showed an Ea′ reduction of approximately 0.1–3.1%, while the Starink method showed a reduction of approximately 1.1–2.2%. This decrease may indicate modification of lignin-derived structures, possibly involving relaxation of aromatic networks and increased accessibility of reactive sites. Furthermore, the reduction in Ea′ observed during the early pyrolysis stage may be associated with structural relaxation that facilitates hemicellulose exposure, contributing to the observed decrease in initial thermal stability (Table 3).
The apparent activation energy (Ea′) for bagasse meal was ultimately calculated by averaging the activation energy values corresponding to conversion rates of 0.1–0.7 (Figure 5). Ea′ consistently decreased in both methods, with reductions of 1.9–2.1% observed using the Friedman method and 2.4–2.8% using the Starink method. The difference in reduction amounts between methods is thought to be due to the presence or absence of approximation equations and the differences in the equations used.
The order of magnitude for Ea′ was consistently control group > oxygen NBW > nitrogen NBW > carbon dioxide NBW, consistent with the relationship for maximum peak temperature (Table 3). These results suggest that using carbon dioxide NBW most effectively improves the refractory nature of bagasse meal. Therefore, this study selected carbon dioxide as the most suitable NBW for pretreatment prior to liquefaction. Subsequently, bagasse meal from the control group (untreated with NBW) and bagasse meal pretreated with carbon dioxide were liquefied under identical conditions. The differences in the characteristics of the liquefaction products and liquefaction residues were then confirmed.

3.2. Effect of Nanobubble Water Pretreatment on Bagasse Meal Liquefaction

3.2.1. Changes in Residue Content and Liquefaction Reaction Rate

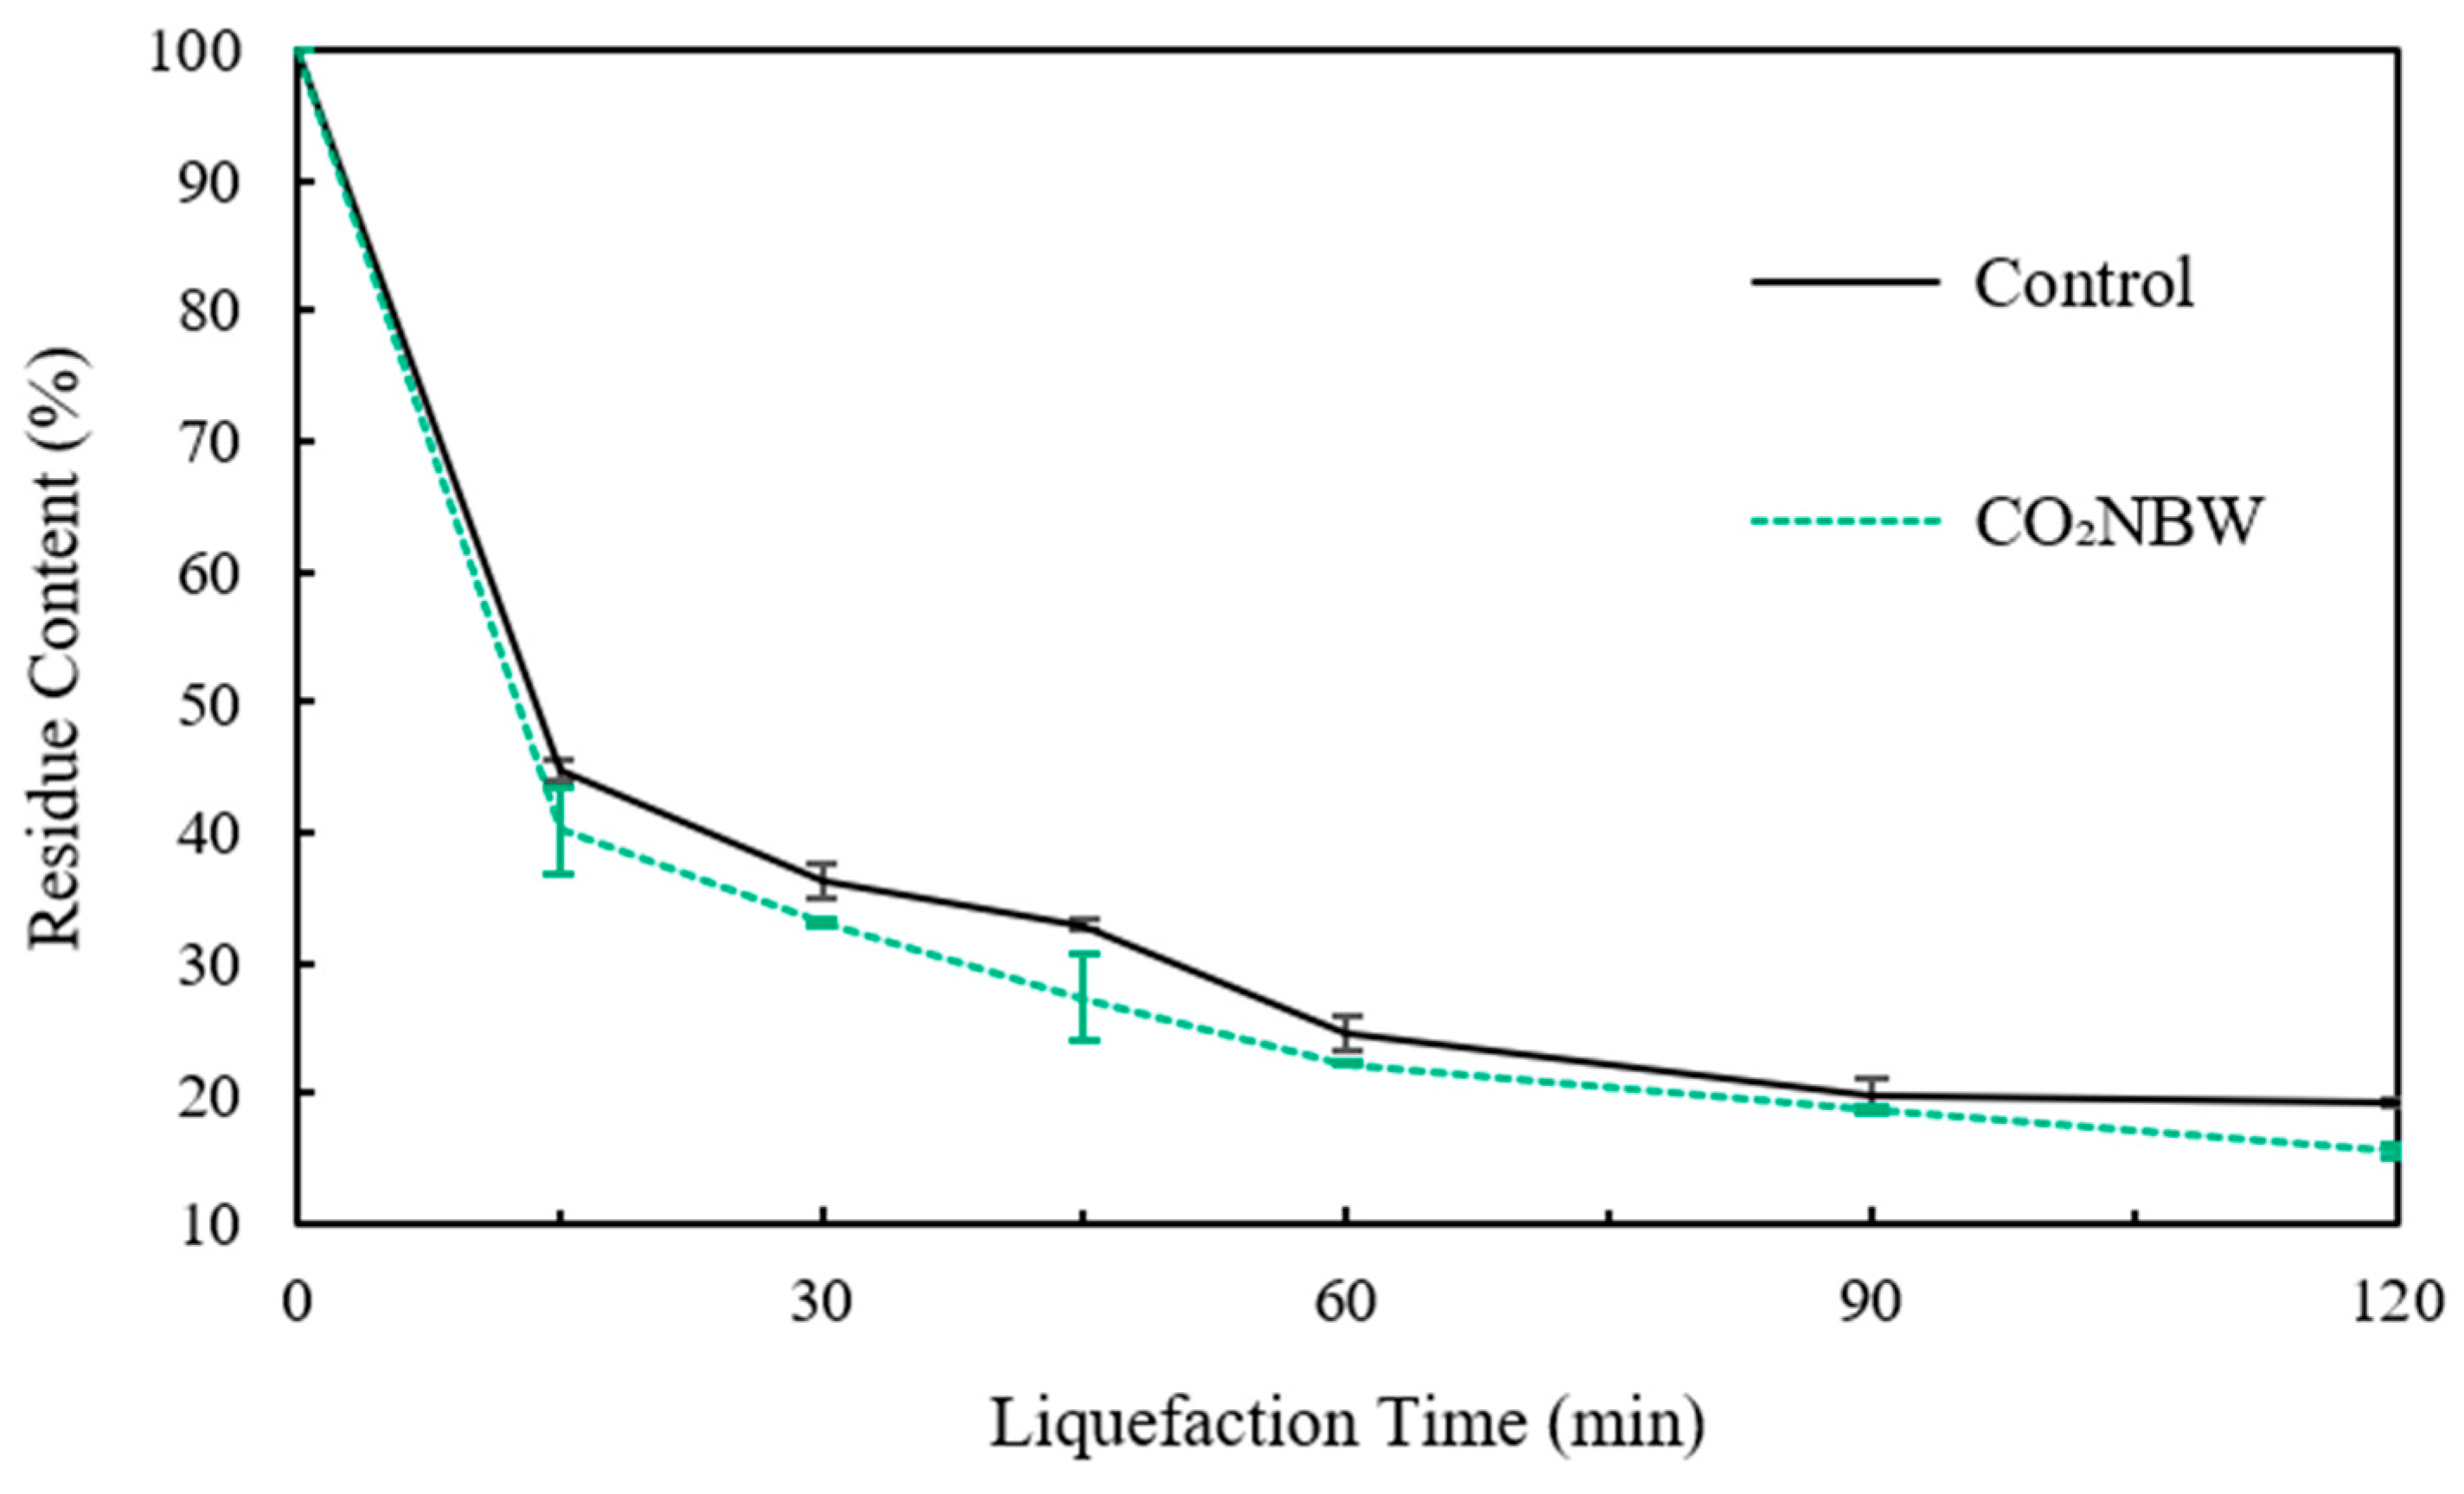
The residue content consistently decreased (Figure 6). It decreased by 11%, 9.0%, 17%, 8.9%, 6.3%, and 19% at liquefaction times of 15, 30, 45, 60, 90, and 120 min, respectively. The higher reduction rate observed between 15 and 45 min compared to 60 and 90 min indicates that the initial liquefaction stage was particularly accelerated due to a decrease in activation energy, attributed to the relaxation of hydrogen bonds and aromatic networks. By 60 min, the two residue contents converged, and at 90 min, they were closest, indicating that the liquefaction of amorphous cellulose, hemicellulose, and some lignin was completed by 90 min as the first stage [59,60]. Although the control group remained flat until 120 min, the pretreated bagasse meal showed a decreasing trend, reaching its maximum rate of decrease. This occurred because NBW amorphized crystalline cellulose and relaxed hydrogen bonds, making cellulose more susceptible to liquefaction [60,61].
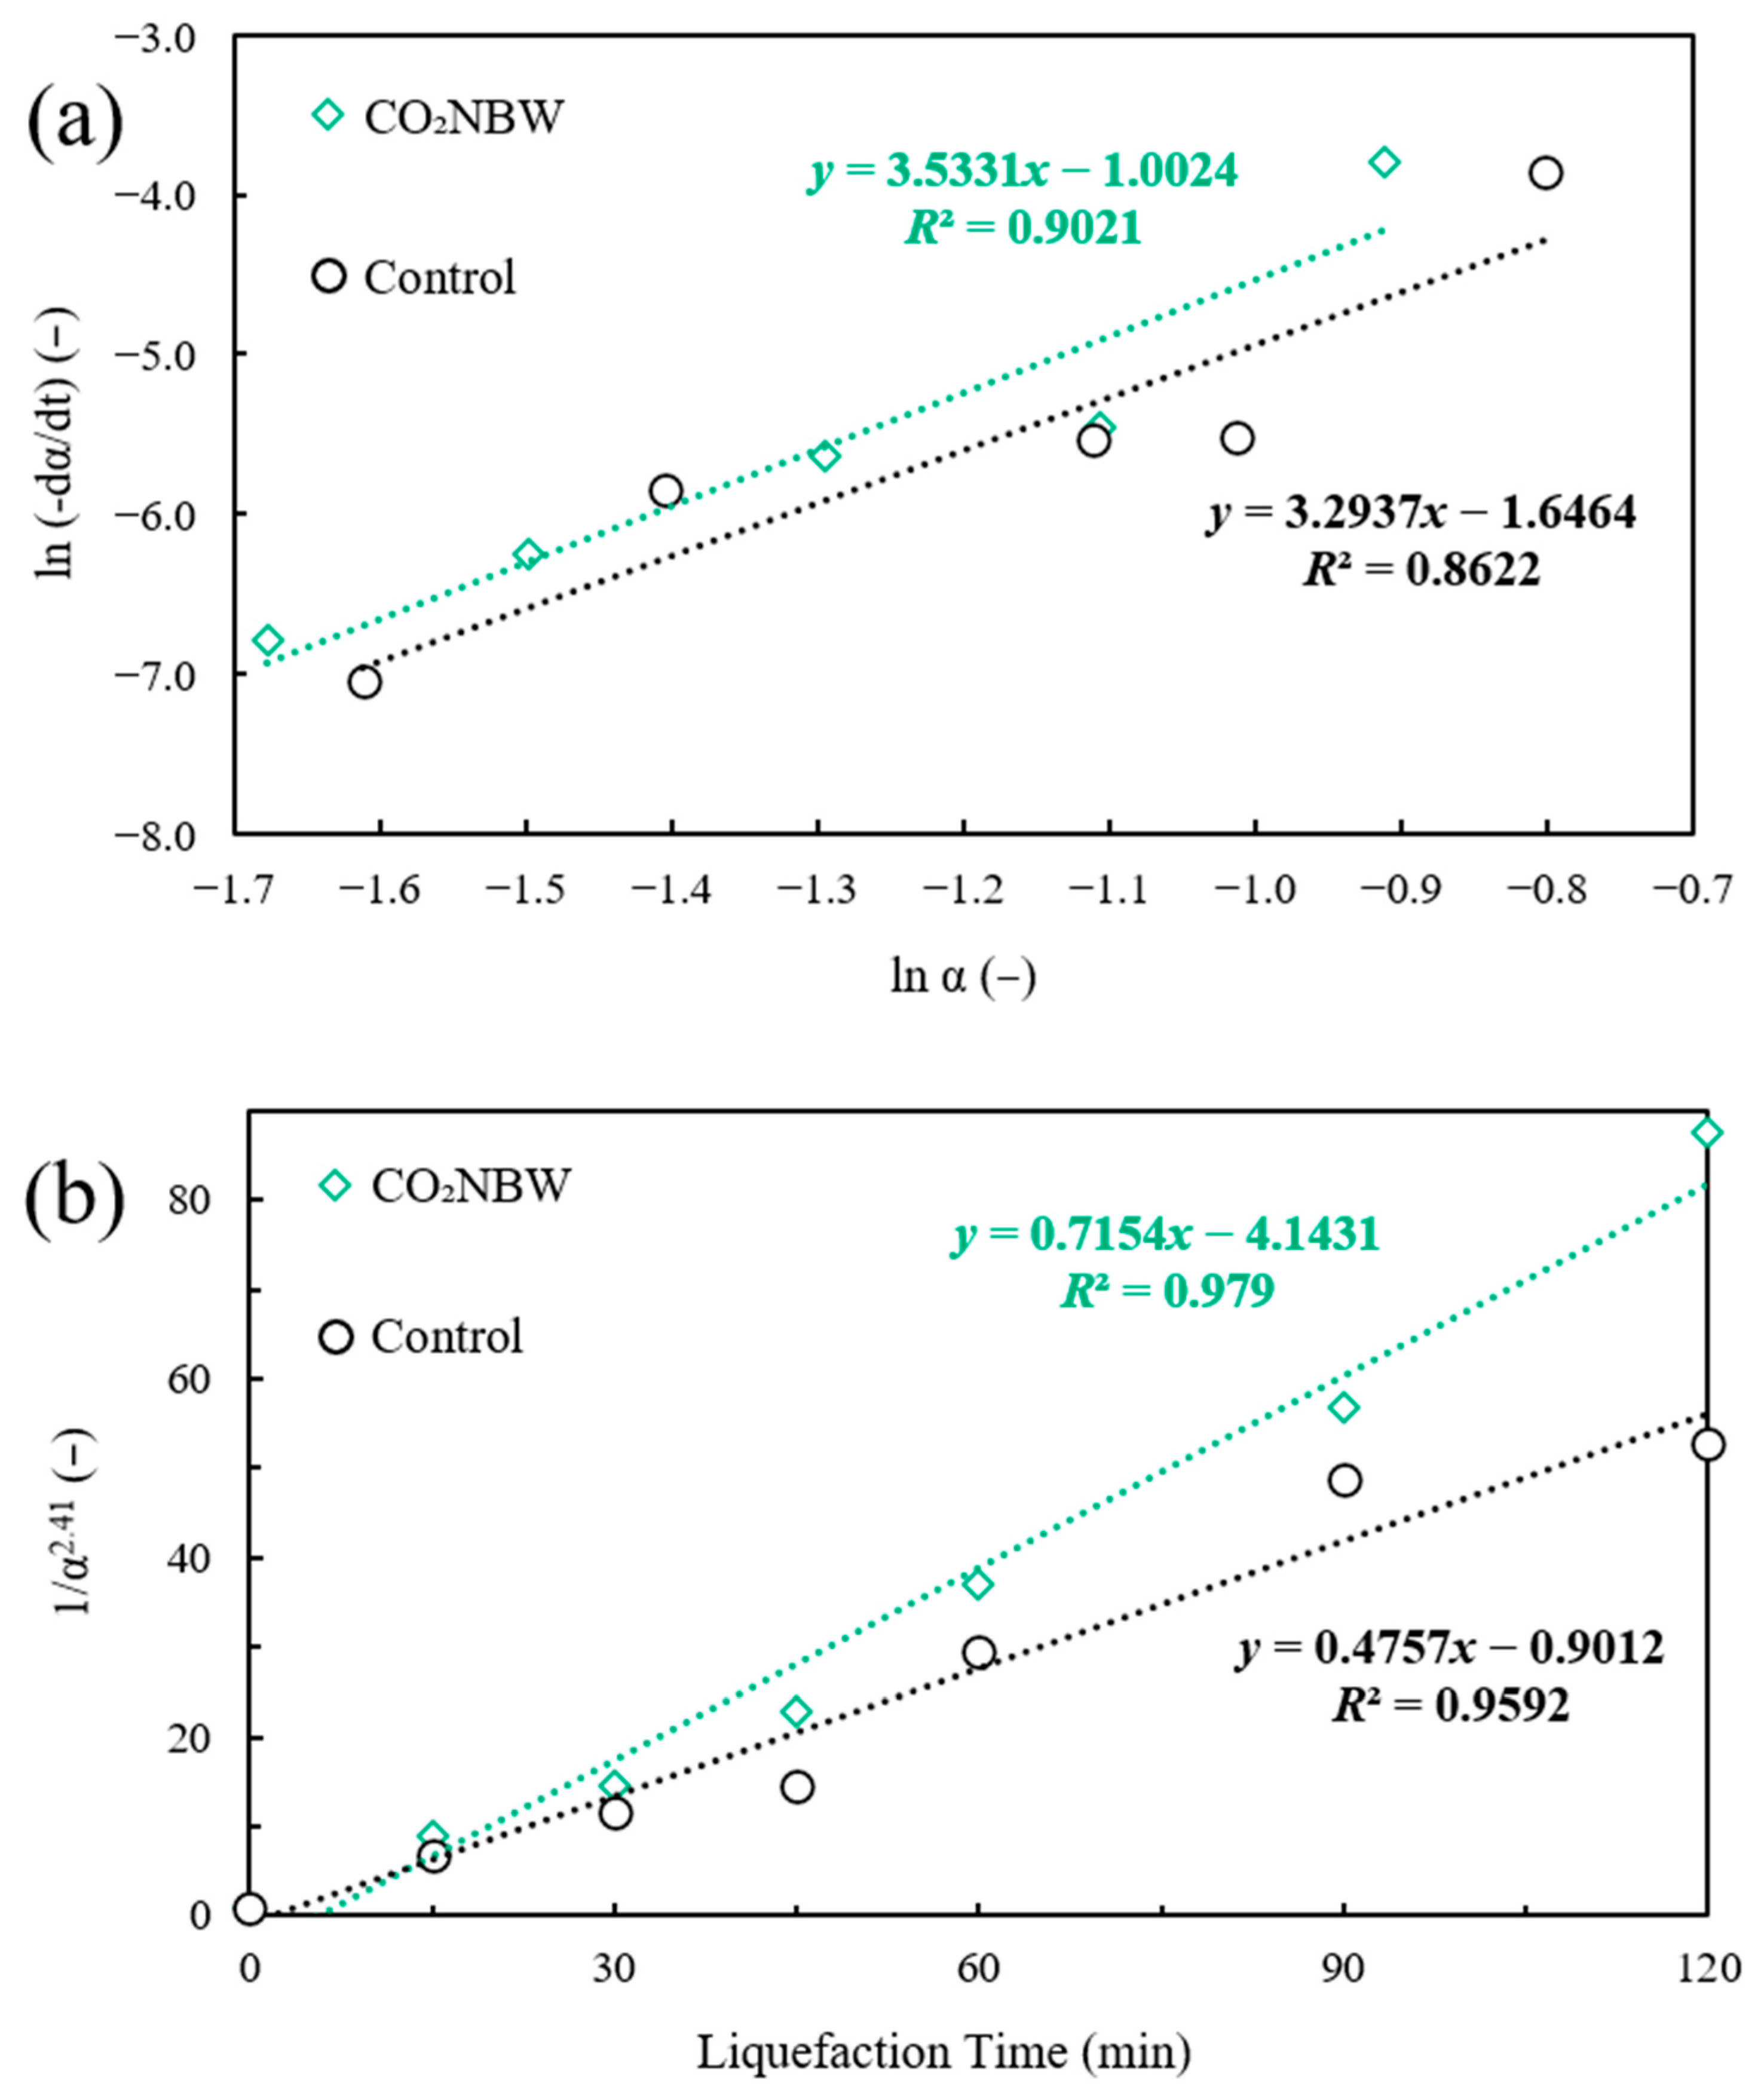
Next, we plotted the relationship between the liquefaction residue content and the liquefaction reaction rate constant based on the obtained residue content data (Figure 7a). However, the coefficient of determination for the resulting straight line was not particularly high, and the slope n—which represents the reaction order—did not match exactly. Consequently, we were unable to compare the two apparent reaction rate constants (k′) derived from the y-intercepts. To make this comparison feasible, we therefore conducted additional analyses. Specifically, since no significant difference was observed between the two reaction orders obtained in Figure 7a, we assumed the average value (3.41) to be the liquefaction reaction order for both samples. We substituted n = 3.41 into Equation (6), plotted 1/α2.41 on the vertical axis and liquefaction time on the horizontal axis, and fitted a straight line [52] (Figure 7b). The analysis revealed improved coefficients of determination: 0.9592 for the control group and 0.979 for the CO2NBW group. Therefore, it was considered that the liquefaction of both samples could potentially be explained using a 3.41-order reaction model.
At this point, k′ increased by 50%. This was primarily due to a decrease in the residue content during the initial stage of liquefaction (Figure 6), which supports the finding that the liquefaction reaction rate increased due to a decrease in activation energy (Figure 4 and Figure 5).

3.2.2. Changes in Molecular Weight of Liquefied Products

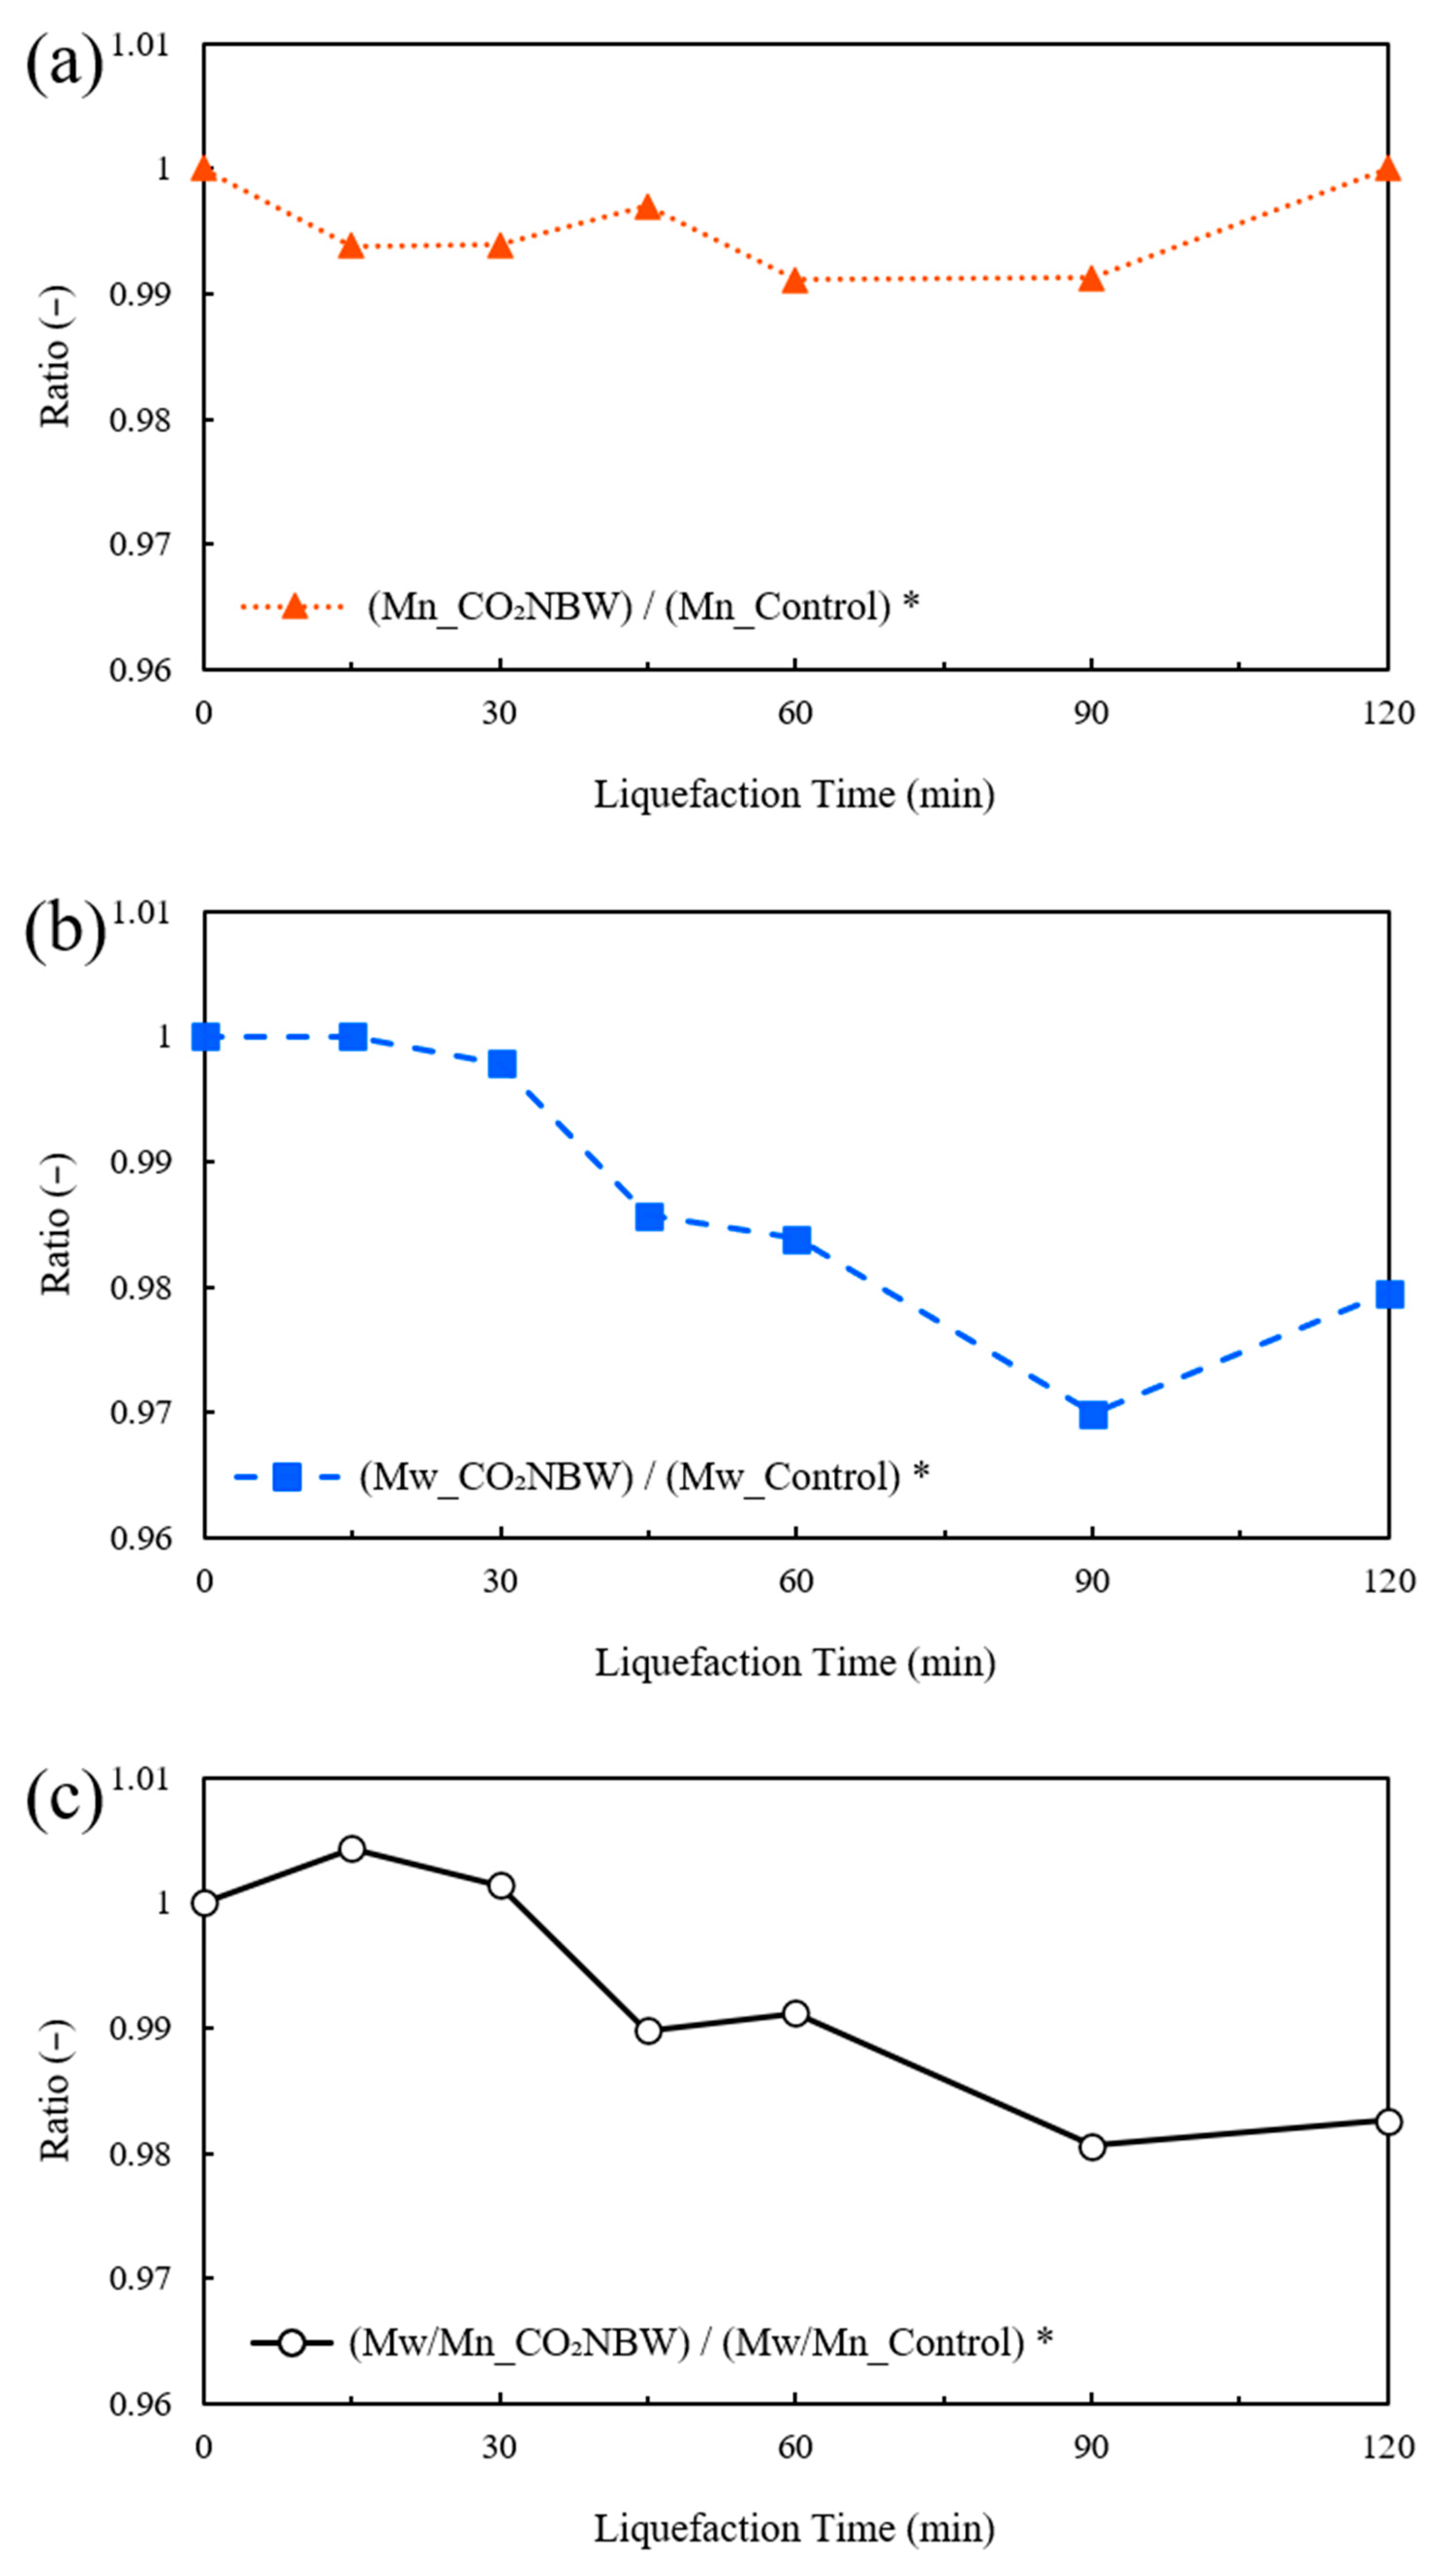
The molecular weight data are presented in Table S2. Mn decreased by 0.30–0.87% between 15 and 90 min (Figure 8a). Mw decreased by 0.22–3.0% between 30 and 120 min (Figure 8b). Mn/Mw decreased by 0.88–1.9% between 45 and 120 min (Figure 8c). These results indicate that NBW pretreatment contributed to the low molecular weight nature of the liquefied products.

3.2.3. Changes in Hydroxyl Value of Liquefied Products

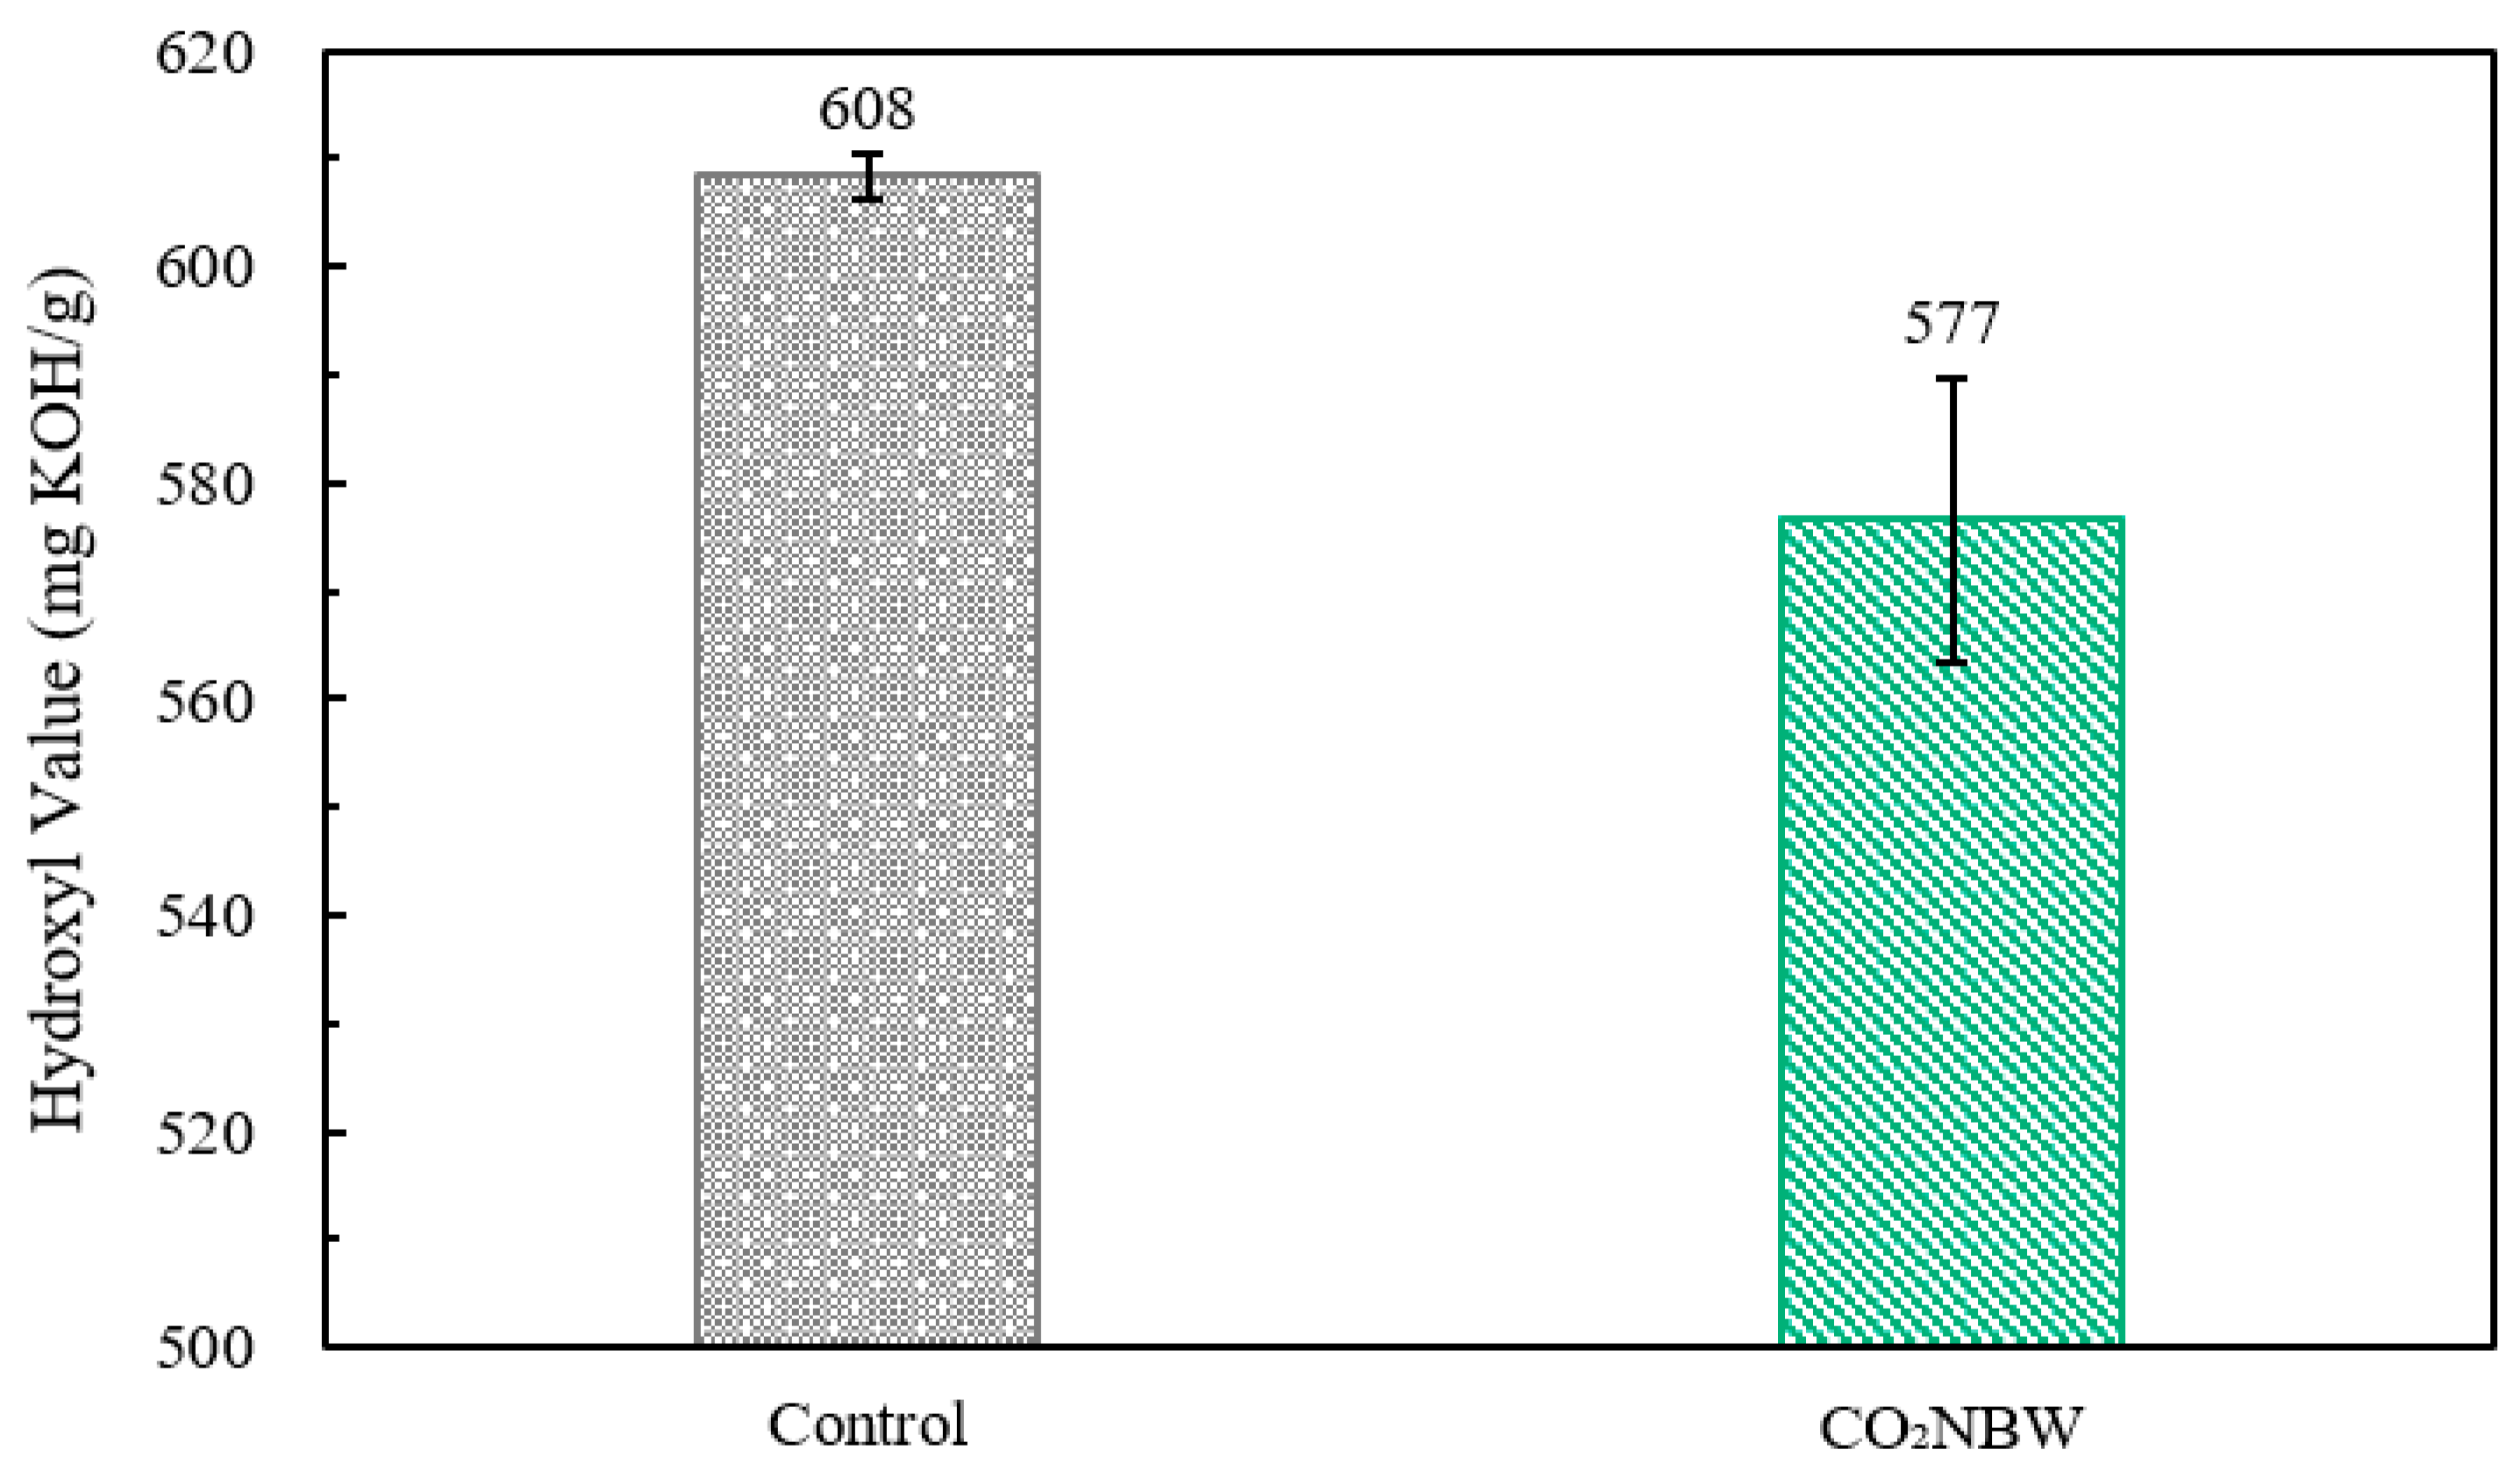
The hydroxyl value of the 120-min liquefied product decreased by 5.2% (Figure 9). As mentioned earlier, this resulted from the accelerated liquefaction of crystalline cellulose (Figure 6), which led to vigorous consumption of hydroxyl groups. When no recondensation reaction is considered to occur after rapid liquefaction, the hydroxyl value generally decreases gradually as the liquefaction reaction progresses and the residue content decreases [53]. Therefore, this result is consistent with past studies [53,59,62,63]. For high-rigidity structural applications, such as high-performance thermosetting polyurethane and rigid insulation foam, a high OH value is desirable to ensure sufficient crosslinking density; therefore, a decrease in the OH value may lead to reduced strength and heat resistance. On the other hand, in flexible and viscoelastic foams and coatings, excessive crosslinking produces hard and brittle materials; therefore, as the OH value decreases, viscosity and molecular weight also decrease, which may improve mixability and foaming processability. Consequently, the impact of a decrease in the hydroxyl value on the performance of the final product depends on the specific application.
However, in a previous study using ozone NBW [18], the hydroxyl value increased significantly. This is thought to be due to ozone decomposing much of the amorphous material, exposing cellulose, and additionally increasing its proportion. Alternatively, it may be attributed to ozone’s strong oxidizing power, significantly relaxing hydrogen bonds and aromatic networks. In either case, the modification effects of the three gases used in this study may not have matched those of ozone, highlighting the limitations of NBW using less reactive gases.

3.2.4. Changes in the Chemical Structure of the Liquefied Product

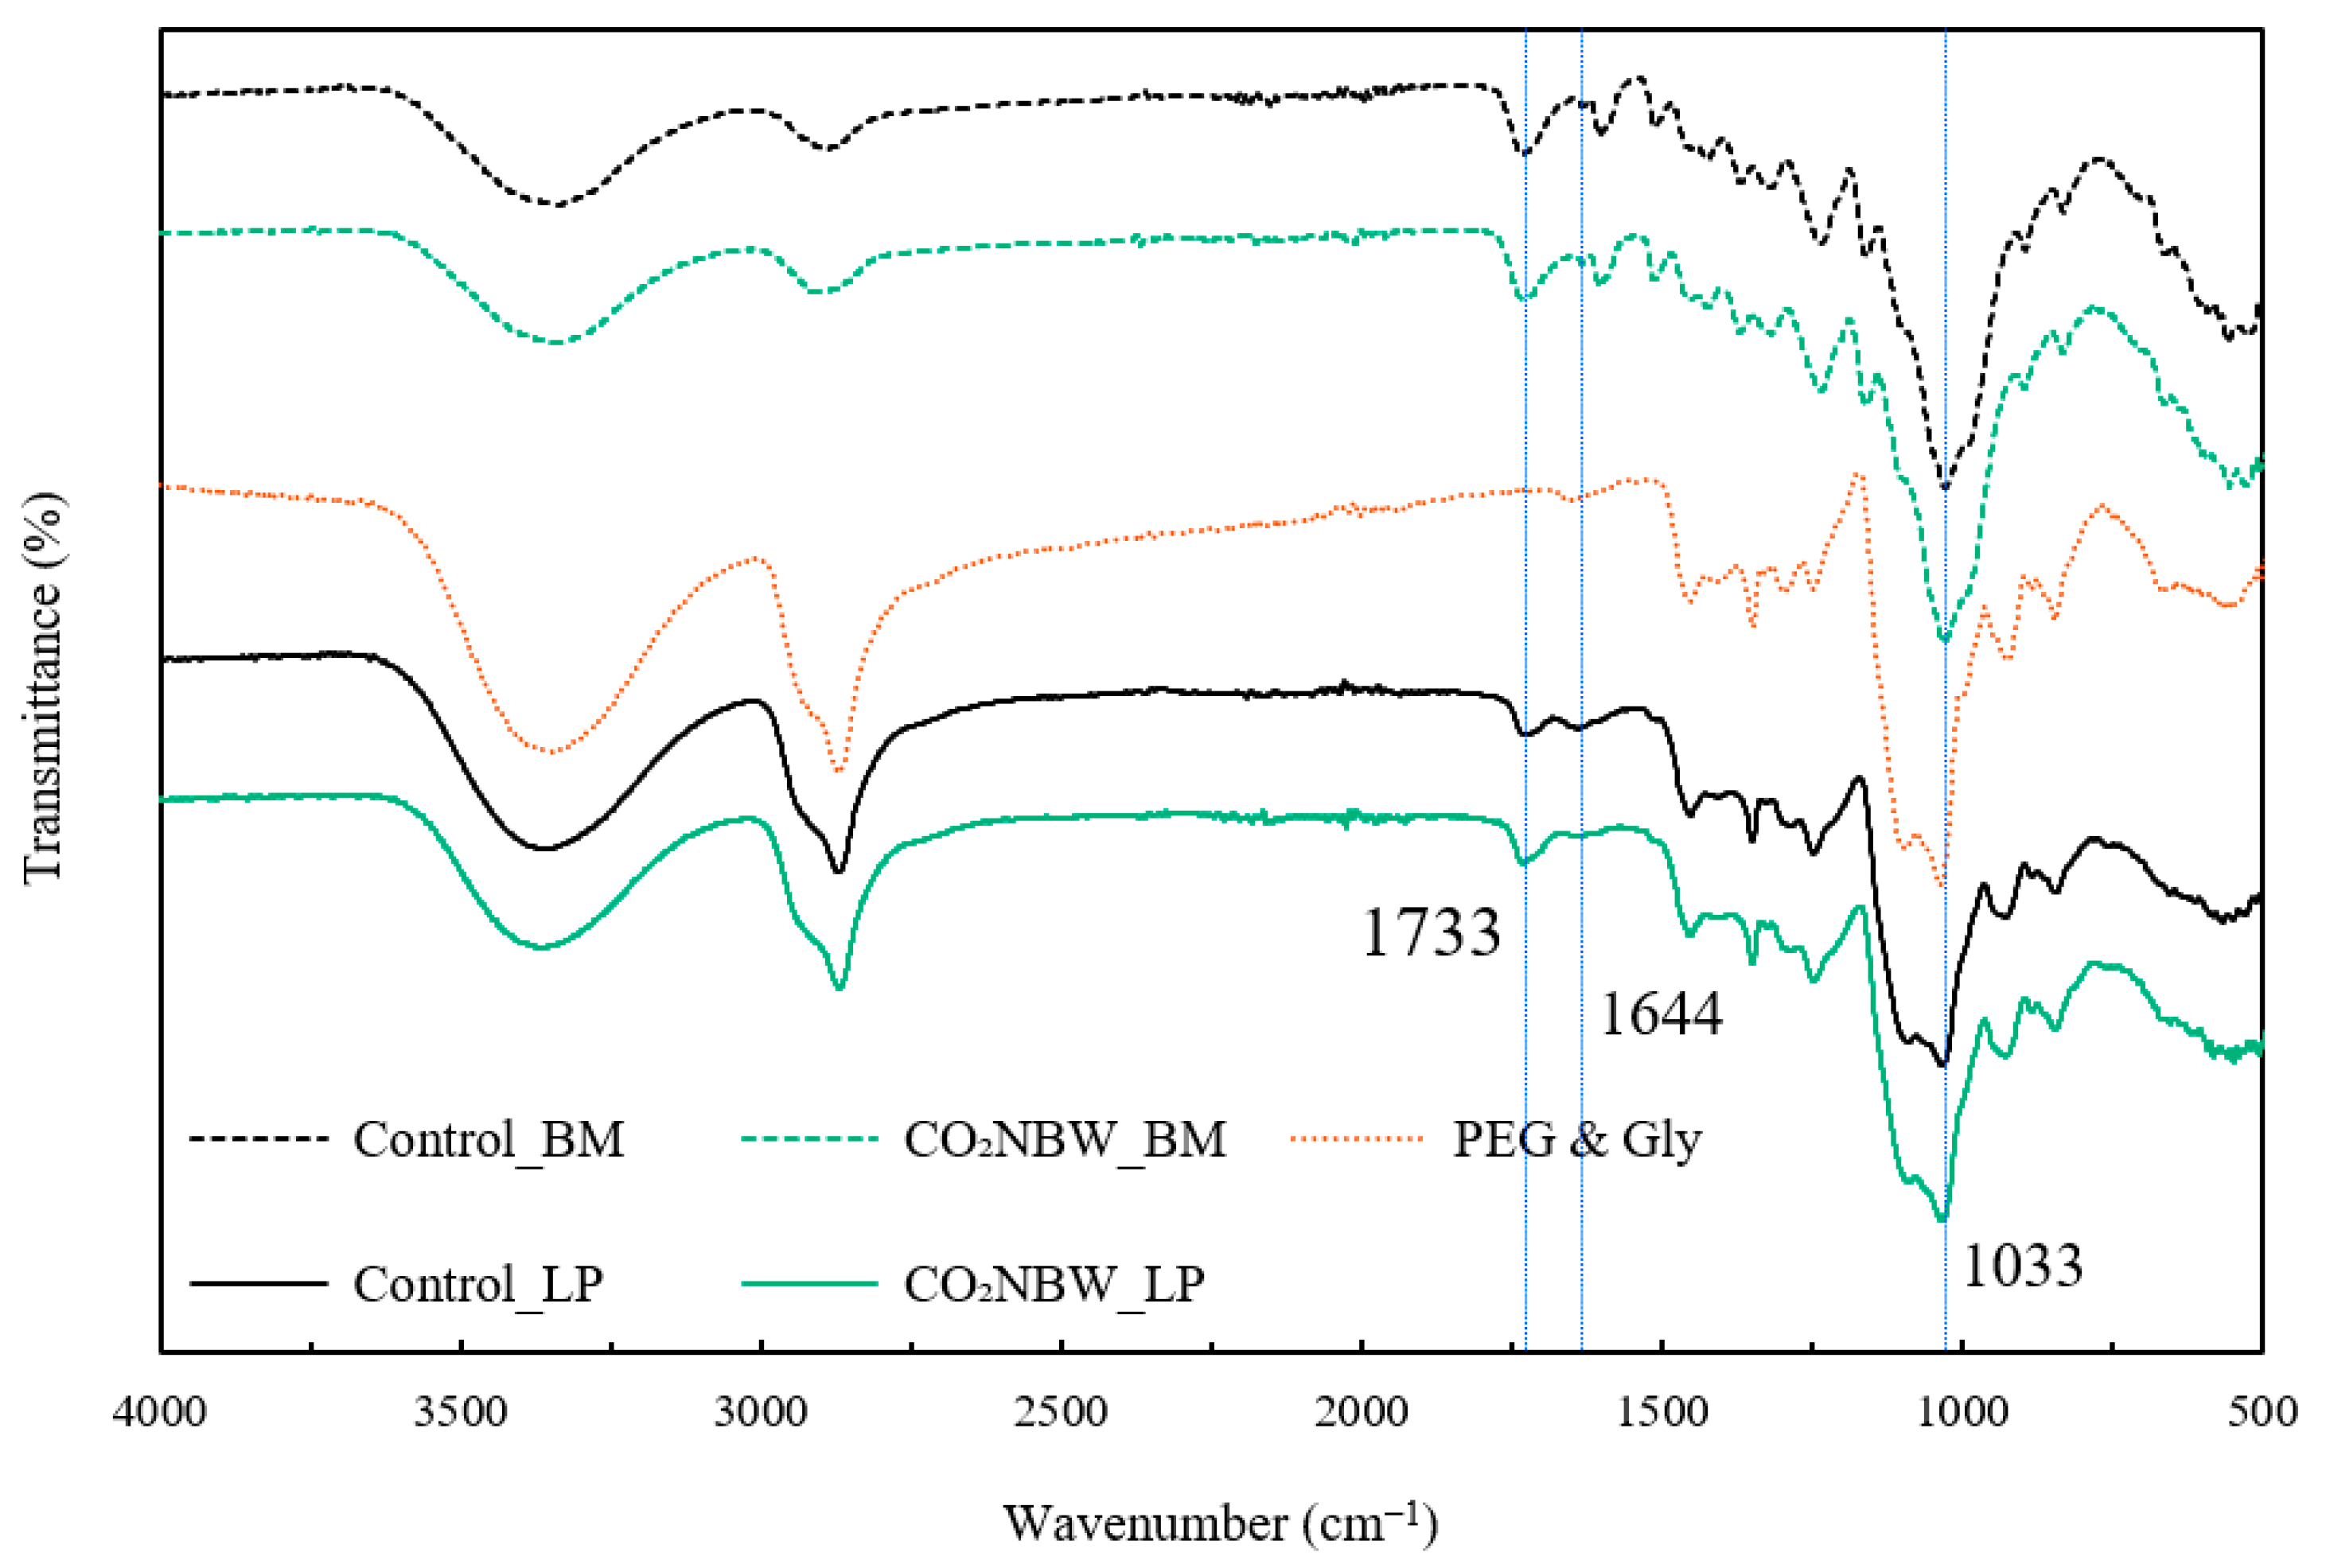
In the 120-min liquefied product, the peak around 1733 cm−1 originating from the C=O stretching vibration of polysaccharides [52] and the peak around 1033 cm−1 originating from the C-O stretching vibration of polysaccharides [52] became stronger and sharper (Figure 10). This may indicate enhanced depolymerization and increased accessibility of cellulose, suggesting that crystalline regions could become more susceptible to liquefaction at extended reaction times of 120 min. On the other hand, the peak around 1644 cm−1, originating from the C=C [15] of the lignin structure, weakened. This could be attributed to the destruction of the fundamental conjugated structure originating from lignin in the product. Pretreatment suggests the possibility that prolonged liquefaction decomposes and transforms the skeletal structure of lignin.

3.2.5. Changes in Thermal Stability of Liquefaction Residue

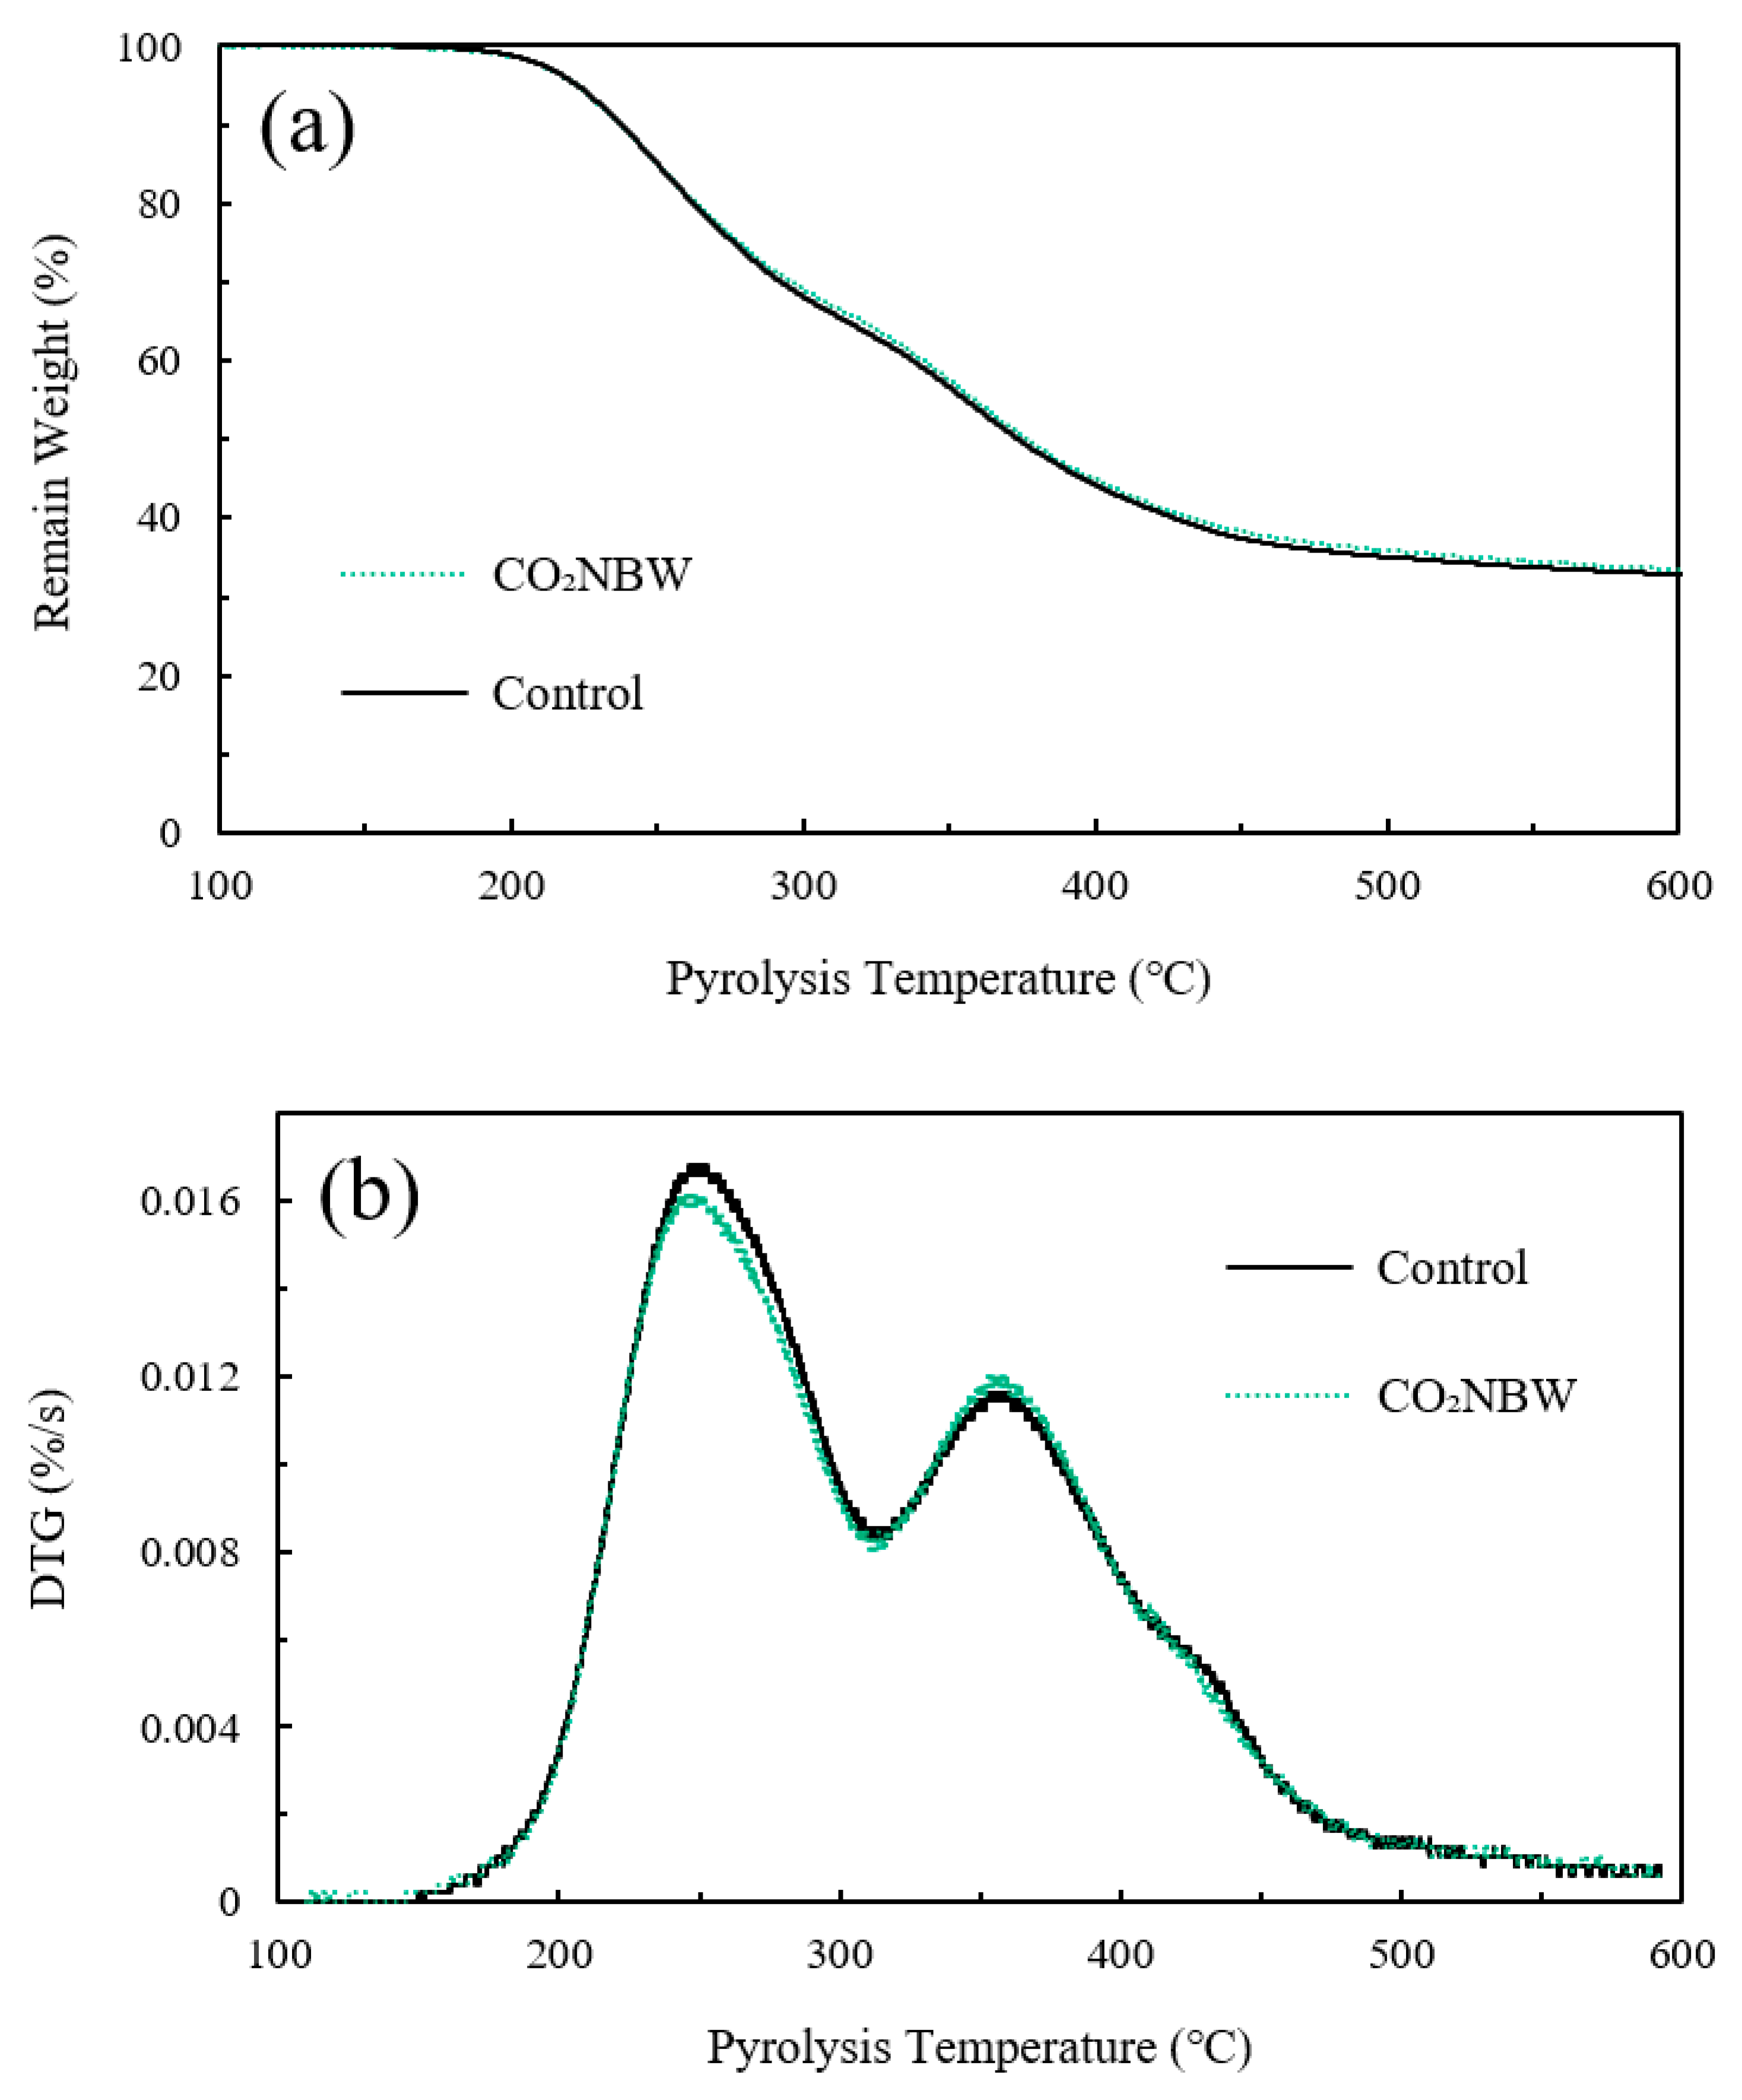
The TG curve of the residue after 120 min liquefaction (Figure 11a) was used to generate DTG curves (Figure 11b), identifying two pyrolysis peak temperatures (Tmax1 and Tmax2) (Figure 4). Weight loss between 150 and 300 °C primarily resulted from the decomposition of liquefaction derivatives, hemicellulose, and lignin side chains. Weight loss between 300 and 400 °C was mainly due to cellulose decomposition, while lignin decomposition caused weight loss above 400 °C [24,56]. Both low-temperature peaks (Tmax1) occurred around 248 °C, representing a decrease of approximately 80 °C or more compared to the pre-liquefaction sample (around 333 °C, Table 3). This indicates that the liquefaction process partially decomposed the hemicellulose, cellulose, and lignin components in the bagasse meal into polyols, generating abundant components in the liquefaction residue that readily undergo thermal decomposition [64]. Therefore, the 1.7 °C decrease in this peak temperature due to pretreatment might reflect a slight reduction in the thermal stability of the liquefaction residue derived from liquefaction derivatives. This subtle decrease could potentially stem from the degradation of high-molecular-weight products—considered residues because liquefaction was incomplete—into lower-molecular-weight products or from the suppression of condensation reactions. This tentatively suggests the dominance of decomposition reactions (Figure 7) and a reduced residue content (Figure 6).
Furthermore, the peak temperature on the high-temperature side (Tmax2), originating from unreacted cellulose (primarily crystalline regions), was around 356 °C, an increase of over 20 °C compared to before liquefaction (around 333 °C, Table 3). This resulted from the liquefaction of nearly all amorphous cellulose, leading to a concentration of crystalline regions [61] and improved thermal stability. The marginal decrease (0.33 °C) in this peak temperature due to pretreatment precludes a definitive conclusion, but it might hint at a minor trend toward the amorphization of crystalline cellulose and hydrogen bond relaxation.
The final weight increased by 2.3% (Table 5). This is attributed to the concentration of thermally stable residues and the enhanced liquefaction of other components [24,64].

4. Conclusions

The findings suggest that Nanobubble Water (NBW) pretreatment induces certain structural and compositional modifications in lignocellulosic biomass. The observed decreases in cellulose and lignin content, together with increased crystallinity and lateral order index, indicate a trend toward the preferential degradation of amorphous components, including amorphous cellulose and lignin. In parallel, reductions in total crystallinity index, lower 50% weight loss and pyrolysis peak temperatures, and decreased activation energy during the mid-pyrolysis stage imply that NBW could also affect the structural transformation within crystalline regions. These results point to the possibility of a dual effect in which both amorphous degradation and crystalline phase alteration occur simultaneously. Furthermore, the consistent decrease in low-temperature weight loss temperatures (5% and 10%), along with reductions in activation energy across the entire pyrolysis range, could be interpreted as an indication that NBW weakens intermolecular interactions, including hydrogen bonding in cellulose and aromatic network stability in lignin. This structural relaxation may potentially enhance the overall reactivity of the biomass. Collectively, these effects contribute to a reduction in the apparent activation energy, suggesting a potential improvement in process efficiency. Although these insights are based on preliminary trends where certain measurements were performed singly, they align with the observed decrease in residue content and an increase in reaction rate constants. These trends suggest that NBW pretreatment has the potential to facilitate the liquefaction of the primary components of bagasse meal. Additionally, the enhanced liquefaction of crystalline cellulose at 120 min is consistent with the reduced hydroxyl value and the increased cellulose-derived structures in the liquefied product.
However, the present study lacks sufficient data regarding NBW, as well as detailed information on the modification effects and solid evidence supporting the proposed mechanisms. Indeed, simply bringing bagasse meal into contact with NBW yields only a very limited modification effect, with the percentage changes consistently remaining at just a few percent. This study has merely demonstrated the possibility that NB-containing water induces certain structural changes in bagasse meal. It remains unclear whether these effects were caused solely by the NBs in the water or by the gas-saturated water itself; thus, further verification is required.
To overcome these limitations, it is necessary to thoroughly re-examine the pretreatment conditions by adjusting parameters such as temperature, time, pressure, and pH, or by incorporating additives such as salt. Alternatively, rather than separating the process into two distinct stages as performed in this study, developing experimental equipment to introduce NBs directly into the liquefaction reaction system must be considered. Furthermore, it is indispensable to consider additional analytical methods to elucidate, in a more detailed and explicit manner, the crystalline state of cellulose constituting the bagasse meal, as well as the changes in intramolecular and intermolecular interactions within cellulose and lignin.

Supplementary Materials

The following supporting information can be downloaded at https://www.mdpi.com/article/10.3390/physchem6030045/s1. Figure S1: Changes in XRD spectra of bagasse meal after nanobubble water pretreatment. Figure S2: Changes in FT-IR spectra of bagasse meal after nanobubble water pretreatment. Figure S3: TG curves of samples at different heating rates; (a) Control, (b) O2NBW, (c) N2NBW, (d) CO2NBW. Figure S4: Conversion rate evolution of samples at different heating rates; (a) Control, (b) O2NBW, (c) N2NBW, (d) CO2NBW. Figure S5: Arrhenius plots of bagasse meal at different conversion rates; (a) Control with Friedman method, (b) O2NBW with Friedman method, (c) N2NBW with Friedman method, (d) CO2NBW with Friedman method, (e) Control with Starink method, (f) O2NBW with Starink method, (g) N2NBW with Starink method, (h) CO2NBW with Starink method. Table S1: Coefficients of determination for each Arrhenius plot; (a) Friedman method, (b) Starink method. Table S2: GPC data showing molecular weight (Mn), weight-average molecular weight (Mw), and polydispersity (Mw/Mn).

Author Contributions

S.A. (Shogo Ariizumi): writing—original draft, data curation, conceptualization, methodology, visualization, investigation, and writing—review and editing; C.E.E.: supervision and writing—review and editing; T.O.M.: supervision and writing—review and editing; G.M.: data curation and methodology; S.A. (Satoshi Anzai): data curation and methodology; M.S.: supervision, writing—revision and editing, and resources; Q.W.: supervision, writing—revision and editing, and resources. All authors have read and agreed to the published version of the manuscript.

Funding

This study was partially supported by the Grant-in-Aid for Scientific Research (KAKENHI), including Special Funds for Innovative Area Research and Basic Research (Category B), provided by the Ministry of Education, Culture, Sports, Science and Technology (MEXT), Japan. The funding was awarded under grant numbers 22H03747 (FY2022–FY2024), 24K20941 (FY2024–FY2026), and 25K03267 (FY2025–FY2028).

Institutional Review Board Statement

Not applicable.

Data Availability Statement

The original contributions presented in this study are included in the article. Further inquiries can be directed to the corresponding author.

Acknowledgments

Our heartfelt thanks go to the Okinawa Prefectural Agricultural Cooperative for their kind donations of materials, which made this study possible. We are truly grateful for their generosity and the trust they placed in our research endeavors.

Conflicts of Interest

All authors declare that the research was conducted in the absence of any commercial or financial relationships that could be construed as a potential conflict of interest. The authors declare the following financial interests/personal relationships, which may be considered as potential competing interests: SHOGO ARIIZUMI reports that the support was provided by Saitama University.

References

  1. State of the Global Climate 2024. Available online: https://wmo.int/publication-series/state-of-global-climate/state-of-global-climate-2024 (accessed on 1 March 2026).
  2. Food and Agriculture Organization of the United Nations. With Major Processing by Our World in Data. 2025. Available online: https://ourworldindata.org/grapher/sugar-cane-production?tab=line&time=earliest..2023&country=IND~CHN~THA~PAK~OWID_WRL~BRA&mapSelect=IND~CHN~THA~PAK~OWID_WRL~BRA&tableFilter=countries (accessed on 1 March 2026).
  3. Ungureanu, N.; Vlăduț, V.; Biriș, S.Ș. Sustainable valorization of waste and by-products from sugarcane processing. Sustainability 2022, 14, 11089. [Google Scholar] [CrossRef]
  4. Garcia Tavares, R.; Lakshmanan, P.; Peiter, E.; O’Connell, A.; Caldana, C.; Vicentini, R.; Menossi, M. ScGAI is a key regulator of culm development in sugarcane. J. Exp. Bot. 2018, 69, 3823–3837. [Google Scholar] [CrossRef] [PubMed]
  5. Cerqueira, D.A.; Rodrigues Filho, G.; da Silva Meireles, C. Optimization of sugarcane bagasse cellulose acetylation. Carbohydr. Polym. 2007, 69, 579–582. [Google Scholar] [CrossRef]
  6. Hofsetz, K.; Silva, M.A. Brazilian sugarcane bagasse: Energy and non-energy consumption. Biomass Bioenergy 2012, 46, 564–573. [Google Scholar] [CrossRef]
  7. Matsueda, Y.; Antunes, E. A review of current technologies for the sustainable valorisation of sugarcane bagasse. J. Environ. Chem. Eng. 2024, 12, 114900. [Google Scholar] [CrossRef]
  8. Sarker, T.C.; Azam, S.M.G.G.; Bonanomi, G. Recent advances in sugarcane industry solid by-products valorization. Waste Biomass Valorization 2017, 8, 241–266. [Google Scholar]
  9. Meghana, M.; Shastri, Y. Sustainable valorization of sugar industry waste: Status, opportunities, and challenges. Bioresour. Technol. 2020, 303, 122929. [Google Scholar] [CrossRef] [PubMed]
  10. Kumar, A.; Kumar, V.; Singh, B. Cellulosic and hemicellulosic fractions of sugarcane bagasse: Potential, challenges and future perspective. Int. J. Biol. Macromol. 2021, 169, 564–582. [Google Scholar] [CrossRef]
  11. Lin, L.; Yao, Y.; Yoshioka, M.; Shiraishi, N. Liquefaction mechanism of cellulose in the presence of phenol under acid catalysis. Carbohydr. Polym. 2004, 57, 123–129. [Google Scholar] [CrossRef]
  12. Yamada, T.; Aratani, M.; Kubo, S.; Ono, H. Chemical analysis of the product in acid-catalyzed solvolysis of cellulose using polyethylene glycol and ethylene carbonate. J. Wood Sci. 2007, 53, 487–493. [Google Scholar] [CrossRef]
  13. Zou, X.; Qin, T.; Huang, L.; Zhang, X.; Yang, Z.; Wang, Y. Mechanisms and main regularities of biomass liquefaction with alcoholic solvents. Energy Fuels 2009, 23, 5213–5218. [Google Scholar] [CrossRef]
  14. Bontaş, M.G.; Diacon, A.; Călinescu, I.; Rusen, E. Lignocellulose biomass liquefaction: Process and applications development as polyurethane foams. Polymers 2023, 15, 563. [Google Scholar] [CrossRef] [PubMed]
  15. Wang, Q.; Tuohedi, N. Polyurethane foams and bio-polyols from liquefied cotton stalk agricultural waste. Sustainability 2020, 12, 4214. [Google Scholar] [CrossRef]
  16. Masuda, G.; Akuta, S.; Wang, W.; Suzuki, M.; Honda, Y.; Wang, Q. Study on Fast Liquefaction and Characterization of Produced Polyurethane Foam Materials from Moso Bamboo. Materials 2024, 17, 3751. [Google Scholar] [CrossRef] [PubMed]
  17. Tuohedi, N.; Wang, Q. Preparation and evaluation of epoxy resin prepared from the liquefied product of cotton stalk. Processes 2021, 9, 1417. [Google Scholar] [CrossRef]
  18. Masuda, G.; Enyoh, C.E.; Wang, W.; Anzai, S.; Wang, Q. Ozone Nanobubble-Assisted Pretreatment of Lignocellulose: Enhancing Wood Liquefaction and Bio-Polyurea Development. Appl. Sci. 2025, 15, 4618. [Google Scholar] [CrossRef]
  19. Seddiqi, H.; Oliaei, E.; Honarkar, H.; Jin, J.; Geonzon, L.C.; Bacabac, R.G.; Klein-Nulend, J. Cellulose and its derivatives: Towards biomedical applications. Cellulose 2021, 28, 1893–1931. [Google Scholar] [CrossRef]
  20. Rao, J.; Lv, Z.; Chen, G.; Peng, F. Hemicellulose: Structure, chemical modification, and application. Prog. Polym. Sci. 2023, 140, 101675. [Google Scholar] [CrossRef]
  21. Liao, J.J.; Abd Latif, N.H.; Trache, D.; Brosse, N.; Hussin, M.H. Current advancement on the isolation, characterization and application of lignin. Int. J. Biol. Macromol. 2020, 162, 985–1024. [Google Scholar] [CrossRef] [PubMed]
  22. Yu, X.; Sun, X.; Dong, J.; Wu, L.; Guo, W.; Wang, Y.; Zhang, M. Instant catapult steam explosion pretreatment of wheat straw liquefied polyols to prolong the slow-release longevity of bio-based polyurethane-coated fertilizers. Chem. Eng. J. 2022, 435, 134985. [Google Scholar] [CrossRef]
  23. Lv, S.; Lin, X.; Gao, Z.; Hou, X.; Zhou, H.; Sun, J. Phenol liquefaction of waste sawdust pretreated by sodium hydroxide: Optimization of parameters using response surface methodology. Molecules 2022, 27, 7880. [Google Scholar] [CrossRef] [PubMed]
  24. Wu, C.; Qiu, G.; Shentu, B.; Jin, Y. Effect of N-methylmorpholine-N-oxide (NMMO) pretreatment on liquefaction behavior of cornstalk. Biomass Convers. Biorefinery 2024, 14, 27407–27417. [Google Scholar]
  25. Jovičić, N.; Krička, T.; Antonović, A.; Matin, B.; Pezo, L.; Brandić, I.; Matin, A. Toward sustainable bioproducts from lignocellulosic biomass: Influence of chemical pretreatments on liquefied walnut shells. Open Agric. 2025, 10, 20220382. [Google Scholar] [CrossRef]
  26. ISO 20480-1:2017; Fine Bubble Technology—General Principles for Usage and Measurement of Fine Bubbles—Part 1: Terminology. International Organization for Standardization: Geneva, Switzerland, 2017. Available online: https://www.iso.org/standard/68187.html (accessed on 1 March 2026).
  27. Ulatowski, K.; Sobieszuk, P.; Mróz, A.; Ciach, T. Stability of nanobubbles generated in water using porous membrane system. Chem. Eng. Process.-Process Intensif. 2019, 136, 62–71. [Google Scholar] [CrossRef]
  28. Nirmalkar, N.; Pacek, A.W.; Barigou, M. On the existence and stability of bulk nanobubbles. Langmuir 2018, 34, 10964–10973. [Google Scholar] [CrossRef] [PubMed]
  29. Nirmalkar, N.; Pacek, A.W.; Barigou, M. Bulk nanobubbles from acoustically cavitated aqueous organic solvent mixtures. Langmuir 2019, 35, 2188–2195. [Google Scholar] [CrossRef] [PubMed]
  30. Zhou, Y.; Han, Z.; He, C.; Feng, Q.; Wang, K.; Wang, Y.; Fujita, T. Long-term stability of different kinds of gas nanobubbles in deionized and salt water. Materials 2021, 14, 1808. [Google Scholar] [CrossRef] [PubMed]
  31. Jia, M.; Farid, M.U.; Kharraz, J.A.; Kumar, N.M.; Chopra, S.S.; Jang, A.; An, A.K. Nanobubbles in water and wastewater treatment systems: Small bubbles making big difference. Water Res. 2023, 245, 120613. [Google Scholar] [CrossRef] [PubMed]
  32. Hansen, H.H.; Cha, H.; Ouyang, L.; Zhang, J.; Jin, B.; Stratton, H.; An, H. Nanobubble technologies: Applications in therapy from molecular to cellular level. Biotechnol. Adv. 2023, 63, 108091. [Google Scholar] [CrossRef] [PubMed]
  33. Arablousabet, Y.; Povilaitis, A. The Impact of Nanobubble Gases in Enhancing Soil Moisture, Nutrient Uptake Efficiency and Plant Growth: A Review. Water 2024, 16, 3074. [Google Scholar] [CrossRef]
  34. Wang, X.; Yuan, T.; Guo, Z.; Han, H.; Lei, Z.; Shimizu, K.; Lee, D.J. Enhanced hydrolysis and acidification of cellulose at high loading for methane production via anaerobic digestion supplemented with high mobility nanobubble water. Bioresour. Technol. 2020, 297, 122499. [Google Scholar] [CrossRef] [PubMed]
  35. Wang, X.; Yuan, T.; Lei, Z.; Kobayashi, M.; Adachi, Y.; Shimizu, K.; Zhang, Z. Supplementation of O2-containing gas nanobubble water to enhance methane production from anaerobic digestion of cellulose. Chem. Eng. J. 2020, 398, 125652. [Google Scholar] [CrossRef]
  36. Yang, X.; Nie, J.; Wei, Y.; Zhao, Z.; Shimizu, K.; Lei, Z.; Zhang, Z. Simultaneous enhancement on lignin degradation and methane production from anaerobic co-digestion of waste activated sludge and alkaline lignin supplemented with N2-nanobubble water. Bioresour. Technol. Rep. 2020, 11, 100470. [Google Scholar] [CrossRef]
  37. Ho, T.H.; Yang, X.; Nie, J.; Zhao, Z.; Wei, Y.; Shimizu, K.; Lei, Z. Effect of nanobubble water on anaerobic methane production from lignin. Res. Chem. Intermed. 2020, 46, 4767–4780. [Google Scholar] [CrossRef]
  38. He, C.; Song, H.; Liu, L.; Li, P.; Awasthi, M.K.; Xu, G.; Yang, Y. Enhancement of methane production by anaerobic digestion of corn straw with hydrogen-nanobubble water. Bioresour. Technol. 2022, 344, 126220. [Google Scholar] [CrossRef] [PubMed]
  39. Wang, E.; Sun, H.; Chen, P.; Zheng, Y.; Guo, J.; Dong, R. Two-step anaerobic digestion of rice straw with nanobubble water. Bioresour. Technol. 2023, 376, 128928. [Google Scholar] [CrossRef] [PubMed]
  40. Zhu, Y.; Lyu, T.; Li, D.; Zhang, Z.; Guo, J.; Li, X.; Wang, S. Process mechanisms of nanobubble technology enhanced hydrolytic acidification of anaerobic digestion of lignocellulosic biomass. Chem. Eng. J. 2024, 480, 147956. [Google Scholar] [CrossRef]
  41. About Anzaikanyetsu’s Nanobubble Generator. Available online: https://anzaimcs.com/main/nanobubble.html (accessed on 1 March 2026).
  42. Wang, Q.; Kawamura, S. Decayed woody material from mushroom cultivation: Characterization of liquefaction. WIT Trans. Ecol. Environ. 2018, 217, 481–492. [Google Scholar] [CrossRef]
  43. Sunardi Istikowati, W.T.; Sari, D.I. Extraction of α-cellulose from eleocharis dulcis holocellulose using NaOH and KOH. J. Phys. Conf. Ser. 2019, 1397, 012031. [Google Scholar] [CrossRef]
  44. Nelson, M.L.; O’Connor, R.T. Relation of certain infrared bands to cellulose crystallinity and crystal lattice type. Part II. A new infrared ratio for estimation of crystallinity in celluloses I and II. J. Appl. Polym. Sci. 1964, 8, 1325–1341. [Google Scholar] [CrossRef]
  45. Friedman, H.L. Kinetics of thermal degradation of char-forming plastics from thermogravimetry. Application to a phenolic plastic. J. Polym. Sci. Part C Polym. Symp. 1964, 6, 183–195. [Google Scholar]
  46. Starink, M.J. The determination of activation energy from linear heating rate experiments: A comparison of the accuracy of isoconversion methods. Thermochim. Acta 2003, 404, 163–176. [Google Scholar] [CrossRef]
  47. Vyazovkin, S.; Burnham, A.K.; Criado, J.M.; Pérez-Maqueda, L.A.; Popescu, C.; Sbirrazzuoli, N. ICTAC Kinetics Committee recommendations for performing kinetic computations on thermal analysis data. Thermochim. Acta 2011, 520, 1–19. [Google Scholar] [CrossRef]
  48. Acemioglu, B.; Alma, M.H. Kinetics of wood phenolysis in the presence of HCl as catalyst. J. Appl. Polym. Sci. 2002, 85, 1098–1103. [Google Scholar] [CrossRef]
  49. Alma, M.H.; Acemioglu, B. A kinetic study of sulfuric acid-catalyzed liquefaction of wood into phenol. Chem. Eng. Commun. 2004, 191, 968–980. [Google Scholar] [CrossRef]
  50. Yan, Y.; Hu, M.; Wang, Z. Kinetic study on the liquefaction of cornstalk in polyhydric alcohols. Ind. Crops Prod. 2010, 32, 349–352. [Google Scholar] [CrossRef]
  51. Zhang, H.; Yang, H.; Guo, H.; Huang, C.; Xiong, L.; Chen, X. Kinetic study on the liquefaction of wood and its three cell wall component in polyhydric alcohols. Appl. Energy 2014, 113, 1596–1600. [Google Scholar] [CrossRef]
  52. Guo, H.; Bian, K.; Cai, H.; Zhang, H.; Li, H.; Chen, X.; Chen, X. Investigation on the liquefaction performances, mechanism and kinetics of wheat straw in different solvents. Waste Biomass Valorization 2024, 15, 1519–1531. [Google Scholar]
  53. El-barbary, M.H.; Shukry, N. Polyhydric alcohol liquefaction of some lignocellulosic agricultural ratios. Ind. Crops Prod. 2008, 27, 33–38. [Google Scholar] [CrossRef]
  54. Wang, T.; Yang, C.; Sun, P.; Wang, M.; Lin, F.; Fiallos, M.; Khu, S.T. Generation mechanism of hydroxyl free radicals in micro–nanobubbles water and its prospect in drinking water. Processes 2024, 12, 683. [Google Scholar] [CrossRef]
  55. Fujita, T.; Kurokawa, H.; Han, Z.; Zhou, Y.; Matsui, H.; Ponou, J.; Wei, Y. Free radical degradation in aqueous solution by blowing hydrogen and carbon dioxide nanobubbles. Sci. Rep. 2021, 11, 3068. [Google Scholar] [CrossRef] [PubMed]
  56. Yang, H.; Yan, R.; Chen, H.; Zheng, C.; Lee, D.H.; Liang, D.T. In-depth investigation of biomass pyrolysis based on three major components: Hemicellulose, cellulose and lignin. Energy Fuels 2006, 20, 388–393. [Google Scholar]
  57. Ma, Z.; Chen, D.; Gu, J.; Bao, B.; Zhang, Q. Determination of pyrolysis characteristics and kinetics of palm kernel shell using TGA–FTIR and model-free integral methods. Energy Convers. Manag. 2015, 89, 251–259. [Google Scholar] [CrossRef]
  58. Torres-García, E.; Ramírez-Verduzco, L.F.; Aburto, J. Pyrolytic degradation of peanut shell: Activation energy dependence on the conversion. Waste Manag. 2020, 106, 203–212. [Google Scholar] [CrossRef] [PubMed]
  59. Chen, F.; Lu, Z. Liquefaction of wheat straw and preparation of rigid polyurethane foam from the liquefaction products. J. Appl. Polym. Sci. 2009, 111, 508–516. [Google Scholar]
  60. Hu, S.; Luo, X.; Li, Y. Polyols and polyurethanes from the liquefaction of lignocellulosic biomass. ChemSusChem 2014, 7, 66–72. [Google Scholar] [PubMed]
  61. Zhang, H.; Pang, H.; Shi, J.; Fu, T.; Liao, B. Investigation of liquefied wood residues based on cellulose, hemicellulose, and lignin. J. Appl. Polym. Sci. 2012, 123, 850–856. [Google Scholar]
  62. Yan, Y.; Pang, H.; Yang, X.; Zhang, R.; Liao, B. Preparation and characterization of water-blown polyurethane foams from liquefied cornstalk polyol. J. Appl. Polym. Sci. 2008, 110, 1099–1111. [Google Scholar] [CrossRef]
  63. Lee, S.H.; Yoshioka, M.; Shiraishi, N. Liquefaction of corn bran (CB) in the presence of alcohols and preparation of polyurethane foam from its liquefied polyol. J. Appl. Polym. Sci. 2000, 78, 319–325. [Google Scholar] [CrossRef]
  64. Chen, W.; Zhang, Q.; Lin, X.; Jiang, K.; Han, D. The degradation and repolymerization analysis on solvolysis liquefaction of corn stalk. Polymers 2020, 12, 2337. [Google Scholar] [CrossRef] [PubMed]
Figure 1. Exterior view of the nanobubble water pretreatment system.
Physchem 06 00045 g001
Figure 2. Configuration of the nanobubble water pretreatment system.
Physchem 06 00045 g002
Scheme 1. Speculation on the cause of reduced cellulose and lignin content due to nanobubble water pretreatment.
Physchem 06 00045 sch001
Figure 3. Changes in TG curves (a) and DTG curves (b) of bagasse meal after nanobubble water pretreatment.
Physchem 06 00045 g003
Figure 4. Changes in activation energy for bagasse meal at different conversion rates. (a) Friedman method; (b) Starink method.
Physchem 06 00045 g004
Figure 5. Change in apparent activation energy (Ea′) of bagasse meal due to nanobubble water pretreatment.
Physchem 06 00045 g005
Figure 6. Changes in residue content of bagasse meal over time following carbon dioxide nanobubble water pretreatment (Error bars indicate the standard error).
Physchem 06 00045 g006
Figure 7. Relation between (a) liquefaction reaction rate and liquefaction residue content (α); (b) 1/α2.41 and liquefaction time.
Physchem 06 00045 g007
Figure 8. Changes in molecular weight of bagasse liquefaction products following carbon dioxide nanobubble water pretreatment; Ratio of (a) number-average molecular weight (Mn), (b) weight-average molecular weight (Mw), and (c) polydispersity (Mw/Mn). * Molecular weight of bagasse meal liquefaction products pretreated with carbon dioxide nanobubble water/Molecular weight of untreated (control group) bagasse meal liquefaction products.
Physchem 06 00045 g008
Figure 9. Change in hydroxyl value of 120-min liquefaction products of bagasse meal treated with carbon dioxide nanobubble water pretreatment (Error bars indicate the standard error).
Physchem 06 00045 g009
Figure 10. Changes in the FT-IR spectrum of the 120-min liquefaction product (LP) of bagasse meal (BM) using carbon dioxide nanobubble water.
Physchem 06 00045 g010
Figure 11. Changes in the TG curve (a) and the DTG curve (b) of the 120-min liquefied residue from bagasse meal pretreated with carbon dioxide nanobubble water.
Physchem 06 00045 g011
Table 1. Changes in component composition ratios of bagasse meal due to nanobubble water pretreatment (Error bars indicate the standard error).
ConditionCellulose (%)Hemicellulose (%)Lignin (%)Soluble Organic Fraction (%)
Control45.8 ± 0.0933.4 ± 0.6022.2 ± 0.101.67 ± 0.04
O2NBW44.4 ± 0.7935.4 ± 0.6721.2 ± 0.022.47 ± 0.91
N2NBW44.9 ± 0.4335.2 ± 0.2521.9 ± 0.111.76 ± 0.04
CO2NBW44.9 ± 0.3035.5 ± 0.0321.2 ± 0.112.10 ± 0.02
Table 2. Changes in crystallinity, total crystallinity index (TCI), and lateral order index (LOI) of bagasse meal after nanobubble water pretreatment.
ConditionCrystallinity (%)Total Crystallinity Index (TCI; A1370/A2900)Lateral Order Index (LOI; A1423/A897)
Control29.51.030.590
O2NBW33.00.8970.647
N2NBW31.20.9190.631
CO2NBW32.30.9590.618
Table 3. Changes in 5%, 10%, and 50% weight reduction temperature (T5%, T10%, and T50%) and maximum peak temperature (Tmax) of bagasse meal due to nanobubble water pretreatment.
ConditionT5% (°C)T10% (°C)T50% (°C)Tmax (°C)
Control253268330335(334.9)
O2NBW249264329333(333.3)
N2NBW249264328333(332.7)
CO2NBW249264327331(331.3)
Table 4. Statistical evaluation of apparent activation energy (Ea′) obtained from Starink and Friedman methods within the conversion range α = 0.1–0.7.
Kinetic MethodConditionMean Ea
(kJ mol−1)
SD
(kJ mol−1)
95% CI
(kJ mol−1)
Ea′ Reduction vs. Control (%)
FriedmanControl164.289.58159.07–169.49
O2NBW161.219.26156.18–166.241.87
N2NBW161.119.59155.89–166.321.93
CO2NBW160.899.49155.73–166.052.06
StarinkControl160.6410.95154.03–167.26
O2NBW156.8411.57149.85–163.832.37
N2NBW156.4511.45149.53–163.372.61
CO2NBW156.2011.37149.33–163.072.76
Table 5. Changes in left and right maximum peak temperatures (Tmax1, Tmax2) and final weight of 120-min liquefied residue from bagasse meal pretreated with carbon dioxide nanobubble water.
ConditionTmax1 (°C)Tmax2 (°C)Final Weight (%)
Control249(249.3)357(356.7)32.7
CO2NBW248(247.6)356(356.3)33.5
Disclaimer/Publisher’s Note: The statements, opinions and data contained in all publications are solely those of the individual author(s) and contributor(s) and not of MDPI and/or the editor(s). MDPI and/or the editor(s) disclaim responsibility for any injury to people or property resulting from any ideas, methods, instructions or products referred to in the content.