Article

Stand Structure, Carbon Pools, and Biodiversity Relationships in Temperate Forests of Southern Quebec, Canada: A Multi-Taxon Analysis


1
Data Science Laboratory, Université TÉLUQ, 5800 rue Saint-Denis, Montréal, QC H2S 3L5, Canada
2
Independent Researcher, Montreal, QC, Canada
*
Author to whom correspondence should be addressed.
Conservation 2026, 6(1), 26; https://doi.org/10.3390/conservation6010026
Submission received: 24 December 2025 / Revised: 21 January 2026 / Accepted: 4 February 2026 / Published: 26 February 2026

Abstract

Reconciling carbon (C) sequestration with biodiversity conservation remains a key challenge for sustainable forest management, as C–biodiversity relationships vary across taxa and contexts. We evaluated how botanical composition, forest structure, C pools, and land use predict species richness of insects, birds, and bats across mature temperate forests in southern Québec, Canada. Generalized linear models were fitted for insects and birds, while bat data were analyzed descriptively due to low and uneven richness. Botanical composition and forest structure were the most consistent predictors across groups. Insects responded strongly to vegetation structure and C allocation, with richness decreasing with shrub density and mineral soil C but increasing with the soil:above-ground C ratio and distance from infrastructure. Bird richness increased with herbaceous cover and wetland area, emphasizing the value of open and moist habitats. Across taxa, C pools acted as secondary but complementary predictors. Based on observational analyses, our results show that C–biodiversity relationships are compartment-specific and taxon-sensitive, and suggest that maintaining structural complexity, diverse vegetation strata, wetland habitats, and soil C pools may help align biodiversity conservation with C sequestration objectives in temperate forests.

1. Introduction

Preserving biodiversity and mitigating climate change are two major ecological challenges, and forests play a dual role as both biodiversity reservoirs and carbon (C) sinks [1,2]. Quantifying forest C pools is therefore critical not only for evaluating the sequestration potential of forest ecosystems, but also for understanding how C storage relates to species richness across multiple taxonomic groups [3]. Because forest C pools covary with fundamental attributes of ecosystem structure such as vegetation maturity, vertical complexity, and biomass, they can provide integrative information on habitat conditions and the availability of ecological niches [4,5]. In this sense, C pools may serve as useful proxies for environmental features that shape species richness patterns, particularly in structurally complex forest ecosystems.
Understanding biodiversity–C relationships, however, requires considering multiple complementary dimensions of forest ecosystems. Botanical composition provides insight into resource availability, plant functional traits, and trophic pathways, whereas land cover and land-use patterns reflect anthropogenic pressures, habitat configuration, and landscape connectivity [6,7]. Together, these variables capture important drivers of species distributions at different spatial scales. Nevertheless, both botanical and land-use variables often exert effects that are taxon-specific or scale-dependent, limiting their generalizability across taxa and landscapes [8,9]. Integrating these dimensions with C pool assessments therefore offers a more holistic framework for identifying the main determinants of species richness diversity in heterogeneous forested landscapes.
At broad spatial extents, many global studies have generally reported positive relationships between forest C pools and species richness, particularly in relatively intact and mature forest ecosystems [10,11]. These findings have often been interpreted as evidence that C-rich forests provide favorable conditions for diverse biological communities. However, such relationships often weaken, vary in direction, or become highly context-dependent at regional scales, where forest ecosystems are shaped by a combination of stand development, management legacies, soil properties, and landscape configuration [4,12]. At these finer scales, human influences, including land-use change, habitat fragmentation, infrastructure development, and historical forest management, can substantially modify habitat structure, resource availability, and species distributions [6,13].
As a result, C pools are unlikely to act as universal drivers of biodiversity at regional scales. Rather, they tend to reflect underlying structural, edaphic, and moisture-related conditions that differentially influence species richness across taxonomic groups. Empirical work has shown that both the strength and the direction of biodiversity–C relationships depend strongly on the taxa considered and on the specific C compartments examined [14,15]. In forest ecosystems, above-ground and soil C stocks often covary with stand structure, forest age, soil properties and development, and land-use history, which together shape habitat complexity and niche availability for different organism groups [16]. In some cases, local trade-offs emerge, such as reduced understory diversity in high biomass stands [17]. Consequently, observed correlations between C pools and biodiversity are more likely to arise from indirect associations mediated by shared environmental gradients than from direct causal effects of C storage per se. A recent synthesis study further supports this interpretation by showing that biodiversity–C relationships vary across dimensions of biodiversity and C compartments, reinforcing their context-dependent nature [18]. Such nuances underscore the importance of fine-scale, regionally grounded studies to inform effective and locally adapted conservation strategies.
In this study, we hypothesized that, within the studied regional context, variation in forest C pools explains species richness patterns across taxonomic groups (i.e., insects, birds, and bats) after accounting for botanical composition and forest structure as well as land-use characteristics. This hypothesis is based on the premise that C pools integrate key structural and edaphic attributes of forest ecosystems (e.g., vegetation maturity, vertical stratification, and biomass) that underpin habitat complexity and the availability of ecological niches [14,15]. While botanical composition and forest structure provide detailed information on plant diversity and functional traits, and land use reflects spatial occupation and anthropogenic pressure, these variables are often expected to exert more localized or taxon-specific effects [19,20]. In contrast, C pools may function as integrative ecological proxies that capture multiple dimensions of habitat quality relevant across trophic levels. Our objectives were therefore to (i) quantify forest ecosystem C pools in a region of southern Quebec, Canada, and (ii) test the proposed hypothesis by simultaneously integrating C pools, botanical composition, forest structure, and landscape characteristics at the regional scale, a scale commonly used for sustainable development and conservation planning. By explicitly accounting for regional ecological contingencies, this approach aims to clarify how C storage relates to biodiversity patterns across taxa and to identify potential synergies and limits between C sequestration and biodiversity conservation in mature forest landscapes.

2. Materials and Methods

2.1. Study Sites and Plots

We examined the relationship between C pools, forest botanical composition and forest structure, and land use as predictors of species richness for three taxonomic groups (i.e., insects, birds, and bats) across 10 protected forest sites of the Lanaudière Ecosystem Conservation Trust (Fiducie de conservation des écosystèmes de Lanaudière; FICEL) in the northeast region of Montréal, Québec, Canada (Figure 1). The protected forest sites encompass mature and old-growth stands dominated by maple spp. (>80 years), birch spp. (40–80 years), and balsam fir (>60 years) established on organic to mineral soils. The selected taxonomic groups serve as widely used indicators of forest ecosystem integrity and ecological quality. Insects contribute to pollination, decomposition, and nutrient cycling [21], birds regulate insect populations and disperse seeds [22], and bats represent a functionally important group in temperate forest ecosystems through nocturnal insect predation and their sensitivity to forest structure and landscape configuration. In this study, bats were not intended to represent mammalian biodiversity as a whole, but rather to provide complementary information on habitat use by a mobile, nocturnal insectivorous taxon [23,24,25]. Together, these groups capture key trophic functions whose variation can reflect ecosystem health. As a whole, the study sites encompassed a total of 33 sampling plots of 400 m2 (radius = 11.28 m) in which C and bird surveys were conducted. Insect and bat surveys were performed in 27 and 31 of these plots, respectively. These sample sizes reflect taxon-specific survey feasibility and logistical constraints, and were accounted for in all subsequent analyses.

2.2. Carbon Pools

Carbon pools were quantified in each plot during the summers of 2023 and 2024, following the protocol of Thiffault et al. [26]. All mature trees (diameter at breast height, dbh > 9 cm) were counted within each 400 m2 plot, with species identification, individual tree mapping, and measurement of dbh. Smaller trees (dbh < 9 cm) were surveyed in a 50 m2 subplot (radius = 3.99 m) using the same procedure. This diameter threshold corresponds to standard forest inventory protocols commonly used in forest ecosystems in Canada, including eastern temperate forests, and allows consistent characterization of stand structure, whereas subplots were selected to represent the dominant forest types within each plot. Coarse woody debris (diameter > 3 cm) were recorded along four 10 m transects radiating from the plot center, while fine woody debris (1.1–3 cm) were sampled along the 5–10 m segments of these same transects, noting size and decomposition class.
Above-ground biomass was estimated considering tree species and dbh using the R package allodb (version 0.0.1.9000) [27], which is designed for extratropical forests. The get_biomass() function automatically computes individual tree biomass from allometric equations that integrates dbh, genus, species, and spatial coordinates. Root biomass was estimated as a proportion of stem biomass, based on equations from [28]. Wood debris biomass was calculated following the National Forest Inventory of Canada [29] protocol. This approach involves determining the volume of woody of recorded debris, then calculating biomass using wood density coefficient (in kg cm−3) adjusted by decomposition class. For large debris, the relative proportion of hardwood and softwood trees per plot to derive a weighted density coefficient that reflects species composition.
Carbon concentrations in above-ground biomass, roots, and woody debris were estimated using conversion factors from Lamlom and Savidge [30]. Specifically, C concentrations in large trees (dbh > 9 cm) and woody debris were set at 48% (hardwoods) and 51% (conifers) of biomass, respectively, while roots and small trees (dbh < 9 cm) were assigned a C concentration of 50%.
Soil samples were taken at three locations per plot. In the first location, a 30 cm-deep pedon was excavated at the plot center, and a 20 cm × 20 cm template was used to collect plant litter (PL), fine woody debris (FWD), and forest floor layers, with their thickness recorded. Two horizontal cores were taken from each of the main two B horizons (four samples per pedon) using a 1.905 cm-diameter metal corer, noting their depth and Munsell color. A fifth vertical sample was extracted from the BC/C horizon (~50 cm depth) to represent deeper mineral soil. Two additional locations were sampled following a similar procedure, i.e., FWD, PL, and forest floor layers were collected using the template, but only the surface mineral soil was sampled vertically with the corer. Each additional location provided four samples (two forest floors and two mineral soils). Soil stoniness was visually assessed using the Munsell booklet schematics, and soil groups and forest floor types (i.e., mull, moder, and mor) were classified following the Canadian Soil Classification System [31].
Bulk density was determined from undisturbed soil cores. Samples were oven-dried (65 °C for 72 h) to obtain dry mass. Bulk density (g cm−3) was calculated as the ratio of dry mass to core volume. Subsamples were sieved (<2 mm) and ground (<60 μm) for C analysis by combustion (1040 °C, infrared detection with the EA1108 CHNS–O Analyzer, Carlo Erba Instruments/Thermo–Fisher, Milan, Italy). Soil C pools (Mg C ha−1) were then computed from C concentration, bulk density, soil depth, and stoniness corrections.

2.3. Insects, Birds, and Bats Inventories

Insect, bird, and bat surveys were conducted using taxon-specific standardized protocols that differed in timing and frequency among groups. Insects were sampled in 2019, birds in 2018 and 2023, and bats in 2024. Insects were sampled in summer using Luminoc® traps (Luminoc, Angers, France) following Hébert et al. [32], with three consecutive nights of trapping per plot. Specimens attracted by light fell into containers filled with a water (45%), vinegar (5%) and denatured ethyl alcohol (50%) solution. Captured insects were then preserved in 80% ethanol for identification. Due to logistical constraints, 27 of the 33 plots were sampled. Insect richness estimates reflect the subset of taxa effectively sampled by light traps and should be interpreted as a standardized, comparable index across plots rather than an exhaustive inventory of local insect diversity. Birds were surveyed using the point-count method [33,34] with 10 min listening periods and three concentric distance bands per plot (i.e., 0–30 m, 30–75 m, and 75+ m). Surveys occurred in May–June, with two consecutive days of sampling in each plot. Bats were recorded following Fabianek’s methodology [35]. We used Anabat Express detectors (Titley Scientific, Brendale, Australia) between June 19 and July 22. Recordings were conducted three times in each of the 31 plots, yielding 93 samplings in total. These different protocols were designed to maximize detection within each taxonomic group while ensuring comparability across plots within each dataset. Although sampling effort differed among taxa, survey designs were sufficient to capture relative differences in species richness among plots, even though observed richness represents only a subset of the regional species pool.

2.4. Vegetation Inventories and Characterization of Land Use

A detailed vegetation inventory was completed in a 10 m × 20 m quadrat within each plot during July and August 2023, describing species composition and cover for the tree (dbh > 9 cm), shrub, herbaceous, and bryophyte (muscine) strata. Standing dead trees and coarse woody debris were also recorded, along with decomposition stage [26]. Land use was mapped using Google Earth Pro (version 7.3.3) and L’Atlas des Basses-Terres du Saint-Laurent [36] within a 1 km radius around each plot, distinguishing mature forests, shrublands, wetlands (swamps, marshes, and bogs), water bodies and anthropogenic features (roads, agriculture, residential area, industries, and other infrastructures). Distance in meters to linear infrastructures (main, secondary, and tertiary roads, high-voltage powerlines, and all-terrain vehicle trails were measured for each plot.

2.5. Statistical Analysis

2.5.1. Horizon-Level Soil Carbon Pools Among Pedogenic Environments

We conducted one-way ANOVAs to test whether total C pools differed among the main three soil types (groups) observed in the field with distinct genetic pathways and C dynamics. These included poorly drained Gleysols, well-drained podzolized soils (i.e., Podzols and Eluviated Dystric Brunisols) and Brunisols (Sombric and Melanic) with Mull-type forest floors. The comparison was performed using the aov() function in the base stats package in R both for total C pools across the entire soil profile and separately for individual genetic horizons to capture vertical variation in C distribution. It provided an initial assessment of soil-type contrasts and informed the interpretation of C pool variation included in subsequent modeling steps. Regosols and organic soils were not included in the comparison due to n = 1 for each soil type.

2.5.2. Species Richness Models for Insects, Birds, and Bats

We used a multivariate modeling framework to examine the effects of forest botanical composition and forest structure, land use, and C pools on species richness for insects, birds, and bats (see predictor variables in Supplementary Material Table S1). Analyses were conducted separately for each taxonomic group to account for differences in sampling design, richness distributions, and ecological responses. All statistical analyses were performed in R (version 4.5.2) [37] using the ggplot2 (4.0.1) [38], MASS (7.3-65) [39], ggcorrplot (0.1.4.1) [40], car (version 3.1-3) [41], pedometrics (0.12.1) [42], pscl (1.5.9) [43], and dplyr (1.1.4) [44] packages.
Prior to modeling, we conducted a screening of explanatory variables within each predictor group (botanical composition and forest structure, land use, and C pools; Supplementary Material Table S2). Pearson correlation matrices were computed and visualized using correlograms. When pairs of predictors were highly correlated (r > 0.7), we retained the variable that was ecologically more interpretable or less redundant [45,46]. Multicollinearity among retained predictors was further assessed using variance inflation factors (VIF), and predictors with VIF values exceeding 3 were removed iteratively.
Species richness of insects and birds was analyzed using generalized linear models (GLMs) with a Poisson error distribution and fitted at the plot level. Given the limited number of protected sites and uneven numbers of plots per site, we did not explicitly model area-level random effects. For each fitted model, dispersion was evaluated using the Pearson χ2/df ratio and associated p values. For insect richness, there was no indication of overdispersion (χ2/df = 1.05, p = 0.40). A negative binomial model was additionally fitted as a diagnostic step to assess potential overdispersion. Dispersion estimates were close to zero and model coefficients were virtually identical to those obtained from Poisson models, further indicating negligible overdispersion. Accordingly, Poisson GLMs were retained for inference. For bird richness, dispersion diagnostics indicated no overdispersion (χ2/df = 0.61, p = 0.94), and Poisson GLMs were therefore considered appropriate. Model selection for insects and birds was conducted using stepwise backward selection based on Akaike’s Information Criterion (AIC) [47] to obtain the most parsimonious models. Model performance was evaluated using AIC and McFadden’s pseudo-R2.
Bat species richness was characterized by very low values and a strong predominance of zero counts across plots. Although zero-inflated or hurdle-type count models could in principle be considered for such data, the limited variation in richness and modest sample size would result in unstable and poorly parameterized models. Consequently, formal statistical modeling of bat richness was not pursued, and bat data were instead analyzed descriptively to provide ecological context and identify potential patterns for future investigation. Accordingly, cross-taxa comparisons are based only on insect and bird responses.
To identify predictors shared across taxa, we conducted a cross-taxa synthesis restricted to plots where both insects and birds were surveyed (n = 27). For each of these plots, we calculated a combined richness response as the sum of insect and bird species richness. We then fitted a Poisson GLM using the pooled set of predictors retained in the final insect and bird models, following the same collinearity screening, backward selection, and model evaluation procedures described above. This synthesis was intended to identify predictors consistently associated with richness across the two modeled taxa (insects and birds), and bats were not included due to sparse/zero-inflated richness.

3. Results

3.1. Variation in Carbon Pools Between Plots and Ecosystem Compartments

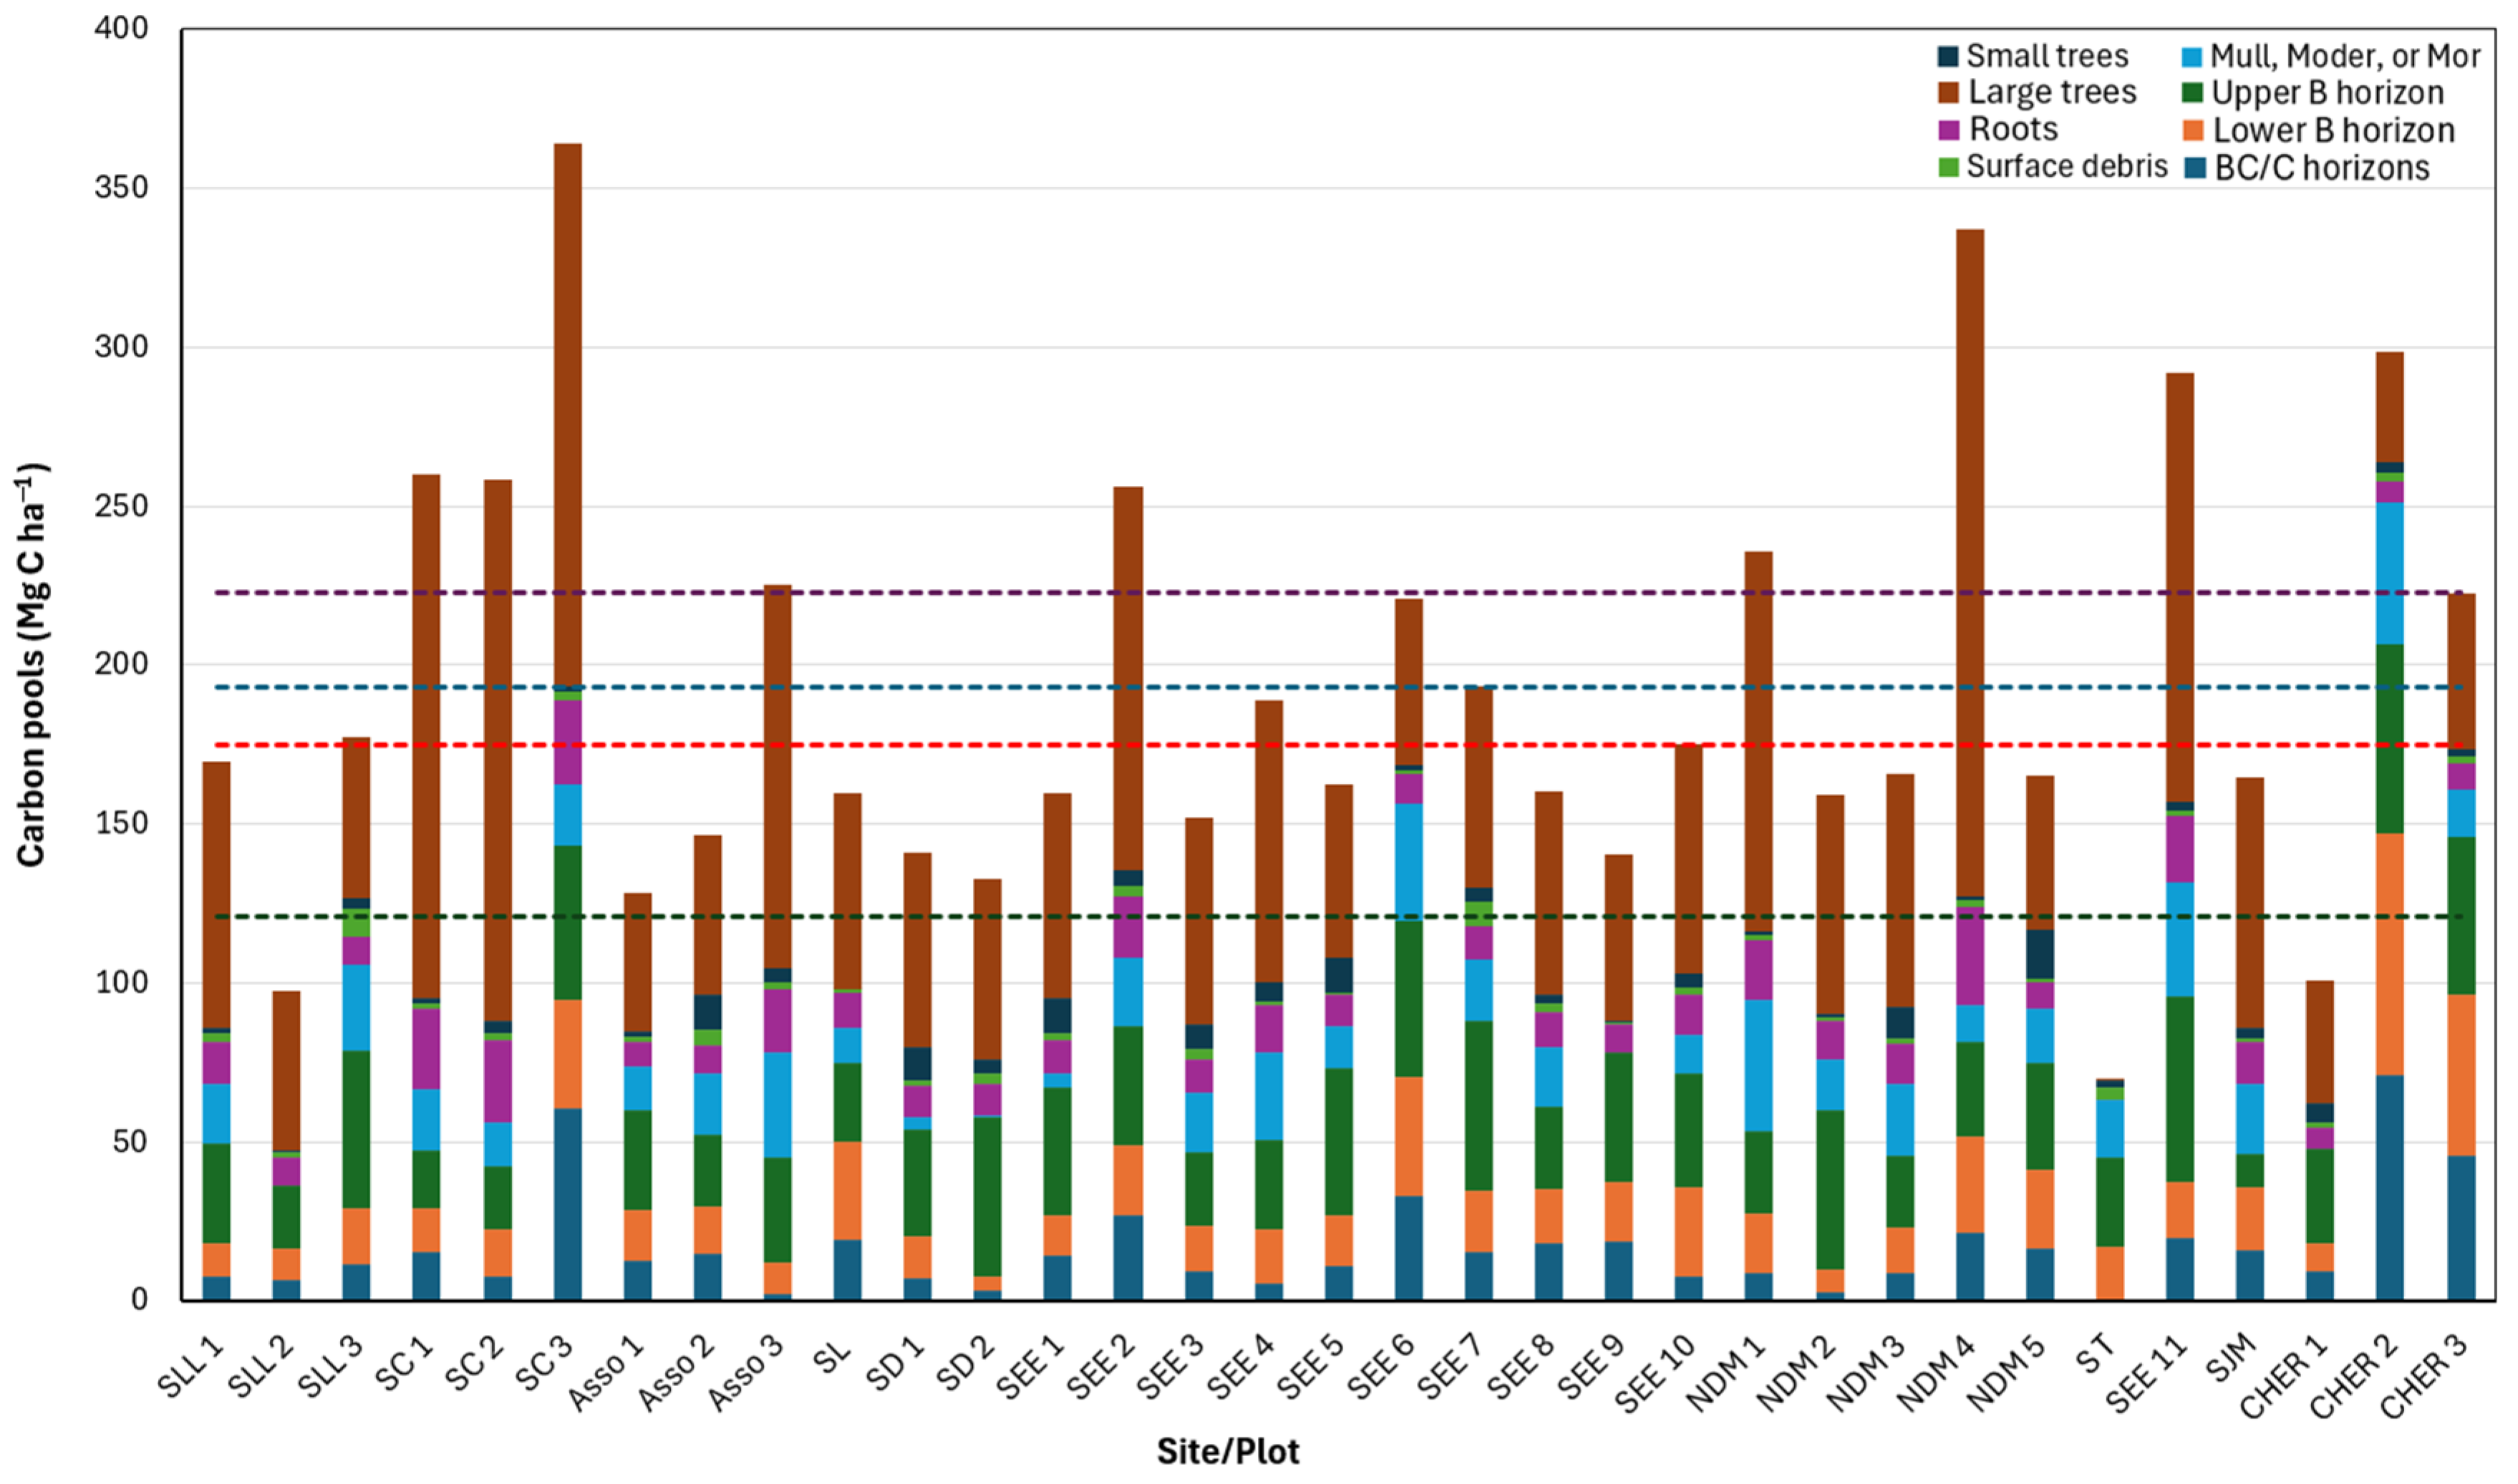
Large differences in total ecosystem C pools were observed among plots (Figure 2). Plots SC3 and NDM4 contained more than 300 Mg C ha−1, whereas SC1, SC2, SEE2, SEE11 and CHER2 ranged between 250 and 300 Mg C ha−1. Two plots, SLL2 and ST, had less than 100 Mg C ha−1. Plots SC1, SC2, and NDM4 were characterized by a high proportion of large tree C pools, exceeding 50% of total ecosystem C. Conversely, large tree C pools represented only <1%, 12% and 21% of total pools at ST, CHER2 and CHER3. Most other plots showed a more balanced distribution between above- and below-ground compartments. Belowground pools, governed mainly by soil C, followed by root C, generally accounted for 50–70% of total ecosystem C. Small trees and woody debris were minor components (<2%), although at some plots (e.g., ASSO2, MDM3, MDM5, SD1, SEE1, and SEE5), small trees contributed more than 5% of total ecosystem C (Figure 2; see Supplementary Material Table S3 for details on C pools by compartment).
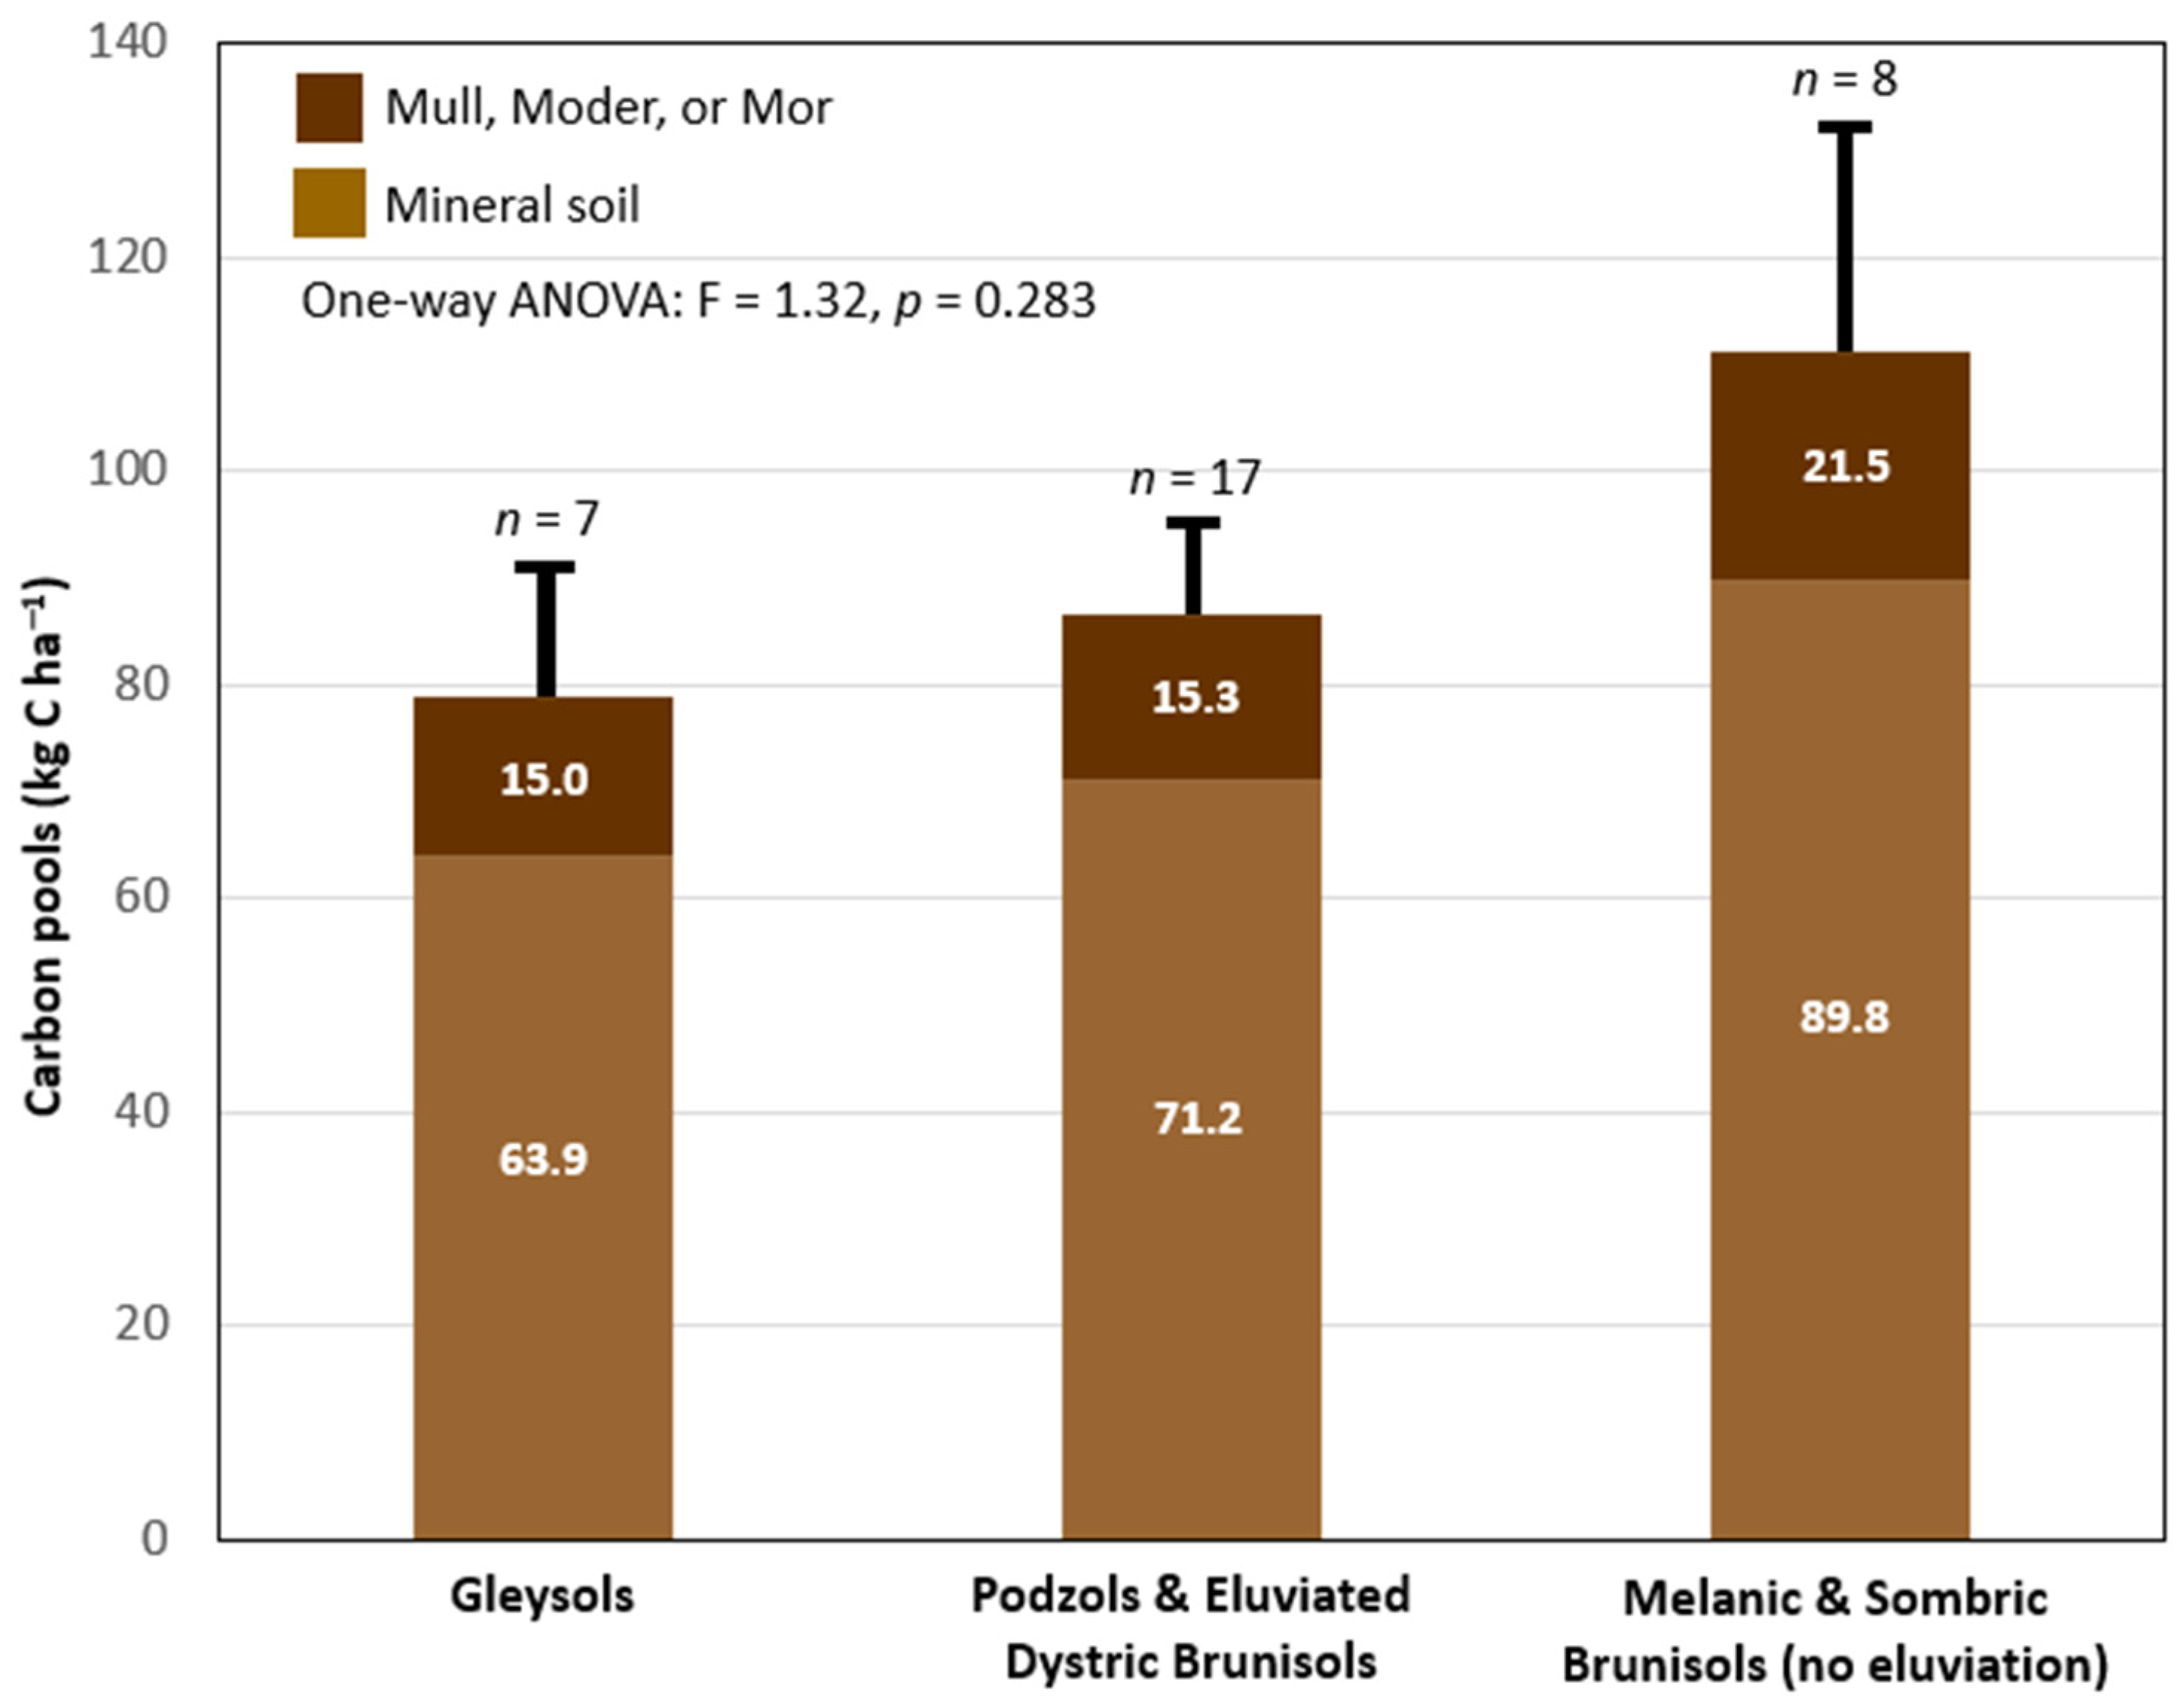
In addition to variation among sites/plots, differences in soil genesis were associated with modest but ecologically meaningful shifts in below-ground C pools (Figure 3). Although total soil C stocks did not differ significantly among the three soil types, Melanic and Sombric Brunisols tended to exhibit higher mean C pools than Podzols and Eluviated Dystric Brunisols or Gleysols. These differences among soil types were similar whether C pools were examined at the whole-profile scale or separately for individual horizons. The mineral soil horizons contributed to 80–82% of total C pools in all three soil groups, with organic surface horizons (i.e., mull, moder, and mor) contributing the rest (Figure 3).

3.2. Species Richness of Taxonomic Groups

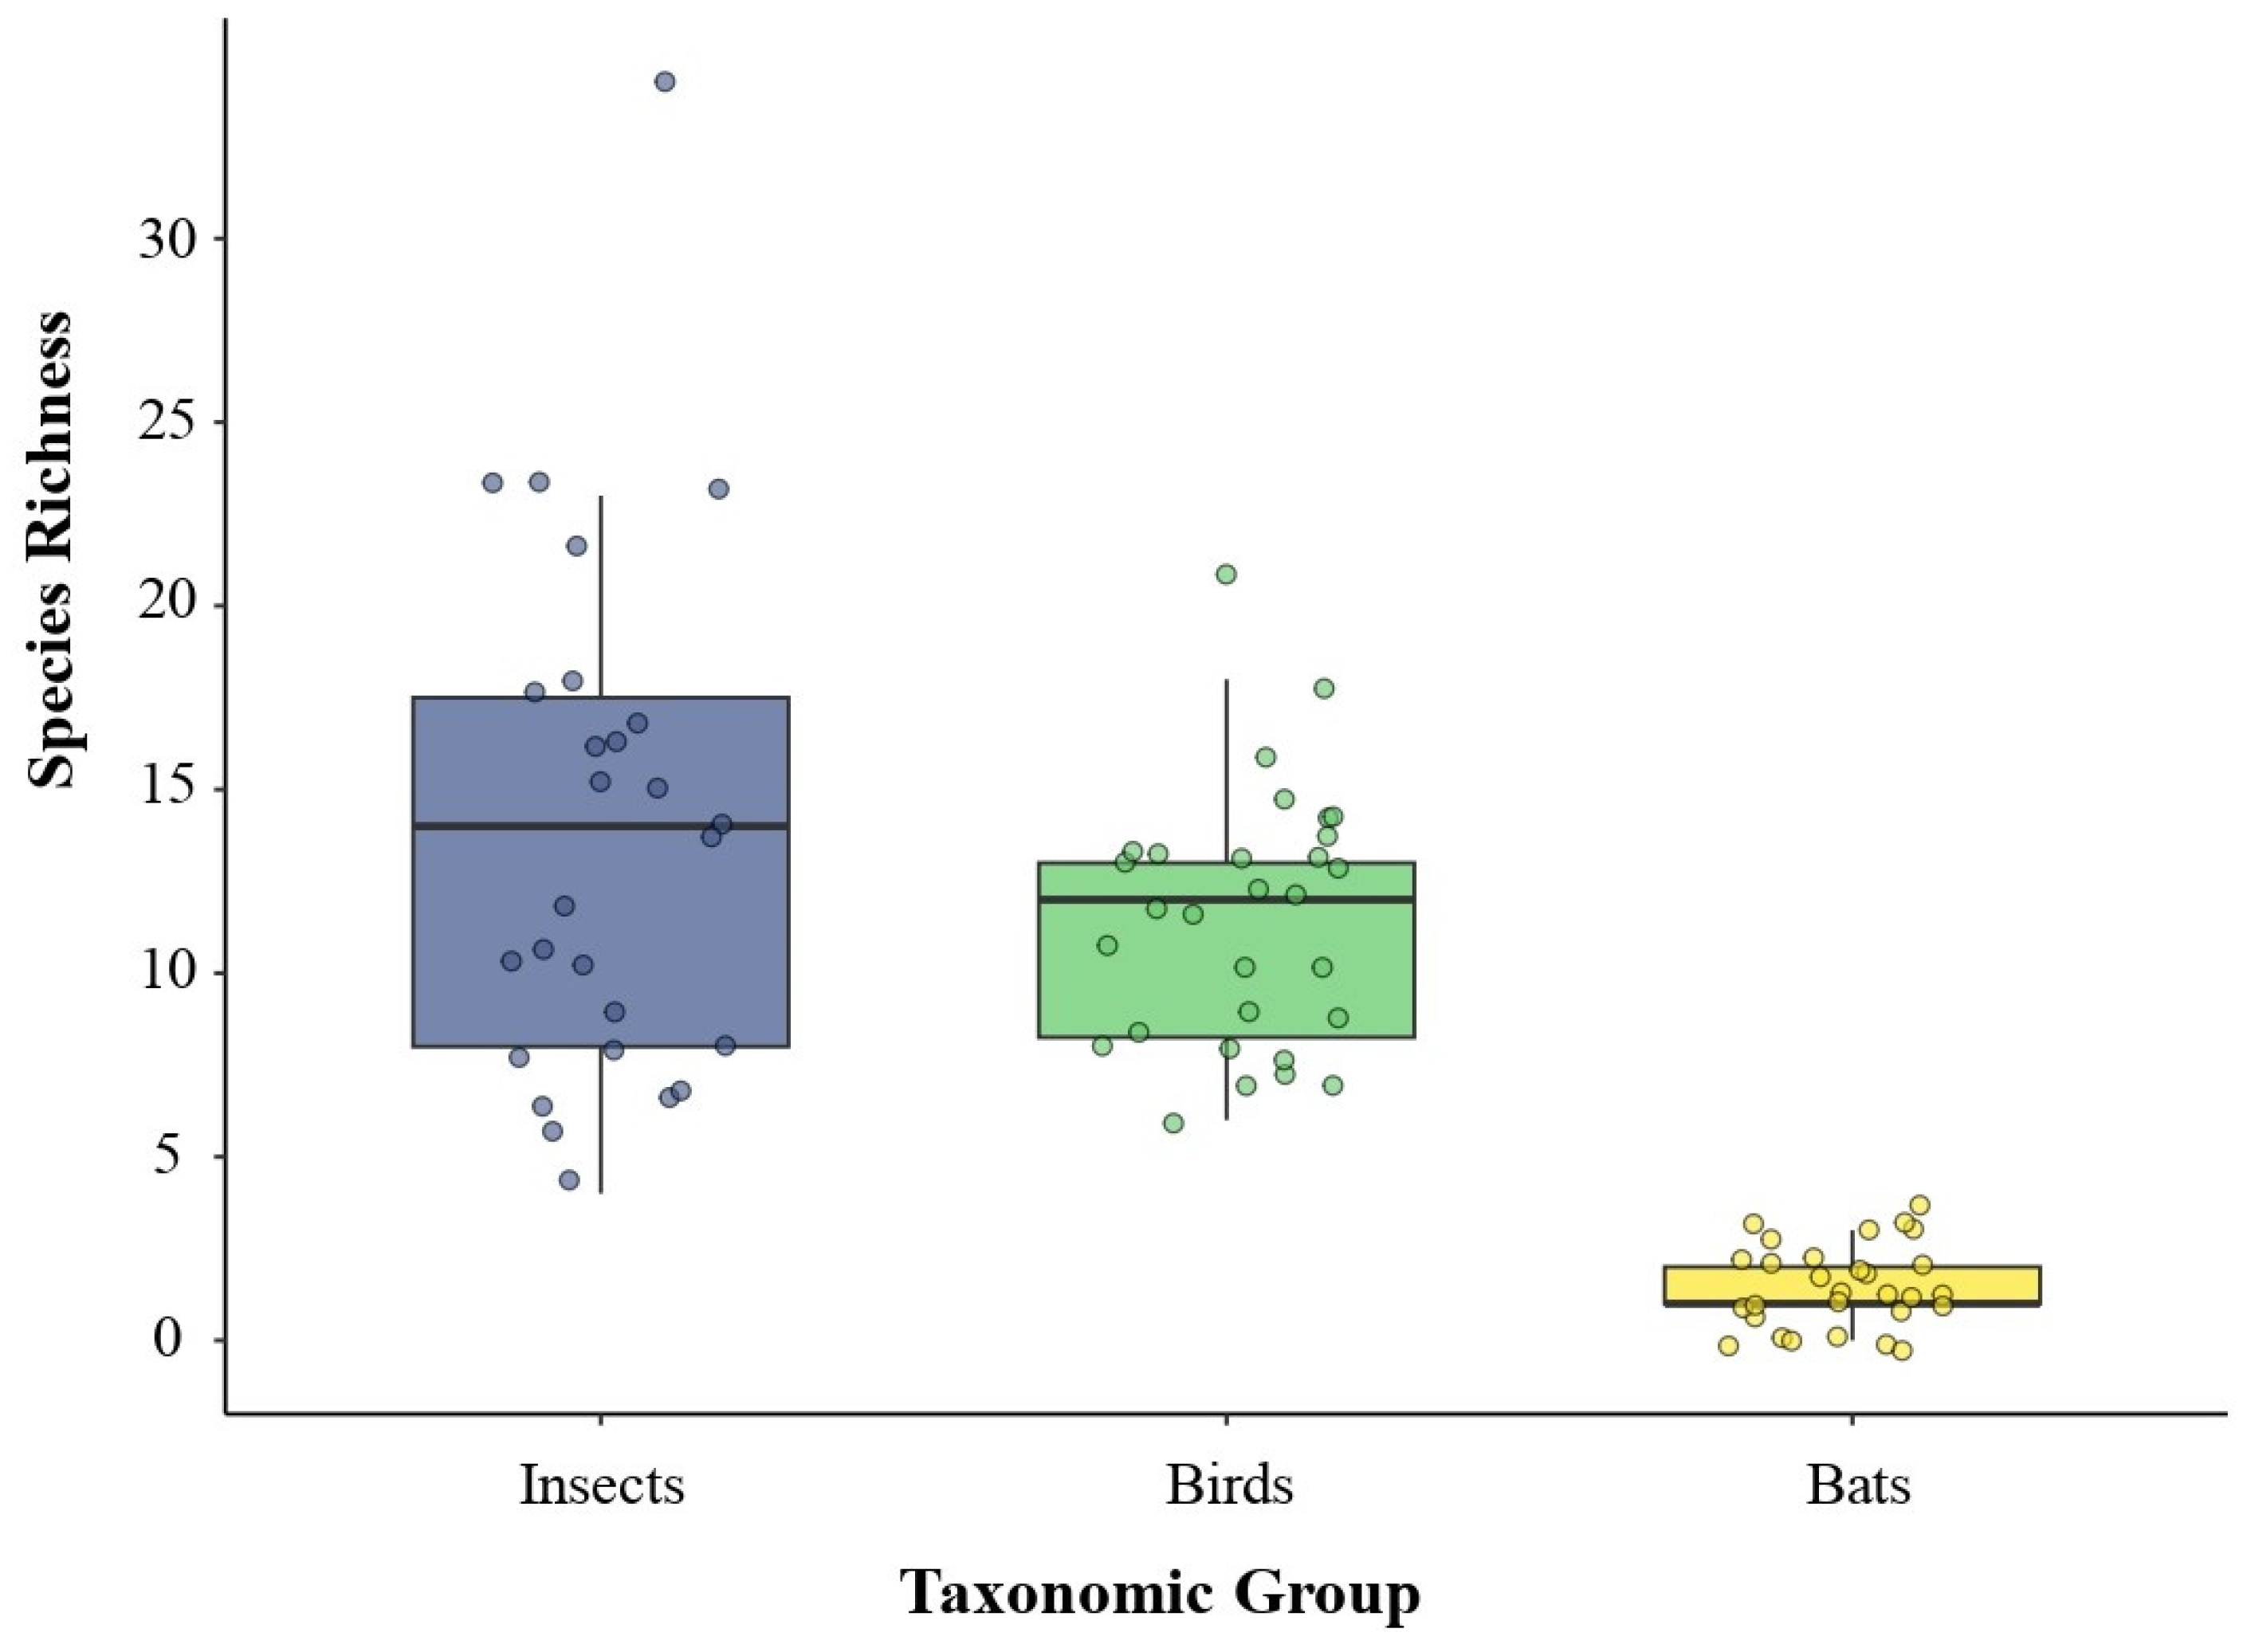
Species richness varied among taxa (Figure 4). Mean species richness per plot was highest for insects, and lowest for bats. Insects exhibited greater among-plot variability (10–30 species per plot), whereas bird richness spanned a narrower range (10–25 species). Bats were the least diverse group, with 0–4 species per plot (Figure 4), a range too narrow to support meaningful statistical analysis as explained in Section 2.5.2. Insect assemblages were largely composed of microlepidoptera (36%), while the most frequently observed bird species were Catharus fuscescens (9%), Vireo olivaceus (7%), and Corvus brachyrhynchos (7%). Bat communities were dominated by Lasionycterys noctivagans (43%), Lasiurus cinereus (21%), and Myotis lucifugus (11%) (see Supplementary Material Table S1 for detailed species information).

3.3. Environmental Predictors of Species Richness

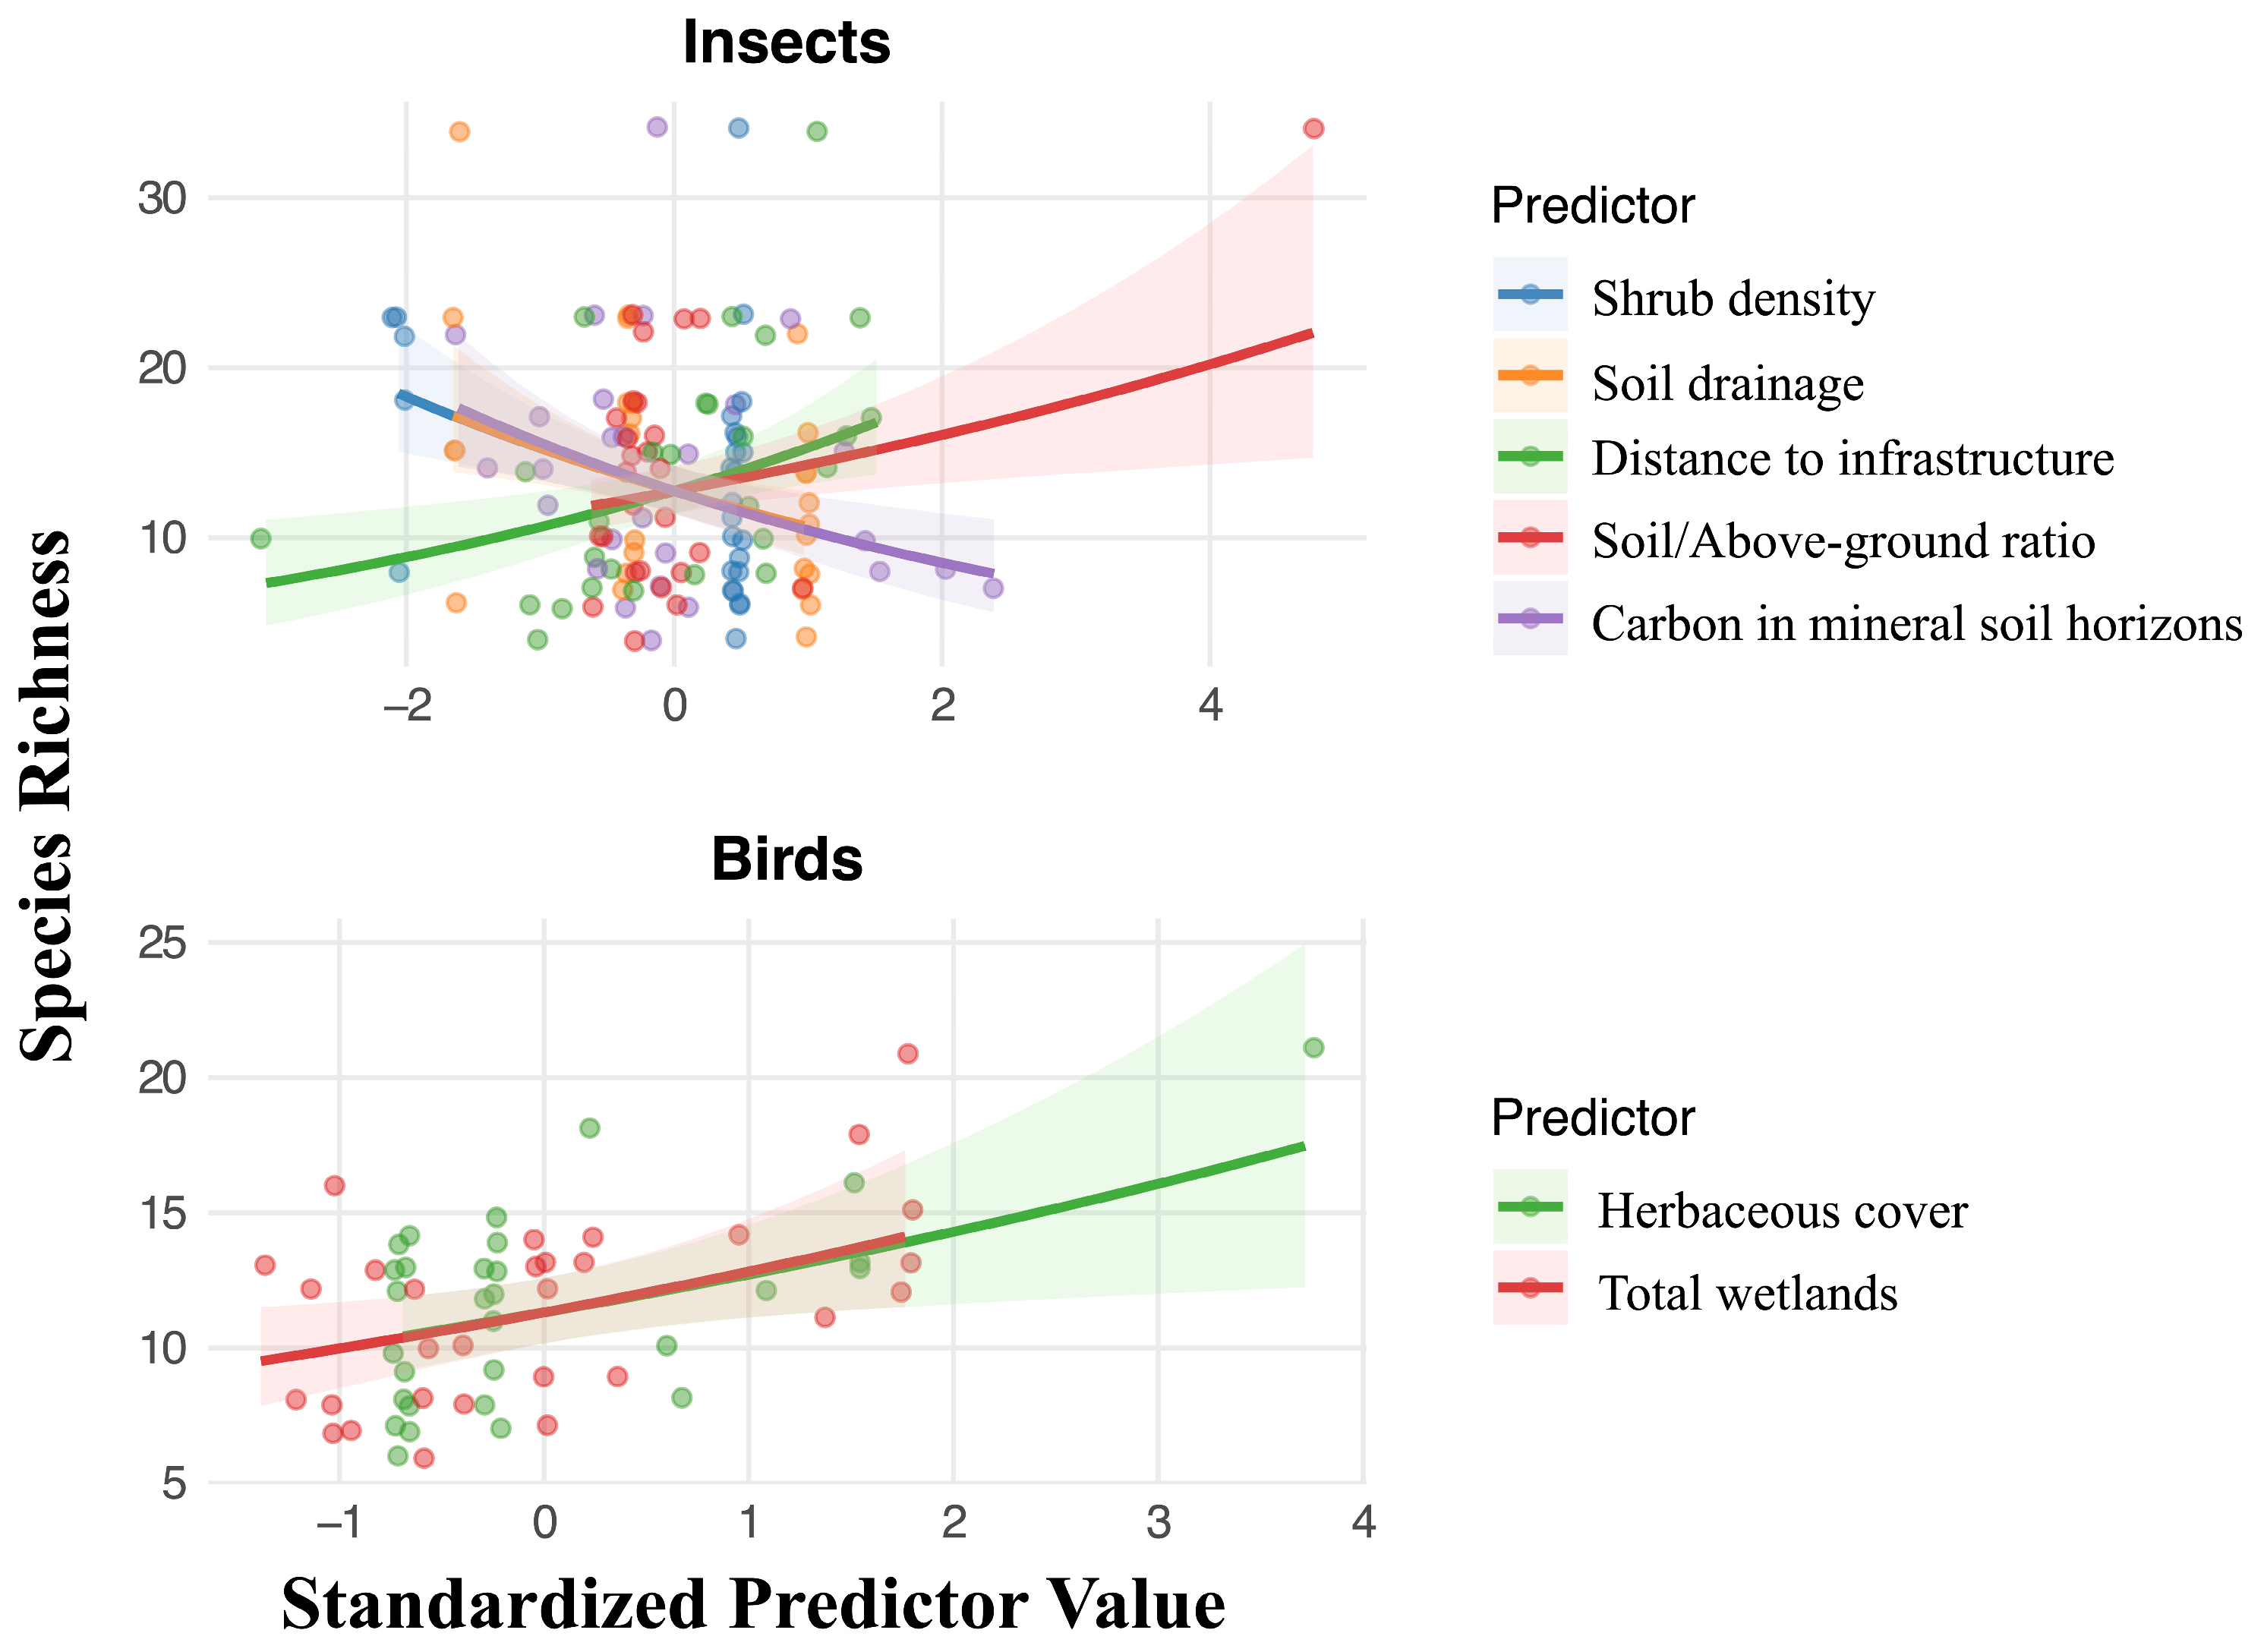
Insect species richness was significantly influenced by several variables (Table 1, Figure 5), including negative effects of dense shrub stands and mineral soil C pools, and positive effects of the soil C/above-ground C ratio and distance to linear infrastructure. This model explained 91% of variance, suggesting a strong influence of vegetation structure and soil–vegetation C distribution on insect diversity. Bird species richness increased with herbaceous cover and the presence of wetlands, indicating the importance of open and wet habitats. The model explained 38% of variance (Table 1, Figure 5).

3.4. Comparison of Predictors Across Taxonomic Groups

Although diversity in species richness varied considerably among taxonomic groups, C storage emerged as the second most consistent predictor across results, after botanical composition and forest structure. Insect species richness was well explained by both vegetation structure and C pools, whereas bird species richness showed stronger relationships with habitat features such as herbaceous cover and wetland presence. For insect species richness, predictors based on botanical composition and forest structure, C storage and land use, respectively, explained 77%, 73%, and 59% of variation in richness (Table 2). For birds, botanical composition and forest structure remained the main driver (33% of variation in richness), followed by land use (25%) and C storage (15%) (Table 2).
Species richness models also revealed consistent and taxon-specific predictors across taxonomic groups (Table 2). For birds, species richness increased with herbaceous cover and wetland presence in the landscape, but decreased with C pools in FH horizons. For insects, richness declined with higher C in mineral soil, drainage, tree abundance, shrubs and woody plants abundance, and tree species richness, but increased with small tree abundance, a greater soil C/above-ground C ratio, and distance to linear infrastructure (Table 2). Integrating all predictor groups enhanced model performance for both taxa. For insects, the combined model increases from R2 = 0.77 (botanical only) to R2 = 0.91 (all predictors) (Table 1 and Table 2). A similar, although smaller, improvement was observed for birds (R2 = 0.33 to 0.38).

4. Discussion

4.1. General Findings

Our results highlight context-dependent relationships among C pools, forest botanical composition and forest structure, landscape characteristics, and species richness diversity at the regional scale, contributing additional perspective to ongoing discussions on the synergies between C sequestration and biodiversity conservation [51]. The variability of responses across taxa and C compartments underscores the role of site-specific conditions [52]. Moreover, models integrating multiple predictor domains highlight the complementarity roles of vegetation structure, land use, and C storage in shaping species richness patterns. Collectively, these findings indicate that species richness patterns are best interpreted using taxon-specific approaches rather than a single generalized framework.

4.2. Forest Carbon Pools: Comparison with Literature Values

The average above-ground C pools (small and large trees combined) across our plots was 84.4 Mg C ha−1, more than twice the mean value reported for Québec forests by Duchesne et al. [53], who also documented higher C storage in hardwoods than boreal stands, consistent with our results. Total ecosystem C pools in our plots (mean = 175 Mg C ha−1) were comparable to estimates for eastern Boreal Shield forests and managed Canadian forests (~190–193 C ha−1) [49], with several plots exceeding 200 Mg C ha−1, and a few surpassing 300 Mg C ha−1, values that fall at or above the upper range in Kurz et al. [49] and Duchesne et al. [53].
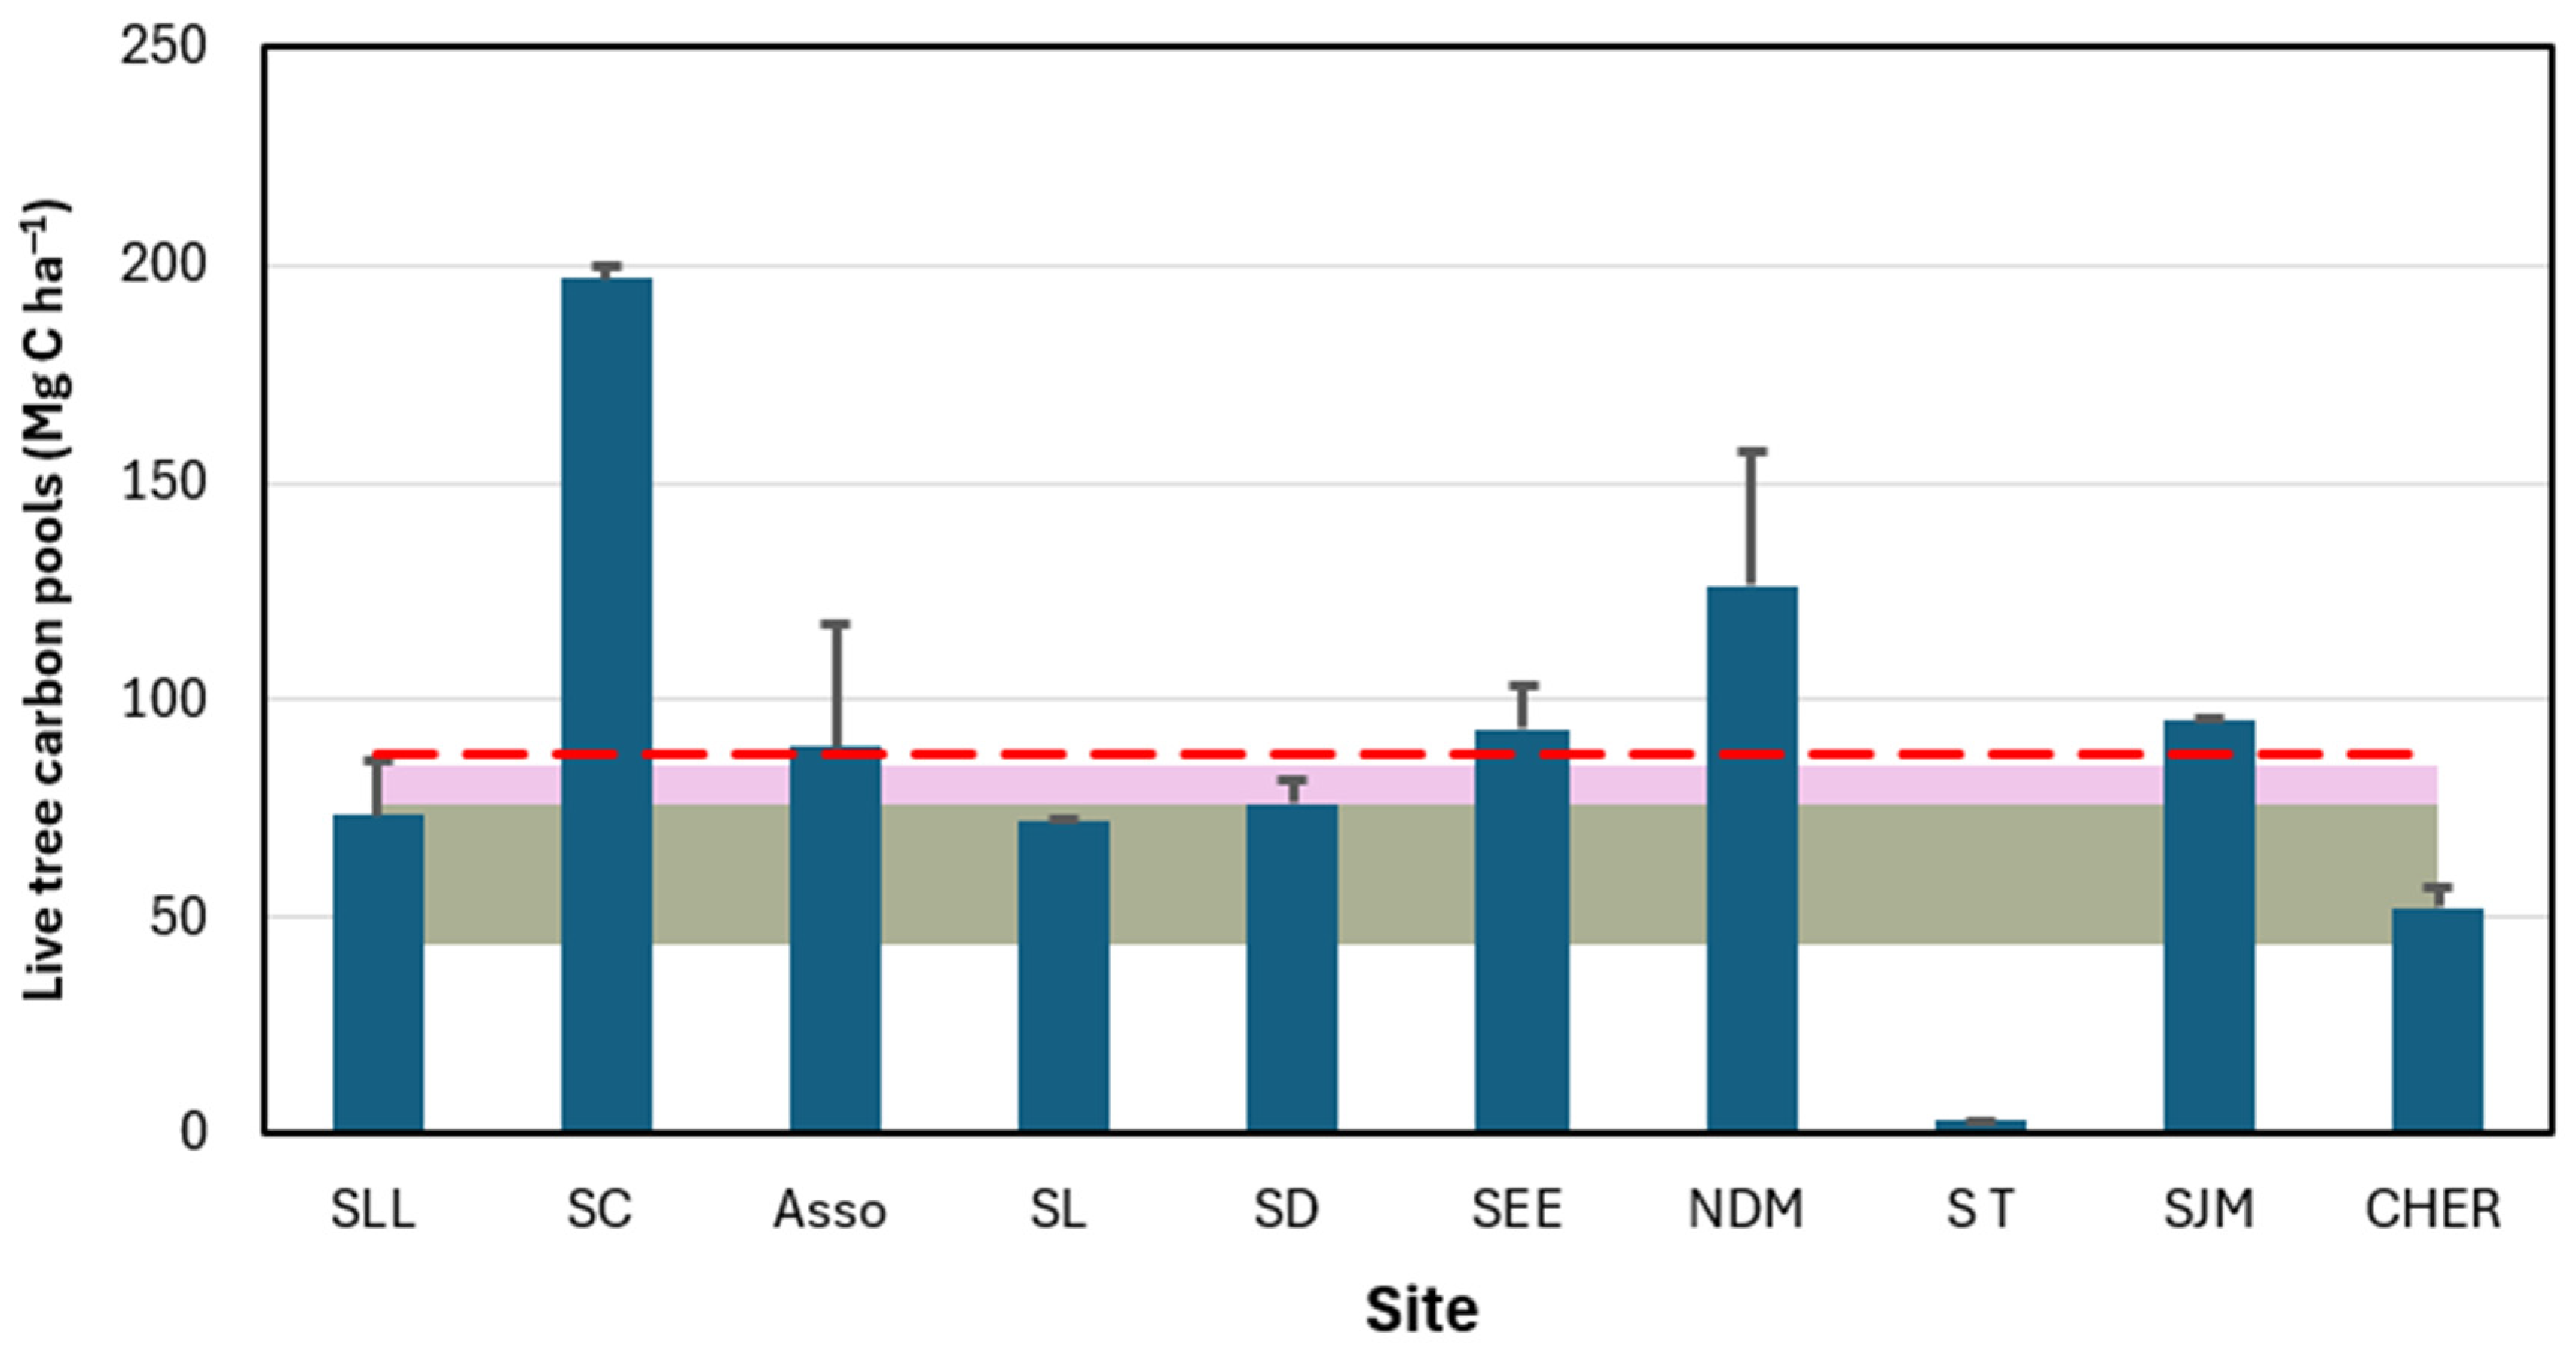
Remote sensing-based estimates of tree C pools for temperate broadleaf/mixed and coniferous forests reported by Thurner et al. [54] (54.2–64.2 Mg C ha−1) were notably lower than those in our study (Figure 6). Such discrepancies likely reflect methodological differences among studies as well as differences in forest composition, stand age, and disturbance history. Overall, these comparisons suggest that the protected mature and old-growth forests examined in our study store relatively high amounts of C compared to regional and continental benchmarks.

4.3. Forest Carbon Pools: Compartmental and Vertical Distribution

Across sites, soils and trees contributed roughly equally to total ecosystem C pools. However, soils consistently represented the largest single compartment, followed by large trees, roots, small trees, and finally woody debris. Upper mineral horizons contained most of the soil C, followed by the forest floor and lower mineral horizons. These patterns are consistent with previous studies showing that mineral soils in Canadian temperate forests can store as much, and often more, C than above-ground biomass [49,55]. Only a few stands (e.g., SC1, SC2, and NDM4) exhibited clearly higher tree-than-soil C, as in Smyth et al. [56] using a modeling approach. Unlike Kurz et al. [49], we found that roots exceeded debris as a C pool, with debris representing only a minor share of total C.
The vertical distribution of soil C reflected variation in stand structure, species composition, and soil properties, as well as factors such as litter inputs, rooting depth, parent material, and drainage [57,58]. Although forest floors contain concentrated organic matter, a substantial proportion of soil C was stored in the underlying mineral horizons, highlighting the importance of including these layers in ecosystem-level C accounting [55]. In our study, mineral horizons accounted for 80–82% of whole-profile soil C, consistent with observations from Podzols and Brunisols in northern temperate and boreal systems where a large fraction of soil organic C resides below the organic horizons [59,60]. These results emphasize that restricting sampling to forest floors or shallow mineral layers can substantially underestimate total ecosystem C storage, particularly in deciduous stand where forest floors may be thin due to rapid decomposition [58].
Importantly, differences among soil types were similar whether C pools were assessed at the whole-profile scale or by individual genetic horizons, indicating broadly comparable patterns of vertical C partitioning across soil-forming pathways. Overall, within the studied region, variation in ecosystem-level C storage appears more strongly associated with stand structure, tree-size distributions, and site-specific conditions than with differences in soil development alone.

4.4. Dominance of Botanical Composition and Forest Structure: A Robust but Taxon-Dependent Pattern

Our results indicate that variables related to botanical composition and forest structure were the strongest predictors of species richness, although their explanatory strength varied among taxonomic groups. For insect species richness, botanical composition and forest structure had the highest predictive value (R2 = 0.77), followed closely by C pools (R2 = 0.73). For bird species richness, botanical composition and forest structure remained the best predictor (R2 = 0.33), although the relationship was weaker.
For bird species richness, the marked influence of botanical composition and forest structure corroborates earlier findings emphasizing the role of vegetation strata and structural complexity in shaping avian diversity [61]. Our results further suggest that bird diversity is positively associated with the presence of wetlands and herbaceous strata, which provide key foraging and nesting habitats. However, for bats, the very low species richness observed (0–4 species per site) and the absence of suitable data for modeling suggest that their diversity depends on ecological factors not captured in our dataset. This interpretation aligns with previous studies highlighting the strong dependence of bats on specific microhabitats such as roosts and foraging structures [62,63].
Forest composition and structure, reflecting vegetation complexity, remains a cornerstone of species richness diversity prediction because it increases habitat heterogeneity and niche availability [2]. Dead wood, senescent trees, and stumps further enhance this complexity by providing essential microhabitats for various taxa [64]. Consistent with Barbaro et al. [65], our findings suggest that bird and bat diversities are best explained when biotic, climatic, and structural variables are integrated. However, in Barbaro et al. [65], tree functional diversity was the primary driver of bird diversity, while bats responded more strongly to understory structure and microhabitat features.

4.5. Contrasting Role of Carbon Pools in Community Structure

Carbon pools emerged as secondary but informative predictors of species richness, exerting a strong influence on insects and a weaker, sometimes negative, effect on birds. These mixed responses contrast with the generally positive biodiversity–C relationships reported in some global syntheses, but are consistent with evidence that such relationships weaken and become context dependent at regional scales and across taxa [4,15].
For insects, C-related variables were retained in the best-supported models, indicating sensitivity to C distribution within the ecosystem. In contrast, bird species richness was more strongly associated with habitat variables such as herbaceous cover and wetland extent, and C pools explained a smaller proportion of variation. These patterns suggest that C pools influence biodiversity largely through indirect associations with habitat structure and environmental conditions rather than through direct trophic mechanisms.
The negative relationship between soil C and bird richness observed in our models likely reflects broader site characteristics linked to soil C accumulation. Soil C pools integrate information on parent material, drainage, biological activity, topography, vegetation, climate, and land use, which together shape habitat suitability for different taxa [66,67]. In the study region, soils with high C pools are often associated with poor drainage (Organic order) or acidic parent materials (Podzolic order with thick forest floors), but well-drained and less acidic conditions can also favor high earthworm and microbial communities, leading to rapid litter decomposition, a thin leaf litter layer with little surface debris, and highly humified organic matter contents within the mineral soil (Brunisol order with Mull-type forest floors) [31,68]. These latter soils could be associated with conditions that may constrain foraging opportunities for some bird species. As such, the observed relationships are best interpreted as emerging from the combined effects of soil genesis, hydrology, and vegetation structure rather than from a direct effect of soil C per se.
These relationships should be interpreted cautiously. The correlative nature of our analyses precludes causal inference, and sample sizes were necessarily limited by the field-intensive design. Nonetheless, our results highlight that different C compartments capture distinct environmental dimensions [10], with soil C reflecting edaphic and microbial processes and above-ground C linked more directly to vegetation structure. Although less predictive overall than botanical composition and forest structure, C pools remain a valuable complementary indicator, particularly for insects, as they capture aspects of habitat variation not fully represented by vegetation variables alone.

4.6. Insects as a Reliable Bioindicator: Strengths and Limitations

Insects proved to be highly responsive to environmental gradients, confirming their value as bioindicators [69]. The strong performance of the insect model (R2 = 0.91) is consistent with previous studies showing high sensitivity of insect assemblages to microhabitat conditions, vegetation structure, and anthropogenic disturbances [69,70,71]. In our study, insect richness declined with increasing mineral soil C, soil moisture, and shrub density, suggesting that high soil C levels do not necessarily coincide with higher insect diversity. Conversely, richness increased with the soil/above-ground C ratio, indicating that the distribution of C among ecosystem compartments plays an important role in shaping insect communities. These results highlight that interactions between C sequestration and insect diversity are driven by specific ecological contexts [72].
These patterns highlight the close coupling among botanical composition, forest structure, C distribution, and microclimatic conditions. Although botanical composition and forest structure outweighed C pools as predictors of insect richness, C variables remained informative, capturing environmental dimensions not fully represented by vegetation metrics. Similar ambiguity in C–insect relationships has been reported elsewhere. For example, Schuldt et al. [73] found positive associations between total C pools and multitrophic diversity, whereas Van De Perre et al. [74] showed that increased C storage can coincide with greater differentiation rather than uniformly higher insect richness. Together, these findings underscore the need for integrative approaches when interpreting C–biodiversity relationships involving insect communities.

4.7. Limited Insight into Bat Richness: Missing Ecological Variables

Bat detections were sparse and uneven among plots, precluding robust statistical modeling of species richness. Nonetheless, the observed patterns, i.e., low richness and dominance of a few widespread species, are consistent with previous studies indicating that bat communities in temperate forests are strongly shaped by factors not fully captured in our dataset. Roost availability, prey abundance, and fine-scale forest structure, including canopy gaps, standing snags, and trees with cavities or exfoliating bark, are known to play a central role in determining bat occurrence and activity [63,72,75,76].
Landscape composition and configuration may further modulate these patterns, as forest amount, edge density, and matrix composition have been shown to influence insectivorous bat richness in forested landscapes [77]. In addition, acoustic surveys in northern environments are subject to detection biases that can limit species identification [78,79]. Together, these constraints suggest that bat richness in the study area is likely governed by a combination of microhabitat availability and landscape context, emphasizing the need for complementary monitoring approaches and targeted variables in future studies.

5. Implications for Sustainable Management and Conclusion

Because our analyses are based on observational and correlational models, with plots nested within a limited number of protected sites and uneven sampling among sites, the management implications discussed below should be interpreted as indicative associations rather than evidence of direct causal relationships or broadly generalizable effects. Our study demonstrates that the relationships between C pools, botanical composition and forest structure, landscape characteristics and species richness are highly taxonomic group dependent, underscoring the need for group-specific approaches in both ecological research and forest management. Botanical composition and forest structure emerged as the strongest predictors of species richness, particularly for insects, while birds showed more moderate responses and bat patterns were limited to descriptive interpretation due to low detectability, reinforcing the central role of vertical complexity, senescent trees, and dead wood in sustaining multi-taxonomic diversity in temperate forests. Carbon pools acted as secondary but complementary predictors, with effects varying among taxonomic groups and C pool compartments. Insect species richness increased with higher ratios of soil to above-ground C, whereas bird species richness was negatively associated with C stored in organic soil horizons, indicating contrasting, taxon-specific responses to different C pools. The strong response of insect species richness further confirms their value as a bioindicator sensitive to environmental gradients and botanical composition and forest structure.
From a management perspective, our findings emphasize the importance of maintaining structural complexity and diverse vegetation strata as central components of biodiversity conservation in mature and old-growth forests. Carbon pools, particularly in soils, appear to be closely associated with these structural attributes and can therefore provide complementary information relevant to climate mitigation objectives. However, strategies focused exclusively on maximizing C storage may not uniformly benefit all taxa and may have unintended consequences in certain ecological contexts. Management approaches should therefore prioritize habitat heterogeneity and structural features while considering C sequestration as one of several interacting ecosystem attributes. Within this framework, mature and old-growth forests remain critical for conserving multi-taxonomic diversity due to their structural complexity, rather than C storage alone.
Finally, because our study was conducted exclusively in protected mature and old-growth stands, caution is warranted when extrapolating these results to younger or intensively managed forests. In addition, the temporal mismatch among sampling years (insects in 2019, birds in 2018 and 2023, and bats in 2024) may have introduced minor variability associated with interannual climatic conditions or community turnover. However, such effects are likely limited given the relative stability of mature forest communities. Together, these limitations open promising avenues for future research, including the examination of C–biodiversity relationships across successional gradients, the evaluation of alternative silvicultural practices, and the development of integrative models incorporating landscape connectivity, functional diversity, and temporal dynamics. Such approaches are essential to reconcile carbon sequestration and biodiversity conservation within a unified framework for sustainable forest management.

Supplementary Materials

The following supporting information can be downloaded at: https://www.mdpi.com/article/10.3390/conservation6010026/s1, Table S1: Species richness by taxonomic group in each study plot. Table S2: Explanatory variables for insects, birds and bats: botanical composition and forest structure, land use, and C pools. Table S3: Carbon pools by compartment (Mg carbon ha−1) in each plot. Figure S1: Relative abundance of species detected within each taxonomic group. A) Birds: PATC (Setophaga magnolia), MOTC (Empidonax minimus), BRGB (Zonotrichia albicollis), PAFM (Setophaga pensylvanica), MEAM (Turdus migratorius), QUBR (Quiscalus quiscula), PIMA (Sphyrapicus varius), CACO (Anas platyrhynchos), GRSO (Catharus guttatus), CAPR (Pheucticus ludovicianus), CABR (Aix sponsa), GEBL (Cyanocitta cristata), PACO (Seiurus aurocapilla), COAM (Corvus brachyrhynchos), VIYR (Vireo olivaceus), and GRFA (Catharus fuscescens). B) Insects and C) Bats: MYSE (Myotis septentrionalis), EPNO (Eptesicus fuscus & Lasionycterys noctivagans), MYSP (Myotis septentrionalis & Myotis lucifugus & Myotis leibii), LABO (Lasiurus borealis), EPFU (Eptesicus fuscus), MYLU (Myotis lucifugus), LACI (Lasiurus cinereus), and LANO (Lasionycterys noctivagans). Species with less than 2% abundance are grouped as Other.

Author Contributions

Conceptualization: N.B. and M.L. methodology, data curation and laboratory analysis: K.L., M.L., R.B., R.T.-P. and N.B., figures production: R.T.-P., R.B. and N.B., writing—original draft preparation: R.B., N.B. and R.T.-P., writing—review and editing: N.B., R.B., R.T.-P., M.L. and K.L., funding acquisition: N.B. and M.L. All authors have read and agreed to the published version of the manuscript.

Funding

This work was supported by grants to N. Bélanger by the Ministère de l’Enseignement supérieur of the Quebec Governement (Soutien aux initiatives avec les collectivités et les entreprises) and by the Natural Sciences and Engineering Research Council of Canada (NSERC Discovery grants RGPIN 2020–04931 as well as several Undergraduate Research Awards), as well as funding to the Fiducie de conservation des écosystèmes de Lanaudière by Environment and Climate Change Canada (Nature Smart Climate Solutions Fund).

Institutional Review Board Statement

This study did not involve experimental manipulation, capture, handling, or disturbance of vertebrate animals. Bird and bat data were obtained exclusively through passive acoustic monitoring. Insect sampling was conducted by a co-author during his professional activities at the time of routine data collection, using standard entomological methods. The authors did not conduct any experimental procedures involving vertebrate animals. According to institutional policies at Université TÉLUQ and applicable Canadian regulations, ethics approval is not required for non-invasive observational wildlife studies or for the secondary use of ecological monitoring data.

Informed Consent Statement

Not applicable.

Data Availability Statement

Available from Nicolas Bélanger, Data Science Laboratory, Université TÉLUQ, and Michel Leboeuf, Independent researcher.

Acknowledgments

We thank D. Bélanger for assistance with carbon analyses. We acknowledge A. Beaulieu, C. Chaput-Richard, B. Courcot, P. Gagnon-Tétreault, S. Laberge, V. Labrèche, A. Lagarde, L.-A. Mc Duff, and D. Nahum for their help in the field and sample preparation in the laboratory. We also thank S. Lebel-Desrosiers for some training in the field and laboratory.

Conflicts of Interest

The authors declare no conflict of interest. The authors declare that the funder was not involved in the study design, collection, analysis, interpretation of data, the writing of this article or the decision to submit it for publication.

References

  1. Hurteau, M.D. The Role of Forests in the Carbon Cycle and in Climate Change. In Climate Change; Elsevier: Amsterdam, The Netherlands, 2021; pp. 561–579. [Google Scholar]
  2. Toivonen, J.; Kangas, A.; Maltamo, M.; Kukkonen, M.; Packalen, P. Assessing biodiversity using forest structure indicators based on airborne laser scanning data. For. Ecol. Manag. 2023, 546, 121376. [Google Scholar] [CrossRef] [Scilit]
  3. Charmakar, S.; Oli, B.N.; Joshi, N.R.; Maraseni, T.N.; Atreya, K. Forest carbon storage and species richness in FSC certified and non-certified community forests in Nepal. Small-Scale For. 2021, 20, 199–219. [Google Scholar] [CrossRef] [Scilit]
  4. Sabatini, F.M.; De Andrade, R.B.; Paillet, Y.; Ódor, P.; Bouget, C.; Campagnaro, T.; Gosselin, F.; Janssen, P.; Mattioli, W.; Nascimbene, J.; et al. Trade-offs between carbon stocks and biodiversity in European temperate forests. Glob. Change Biol. 2019, 25, 536–548. [Google Scholar] [CrossRef] [Scilit]
  5. Springer, K.; Manning, P.; Boesing, A.L.; Ammer, C.; Fiore-Donno, A.M.; Fischer, M.; Goldmann, K.; Le Provost, G.; Overmann, J.; Ruess, L.; et al. Identifying the stand properties that support both high biodiversity and carbon storage in German forests. For. Ecol. Manag. 2024, 572, 122328. [Google Scholar] [CrossRef] [Scilit]
  6. Haddad, N.M.; Brudvig, L.A.; Clobert, J.; Davies, K.F.; Gonzalez, A.; Holt, R.D.; Lovejoy, T.E.; Sexton, J.O.; Austin, M.P.; Collins, C.D.; et al. Habitat fragmentation and its lasting impact on Earth’s ecosystems. Sci. Adv. 2015, 1, e1500052. [Google Scholar] [CrossRef] [Scilit]
  7. Fahrig, L. Ecological responses to habitat fragmentation per se. Annu. Rev. Ecol. Evol. Syst. 2017, 48, 1–23. [Google Scholar] [CrossRef] [Scilit]
  8. Ampoorter, E.; Barbaro, L.; Jactel, H.; Baeten, L.; Boberg, J.; Carnol, M.; Castagneyrol, B.; Charbonnier, Y.; Dawud, S.M.; Deconchat, M.; et al. Tree diversity is key for promoting the diversity and abundance of forest-associated taxa in Europe. Oikos 2020, 129, 133–146. [Google Scholar] [CrossRef] [Scilit]
  9. Burrascano, S.; De Andrade, R.B.; Paillet, Y.; Ódor, P.; Antonini, G.; Bouget, C.; Campagnaro, T.; Gosselin, F.; Janssen, P.; Persiani, A.M.; et al. Congruence across taxa and spatial scales: Are we asking too much of species data? Glob. Ecol. Biogeogr. 2018, 27, 980–990. [Google Scholar] [CrossRef] [Scilit]
  10. Di Marco, M.; Watson, J.E.M.; Currie, D.J.; Possingham, H.P.; Venter, O. The extent and predictability of the biodiversity–carbon correlation. Ecol. Lett. 2018, 21, 365–375. [Google Scholar] [CrossRef] [Scilit] [PubMed]
  11. Jung, M.; Arnell, A.; De Lamo, X.; García-Rangel, S.; Lewis, M.; Mark, J.; Merow, C.; Miles, L.; Ondo, I.; Pironon, S.; et al. Areas of global importance for conserving terrestrial biodiversity, carbon and water. Nat. Ecol. Evol. 2021, 5, 1499–1509. [Google Scholar] [CrossRef] [Scilit]
  12. Labadie, G.; Cadieux, P.; Moreau, L.; Bognounou, F.; Thiffault, E.; Cyr, D.; Boulanger, Y.; Stralberg, D.; Grondin, P.; Tremblay, J.A. Are forest management practices to improve carbon balance compatible with maintaining bird diversity under climate change? A case study in eastern North America. PLoS Clim. 2024, 3, e0000293. [Google Scholar] [CrossRef] [Scilit]
  13. Watson, J.E.M.; Evans, T.; Venter, O.; Williams, B.; Tulloch, A.; Stewart, C.; Thompson, I.; Ray, J.C.; Murray, K.; Salazar, A.; et al. The exceptional value of intact forest ecosystems. Nat. Ecol. Evol. 2018, 2, 599–610. [Google Scholar] [CrossRef] [Scilit]
  14. Sullivan, M.J.P.; Talbot, J.; Lewis, S.L.; Phillips, O.L.; Qie, L.; Begne, S.K.; Chave, J.; Cuni-Sanchez, A.; Hubau, W.; Lopez-Gonzalez, G.; et al. Diversity and carbon storage across the tropical forest biome. Sci. Rep. 2017, 7, 39102. [Google Scholar] [CrossRef] [Scilit]
  15. Lecina-Diaz, J.; Alvarez, A.; Regos, A.; Drapeau, P.; Paquette, A.; Messier, C.; Retana, J. The positive carbon stocks–biodiversity relationship in forests: Co-occurrence and drivers across five subclimates. Ecol. Appl. 2018, 28, 1481–1493. [Google Scholar] [CrossRef] [Scilit]
  16. Asbeck, T.; Sabatini, F.; Augustynczik, A.L.D.; Basile, M.; Helbach, J.; Jonker, M.; Knuff, A.; Bauhus, J. Biodiversity response to forest management intensity, carbon stocks and net primary production in temperate montane forests. Sci. Rep. 2021, 11, 1625. [Google Scholar] [CrossRef] [Scilit] [PubMed]
  17. Ezquerro, M.; Pardos, M.; Diaz-Balteiro, L. The inclusion of improved forest management in strategic forest planning and its impact on timber harvests, carbon and biodiversity conservation. Sci. Total Environ. 2024, 949, 174813. [Google Scholar] [CrossRef] [Scilit]
  18. Liu, B.; Scherer, L.; Van Bodegom, P.M.; Sun, Z.; Behrens, P. Exploring the spatial relationship between carbon storage and biodiversity: A systematic review and meta-analysis. Land. Degrad. Dev. 2025, 36, 2786–2797. [Google Scholar] [CrossRef] [Scilit]
  19. Betts, M.G.; Phalan, B.; Frey, S.J.K.; Rousseau, J.S.; Yang, Z. Old-growth forests buffer climate-sensitive bird populations from warming. Divers. Distrib. 2018, 24, 439–447. [Google Scholar] [CrossRef] [Scilit]
  20. Vera, P.; Sasa, M.; Encabo, S.I.; Barba, E.; Belda, E.J.; Monrós, J.S. Land use and biodiversity congruences at local scale: Applications to conservation strategies. Biodivers. Conserv. 2011, 20, 1287–1317. [Google Scholar] [CrossRef] [Scilit]
  21. Losey, J.E.; Vaughan, M. The economic value of ecological services provided by insects. BioScience 2006, 56, 311–323. [Google Scholar] [CrossRef] [Scilit]
  22. Sekercioglu, C. Increasing awareness of avian ecological function. Trends Ecol. Evol. 2006, 21, 464–471. [Google Scholar] [CrossRef] [Scilit]
  23. Ramírez-Fráncel, L.A.; García-Herrera, L.V.; Losada-Prado, S.; Reinoso-Flórez, G.; Sánchez-Hernández, A.; Estrada-Villegas, S.; Lim, B.K.; Guevara, G. Bats and their vital ecosystem services: A global review. Integr. Zool. 2022, 17, 2–23. [Google Scholar] [CrossRef] [Scilit] [PubMed]
  24. Boyles, J.G.; Cryan, P.M.; McCracken, G.F.; Kunz, T.H. Economic importance of bats in agriculture. Science 2011, 332, 41–42. [Google Scholar] [CrossRef] [Scilit]
  25. Jung, K.; Kaiser, S.; Böhm, S.; Nieschulze, J.; Kalko, E.K.V. Moving in three dimensions: Effects of structural complexity on occurrence and activity of insectivorous bats in managed forest stands. J. Appl. Ecol. 2012, 49, 523–531. [Google Scholar] [CrossRef] [Scilit]
  26. Thiffault, É.; Paré, D.; Dagnault, S.; Jacques, M. Mise en Place d’un Dispositif de Suivi Environnemental des Effets de la Récolte des Résidus de Coupe: Guide; Centre de foresterie des Laurentides: Sainte-Foy, QC, Canada, 2011. [Google Scholar]
  27. Gonzalez-Akre, E.; Piponiot, C.; Lepore, M.; Herrmann, V.; Lutz, J.A.; Baltzer, J.L.; Dick, C.W.; Gilbert, G.S.; He, F.; Heym, M.; et al. allodb: An R package for biomass estimation at globally distributed extratropical forest plots. Methods Ecol. Evol. 2022, 13, 330–338. [Google Scholar] [CrossRef] [Scilit]
  28. Cairns, M.A.; Brown, S.; Helmer, E.H.; Baumgardner, G.A. Root biomass allocation in the world’s upland forests. Oecologia 1997, 111, 1–11. [Google Scholar] [CrossRef] [Scilit] [PubMed]
  29. Ressources Naturelles Canada. Inventaire Forestier National du Canada (IFN); Gouvernement du Canada: Ottawa, ON, Canada, 2016. [Google Scholar]
  30. Lamlom, S.H.; Savidge, R.A. A reassessment of carbon content in wood: Variation within and between 41 North American species. Biomass Bioenergy 2003, 25, 381–388. [Google Scholar] [CrossRef] [Scilit]
  31. Soil Classification Working Group. The Canadian System of Soil Classification, 3rd ed.; Agriculture and Agri-Food Canada Publication 1646; NRC Research Press: Ottawa, ON, Canada, 1998. [Google Scholar]
  32. Hébert, C.; Jobin, L.; Fréchette, M.; Pelletier, G.; Coulombe, C.; Germain, C.; Auger, M. An efficient pit-light trap to study beetle diversity. J. Insect Conserv. 2000, 4, 189–200. [Google Scholar] [CrossRef] [Scilit]
  33. Bibby, C.J.; Burgess, N.D.; Hill, D.A.; Mustoe, S. Bird Census Techniques, 2nd ed.; Academic Press: London, UK, 2000. [Google Scholar]
  34. Verner, J. Assessment of Counting Techniques. In Current Ornithology; Johnston, R.F., Ed.; Springer: Boston, MA, USA, 1985; pp. 247–302. [Google Scholar]
  35. Fabianek, F. Formation Acoustique sur les Chiroptères du Québec; Atelier de Formation: Québec, QC, Canada, 2017. [Google Scholar]
  36. Environnement et Changement Climatique Canada; Ministère de l’Environnement, de la Lutte Contre les Changements Climatiques, de la Faune et des Parcs. Cartographie de L’occupation du sol des Basses-Terres du Saint-Laurent, Circa 2014; Plan d’action Saint-Laurent; Gouvernement du Québec: Québec, QC, Canada, 2018; 49p.
  37. R Core Team. R: A Language and Environment for Statistical Computing; R Foundation for Statistical Computing: Vienna, Austria, 2025. [Google Scholar]
  38. Wickham, H.; Chang, W.; Henry, L.; Pedersen, T.L.; Takahashi, K.; Wilke, C.; Woo, K.; Yutani, H.; Dunnington, D.; Van Den Brand, T. ggplot2: Create Elegant Data Visualisations Using the Grammar of Graphics, R package version 4.0.1; 2007. Available online: https://cran.r-project.org/web/packages/ggplot2/ggplot2.pdf (accessed on 23 December 2025).
  39. Ripley, B.; Venables, B. MASS: Support Functions and Datasets for Venables and Ripley’s MASS, R package version 7.3-65; 2023. Available online: https://cran.uni-muenster.de/web/packages/MASS/MASS.pdf (accessed on 23 December 2025).
  40. Kassambara, A. ggcorrplot: Visualization of a Correlation Matrix Using “ggplot2”. R package 0.1.4.1. 2016. Available online: https://cran.r-project.org/web/packages/ggcorrplot/ggcorrplot.pdf (accessed on 23 December 2025).
  41. Fox, J.; Weisberg, S.; Price, B. Car: Companion to Applied Regression, R package version 3.1-3; 2023. Available online: https://cran.r-project.org/web/packages/car/car.pdf (accessed on 23 December 2025).
  42. Samuel-Rosa, A. Pedometrics: Miscellaneous Pedometric Tools, R package version 0.12.1; 2022. Available online: https://cran.r-project.org/web/packages/pedometrics/pedometrics.pdf (accessed on 23 December 2025).
  43. Jackman, S. pscl: Political Science Computational Laboratory, R package version 1.5.9; 2020. Available online: https://cran.r-project.org/web/packages/pscl/pscl.pdf (accessed on 23 December 2025).
  44. Wickham, H.; François, R.; Henry, L.; Müller, K.; Vaughan, D. dplyr: A Grammar of Data Manipulation, R package version 1.1.4; 2023. Available online: https://cran.r-project.org/web/packages/dplyr/dplyr.pdf (accessed on 23 December 2025).
  45. Dormann, C.F.; Elith, J.; Bacher, S.; Buchmann, C.; Carl, G.; Carré, G.; Marquéz, J.R.G.; Gruber, B.; Lafourcade, B.; Leitão, P.J.; et al. Collinearity: A review of methods to deal with it and a simulation study evaluating their performance. Ecography 2013, 36, 27–46. [Google Scholar] [CrossRef] [Scilit]
  46. Brun, P.; Thuiller, W.; Chauvier, Y.; Pellissier, L.; Wüest, R.O.; Wang, Z.; Zimmermann, N.E. Model complexity affects species distribution projections under climate change. J. Biogeogr. 2020, 47, 130–142. [Google Scholar] [CrossRef] [Scilit]
  47. Aho, K.; Derryberry, D.; Peterson, T. Model selection for ecologists: The worldviews of AIC and BIC. Ecology 2014, 95, 631–636. [Google Scholar] [CrossRef] [Scilit] [PubMed]
  48. Shaw, C.H.; Hilger, A.B.; Metsaranta, J.; Kurz, W.A.; Russo, G.; Eichel, F.; Stinson, G.; Smyth, C.; Filiatrault, M. Evaluation of simulated estimates of forest ecosystem carbon stocks using ground plot data from Canada’s National Forest Inventory. Ecol. Model. 2014, 272, 323–347. [Google Scholar] [CrossRef] [Scilit]
  49. Kurz, W.A.; Shaw, C.H.; Boisvenue, C.; Stinson, G.; Metsaranta, J.; Leckie, D.; Dyk, A.; Smyth, C.; Neilson, E.T. Carbon in Canada’s boreal forest—A synthesis. Environ. Rev. 2013, 21, 260–292. [Google Scholar] [CrossRef] [Scilit]
  50. Food and Agriculture Organization of the United Nations (FAO). Global Forest Resources Assessment 2005; FAO Forestry Paper No. 147; FAO: Rome, Italy, 2006. [Google Scholar]
  51. Strassburg, B.B.N.; Kelly, A.; Balmford, A.; Davies, R.G.; Gibbs, H.K.; Lovett, A.; Miles, L.; Orme, C.D.L.; Price, J.; Turner, R.K.; et al. Global congruence of carbon storage and biodiversity in terrestrial ecosystems. Conserv. Lett. 2010, 3, 98–105. [Google Scholar] [CrossRef] [Scilit]
  52. Van Der Sande, M.T.; Poorter, L.; Kooistra, L.; Balvanera, P.; Thonicke, K.; Thompson, J.; Arets, E.J.M.M.; Garcia Alaniz, N.; Jones, L.; Mora, F.; et al. Biodiversity in species, traits, and structure determines carbon stocks and uptake in tropical forests. Biotropica 2017, 49, 593–603. [Google Scholar] [CrossRef] [Scilit]
  53. Duchesne, L.; Houle, D.; Ouimet, R.; Lambert, M.-C.; Logan, T. Aboveground carbon in Quebec forests: Stock quantification at the provincial scale and assessment of temperature, precipitation and edaphic properties effects on the potential stand-level stocking. PeerJ 2016, 4, e1767. [Google Scholar] [CrossRef] [Scilit]
  54. Thurner, M.; Beer, C.; Santoro, M.; Carvalhais, N.; Wutzler, T.; Schepaschenko, D.; Shvidenko, A.; Kompter, E.; Ahrens, B.; Levick, S.R.; et al. Carbon stock and density of northern boreal and temperate forests. Glob. Ecol. Biogeogr. 2014, 23, 297–310. [Google Scholar] [CrossRef] [Scilit]
  55. Quideau, S.; Norris, C.; Adesanya, T.; Carodenuto, S.; Diochon, A.; Karst, J.; Laganiere, J.; Poirier, V.; Simpson, M. Carbon under Canadian forests—Why soils matter. In Proceedings of the EGU General Assembly 2025, Vienna, Austria, 27 April–2 May 2025. [Google Scholar]
  56. Smyth, C.E.; Kurz, W.A.; Neilson, E.T.; Stinson, G. National-scale estimates of forest root biomass carbon stocks and associated carbon fluxes in Canada. Glob. Biogeochem. Cycles 2013, 27, 1262–1273. [Google Scholar] [CrossRef] [Scilit]
  57. Crockett, E.T.H.; Vennin, S.; Botzas-Coluni, J.; Larocque, G.; Bennett, E.M. Bright spots of carbon storage in temperate forests. J. Appl. Ecol. 2021, 58, 3012–3022. [Google Scholar] [CrossRef] [Scilit]
  58. Jobbágy, E.G.; Jackson, R.B. The vertical distribution of soil organic carbon and its relation to climate and vegetation. Ecol. Appl. 2000, 10, 423–436. [Google Scholar] [CrossRef]
  59. Callesen, I.; Liski, J.; Raulund-Rasmussen, K.; Olsson, M.T.; Tau-Strand, L.; Vesterdal, L.; Westman, C.J. Soil carbon stores in nordic well-drained forest soils—Relationships with climate and texture class. Glob. Change Biol. 2003, 9, 358–370. [Google Scholar] [CrossRef] [Scilit]
  60. Paré, D.; Banville, J.L.; Garneau, M.; Bergeron, Y. Soil carbon stocks and soil carbon quality in the upland portion of a boreal landscape, James Bay, Quebec. Ecosystems 2011, 14, 533–546. [Google Scholar] [CrossRef] [Scilit]
  61. Basile, M.; Storch, I.; Mikusiński, G. Abundance, species richness and diversity of forest bird assemblages—The relative importance of habitat structures and landscape context. Ecol. Indic. 2021, 133, 108402. [Google Scholar] [CrossRef] [Scilit]
  62. Charbonnier, Y.M.; Barbaro, L.; Barnagaud, J.-Y.; Ampoorter, E.; Nezan, J.; Verheyen, K.; Jactel, H. Bat and bird diversity along independent gradients of latitude and tree composition in European forests. Oecologia 2016, 182, 529–537. [Google Scholar] [CrossRef] [Scilit]
  63. Rigo, F.; Paniccia, C.; Anderle, M.; Chianucci, F.; Obojes, N.; Tappeiner, U.; Hilpold, A.; Mina, M. Relating forest structural characteristics to bat and bird diversity in the Italian Alps. For. Ecol. Manag. 2024, 554, 121673. [Google Scholar] [CrossRef] [Scilit]
  64. Di Cosmo, L.; Floris, A. Biodiversity and Protected Wooded Lands: Biodiversità e Protezione Delle Foreste. In Italian National Forest Inventory—Methods and Results of the Third Survey; Gasparini, P., Di Cosmo, L., Floris, A., De Laurentis, D., Eds.; Springer Tracts in Civil Engineering; Springer International Publishing: Cham, Switzerland, 2022; pp. 391–446. [Google Scholar]
  65. Barbaro, L.; Allan, E.; Ampoorter, E.; Castagneyrol, B.; Charbonnier, Y.; De Wandeler, H.; Kerbiriou, C.; Milligan, H.T.; Vialatte, A.; Carnol, M.; et al. Biotic predictors complement models of bat and bird responses to climate and tree diversity in European forests. Proc. R. Soc. B 2019, 286, 20182193. [Google Scholar] [CrossRef] [Scilit]
  66. Stokland, J.N.; Siitonen, J.; Jonsson, B.G. Biodiversity in Dead Wood; Ecology, Biodiversity and Conservation; Cambridge University Press: Cambridge, UK, 2012. [Google Scholar]
  67. Schaetzl, R.J.; Anderson, S. Soils: Genesis and Geomorphology, 1st ed.; Cambridge University Press: Cambridge, UK, 2005. [Google Scholar]
  68. Cotrufo, M.F.; Wallenstein, M.D.; Boot, C.M.; Denef, K.; Paul, E. The Microbial Efficiency-Matrix Stabilization (MEMS) framework integrates plant litter decomposition with soil organic matter stabilization: Do labile plant inputs form stable soil organic matter? Glob. Change Biol. 2013, 19, 988–995. [Google Scholar] [CrossRef] [Scilit]
  69. Ramola, G.C.; Rawat, N.; Singh, R.; Sajwan, A.S.; Sahu, L.; Rawat, P. Insects as ecological indicators: A review. Int. J. Environ. Clim. Change 2024, 14, 260–279. [Google Scholar] [CrossRef] [Scilit]
  70. Guilbert, E.; Affholder, O.; Montreuil, O.; Coutant, O.; Forget, P.-M. Human disturbance affects dung beetle assemblages in French Guiana forests. Diversity 2022, 14, 1059. [Google Scholar] [CrossRef] [Scilit]
  71. Haddad, N.M.; Tilman, D.; Haarstad, J.; Ritchie, M.; Knops, J.M.H. Contrasting effects of plant richness and composition on insect communities: A field experiment. Am. Nat. 2001, 158, 17–35. [Google Scholar] [CrossRef]
  72. Drake, E.C.; Gignoux-Wolfsohn, S.; Maslo, B. Systematic review of the roost-site characteristics of North American forest bats: Implications for conservation. Diversity 2020, 12, 76. [Google Scholar] [CrossRef] [Scilit]
  73. Schuldt, A.; Liu, X.; Buscot, F.; Bruelheide, H.; Erfmeier, A.; He, J.; Klein, A.; Ma, K.; Scherer-Lorenzen, M.; Schmid, B.; et al. Carbon–biodiversity relationships in a highly diverse subtropical forest. Glob. Change Biol. 2023, 29, 5321–5333. [Google Scholar] [CrossRef] [Scilit]
  74. Van De Perre, F.; Willig, M.R.; Presley, S.J.; Bapeamoni Andemwana, F.; Beeckman, H.; Boeckx, P.; Cooleman, S.; De Haan, M.; De Kesel, A.; Dessein, S.; et al. Reconciling biodiversity and carbon stock conservation in an Afrotropical forest landscape. Sci. Adv. 2018, 4, eaar6603. [Google Scholar] [CrossRef] [Scilit] [PubMed]
  75. Paillet, Y.; Archaux, F.; Du Puy, S.; Bouget, C.; Boulanger, V.; Debaive, N.; Gilg, O.; Gosselin, F.; Guilbert, E. The indicator side of tree microhabitats: A multi-taxon approach based on bats, birds and saproxylic beetles. J. Appl. Ecol. 2018, 55, 2147–2159. [Google Scholar] [CrossRef] [Scilit]
  76. Meramo, K.; Vasko, V.; Pietikäinen, T.-M.; Laine, V.N.; Ovaskainen, O.; Lilley, T.M. Tree-volume and forest age increase bat species diversity in boreal urban landscape. Landsc. Ecol. 2025, 40, 23. [Google Scholar] [CrossRef] [Scilit]
  77. Falcão, F.; Dodonov, P.; Caselli, C.B.; Dos Santos, J.S.; Faria, D. Landscape structure shapes activity levels and composition of aerial insectivorous bats at different spatial scales. Biodivers. Conserv. 2021, 30, 2545–2564. [Google Scholar] [CrossRef] [Scilit]
  78. Skalak, S.L. Patterns of Bat Activity and Effective Acoustic Sampling. Master’s Thesis, University of Regina, Regina, SK, Canada, 2010. [Google Scholar]
  79. Adams, A.W. Assessing and Analyzing Bat Activity with Acoustic Monitoring: Challenges and Interpretations. Ph.D. Thesis, The University of Western Ontario, London, ON, Canada, 2013. [Google Scholar]
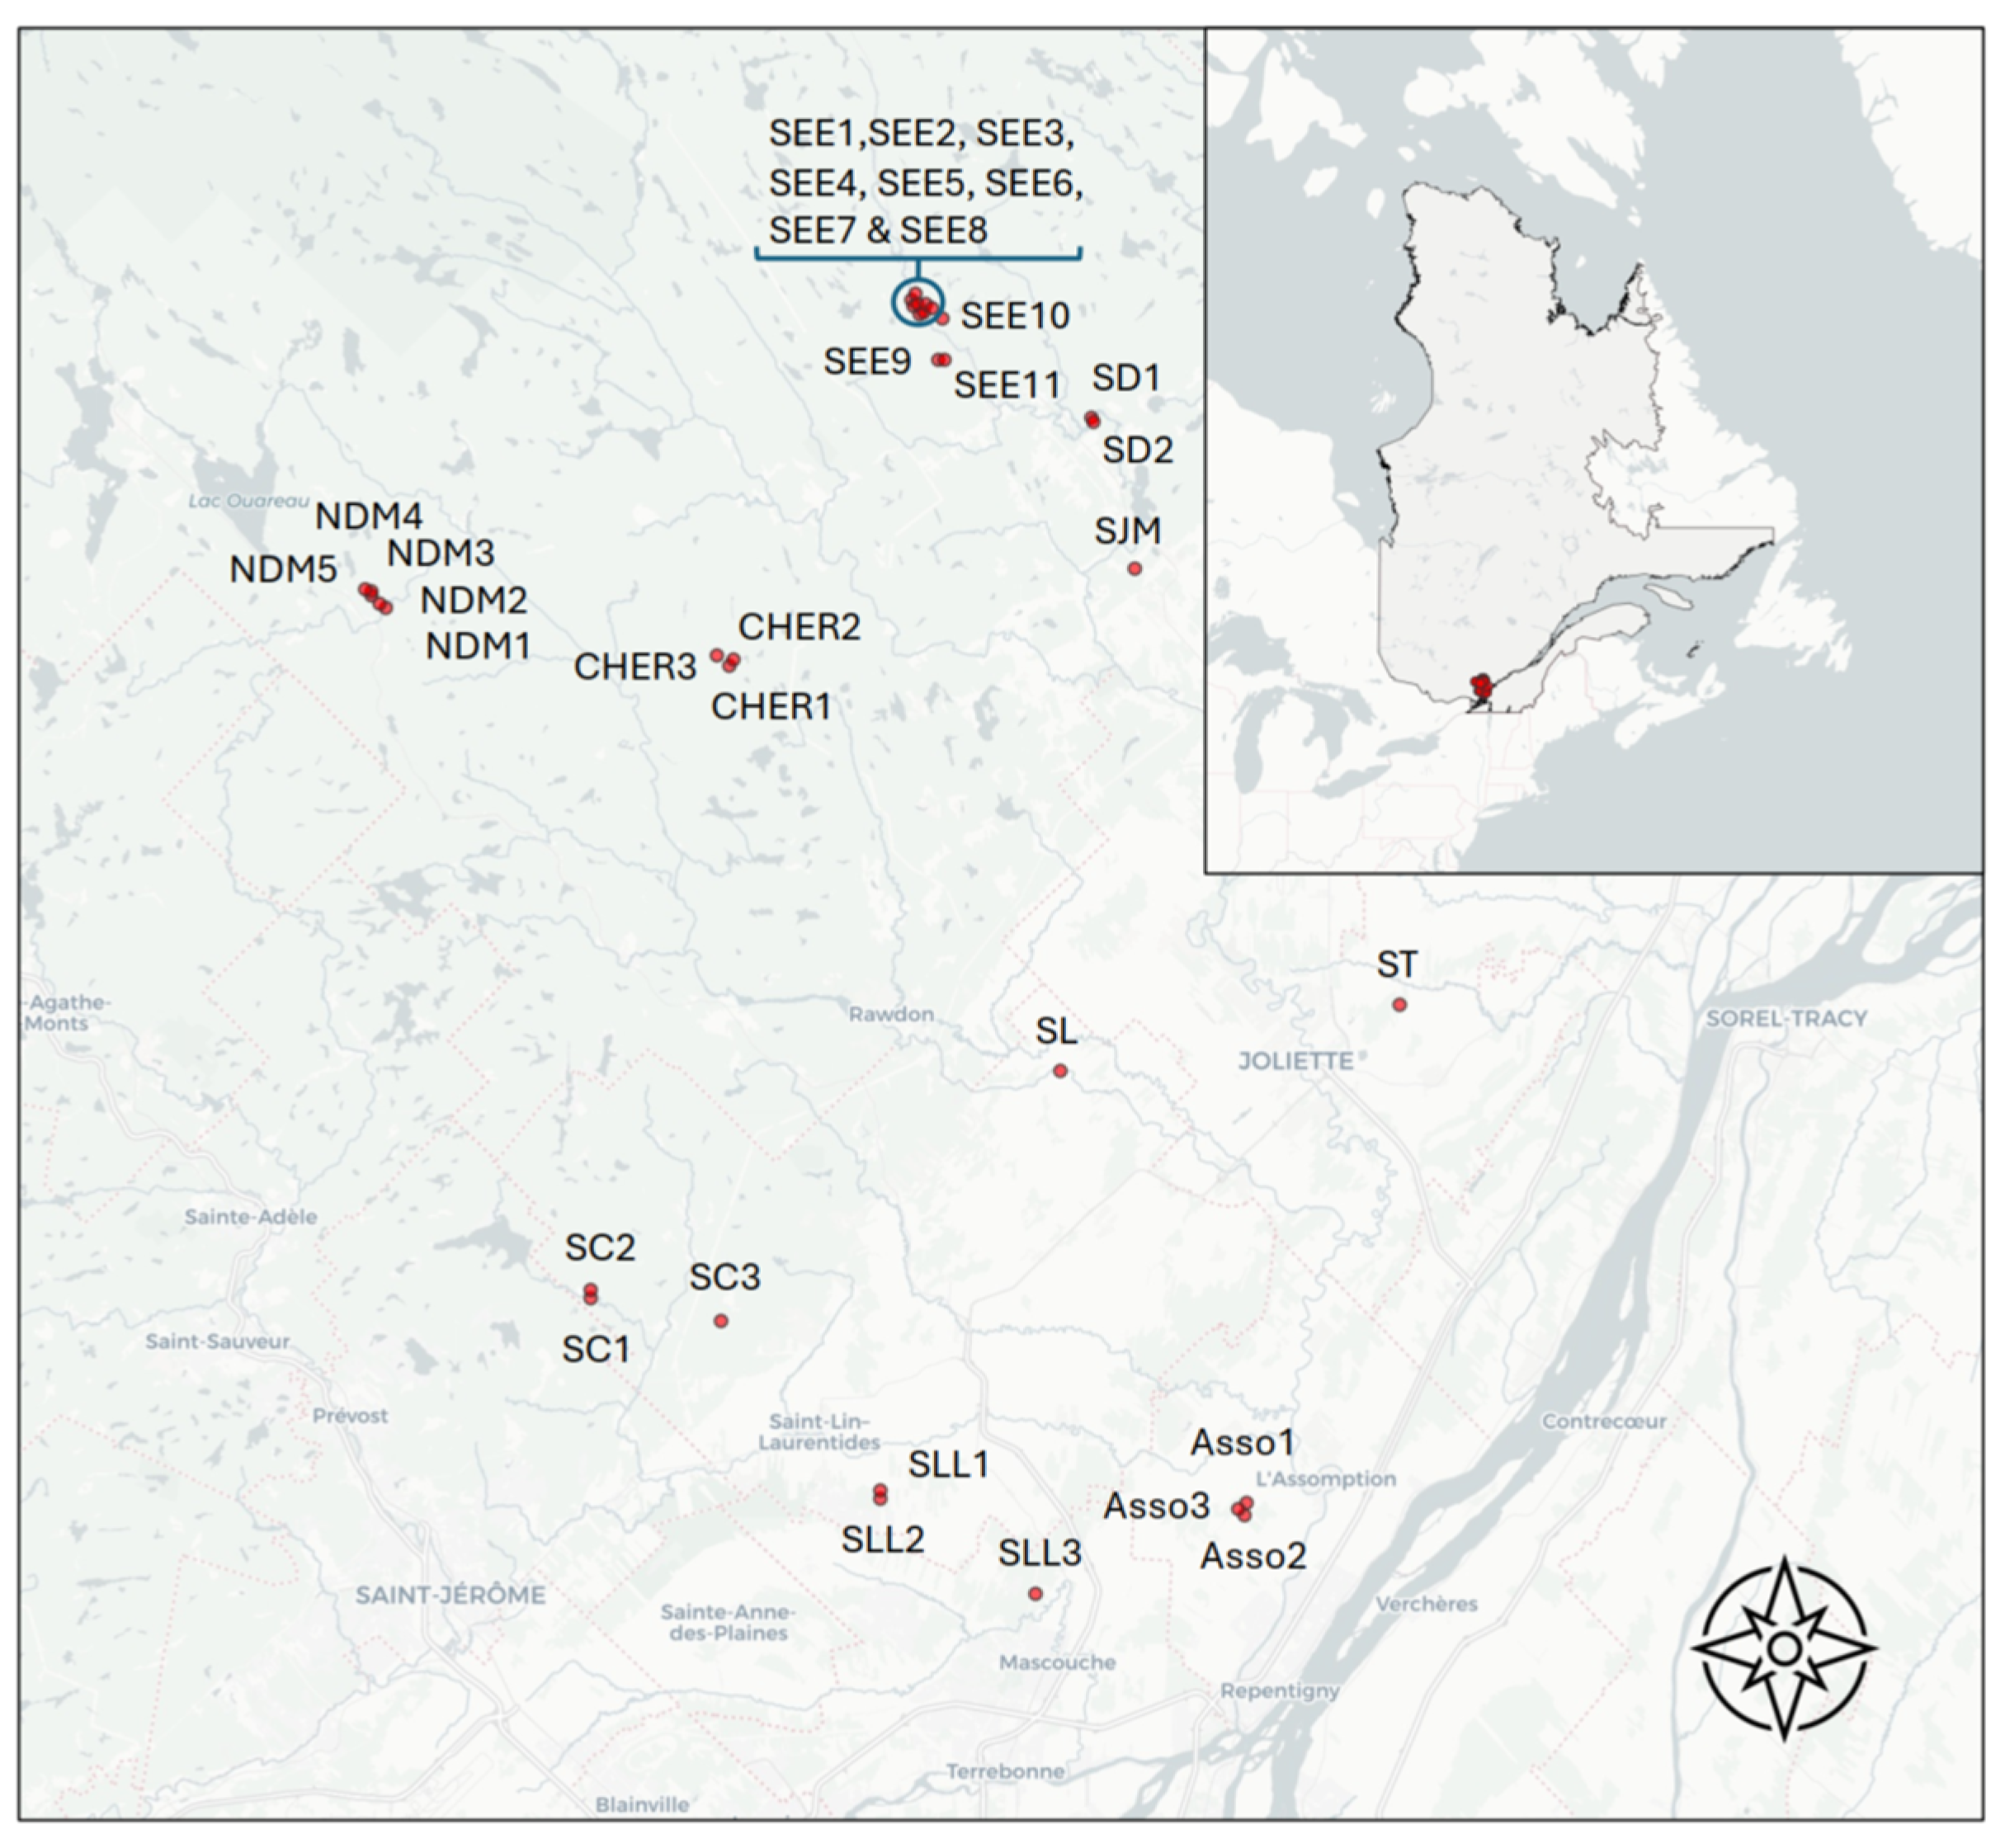
Figure 1. Geographic location and spatial distribution of the 10 protected forest sites and 33 sampling plots included in the study. SLL is Saint-Lin–Laurentides, SC is Saint-Calixte, ASSO is L’Assomption, SL is Saint-Liguori, SD is Saint-Damien, SEE is Sainte-Émilie-de-l’Énergie, NDM is Notre-Dame-de-la-Merci, ST is Saint-Thomas, SJM: Saint-Jean-de-Matha, and CHER is Chertsey.
Conservation 06 00026 g001
Figure 2. Carbon pools by compartment for each plot, with colored/dashed lines representing total ecosystem carbon pools reported for similar forest ecosystems (purple is [48], blue is [49], green is [50], and red is the mean from our study plots). See Figure 1 for plot details. “Mull, Moder, or Mor” encompasses all forest floor types.
Conservation 06 00026 g002
Figure 3. Whole-profile and horizon-level soil carbon pools in contrasting pedogenic environments across all study plots. Error bars represent the standard error of the mean of total soil carbon pools. ‘Mull, Moder, or Mor’ encompasses all forest floor types.
Conservation 06 00026 g003
Figure 4. Distribution of species richness across plots for each taxonomic group (i.e., insects, birds, and bats). Boxplots show the median (central line), interquartile range (IQR; box), and values within 1.5 × IQR (whiskers), with individual points representing observed richness values for each plot.
Conservation 06 00026 g004
Figure 5. Species richness models for insects (R2 = 0.91) and birds (R2 = 0.38). Residuals were fitted using a Poisson distribution. See Table 1 for detailed statistics.
Conservation 06 00026 g005
Figure 6. Tree carbon pools estimated for all 10 study sites compared to those estimated by Thurner et al. [54] for temperate broadleaf and mixed forests (gray area, mean 54.2 ± 21.4 Mg C ha−1) as well as temperate coniferous forests (pink area, mean 64.2 ± 20.7 Mg C ha−1). The red dashed line represents the mean tree carbon pool across our study sites (87.86 ± 15.83 Mg C ha−1). Error bars represent the standard error of the mean of total soil carbon pools at each site. See Figure 1 for site details and number of plots per site.
Conservation 06 00026 g006
Table 1. Best models for species richness of insects and birds. Residuals were fitted using a Poisson distribution. All predictors are significant at p < 0.05). AIC: Akaike’s Information Criterion.
Taxonomic GroupModelEstimate (β)p ValueAICR2
InsectsY ~ Shrubs and woody plants binary variable at 25%−0.45600.0002152.700.91
Humid 1, Dry 0, Mesic 0.5−0.47500.0043
Carbon in mineral soil horizons−0.02450.0021
Soil carbon/above-ground carbon ratio+0.07030.0067
Logarithm of distance to linear infrastructure+0.44370.0041
BirdsY ~ Herbaceous+0.01030.0150149.910.38
Total wetlands+0.00990.0203
Table 2. Comparison of species richness models for insects and birds based on botanical composition and forest structure, carbon storage, and land use predictors. Residuals were fitted using a Poisson distribution. All predictors are significant at p < 0.05, except a few marginally significant ones (p < 0.1) shown in italics. AIC: Akaike’s Information Criterion.
Taxonomic GroupModelEstimate (β)p ValueAICR2
Botanical composition
InsectsY ~ Trees variable number at 25%−0.18560.0307176.500.77
Shrubs and woody plants binary variable at 25%−0.48430.0002
Specific tree species richness−0.14740.0007
Specific herbaceous, forage, and lycopod species richness0.02290.0876
Humid 1, Dry 0, Mesic 0.5−0.48450.0005
BirdsY ~ Herbaceous+0.01030.0062165.360.33
Tree/shrub ratio0.03230.0766
Carbon storage
InsectsY ~ Carbon in mineral soil horizons−0.02040.0046177.180.73
Small trees+0.03100.0142
Soil carbon/above-ground carbon ratio+0.1265<0.0001
BirdsY ~ Carbon in forest floors−0.01060.0209170.940.15
Land use
InsectsY ~ Logarithm of distance to linear infrastructure+0.6771<0.0001184.630.59
BirdsY ~ Total wetlands+0.01230.0030153.450.25
Disclaimer/Publisher’s Note: The statements, opinions and data contained in all publications are solely those of the individual author(s) and contributor(s) and not of MDPI and/or the editor(s). MDPI and/or the editor(s) disclaim responsibility for any injury to people or property resulting from any ideas, methods, instructions or products referred to in the content.