Article

Exploring the Potential Role of the TETRATRICOPEPTIDE THIOREDOXIN-LIKE Gene Family in Nitrogen-Fixing and Water-Restricted Soybean Plants


by
Maria Martha Sainz
1,*,
Carla Valeria Filippi
1,
Selene Píriz-Pezzutto
1,
Guillermo Eastman
2,
José Sotelo-Silveira
2,3,
Omar Borsani
1 and
Mariana Sotelo-Silveira
1,*
1
Laboratorio de Bioquímica, Departamento de Biología Vegetal, Facultad de Agronomía, Universidad de la República, Avenida Garzón 780, Montevideo CP 12900, Uruguay
2
Departamento de Genómica, Instituto de Investigaciones Biológicas Clemente Estable, Ministerio de Educación y Cultura, Av. Italia 3318, Montevideo CP 11600, Uruguay
3
Departamento de Biología Celular y Molecular, Facultad de Ciencias, Universidad de la República, Iguá 4225, Montevideo CP 11400, Uruguay
*
Authors to whom correspondence should be addressed.
Stresses 2026, 6(3), 69; https://doi.org/10.3390/stresses6030069
Submission received: 6 August 2026 / Revised: 8 September 2026 / Accepted: 15 September 2026 / Published: 18 September 2026
(This article belongs to the Section Plant and Photoautotrophic Stresses)

Abstract

The TETRATRICOPEPTIDE THIOREDOXIN-LIKE (TTL) proteins are a plant-specific family proposed to function as peripheral membrane proteins that contribute to abiotic stress tolerance in Arabidopsis, likely by maintaining cell wall integrity through brassinosteroid signaling. In previous work of our group, we identified a GmTTL gene that showed differential abundance in the polysome-associated RNA (PAR) fraction in nitrogen-fixing soybean plants under water restriction (WR). This finding, together with the lack of knowledge about this gene family in soybean, prompted us to perform a genome-wide characterization of this family. In this work, using the Glycine max v4.0 proteome, we identified ten homologs (GmTTL1–GmTTL10) distributed across five chromosomes. Phylogenetic and structural analyses grouped these genes into three clades and revealed a highly conserved exon–intron organization, as well as conserved numbers and arrangements of TPR and TRXL motifs. Moreover, to investigate their potential biological functions, we reanalyzed by STRING the co-expression module enriched with 367 downregulated genes at the PAR level to which GmTTL7 belong. Interestingly, the protein–protein interaction (PPI) network analysis showed the over-representation of Gene Ontology (GO) terms associated with “cellular anatomical entity”, “membrane”, “cell periphery”, “cell wall modification”, “cell wall organization or biogenesis”, and “nitrate assimilation”. Notably, the PPI network revealed a novel predicted functional association between GmTTL and two nitrate reductase enzymes in nitrogen-fixing plants subjected to WR. This study provides a framework for future functional studies of GmTTL proteins and their contribution to abiotic stress adaptation in soybean.

1. Introduction

The TETRATRICOPEPTIDE THIOREDOXIN-LIKE (TTL) gene family was first described in Arabidopsis thaliana (Arabidopsis). Their proteins are characterized by the presence of six tetratricopeptide repeats (TPR) in conserved positions and a non-functional thioredoxin-like domain in the carboxyl-terminal region, which shows homology to thioredoxins but lacks the essential cysteine residues required for thioredoxin activity [1,2]. The Arabidopsis TTL gene family comprises four members, including the first characterized member, TTL1, whose mutation causes root swelling and root growth arrest under NaCl and osmotic stress [1,2]. Furthermore, TTL1 was described to contribute to anisotropic root growth during osmotic stress adaptation and maintain cell wall integrity through a genetic interaction with Cellulose synthase 6 (CESA6) [3]. Thanks to the presence of the TPR motifs, TTL proteins likely mediate the assembly of multiprotein complexes. Studies conducted with TTL3 showed that this protein interacts with a constitutively active BRASSINOSTEROID INSENSITIVE1 (BRI1) receptor kinase, BRI1-SUPPRESSOR1 phosphatase, and the BRASSINAZOLE RESISTANT1 transcription factor to optimize signal transduction in Arabidopsis [4]; TTL3 also interacts with microtubules and may link cytoskeletal function to the brassinosteroid signaling pathway [5]. Additionally, TTL3 interacts with cellulose synthases, which modulate stress tolerance [6]. Moreover, the TTL3 gene has been identified as being related to lateral root emergence and development [5].
This family of proteins is characteristic of land plants, as confirmed by extensive investigations across a variety of sequenced genomes. These proteins were not identified in animals or microorganisms but are present in all plant genomes analyzed, including those of Physcomitrella patens and Selaginella moellendorffii. Notably, they are absent in algae [2].
In recent studies conducted by our group, which aimed to analyze the differential responses of roots of nodulated (N-fix) soybean plants to water restriction (WR) at the transcriptional and translational levels, we identified a soybean GmTTL gene that showed differential abundance in the polysome-associated RNA (PAR) fraction [7,8]. Translational control has proven important in plants exposed to environmental stresses like WR [9,10], which is logical because this stage of gene expression regulation provides plants, and organisms in general, with flexibility and adaptability. It does not require new messenger RNA (mRNA) synthesis but instead depends on how efficiently existing mRNAs are translated [11,12]. Consequently, the analysis of the translatome—the subset of mRNAs that are being translated—enables more precise and comprehensive measurement of cell gene expression than analyzing only steady-state mRNA levels—the transcriptome [13].
Cultivated soybean is a globally important crop that serves as the primary source of protein and oil for human and animal consumption and is increasingly becoming a key biodiesel crop [14]. Although there is extensive information regarding the response mechanisms of soybean to WR, most of these studies have been conducted on non-nodulated fertilized (N-fed) plants, even though producers mainly rely on the plant’s high capacity for symbiotic nitrogen fixation [15]. Therefore, analyzing the response of N-fix plants to WR appears to be more suitable, especially considering that it is known to differ from that of N-fed plants [7,8,16,17,18].
In this context, considering the previously characterized role of Arabidopsis AtTTLs mentioned above, the TTL family remains poorly characterized in legumes and, particularly, has not been systematically characterized in soybean. Therefore, its composition, evolutionary relationships, and potential functional diversification in soybean remain largely unknown. We were therefore interested in identifying the GmTTL family members and conducting an initial classification in soybean. We identified ten TTL (TETRATRICOPEPTIDE THIOREDOXIN-LIKE) homologs from the Glycine max v4.0 proteome, which we arbitrarily named GmTTL1–GmTTL10. These homologs showed an uneven chromosomal distribution across five chromosomes. Phylogenetic and structural analyses revealed their division into three clades and the conservation of their gene structure. The GmTTL proteins showed conservation in the number and position of the TPR and TRXL motifs. Pairwise sequence comparison of the promoter regions of the GmTTLs showed 24% to 52% identity among all GmTTLs. The promoter sequence similarity pattern showed qualitative concordance with the clustering of the expression patterns of the GmTTLs.
Through gene co-expression and differential expression analysis, we identified a co-expression module enriched with downregulated differentially expressed genes (DEGs) at the PAR level in N-fix plants exposed to WR. One of these downregulated DEGs was a GmTTL gene. By constructing a protein–protein interaction (PPI) network from this specific subset of DEGs, we uncovered novel, biologically interesting associations regarding the role of this gene family in nodulated soybean roots subjected to WR. These findings provide a framework for future functional studies aimed at elucidating the contribution of GmTTL proteins to abiotic stress adaptation in soybean. Given that, to the best of our knowledge, GmTTL proteins have not yet been functionally characterized in legume species, our results provide a basis for future experimental studies to validate the predicted roles and associations identified.

2. Results

2.1. TTL Family Member Identification and Initial Characterization in Soybean

A proteome-wide analysis identified a broad set of 302 TPR-containing proteins in soybean (Table S1); the majority of them (234) have one to three TPR motifs, whereas the rest display between four to 13 TPR motifs (Table S1). Previously, we have identified a total of 125 soybean proteins containing Trx motifs [7].
The TTL proteins constitute a family specific to land plants that was first described in Arabidopsis for having six TPR domains located in specific positions throughout the sequence and a thioredoxin-like (TRXL) motif located in the C-terminal end of the sequence [1,19,20], which lacks an essential cysteine required for reducing activity [1,19].
Domain-based screening of the Glycine max v4.0 proteome followed by inspection of the characteristic TTL domain architecture resulted in a final set of ten GmTTL candidates, corresponding to ten distinct gene loci, which were retained for downstream analyses (Table S2). For convenience, these proteins were named GmTTL1 to GmTTL10 according to the order of their NCBI protein identifiers. This nomenclature is operational and does not imply one-to-one orthology with Arabidopsis TTL1–TTL4. GmTTL homolog lengths ranged from 584 (GmTTL6) to 703 (GmTTL7) amino acids. Accordingly, their molecular weights ranged from 63.9 kDa (GmTTL6) to 78.7 kDa (GmTTL7). The predicted values for the isoelectric point (pI) varied from 8.8 (GmTTL2 and GmTTL5) to 9.5 (GmTTL8) (Table S3). Regarding subcellular localization, all GmTTL homologs are predicted to be localized in the nucleus, in contrast to the cytoplasmic localization reported in Arabidopsis for these proteins [2,6].
By mapping the 10 GmTTL homologs on the Glycine max chromosomes, we observed that their physical locations are distributed across five chromosomes: GmTTL1 on chromosome 4, GmTTL2 and GmTTL3 on chromosome 6, GmTTL4, GmTTL9, and GmTTL10 on chromosome 12, GmTTL5, GmTTL6, and GmTTL7 on chromosome 13, and GmTTL8 on chromosome 14 (Table S2).

2.2. Phylogenetic, Gene Structure, and Conserved Motif Analyses of the GmTTL Gene Family

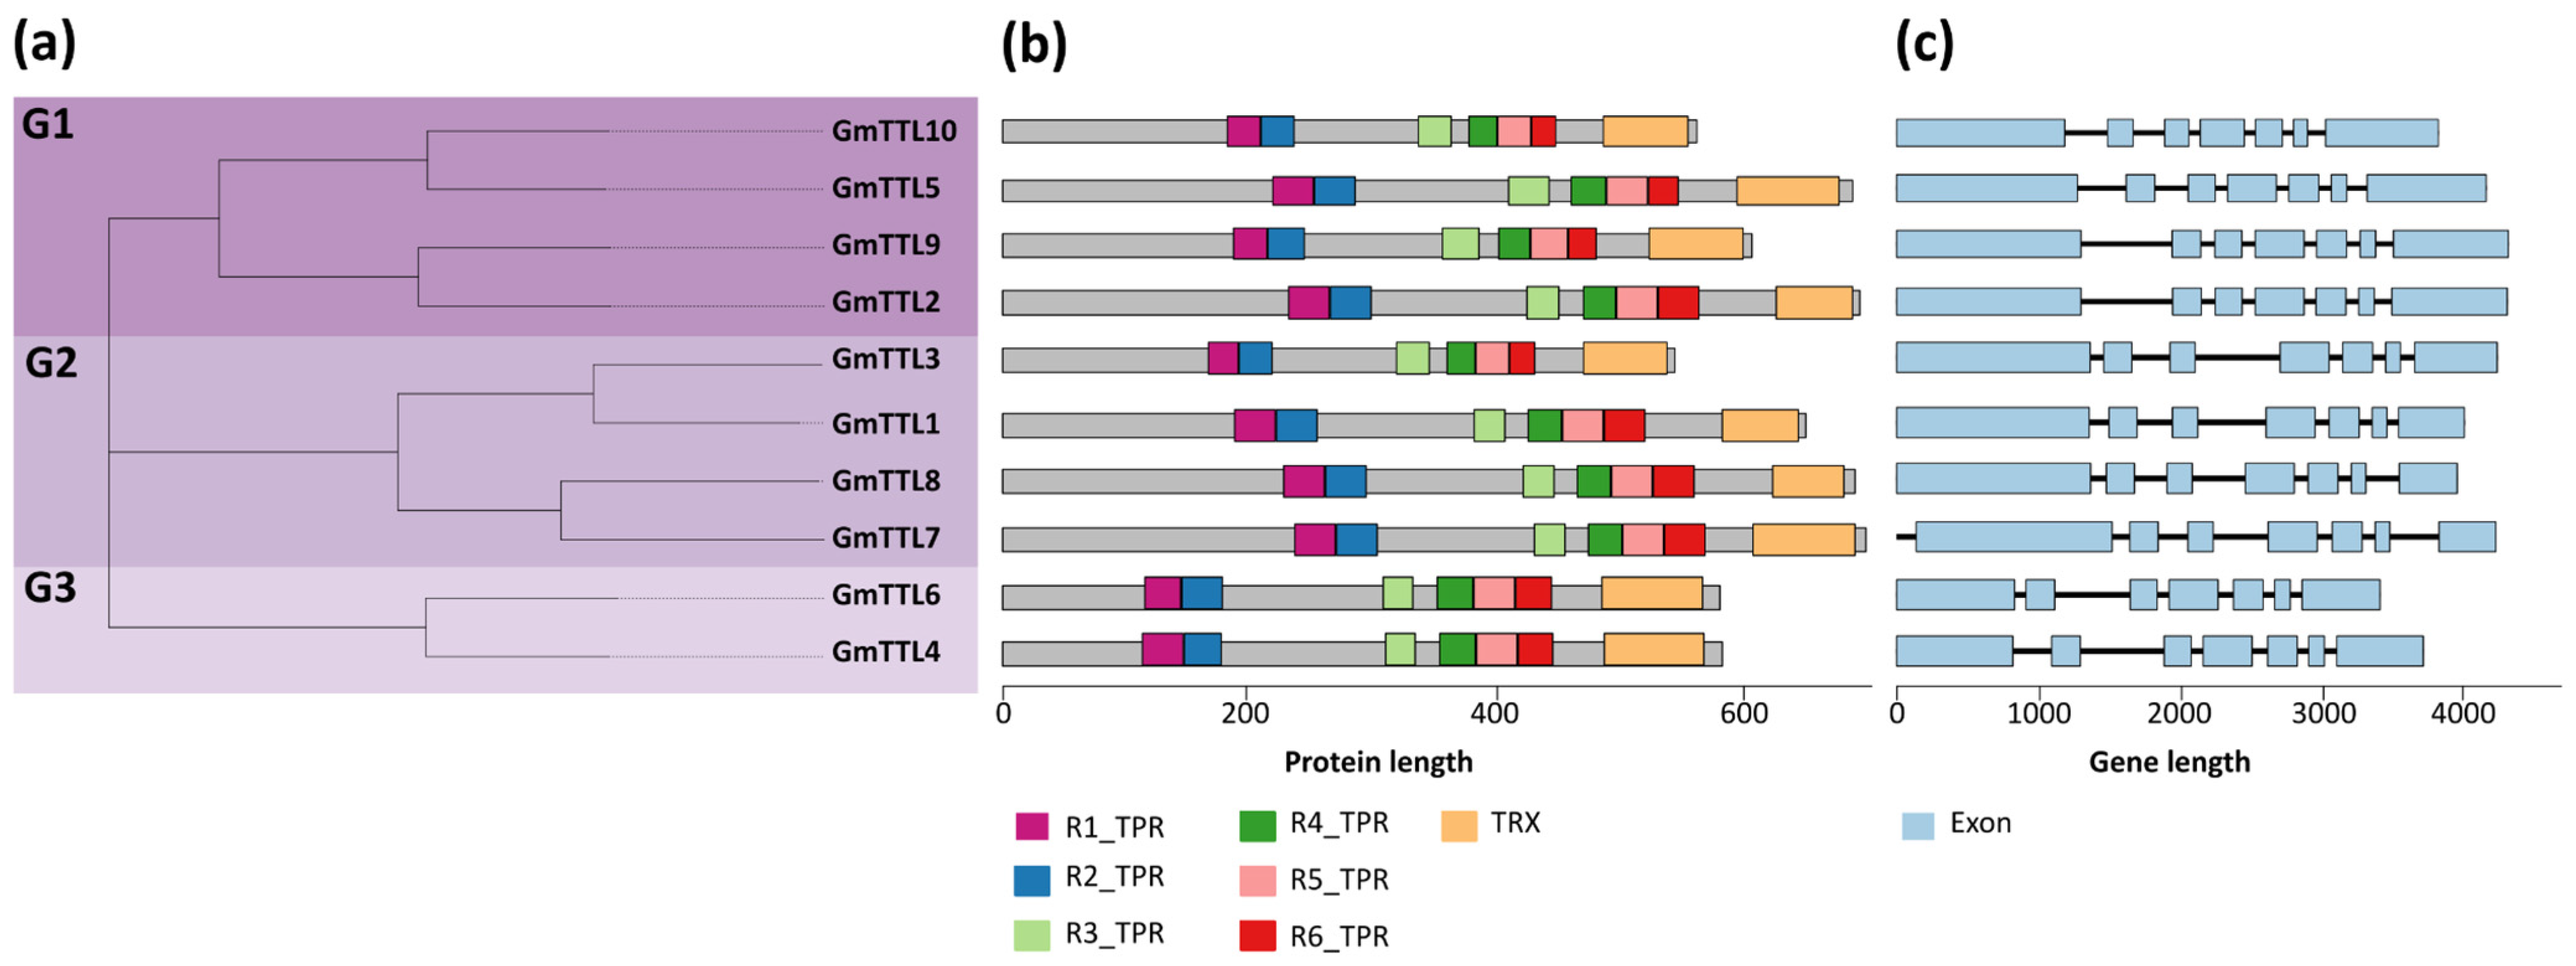
The neighbor-joining analysis grouped the GmTTL proteins into three subgroups (Figure 1a, bootstrap-supported reconstruction in Figure S2). Subgroups G1 and G2 consisted of four GmTTL members, whereas subgroup G3 contained 2 GmTTL members. The GmTTL proteins showed conservation in the number and position of the TPR and TRXL motifs (Figure 1b). The coordinates of the predicted TPR motifs are provided in Supplementary Table S1.
The length of the GmTTL genes ranged from 3285 bp (GmTTL6) to 4156 bp (GmTTL9) (Supplementary Table S1). The analysis of the exon–intron structures of GmTTL genes revealed that all members contained seven exons (Figure 1c), ranging in size from 100 bp to 1330 bp. Curiously, the fourth exon is of the same length in all the genes of the family.
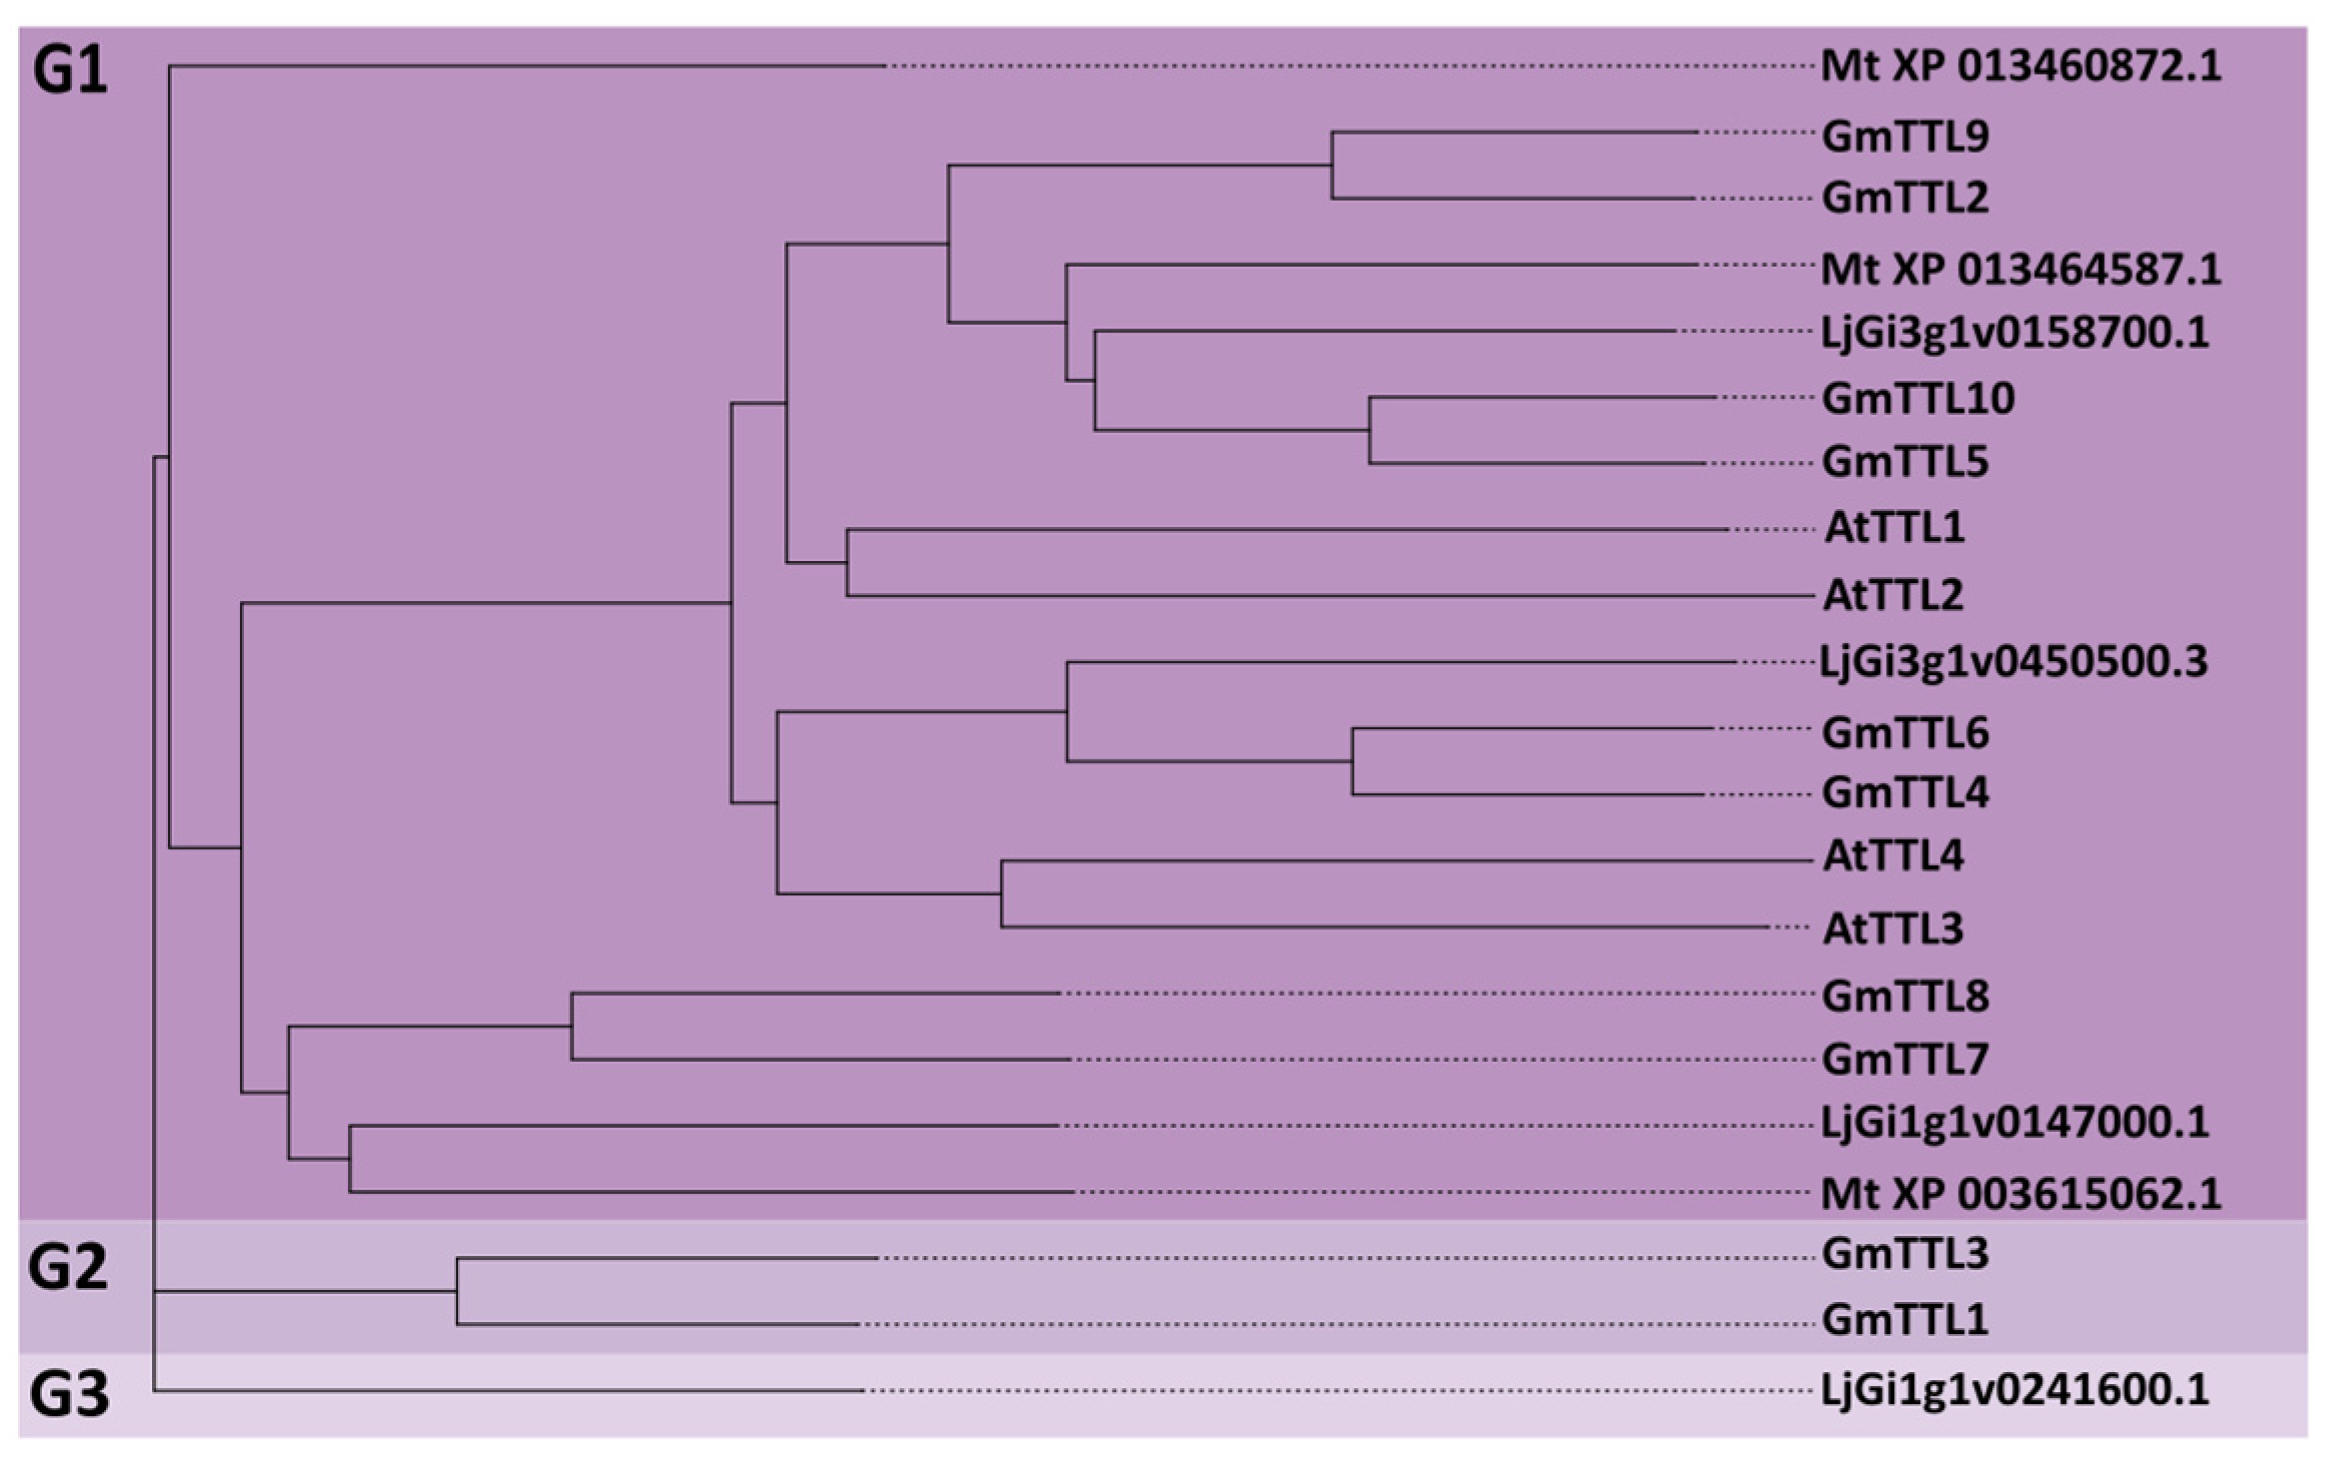
A phylogenetic analysis of all TTL proteins from Arabidopsis thaliana, Lotus japonicus, and Medicago truncatula also revealed that GmTTL proteins form three groups (Figure 2). The largest group (G1) included eight of the 10 GmTTLs that grouped with AtTTL1 and AtTTL2 of Arabidopsis, and the majority of TTL proteins of Lotus japonicus and Medicago truncatula. G2 contained GmTTL3 and GmTTL1, whereas G3 included only one TTL protein from Lotus japonicus, LjGi1g1v0241600.1.
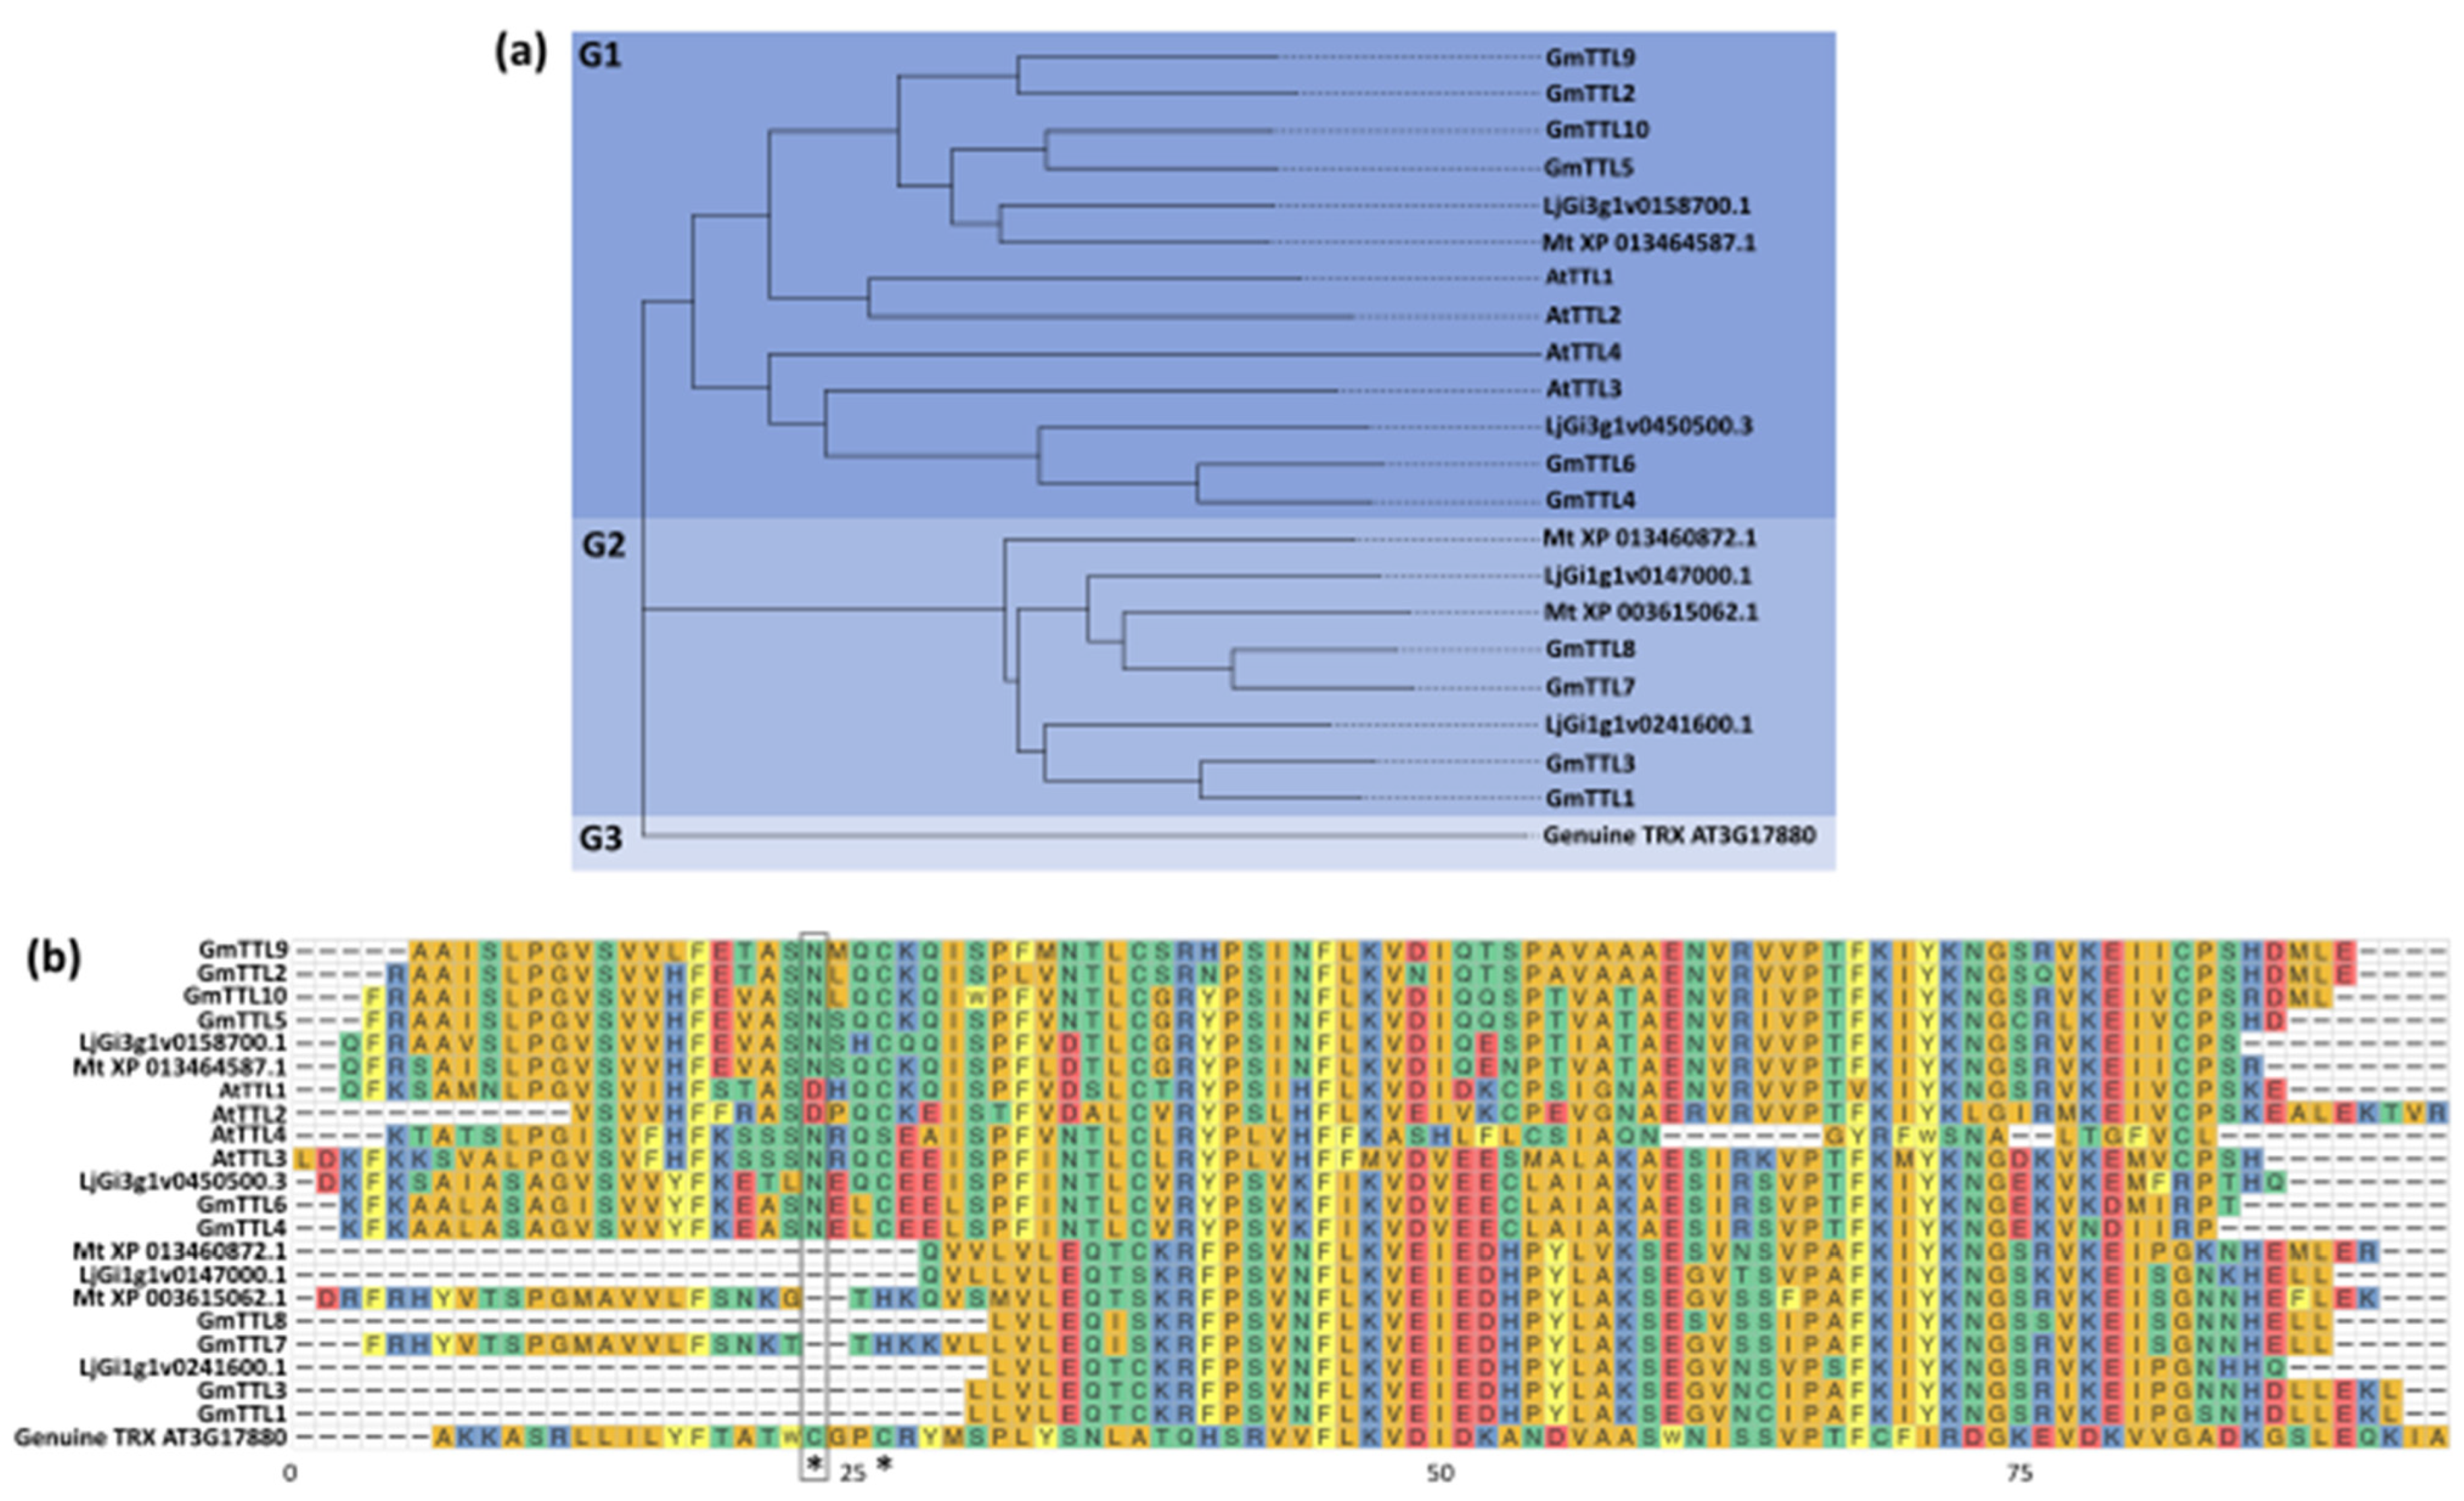
The phylogenetic analysis using the TRXL sequences showed the formation of three groups, G1, which includes all the AtTTLs together with six GmTTL proteins (GmTTL4, GmTTL6, GmTTL5, GmTTL10, GmTTL2, and GmTTL9), and G2, which includes four GmTTL (GmTTL1, GmTTL3, GmTTL7, and GmTTL8) that were more similar to the TTLs from Medicago truncatula and Lotus japonicus, and G3 containing the genuine thioredoxin. The alignment of the TRXL domains showed that none of the GmTTL proteins contain the consensus sequence required for thioredoxin activity (Figure 3).
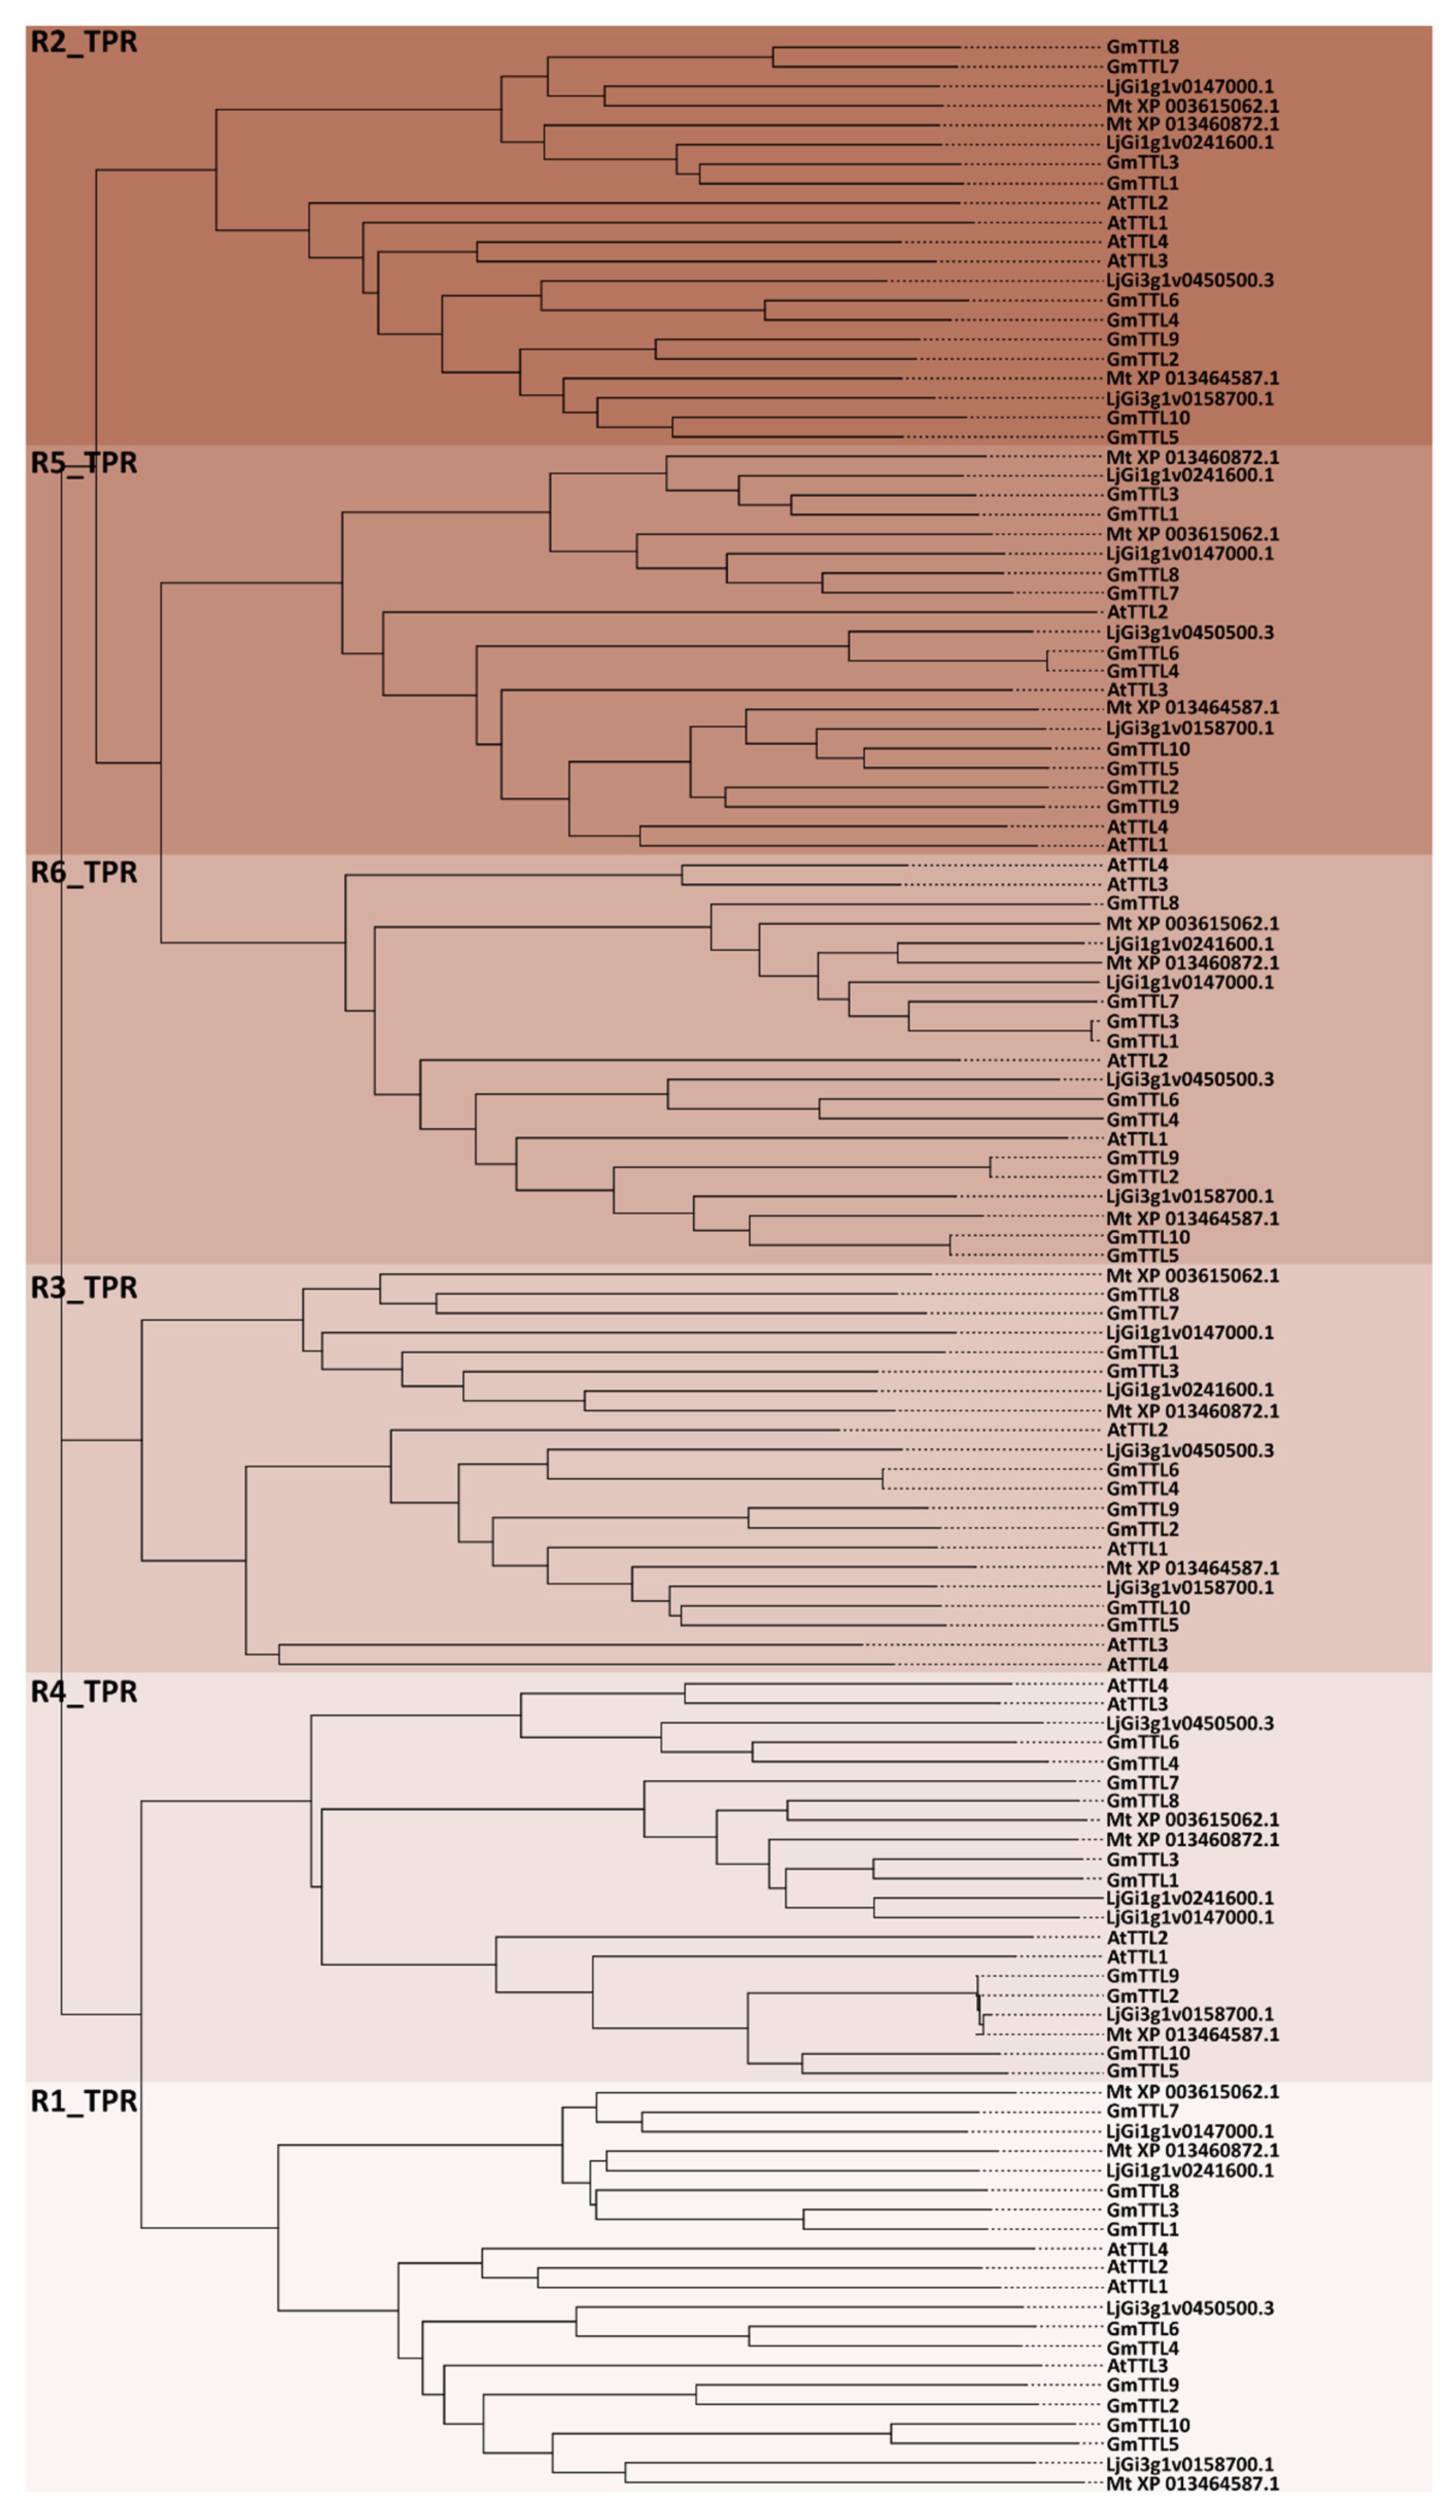
As the TPRs motives in GmTTLs are located in similar positions in all the proteins, we performed the alignment of the six TPR motifs (R1_TPR to R6_TPR) between the proteins of Arabidopsis, soybean, Medicago truncatula, and Lotus japonicus. We confirmed that TPRs in the same position were more closely related to each other in other species than to other TPR motifs within the same GmTTL protein ([2]; Figure 4). Figure 4 shows how R1_TPR from GmTTL1 is more related to R1_TPR from Lotus japonicus than to other TPRs within GmTTL1.

2.3. Analysis of Upstream Regions and Cis-Regulatory Elements (CREs) for GmTTL and Its Expression Patterns

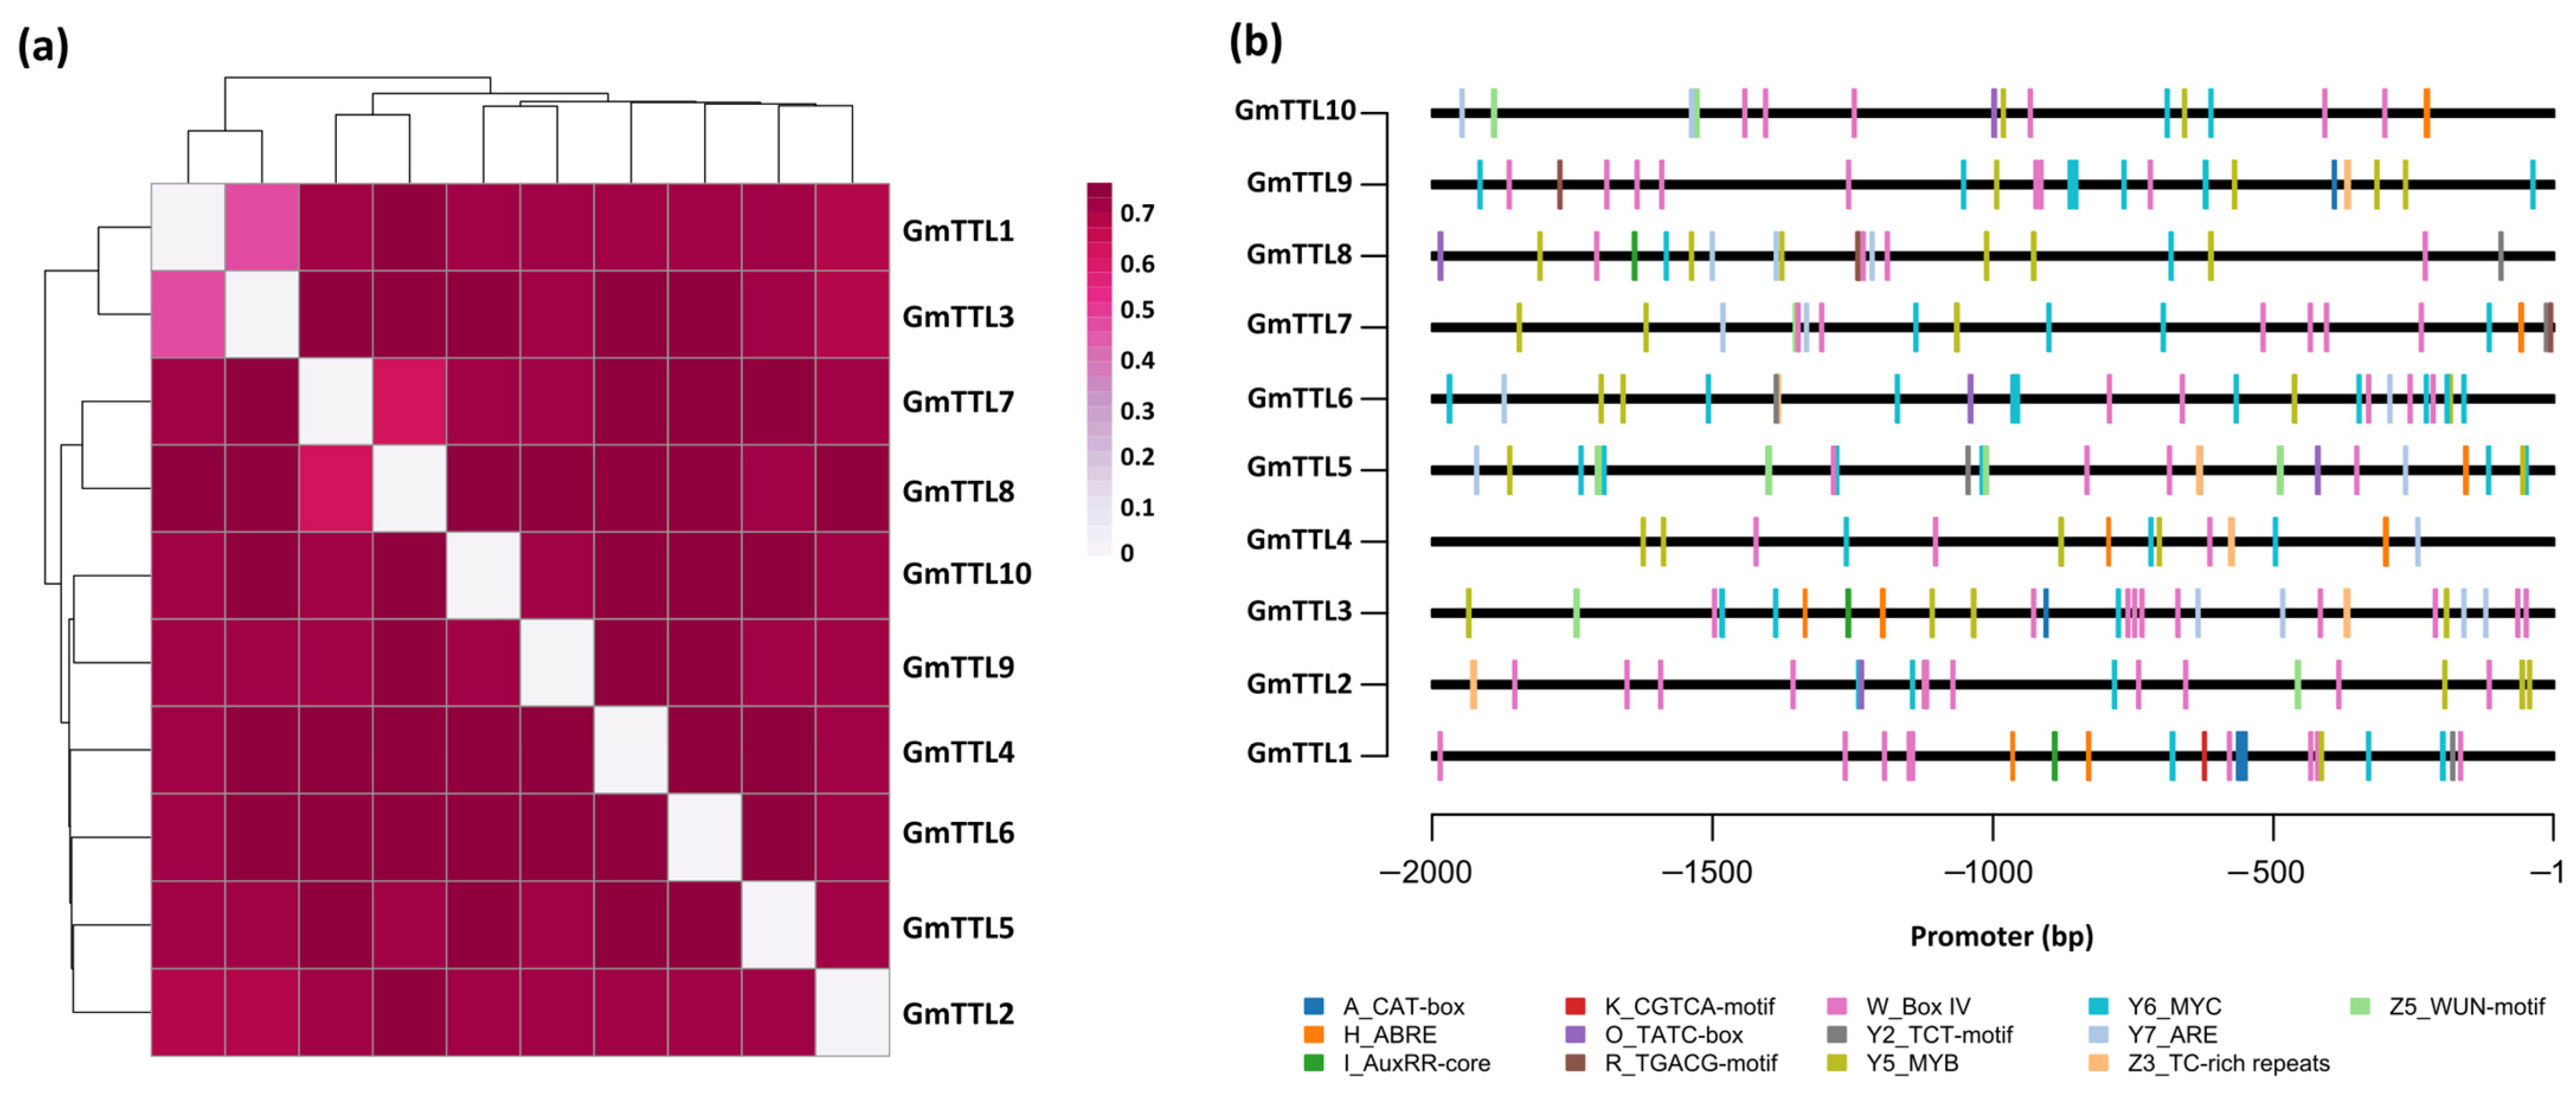
We performed a pairwise sequence comparison between the promoter regions of the GmTTLs using 2000 bp upstream of the TSS. The analysis showed a range of 24% to 52% identity between the promoters of all GmTTLs (Figure 5a). The promoter sequences of GmTTL1 and GmTTL3 were the most similar (52% of identity; Figure 5a), and the promoter sequences of GmTTL6 and GmTTL10 were the least similar (24% of identity; Figure 5a). Interestingly, the majority of the promoters formed the same pairs as the protein sequences (Figure 1a); however, the promoters from GmTTL2, GmTTL5, GmTTL9, and GmTTL10 formed different pairs (Figure 1a and Figure 5). We then investigated the transcript accumulation of the GmTTLs in soybean tissues from publicly available RNA-Seq data in Phytozome (https://phytozome.jgi.doe.gov/pz/portal.html; accessed on 6 September 2026) [21]. The heatmap expression analysis of the entire family of GmTTLs genes (Figure S1) separated into two clusters, one that includes GmTTL1, GmTTL3, GmTTL4, GmTTL6, GmTTL7, and GmTTL8; and the other that contains GmTTL2, GmTTL5, GmTTL9, and GmTTL10. The first cluster is characterized by having genes with low levels of expression in seeds, leaves, shoots, root tip, and flowers. However, the second cluster is characterized by genes with high expression in seeds, leaves, shoots, root tip, and flowers. Interestingly, some closely related genes based on the amino acid sequence showed similar expression patterns, as can clearly be seen for GmTTL1 and GmTTL3, which both show high levels of expression in nodules, roots, and roots treated with urea, ammonium, and nitrate; but low levels in seeds, leaves, shoots, root tip, and flowers (Figure S1). The clustering of the expression pattern of GmTTLs genes showed qualitative similarity to the grouping of the promoters by their sequence similarity (Figure 5 and Figure S1).
We investigated the potential regulatory mechanisms of GmTTL genes by analyzing cis-regulatory elements within 2000 base pairs upstream of the transcription start site (TSS). We classified the identified cis-acting elements by their predicted response types (Figure 5b). In addition to common cis-acting elements, such as the enhancer element CAAT-box and the core promoter element TATA-box, stress-responsive elements were the most abundant. Notably, we detected WUN motifs in seven of 10 putative promoter regions, TC-rich repeats present in around seven of 10 GmTTL, MYB-binding site involved in drought inducibility (MBS) present in 10 of the GmTTL’s putative promoters, and the anaerobic induction ARE motif present in eight of the 10 GmTTL’s putative promoters. Some CREs were involved in light responsiveness, such as Box IV, which was present in 100% of the GmTTL putative promoters. Moreover, we detected hormone-related cis-acting elements, including the MeJA-responsive element (TGACG motif and CGTCA motif), the ABA-responsive element (ABRE) present in six of 10 putative promoters, and the AuxRR core involved in auxin responsiveness was present in three of 10 putative promoter regions. Similar cis-regulatory elements were found in the AtTTLs promoter regions (Table S6) supported with experimental evidence [2,3]. These predictions indicate that the GmTTLs promoter regions contain putative cis-regulatory elements associated with light, abiotic stress, and hormone responses, although their functional activity remains to be experimentally validated.

2.4. Identification of the Differentially Expressed GmTTL Genes in N-Fixing and Water-Restricted Plants

The RNA-Seq data—from TOTAL and PAR fractions—used in this study were obtained from previous research in our lab, where a nodulation and WR experiment was conducted in soybean [7,8]. The experiment included four combined treatments: nodulated water-restricted plants (N + WR), nodulated well-watered plants (N + WW), non-nodulated water-restricted plants (NN + WR), and non-nodulated well-watered plants (NN + WW). These treatments allow for different comparisons. The two comparisons analyzed here highlight the differential response of N-fix and water-restricted plants: (i) N + WR vs. N + WW and (ii) N + WR vs. NN + WR. The first comparison illustrates the response of nodulated plants to WR, while the second highlights their distinct response compared to non-nodulated plants under the same conditions. It is important to note that this last comparison (ii) involves two variables related to nitrogen supply—nitrate availability and rhizobial inoculation—which may complicate the interpretation of the results and should therefore be considered a limitation of the study. Furthermore, because we analyzed both TOTAL and PAR RNA fractions, the plant responses to WR in the two possible nodulation conditions were further categorized based on their transcriptional, translational, or combined transcriptional and translational regulation.
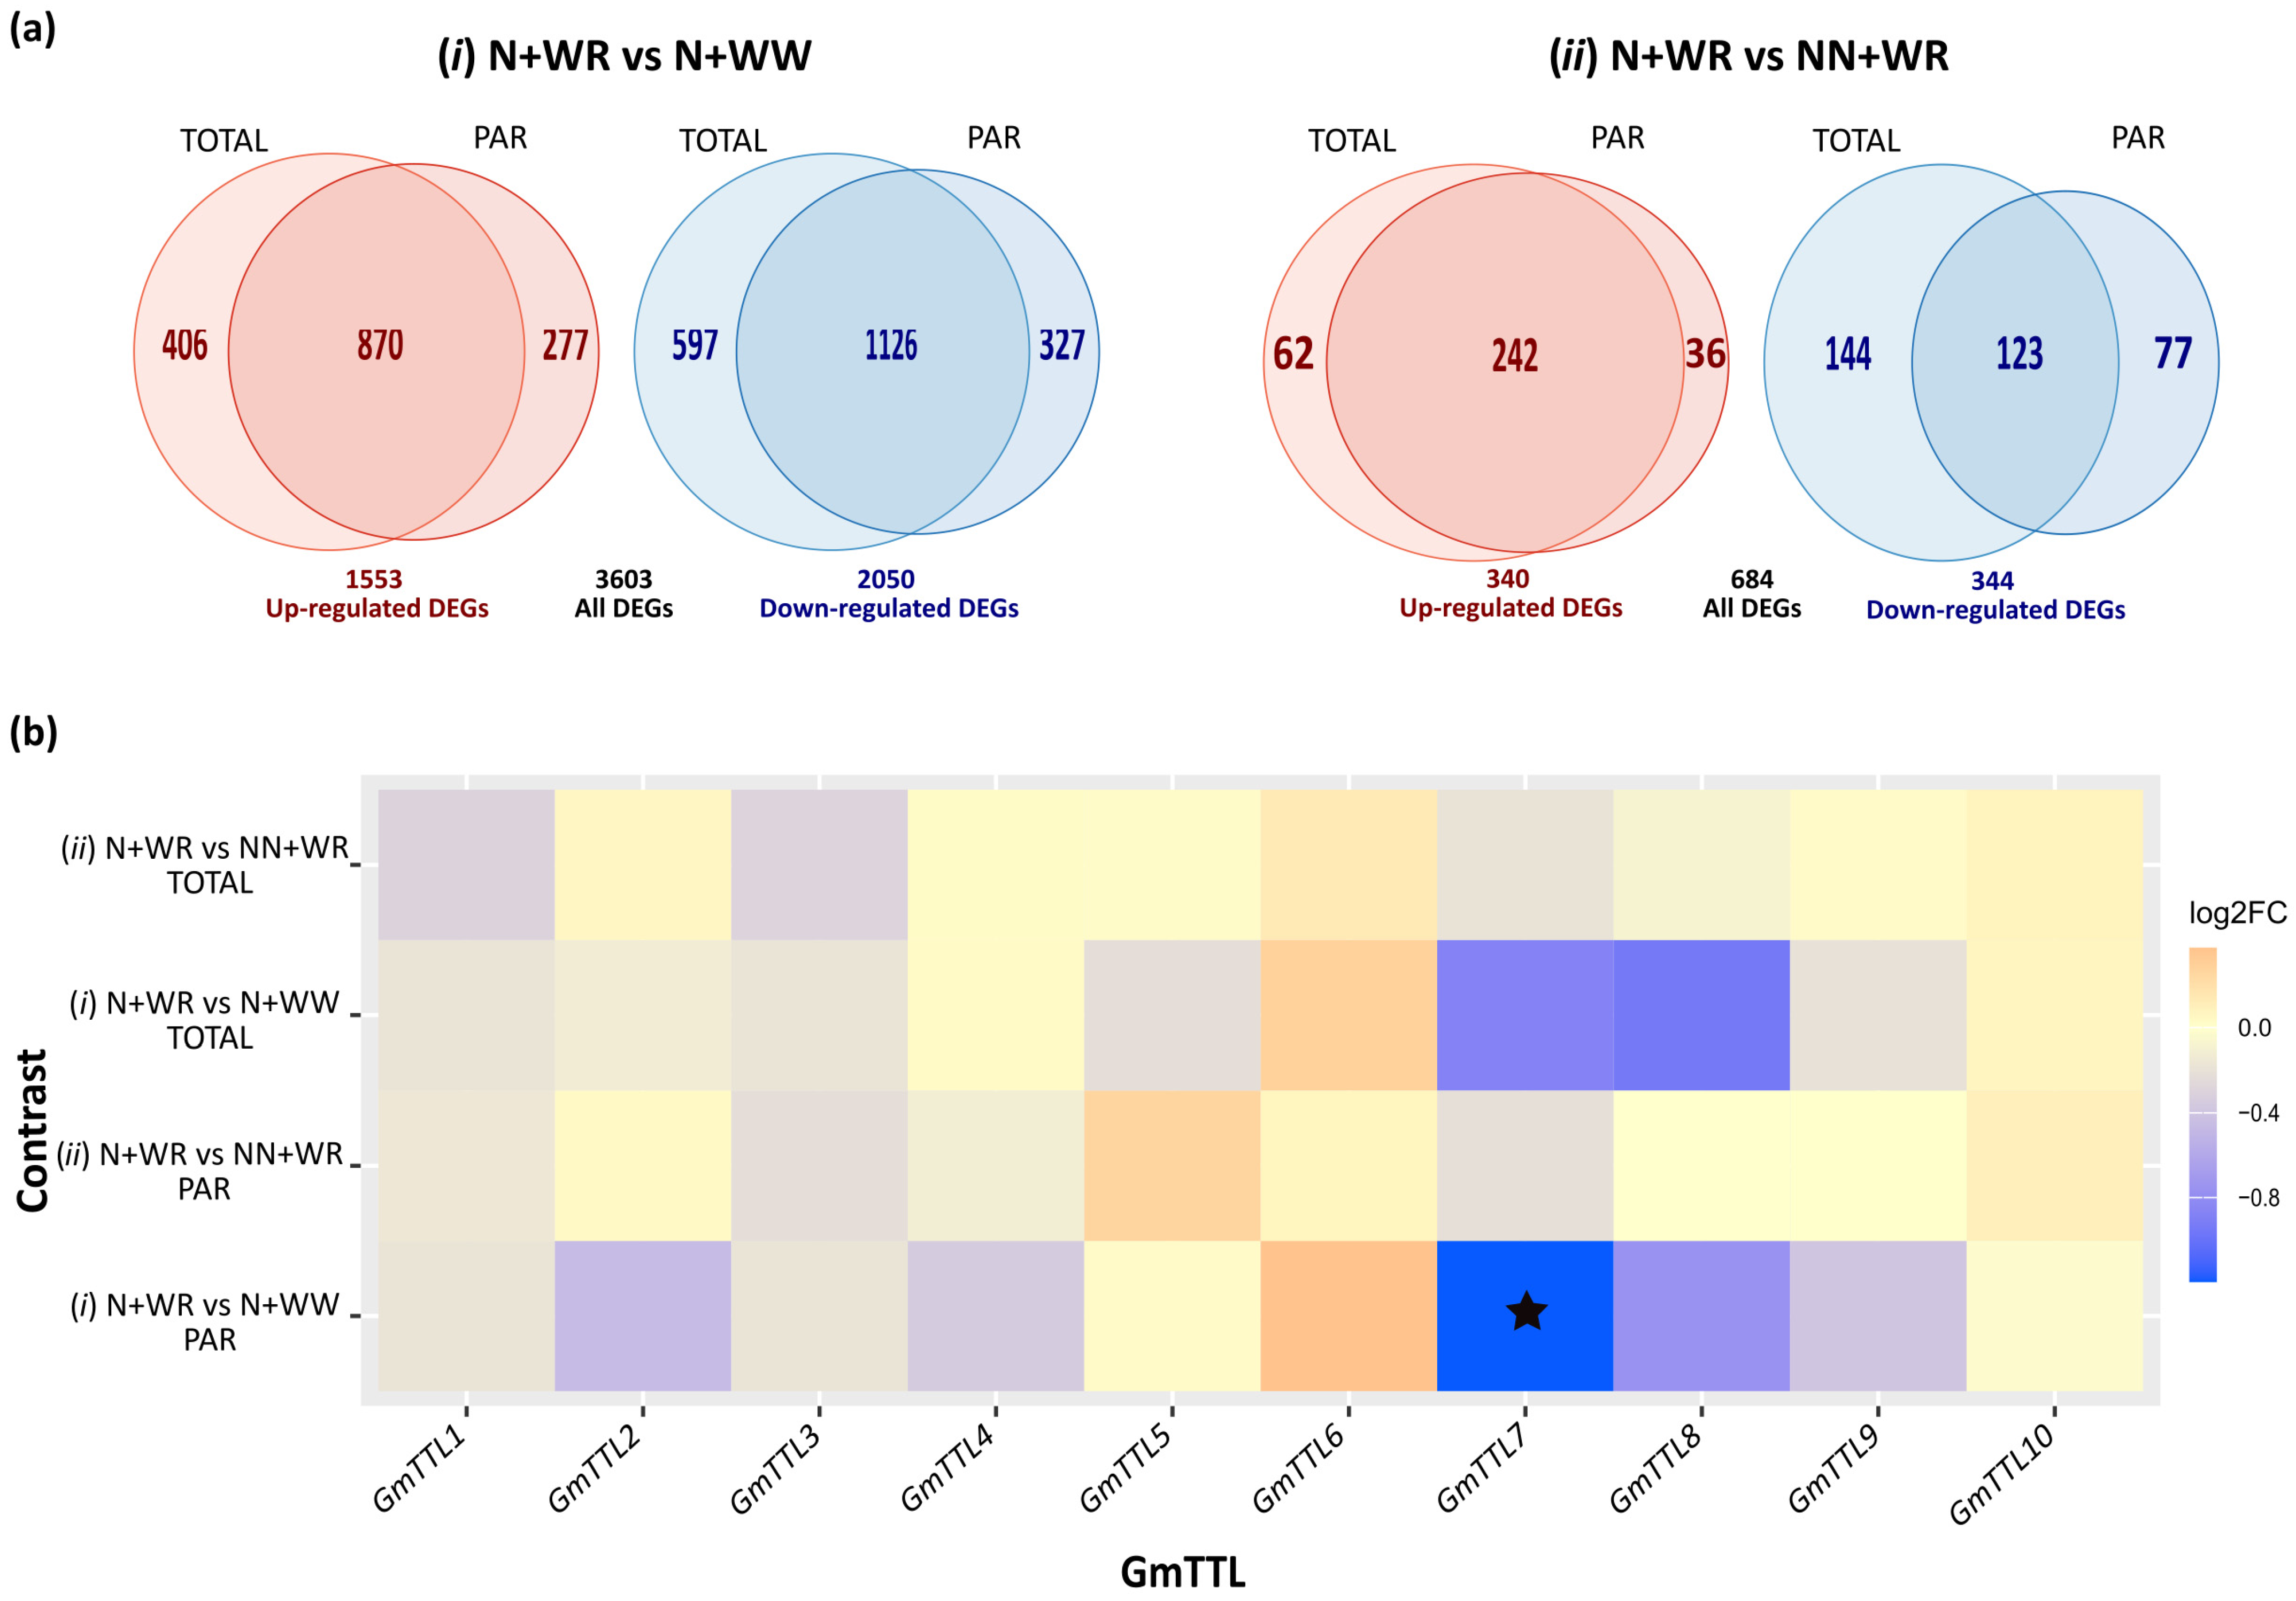
We began exploring the RNA-Seq data by analyzing the differentially expressed genes (DEGs) in the two previously mentioned comparisons. The status of the DEGs (up- or downregulated) and the regulation level (TOTAL, PAR, and TOTAL + PAR) where differential expression was identified are further distinguished (Figure 6a). Contrast (i) presented a larger absolute number of DEGs—about five times more—than contrast (ii), indicating that the imposition of WR altered the expression of a greater number of DEGs than the nodulation condition of the plant. Additionally, more DEGs were downregulated than upregulated in contrast (i), which aligns with previously published literature showing a general downregulation of gene expression in plants subjected to WR. In most cases (all except downregulated DEGs from contrast (ii), the majority of DEGs were at the TOTAL + PAR level, indicating that most genes are regulated at both the transcriptional and translational levels. For contrast (ii), however, analysis showed that while there were more downregulated DEGs than upregulated at the TOTAL and PAR levels (144/62 and 77/36, respectively), at the combined TOTAL + PAR regulation level, the majority of DEGs were upregulated (242/123). All of this data is depicted in Figure 6a.
Even though most DEGs were regulated at the transcriptional and translational levels (TOTAL + PAR), it is noteworthy that in both contrasts—encompassing both up- and downregulated DEGs—some genes were regulated mainly at the translational level (PAR) (Figure 6a). This observation is consistent with the role of translational control of gene expression in enabling rapid cellular responses to stimuli, thereby providing greater flexibility and adaptability [23].
Among these extensive DEG lists, we focused our analysis on the land plant-specific GmTTL genes to gain more insights into their role in nodulated plants exposed to environmental stresses. All ten GmTTLs were detected in our RNA-Seq data, and their expression levels in contrasts (i) and (ii), as well as in the TOTAL and PAR fractions, are shown in Figure 6b. These ten GmTTL genes were cross-referenced with the previously generated differential expression results for both TOTAL and PAR fractions. As expected, the expression profiles of the TOTAL and PAR fractions for each contrast showed a high correlation between them. Notably, GmTTL7—which presents high homology with AtTTL3 from Arabidopsis (Figure 3a)—was the only gene exhibiting differential expression levels in (i) N + WR vs. N + WW in the PAR fraction. None of the remaining nine GmTTL genes met the DEG criteria in the PAR fraction in either of the two analyzed contrasts. This is indicated with an asterisk in the corresponding profile of Figure 6b.

2.5. Downregulation of GmTTL7 in N-Fixing Plants Under Water Restriction Is Detected Specifically in the Polysome-Associated RNA Fraction

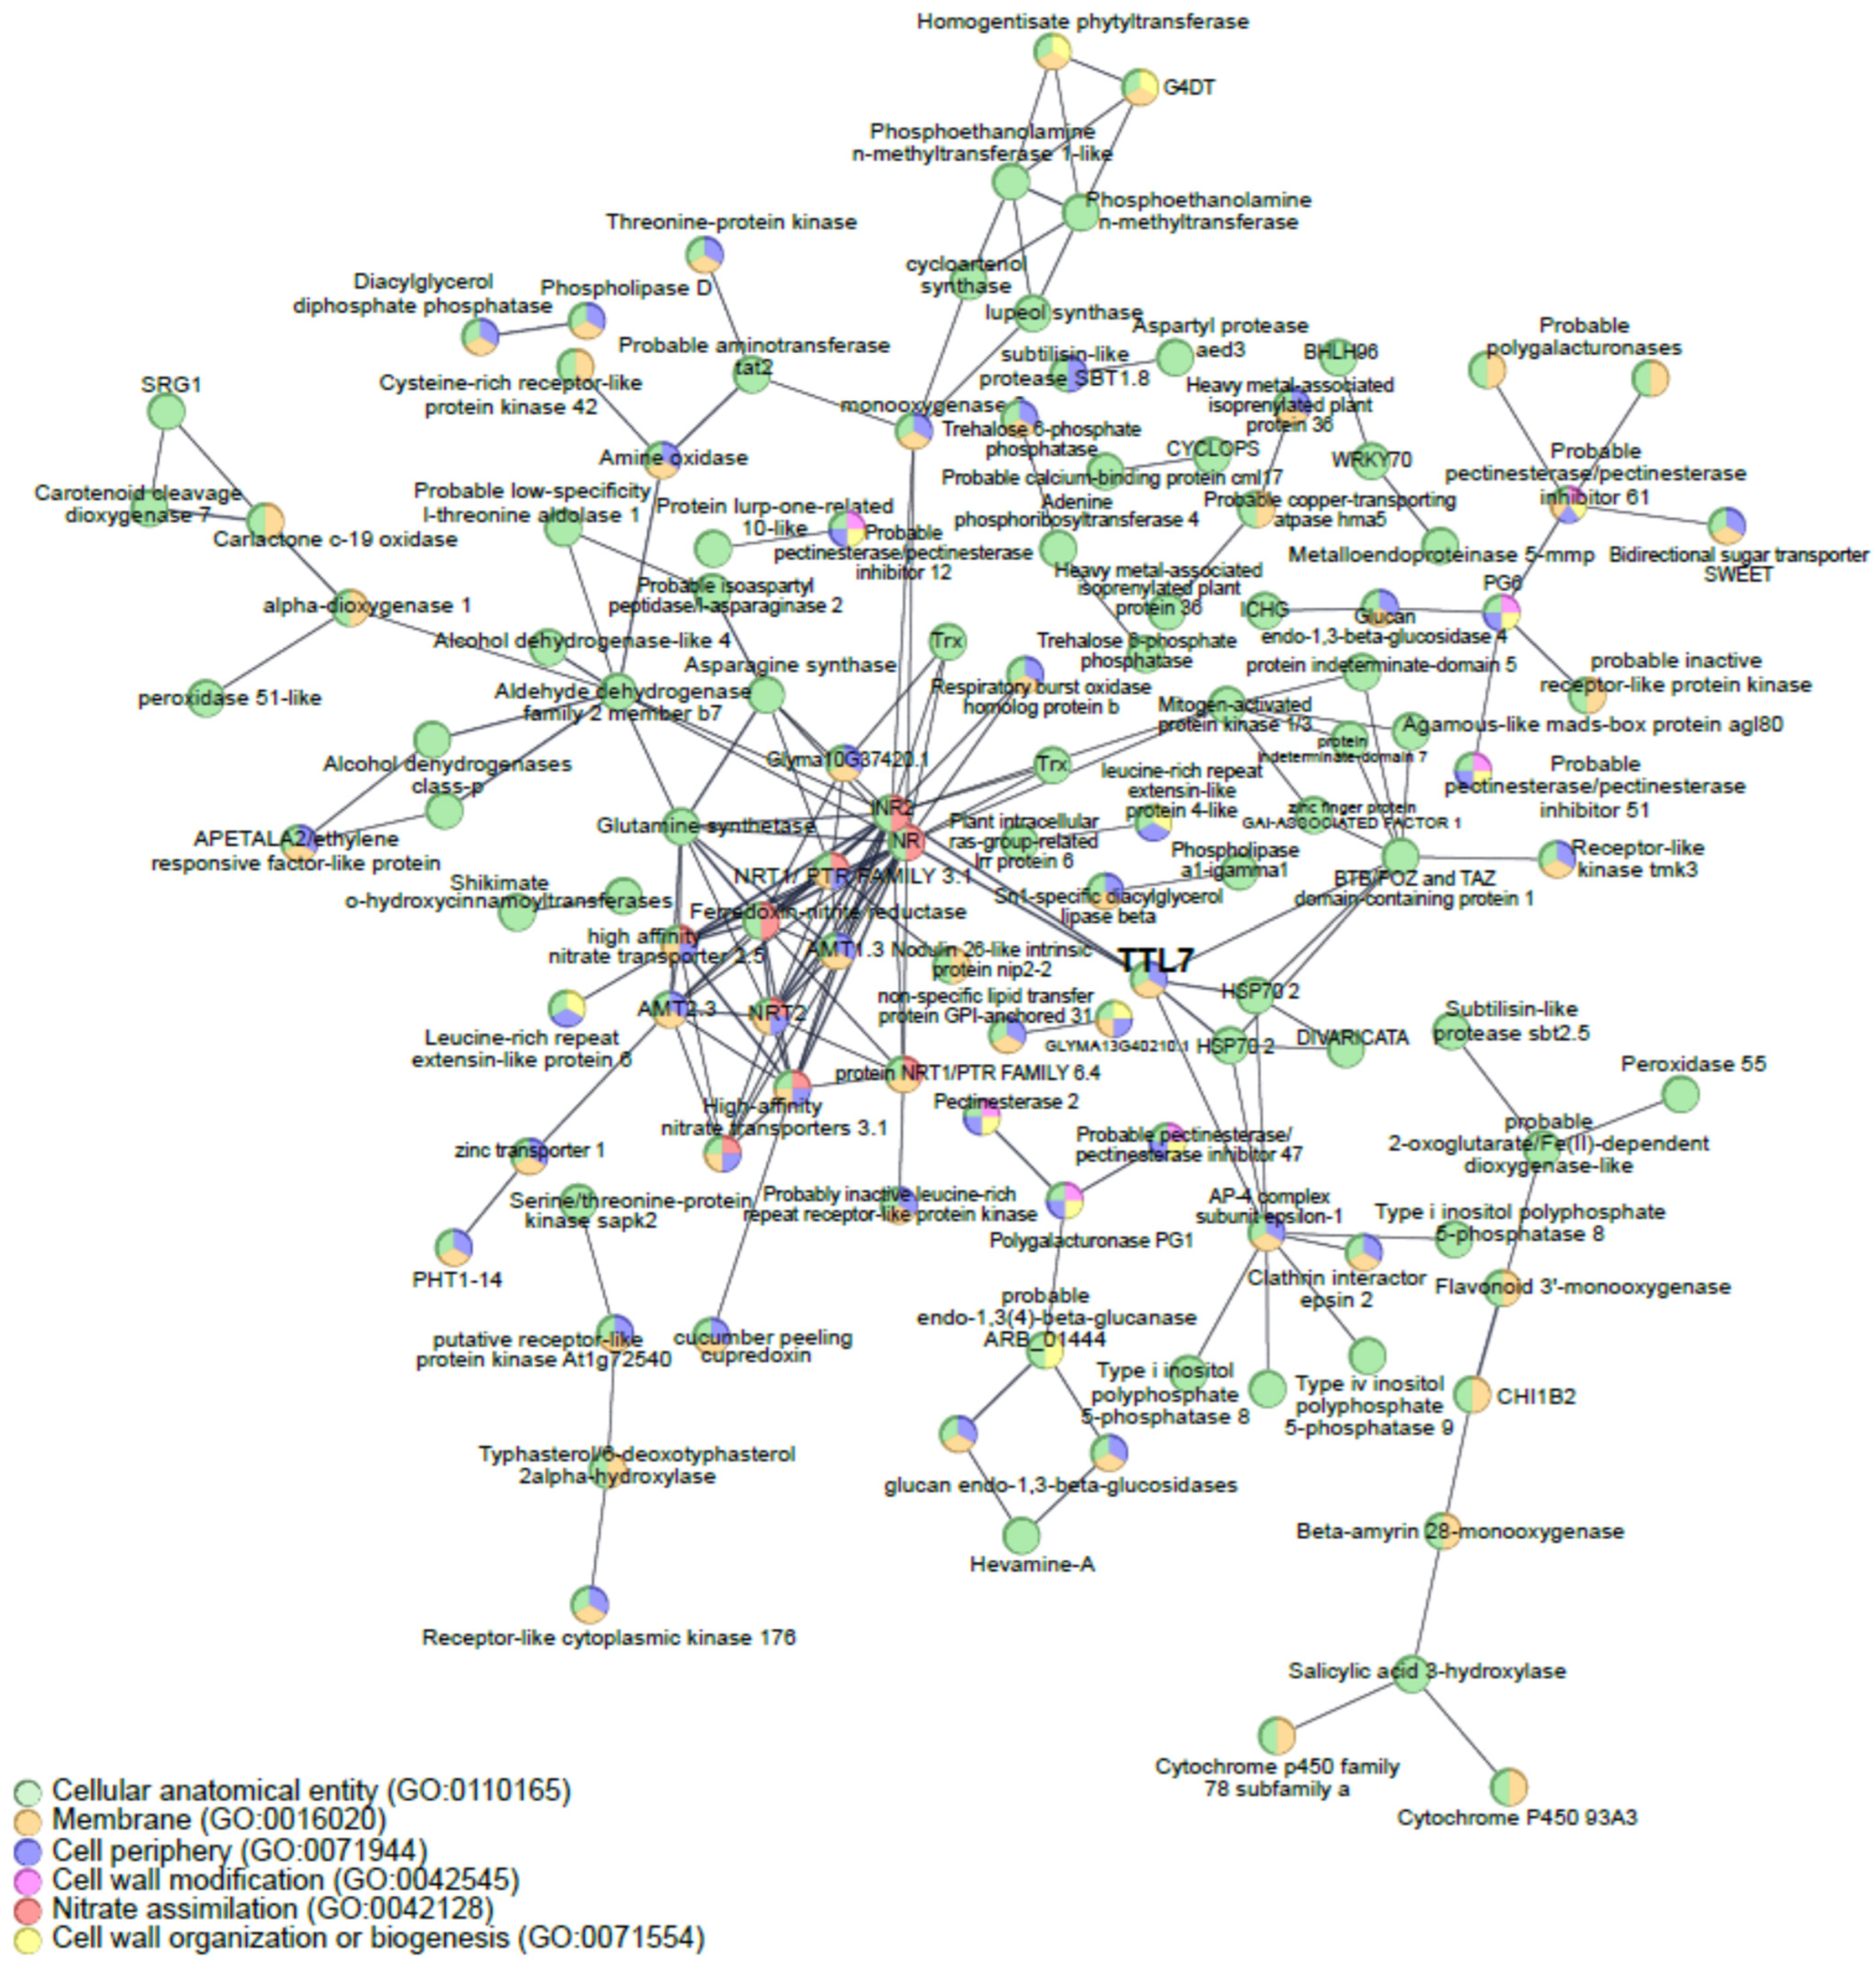
To place GmTTL7 within a co-expression context, we used the WGCNA module assignments and differential expression results previously generated and reported in [8] (Table S4). The ten GmTTL genes identified here were cross-referenced with the previously established DEG and module assignments. GmTTL7 belonged to the previously defined module M7, which contained an enriched subset of downregulated genes. Because GmTTL7 met the DEG criteria specifically in the PAR fraction in contrast i, the corresponding M7 subset of downregulated PAR DEGs was subsequently considered for the PPI analysis. This tool combines known and predicted relationships between proteins, covering both physical interactions and functional associations [24]. Figure 7 shows that this particular subset of DEGs is enriched in the following GO terms: “cellular anatomical entity”, “membrane”, “cell periphery”, “cell wall modification”, “nitrate assimilation”, and “cell wall organization or biogenesis”. Notably, all nodes (proteins) in the network are included in the “cellular anatomical entity”. In particular, GmTTL7, which is also included in the “membrane” and “cell periphery” terms, showed connections with two HSP70-2 (Heat shock 70 kDa protein 2) and two nitrate reductase enzymes (NR and INR2, a constitutive and an inducible enzyme, respectively) (Figure 7). Importantly, the associations between the GmTTL7 and the two nitrate reductases were supported by a substantially higher combined STRING score (0.805) than the minimum score used for network construction (0.400). This higher confidence is reflected by the increased thickness of the corresponding edges in Figure 7. However, these associations are based on functional association evidence and do not constitute evidence of direct physical interaction. Additionally, GmTTL7 showed two other connections, though with lower confidence (i.e., thinner lines), to the epsilon subunit of the AP-4 complex and to an uncharacterized BTB/POZ and TAZ domain-containing protein (Figure 7). The AP-4 complex (Adaptor Protein Complex 4) forms a non-clathrin-associated coat on vesicles departing the trans-Golgi network and may be involved in targeting proteins from that network to the endosomal-lysosomal system [25]. The other connecting node, although uncharacterized, is a proposed peripheral membrane protein involved in the endomembrane system. These connections could be related to the already described behavior of AtTTLs as membrane proteins that modulate stress tolerance by safeguarding cellulose synthases [6]; however, these predicted connections remain to be experimentally validated. The over-represented functional terms identified in this PPI network highlight biological processes that may link the GmTTL gene family to new functions or roles.

3. Discussion

The TETRATRICOPEPTIDE THIOREDOXIN-LIKE (TTL) gene family is exclusive to land plants and was first described in Arabidopsis thaliana for its association with abiotic stress responses and developmental signaling [2,4,5,26]. However, despite growing knowledge of AtTTL function in Arabidopsis, this gene family remains largely unexplored in legume species and has not been characterized in Glycine max. In this study, we conducted an initial identification and characterization of the GmTTL candidates present in the Glycine max v4.0 proteome.
Based on the domain type related to protein function, we identified ten distinct GmTTL genes in soybean (Table S2) that were distributed along five chromosomes. Overall, the phylogenetic analysis revealed that the GmTTL genes could be divided into three subgroups: G1 and G2, each with four members, and G3 with two members (Figure 1a). The structural features of the ten identified GmTTL genes resemble those originally described for Arabidopsis AtTTLs [1]. All members display strict conservation of exon numbers and sequence length conservation in the fourth exon across the entire family.
Furthermore, sequence analysis confirmed that the C-terminal thioredoxin-like (TRXL) domain of all 10 GmTTLs lacks the essential catalytic cysteine residues needed for disulfide reductase activity (Figure 3b). This result is consistent with findings in Arabidopsis, where AtTTL3 does not appear to possess reducing enzymatic activity, in agreement with its lack of conserved cysteine pairs found in active thioredoxins of the h class, yet is still considered important for protein stability [19]. Interestingly, our phylogenetic analysis of TRXL domains separated the family into two distinct groups, with GmTTL1/3/7/8 grouping more closely with legume TTLs orthologs than with Arabidopsis orthologs, suggesting the hypothesis of a functional diversification specific to the Fabaceae family. The alignment of the six tetratricopeptide repeats (TPRs) demonstrated that individual TPRs are more closely related to their positional counterparts in other species (such as Lotus japonicus and Medicago truncatula) than to other TPR motifs within the same protein (Figure 4). This finding has already been described in [2] and supports the hypothesis that each TPR motif has evolved to facilitate highly specific, distinct protein–protein interactions within multiprotein bridging complexes, a mechanism vital for TTLs functioning as molecular scaffolds.
Interestingly, the pairwise sequence comparison between the promoter regions of the GmTTLs revealed a range of 24% to 52% identity between the promoters of all GmTTLs (Figure 5a), and the promoter sequences formed the same pairs as the protein sequences, except for promoters GmTTL2, GmTTL5, GmTTL9, and GmTTL10 that formed different pairs (Figure 1a and Figure 5). Furthermore, we observed that both the clustering by sequence identity of the GmTTLs promoter regions and the clustering corresponding to the spatial expression across tissues revealed qualitatively similar patterns; the transcript accumulation of the GmTTLs in soybean tissues extracted from publicly available RNA-Seq data separated two clusters, the first cluster is characterized by having genes with low levels of expression in seeds, leaves, shoots, root tip, and flowers and the second cluster characterized by having genes with high expression in seeds, leaves, shoots, root tip, and flowers. Notably, the clustering of GmTTL proteins according to the amino acid sequence differed substantially from that based on expression patterns. However, some proteins, such as GmTTL1 and GmTTL3, showed concordance between both analyses, being closely related in sequence and exhibiting similar expression profiles. The clustering of the promoter regions also differs from the clustering observed with the GmTTLs amino acid sequences, suggesting sub-functionalization driven by mutations in their regulatory sequences, as was observed with AtTTL2 [2].
The prediction of cis-regulatory elements showed that in GmTTLs promoters the most abundant elements found were those associated with stress response, including MYB-binding sites involved in drought inducibility, and those related to hormone induction, such as the ABA-responsive element (ABRE) and the AuxRR core involved in auxin responsiveness. Similar cis-regulatory elements were found in the AtTTLs promoters (Table S6) supported with experimental evidence [2,3]. The presence of these predicted elements in GmTTLs promoters is consistent with possible regulation by abiotic stress- and hormone-related pathways, although their functional relevance in soybean remains to be experimentally demonstrated.
In this study, we provide initial insights into this gene family’s potential involvement in the response of soybean nitrogen-fixing plants subjected to water restriction. To achieve this, we leveraged RNA-Seq datasets from a previous study that analyzed transcriptional and translational regulation of nitrogen-fixing and water-restricted soybean plants [8]. All ten GmTTLs were detected in our RNA-Seq data. Notably, the only gene exhibiting differential regulation—specifically downregulation—at the PAR level in N-fix and water-restricted plants was GmTTL7, which presents high homology to AtTTL3 and AtTTL1 from Arabidopsis (Figure 3a) [1,3]. To examine the functional context of this selective PAR-level downregulation, we integrated the previously published WGCNA module assignments and differential expression results [8] with the GmTTL family identified here. GmTTL7 belonged to the previously defined M7 module, and the corresponding subset of downregulated PAR DEGs was subsequently used for STRING [24] analysis. The over-representation of Gene Ontology (GO) terms such as “cellular anatomical entity”, “membrane”, “cell periphery”, “cell wall organization or biogenesis”, and “nitrate assimilation” provides valuable clues regarding the cellular processes potentially associated with GmTTL7. In Arabidopsis, AtTTLs proteins have been proposed to function as bridges linking stress perception to the dynamic regulation of cellulose biosynthesis at the plasma membrane [6] and to have a role in lateral root emergence and development [5]. The enrichment of membrane and cell wall-related functions in the predicted PPI network is consistent with the hypothesis that GmTTL7 could participate in related processes in soybean nodulated roots under WR. Here, we found that GmTTL7 is associated with key components of cellular stress response and membrane trafficking, including HSP70-2 and the epsilon subunit of the AP-4 complex, which participates in vesicle trafficking from the trans-Golgi network to the endosomal-lysosomal system [25]. These associations, together with evidence of stress-induced relocalization of AtTTL3 to the plasma membrane in Arabidopsis [6], support the hypothesis that GmTTL7 may be involved in membrane-associated processes contributing to cellular adaptation under water deficit. However, the membrane localization of GmTTL7 predicted by the PPI analysis is not consistent with the nuclear localization predicted by the protein sequence using tPlant-mPLoc, which makes the actual GmTTL7 localization unresolved and should be experimentally confirmed.
Perhaps the more novel finding was that the PPI analysis revealed a predicted functional association connection between GmTTL7 with proteins involved in nitrate uptake and reduction. However, these associations are based on functional association evidence and do not constitute evidence of direct physical interaction. Considering the information available from Arabidopsis AtTTL gene family and the predictive information generated here by the PPI analysis, GmTTL7 emerges as a promising candidate for future functional work. A possible hypothesis for future investigation could be that GmTTL7 may participate in a sensory or regulatory hub that coordinates root cell wall status, root growth, and metabolic shifts associated with nitrogen management during WR [27]. The network identified in this study provides a set of candidate genes and interactions for future experimental validation. Functional approaches such as gene knockout or knockdown strategies, protein interaction assays, and subcellular localization analyses will be valuable for elucidating the role of GmTTL7 in the adaptation of soybean roots to water deficit.

4. Materials and Methods

4.1. Retrieval of Sequences and TTL Family Members Identification and Initial Characterization

Protein sequences and annotation files were retrieved from the Glycine max v4.0 reference proteome (GCF_000004515.6) from NCBI. Protein domain composition was annotated using InterProScan v5.0 [28] with default parameters. Candidate TTL proteins were additionally examined using HMMER v3.2.1 hmmscan against the Pfam TPR_1 (PF00515.30) and Thioredoxin (PF00085.22) profiles. Proteins showing the characteristic combination and organization of TPR repeats and a C-terminal thioredoxin-like domain were retained as GmTTL candidates. BLASTP v2.13.0 [29] was subsequently used for sequence-similarity comparisons among the identified TTL sequences and domains.
Based on the protein sequence information, we used seqinR [30] to compute isoelectric point and molecular weight (in kDa), while the prediction of subcellular localization of each protein was done using tPlant-mPLoc v2.0 [31]. To determine the chromosomal location and gene structure of GmTTL homologs, we used the GFF3 annotation file. In addition, PlantCARE (accessed on 10 May 2022, [22]) was used to predict putative cis-regulatory elements (CREs) in the approximately 2 kb genomic regions upstream of the GmTTL genes. The transcription start positions were inferred from the annotated transcript models in the Glycine max v4.0 GFF3 annotation, using the 5′ boundary of the corresponding transcript model. Upstream regions were defined according to gene orientation and extracted in a strand-aware manner. We analyzed the protein motifs using the MEME suite v5.4.1 [32], with the maximum motif number set to 10 and an optimum width range set to 6–50 amino acids, the remaining parameters as default. We annotated the identified motifs using InterProScan v5.0 [28]. To plot GmTTLs homologs gene structure and protein motif, added to CREs, we use R base functions [33] and pheatmap v1.0.12 (accessed on 1 June 2022) [34]. These upstream sequences were aligned, and pairwise nucleotide dissimilarity was calculated from the alignment as a measure of sequence distance. The resulting distance matrix was used for hierarchical clustering and visualized as a clustered heatmap in R using the pheatmap package v1.0.12 [34].
For comparison purposes, Arabidopsis TTL protein sequences were retrieved from The Arabidopsis Information Resource (TAIR), whereas Glycine max (GCF_000004515.6), Lotus japonicus (20210713_LjGifu1.3), and Medicago truncatula (GCF_003473485.1) sequences were retrieved from NCBI. Amino acid sequences were aligned using Clustal Omega as implemented in the R package msa v1.22.0 [35]. Pairwise sequence-identity distances were calculated from the resulting alignments, and neighbor-joining trees were reconstructed in R using the ape package v.5.8. Because this was a distance-based analysis, no explicit amino acid substitution model was applied. Branch support was assessed using 1000 bootstrap replicates implemented with the phangorn package v.2.12.1 [36]. Bootstrap-supported versions of the phylogenetic reconstructions shown in Figure 1, Figure 2, Figure 3 and Figure 4 are provided as Supplementary Figures S2–S5.

4.2. Analysis of Transcript Accumulation of the GmTTLs from Publicly Available RNA-Seq Data

We investigated the transcript accumulation of the GmTTLs in soybean tissues from publicly available RNA-Seq data in Phytozome (https://phytozome.jgi.doe.gov/pz/portal.html; accessed on 6 September 2026) [21]. The gene atlas experiments from phytozome.jgi.doe.gov/info/Gmax_Wm82_a4_v1 dataset include standard tissues from G. max cv. Williams 82 and M. truncatula Jemalong A17 that were sterilized and grown as specified in [37]. Nitrogen was supplemented by watering every 3 days with nutrient solution containing either 10 mM KNO3 (NO3− plants), 10 mM (NH4)3PO4 (NH4+ plants) or 10 mM urea (urea plants). Plants under symbiotic conditions were watered with nutrient solution containing 0.5 mM NH4NO3 every other week. After 4 weeks, different tissues (leaf, stem, root, shoot, shoot tip, root tip, lateral roots, root nodules, etc.) were harvested. All tissues were collected in three biological replicates and immediately flash frozen in liquid nitrogen and stored at −80 °C until further processing was done. High-quality RNA was extracted mainly using standard Trizol-reagent based extraction. Total RNA starting material was 1 μg per sample and 8 cycles of PCR was used for library amplification as stated in [37]. Fragments per kilobase of exon per million fragments mapped (FPKM) values were calculated for each gene by normalizing the read count data to both the length of the gene and the total number of mapped reads in the sample and considered as the metric for estimating gene expression levels (10.1093/nar/gkad616). Genes with low expression were filtered out, by requiring ≥2 relative log expression normalized counts in at least two samples for each gene. Afterward, the transcript accumulation pattern was visually compared with the promoter region identity similarity pattern.

4.3. Plant Growth and Water Restriction Assay

We grew plants of the Don Mario 6.8i (DM) soybean genotype under controlled conditions in a growth chamber, as detailed in [7,8]. We sowed three seeds per pot and carefully analyzed the homogeneity of the seedlings to avoid any interference related to developmental phenotype. The Bradyrhizobium elkanii strain U1302 grown in liquid YEM-medium [38] was used for the inoculated plants.
For the water restriction (WR) assay, the experimental unit was one pot with one plant. The experimental design was completely randomized, with 20 pots corresponding to four combined treatments and five biological replicates (n = 5). Plants were assigned to four combined treatments according to nodulation status and water availability: nodulated plants subjected to water restriction (N + WR), nodulated plants maintained under well-watered conditions (N + WW), non-nodulated plants subjected to water restriction (NN + WR), and non-nodulated plants maintained under well-watered conditions (NN + WW).
It is relevant to mention that, although five biological replicates were included for each combined treatment, the experimental pipeline and subsequent RNA-Seq analyses were conducted using three of the five biological replicates for each combined treatment.
The seedlings grew without water restriction for the first 19 days after sowing (V2-3 developmental stage), maintaining the substrate at field capacity with B&D-medium [39] supplemented with KNO3 (0.5 mM and 5 mM final concentration for N and NN plants, respectively). Watering withdrawal to the WR plants began on day 20 (day 0 of the WR period), while we maintained the WW plants without water restriction throughout the assay. We measured the substrate water content daily and the stomatal conductance of all plants from day 20 till the end of the WR period, as described in [8]. We established the end of the WR period individually for each WR plant when the stomatal conductance value reached 50% of the value obtained on day 0 of the WR period. At this moment, we harvested the roots of each WR plant and kept them at −80 °C until polysomal fraction purification. We harvested the roots of the WW plants simultaneously with those of the WR plants and kept them at −80 °C until the polysomal fraction was purified.

4.4. Polysomal Fraction Purification by Sucrose Cushion Centrifugation

4.4.1. Preparation of Cytoplasmic Lysates

We performed all the steps at 4 °C or on ice, and all equipment and materials were pre-chilled and RNase-free. We pulverized frozen roots in liquid nitrogen and homogenized 2 mL of packed tissue in 4 mL of Polysome Extraction Buffer described in [7], using a mortar and pestle. The homogenate was maintained at 4 °C with gentle shaking for 15 min, then clarified by centrifugation at 16,000 g for 15 min. Then, we filtered the homogenate with cheesecloth and repeated the centrifugation step. A volume of 500 µL of the supernatant was reserved for total RNA isolation (TOTAL). The remaining supernatant (2 mL) was centrifuged through sucrose cushions to purify polysomal fractions.

4.4.2. Sucrose Cushion Centrifugation and Polysome Purification

We made two layers of sucrose cushions (4.5 mL of 12% and 4.5 mL of 33.5%) from a 2M sucrose stock solution, a 10× salts stock solution (400 mM Tris-HCl, pH 8.4, 200 mM KCl, 100 mM MgCl2) used at 1×, 50 μg mL−1 cycloheximide, and 50 μg mL−1 chloramphenicol. The 2 mL clarified cytosolic extract was loaded on the two-layer’s sucrose cushions and centrifuged in a Beckman L-100K class S ultracentrifuge with W40 Ti swinging bucket rotor (Beckman Coulter, Brea, CA, USA, 344059) at 4 °C for 2 h at 35,000 rpm. Ultra-Clear tubes with volumes of 13.2 mL were used. Following centrifugation, the polysomal pellet was gently resuspended in 200 μL of Polysome Resuspension Buffer (PRB; 200 mM Tris-HCl, pH 9.0, 200 mM KCl, 25 mM EGTA, 35 mM MgCl2, 5 mM DTT, 50 μg mL−1 cycloheximide, and 50 μg mL−1 chloramphenicol) by repeated pipetting. The suspension was subsequently incubated at 4 °C for 30 min. RNA was then purified from the resuspended polysomal material using the standard RNA purification procedure to recover the polysome-associated RNA (PAR) fraction.

4.5. Extraction of TOTAL and PAR RNA Fractions and Transcriptome Sequencing

For RNA extraction, 750 µL of TRIzol LS reagent (Invitrogen, Carlsbad, CA, USA, 10296-028) was used to homogenize both the resuspended polysomal pellet and the extract previously reserved for total RNA isolation. The samples were allowed to stand at room temperature (RT) for 5 min before 200 µL of chloroform was added. After vigorous mixing for 15 s, the samples were incubated at RT for a further 10 min. The phases were subsequently separated by centrifugation at 12,000× g for 15 min at 4 °C. A 500 µL volume of the aqueous phase was transferred to a fresh tube containing 375 µL of cold isopropanol and 0.5 µL of RNase-free glycogen (Invitrogen, USA, 10814-010). Following a 10 min incubation at 4 °C, RNA was recovered by centrifugation at 12,000× g for 15 min. The resulting pellet was washed with 1 mL of cold 75% ethanol, centrifuged, air-dried, and resuspended in 50 µL of RNase-free water. The samples were subsequently incubated at 65 °C for 5 min. RNA concentration and integrity were evaluated using an Agilent 2100 Bioanalyzer (Agilent Technologies, Inc., Santa Clara, CA, USA). Samples containing more than 1.0 µg of RNA and with an RNA integrity number (RIN) above 7.0 were selected for library preparation and sequencing. TOTAL and PAR RNA samples from three biological replicates of each combined treatment (N + WR, NN + WR, N + WW, and NN + WW) were submitted to Macrogen Inc. (Seoul, Republic of Korea). TruSeq Stranded mRNA paired-end (PE) cDNA libraries were prepared and sequenced on an Illumina high-throughput sequencing platform.

4.6. Data Analysis

The analysis of the sequencing data on which this study relied was detailed in [8], and the data are available in the NCBI Sequence Read Archive (SRA): BioSample accessions: SAMN30227622-SAMN30227645, BioProject ID: PRJNA868178.
Therefore, we suggest checking that reference for a thorough description of the analysis pipeline. In this section, however, we provide a brief overview of the primary analysis methods.

4.6.1. Processing of Sequencing Data

We used FastQC v0.11.9 (https://www.bioinformatics.babraham.ac.uk/projects/fastqc/; accessed on 6 September 2026) to visually inspect the data quality of the Illumina sequencing. We trimmed the adapters and low-quality bases using Trimmomatic v0.39 [40], retaining PE reads with an overall Phred quality score greater than 30 and a length greater than 80 bp for subsequent analysis.
We mapped the reads to the Glycine max v4.0 transcriptome (GCF_000004515.6, retrieved from https://www.ncbi.nlm.nih.gov/; accessed on 6 September 2026) using Salmon V0.12.0, in quasi-mapping mode [41], and we quantified the transcript abundance.
The R/BioConductor package Tximport [42] was used to convert the estimated transcript-level abundances to gene-level expression abundances. Descriptive statistics were estimated using R base functions.

4.6.2. Differentially Expressed Gene (DEG) Analysis

Differential expression analyses were performed using DESeq2 v3.15 [43]. Genes with |log2FC| > 1 and adjusted p-value (padj)  <  0.05 were considered differentially expressed in our study. The generated gene lists were filtered to keep only differentially expressed TTLs. Plots were generated using R base functions and the R package ggplot2 version 3.3.6 [44].

4.6.3. Co-Expression Analysis

WGCNA module assignments used in the present study were obtained directly from our previously published analysis described in [8]. The ten GmTTL genes identified in the Glycine max v4.0 proteome were cross-referenced with the published differential expression results and WGCNA module assignments to identify the module containing the differentially expressed GmTTL member. Full details of gene filtering, network construction, soft-threshold selection, module detection, and module composition are provided in [8].

4.6.4. Protein–Protein Interaction (PPI) Analysis

Gene lists analysis was performed using STRINGdb v11.5 [45] with default parameters, using protein sequences in FASTA format as input. For visualization purposes, unconnected nodes were hidden.

Supplementary Materials

The following supporting information can be downloaded at https://www.mdpi.com/article/10.3390/stresses6030069/s1, Figure S1. Heatmap showing the expression analysis of the entire family of GmTTL genes. Analysis of the transcript accumulation of the GmTTLs in soybean tissues from publicly available RNA-Seq data (dataset: http://phytozome.jgi.doe.gov/info/Gmax_Wm82_a4_v1; accessed on 6 September 2026) in Phytozome (https://phytozome.jgi.doe.gov/pz/portal.html; accessed on 6 September 2026) [21,37]. Four week tissues (leaf, stem, root, shoot, shoot tip, root tip, lateral roots, root nodules) were harvested involving three independent biological replicates for each condition for RNA-Seq preparation. Color intensity represents relative expression levels across the analyzed samples (10.1093/nar/gkad616); Figure S2. Bootstrap-supported phylogenetic analysis of Glycine max TTL proteins. Neighbor-joining tree based on the amino acid sequence alignment of the ten GmTTL proteins identified in the Glycine max v4.0 proteome. Sequences were aligned using Clustal Omega, and the tree was reconstructed from pairwise sequence-identity distances. Numbers at internal nodes indicate bootstrap support values (%) based on 1000 replicates; values below 50% are not shown. The scale bar represents branch length according to the sequence-distance measure used for tree reconstruction. This analysis corresponds to the phylogenetic reconstruction shown in Figure 1a; Figure S3. Bootstrap-supported phylogenetic analysis of TTL proteins from Glycine max, Arabidopsis thaliana, Medicago truncatula, and Lotus japonicus. Neighbor-joining tree based on the amino acid sequence alignment of full-length TTL proteins from the four species. Sequences were aligned using Clustal Omega, and the tree was reconstructed from pairwise sequence-identity distances. Numbers at internal nodes indicate bootstrap support values (%) based on 1000 replicates; values below 50% are not shown. The scale bar represents branch length according to the sequence-distance measure used for tree reconstruction. This analysis corresponds to the phylogenetic reconstruction shown in Figure 2; Figure S4. Bootstrap-supported phylogenetic analysis of TTL thioredoxin-like (TRXL) domains. Neighbor-joining tree based on the amino acid sequence alignment of TRXL domains from TTL proteins of Glycine max, Arabidopsis thaliana, Medicago truncatula, and Lotus japonicus. The thioredoxin domain of the genuine Arabidopsis thaliana thioredoxin At3g17880 was included as a reference. Sequences were aligned using Clustal Omega, and the tree was reconstructed from pairwise sequence-identity distances. Numbers at internal nodes indicate bootstrap support values (%) based on 1000 replicates; values below 50% are not shown. The scale bar represents branch length according to the sequence-distance measure used for tree reconstruction. This analysis corresponds to the phylogenetic reconstruction shown in Figure 3a; Figure S5. Bootstrap-supported phylogenetic analysis of individual TPR motifs from TTL proteins. Neighbor-joining tree based on the amino acid sequence alignment of the positional TPR motifs (R1–R6) from TTL proteins of Glycine max, Arabidopsis thaliana, Medicago truncatula, and Lotus japonicus. Sequences were aligned using Clustal Omega, and the tree was reconstructed from pairwise sequence-identity distances. Numbers at internal nodes indicate bootstrap support values (%) based on 1000 replicates; values below 50% are not shown. The scale bar represents branch length according to the sequence-distance measure used for tree reconstruction. This analysis corresponds to the phylogenetic reconstruction shown in Figure 4; Table S1. Predicted TPR repeat regions in Glycine max proteins. Tetratricopeptide repeat (TPR) motifs predicted in proteins of Glycine max (soybean), including the repeat number (ordered from N-terminus to C-terminus), the start and end amino acid positions within each protein, and their corresponding NCBI Protein IDs. Predictions were obtained using InterProScan; Table S2. Genomic features and functional annotations of TTL-like genes in Glycine max. This table summarizes ten Glycine max (soybean) genes belonging to the TTL (TPR repeat-containing thioredoxin-like) protein family. For each gene, the table includes a short gene name (gene_name), stable gene identifier (stable_id), NCBI gene ID (ncbi_gene_id), and functional annotation (annotation). Genomic coordinates are given by the chromosome (chromosome), gene start and end positions (gene_start, gene_end), and coding strand (strand). The corresponding predicted protein is indicated with its identifier (protein_id) and length in amino acids (protein_length). All gene models are based on version 4 of the soybean reference genome; Table S3. Isoelectric points, molecular weights, and predicted nuclear localization of TTL proteins in Glycine max. This table summarizes predicted biochemical properties of TTL proteins (TPR repeat-containing thioredoxin-like) from Glycine max. The data includes the gene short name (Gm_TTL_name), predicted isoelectric point (isoelectric_point), estimated molecular weight in kilodaltons (molecular_weight_kDa), and subcellular localization (predicted_localization). All proteins were predicted to localize to the nucleus; Table S4. Differentially expressed genes (DEGs), and their WGCNA module correspondence, in the (i) N + WR vs. N + WW contrast within the polysomal fraction. List of DEGs identified in the N + WR (nodulated + water restricted) vs. N + WW (nodulated + well-watered) contrast, within the polysomal (P) mRNA fraction. Only genes meeting the significance thresholds (adjusted p-value < 0.05 and |log2FoldChange| ≥ 1) are shown. Gene IDs correspond to NCBI Gene identifiers. GmTTL7, found to is differentially expressed in this contrast, is highlighted in color in the table. A. The product of these genes was used for protein–protein interaction analysis using the STRING database. Module_WGCNA pertinence was defined in [8]. In bold: genes included in the protein–protein interaction analysis; Table S5. Genes included in the protein–protein interaction analysis. All genes belonging to Module 7—Downregulated in the condition N + WR vs. N + WW—Only PAR fraction; Table S6. Number and localization of the more frequent cis-acting elements among the AtTTL promoter regions. The 2000 bp of genomic sequence upstream of the Transcriptional Start Site (TSS) of AtTTL sequences were analyzed with PlantCARE [22] to predict their cis-regulatory elements (CREs).

Author Contributions

Conceptualization, M.M.S. and M.S.-S.; Data curation, C.V.F., G.E. and J.S.-S.; Formal analysis, M.M.S., C.V.F., J.S.-S. and M.S.-S.; Funding acquisition, M.M.S. and O.B.; Investigation, M.M.S. and S.P.-P.; Methodology, M.M.S. and J.S.-S.; Resources, J.S.-S.; Writing—original draft, M.M.S. and M.S.-S.; Writing—review and editing, M.M.S., C.V.F., G.E., J.S.-S., O.B. and M.S.-S. All authors have read and agreed to the published version of the manuscript.

Funding

This research was funded by Comisión Sectorial de Investigación Científica (CSIC) CSIC I+D 2022 Grant No. 22520220100256UD, CSIC I+D 2020 Grant No. 282 (María Martha Sainz), CSIC I+D 2022 Grant No. 22520220100308UD, CSIC I+D 2018, Grant No. 95 (Mariana Sotelo-Silveira) and Programa de Desarrollo de las Ciencias Básicas (PEDECIBA) (María Martha Sainz, Carla Valeria Filippi, José Sotelo-Silveira, Omar Borsani, Mariana Sotelo-Silveira).

Institutional Review Board Statement

Not applicable.

Informed Consent Statement

Not applicable.

Data Availability Statement

All datasets supporting the results of this study are included within the article and its Supplementary Material. The sequencing data is available in the NCBI Sequence Read Archive (SRA) under the accession number PRJNA868178.

Acknowledgments

We thank the Sistema Nacional de Investigadores (ANII) (María Martha Sainz, Carla Valeria Filippi, Guillermo Eastman, José Sotelo-Silveira, Omar Borsani, Mariana Sotelo-Silveira).

Conflicts of Interest

The authors declare no conflicts of interest.

References

  1. Rosado, A.; Schapire, A.L.; Bressan, R.A.; Harfouche, A.L.; Hasegawa, P.M.; Valpuesta, V.; Botella, M.A. The Arabidopsis Tetratricopeptide Repeat-Containing Protein TTL1 is Required for Osmotic Stress Responses and Abscisic Acid Sensitivity. Plant Physiol. 2006, 142, 1113–1126. [Google Scholar] [CrossRef] [Scilit] [PubMed]
  2. Lakhssassi, N.; Doblas, V.G.; Rosado, A.; del Valle, A.E.; Pose, D.; Jimenez, A.J.; Castillo, A.G.; Valpuesta, V.; Borsani, O.; Botella, M.A. The Arabidopsis TETRATRICOPEPTIDE THIOREDOXIN-LIKE Gene Family is Required for Osmotic Stress Tolerance and Male Sporogenesis. Plant Physiol. 2012, 158, 1252–1266. [Google Scholar] [CrossRef] [Scilit] [PubMed]
  3. Cuadrado-Pedetti, M.B.; Rauschert, I.; Sainz, M.M.; Amorim-Silva, V.; Botella, M.A.; Borsani, O.; Sotelo-Silveira, M. The Arabidopsis TETRATRICOPEPTIDE THIOREDOXIN-LIKE 1 Is Involved in Anisotropic Root Growth during Osmotic Stress Adaptation. Gene 2021, 12, 236. [Google Scholar] [CrossRef] [Scilit] [PubMed]
  4. Amorim-Silva, V.; Garcia-Moreno, A.; Castillo, A.G.; Lakhssassi, N.; Esteban del Valle, A.; Perez-Sancho, J.; Li, Y.; Pose, D.; Perez-Rodriguez, J.; Lin, J.; et al. TTL Proteins Scaffold Brassinosteroid Signaling Components at the Plasma Membrane to Optimize Signal Transduction in Arabidopsis. Plant Cell 2019, 31, 1807–1828. [Google Scholar] [CrossRef] [Scilit] [PubMed]
  5. Xin, P.; Schier, J.; Sefrenová, Y.; Kulich, I.; Dubrovsky, J.G.; Vielle-Calzada, J.-P.; Soukoup, A. The Arabidopsis TETRATRICOPEPTIDE-REPEAT THIOREDOXIN-LIKE (TTL) Family Members Are Involved in Root System Formation via Their Interaction with Cytoskeleton and Cell Wall Remodeling. Plant J. 2022, 112, 946–965. [Google Scholar] [CrossRef] [Scilit] [PubMed]
  6. Kesten, C.; García-moreno, Á.; Amorim-silva, V.; Menna, A.; Castillo, A.G.; Percio, F.; Armengot, L.; Ruiz-lopez, N.; Jaillais, Y.; Sánchez-rodríguez, C.; et al. Peripheral Membrane Proteins Modulate Stress Tolerance by Safeguarding Cellulose Synthases. Sci. Adv. 2022, 8, eabq6971. [Google Scholar] [CrossRef] [Scilit] [PubMed]
  7. Sainz, M.M.; Filippi, C.V.; Eastman, G.; Sotelo-Silveira, J.R.; Borsani, O.; Sotelo-Silveira, M. Analysis of Thioredoxins and Glutaredoxins in Soybean: Evidence of Translational Regulation under Water Restriction. Antioxidants 2022, 11, 1622, Correction in Antioxidants 2023, 12, 1377. https://doi.org/10.3390/antiox12071377. [Google Scholar] [CrossRef] [Scilit] [PubMed]
  8. Sainz, M.M.; Filippi, C.V.; Eastman, G.; Sotelo-silveira, M.; Zardo, S.; Martínez-Moré, M.; Sotelo-Silveira, J.R.; Borsani, O. Water Deficit Response in Nodulated Soybean Roots: A Comprehensive Transcriptome and Translatome Network Analysis. BMC Plant Biol. 2024, 24, 585. [Google Scholar] [CrossRef] [Scilit] [PubMed]
  9. Kawaguchi, R.; Girke, T.; Bray, E.A.; Bailey-Serres, J. Differential MRNA Translation Contributes to Gene Regulation under Non-Stress and Dehydration Stress Conditions in Arabidopsis thaliana. Plant J. 2004, 38, 823–839. [Google Scholar] [CrossRef] [Scilit] [PubMed]
  10. Lei, L.; Shi, J.; Chen, J.; Zhang, M.; Sun, S.; Xie, S.; Li, X.; Zeng, B.; Peng, L.; Hauck, A.; et al. Ribosome Profiling Reveals Dynamic Translational Landscape in Maize Seedlings under Drought Stress. Plant J. 2015, 84, 1206–1218. [Google Scholar] [CrossRef] [Scilit] [PubMed]
  11. Lee, T.A.; Bailey-Serres, J. Integrative Analysis from the Epigenome to Translatome Uncovers Patterns of Dominant Nuclear Regulation during Transient Stress. Plant Cell 2019, 31, 2573–2595. [Google Scholar] [CrossRef] [Scilit] [PubMed]
  12. Urquidi Camacho, R.A.; Lokdarshi, A.; von Arnim, A.G. Translational Gene Regulation in Plants: A Green New Deal. Wiley Interdiscip. Rev. RNA 2020, 11, e1597. [Google Scholar] [CrossRef] [Scilit] [PubMed]
  13. Sablok, G.; Powell, J.J.; Kazan, K. Emerging Roles and Landscape of Translating MRNAs in Plants. Front. Plant Sci. 2017, 8, 1443. [Google Scholar] [CrossRef] [Scilit] [PubMed]
  14. Vargas-Almendra, A.; Ruiz-Medrano, R.; Núñez-Muñoz, L.A.; Ramírez-Pool, J.A.; Calderón-Pérez, B.; Xoconostle-Cázares, B. Advances in Soybean Genetic Improvement. Plants 2024, 13, 3073. [Google Scholar] [CrossRef] [Scilit] [PubMed]
  15. Maluk, M.; Giles, M.; Wardell, G.E.; Akramin, A.T.; Ferrando-molina, F.; Murdoch, A.; Barros, M.; Beukes, C.; Harrison, E.; Daniell, T.J.; et al. Biological Nitrogen Fi Xation by Soybean (Glycine Max [L.] Merr.), a Novel, High Protein Crop in Scotland, Requires Inoculation with Non-Native Bradyrhizobia. Front. Agron. 2023, 5, 1196873. [Google Scholar] [CrossRef] [Scilit]
  16. Staudinger, C.; Mehmeti-Tershani, V.; Gil-Quintana, E.; Gonzalez, E.M.; Hofhansl, F.; Bachmann, G.; Wienkoop, S. Evidence for a Rhizobia-Induced Drought Stress Response Strategy in Medicago truncatula. J. Proteom. 2016, 136, 202–213. [Google Scholar] [CrossRef] [Scilit] [PubMed]
  17. Álvarez-Aragón, R.; Palacios, J.M.; Ramírez-Parra, E. Rhizobial Symbiosis Promotes Drought Tolerance in Vicia sativa and Pisum sativum. Environ. Exp. Bot. 2023, 208, 105268. [Google Scholar] [CrossRef] [Scilit]
  18. López, C.M.; Alseekh, S.; Torralbo, F.; Martínez Rivas, F.J.; Fernie, A.R.; Amil-Ruiz, F.; Alamillo, J.M. Transcriptomic and Metabolomic Analysis Reveals That Symbiotic Nitrogen Fixation Enhances Drought Resistance in Common Bean. J. Exp. Bot. 2023, 74, 3203–3219. [Google Scholar] [CrossRef] [Scilit] [PubMed]
  19. Ceserani, T.; Trofka, A.; Gandotra, N.; Nelson, T. VH1/BRL2 Receptor-like Kinase Interacts with Vascular-Specific Adaptor Proteins VIT and VIK to Influence Leaf Venation. Plant J. 2009, 57, 1000–1014. [Google Scholar] [CrossRef] [Scilit] [PubMed]
  20. Prasad, B.D.; Goel, S.; Krishna, P. In Silico Identification of Carboxylate Clamp Type Tetratricopeptide Repeat Proteins in Arabidopsis and Rice as Putative Co-Chaperones of Hsp90/Hsp70. PLoS ONE 2010, 5, e12761. [Google Scholar] [CrossRef] [Scilit] [PubMed]
  21. Goodstein, D.M.; Shu, S.; Howson, R.; Neupane, R.; Hayes, R.D.; Fazo, J.; Mitros, T.; Dirks, W.; Hellsten, U.; Putnam, N.; et al. Phytozome: A Comparative Platform for Green Plant Genomics. Nucleic Acids Res. 2012, 40, 1178–1186. [Google Scholar] [CrossRef] [Scilit] [PubMed]
  22. Lescot, M.; Déhais, P.; Thijs, G.; Marchal, K.; Moreau, Y.; Peer, Y.V.D.; Rouzé, P.; Rombauts, S. PlantCARE, a Database of Plant Cis-Acting Regulatory Elements and a Portal to Tools for in Silico Analysis of Promoter Sequences. Nucleic Acids Res. 2002, 30, 325–327. [Google Scholar] [CrossRef] [Scilit] [PubMed]
  23. Merchante, C.; Stepanova, A.N.; Alonso, J.M. Translation Regulation in Plants: An Interesting Past, an Exciting Present and a Promising Future. Plant J. 2017, 90, 628–653, Correction in Plant J. 2019, 98, 1157–1157. https://doi.org/10.1111/tpj.14359. [Google Scholar] [CrossRef] [Scilit] [PubMed]
  24. Szklarczyk, D.; Gable, A.L.; Nastou, K.C.; Lyon, D.; Kirsch, R.; Pyysalo, S.; Doncheva, N.T.; Legeay, M.; Fang, T.; Bork, P.; et al. The STRING Database in 2021: Customizable Protein–Protein Networks, and Functional Characterization of User-Uploaded Gene/Measurement Sets. Nucleic Acids Res. 2021, 49, D605–D612, Correction in Nucleic Acids Res. 2021, 49, 10800. https://doi.org/10.1093/nar/gkab835. [Google Scholar] [CrossRef] [Scilit] [PubMed]
  25. Law, K.C.; Chung, K.K.; Zhuang, X. An Update on Coat Protein Complexes for Vesicle Formation in Plant Post-Golgi Trafficking. Front. Plant Sci. 2022, 13, 826007. [Google Scholar] [CrossRef] [Scilit] [PubMed]
  26. Píriz-Pezzutto, S.; Martínez-Moré, M.; Sainz, M.M.; Borsani, O.; Sotelo-Silveira, M. Arabidopsis Root Apical Meristem Adaptation to an Osmotic Gradient Condition: An Integrated Approach from Cell Expansion to Gene Expression. Front. Plant Sci. 2024, 15, 1465219. [Google Scholar] [CrossRef] [Scilit] [PubMed]
  27. Dziewit, K.; Wabnik, K.; Szal, B.; Podgórska, A. Nitrogen Sources Modulate Auxin Transport to Fine—Tune Root System Architecture. Plant Cell Rep. 2026, 45, 164. [Google Scholar] [CrossRef] [Scilit] [PubMed]
  28. Jones, P.; Binns, D.; Chang, H.-Y.; Fraser, M.; Li, W.; McAnulla, C.; McWilliam, H.; Maslen, J.; Mitchell, A.; Nuka, G.; et al. InterProScan 5: Genome-Scale Protein Function Classification. Bioinformatics 2014, 30, 1236–1240. [Google Scholar] [CrossRef] [Scilit] [PubMed]
  29. Altschul, S.F. BLAST Algorithm. In Encyclopedia of Life Sciences; Wiley: Hoboken, NJ, USA, 2014; pp. 1–5. [Google Scholar] [CrossRef] [Scilit]
  30. Charif, D.; Lobry, J.R. SeqinR 1.0-2: A Contributed Package to the R Project for Statistical Computing Devoted to Biological Sequences Retrieval and Analysis. In Structural Approaches to Sequence Evolution; Bastolla, U., Porto, M., Roman, H.E., Vendruscolo, M., Eds.; Springer: New York, NY, USA, 2007; p. 207232. [Google Scholar] [CrossRef] [Scilit]
  31. Chou, K.C.; Shen, H. Bin Plant-MPLoc: A Top-down Strategy to Augment the Power for Predicting Plant Protein Subcellular Localization. PLoS ONE 2010, 5, e11335. [Google Scholar] [CrossRef] [Scilit] [PubMed]
  32. Bailey, T.L.; Johnson, J.; Grant, C.E.; Noble, W.S. The MEME Suite. Nucleic Acids Res. 2015, 43, W39–W49. [Google Scholar] [CrossRef] [Scilit] [PubMed]
  33. R Core Team. R: A Laguage and Environment for Statistical Computing; R Foundation for Statistical Computing: Vienna, Austria, 2021. [Google Scholar]
  34. Kolde, R. Pheatmap: Pretty Heatmaps, version 1.0.12; The Comprehensive R Archive Network: Wien, Austria, 2019. [Google Scholar]
  35. Bodenhofer, U.; Bonatesta, E.; Horejs-Kainrath, C.; Hochreiter, S. Msa: An R Package for Multiple Sequence Alignment. Bioinformatics 2015, 31, 3997–3999. [Google Scholar] [CrossRef] [Scilit] [PubMed]
  36. Schliep, K.P. Phangorn: Phylogenetic Analysis in R. Bioinformatics 2011, 27, 592–593. [Google Scholar] [CrossRef] [Scilit] [PubMed]
  37. Sreedasyam, A.; Plott, C.; Hossain, M.S.; Lovell, J.T.; Grimwood, J.; Jenkins, J.W.; Daum, C.; Barry, K.; Carlson, J.; Shu, S.; et al. JGI Plant Gene Atlas: An updateable transcriptome resource to improve functional gene descriptions across the plant kingdom. Nucleic Acids Res. 2023, 51, 8383–8401. [Google Scholar] [CrossRef] [Scilit] [PubMed]
  38. Vincent, J. A Manual for the Practical Study of Root-Nodule Bacteria; IBP Handbook; Blackwell Scientific Publications: Oxford, UK, 1970. [Google Scholar]
  39. Broughton, W.J.; Dilworth, M.J. Control of Leghaemoglobin Synthesis in Snake Beans. Biochem. J. 1971, 125, 1075–1080. [Google Scholar] [CrossRef] [Scilit] [PubMed]
  40. Bolger, A.M.; Lohse, M.; Usadel, B. Trimmomatic: A Flexible Trimmer for Illumina Sequence Data. Bioinformatics 2014, 30, 2114–2120. [Google Scholar] [CrossRef] [Scilit] [PubMed]
  41. Patro, R.; Duggal, G.; Love, M.I.; Irizarry, R.A.; Kingsford, C. Salmon Provides Fast and Bias-Aware Quantification of Transcript Expression. Nat. Methods 2017, 14, 417–419. [Google Scholar] [CrossRef] [Scilit] [PubMed]
  42. Soneson, C.; Love, M.I.; Robinson, M.D. Differential Analyses for RNA-Seq: Transcript-Level Estimates Improve Gene-Level Inferences. F1000Research 2016, 4, 1521. [Google Scholar] [CrossRef] [Scilit] [PubMed]
  43. Love, M.I.; Huber, W.; Anders, S. Moderated Estimation of Fold Change and Dispersion for RNA-Seq Data with DESeq2. Genome Biol. 2014, 15, 550. [Google Scholar] [CrossRef] [Scilit] [PubMed]
  44. Wickham, H. Ggplot2: Elegant Graphics for Data Analysis; Springer: Berlin/Heidelberg, Germany, 2016; Volume 174. [Google Scholar]
  45. Jensen, L.J.; Kuhn, M.; Stark, M.; Chaffron, S.; Creevey, C.; Muller, J.; Doerks, T.; Julien, P.; Roth, A.; Simonovic, M.; et al. STRING 8—A Global View on Proteins and Their Functional Interactions in 630 Organisms. Nucleic Acids Res. 2009, 37, 412–416. [Google Scholar] [CrossRef] [Scilit] [PubMed]
Figure 1. Phylogenetic tree, conserved motif, and gene structure of Glycine max TTL genes (GmTTL). (a) Phylogenetic relationship among the GmTTL based on the amino acid sequence alignment. (b) The GmTTL proteins showed conservation in the number and position of the TPR and TRLX motifs. (c) Exon–intron structures of GmTTL genes. A bootstrap-supported reconstruction of the phylogenetic tree is provided in Supplementary Figure S2.
Stresses 06 00069 g001
Figure 2. Phylogenetic tree of TTL proteins from Glycine max, Medicago truncatula, Lotus japonicus and Arabidopsis thaliana. A bootstrap-supported reconstruction of this tree is provided in Supplementary Figure S3.
Stresses 06 00069 g002
Figure 3. Phylogenetic and sequence analyses of TRXL domains. (a) Phylogenetic analysis of the TRXL domain of the TTLs from Glycine max, Medicago truncatula, Lotus japonicus and Arabidopsis thaliana. We included the protein sequence of a genuine thioredoxin (At3g17880). (b) The alignment of the TRXL domains showed that the homologous regions lack at least one of the two-Cys motif (indicated with *) (WCGPC) required for thioreductase activity. A bootstrap-supported reconstruction of the TRXL-domain phylogeny shown in panel (a) is provided in Supplementary Figure S4.
Stresses 06 00069 g003
Figure 4. Phylogenetic relationship among individual TPR motifs. An unrooted tree was built using the six TPR sequences of the four Glycine max proteins and TPR sequences from TTL orthologs from Medicago truncatula, Lotus japonicas, and Arabidopsis thaliana. A bootstrap-supported reconstruction of this analysis is provided in Supplementary Figure S5.
Stresses 06 00069 g004
Figure 5. Analysis of promoter region and Cis-Regulatory Elements (CREs) for GmTTL. (a) Pairwise sequence comparison between the promoter regions of the GmTTLs using 2000 bp upstream of the TSS. The analysis showed a range of 24% to 52% identity between the promoters of all GmTTLs. (b) Number and localization of the more frequent cis-acting elements in the promoter regions of the GmTTL gene family. A 2000 bp genomic region upstream of the Transcriptional Start Site (TSS) of GmTTL sequences was analyzed using PlantCARE [22] to predict cis-regulatory elements (CREs). The identified cis-acting elements are labeled in different colors. The illustration excludes the TATA-box and CAAT-box.
Stresses 06 00069 g005
Figure 6. Differential expression analysis and GmTTL expression patterns in nodulated (N) soybean plants under water restriction (WR). (a) Venn diagrams illustrating the numbers of up- and downregulated genes identified in the (i) N + WR vs. N + WW and (ii) N + WR vs. NN + WR comparisons in total RNA (TOTAL) and polysome-associated RNA (PAR) fractions. (b) Heatmap depicting the expression patterns of GmTTLs based on the RNA-Seq data generated in this study. The asterisk denotes the GmTTL gene identified as differentially expressed in the present analysis. Genes showing |log2FC| > 1 and an adjusted p-value (padj) < 0.05 were classified as differentially expressed.
Stresses 06 00069 g006
Figure 7. String analysis derived protein–protein interaction network obtained from WGCNA M7 downregulated genes at the PAR level in nodulated and water-restricted soybean plants with respect to nodulated and well-watered soybean plants ((i) N + WR vs. N + WW comparison). This subset of differentially expressed genes is highlighted in bold in Table S4, and also is shown in Table S5. The network nodes represent proteins. Connecting lines denote protein–protein associations whose thickness indicates the strength of data support. The GO_BP terms are specified in the legends according to their colors. The number of nodes and edges are 356 and 171, respectively. PPI enrichment p-value < 1.0 × 10⁻¹⁶, and the minimum required interaction score was set to 0.400 (medium confidence). Disconnected nodes, i.e., proteins that showed no interactions in the network, were removed.
Stresses 06 00069 g007
Disclaimer/Publisher’s Note: The statements, opinions and data contained in all publications are solely those of the individual author(s) and contributor(s) and not of MDPI and/or the editor(s). MDPI and/or the editor(s) disclaim responsibility for any injury to people or property resulting from any ideas, methods, instructions or products referred to in the content.