Article

Dose-Dependent Effects of Boron on Photosynthetic and Oxidative Processes in Young Sugar Beet (Beta vulgaris L.) Plants

1
Institute of Agronomy, Hungarian University of Agriculture and Life Sciences, H-7400 Kaposvár, Hungary
2
Institute of Plant Protection, Hungarian University of Agriculture and Life Sciences, H-8360 Keszthely, Hungary
*
Author to whom correspondence should be addressed.
Stresses 2025, 5(4), 61; https://doi.org/10.3390/stresses5040061
Submission received: 5 September 2025 / Revised: 10 October 2025 / Accepted: 13 October 2025 / Published: 16 October 2025
(This article belongs to the Collection Feature Papers in Plant and Photoautotrophic Stresses)

Abstract

Sugar beet (Beta vulgaris L.) is very sensitive to fluctuations in micronutrient availability, and either an excess or a shortage of boron (B) may reduce the plant’s development and its ability to withstand stress. B is essential for photosynthesis and cell wall integrity, but the physiological requirements for an optimal supply during early development remain unclear. The photosynthetic efficiency and oxidative stress reactions of sugar beet seedlings were tested under five different B concentrations: 0, 50, 500, 1000, and 2000 µM H3BO3. Integrating non-invasive methods like SPAD, delayed fluorescence (DF), and maximum quantum efficiency of PSII (Fv/Fm) with red–green–blue (RGB) imaging enabled the detailed processing of both the initial and decay phases of DF. According to the results, SPAD and Fv/Fm were not sensitive indicators of early B stress; however, DF decay slopes and red–green–blue pixel distribution distinguished between optimum (500 µM), inadequate (0 µM), and hazardous (2000 µM) treatments. Moreover, lipid oxidation-related biochemical analyses were used to evaluate the ferric reducing antioxidant capacity (FRAP) and malondialdehyde (MDA) concentration. At the extremes of insufficiency and toxicity, MDA levels demonstrated enhanced lipid peroxidation, while FRAP increased with B concentration. The outcome of the research revealed optimum (500 µM) and toxicity-inducing (2000 µM) concentrations at early stages of sugar beet development. The study highlights that the combined use of DF kinetics and RGB analysis provides valuable, non-invasive markers for the early identification of B-stress, which is also confirmed by biochemical indicators, thereby promoting more efficient micronutrient management in sugar beet cultivation.

1. Introduction

More than 100 million tons of sugar beet are produced annually in the European Union, making this crop the most important sugar source for countries on the continent [1]. In the 21st century, the area under sugar beet cultivation has decreased significantly, but the EU27, as a whole, remains the world’s second largest consumer of sugar [2]. As a result of the 2006 reform of the European Common Market Organisation (CMO) for sugar, four of the five sugar factories operating in Hungary closed down, and the area under cultivation has decreased to approximately 10,000 hectares over the past decade [3]. During the 2024 campaign period in Hungary, the digestibility of sugar beet was 13.92%, the lowest in years. Hoffmann et al. [4] pointed out that sugar beet quality was poorer in southern and Eastern Europe than in the other three regions. Accordingly, improving sugar beet quality requires particular attention in these parts of Europe. Nutrient supply is a key factor in achieving high yields and good quality, and within this, the micronutrient supply strategy is important for maximizing sugar beet production [5,6,7].
Sugar beet is highly responsive to micronutrients, and their deficiency is one of the most important stress factors [8]. The application of boron (B) and zinc (Zn) in combination with various macronutrient mixtures can play an important role in improving sugar beet yield and quality [9].
B is an essential micronutrient for higher plants and one of the most important for proper plant growth, yield, and quality [10,11,12]. Boron uptake and transport in plants are regulated by specific membrane proteins: borate efflux transporters such as BOR1 are primarily involved in boron loading into the xylem of roots, while the aquaporin NIP5;1 is essential for efficient root uptake, while NIP6;1 mediates transport from the xylem to the phloem. In addition, the BOR2 transporter is important for maintaining cross-linking and root elongation. The expression of transporters is controlled by transcription factors of the WRKY and NAC families, and there is a strong induction of NIP5;1 and BOR2 expression, and the activation of WRKY and bHLH transcription factors in B-efficient sugar beet varieties contributed to improved boron utilization and increased stress tolerance [13].
The range of B concentrations essential for normal plant function is very narrow [14], and it has different properties, in terms of its plant physiological role, from other elements; for example, it is not an enzyme component or cofactor, does not bind to them, and also does not participate in redox reactions [15]. However, it performs many important functions in plants, as it plays a key role in cell wall synthesis and its structural integration [16,17]. It is linked to the structure of pectin, glycosylinositol-phosphorylceramides (GIPCs) and rhamnoglacturonan-II (RG-II) via B cross-linking [18,19], which regulates cell wall strength [20], and its absence leads to the formation of abnormal cell walls with greatly reduced flexibility [21,22]. Although most research focuses on the B function of the cell wall and cell membrane, it is also involved in cell division and elongation, ascorbic acid and polyphenol transport, as well as sugar transport and antioxidant processes [17,23,24]. The expression of peroxidase (POD), phosphoadenosine phosphosulfate reductase (thioredoxin) family proteins, and glutathione S-transferase (GST) increases in B-deficient roots and leaves [25,26], and the ROS-free radical scavenging capacity is enhanced [23,27].
In most cases, plants increase antioxidant activity to reduce stress-induced damage [28]. This phenomenon also applies to B toxicity, the presence of which increases the activity of key enzymes in the antioxidant system, such as catalase (CAT), superoxide dismutase (SOD), guaiacol peroxidase (POD), ascorbate peroxidase (APX), glutathione reductase (GR), monodehydroascorbate reductase (MDHAR), and dehydroascorbate reductase (DHAR) [29,30]. Nonetheless, B can also mitigate damage induced by stress; the incorporation of B supplementation enhances the non-enzymatic antioxidant mechanisms via carotenoids, phenolic compounds, and proline concentration, hence diminishing oxidative damage [31]. Certain particular and complementary roles of boron in plant growth and development remain inadequately elucidated; yet, it is evident that soon after root absorption, it is mostly translocated to developing tissues, including meristems and reproductive organs [32], and early studies on B nutrition have shown that B deficiency causes root tip abnormalities and cell division disorders [33,34]. It has also been observed that B deficiency affects young and growing parts, inhibiting the growth of young leaves, which become smaller and darker in color [35]. On the other hand, B toxicity can also damage agricultural production by inhibiting root growth, causing leaf tip necrosis and chlorosis, which may reduce the quality and quantity of the harvested crops [36,37,38,39]. Relatively little information is available on the metabolism of boron in sugar beets in terms of toxicity symptoms compared to the range of plant reactions caused by boron deficiency. Nevertheless, there are a few studies that attempt to address this area in detail.
Huo et al. [40] found that boron toxicity primarily damages photosystem II in sugar beets, reducing the plant’s ability to absorb and utilize light energy. The primary reason for this is that B poisoning reduces the concentration of photosynthetic pigments and shows clear signs of toxicity in the form of cell membrane damage and an increase in MDA concentration.
As boron concentration increases, the PSII activity of plants decreases, and both the maximum photosynthetic efficiency of PSII and the photosynthetic performance index also decrease. At the same time, the energy allocation parameters of the PSII reaction center also changed, with a decrease in light energy utilization capacity and the amount of energy used for electron transfer, and a parallel increase in heat dissipation. Overall, this change indicates a significant decrease in photosynthetic efficiency. In addition, the activity of catalase, peroxidase, and superoxide dismutase enzymes increased, and malondialdehyde accumulated.
High concentrations of boron (30 mg/L) have numerous negative effects on the development and functioning of sugar beets. Boron slows down both root and shoot growth and reduces leaf expansion, but a general thickening of leaf tissue can be observed as a consequence of hormonal balance disruptions: a decrease in indoleacetic acid, gibberellin, and zeatin, but an increase in abscisic acid levels. Boron stress not only boosted antioxidant enzymes and lipid oxidation levels, but also elevated proline levels in sugar beet leaves. Furthermore, boron stress significantly inhibited normal beet growth via the influence of endogenous hormone levels and oxidative stress responses [26].
In recent years, the role of B in photosynthetic processes has emerged, particularly in sugar beet plants [40,41], which is also an area that requires further exploration [42]. In a study by Galeriani [43], an increase in photosynthetic activity was observed in response to Ca + B foliar fertilization, which was triggered by an improvement in gas exchange parameters and an increase in Ribulose-1,5-bisphosphate carboxylase/oxygenase (RuBisCO) activity. In addition, it has been shown that the presence of large amounts of B can cause damage to the reaction centers of photosystem II, which is associated with lower chlorophyll and carotenoid levels [44]; however, details of B effect on photosynthesis are yet to be identified.
Methods for monitoring the evolution of abiotic stress in plants are extremely important for agricultural production [45], in which instruments for non-invasive monitoring play an important role [46]. An innovative approach that can be performed in vivo is the measurement of biophoton emission, which allows for a new approach to determining the dynamics of stress development and how photon emission of plants changes in the presence of stress factors [47]. The process of delayed fluorescence (DF) arises from the recombination of charge-separated states within photosystem II (PSII) after illumination has ceased. When plants are kept in darkness, forward electron transport is blocked, and the electrons trapped in the acceptor side of PSII can recombine with oxidized donor-side components, which results in an excited singlet state of P680+, leading to the emission of photons. Since this process directly reflects the redox state of the photosynthetic electron transport chain, DF provides a sensitive indicator of the functional status of the photosynthetic apparatus [48]. DF measurements can be applied for in vivo stress detection and have been shown to distinguish between the effects of different microelement supplies [49].
Although the influence of boron supply on the initial growth of sugar beet has been studied, these analyses mostly focus on deficiency symptoms [50] or on the increased resilience to B deficiency in B-efficient sugar beet varieties [51]. The doses utilized in sugar beet therapy may vary, and there is no consensus on the threshold that signifies an overdose for the plant. Song [26] administered treatments of 0.05, 0.5, 2, and 30 mg/L, identifying the lowest dosage (0.8 µM) as deficient and the maximum (485 µM) as hazardous. Porcel [52] determined that a 50 µM B supply is the optimal concentration for sugar beet.
Therefore, the present experiment aimed to investigate the effects of complete B lack (0 µM) and varied B supply (50, 500, 1000, and 2000 µM H3BO3) on sugar beet seedlings, with particular emphasis on photosynthesis-related, oxidative physiological, and biochemical responses. The study focused on exploring the role of different doses of B in the development of photosynthetic activity and parameters related to oxidative stress. Consequently, delayed fluorescence (DF), fluorescence induction (Fv/Fm), and SPAD values for assessing chlorophyll concentration were quantified, offering a precise representation of the photosynthetic apparatus’s functionality and the potential stress impacts of B. In addition, ferric reducing ability of plasma (FRAP) was used to assess the non-enzymatic antioxidant capacity of the plants, while malondialdehyde (MDA) content was measured to evaluate the extent of lipid oxidation.
This work was conducted with the aim of obtaining a comprehensive insight and better understanding of the effects of varying B concentrations on sugar beet and identifying physiological responses that might be crucial to optimizing nutrient delivery and enhancing plant stress tolerance during early development stages (BBCH 11-14) of sugar beet.

2. Results

2.1. Chlorophyll Content Estimation and Maximum Quantum Efficiency of PSII

The results of the SPAD index, which is used to estimate chlorophyll content, are shown in Figure 1A. At 0 µM, we measured an average SPAD index of 29.34 ± 3.82, with a lower mean only in the treatment with the highest B concentration (2000 µM; 28.01 ± 7.16). The B treatments did not cause significant differences compared to the group not treated with B, but an increase in chlorophyll content was observed in the 50 µM treatment. The highest average was obtained in the 500 µM treatment group (32.84 ± 6.99). Although no statistically significant differences were observed, it can be concluded that certain concentrations of B had a stimulating effect on chlorophyll content.
The Fv/Fm values measured on the plants illustrate the maximum quantum efficiency of PSII (Figure 1B), which was measured by FluorPen FP 110/D. The results showed that there were no significant differences in the maximum quantum efficiency of PSII between the treatments. The average values for the groups were around 0.84 (50 µM, 500 µM) and 0.85 (0 µM, 1000 µM, 2000 µM), which reflect the healthy state of the photosynthetic apparatus. Statistical analyses also showed no detectable differences between treatments, suggesting that B treatments did not affect the maximum efficiency of PSII.

2.2. Changes in Delayed Fluorescence (DF)

2.2.1. Changes in Overall Delayed Fluorescence (DF)

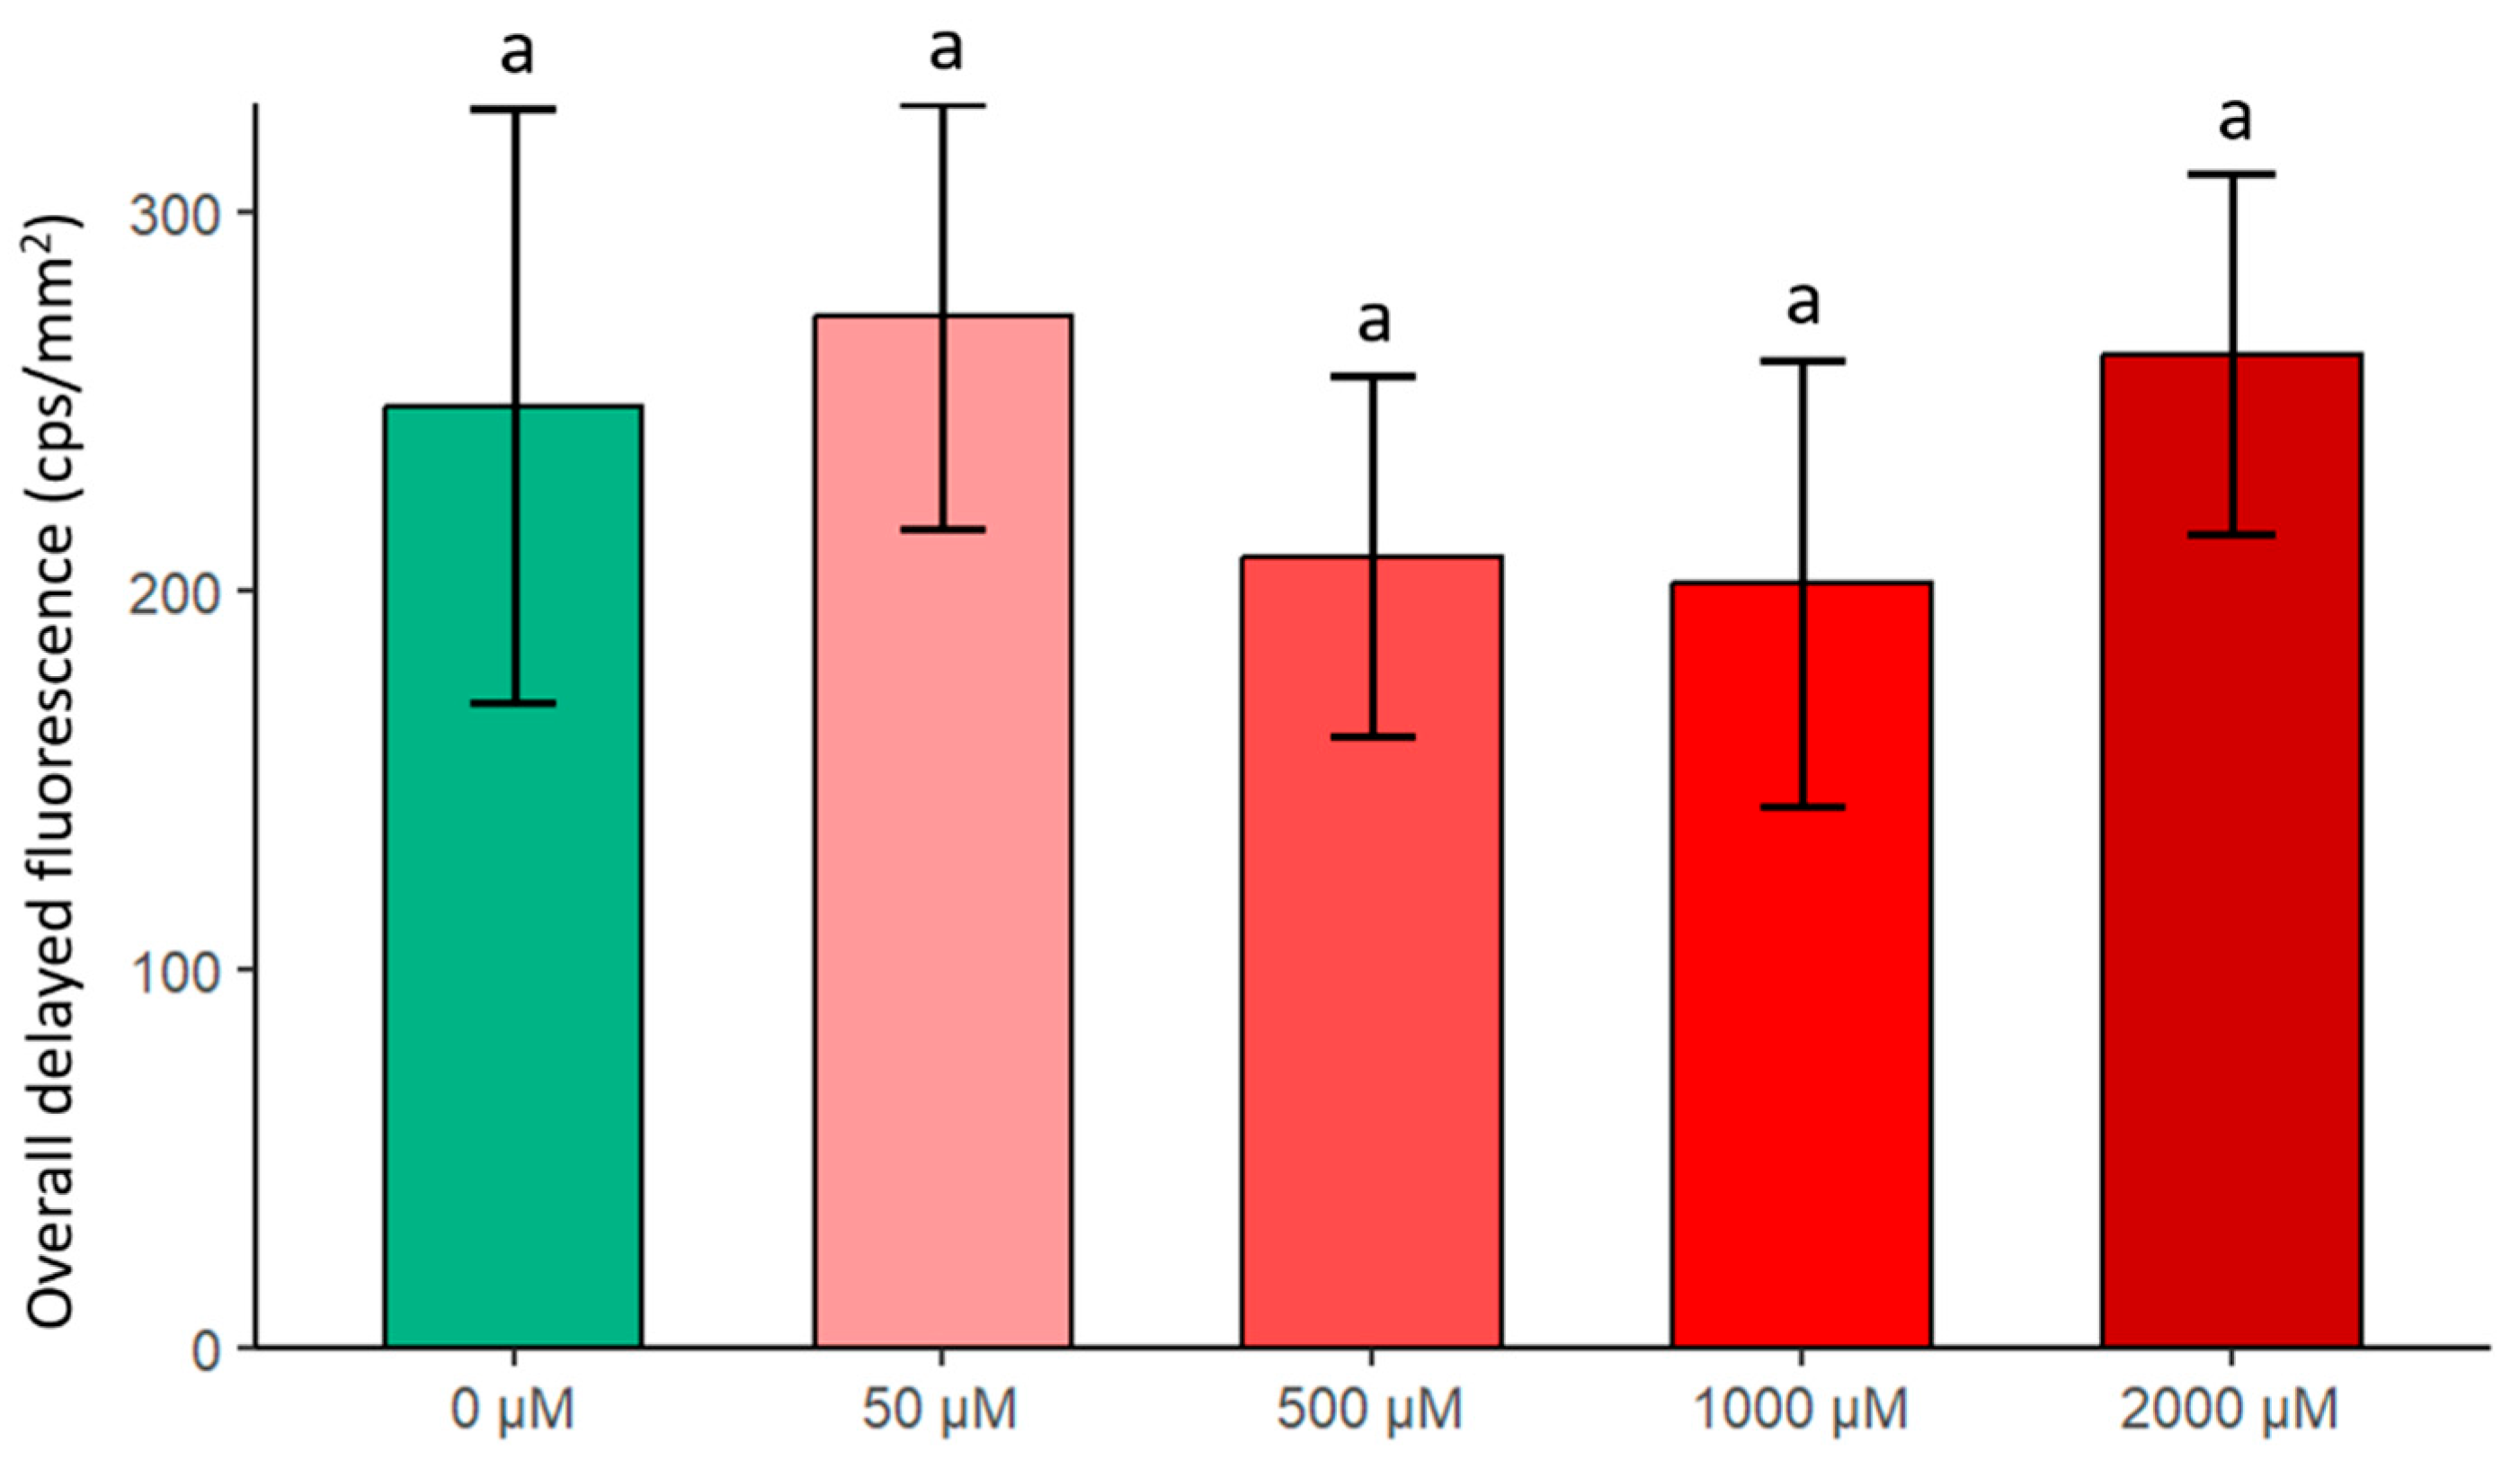
The overall DF results also did not show significantly distinguishable values, but differences can be observed visually in the barplot (Figure 2). Compared to the B-free group, higher biophoton emissions were observed in the 50 µM and 2000 µM treatments, which showed increases of 9.45% and 5.54%, respectively. For the other treatments, the overall emissions were lower, with values below 200 cps. Based on these results, the 50 µM treatment showed the best overall values in terms of photosynthetic parameters.
The DF signal value in the first minute is a characteristic parameter of the stress state, but since it did not result in significant differences between treatments, we intended to subject it to a rapid but informative analysis that shows the total photon intensity emitted in a slightly more detailed way. Therefore, we used spectral analysis. Figure 3 shows the results of the images displaying the one-minute photon intensities expressed as red–green–blue color mapping percentages, where dark colors, blue and purple, indicate lower photon emission, and red and orange indicate higher intensities, which correspond to the colors of the pseudocolor scale assigned by the IndiGO™ software during analysis of the photon detection.
The upper section (A) of the figure illustrates the interrelationship between the channel values, whereas the lower segment (B) depicts the percentage distribution of the three channels. The results indicate that as concentration increases, the blue component becomes predominant, particularly at 2000 µM. Nonetheless, the green component increases at lower doses (0–50 µM) but then decreases consistently at elevated values. The red component remains negligible, exhibiting only modest oscillations. The green and blue channels exhibited normalcy (p > 0.05); however, the red channel did not (p = 0.0025). Moreover, variances were determined to be non-homogeneous across channels (Levene’s test, p = 0.0173); consequently, a non-parametric Friedman test was conducted, revealing a highly significant channel effect (χ2 = 25.20, p = 3.37 × 10⁻⁶). The Wilcoxon test was subsequently employed with Holm correction for pairwise comparison of differences. The test findings indicated a blue > green > red hierarchy, with all pairwise differences being significant: red-green: 1.83 × 10⁻⁴; red-blue: 1.83 × 10⁻⁴; and green-blue: 2.56 × 10⁻².

2.2.2. Changes in Delayed Fluorescence Decay

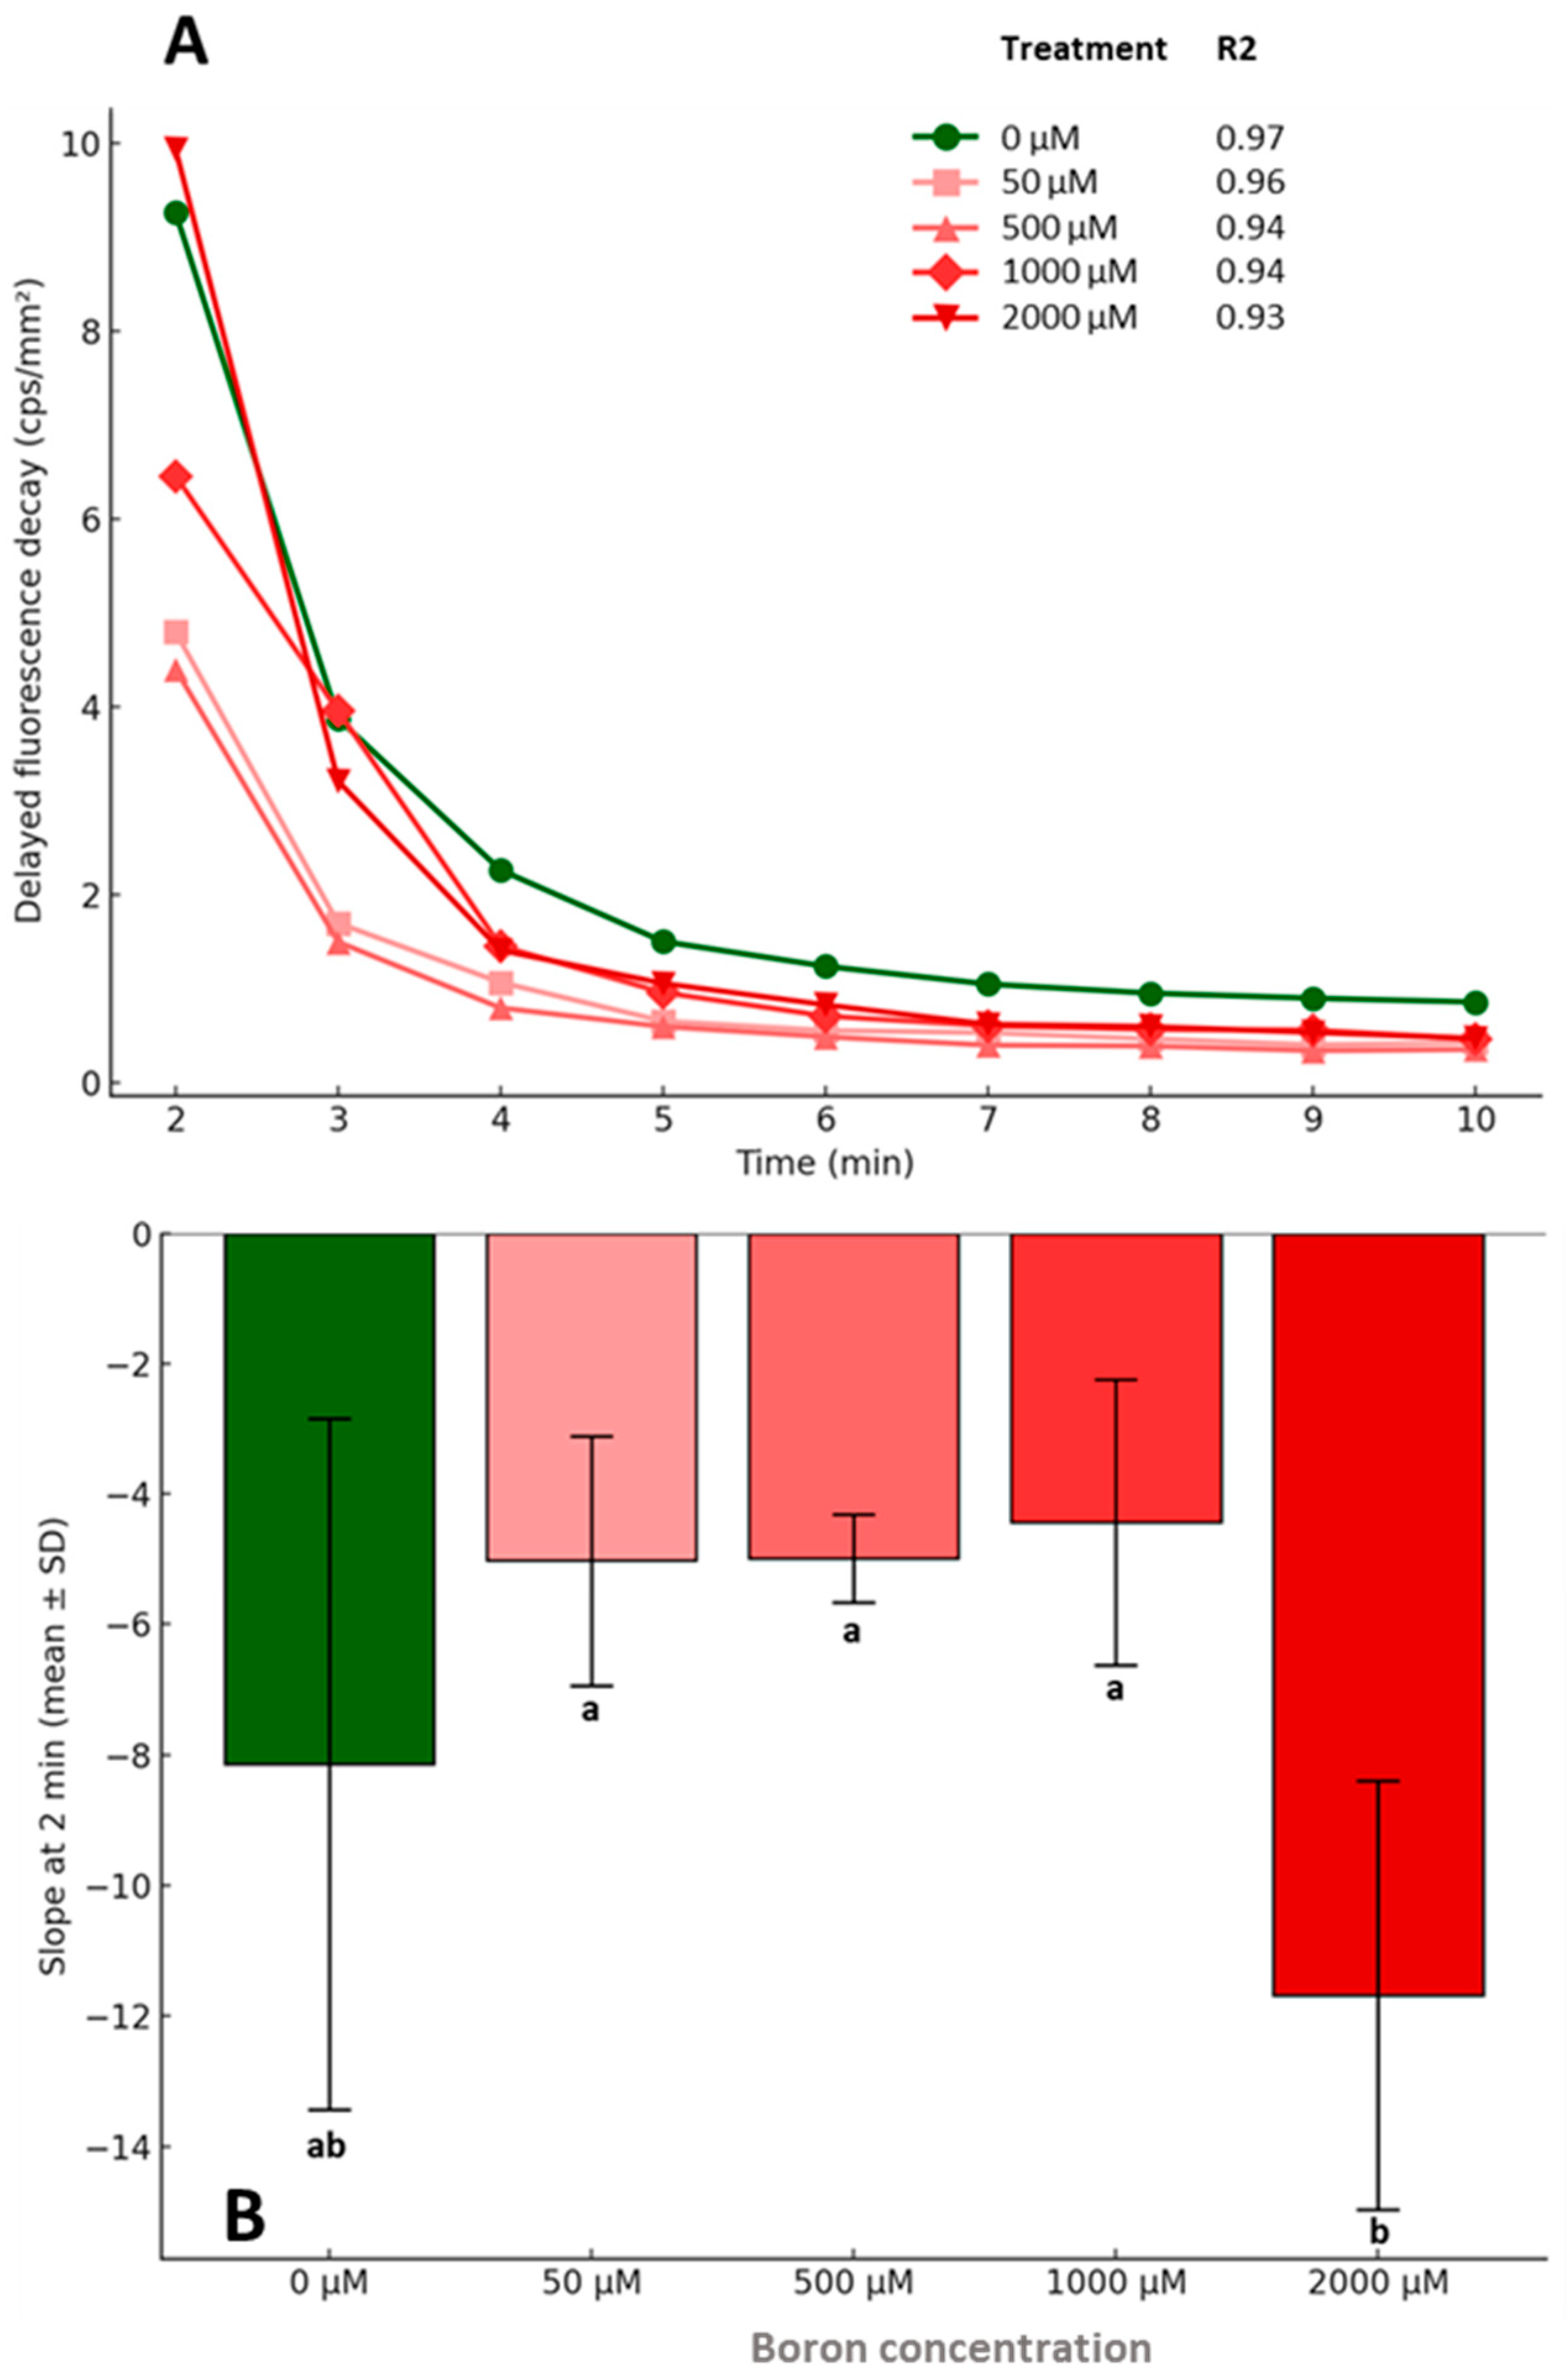
The decay of DF is a sensitive indicator of the physiological condition of plants. The decrease in intensity over time was plotted on a log scale (Figure 4A), while the slope values are shown in a bar chart (Figure 4B). In contrast to the overall DF results, significant differences were found here. The most intense decrease was observed in the 0 µM, 1000 µM, and 2000 µM treatments, while the decline was more moderate in the 50 µM and 500 µM treatments. In the case of the 2000 µM treatment, the intensity of the DF decrease was significantly higher than in the 50 µM, 500 µM and 1000 µM treatments (p = 0.0221). This suggests that lower concentrations of B are capable of stabilizing the state of the photosynthetic apparatus, moderating the rapid decay of fluorescence, while higher concentrations induce it. The R2 values of the fitted exponential trend lines were high for all treatment groups, indicating that the model accurately describes the temporal variation in DF intensity. The strongest fit was at 0 µM (R2 = 0.97), while the fit gradually decreased with increasing concentration, reaching a value of 0.93 at the highest B treatment. This suggests that, although the model reliably explains the data in all cases, individual variability increased at higher concentrations, which slightly weakened the explanatory power of the trend line.

2.3. Changes in Lipidoxidation-Related Processes

2.3.1. Changes in FRAP

The antioxidant capacity of plant samples was determined using the FRAP test (Figure 5). The average value of the control was 2.92 ± 0.26 nM AA equivalent/g fresh weight. Only the 50 µM treatment induced a lower value (2.39 ± 0.54). The 500 µM treatment resulted in a 25.51% increase, while the 1000 µM treatment resulted in a 28.93% increase compared to the 0 µM control, which represented a statistically significant difference (p = 0.0037). The highest treatment (2000 µM) produced the highest antioxidant capacity, which was significantly higher than the other treatments (p < 0.001). These results suggest that medium and high concentrations of B stimulated the antioxidant defense system of the plants. The fitted trend line showed that there was a strong positive correlation between B concentration and FRAP values (R2 = 0.992), further confirming the concentration-dependent effects of B treatments.

2.3.2. Changes in MDA

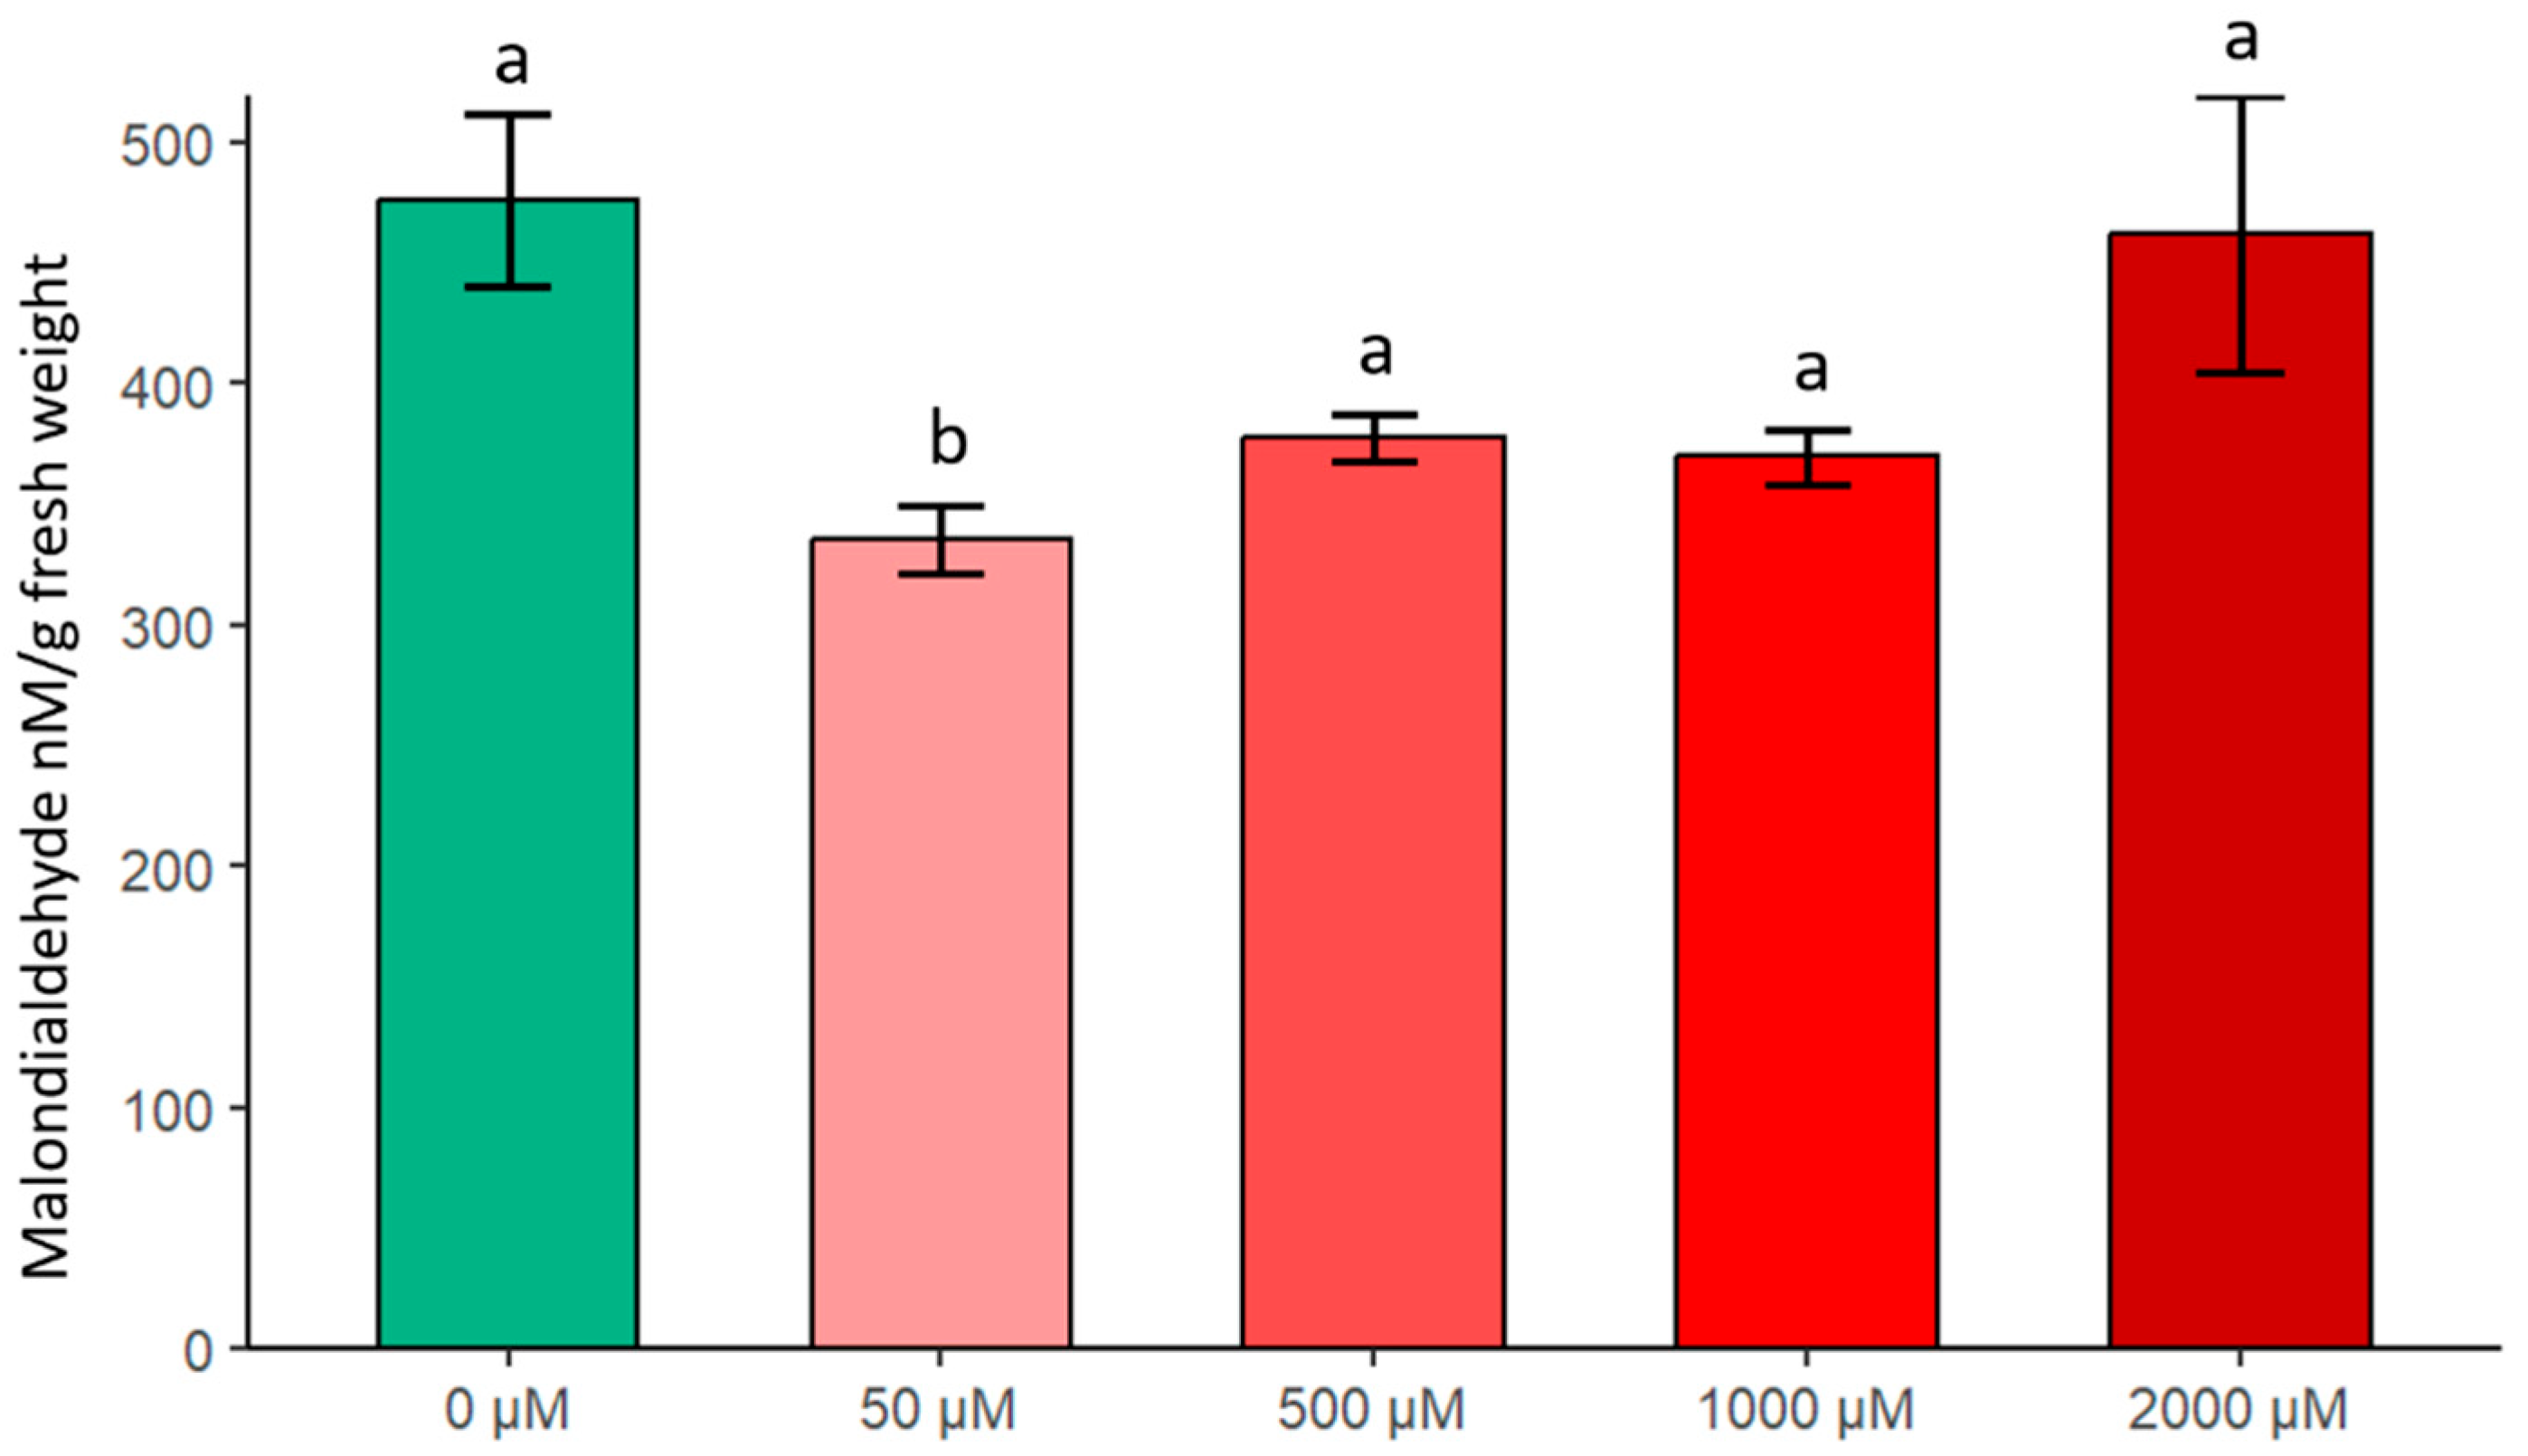
The results of malondialdehyde measurement are shown in Figure 6. The two highest lipid oxidation levels were found in the 0 μM (508 ± 38) and 2000 μM (461 ± 57.32) groups. The 500 μM treatment resulted in a 26.05% decrease, and the 1000 μM treatment resulted in a 28.93% decrease compared to the B-free treatment. The treatment with the lowest concentration of B exhibited the lowest MDA level, which showed a significant difference from all the other treatments in the Kruskal–Wallis + Dunn post hoc test (p = 0.046).

3. Discussion

The early phase of plant development is often investigated by non-invasive analytical techniques, which are less common in sugar beet research compared to other crop species. In most of the cases, the investigations aim towards disease and pest prediction and detection [53,54], differentiation of basic morphological changes [55], or determining macroelement deficiency symptoms [56] rather than focusing on microelement supply issues. Therefore, to our knowledge, this work is the first to characterize B deficiency using a non-destructive, photon emission-based technique.
Previous investigations proved that the values of DF, FRAP, and MDA in combination have consistently demonstrated efficacy as rapid and reliable stress indicators related to leaf damage due to infestation [57], heat stress [58], zinc deficiency and toxicity, as well as the impacts of cadmium [48]. This study further validates the suitability of these measures for identifying stress development at the juvenile stage of sugar beet and, with the incorporation of color analyses, provides a step towards a more sophisticated analysis of those parameters before the occurrence of apparent stress symptoms induced by extreme B supply (0–2000 µM).

3.1. Changes in Photosynthesis-Related Parameters: SPAD, Fv/Fm and DF

The photosynthesis-related parameters, such as SPAD, which indicates relative chlorophyll content, and Fv/Fm values, which characterize maximum quantum efficiency of PSII, did not change in the present experimental setup and measurement period. Our results are consistent with previous research, which found that Fv/Fm and SPAD are often not sensitive enough in the early stages and stress development [59] of sugar beet, but are only able to monitor more serious damage to the electron transport chain and chlorophyll structure at a later developmental stage of the plant.
For this reason, the focus shifted towards a more thorough analysis of DF values, as the aim of this study was to derive sensitive parameters suitable for capturing those subtle changes that are useful to determine possible stress reactions or indicate the highest optimal B concentration that stimulates sugar beet metabolism.
In the analysis of DF values, the integrated analysis of two crucial aspects can define the status of the plant’s photosynthetic system. A higher initial DF intensity reflects a larger proportion of open PSII reaction centers at the onset of dark conditions, while a slower decay indicates sustained charge recombination and delayed energy release from the photosynthetic apparatus [59]. These parameters in combination suggest a more robust electron transport capacity and lower excitation pressure on PSII, which are indicative of efficient photosynthetic functioning under non-stressed conditions [59], and it is also suitable for detecting stress conditions [60,61].
Since the toxicity of sugar beet B is a less-studied area, our results contribute to the exploration of photosynthetic responses triggered by excess B. According to the results of Huo et al. [40], high B concentrations have a destructive effect on PSII, which was concluded from the decrease in photosynthetic assimilate production. However, our findings show that the initially low DF value suggests that few PSII reaction centers remained open and rechargeable after the light was turned off.
This suggests that the QA-QB reduction cycle is less active because either the highly oxidized donor-side components slow down electron transfer. Additionally, the plastoquinone pool is saturated in its reduced state, which limits backflow energetically; alternatively, some reaction centers may be inactivated or closed, preventing electrons from flowing back.
The reduced electron transport capacity means that PSII is unable to efficiently recharge the reaction centers, so few recombination events occur.
Furthermore, enhanced heat dissipation (non-photochemical quenching: NPQ) occurs, in which the excitation energy is dissipated in the form of heat via an alternative pathway, resulting in less DF emission, as previously observed by Huo et al. and confirmed by the DF decrease we discovered in our pixel analyses [40].
Furthermore, in our current work, besides the aforementioned initial DF intensity changes, it was also possible to identify differences in the steepness of the DF slope during the decay that proved to specifically indicate the onset of stress, suggesting early both B deficiency (0 µM) and excess leading to toxicity (2000 µM) at the beginning of sugar beet development. This leads to the conclusion that DF measurement and the analysis of initial intensities and decay slopes are accurate and sensitive enough to be reliable indicators of B stress development in sugar beet.
The non-invasive characterization of sugar beet investigations have primarily concentrated on the assessment of morphological characteristics such as seed mass, perisperm surface area and volume [55], or the evaluation of damage inflicted by fungus (Cercospora beticola) [62]. In contrast, DF measurements hold the advantage of the determination of dynamically changing efficiency of plant photosynthetic apparatus through the analysis of initial value and the decay rate of DF, which is more suited to the nature of stress evolution than static indicators such as chlorophyll content or the above-mentioned indices. The changes in DF therefore can be directly associated with the operational modifications of the photosynthetic system, and our results indicate that the decay of DF, especially its steepness, are sufficiently sensitive criteria to identify the initial phase of B stress in BBCH 11–14 sugar beet seedlings.
To fine-tune the results of DF measurement, the application of color analysis was introduced. In plant sciences, in addition to its practical application in remote sensing, it also plays an important role in basic research in the study of life phenomena [63]. Although RGB analysis has been used less extensively in sugar beet research than in other crop species [64], there are a few examples. Sánchez-Sastre [65] exploited RGB analysis on sugar beet in order to estimate chlorophyll content, determine nitrogen availability, and infer sugar content.
Spectral alterations are preliminary indicators of stress that facilitate their integration into existing non-invasive methods, as they are both scalable and straightforward to execute. Our RGB analysis results confirmed that, despite that the initial intensity of DF did not exhibit changes in the early stages of stress development, DF color separation revealed stress initiation processes that were previously unattainable.
The pattern of RGB distribution shows that the blue channel dominates under all treatments, while the proportion of red pixels decreased steadily with increasing B concentration. The relative dominance of blue versus red pixels in the RGB analysis reflects differences in the intensity distribution of photon emission within the captured spectral range. However, these assignments should not be interpreted as absolute spectral properties, since RGB channels represent only broad wavelength categories rather than precise emission spectra. The photon quantities, collected in the first minute, were included in the RGB analysis and the results were standardized per unit area, therefore the differences represented channel types and B treatments. At the optimal 500 µM treatment, the RGB balance showed the most even distribution. However, at 2000 µM B, the strong dominance of blue pixels, indicating lower photon emission and minimal red contribution indicates that the system shifts toward stress-induced spectral changes, consistent with early toxicity. The shift in photon intensity is consistent with lipid peroxidation results, indicating membrane destabilization caused by oxidative stress and via the increase in FRAP, an activated antioxidant system as well. Although Yi [56] used RGB images to detect macroelement nutrient deficiencies such as nitrogen, phosphorus, and potassium, none of the known literature references mentioned research on the effects of B availability on sugar beet or DF-related investigations, so RGB analysis of DF changes can be considered a promising approach for refining the analysis of this non-invasive technique.

3.2. Changes in Lipidoxidation-Related Processes

Furthermore, in accordance with the results of Ripoll [66], it was also found in the current work that fluorescence measurements are far more informative when assessed in conjunction with other analytical methods, such as FRAP and MDA, as used in our study. The intricate assessment of these parameters facilitated the identification of the onset of both deficiency and toxic conditions before the appearance of visible symptoms.
Ferric reducing antioxidant capacity is a reliable indicator of abiotic stress, and Sen et al. [67] found that FRAP values chlorophyll, and carotenoid contents were enhanced under drought-stressed conditions in drought-tolerant mutants of sugar beet. In coordination with their results, FRAP showed a well-defined increase parallel to the increased concentration in the current experiment. This shows that in the full absence of B, the non-enzymatic antioxidant pool depletes; nevertheless, the highest doses increase the manufacture of these antioxidants. However, this fact alone does not tell us whether the rise is due to stress or a bigger baseline antioxidant pool. However, when combined with the consequences of lipid oxidation, this topic becomes clearer. MDA levels increased at the extremes (0 and 2000 µM), but remained lower in the intermediate values.
Our results show that changes in MDA and DF slope values are more sensitive to developing stress than MDA values, as MDA showed a trend toward stress in extreme values, but it was not significant. In contrast, DF slopes have already statistically confirmed these trends, and it was shown that the lowest slope, i.e., the longest decay, was observed at the 500 µM treatment, suggesting that photosynthetic activity was highest at this B concentration.
Overall, the analysis of DF, RGB, FRAP and MDA revealed 500 µM B supply proved to be the most effective supporter of early sugar beet development. This result is in contrast to that of Porcel [52], who determined that a 50 µM B to be ideal for Arabidopsis and there is limited information on B concentrations affecting sugar beet physiology, with only a few studies available. This emphasizes the necessity of establishing a sufficiently high B concentration for early growth of sugar beet that remains within the micronutrient range. Song et al. [13] and Wang et al. [68] tested two concentrations (0.1 µM as deficiency and 50 µM as adequate) in hydroponics, showing a two-order-of-magnitude gap between deficiency and adequacy. However, “optimal” boron supply is not a fixed value but a range that depends on the experimental setup and the physiological process examined. For example, hydroponics ensures homogeneous supply, while rock wool systems are more heterogeneous and closer to soil conditions.
The experiment encompassed a broader concentration range (0–2000 µM H3BO3) to evaluate the potential enhancement of productivity and stress resistance.
It is advantageous to optimize the B supply for each variety and the production system to ensure that the yield and quality characteristics are reached to their full potential.
The results of this research therefore contribute to the development of more effective B supply during the early, extremely sensitive period of sugar beet plants in terms of boron supply, when the optimization of external micronutrient supplementation is essential for maintaining successful and sustainable sugar beet production.

4. Materials and Methods

4.1. Culture Conditions

Sugar beet seeds were germinated on filter paper for 4 days. The seeds were placed on filter paper, rolled up, and soaked in distilled water. The germinated seeds were planted in Grodan Delta 75 × 75 × 65 mm rockwool blocks. The plants were placed in a Pol-Eco Apartura KK 1450 climate chamber (POLEKO-APARATURA sp.j. ul. Kokoszycka 172C, 44-300 Wodzisław Sląski, Poland) at 25 °C, with a light intensity of 700 µM m−2s−1 for 16 h during the day and 20 °C; 0 µM m−2 s−1 light intensity for 8 h under night conditions, and grown for four weeks (Figure 7), watered with B-free half-strength Hoagland solution. During the growing period, 50 plants (10 plants/treatment) were selected for measurements.

4.2. Boron (B) Treatments

Ten plants were used for measurements in each treatment group. DF measurements and other rapid non-invasive instrumental measurements were performed on 4 plants/treatements, and the remaining plants were used to supplement the sample for analytical tests. During the microelement treatments, we used boric acid (H3BO3) solution at concentrations of 50 µM, 500 µM, 1000 µM, and 2000 µM (Figure 8), applied every two days simultaneously with irrigation, in volumes of 10 mL. The treatments lasted for 21 days, during which non-invasive measurements were performed, followed by sampling for analytical measurements. The leaves were cut with scissors, chopped, mixed, and then 0.1 g of this average sample per treatment was placed in aluminum foil for analytical measurements. After sampling, the plant samples were immediately stored at −20 °C before further processing.

4.3. Non-Invasive Measurements

4.3.1. Estimation of Relative Chlorophyll Content

The relative chlorophyll content of the plants was estimated using a Minolta SPAD 502 device (Konica Minolta, Europaallee, 17 30855 Langenhagen, Germany) on 4 different plants per treatment, with 10 measurements taken from each one, measured at various points on the surface of each leaf. The device is capable of measuring the intact transmission of plants at wavelengths between 650 and 940 nm. Chlorophyll content and the SPAD index value are closely correlated, so the measurement results provide an estimate of chlorophyll content. The measurements are taken by briefly placing the leaf to be measured inside the 2 × 3 mm sensor, and the device displays the SPAD index without units of measurement within one second.

4.3.2. Measurement of Fv/Fm

Fv/Fm measurement allows us to observe the physiological state of plants through the photosynthetic activity of the photosystem II (PSII) photochemical system, which was measured on 4 plants per treatment. The instrument we used was a FluorPen FP 110/D (PSI (Photon Systems Instruments) spol. s r.o., Průmyslová 470, 664 24 Drásov, Czech Republic). Leaf clips placed on the leaves are closed to darken the surface to be measured for 30 min. When the device is inserted into the clip, the cover is removed and the measurement can be performed to determine, among other things, the Fv/Fm value, which gives the maximum quantum efficiency of PSII.

4.3.3. Measurement of DF

DF detection was performed on 4 plants per treatment using a NightSHADE LB 985 In Vivo Plant Imaging System (Institute Berthold Technologies Bioanalytical Instruments, Calmbacher Strasse 22, D-75323 Bad Wildbad, Germany). The instrument has an ultra-sensitive, thermoelectrically cooled, slow-scan NighOwlcam CCD camera cooled to −68 °C. The exposure time was set to 60 s with 4 × 4 pixel binning, and both the “background correction” and “cosmic suppression” options were left on to eliminate high-intensity pixels potentially caused by cosmic radiation. Before starting the measurement, we turned on LED panels with maximum intensity in the far red (730 nm), red (660 nm), green (565 nm), and blue (470 nm) ranges for 5 s to achieve standardized baseline values. After turning off the LEDs, the luminescence was monitored for 10 min, and the photon count was collected every 60 s and analyzed using IndiGO™ 2.0.5.0 software. The counts per second (cps) were converted to counts per second per square millimeter (cps/mm2) by selecting the areas to be measured. This form of biophoton emission indicates a state of stress at a low emission signal, in which the photosynthetic apparatus of these plants is not functioning properly or is under stress.

4.3.4. Image Processing and RGB Intensity Analysis

Quantitative processing of dark field images recorded from plants was performed using ImageJ/Fiji (v2.17.0) image analysis software. With this method, we characterized the fluorescent response of the treatments based on RGB intensity distributions. We used images recorded with a NightOWLcam CCD camera during DF measurements. Each image contained four plants, and we used the images taken in the first minute for each treatment.
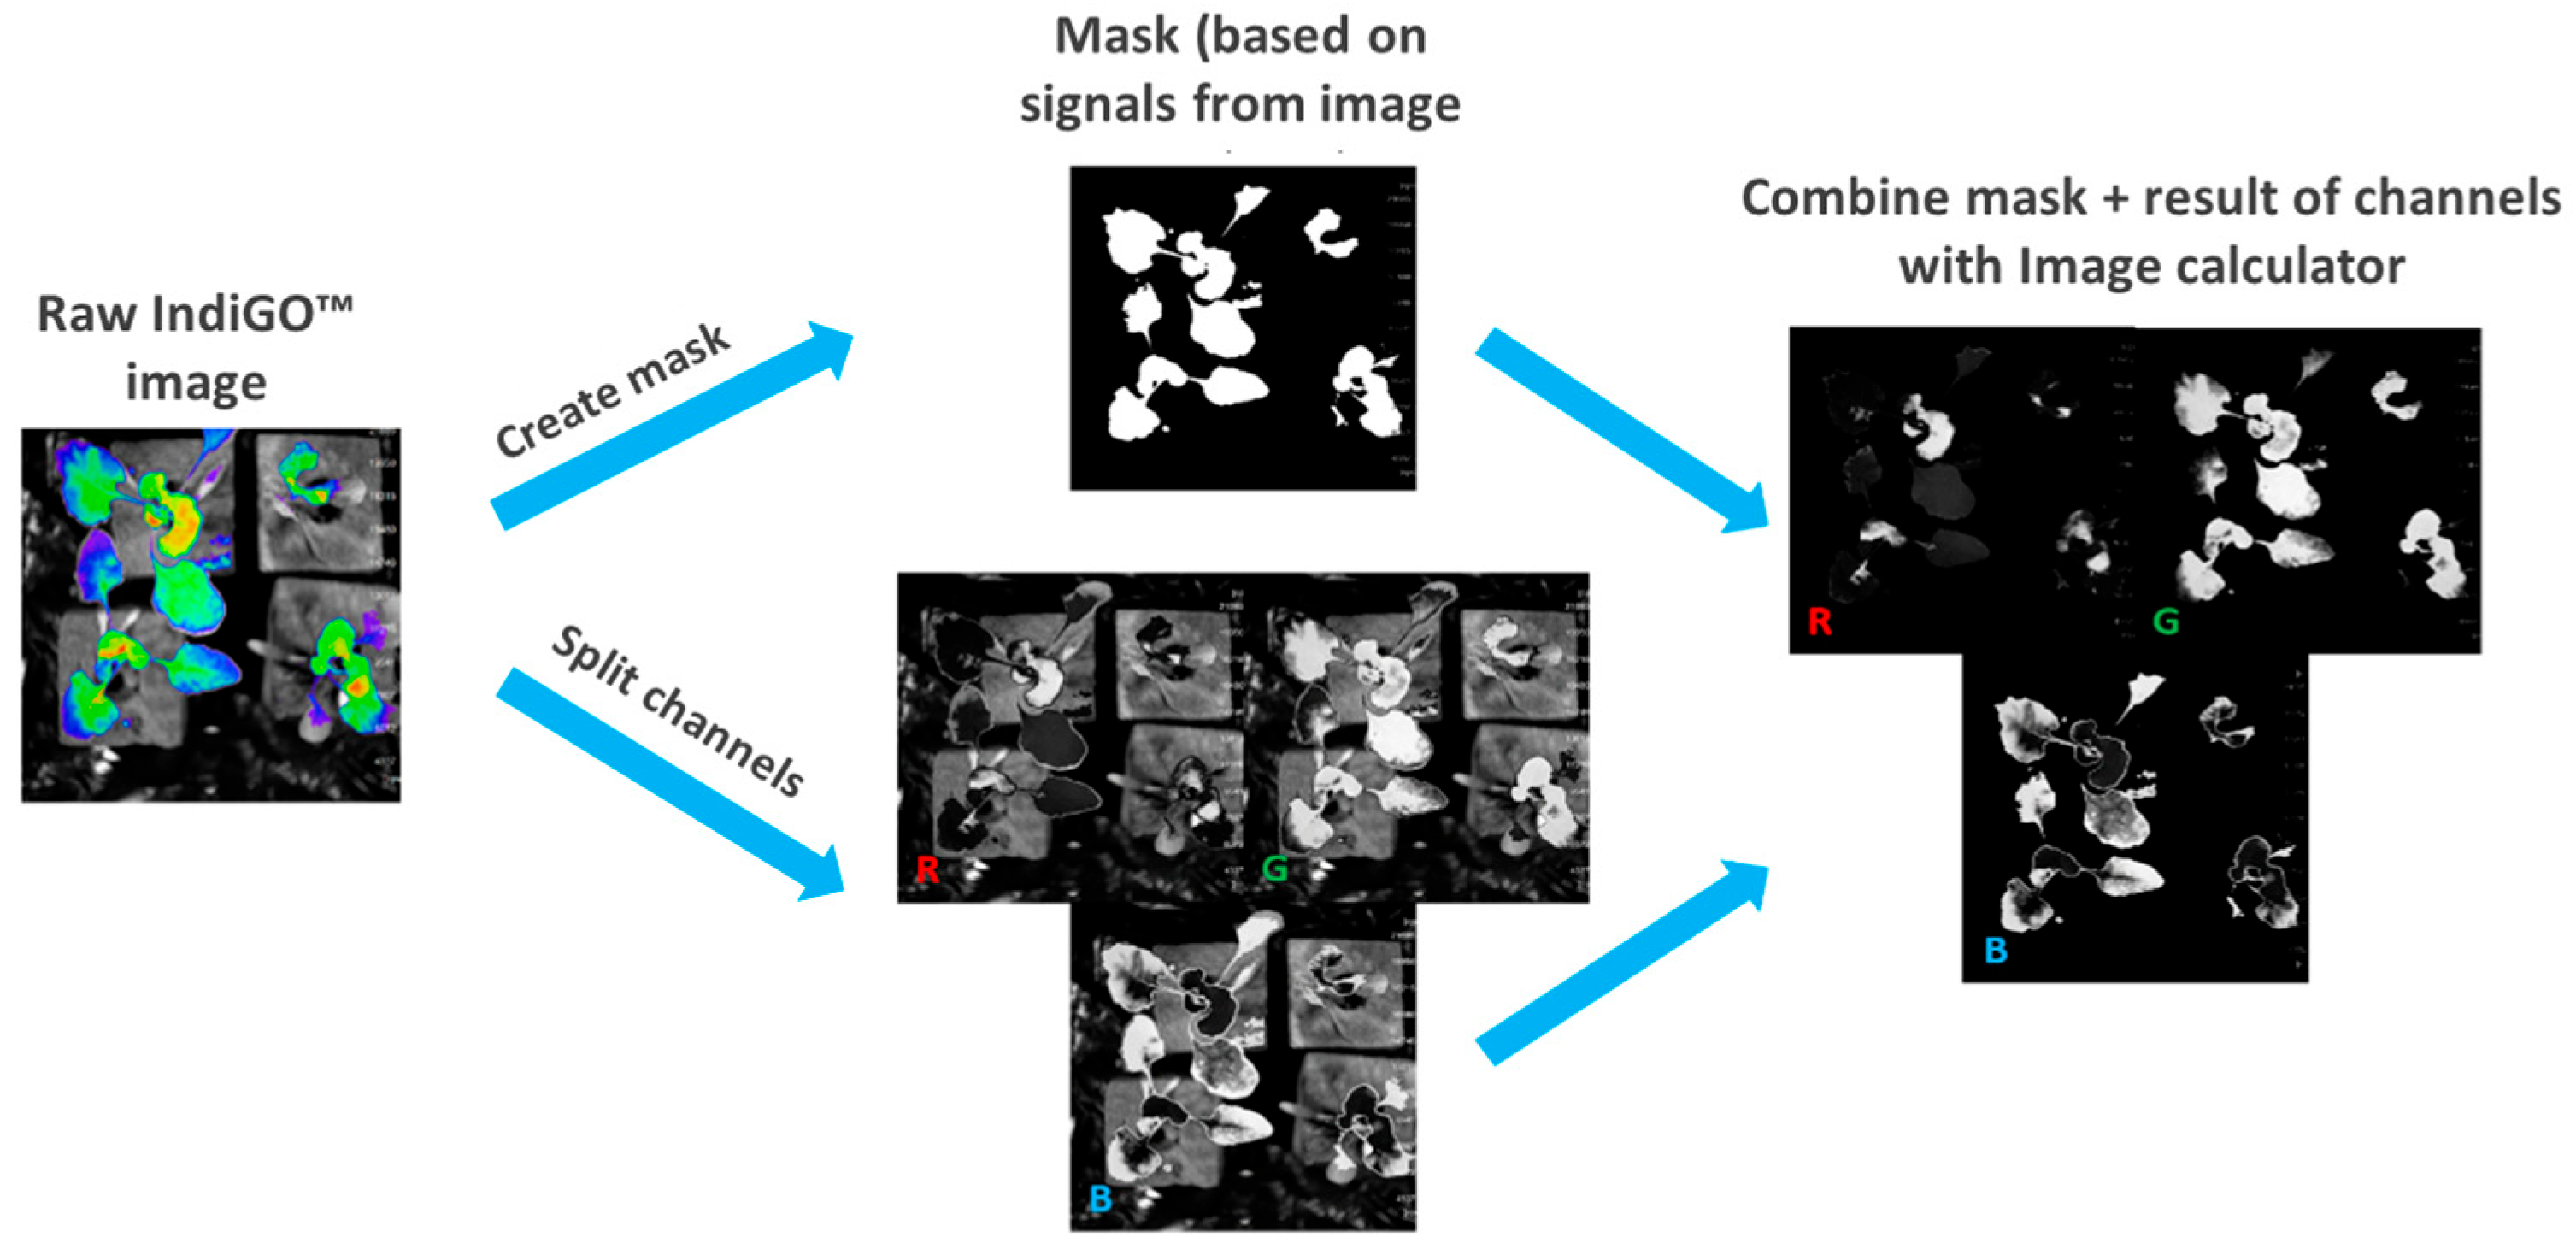
Images were converted from red–green–blue (RGB) to hue–saturation–brightness (HSB) color space, and the saturation (S) and brightness (B) channels were thresholded (S > 0.35; B > 0.12) to generate foreground masks excluding background pixels. For each image, we quantified the relative proportion of masked pixels in each category as well as overall indices (%Red, %Green, %Blue) (Figure 9).

4.4. Measurement of FRAP

The total antioxidant capacity based on ferric reducing ability was determined using the method of Benzie and Strain [69], based on the protocol entitled Estimation of total antioxidant activity, which describes in detail the steps of the FRAP (ferric reducing ability of plasma) methodology. First, the reagent (working solution) was prepared using three solutions in a 10:1:1 ratio:
  • Acetate buffer: 300 mM, pH 3.6
  • TPTZ (2,4,6-tripyridyl-s-triazine) 10 mM in 40 mM HCl; 100 mL distilled water in 330 µL HCl
  • FeCl3 × 6 H2O: 20 mM
The prepared working solution is light-sensitive, so we placed it in a cabinet until use. The extraction process is the same as that used for MDA measurement, with the difference that here the samples were ground with 1.5 mL of phosphate buffer at pH 7.6. The ground leaves were placed in 2 mL Eppendorf tubes and centrifuged (Hettich, MIKRO 220R; Andreas Hettich GmbH&Co. KG Föhren str. 12, D-78532 Tuttlingen, Germany) at 4 °C for 10 min at 13,000 rpm. During centrifugation, we also placed 1950 µL of working solution in 2 mL Eppendorf tubes, then added 50 µL from the supernatant to the reagent, ensuring that the addition was as rapid as possible so that the reaction would proceed uniformly. The mixture was immediately incubated at 37 °C for 15 min. The absorbance was measured with a spectrophotometer at 593 nm, and the values were given as µg ascorbic acid (AA) equivalent/g fresh weight, as the average of three samples.

4.5. Measurement of MDA

To determine the level of lipid oxidation, we used the malondialdehyde (MDA) method developed by Heath and Packer [70] with some modifications. Plant samples weighing 0.1 g were ground in a mortar cooled in a freezer with 1.5 mL of 0.1% trichloroacetic acid (TCA) solution and placed in 2 mL Eppendorf tubes. Centrifugation was performed for 10 min at 4 °C and 13,000 rpm (Hettich, MIKRO 220R; Andreas Hettich GmbH & Co. KG Föhren str. 12, D-78532 Tuttlingen, Germany). The reagent is a 20% trichloroacetic acid (TCA) solution containing 0.5% thiobarbituric acid (TBA). The clear supernatant was removed from the centrifuged extract, and 0.4 mL was added to 1.6 µL of reagent. Incubation was carried out in screw-capped tubes at 96 °C for 30 min, and then the samples were cooled before absorbance was measured using a spectrophotometer at 532 and 600 nm. The data were expressed in nM/g fresh weight, as the average of three samples.

4.6. Statistical Analyses

The data were recorded in Microsoft® Excel 16.0 software. All analyses were performed using R (v4.5.1) statistical environment [71]. Normality of residuals was assessed using the Shapiro–Wilk test, and homogeneity of variances was checked with Levene’s test. Depending on whether the assumptions of normality and/or homogeneity of variances were violated, we applied the following analyses:
  • Kruskal–Wallis + Dunn post hoc with Holm correction;
  • Welch ANOVA + Games–Howell post hoc;
  • ANOVA + Tukey post hoc.
Software and packages used: base stats, agricolae [72], and ggplot2 [73]. Curve fitting and slope calculation for DF decay was performed using the 2–10 min results, as this range provided the best exponential fit across treatments. In the present analysis, the slope values were specifically evaluated at t = 2 min to represent the early phase of exponential decay. The slope (t = 2 min) was calculated as the first derivative of the fitted function. The goodness of fit for all the analyses was assessed using R2 values. The Kruskal–Wallis test was used to detect overall differences among treatments followed by Dunn’s post hoc test with Holm correction using the FSA [74] package.

5. Conclusions

This work aimed to identify the ideal and potentially toxic boron concentrations in the early developmental phase of sugar beet. This was primarily conducted through non-invasive assessments of the photosynthetic apparatus (SPAD, Fv/Fm, DF), alongside investigations related to lipid oxidation (FRAP, MDA).
The intensity of DF decay aided in identifying a shift from suboptimal (0 µM), optimal (500 µM) and high (2000 µM) concentrations, which was further strengthened via the results of RGB analysis and analytical measurements. RGB pixel-based analysis of DF provides a simple and non-invasive proxy for stress detection in addition to conventional fluorescence parameters. This approach highlights subtle spectral changes that are not fully captured by SPAD or Fv/Fm indices, reinforcing its suitability for early stress detection. In future works, DF and RGB results should be validated against growth/yield or molecular markers. The follow-up work needs to focus on field trials to establish thresholds for practical B management in sugar beet cultivation.

Author Contributions

Conceptualization, F.C. and I.J.; methodology, F.C. and I.J.; software, F.C. and I.J.; validation, F.C., I.J., G.K. and R.H.; formal analysis, I.J.; investigation, F.C.; resources, R.H.; data curation, F.C.; writing—original draft preparation, F.C.; writing—review and editing, I.J., G.K. and R.H.; visualization, F.C., I.J. and R.H.; supervision, I.J., G.K. and R.H.; funding acquisition, F.C. All authors have read and agreed to the published version of the manuscript.

Funding

This research was funded by University Research Scholarship Programme of the Ministry for Culture and Innovation from the Source of the National Research, Development and Innovation, grant number EKÖP-MATE/2024/2025/D.

Data Availability Statement

The raw data supporting the conclusions of this article will be made available by the authors on request.

Acknowledgments

This work was supported by the Flagship Research Groups Programme of the Hungarian University of Agriculture and Life Sciences.

Conflicts of Interest

The authors declare no conflict of interest.

Abbreviations

The following abbreviations are used in this manuscript:
AAAscorbic acid
BBoron
cpsCount per second
DFDelayed fluorescence
FRAPFerric reducing ability of plasma
Fv/FmVariable fluorescence over maximum fluorescence
HSBHue–Saturation–Brightness
MDAMalondialdehyde
RGBRed–Green–Blue

References

  1. Food and Agriculture Organization of the United Nations. Available online: https://www.fao.org/faostat/en/#compare (accessed on 17 August 2025).
  2. Statista. Sugar Consumption Worldwide in 2023/2024, by Leading Country (in Million Metric Tons). Available online: https://www.statista.com/statistics/496002/sugar-consumption-worldwide/ (accessed on 17 August 2025).
  3. Hungarian Central Statistical Office. 19.1.1.12. Area Harvested of Major Arable Crops [Thousand Hectares]. Available online: https://www.ksh.hu/stadat_files/mez/hu/mez0012.html (accessed on 17 August 2025).
  4. Hoffmann, C.M.; Huijbregts, T.; van Swaaij, N.; Jansen, R. Impact of different environments in Europe on yield and quality of sugar beet genotypes. Eur. J. Agron. 2009, 30, 17–26. [Google Scholar] [CrossRef]
  5. Kiymaz, S.; Ertek, A. Yield and quality of sugar beet (Beta vulgaris L.) at different water and nitrogen levels under the climatic conditions of Kırsehir, Turkey. Agric. Water Manag. 2015, 158, 156–165. [Google Scholar] [CrossRef]
  6. Mekdad, A.A.A.; Rady, M.M. Response of Beta vulgaris L. to nitrogen and micronutrients in dry environment. Plant Soil Environ. 2016, 62, 23–29. [Google Scholar] [CrossRef]
  7. Mekdad, A.A.A.; Shaaban, A. Integrative applications of nitrogen, zinc, and boron to nutrients-deficient soil improves sugar beet productivity and technological sugar contents under semi-arid conditions. J. Plant Nutr. 2020, 43, 1935–1950. [Google Scholar] [CrossRef]
  8. Abdel-Motagally, F. Effect concentration and spraying time of boron on yield and quality traits of sugar beet grown in newly reclaimed soil conditions. Agric. Sci. 2015, 46, 15–26. [Google Scholar]
  9. Mahapatra, C.K.; Bhadra, T.; Paul, K.S. Nutrient management in sugar beet: A review. Pak. Sugar J. 2020, 35, 31–44. [Google Scholar] [CrossRef]
  10. Moustafa, Z.R.; Soudi, A.M.K.; Mohamed, K.E. Productivity and quality of sugar beet as influenced by nitrogen fertilizer and some micronutrients. Egypt. J. Agric. Res. 2011, 89, 1005–1017. [Google Scholar] [CrossRef]
  11. Rassam, G.; Dashti, M.; Dadkhah, A.; Yazdi, A.K. Root yield and quality of sugar beet in relation to foliar application of micronutrients. Ann. West Univ. Timişoara Ser. Biol. 2015, 2, 87–94. [Google Scholar]
  12. Zewail, R.M.Y.; El-Gmal, I.S.; Khaitov, B.; El-Desouky, H.S. Micronutrients through foliar application enhance growth, yield and quality of sugar beet (Beta vulgaris L.). J. Plant Nutr. 2020, 43, 2275–2285. [Google Scholar] [CrossRef]
  13. Song, X.; Wang, X.; Song, B.; Wu, Z.; Zhao, X.; Huang, W.; Riaz, M. Transcriptome Analysis Reveals the Molecular Mechanism of Boron Deficiency Tolerance in Leaves of Boron-Efficient Beta vulgaris Seedlings. Plant Physiol. Biochem. 2021, 168, 294–304. [Google Scholar] [CrossRef]
  14. Lewis, D.H. Boron: The essential element for vascular plants that never was. New Phytol. 2019, 221, 1685–1690. [Google Scholar] [CrossRef]
  15. Long, Y.; Peng, J. Interaction between Boron and Other Elements in Plants. Genes 2023, 14, 130. [Google Scholar] [CrossRef]
  16. Matoh, T. Boron in plant cell walls. Plant Soil 1997, 193, 59–70. [Google Scholar] [CrossRef]
  17. Shireen, F.; Nawaz, M.A.; Chen, C.; Zhang, Q.; Zheng, Z.; Sohail, H.; Sun, J.; Cao, H.; Huang, Y.; Bie, Z. Boron: Functions and approaches to enhance its availability in plants for sustainable agriculture. Int. J. Mol. Sci. 2018, 19, 1856. [Google Scholar] [CrossRef] [PubMed]
  18. Camacho-Cristóbal, J.J.; Herrera-Rodríguez, M.B.; Beato, V.M.; Rexach, J.; Navarro-Gochicoa, M.T.; Maldonado, J.M.; González-Fontes, A. The expression of several cell wall-related genes in Arabidopsis roots is down-regulated under boron deficiency. Environ. Exp. Bot. 2008, 63, 351–358. [Google Scholar] [CrossRef]
  19. Voxeur, A.; Fry, S.C. Glycosylinositol phosphorylceramides from Rosa cell cultures are boron-bridged in the plasma membrane and form complexes with rhamnogalacturonan II. Plant J. 2014, 79, 139–149. [Google Scholar] [CrossRef]
  20. Ryden, P.; Sugimoto-Shirasu, K.; Smith, A.C.; Findlay, K.; Reiter, W.D.; McCann, M.C. Tensile properties of Arabidopsis cell walls depend on both a xyloglucan cross-linked microfibrillar network and rhamnogalacturonan II-borate complexes. Plant Physiol. 2003, 132, 1033–1040. [Google Scholar] [CrossRef]
  21. Funakawa, H.; Miwa, K. Synthesis of borate cross-linked rhamnogalacturonan II. Front. Plant Sci. 2015, 6, 223. [Google Scholar] [CrossRef] [PubMed]
  22. Brdar-Jokanović, M. Boron toxicity and deficiency in agricultural plants. Int. J. Mol. Sci. 2020, 21, 1424. [Google Scholar] [CrossRef] [PubMed]
  23. Kohli, S.K.; Kaur, H.; Khanna, K.; Handa, N.; Bhardwaj, R.; Rinklebe, J.; Ahmad, P. Boron in plants: Uptake, deficiency and biological potential. Plant Growth Regul. 2023, 100, 267–282. [Google Scholar] [CrossRef]
  24. Dordas, C.; Brown, P.H. Boron deficiency affects cell viability, phenolic leakage and oxidative burst in rose cell cultures. Plant Soil 2005, 268, 293–301. [Google Scholar] [CrossRef]
  25. Song, B.; Hao, X.; Wang, X.; Yang, S.; Dong, Y.; Ding, Y.; Wang, Q.; Wang, X.; Zhou, J. Boron stress inhibits beet (Beta vulgaris L.) growth through influencing endogenous hormones and oxidative stress response. Soil Sci. Plant Nutr. 2019, 65, 346–352. [Google Scholar] [CrossRef]
  26. Han, S.; Tang, N.; Jiang, H.X.; Yang, L.T.; Li, Y.; Chen, L.S. CO2 assimilation, photosystem II photochemistry, carbohydrate metabolism and antioxidant system of citrus leaves in response to boron stress. Plant Sci. 2009, 176, 143–153. [Google Scholar] [CrossRef]
  27. Lu, Y.B.; Qi, Y.P.; Yang, L.T.; Lee, J.; Guo, P.; Ye, X.; Jia, M.Y.; Li, M.L.; Chen, L.S. Long-term boron-deficiency-responsive genes revealed by cDNA-AFLP differ between Citrus sinensis roots and leaves. Front. Plant Sci. 2015, 6, 585. [Google Scholar] [CrossRef] [PubMed]
  28. Rao, M.J.; Duan, M.; Zhou, C.; Jiao, J.; Cheng, P.; Yang, L.; Wei, W.; Shen, Q.; Ji, P.; Yang, Y.; et al. Antioxidant Defense System in Plants: Reactive Oxygen Species Production, Signaling, and Scavenging During Abiotic Stress-Induced Oxidative Damage. Horticulturae 2025, 11, 477. [Google Scholar] [CrossRef]
  29. Melgar, J.C.; Guidi, L.; Remorini, D.; Agati, G.; Degl’Innocenti, E.; Castelli, S.; Baratto, M.C.; Faraloni, C.; Tattini, M. Antioxidant defences and oxidative damage in salt-treated olive plants under contrasting sunlight irradiance. Tree Physiol. 2009, 29, 1187–1198. [Google Scholar] [CrossRef]
  30. Landi, M.; Degl’Innocenti, E.; Pardossi, A.; Guidi, L. Antioxidant and photosynthetic responses in plants under boron toxicity: A review. Am. J. Agric. Biol. Sci. 2012, 7, 255–270. [Google Scholar] [CrossRef]
  31. de Souza, J.P., Jr.; de Mello Prado, R.; Campos, C.N.S.; Junior, G.D.S.S.; Costa, M.G.; de Pádua Teixeira, S.; Gratão, P.L. Silicon modulate the non-enzymatic antioxidant defence system and oxidative stress in a similar way as boron in boron-deficient cotton flowers. Plant Physiol. Biochem. 2023, 197, 107594. [Google Scholar] [CrossRef]
  32. Pereira, G.L.; Siqueira, J.A.; Batista-Silva, W.; Cardoso, F.B.; Nunes-Nesi, A.; Araújo, W.L. Boron: More Than an Essential Element for Land Plants? Front. Plant Sci. 2021, 11, 610307. [Google Scholar] [CrossRef] [PubMed]
  33. Sommer, A.L.; Sorokin, H. Effects of the absence of boron and of some other essential elements on the cell and tissue structure of the root tips of Pisum sativum. Plant Physiol. 1928, 3, 237–251. [Google Scholar] [CrossRef]
  34. Bolaños, L.; Abreu, I.; Bonilla, I.; Camacho-Cristóbal, J.J.; Reguera, M. What Can Boron Deficiency Symptoms Tell Us about Its Function and Regulation? Plants 2023, 12, 777. [Google Scholar] [CrossRef] [PubMed]
  35. Liu, G.; Dong, X.; Liu, L.; Wu, L.; Peng, S.; Jiang, C. Boron deficiency is correlated with changes in cell wall structure that lead to growth defects in the leaves of navel orange plants. Sci. Hortic. 2014, 176, 54–62. [Google Scholar] [CrossRef]
  36. Camacho-Cristóbal, J.J.; Rexach, J.; González-Fontes, A. Boron in plants: Deficiency and toxicity. J. Integr. Plant Biol. 2008, 50, 1247–1255. [Google Scholar] [CrossRef]
  37. Khan, M.K.; Pandey, A.; Hamurcu, M.; Avsaroglu, Z.Z.; Ozbek, M.; Omay, A.H.; Elbasan, F.; Omay, M.R.; Gokmen, F.; Topal, A.; et al. Variability in Physiological Traits Reveals Boron Toxicity Tolerance in Aegilops Species. Front. Plant Sci. 2021, 12, 736614. [Google Scholar] [CrossRef]
  38. Riaz, M.; Kamran, M.; El-Esawi, M.A.; Hussain, S.; Wang, X. Boron-toxicity induced changes in cell wall components, boron forms, and antioxidant defense system in rice seedlings. Ecotoxicol. Environ. Saf. 2021, 216, 112192. [Google Scholar] [CrossRef]
  39. Pandey, A.; Khan, M.K.; Hamurcu, M.; Brestic, M.; Topal, A.; Gezgin, S. Insight into the Root Transcriptome of a Boron-Tolerant Triticum zhukovskyi Genotype Grown under Boron Toxicity. Agronomy 2022, 12, 2421. [Google Scholar] [CrossRef]
  40. Huo, J.; Song, B.; Riaz, M.; Song, X.; Li, J.; Liu, H.; Huang, W.; Jia, Q.; Wu, W. High boron stress leads to sugar beet (Beta vulgaris L.) toxicity by disrupting photosystem II. Ecotoxicol. Environ. Saf. 2022, 248, 114295. [Google Scholar] [CrossRef] [PubMed]
  41. Song, X.; Song, B.; Huo, J.; Liu, H.; Adil, M.F.; Jia, Q.; Wu, W.; Kuerban, A.; Wang, Y.; Huang, W. Effect of boron deficiency on the photosynthetic performance of sugar beet cultivars with contrasting boron efficiencies. Front. Plant Sci. 2023, 13, 1101171. [Google Scholar] [CrossRef]
  42. Wu, Z.; Wang, X.; Song, B.; Zhao, X.; Du, J.; Huang, W. Responses of Photosynthetic Performance of Sugar Beet Varieties to Foliar Boron Spraying. Sugar Tech 2021, 23, 1332–1339. [Google Scholar] [CrossRef]
  43. Galeriani, T.M.; Neves, G.O.; Ferreira, J.H.S.; Oliveira, R.N.; Oliveira, S.L.; Calonego, J.C.; Crusciol, C.A.C. Calcium and Boron Fertilization Improves Soybean Photosynthetic Efficiency and Grain Yield. Plants 2022, 11, 2937. [Google Scholar] [CrossRef]
  44. Oikonomou, A.; Ladikou, E.-V.; Chatziperou, G.; Margaritopoulou, T.; Landi, M.; Sotiropoulos, T.; Araniti, F.; Papadakis, I.E. Boron excess imbalances root/shoot allometry, photosynthetic and chlorophyll fluorescence parameters and sugar metabolism in apple plants. Agronomy 2019, 9, 731. [Google Scholar] [CrossRef]
  45. Li, Z.; Zhou, J.; Dong, T.; Xu, Y.; Shang, Y. Application of electrochemical methods for the detection of abiotic stress biomarkers in plants. Biosens. Bioelectron. 2021, 182, 113105. [Google Scholar] [CrossRef] [PubMed]
  46. Fu, Y.-X.; Liu, S.-Y.; Guo, W.-Y.; Dong, J.; Nan, J.-X.; Lin, H.-Y.; Mei, L.-C.; Yang, W.-C.; Yang, G.-F. In vivo diagnostics of abiotic plant stress responses via in situ real-time fluorescence imaging. Plant Physiol. 2022, 190, 196–201. [Google Scholar] [CrossRef]
  47. Jócsák, I.; Malgwi, I.; Rabnecz, G.; Szegő, A.; Varga-Visi, É.; Végvári, G.; Pónya, Z. Effect of cadmium stress on certain physiological parameters, antioxidative enzyme activities and biophoton emission of leaves in barley (Hordeum vulgare L.) seedlings. PLoS ONE 2020, 15, e0240470. [Google Scholar] [CrossRef] [PubMed]
  48. Berden-Zrimec, M.; Drinovec, L.; Zrimec, A.; Tišler, T. Delayed fluorescence in algal growth inhibition tests. Cent. Eur. J. Biol. 2007, 2, 169–181. [Google Scholar] [CrossRef]
  49. Jócsák, I.; Csima, F.; Somfalvi-Tóth, K. Alterations of Photosynthetic and Oxidative Processes Influenced by the Presence of Different Zinc and Cadmium Concentrations in Maize Seedlings: Transition from Essential to Toxic Functions. Plants 2024, 13, 1150. [Google Scholar] [CrossRef]
  50. Song, X.; Hao, X.; Song, B.; Zhao, X.; Wu, Z.; Wang, X.; Du, J.; Huang, W.; Riaz, M.; Li, X.; et al. The Oxidative Damage and Morphological Changes of Sugar Beet (Beta vulgaris L.) Leaves at Seedlings Stage Exposed to Boron Deficiency in Hydroponics. Sugar Tech 2022, 24, 532–541. [Google Scholar] [CrossRef]
  51. Song, X.; Song, B.; Huo, J.; Riaz, M.; Wang, X.; Huang, W.; Zhao, S. Boron-Efficient Sugar Beet (Beta vulgaris L.) Cultivar Improves Tolerance to Boron Deficiency by Improving Leaf Traits. J. Soil Sci. Plant Nutr. 2022, 22, 4217–4227. [Google Scholar] [CrossRef]
  52. Porcel, R.; Bustamante, A.; Ros, R.; Serrano, R.; Mulet Salort, J.M. BvCOLD1: A novel aquaporin from sugar beet (Beta vulgaris L.) involved in boron homeostasis and abiotic stress. Plant Cell Environ. 2018, 41, 2844–2857. [Google Scholar] [CrossRef]
  53. Ali, M.M.; Bachik, N.A.; Muhadi, N.A.; Yusof, T.N.T.; Gomes, C. Non-destructive techniques of detecting plant diseases: A review. Physiol. Mol. Plant Pathol. 2019, 108, 101426. [Google Scholar] [CrossRef]
  54. Keszthelyi, S.; Pónya, Z.; Csóka, Á.; Bázár, G.; Morschhauser, T.; Donkó, T. Non-destructive imaging and spectroscopic techniques to investigate the hidden-lifestyle arthropod pests: A review. J. Plant Dis. Prot. 2020, 127, 283–295. [Google Scholar] [CrossRef]
  55. Ducournau, S.; Charrier, A.; Demilly, D.; Wagner, M.-H.; Trigui, G.; Dupont, A.; Hamdy, S.; Boudehri-Giresse, K.; Le Corre, L.; Landais, L.; et al. High throughput phenotyping dataset related to seed and seedling traits of sugar beet genotypes. Data Brief 2020, 29, 105201. [Google Scholar] [CrossRef]
  56. Yi, J.; Krusenbaum, L.; Unger, P.; Hüging, H.; Seidel, S.J.; Schaaf, G.; Gall, J. Deep learning for non-invasive diagnosis of nutrient deficiencies in sugar beet using RGB images. Sensors 2020, 20, 5893. [Google Scholar] [CrossRef]
  57. Lukács, H.; Jócsák, I.; Somfalvi-Tóth, K.; Keszthelyi, S. Physiological Responses Manifested by Some Conventional Stress Parameters and Biophoton Emission in Winter Wheat as a Consequence of Cereal Leaf Beetle Infestation. Front. Plant Sci. 2022, 13, 839855. [Google Scholar] [CrossRef] [PubMed]
  58. Jócsák, I.; Gyalog, H.; Hoffmann, R.; Somfalvi-Tóth, K. In-Vivo Biophoton Emission, Physiological and Oxidative Responses of Biostimulant-Treated Winter Wheat (Triticum aestivum L.) as Seed Priming Possibility, for Heat Stress Alleviation. Plants 2022, 11, 640. [Google Scholar] [CrossRef]
  59. Chaerle, L.; Hagenbeek, D.; de Bruyne, E.; van der Straeten, D. Chlorophyll fluorescence imaging for disease-resistance screening of sugar beet. Plant Cell Tissue Organ Cult. 2007, 91, 97–106. [Google Scholar] [CrossRef]
  60. Goltsev, V.; Zaharieva, I.; Chernev, P.; Strasser, R. Delayed Chlorophyll Fluorescence as a Monitor for Physiological State of Photosynthetic Apparatus. Biotechnol. Biotechnol. Equip. 2009, 23 (Suppl. S1), 452–457. [Google Scholar] [CrossRef]
  61. Zhou, R.; Kan, X.; Chen, J.; Hua, H.; Li, Y.; Ren, J.; Feng, K.; Liu, H.; Deng, D.; Yin, Z. Drought-induced changes in photosynthetic electron transport in maize probed by prompt fluorescence, delayed fluorescence, P700 and cyclic electron flow signals. Environ. Exp. Bot. 2019, 158, 51–62. [Google Scholar] [CrossRef]
  62. Sánchez-Moreiras, A.M.; Graña, E.; Reigosa, M.J.; Araniti, F. Imaging of Chlorophyll a Fluorescence in Natural Compound-Induced Stress Detection. Front. Plant Sci. 2020, 11, 583590. [Google Scholar] [CrossRef] [PubMed]
  63. Riccio, M.; Resca, E.; Bertoni, L.; Cavani, F.; Sena, P.; Ferretti, M.; Baldini, A.; Palumbo, C.; de Pol, A. RGB method in immunofluorescence investigations on stem cells. Opt. Laser Technol. 2011, 43, 317–322. [Google Scholar] [CrossRef]
  64. Kior, A.; Yudina, L.; Zolin, Y.; Sukhov, V.; Sukhova, E. RGB Imaging as a Tool for Remote Sensing of Characteristics of Terrestrial Plants: A Review. Plants 2024, 13, 1262. [Google Scholar] [CrossRef]
  65. Sánchez-Sastre, L.F.; Alte da Veiga, N.M.S.; Ruiz-Potosme, N.M.; Carrión-Prieto, P.; Marcos-Robles, J.L.; Navas-Gracia, L.M.; Martín-Ramos, P. Assessment of RGB Vegetation Indices to Estimate Chlorophyll Content in Sugar Beet Leaves in the Final Cultivation Stage. AgriEngineering 2020, 2, 128–149. [Google Scholar] [CrossRef]
  66. Ripoll, J.; Bertin, N.; Bidel, L.P.R.; Urban, L. A user’s view of the parameters derived from the induction curves of maximal chlorophyll a fluorescence: Perspectives for analyzing stress. Front. Plant Sci. 2016, 7, 1679. [Google Scholar] [CrossRef] [PubMed]
  67. Sen, A.; Alikamanoglu, S. Characterization of drought-tolerant sugar beet mutants induced with gamma radiation using biochemical analysis and isozyme variations. J. Sci. Food Agric. 2014, 94, 367–372. [Google Scholar] [CrossRef] [PubMed]
  68. Wang, X.; Song, B.; Wu, Z.; Zhao, X.; Song, X.; Adil, M.F.; Huang, W. Insights into Physiological and Molecular Mechanisms Underlying Efficient Utilization of Boron in Different Boron Efficient Beta vulgaris L. Varieties. Plant Physiol. Biochem. 2023, 197, 107619. [Google Scholar] [CrossRef] [PubMed]
  69. Benzie, I.F.F.; Strain, J.J. The Ferric Reducing Ability of Plasma (FRAP) as a Measure of “Antioxidant Power”: The FRAP Assay. Anal. Biochem. 1996, 239, 70–76. [Google Scholar] [CrossRef]
  70. Heath, R.L.; Packer, L. Photoperoxidation in isolated chloroplasts. Arch. Biochem. Biophys. 1968, 125, 189–198. [Google Scholar] [CrossRef]
  71. R Core Team. R Core Team R: A Language and Environment for Statistical Computing; R Foundation for Statistical Computing: Vienna, Austria, 2023. [Google Scholar]
  72. de Mendiburu, F.; Yaseen, M. Agricolae: Statistical Procedures for Agricultural Research; R Foundation for Statistical Computing: Vienna, Austria, 2020. [Google Scholar]
  73. Wickham, H. Ggplot2: Elegant Graphics for Data Analysis, 2nd ed.; Springer International Publishing: Berlin/Heidelberg, Germany, 2016; pp. 187–253. [Google Scholar]
  74. Ogle, D. FSA: Simple Fisheries Stock Assessment Methods. 2023. Available online: https://fishr-core-team.github.io/FSA/ (accessed on 17 August 2025).
Figure 1. Effect of different concentrations of boron (0, 50, 500, 1000, and 2000 µM) on chlorophyll content estimation (A) and maximum quantum efficiency of PSII (B) in sugar beet (Beta vulgaris L.). The results are presented as an average of the values of each treatment (n = 4) ± standard deviations (SD). Same lowercase letters indicate non-significant difference among treatments (ANOVA + Tukey: p < 0.05).
Stresses 05 00061 g001
Figure 2. Effect of different concentrations of boron (0, 50, 500, 1000, and 2000 µM) on delayed fluorescence in sugar beet (Beta vulgaris L.). The results are presented as an average of the values of each treatment (n = 4) ± standard deviations (SD). Same lowercase letters indicate non-significant difference among treatments (ANOVA + Tukey: p < 0.05).
Stresses 05 00061 g002
Figure 3. Average distribution of pixel colors under different boron concentrations (0, 50, 500, 1000, and 2000 µM) of sugar beet seedlings (Beta vulgaris L.). (A) The percentage of red, green, and blue pixels extracted from three RGB images per treatment. Error bars represent standard deviations (SD). (B) The relative contributions of red, green, and blue pixels within each treatment.
Stresses 05 00061 g003
Figure 4. Effect of different concentrations of boron (0, 50, 500, 1000, and 2000 µM) on delayed fluorescence decay in sugar beet (Beta vulgaris L.) (A) Kinetics of delayed fluorescence (DF) decay (cps/mm2) over 2–10 min period under different treatments. Curves represent mean values with fitted trendlines, and R2 values of the respective fits are shown in the legend. (B) Average slope of the fitted exponential function at 2 min DF values across treatments. The results are presented as an average of the values of each treatment (n = 4) ± standard deviations (SD). Different lowercase letters indicate significant difference among treatments (Kruskall–Wallis + Dunn: p < 0.05).
Stresses 05 00061 g004
Figure 5. Effect of different concentrations of boron (0, 50, 500, 1000, and 2000 µM) on ferric reducing ability of plasma (FRAP) in sugar beet (Beta vulgaris L.). The results are presented as an average of the values of each treatment (n = 4) ± standard deviations (SD). Different lowercase letters indicate significant difference among treatments (ANOVA + Tukey: p < 0.05).
Stresses 05 00061 g005
Figure 6. Effect of different concentrations of boron (0, 50, 500, 1000, and 2000 µM) on malondialdehyde (MDA) in sugar beet (Beta vulgaris L.). The results are presented as an average of the values of each treatment (n = 4) ± standard deviations (SD). Different lowercase letters indicate a significant difference among treatments (Kruskall–Wallis + Dunn: p < 0.05).
Stresses 05 00061 g006
Figure 7. Examination of boron concentrations (0, 50, 500, 1000, and 2000 µM) in sugar beet (Beta vulgaris L.) plants using various methods. Plant cultivation for 4 weeks (blue), non-invasive methods for 3 weeks (green), analytical methods (red).
Stresses 05 00061 g007
Figure 8. Sugar beet (Beta vulgaris L.) plants grown in rockwool, treated with different concentrations of boron (0, 50, 500, 1000, and 2000 µM).
Stresses 05 00061 g008
Figure 9. The image analysis process in ImageJ/Fiji (v2.17.0) based on images generated by IndiGO™ 2.0.5.0 software. From the imported image, we select the areas using the “Color threshold” function, then apply a mask and split channel. By blending the two, we obtain the final results separately for each channel.
Stresses 05 00061 g009
Disclaimer/Publisher’s Note: The statements, opinions and data contained in all publications are solely those of the individual author(s) and contributor(s) and not of MDPI and/or the editor(s). MDPI and/or the editor(s) disclaim responsibility for any injury to people or property resulting from any ideas, methods, instructions or products referred to in the content.