Article

Vigour Index on Time Basis Calculation on Agastache mexicana Subsp. mexicana Throughout Induced Hydric Stress: SiO2 and Artificial Shade Application Effects

by
Blas Cruz-Lagunas
1,
Edgar Jesús Delgado-Núñez
1,
Juan Reséndiz-Muñoz
2,
Flaviano Godínez-Jaimes
3,
Romeo Urbieta-Parrazales
4,
María Teresa Zagaceta-Álvarez
5,
Yeimi Yuleni Pureco-Leyva
6,
José Luis Fernández-Muñoz
7,* and
Miguel Angel Gruintal-Santos
2,*
1
Facultad de Ciencias Agropecuarias y Ambientales, Universidad Autónoma de Guerrero, Periférico Poniente s/n, Iguala de la Independencia 40010, Guerrero, Mexico
2
Facultad de Ciencias Agropecuarias y Ambientales, Universidad Autónoma de Guerrero, Unidad Tuxpan, km 2.5 Carretera Iguala-Tuxpan, Iguala de la Independencia 40101, Guerrero, Mexico
3
Facultad de Matemáticas, Universidad Autónoma de Guerrero, Av. Lázaro Cárdenas S/N, Chilpancingo 39090, Guerrero, Mexico
4
Centro de Investigación en Cómputo (CIC-IPN), Instituto Politécnico Nacional, Av. Juan de Dios Bátiz, Esq. Miguel Othón de Mendizábal, Col. Nueva Industrial Vallejo, Alcaldía, Gustavo A. Madero, Ciudad de Mexico 07738, Mexico
5
Escuela Superior de Ingeniería Mecánica y Eléctrica Unidad Azcapotzalco, Instituto Politécnico Nacional, Av. Las Granjas 682, Col. Santa Catarina, Alcaldía Azcapotzalco, Ciudad de Mexico 02550, Mexico
6
Escuela Superior de Ciencias Económicas, Universidad Autónoma de Guerrero, Av. Lázaro Cárdenas, s/n C.U. Sur, Chilpancingo 39090, Guerrero, Mexico
7
Centro de Investigación en Ciencia Aplicada y Tecnología Avanzada Unidad Legaria, Instituto Politécnico Nacional, Miguel Hidalgo, Ciudad de Mexico 11500, Mexico
*
Authors to whom correspondence should be addressed.
Stresses 2025, 5(4), 63; https://doi.org/10.3390/stresses5040063
Submission received: 26 August 2025 / Revised: 16 October 2025 / Accepted: 20 October 2025 / Published: 23 October 2025
(This article belongs to the Collection Feature Papers in Plant and Photoautotrophic Stresses)

Abstract

Understanding the impact of hydric stress on medicinal plants in the context of climate change is becoming increasingly important. This study aimed to assess the quality of a seed lot of Agastache mexicana subsp. mexicana (Amm) through a novel calculation of the Vigour Index on time basis ( V I T ). The evaluation was based on relationships among plant height, leaf number, survival time, and plant density across six irrigation regimes, referred to as stages, which differed in the timing and quantity of water, designed to impose water stress from seedling emergence until plant death. To maximise growth and survival time, we utilised two input factors: Artificial Shade Levels (ASLs) of 38%, 87%, and 94%, as well as Silicon Dioxide Levels (SDLs) of 0.0%, 0.2%, 0.4%, and 0.8%. The effects of these treatments were measured using the Survival Index (SI) and the V I T . The plants achieved their highest SI and V I T values influenced by minimum mortality and maximum height and leaf number in stage three. This behaviour aligned with the field capacity of the substrate, supporting the evaluation of stages one and two as waterlogging stress, while the remaining stages were classified as drought stress. The V I T results showed statistically significant effects from ASL, particularly at 94%. However, the V I T in relation to SDL was not statistically significant. The V I T measurements were visualised using spline interpolation, a method that provides an effective approach to quantify adverse conditions affecting Amm’s development and that it can support to identify the hydric stresses type.

1. Introduction

The name Agastache mexicana subsp. mexicana (Amm) comes from the Greek words agan, (many) and stachys (spikes): “many spikes”. This plant is endemic from México and thrives in oak forest areas (Quercus), pine (Pinus), and fir (Abies religiosa) at elevations ranging from 1600 to 3900 m above sea level, in temperate climates. In Mexico, it is referred to as “toronjil morado”. It is a shrubby, perennial, undomesticated plant with a mint scent, and its seeds remain dormant. In traditional medicine, it is used to alleviate gastrointestinal and cardiovascular ailments, as an anti-inflammatory, and as a sleep inducer for the treatment of insomnia and anxiety [1,2,3].
The production of high-quality medicinal and aromatic plant crops largely depends on the quality of the seeds used for propagation; to ensure the adaptation of the seeds to different abiotic stresses, enhancing their germination and emergence, and producing seedlings that exhibit excellent vigorous growth and healthy vegetative development is essential for transplanting from seedbeds to open fields or bio-spaces. Seed standards and testing procedures are necessary [4,5,6].
For seeds that struggle to germinate and develop healthy seedlings under favourable conditions (viability) due to dormancy or latency, maintaining the quality of seed batches is essential for achieving optimal performance, yield, and productivity; this quality is crucial for both scientific research and marketing purposes. In this context, vigour refers to the physiological traits that allow seeds to germinate quickly and to tolerate unfavourable conditions, including those encountered during vegetative growth. Recently, some seed producers, agricultural researchers, and analysts have criticised certain aspects of seed testing for being inadequate or unrealistic [7,8,9,10].
Several environmental factors affect the initial growth of seedlings and may evoke a lethal reaction. These are drought, waterlogging, and insufficient or excess light.
When plants are exposed to drought conditions, anatomical, physiological, and biochemical changes occur in them. Drought impairs normal growth, disturbs water relations, reduces water use efficiency and transpiration, and increases stomatal resistance (rate of photosynthesis is reduced), including osmotic adjustment and antioxidant defense systems, which enhance their capacity to grow and develop, and maintenance of tissue water contents [11,12,13].
In waterlogging stress, elevated levels of water in the soil create hypoxic conditions (a decrease in oxygen levels) within a short period of time. As a result, plant roots suffer from anoxia, the complete absence of oxygen. One of the first plant responses to waterlogging is a reduction in stomatal conductance, which limits water uptake and leads to an internal water deficit. In addition, low levels of oxygen may decrease hydraulic conductivity and lead to a substantial decline in net photosynthetic rate, the effects of which are leaf senescence and reduced leaf area, which are also held responsible. Besides waterlogging stress, it reduces nutrient uptake, disturbs soil aeration and respiration, and ultimately affects the growth and development of plants [14,15,16].
Some plant mechanisms to activate the defence systems of the plant in the face of waterlogging stress include the following: (a) employment of enzymatic antioxidants such as catalase, ascorbate peroxidase, and glutathione reductase, (b) non-enzymatic antioxidants such as ascorbic acid, glutathione, and carotenoids to counteract the damaging effects of oxidative stress, (c) marked upregulation and/or downregulation of several genes, and (d) changes in the plant’s architecture, energy metabolism, respiration, and endogenous phytohormone biosynthesis/signalling, as aerobic respiration is inhibited under flooding stress [14,17].
Some species of plants require different levels of shade to thrive and achieve optimal growth and quality during the germination/emergence/juvenile growth stages. Shorea leprosula, Magnolia tsiampaca, and Melaleuca alternifolia require 50–90%, 50%, and 45–50% shade, respectively. Seedling height, stem diameter, stem weight, leaf health, leaf area, root-weight/shoot ratio, and weight are among the metrics that improve under shade [18,19,20,21].
To assess the optimum conditions for seedling growth adequately, several stress factors at varying levels should be applied. Moreover, to produce healthy seedlings that can be successfully transplanted from seedbeds to open fields, some additional procedures may be used, such as silicon fertilisation. To grow medicinal plants successfully in adverse environmental conditions, such as those with abiotic stress, we need to maximise survival rates for propagation and domestication.
Although silicon is not essential for plants, beneficial effects of SiO2 application in stressed plants were previously found. The mechanisms by which silicon alleviates abiotic stresses (drought, waterlogging, heavy metals, salinity, and shade) in plants are as follows: (a) being transported after absorption by the roots improves the growth and weight of aerial parts and root organs, (b) its deposition in cell walls in the form of hydrated polymers at the leaves and stem levels reduces transpiration, improving photosynthetic capacity by protecting chloroplasts and increasing levels of light-absorbing pigment, (c) it increases cell proliferation and expansion of primary cell walls, (d) upregulating antioxidant enzymes and subsequently reducing cell damage, (e) forming a barrier through the accumulation of leaf apoplasts, (f) increasing stomatal conductance and enhancing water potential, and (g) aiding in protein synthesis [22,23,24,25,26,27,28,29,30,31,32,33,34,35].
Researchers have studied the impact of different shade levels and under normal light, along with varying silicon application rates, which have significantly improved the net photosynthetic rate, stomatal conductance, and transpiration rate, while also decreasing the intercellular carbon dioxide concentration. Additionally, they observed improvements in plant survival and growth, particularly under waterlogging and drought stress [25,34,36,37,38,39].
To summarise survival and growth parameters, different Vigour Indices were developed. Researchers have taken into account root and shoot length, root and shoot dry weight, leaf and shoot fresh weight, and total leaf area [22,36,40,41,42,43]. These vigour measurements were made in germination, the emergence until the end of the early age of the plants, but not during their growth [9,44]. Additionally, the relationship between plant height and leaf number has been used to predict successful cultivation [45]
Likewise, mathematical modelling can aid in interpreting data. Interpolation inserts new data points within a known range and can help fill in missing data, smooth existing data, and make predictions. The spline function works by fitting a series of cubic polynomials. This method has been applied to track corn growth over time, including measurements of dry weight and total leaf area per plant [46], humidity control to enhance plant quality [47], and estimating water consumption in the water cycle, specifically the reference evapotranspiration, which enables more accurate prediction and planning of water resources [48].
To assess the quality of the seeds lot, the aims of this study were as follows: (1) to track the Amm seedlings growth under changing waterlogging/drought conditions, (2) to evaluate the effect of different Artificial Shading Levels (ASLs) and Silicon Dioxide Levels (SDLs) fertilisation on enhancing healthy seedlings production, (3) to evaluate the Vigour Index on time basis ( V I T ) developed by the authors, which couples together survival rate, basic growth parameters, and time duration.

2. Results

2.1. Statistical Results of V I T  (General, SDL, and ASL Effects)

Table 1 shows the V I T statistical means by ASL effect and week, with Tukey grouping. Two statistically different groups were formed at weeks 1, 2, 6, and 8, and three statistically different groups in week 9. Most of the highest V I T values occurred when ASL = 94%. At W6, when ASL = 38% and 94%, V I T values reveal a contrast between lower and higher light levels. In weeks 3, 4, 5, and 7, the V I T means do not show significant statistical differences due to one transition zone in the type of stress, as will be seen later.
Table 2 shows the V I T statistical means by the effect of SDL values by week and the results of the multiple comparisons using the Tukey grouping. There are no significant statistical differences. When SDL = 0%, all weeks include the highest mean values except at W2.
The completely randomised factorial design with fixed effects was fitted for every week. In no week did the fitted model meet both assumptions of normality of errors and homogeneity of error variances; therefore, using a Box-Cox transformation of the V I T was necessary.
Table 3 presents the results of the analysis of variance for the completely randomised factorial design with fixed effects per week. The V I T by the effect of ASL was significant at weeks 1, 2, 6, 8, and 9; the effect of SDL was not significant (p > 0.05), and the interaction effect of ASL:SDL was not significant at any week (p > 0.05). V I T general values, without taking into account ASL, SDL, or ASL:SDL effects, were significant in weeks 1, 2, and 9.
See Section S1 in the Supplementary Material to analyze statistical V I T values graphically (Figure S1).
See Section S2 in the Supplementary Material (Tables S1–S14) for statistical analysis of seedlings and plants’ heights, as well as leaf number by week. The Box-Cox transformation reveals that the assumptions of normality of errors and homogeneity of error variances are not accomplished. Besides, to understand in a better way the statistical.

2.2. Agronomic Interpretation

2.2.1. Generalities

Figure 1 illustrates the growth in plant height by week; each discrete point represents the statistical means of the surviving plants. There are nine discrete points measured over a week; the interpolating curve connects each point (Figure 2, Figure 3, Figure 4, Figure 5 and Figure 6 were created in the same manner, but without discrete points). After reaching the peak of growth, the plants began to adapt to drought stress. Ultimately, growth ceased, and leaf senescence occurred, resulting in a rapid decline in their condition by week 9, which was followed by their death.
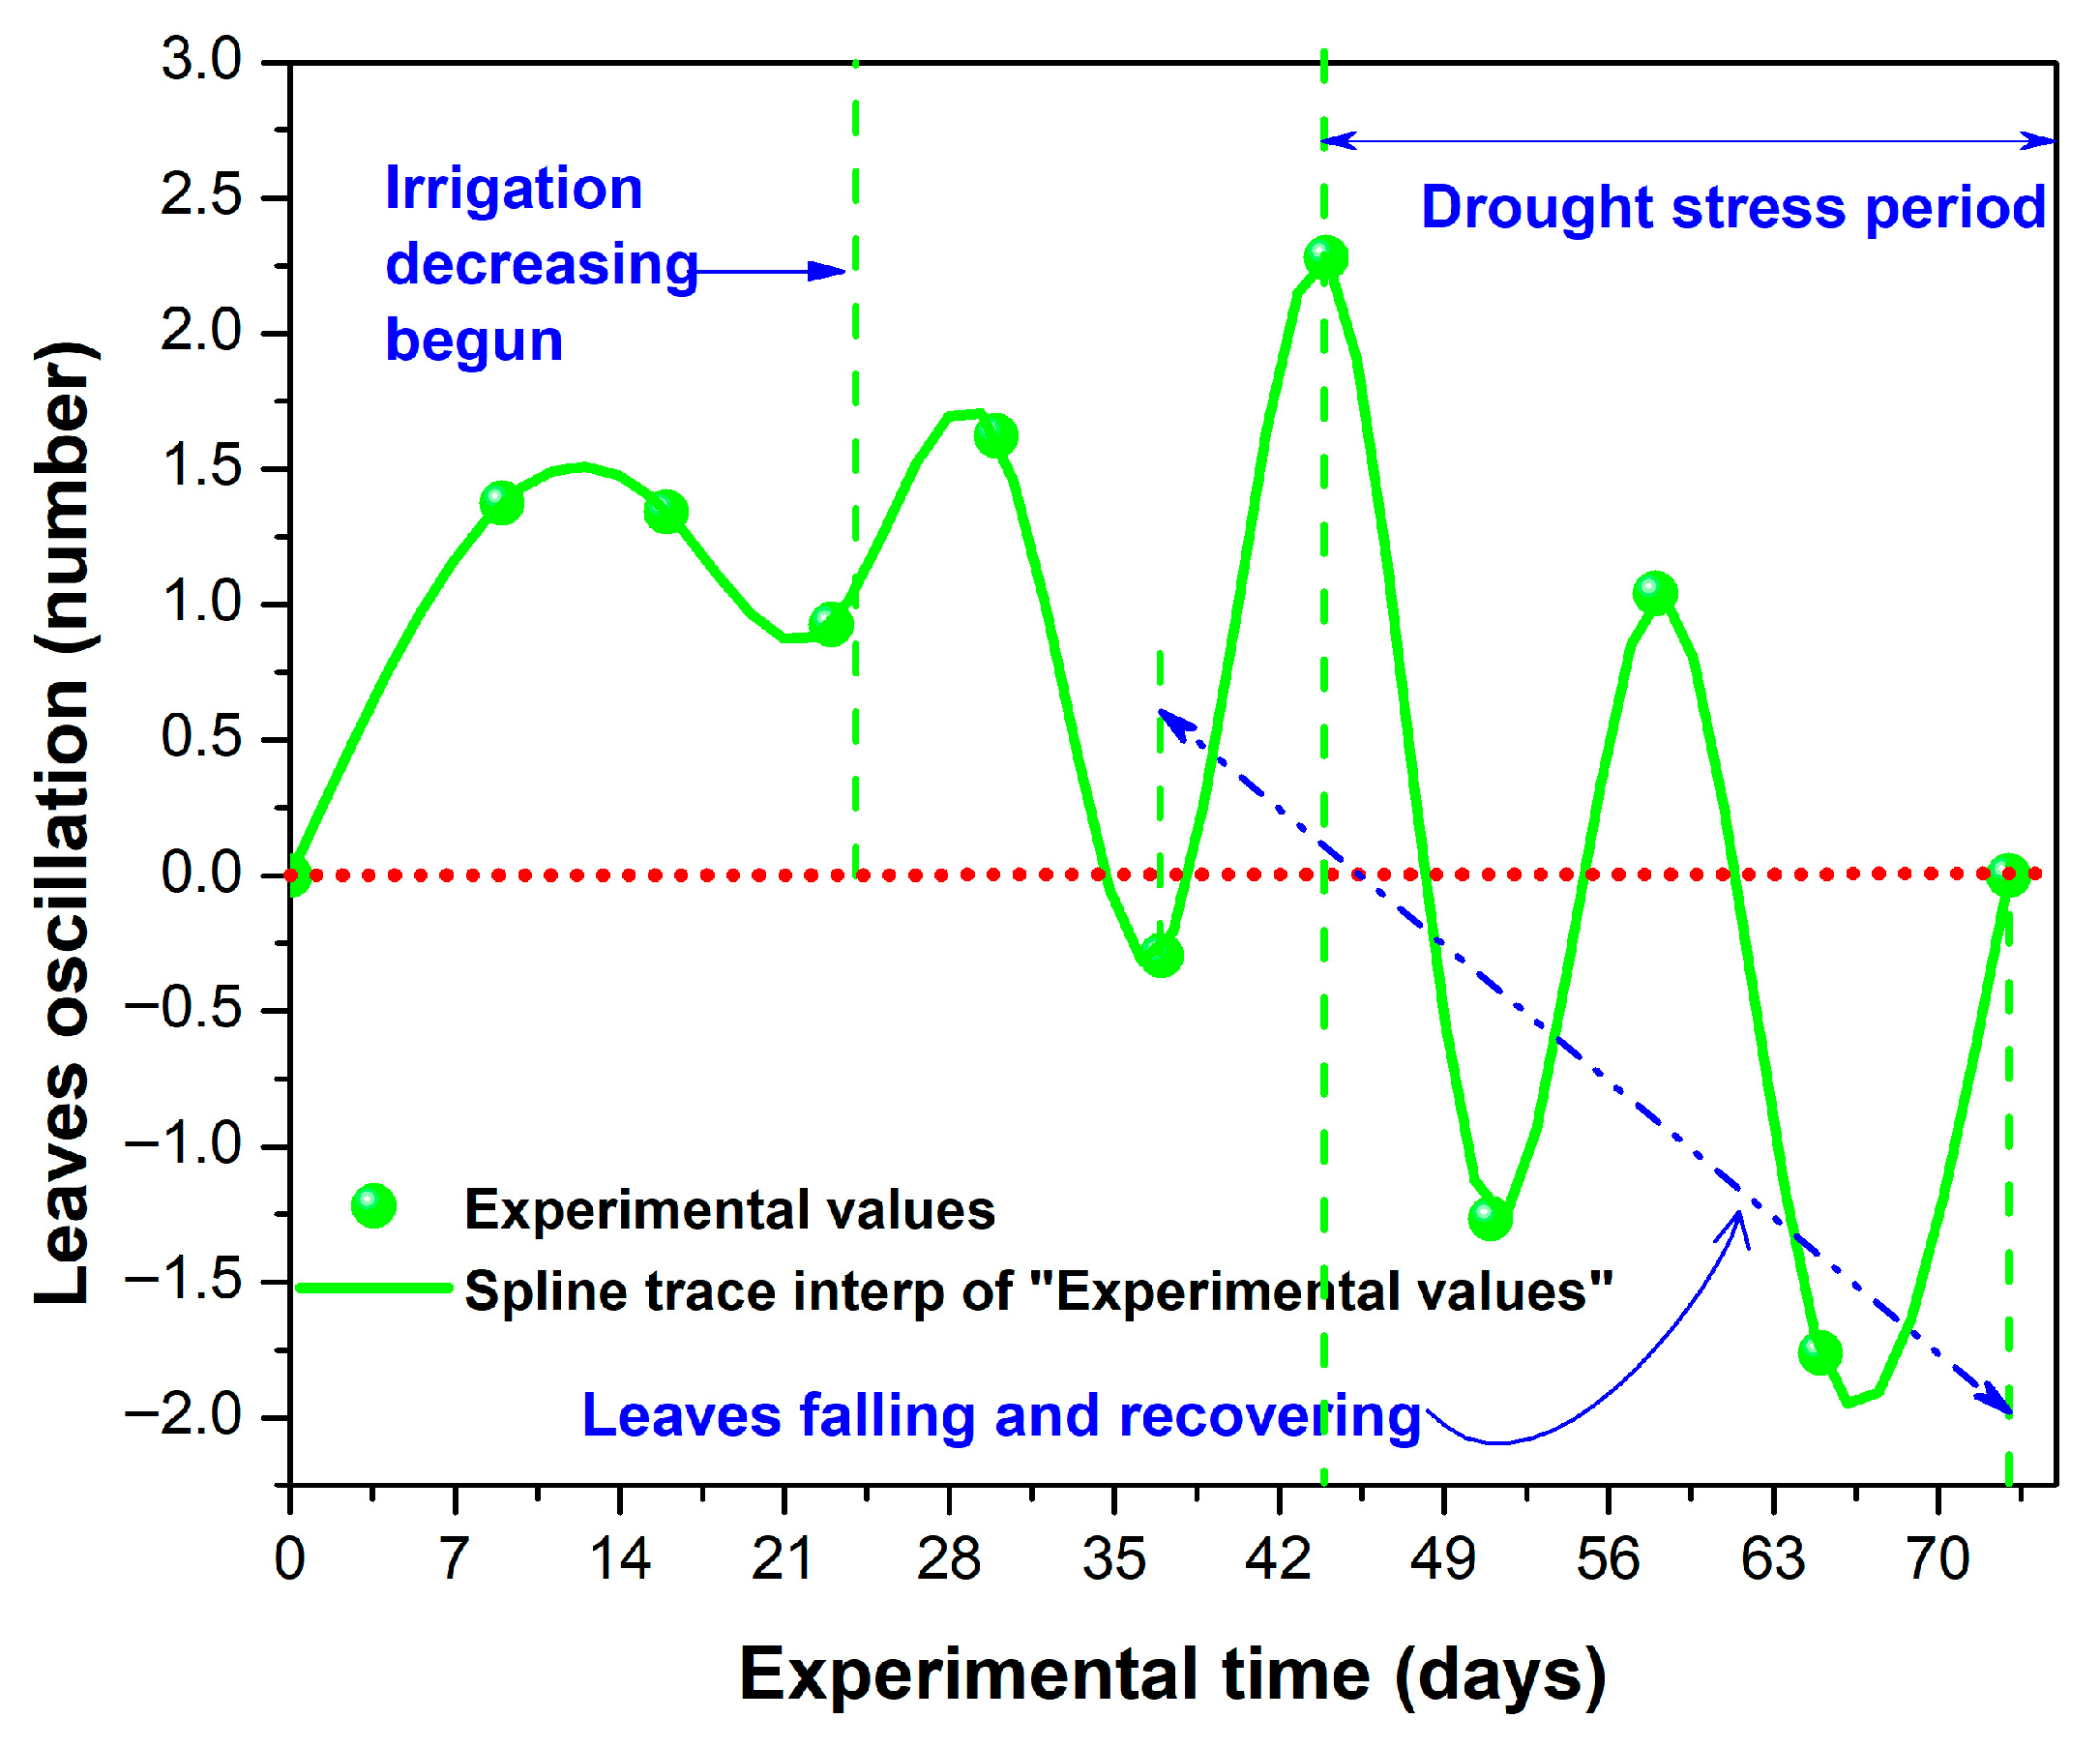
Figure 2 illustrates the statistical means of the leaf number. As the water regime decreases, the leaf number continues to rise. After reaching a peak, the leaf count begins to fluctuate more rapidly, and the plants start to shed leaves due to senescence.
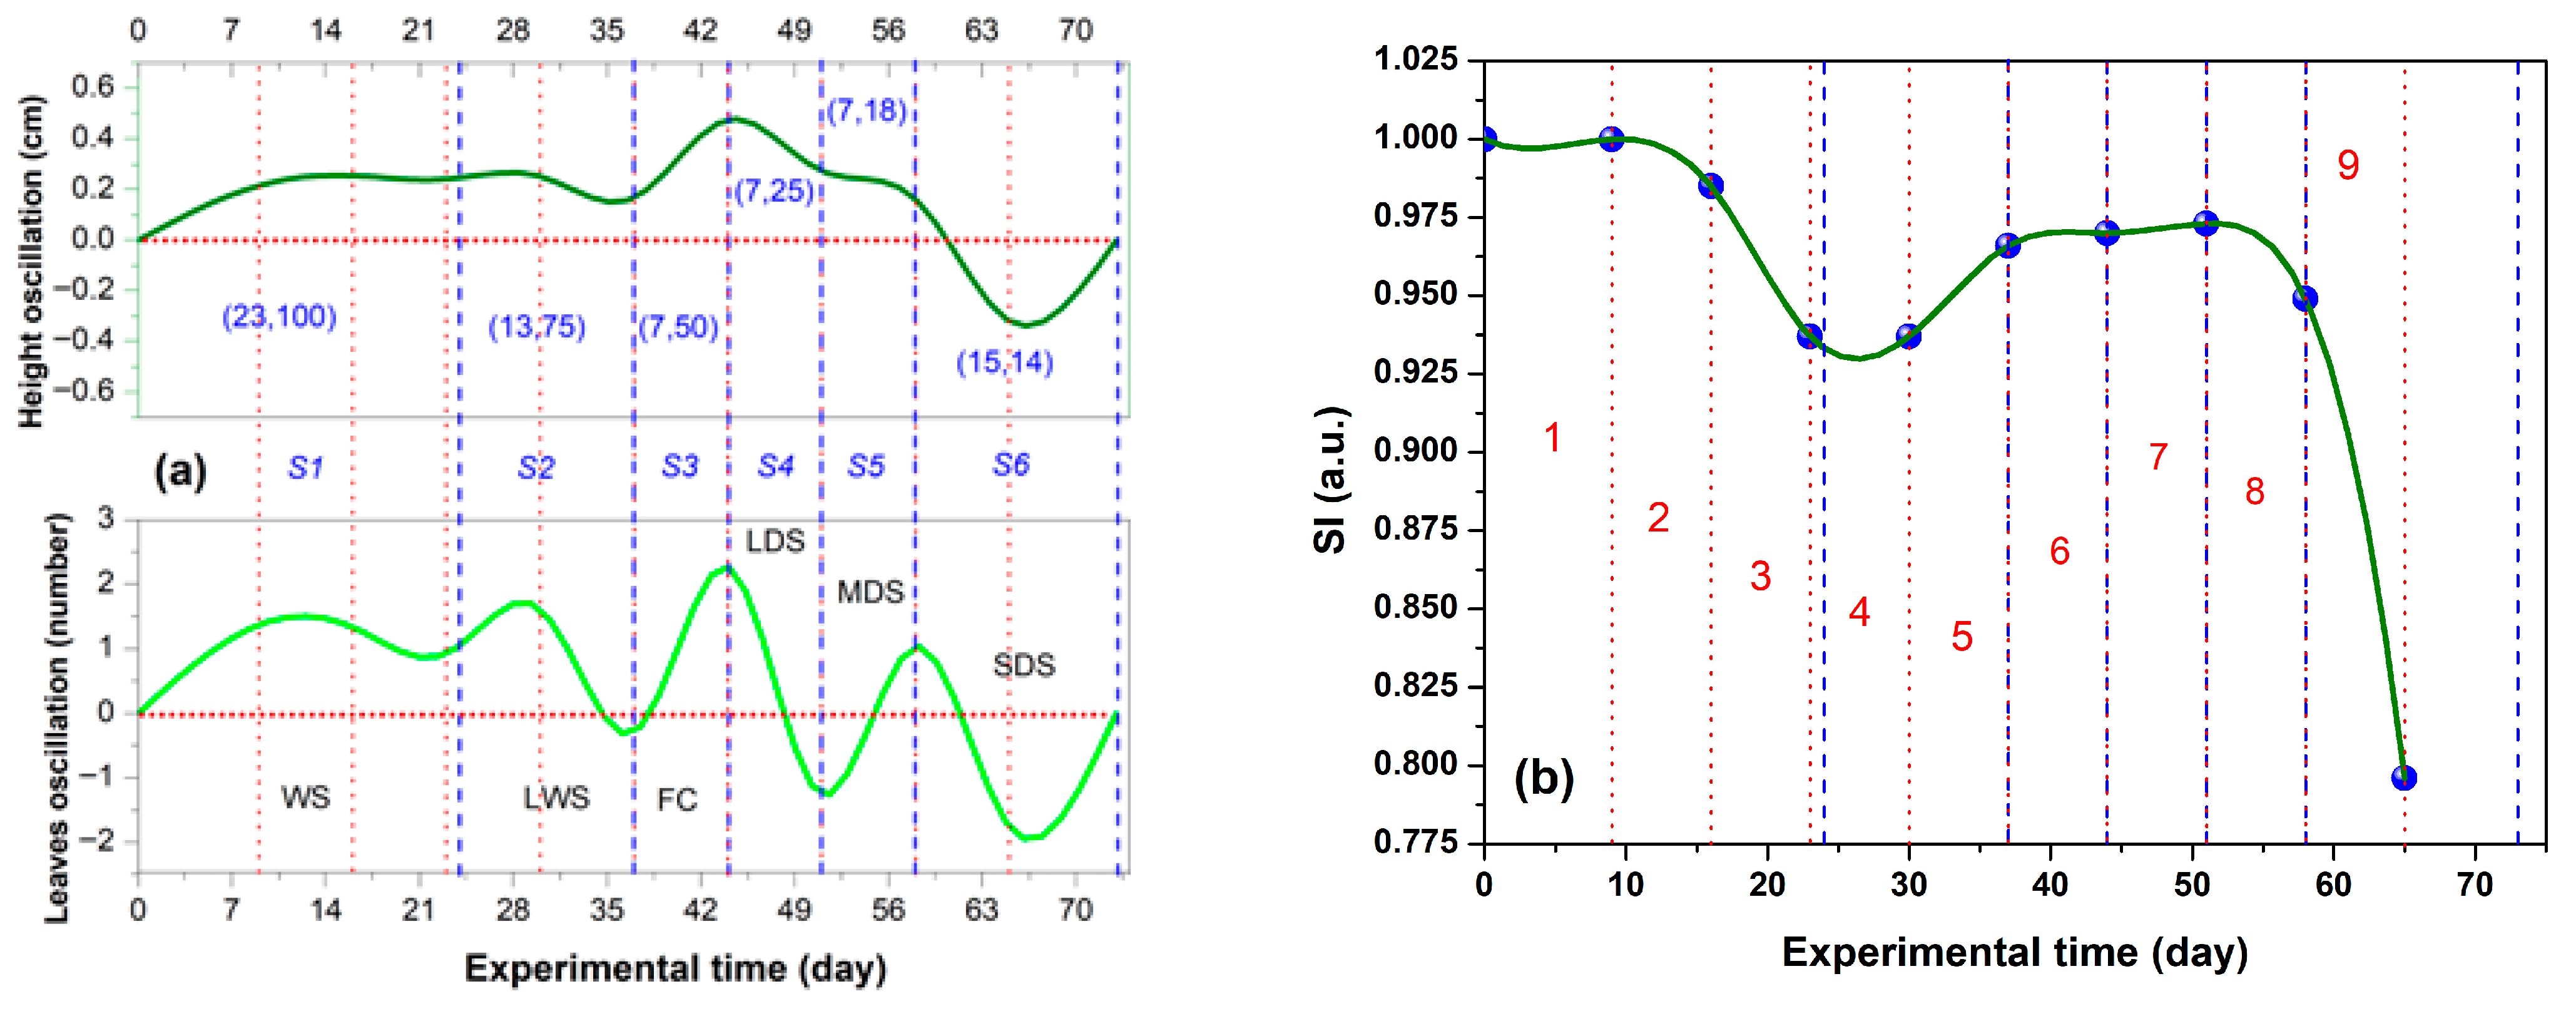
Figure 3a illustrates the growth of plant height (top) and leaf number (bottom). After reaching the peak of growth (S3), the plants began to adapt to drought stress. Ultimately, growth ceased, and final leaf senescence occurred, leading to a rapid decline in the condition of the plants by week 9, followed by their death. The six water regimes were classified as stages S1–S6, because in addition to differing in irrigation level, they also vary in time. Each stage was named according to its effect on the plants, the deduction of which is explained later.
Figure 3b shows the general values of the experimental data (for the entire experiment). After reaching a peak, the leaf number begins to fluctuate more rapidly, and the plants start to shed leaves due to senescence. Note that in weeks 5, 7, and 9, leaf fall increased as the water regime decreased. The criteria used to identify the weeks and stages are consistent across all subsequent Figure 2, Figure 3, Figure 4, Figure 5 and Figure 6.

2.2.2. Irrigation, SDL, and ASL Effects on Height, Leaf Number, SI, and V I T

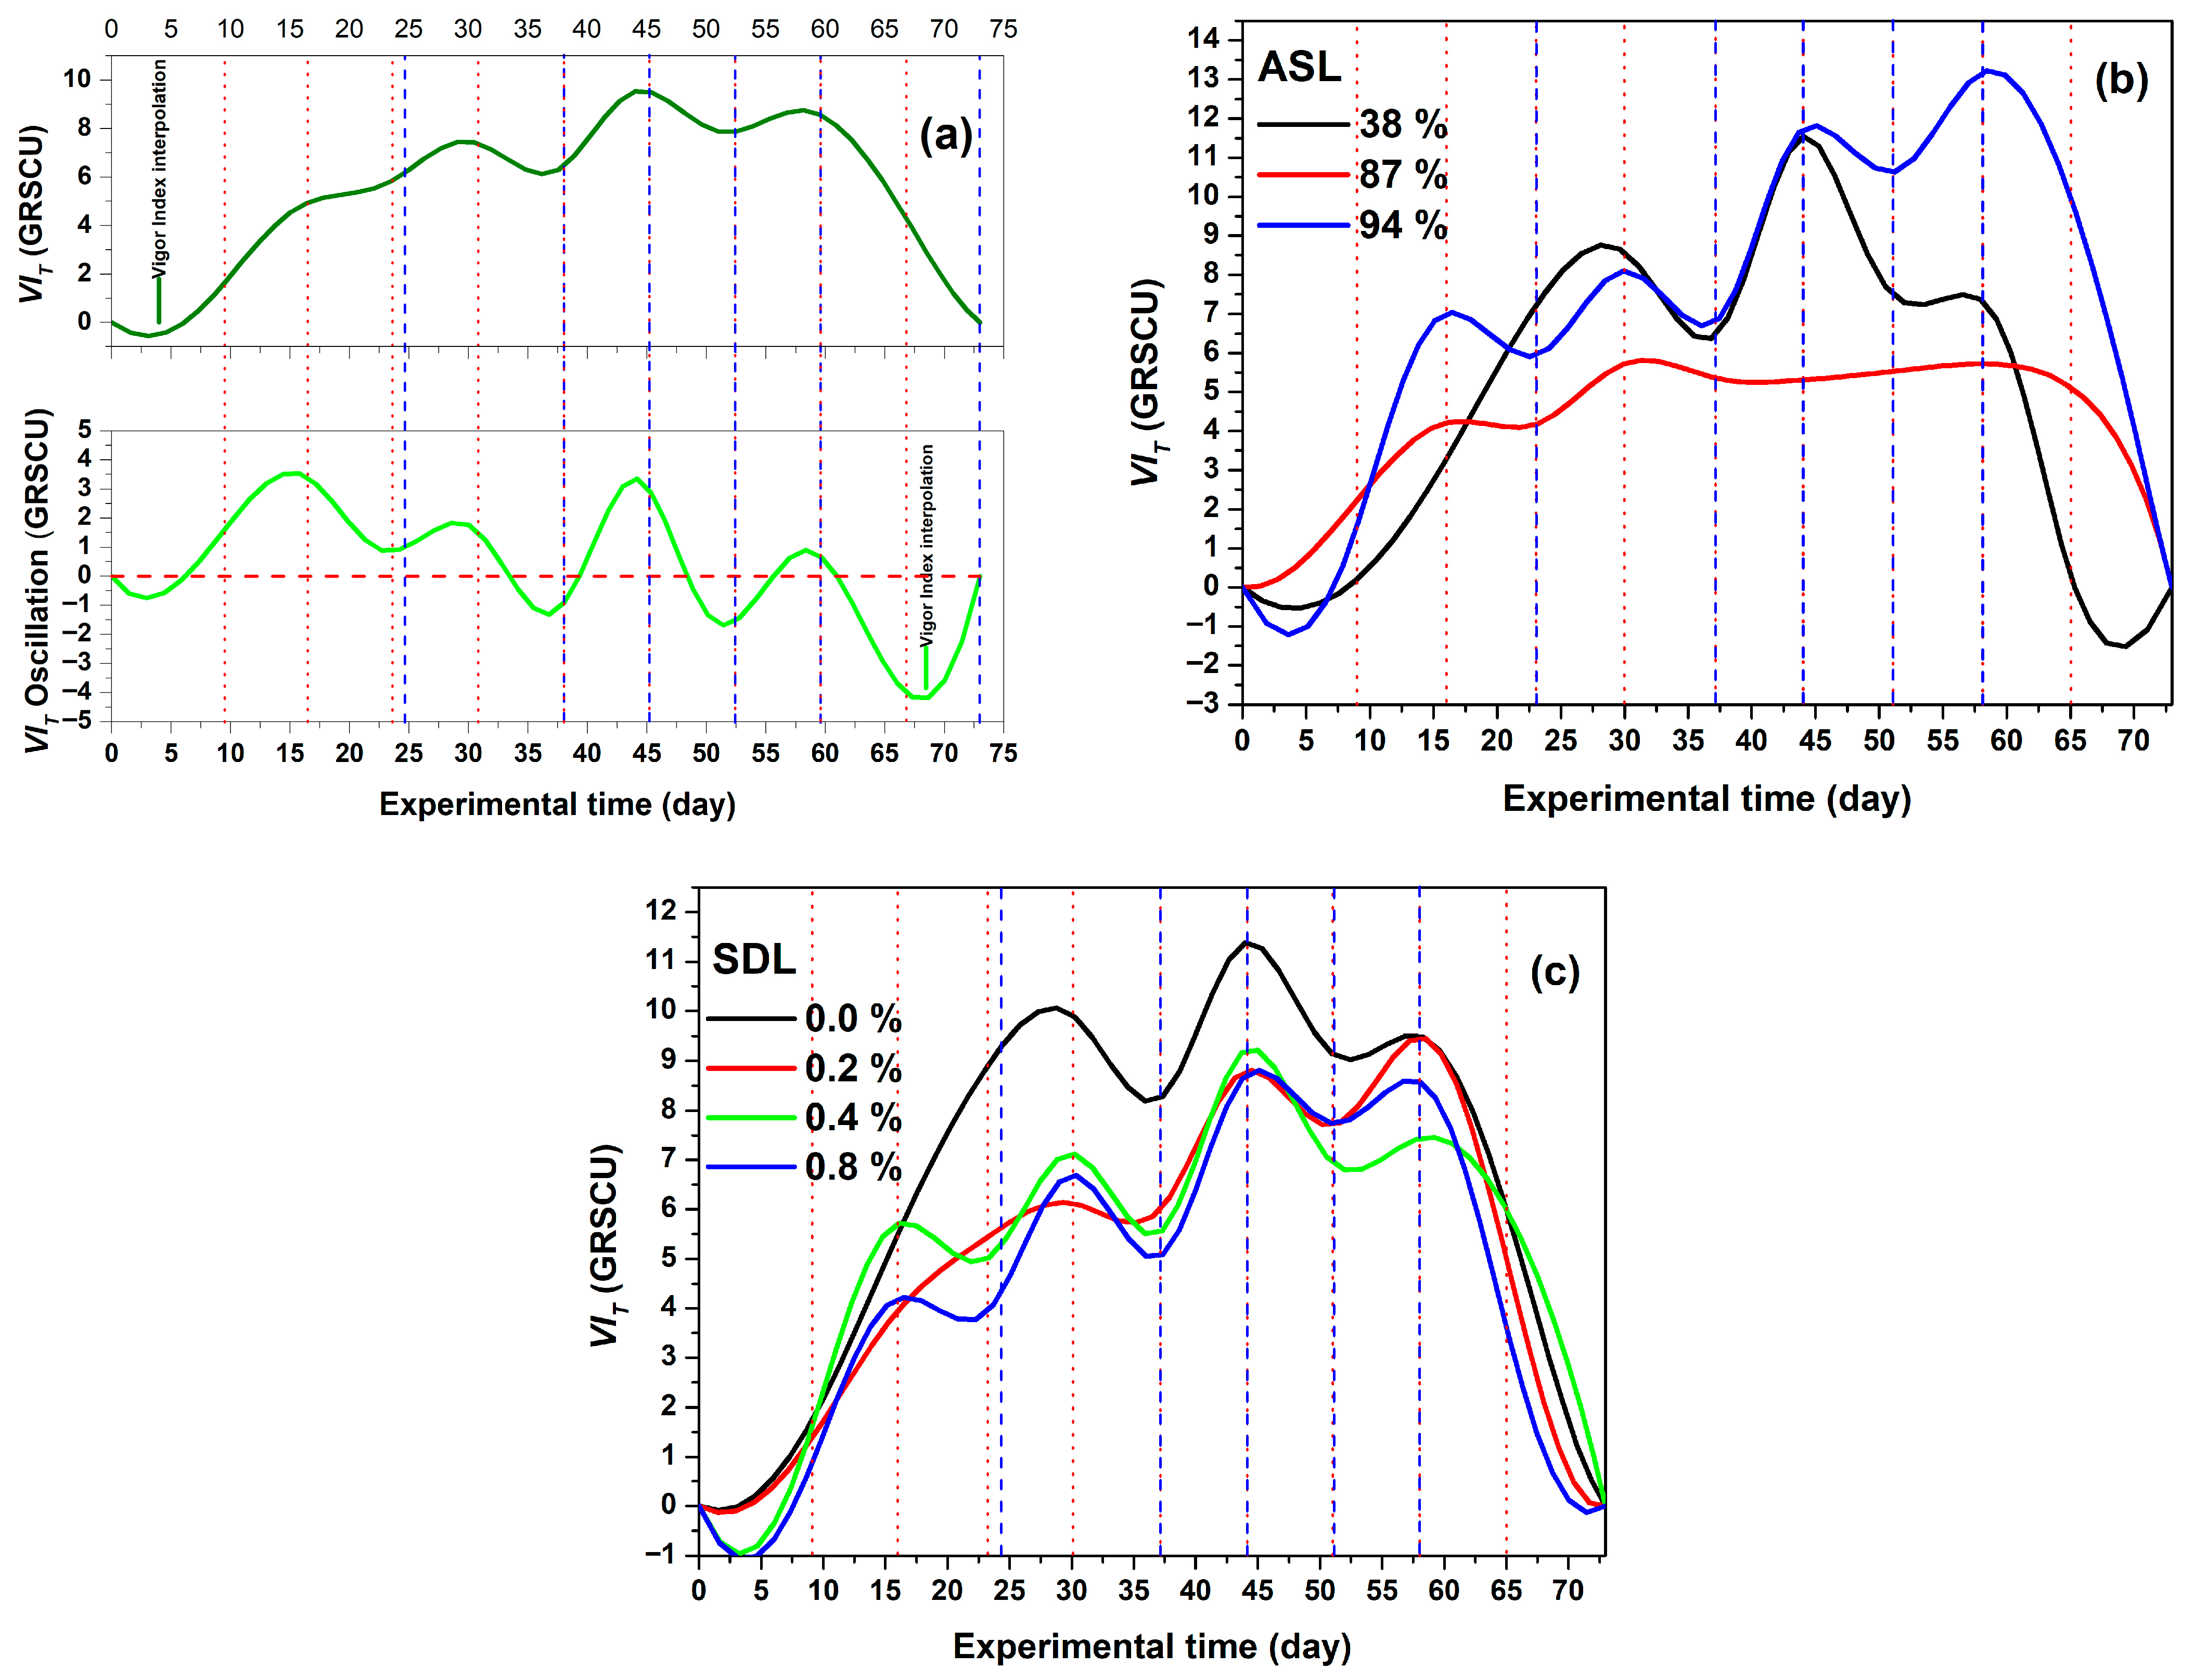
Figure 4a shows the V I T general values; the top part depicts sustained growth, as the plot from the beginning of W1 to the end of W4 follows a double sigmoid profile, but in W5, the V I T general value exhibits a decreasing sigmoid profile. W6 has an increasing sigmoid profile reaching maximum values, and finally, W7-W8-W9 have decreasing-increasing-and decreasing sigmoid profiles, respectively. The bottom part illustrates the oscillation of V I T general values (or gradient of change), suggesting different factors involved among three groups: W1–W5, W6, and W7–W9, as will be seen later.
Figure 4b shows V I T values by the effect of ASL. The highest values correspond to ASL = 94%, whose maximum value is reached in W8. The lowest V I T values were recorded in W4–W9 when ASL = 87%.
Figure 4c shows V I T values by the effect of SDL, with the highest values per week present practically throughout the entire experimental period cycle when SDL = 0.0%.
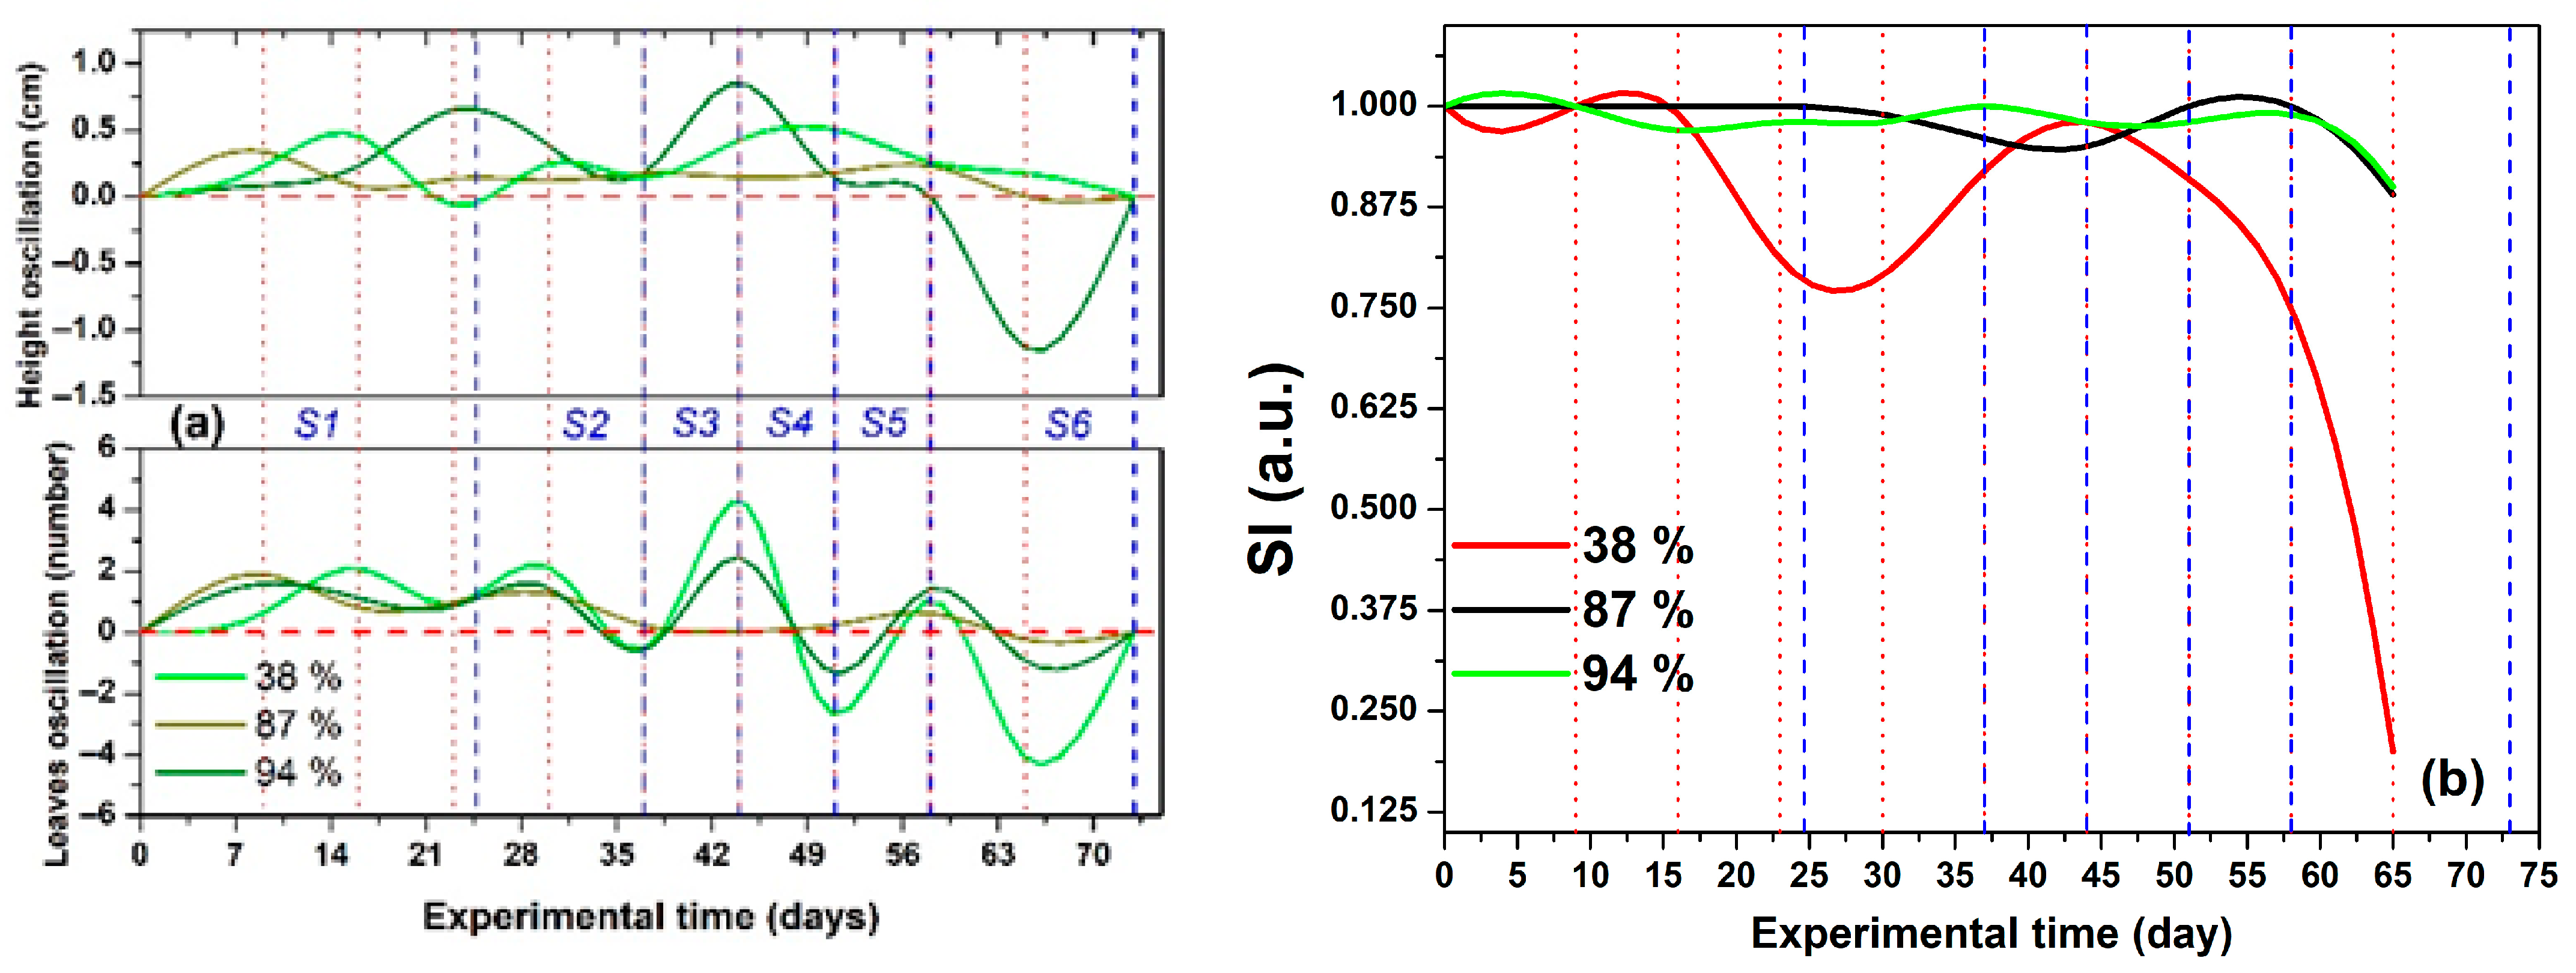
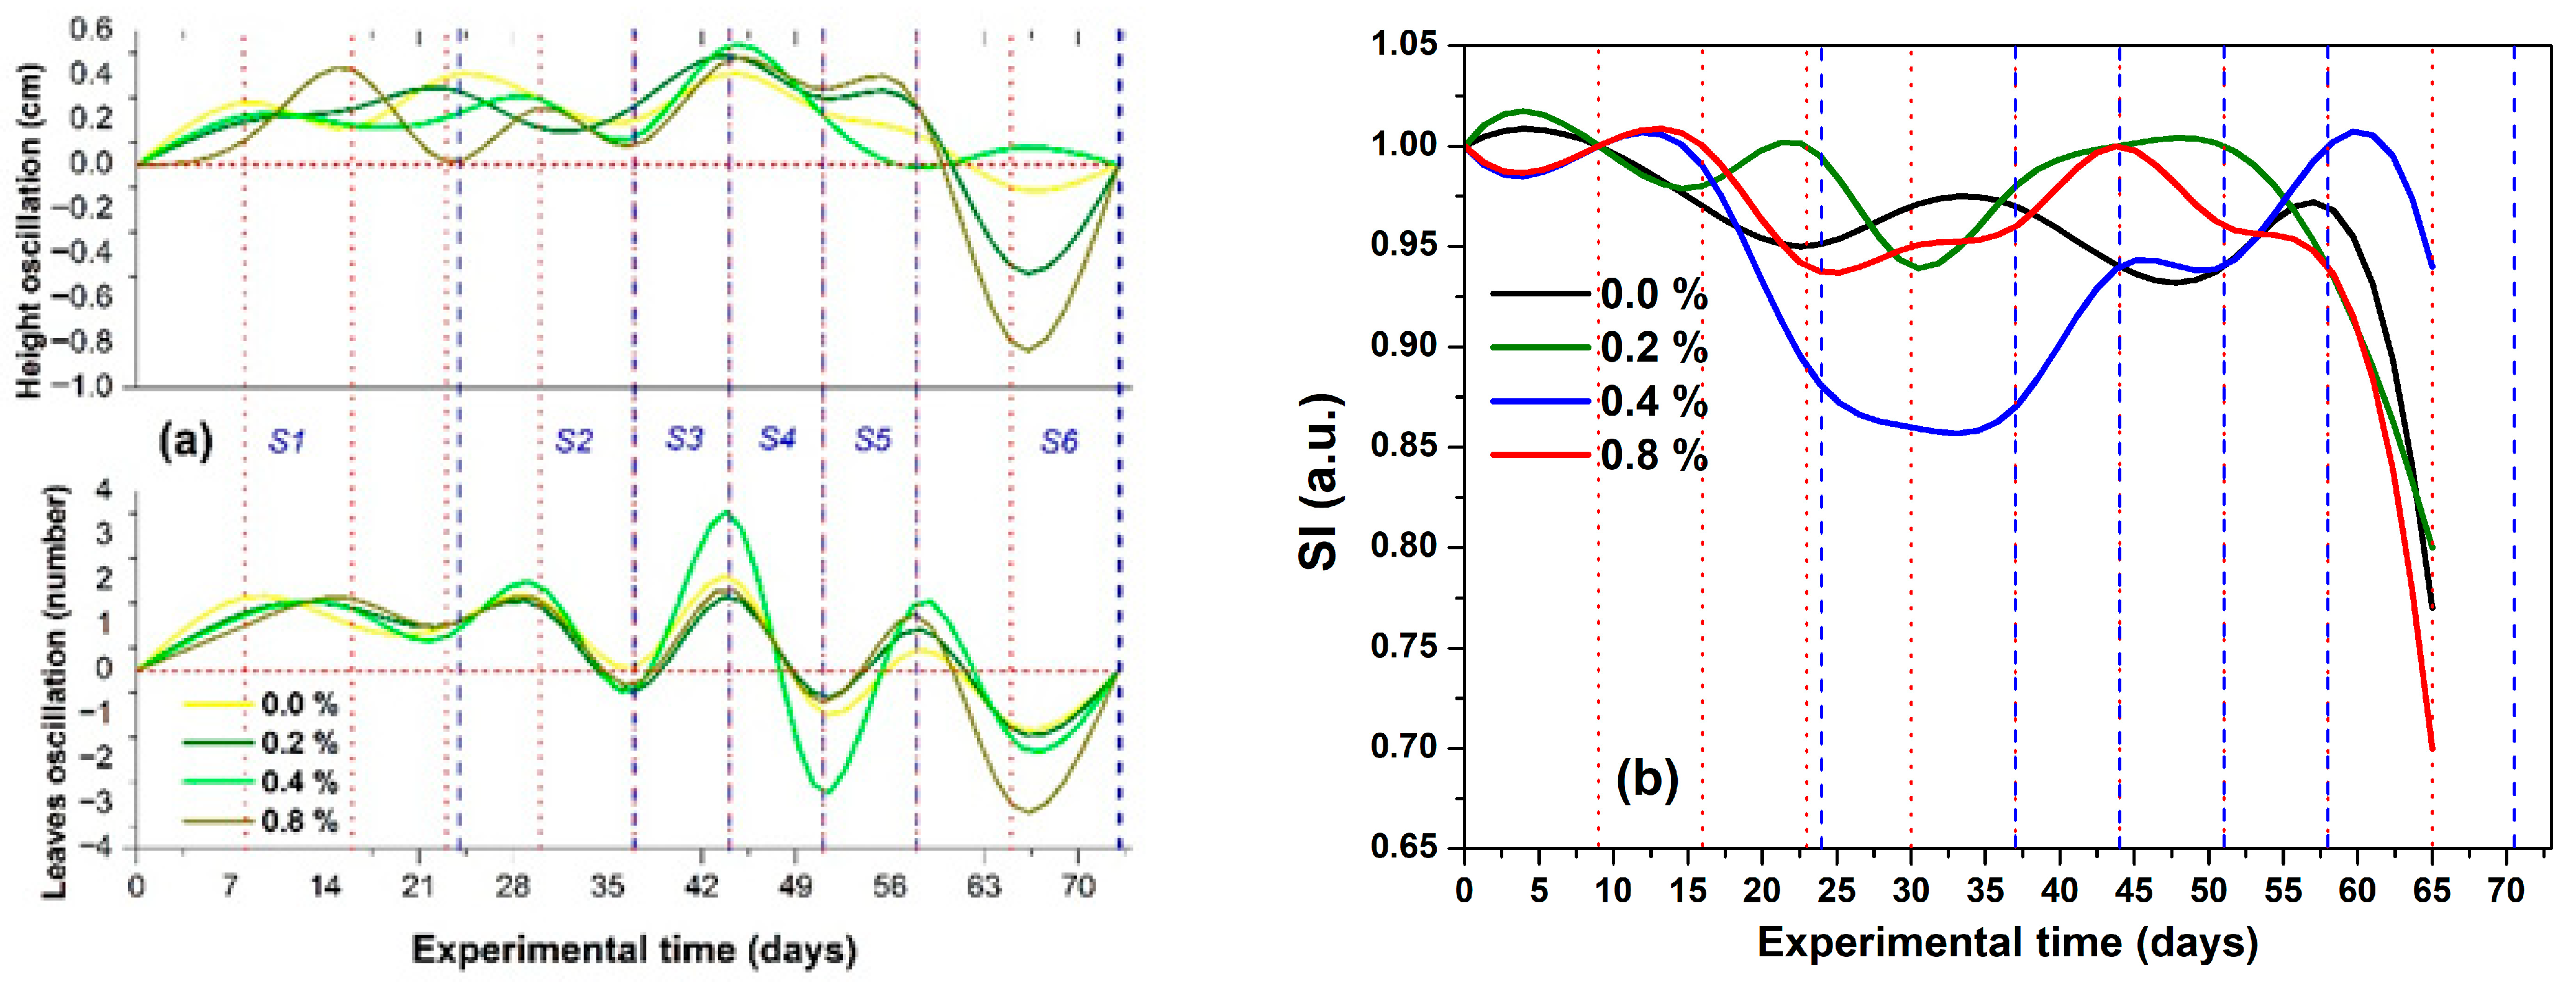
Figure 5a shows height and leaf number, top and bottom, respectively; Figure 5b shows SI general values by the effect of ASL.
Figure 6a shows height and leaf number, top and bottom, respectively; Figure 6b shows SI general values by the effect of SDL.
Every week, the quantity of growth in height differed; we have termed this oscillation, which is closely linked to the irrigation level and fluctuation in the leaf number. Taking into account these facts and Figure 5 and Figure 6, as well as the previous ones, we explain the results as Stage 1–6.
Stage 1 (W1–W3)
This stage involves seed emergence, an increase in the number of leaves, height, and mortality of seedlings; the water regime remains unchanged. The SI general and V I T general values are influenced principally by seed emergence and the growth in height and leaf number in W1 and W2. In W3, however, the SI general value drops sharply, primarily due to the lowest SI values at SDL = 0.4% and 0.8%, and ASL = 38%. Additionally, V I T general values increase more slowly, supported by V I T values at SDL = 0.0% and ASL = 38%.
Stage 2 (W4 and W5)
This is when seedlings and plants begin to adjust to the new irrigation level without the influence of seed emergence. In W4, plant height growth and the leaf number showed a trend of increasing, but in W5, they were inversely related without an evident influence of SDL or ASL; furthermore, in W4, the SI general value was almost the same as in relation to the previous week (although influenced mainly by ASL = 38%, suggesting an impact on the output variables, which also decreased), while in W5, this value improved significantly. These factors influenced the V I T general values in both weeks similarly.
Stage 3 (W6)
In this stage, the oscillations of plant height and leaf number reached their maximum values, particularly when ASL = 94% and SDL = 0.4%. The SI general value remained almost the same as the previous week, influenced by SI values when ASL = 38% and 94%, and SDL = 0.0%. Consequently, the V I T general reached its maximum value, following the same trends despite another reduction in the water regime.
Stage 4 (W7)
Despite the plant’s slight height growth across all Artificial Shade and Silicon Dioxide Levels, the leaf number was the lowest recorded so far. The SI general value increased slightly, influenced by SI values when ASL ≠ 38% and SDL = 0.2%, reflecting the effects of the previous stage. The rapid reduction of the water regime downwardly impacted the V I T general value.
Stage 5 (W8)
Height growth was the lowest yet, and plants recovered leaves at all Artificial Shade and Silicon Dioxide Levels, despite reduced water regime, but more slowly than in the previous stage. The SI general value decreased, influenced principally by SI when ASL = 38% and SDL = 0.2% and 0.8%. Finally, the V I T general value increased only slightly, influenced principally by V I T when ASL = 94% and SDL = 0.0% and 0.2%.
Stage 6 (W9 and the Final Experimental Period)
Here, the plants began their senescence, stopped growing, and the leaf number decreased dramatically; the SI general and V I T general values were the lowest since stage 2, reaching zero by the end of W9. The final V I T values by effect of SDL and ASL were ranked from largest to smallest as follows: ASL = 94%, 87%, and 38%, and SDL = 0.4%, 0.0%, 0.2%, and 0.8%. Ultimately, from here until the completion of the experimental period (day 73), all plants died.

2.3. Water Regimes Effect and Identification of the Stages with Soil Water Availability and Hydric Stress

If we assume that the relationship between hydric stress types and water availability was based on changes in their output variables (height, leaf number, and SI), then the conditions of each stage can be deduced based on the ASL effect mainly.
Based on Table 1 and Table 3, the W1-W2, W6, and W8-W9 (corresponding to S1, S3, and S6, respectively) showed significantly different V I T values, while W3, W4, W5, and W7 did not significantly differ.
Based on figures with ASL effect, the V I T values increased and decreased following sigmoid profiles, particularly in W1–W3 with an increasing double sigmoid, while the remaining weeks exhibited increasing and decreasing sigmoid profiles.
In W1 and W2, the V I T values increased following the typical sigmoid profile of emergence, leaf, and height growth, with the water regime being the initial one. In W3, the V I T values decreased; however, the sigmoid profile was increasing, and the water regime had not changed yet, with the output variables decreasing.
At W4, the V I T values increased, as the water regime decreased for the first time, and output variables increased again, suggesting adaptation to change. At W5, the V I T values decreased once again; the water regime remained unchanged.
The above, coupled with low SI values in W3 that persisted into W4, suggests a flooding effect. W1–W3 or S1 was named Waterlogging Stress (WS), and W4–W5 or S2 was named Low Waterlogging Stress (LWS).
In W6, the V I T values increased and reached their maximum level. The water regime decreased for the second time. The values of the output variables also mostly reached their maximum level, suggesting improved adaptation throughout the experimental period. When this adaptation occurs, the effect is due to the soil reaching field capacity (FC).
In W7, the V I T values decreased again, and the water regime decreased for the third time. The values of the output variables also decreased, again suggesting an impact of drought stress adaptation named Low Drought Stress (LDS). In W8, the V I T values increased mainly by artificial shading application and slightly in the remaining areas, suggesting initial senescence in the plants due to the decline in height and leaf number and therefore an increase of the drought stress named Medium Drought Stress (MDS). The water regime decreased for the fourth time. In W9, the V I T values dropped abruptly due to accelerated death, and the water regime dropped for the last time. These facts suggest the effect of Severe Drought Stress (SDS).
Based on Table 2 and Table 3, during W1–W9, the V I T values were not significantly different. The up-and-down fluctuations were the same as those in the ASL effect. SI values were lowest in W3–W5 when SDL = 0.4%, but highest in W8 and W9.
Figure 7 shows the values of V I T , that were as higher as ASL increased.

3. Discussion

3.1. Comparison of Elements to Calculate Vigour Index and Importance of V I T Calculation

In previous research, the VI traditional calculation of seedlings has also been calculated using the following parameters on seedlings: height, length, root system length, hypocotyl length, root system fresh weight, aerial part fresh weight, and dry weight [36,40,41,42,43].
Vigour Index I (Seedlings length) or VI (SL):
V I   ( S L ) = R o o t   l e n g t h + S h o o t   l e n g t h × ( G e r m i n a t i o n   p e r c e n t a g e )
Vigour Index II–Dry weight or VI (DW):
V I   ( D W ) = D r y   r o o t   w e i g h t + D r y   s h o o t   w e i g h t × G e r m i n a t i o n   p e r c e n t a g e
Vigour Index without root length:
V I = ( S e e d l i n g   L e n g t h × G e r m i n a t i o n   P e r c e n t a g e ) / 100
Here, germination percentage is a synonym of emergence percentage.
The physical factors used to calculate the traditional VI are plant length, weight, and number, concentrated in stems, roots, and shoots. Equations (1) and (2) employ a destructive measurement method; Equation (3) only considers plant length or height.
The proposal in this manuscript was as follows:
V I T   = ( P H × L n ) × ( S P n / S t )
where V I T = Vigour Index on time basis; P H = Plant Height; L n = Leaf number; S P n = number of survival plants; S t = Survival time (weeks). It considers the total survival weeks for each week since the emergence of seeds.
From Equation (4)
S P n = G s D s p
where G s = accumulated germinated seeds; D s p = accumulated dead seedlings
Here, germinated seeds are a synonym of emerged seeds.
Then
V I T = ( P H × L n ) × ( G s D s p ) / S t )
Therefore,
( V I T × S t ) / L n = ( P H ) × ( G s D s p )
Consequently,
V I T × S t L n = ( P H × G s ) ( P H × D s p )
Finally,
( P H × G s ) = V I T × S t L n + ( P H × D s p )
To compare Equation (3) vs. Equation (9), then from Equation (3) we have
V I × 100 = ( S e e d l i n g   L e n g t h × G e r m i n a t i o n   P e r c e n t a g e )
or
V I × 100 = P H × G s
Equation (11) evidently does not contain the same parameters as Equation (9); our proposal is non-destructive, takes into account plant length, leaf regeneration capacity due to adaptation to the water regime, mortality events, and finally survival time (or rate of survival change). The concept V I T on time basis has been proposed mathematically for seed aging based on storage time. However, it is not associated with a mathematical methodology that models seed initial vigour and their ability to germinate and establish seedlings rapidly, uniformly, and robustly across diverse and adverse environmental conditions during vegetative growth [44,49].
Furthermore V I T , values are projected between discrete weekly values by applying mathematical interpolation. The use of interpolation functions, such as membership functions, can help automate the process of measuring morphometric characteristics, and therefore, the measurement of vigour as well [47].

3.2. Water Regimes Effect Linked to Water Available in the Soil and Stress Type

3.2.1. Waterlogging Stress

Considering that Amm plants showed adaptation to different water regimes through oscillations in height growth, leaf number, survival, and death events affecting SI general and V I T general values of the plants:
Although the critical threshold of moisture depends on soil type, moisture, and the plant’s requirements, moderate waterlogging stress is considered to be a layer 50% higher than the field water capacity, according to water regimes in this research, where S2 and S1 were 33% and 50% above, respectively [48,50,51,52].
In S1 (WS), emergence affects the results of SI and V I T general values were obtained possibly through the following process: (1) During seed germination, the amount of water absorbed is influenced by the physical properties of the soil. Excess water retention during the imbibition process can suffocate the embryonic axis by limiting oxygen entry. However, vigorous seeds could germinate across a wide range of soil water levels. (2) Reduced growth in stem length due to diminished apical dominance leads to leaf chlorosis and promotes senescence and abscission [40,53].
In S1 and S2 (LWS), if the water regime had been optimal for maximum water absorption by the plant roots, the SI general values would be close to one. However, persistent waterlogging stress led to senescence and mortality in the seedlings and plants. Possibly, the initial or incipient FC results in stunted plant growth, reduced leaf development, and a higher incidence of seedling and leaf death as noted in [54].
These stages begin with the onset of stress, which is marked by an alarm reaction, a deviation from the functional norm, decreased vitality, and catabolic processes predominating over anabolism and restitution. This initial condition is followed by a resistance phase, characterised by adaptation, repair, and reactivation processes. Ultimately, this sequence leads to a regeneration phase, in which physiological functions are partially or fully restored, provided that the damage was not too severe [55,56].

3.2.2. Field Capacity

The regeneration of leaf number, optimal height growth, and highest SI general values positively influenced the highest overall V I T general values.
In S3, FC refers to the water content in the soil after excess water has drained by gravity, typically measured as a volumetric percentage (%). It is a condition where micropores are filled with water and macropores with air. Soil moisture at FC is retained longer, provided there is no evaporation or the influence of groundwater (capillary). For field capacity, there are several names, including retention capacity, maximum water capacity, capillary capacity, and water retention. FC is also the largest amount of water that can be applied during irrigation, because water above the FC value is considered harmful to the plant.
Referred to as FC, defined as the threshold at which water in larger pores has been drained away by the force of gravity, it is typically at a tension of −10 to −33 kPa. Above the FC, water is gravitationally lost and rapidly percolates (generally unavailable to plants for more than 1–3 days). Below the FC, water is available to plants up to the permanent wilting point (at −1500 kPa), where the water content drops below accessible levels (e.g., 5–20% depending on soil type) [51,57,58,59].

3.2.3. Drought Stress

It is considered drought stress when the available water capacity values are between 50% and 70% below the FC value, classifying drought levels as low, moderate, or severe. Available water capacity is the total amount of water available to plants that can be absorbed by their roots, estimated as the difference between the soil water content at field capacity and the permanent wilting point. In this research, the values below field capacity were 50%, 65%, and 72% for S4, S5, and S6, respectively [57,60,61,62].
S4 and S5, referred to as LDS (Low Drought Stress) and MDS (Moderate Drought Stress), represent periods of manageable stress that can benefit plant growth and turgor pressure. Some researchers suggest that mild stress is advantageous, as it stimulates cell metabolism, enhances physiological activities in plants, and has no negative effects, even over extended periods.
These stages can be understood using the concept of strain (pre-end phase), which pertains to the stress response and applied forces before any damage occurs. This concept highlights long-term stress marked by excessively high stress intensity, which can overload a plant’s adaptive capacity. In other species, reducing the water regime can quickly lower the soil’s water potential, resulting in wilting leaves. However, when recovery irrigation is applied, it raises the water potential, allowing the plants to survive and undergo regrowth [55,56].
One mechanism that contributes to drought resistance is osmotic adjustment (the ability of plants to accumulate solutes in the face of water shortages actively) for maintaining high turgor potential, despite its decrease. Such reactions include the shedding of aerial organs to reduce water loss due to transpiration, as well as the regulation of plant phenology [63].
In S6 (SDS), plants finally reached senescence under the permanent wilting point. Here, researchers “introduce the ecosystem wilting point (ΨEWP), a property that integrates the drought response of an ecosystem’s plant community across the soil–plant–atmosphere continuum. Specifically, ΨEWP defines a threshold below which the capacity of the root system to extract soil water and the ability of the leaves to maintain stomatal function are strongly diminished” [64].
Additionally, the potential water absorption by the roots is greater than the potential transpiration. The points mentioned earlier can be clarified by examining the impact of dormancy on the growth of perennial aromatic medicinal plants, as well as the moisture retention capacity of the substrate [65,66,67,68].

3.3. ASL and SDL Effects on V I T , Linked to the Water Regimes

Based on V I T values of the Table 1, Table 2 and Table 3, SI values, and oscillation growth.
In the case of ASL in this research, when the water regime was reduced, Amm plants adapted, stabilised, and recovered without the need for recovery irrigation, which was clearly influenced by the V I T value when ASL was at 87% and 94%; both levels can be considered as moderate and severe, respectively [31,32,33,34,69,70,71]. Furthermore, considering that some plant species improve certain physiological and growth aspects under shade while others do not, we discuss some of them to continuation.
When we compare the mean V I T values, it is evident that there is less survival but greater growth when ASL = 38% (that we may consider as a light shade), compared to ASL = 87 and 94%, in both waterlogging and drought stresses (W3 and W5, W8 and W9 particularly).
In the first case, temperature and waterlogging may play a key role because roots of seedlings rapidly slow down their respiration and accelerate sugar consumption, absorb less water, and decrease their conductance due to the closure of stomata and an improvement in the transfer of electrons between photosystems (photosynthetic transport chain and photorespiration), positively affecting growth [72].
In the second case, some researchers found that the species differed in their survival and growth rates in drought, light, moderate, and severe shade conditions. Two instances were as follows: (a) in moderate shade, seedlings’ survival was higher for orange varieties than those in light shade, as with mango varieties, (b) all of the juvenile plants of the Eucalyptus globulus subsp. globulus species decreased in height under moderate and severe shade, depending on the seed’s origin (geographic region). In W9, the SI general value reached its lowest level, from largest to smallest: SDL = 94%, 87%, 38%. This effect is primarily due to water demand being influenced by transpiration under conditions of low field capacity and high evaporative stomatal activity, caused by low shading levels and high radiation [55,69,70,71].
In summary, with higher levels of shade, soil, and air, leaf temperatures decrease, resulting in reduced evapotranspiration, increased air humidity, and greater soil moisture availability compared to lightly shaded plants, which alleviates stress. Furthermore, the net assimilation rate and plant growth are significantly reduced. Seedlings exposed to lower light levels tend to have better survival rates due to improved soil moisture retention [45,73].
The SDL effect was not significant at any week. In the case of SDL = 0.0%, the reasons for the lower general V I T values due to growth in height and number of plants should be further investigated. It cannot be concluded that silicon application did not affect some mechanisms for seedling survival.

4. Material and Methods

4.1. Experimental Place and Preparation of Bio-Space

In the facilities of the “Faculty of Agriculture and Environmental Sciences” of the Autonomous University of Guerrero, in the City of Iguala de la Independencia, Campus Tuxpan, a bio-space was prepared to experiment on Agastache mexicana subspecies mexicana. The dimensions of the bio-space for this experiment were 7 × 12 × 9 m3 (height × length × width), covered with special plastic film for the greenhouse. The water used was well-water, pumped with an automated sprinkler irrigation system on three table-like structures with metallic elements containing the trays with seed planting, which were placed on wooden beams (four repetitions on three tables, see Table 4) to separate the trays from the table-kind metallic, to allow water to flow freely out of the cavity.

4.2. Substrate Preparation, Seed Sowing, and Experiment Design

To prepare the substrate, we used without previous treatment Canadian peat or peat moss, whose technical data sheet is in Supplementary Material Section S3, as shown in Table S15. Additionally, the pH value was measured to be 8.5 with a potentiometer. Both ingredients were mixed manually until the mixture was homogeneous (making the mixture resemble mud without excess water); therefore, achieving very specific water content was necessary by adding water little by little in 1 mL, 5 mL, and 100 mL tubes until the desired consistency was reached. For this reason, the weight of peat moss was 1.4148 kg and water = 1.886 L. Using the final weight of the mixture as a reference, we added SDL (0.0%, 0.2%, 0.4%, and 0.8% m/m).
Thus, the mixtures were placed into the tray with dimensions 67 × 33 × 6.5 cm3 with 200 cavities, filling 20 well cavities for each SDL and four repetitions for each ASL (38, 87, and 94%).
Two rows were left empty between every filled row with seeds to avoid migration of substrate and water. In summary, the experiment can be seen in Table 4. The seeds were sown at a depth approximately equal to three times their size.

4.3. Artificial Shade Level Measurements

Above the samples (four replicates for each SDL) placed on a table (1) no shade mesh, (2) 60% shade mesh, and (3) 80% shade mesh. The shade mesh percentage was according to the manufacturer’s labels. Using a digital lux tester (Luxmeter QIYUDS8©), we measured the amount of light outside the bio-space between 12:00 and 13:00 h. Additionally, the amount of light between the plastic of the bio-space and the samples (case 1), and between the shade mesh and the samples (cases 2 and 3) was measured (see Section S4 in the Supplementary Material, Figure S2). Artificial shade was calculated as follows:
%   Artificial   Shade   = ( L o   L i ) ( L o +   L i ) × 100
where L o is light outside the bio-space, L i is the light between the plastic or shade mesh and the samples.
Finally, values were case 1 = 38%, case 2 = 87%, and case 3 = 94%.
Table 4 shows treatments one to twelve (τ1–τ12), with 80 seeds of Amm. In the columns and rows, the total number of seeds for each SDL and ASL was 240 and 320, respectively.
The combination of Silicon Dioxide Levels (SDLs) and Artificial Shade Levels (ASLs) was chosen for its ability to protect Amm plants from high temperatures (ranging from 24 to 35 °C) [74]. We focused on the interplay between water regimes and two key input factors to enhance plant survival and growth.

4.4. Water Regimes Calculation

To calculate the volume and time when the pump was activated, we stored the water in six sprinklers, each placed on a table distributed along its length and hanging at a height of 1 m.
First, the irrigation pump was activated to store water and calculate the volume and time of the water. The pump was also programmed with a trademark Steren timer, model TEMP-08E, to automate the water regime, which was of completely random design as can be seen in Table 5. This system was established for every time (duration days) and water regime. The irrigation was conducted twice every day to achieve the required quantity of water regime.

4.5. Measurements and Indexes

4.5.1. Measurements of Amm’s Plants

The heights of the plants were measured using a Vernier, starting on day nine after sowing Amm’s seeds, for nine consecutive weeks. Each week of measurement was designated simply as week one, week two, and so forth, until week nine (see Section S4 in the Supplementary Material, Figure S3 [45,75]).

4.5.2. Calculations

Vigour Index
For the purposes of this manuscript, the V I T (Vigour Index on time basis) is defined as a measure of growth in height, leaf numbers, regeneration, and survival over time. In this context, the index describes the effects of the water regimes and the stress adaptation response of Amm, allowing for a comparison of the effects of ASL and SDL.
The V I T was calculated following Equation (4), where P H = Plant’s Height, which considers the average of plants total number, L n = Leaf numbers, which considers the average of leaves total number by seedling or plant S P n = number of survival plants, S t = Survival time, it considers the total survival weeks by every week since the emergence of seeds.
The V I T has the following units: (cm)(# leaves)(# surviving plants)/(survival time). We have termed these units GRSCU, where G = Growth, R = Regeneration, S = Survival, C = Capacity, and U = Units. Finally, the data from this experiment are available in Supplementary Material Section S5 (Table S16–Table S27).
Survival Index
SI   =   #   surviving   plants   at   the   end   of   the   week / #   surviving   plants   at   the   beginning   of   the   week

4.6. Statistical Analysis

The data were analysed using a completely randomised factorial design with fixed effects for the response variable V I T , considering drought stress and the effects of ASL and SDL. These analyses employed the ANOVA method and Tukey’s mean comparison test (p-value < 0.05) to identify significant differences between treatments. The model is balanced, as the number of repetitions is equal for each level.
The completely randomised factorial design has the following equation:
Y i j k = μ + α i + β j + ( α β ) i j + ε i j k             ε i j k   ~   I I D N 0 ,   σ 2
where Y i j k is V I T per week with ASL = i and SDL = j; μ is the general mean, α i is the effect of level i of ASL, β j is the effect of level j of SDL; ( α β ) i j is the interaction effect of α i y β j . The errors ε i j k are independents and follow a normal distribution with a mean of zero and constant variance.
The hypotheses to be tested are as follows:
H 0 : There is no effect of ASL on V I T during the weeks of measurement
H 0 : α 1 = α 2 = α 3 = 0
H 1 : There is an effect of ASL on V I T during the weeks of measurement
H 1 :         at   least   one       α i 0
H 0 : There is no effect of SDL on V I T during the weeks of measurement
H 0 : β 1 = β 2 = β 3 = β 4 = 0
H 1 : There is an effect of SDL on V I T during the weeks of measurement
H 1 : at   least   one   β j 0
H 0 : There is no interaction between ASL and SDL factors on V I T during the weeks of measurement
H 0 : ( α β ) 11 = ( α β ) 22 = = ( α β ) 33 = ( α β ) 34 = 0
H1: There is an interaction between ASL and SDL in the V I T during the weeks of measurement
H 1 : at   least   one   α β i j 0
When the fitted model does not meet the assumptions of normality or homogeneity of variances, a Box-Cox transformation is applied, implemented via the powerTransform function of the car library.
The Box-Cox transformation is defined as follows:
y λ * = y λ 1 λ           s i   λ 0 ln λ                 s i   λ = 0    
Tukey’s test with a p-value < 0.05 was used to identify significant differences between means. The statistical analysis was conducted using the statistical package R (R Core Team, 2020) along with the car (Fox and Weisberg, 2019), agricolae (Mendiburu, 2021), and nortest (Gross and Ligges, 2015) libraries [76,77,78,79].
Table 6 presents the values used for the Box-Cox transformation. The p-values from the Shapiro–Wilk and Bartlett tests are also included to evaluate the assumptions of normality of errors and homogeneity of error variances after the transformation. Following the transformation, both assumptions were met, except for W3. For consistency with the analysis for the other weeks, the results of fitting the factorial design with the transformed V I T are presented.

5. Conclusions

The physiological changes observed in Amm seedlings and plants can lead to mortality events, fluctuations in growth rates, leaf loss, and subsequent recovery. These changes also contribute to the plant’s ability to survive under adverse conditions over time.
The V I T values from the effect of ASL showed significant differences in five weeks, whereas SDL did not. The most significant V I T general values for Amm plants occurred at W9, being the best ASL = 94%, considered as a severe shade level. This improvement was attributed to increased shade availability and the better soil moisture conservation.
The SI values were highest when ASL was 87% and 94%; this fact allowed survival under induced hydric stress conditions. Consequently, the best V I T value was observed in treatment nine.
Two stages of hydric stress based on water regime percentages of the FC condition have been identified in the plants:
(1)
WS and LWS (S1 and S2, respectively): During these early stages, the seedlings and plants were young, resulting in limited growth and a small number of leaves. Consequently, the general values were the lowest, while the general values of the V I T showed a gradual increase, following a double sigmoidal profile.
(2)
S3 as a transition stage (FC): at this stage, plant growth in terms of height and leaf number peaked, leading to the highest general values for both SI and V I T .
(3)
LDS, MDS, and SDS (S4, S5, and S6, respectively): During this phase, reduced irrigation levels led to drought stress. The plants that perished were those that had experienced the most significant growth but could not meet their water demands for survival. Additionally, the general values of both SI and V I T consistently decreased until they reached zero.
The overall calculated V I T enables the assessment of the vigour of the seed lot over time. Additionally, by interpolating experimental data on height, number of leaves, SI, and V I T of the plants exposed to unfavourable conditions, predicting values that were not measured is possible over time, constituting a novel method for calculating VI on time basis as V I T . Furthermore, it is a method that can help measure a soil’s field capacity based on morphometric characteristics and resistance to waterlogging and drought stresses.

Supplementary Materials

The following supporting information can be downloaded at: https://www.mdpi.com/article/10.3390/stresses5040063/s1, Supplementary Section S1: Statistical analyses of V I T ; Figure S1: (a) V I T by week, (b) V I T by effect of ASL, (c) V I T by effect of SDL, (d) V I T by week and for every ASL; Supplementary Section S2: Statistical analyses of height and leaf number week by week; Table S1: Means Tukey grouping of seedlings and plant height by ASL effect and week; Table S2: Means Tukey grouping of seedlings and plant height by SDL effect and week; Table S3: ANOVA of the factorial design by week (plant height); Table S4: Means Tukey grouping of seedlings and plant height by ASL effect and week; Table S5: Means Tukey grouping of seedlings and plant height by SDL effect and week; Table S6: Means Tukey grouping of seedlings and plant height by SDL effect and week; Table S7: ANOVA of the factorial design by week (plant height); Table S8: Means Tukey grouping of seedlings and plant leaves number by ASL effect and week; Table S9: Means Tukey grouping of seedlings and plant leaves number by SDL effect and week; Table S10: ANOVA of the factorial design by week (leaf number); Table S11: Means Tukey grouping of seedlings and leaf number by ASL effect and week; Table S12: Means Tukey grouping of seedlings and leaf number by SDL effect and week; Table S13: Means Tukey grouping of seedlings and plant height by SDL effect and week.; Table S14: ANOVA of the factorial design by week (leaf number); Supplementary Section S3: Soil conditions; Table S15: Physicochemical parameters of the soil; Supplementary Section S4: Illustration of plants, leafs of Amm, seedbeds and others; Figure S2: Disposition of bio-space, trays, and Luxmeter; Figure S3: Agastache mexicana subsp. mexicana. In vegetative stage; Supplementary Section S5: Technical data of plants and leaves of Amm; Table S16: R1 ASL = 38%; Table S17: R2 ASL = 38%; Table S18: R3 ASL =38%; Table S19: R4 ASL = 38%; Table S20: R1 ASL = 87%; Table S21: R2 ASL = 87%; Table S22: R3 ASL = 87%; Table S23: R4 ASL = 87%; Table S24: R1 ASL = 94%; Table S25: R2 ASL = 94%; Table S26: R3 ASL = 94%; Table S27: R4 ASL = 94%.

Author Contributions

Conceptualisation by J.R.-M., B.C.-L., F.G.-J. and M.A.G.-S.; methodology by J.L.F.-M., M.A.G.-S., E.J.D.-N. and Y.Y.P.-L.; software by J.L.F.-M., F.G.-J. and R.U.-P.; validation of data by M.T.Z.-Á. and J.L.F.-M.; formal analysis by J.R.-M., J.L.F.-M., B.C.-L., F.G.-J. and Y.Y.P.-L.; investigation by M.A.G.-S., J.R.-M. and E.J.D.-N.; resources by M.A.G.-S., B.C.-L. and R.U.-P.; data curation by F.G.-J. and M.T.Z.-Á.; writing by J.R.-M., F.G.-J. and J.L.F.-M.; writing—review and editing by B.C.-L.; visualisation by Y.Y.P.-L. and E.J.D.-N.; supervision by M.A.G.-S., M.T.Z.-Á. and J.R.-M.; project administration by M.A.G.-S. and M.T.Z.-Á.; funding acquisition by M.A.G.-S. and R.U.-P. All authors have read and agreed to the published version of the manuscript.

Funding

This research received no external funding.

Data Availability Statement

All the data necessary for reproduction of the results of this manuscript can be found in the Supplementary Material.

Acknowledgments

We thank CONAHCyT for supporting this manuscript via project 3981370. We are also grateful to the Instituto Politécnico Nacional, the Unidad CICATA Legaria, SIP-20250514. The authors wish to honour CICATA-IPN Legaria on its 29th Anniversary, and the Universidad Autónoma de Guerrero, Facultad de Ciencias Agropecuarias y Ambientales. We also extend our gratitude to Diatomix Company for its supply and advice on the use of SiO2.

Conflicts of Interest

The authors declare no conflicts of interest.

References

  1. Santillán-Ramírez, M.A.; López-Villafranco, M.E.; Aguilar-Rodríguez, S.; Aguilar-Contreras, A. Estudio etnobotánico, arquitectura foliar y anatomía vegetativa de Agastache mexicana ssp. mexicana y A. mexicana ssp. xolocotziana. Rev. Mex. Biodivers. 2008, 79, 513–524. [Google Scholar]
  2. Martínez-Gordillo, M.; Fragoso-Martínez, I.; del Rosario García-Peña, M.; Montiel, O. Géneros de Lamiaceae de México, diversidad y endemismo. Rev. Mex. Biodivers. 2013, 84, 30–86. [Google Scholar] [CrossRef]
  3. Ventura-Martínez, R.; Rodríguez, R.; González-Trujano, M.E.; Ángeles-López, G.E.; Déciga-Campos, M.; Gómez, C. Spasmogenic and spasmolytic activities of Agastache mexicana ssp. mexicana and A. mexicana ssp. xolocotziana methanolic extracts on the guinea pig ileum. J. Ethnopharmacol. 2017, 196, 58–65. [Google Scholar]
  4. Vogel, H. Cómo Producir y Procesar Plantas Medicinales y Aromáticas de Calidad; FIA: Santiago de Chile, Chile, 2003. [Google Scholar]
  5. Das, M.; Trivedi, A.P. Essentiality of seed standards for the cultivation of medicinal plants—A review. Curr. Hortic. 2021, 9, 9–16. [Google Scholar] [CrossRef]
  6. Murúa Carrizo, F. Efecto de la época y densidad de siembra de comino (Cuminum cyminum L.) sobre el rendimiento, sus componentes y la calidad de semilla. Hortic. Argent. 2011, 30, 9–17. [Google Scholar]
  7. Pérez-Martínez, L.V.; Rodríguez-Castillo, N.A.; Ríos, O.V.; Melgarejo, L.M. Germinación y dormancia de semillas. In Semillas de Plantas de Páramo: Ecología y Métodos de Germinación Aplicados a la Restauración Ecológica; UNAL: Bogotá, Colombia, 2014; pp. 63–113. [Google Scholar]
  8. Borza, J.K.; Westerman, P.R.; Liebman, M. Comparing estimates of seed viability in three foxtail (Setaria) species using the imbibed seed crush test with and without additional tetrazonlium testing. Weed Technol. 2007, 21, 518–522. [Google Scholar] [CrossRef]
  9. Milošević, M.; Vujaković, M.; Karagić, Đ. Vigour tests as indicators of seed viability. Genetika 2010, 42, 103–118. [Google Scholar] [CrossRef]
  10. Delouche, J.C.; Caldwell, W.P. Seed vigor and vigor tests. In Proceedings of the Association of Official Seed; Association of Official Seed Analysts: Wichita, KS, USA, 1960. [Google Scholar]
  11. Kwon, M.Y.; Woo, S.Y. Plants’ responses to drought and shade environments. Afr. J. Biotechnol. 2016, 15, 29–31. [Google Scholar] [CrossRef]
  12. Aroca, R. Plant responses to drought stress. In From Morphological to Molecular Features; Springer: Berlin/Heidelberg, Germany, 2012; pp. 1–5. [Google Scholar]
  13. Sun, Y.; Wang, C.; Chen, H.Y.; Ruan, H. Response of plants to water stress: A meta-analysis. Front. Plant Sci. 2020, 11, 978. [Google Scholar] [CrossRef] [PubMed]
  14. Ashraf, M.A. Waterlogging stress in plants: A review. Afr. J. Agric. Res. 2012, 7, 1976–1981. [Google Scholar] [CrossRef]
  15. Khalid, M.F.; Zakir, I.; Khan, R.I.; Irum, S.; Sabir, S.; Zafar, N.; Ahmad, S.; Abbas, M.; Ahmed, T.; Hussain, S. Effect of water stress (drought and waterlogging) on medicinal plants. In Medicinal Plants: Their Response to Abiotic Stress; Springer Nature: Singapore, 2023; pp. 169–182. [Google Scholar]
  16. Nikam, V.; Chavan, P. Influence of water deficit and waterlogging on the mineral status of a medicinal plant Chlorophytum borivilianum. Acta Bot. Hung. 2009, 51, 105–113. [Google Scholar] [CrossRef]
  17. Zhou, W.; Chen, F.; Meng, Y.; Chandrasekaran, U.; Luo, X.; Yang, W.; Shu, K. Plant waterlogging/flooding stress responses: From seed germination to maturation. Plant Physiol. Biochem. 2020, 148, 228–236. [Google Scholar] [CrossRef]
  18. Chen, C.; Luo, X.; Jin, G.; Cheng, Z.; Pan, X.; Zhu, G.; Li, S.; Zhu, Y.; Tang, N. Shading effect on survival, growth, and contents of secondary metabolites in micropropagated Anoectochilus plantlets. Braz. J. Bot. 2017, 40, 599–607. [Google Scholar] [CrossRef]
  19. Li, Q.; Zhang, L.; He, J.; Li, J.A.; Zhang, H.; Li, Y.; Gu, Y.; Luo, H.; Lu, M.; Lu, K.; et al. Effects of different shade treatments on Melaleuca seedling growth and physiological properties. BMC Plant Biol. 2025, 25, 203. [Google Scholar] [CrossRef]
  20. Zainal, A.; Satria, B.; Mawati, I.; Wulantika, T. The effect of shade on germination and seedling growth of two dogfruit (Pithecellobium jiringa) Genotypes. J. Appl. Agric. Sci. Technol. 2024, 8, 211–227. [Google Scholar] [CrossRef]
  21. Jarvis, P.G. The adaptability to light intensity of seedlings of Quercus petraea (Matt.) Liebl. J. Ecol. 1964, 52, 545–571. [Google Scholar] [CrossRef]
  22. Rahimi, S.; Hatami, M.; Ghorbanpour, M. Silicon-nanoparticle mediated changes in seed germination and vigor index of marigold (Calendula officinalis L.) compared to silicate under PEG-induced drought stress. Gesunde Pflanz. 2021, 73, 575–589. [Google Scholar] [CrossRef]
  23. Ma, J.F.; Yamaji, N. Silicon uptake and accumulation in higher plants. Trends Plant Sci. 2006, 11, 392–397. [Google Scholar] [CrossRef] [PubMed]
  24. Silva, A.J.; Nascimento, C.W.A.; Gouveia-Neto, A.S. Assessment of cadmium toxicities in potted garlic plants. Acta Physiol. Plant 2017, 38, 211. [Google Scholar]
  25. Kaya, C.; Tuna, L.; Higgs, D. Effect of silicon on plant growth and mineral nutrition of maize grown under water-stress conditions. J. Plant Nutr. 2006, 29, 1469–1480. [Google Scholar] [CrossRef]
  26. Cao, B.L.; Ma, Q.; Zhao, Q.; Wang, L.; Xu, K. Effects of silicon on absorbed light allocation, antioxidant enzymes, and ultrastructure of chloroplasts in tomato leaves. Sci. Hortic. 2015, 194, 53–62. [Google Scholar] [CrossRef]
  27. Jesus, E.G.D.; Fatima, R.T.D.; Guerrero, A.C.; Araújo, J.L.D.; Brito, M.E. Growth and gas exchanges of arugula plants under silicon fertilisation and water restriction. Rev. Bras. Eng. Agrícola Ambient. 2018, 22, 119–124. [Google Scholar] [CrossRef]
  28. Zia-ur-Rehman, M.; Khalid, H.; Akmal, F.; Waqar, M.; Rizwan, M.; Qayyum, F.; Nadeem, M. Silicon and antioxidant defense system against. In Silicon in Plants: Advances and Future Prospects; CRC Press: Boca Raton, FL, USA, 2016; p. 321. [Google Scholar]
  29. Sacala, E. Role of silicon in plant resistance to water stress. J. Elem. 2009, 14, 619–630. [Google Scholar] [CrossRef]
  30. Sapre, S.S.; Vakharia, D.N. Role of silicon under water deficit stress in wheat: A biochemical perspective: A review. Agric. Rev. 2016, 37, 109–116. [Google Scholar] [CrossRef]
  31. Coskun, D.; Britto, D.T.; Huynh, W.Q.; Kronzucker, H.J. The role of silicon in higher plants under salinity and drought stress. Front. Plant Sci. 2016, 7, 1072. [Google Scholar] [CrossRef] [PubMed]
  32. Gharineh, M.H.; Karmollachaab, A. Effect of silicon on physiological characteristics of wheat growth under water-deficit stress induced by PEG. Int. J. Agron. Plant Prod. 2013, 4, 1543–1548. [Google Scholar]
  33. Khan, I.; Awan, S.A.; Rizwan, M.; Ali, S.; Hassan, M.J.; Brestic, M.; Zhang, X.; Huang, L. Effects of silicon on heavy metal uptake at the soil-plant interface: A review. Ecotoxicol. Environ. Saf. 2021, 222, 112510. [Google Scholar] [CrossRef]
  34. Hussain, S.; Mumtaz, M.; Manzoor, S.; Shuxian, L.; Ahmed, I.; Skalicky, M.; Brestic, M.; Rastogi, A.; Ulhassan, Z.; Shafiq, I.; et al. Foliar application of silicon improves growth of soybean by enhancing carbon metabolism under shading conditions. Plant Physiol. Biochem. 2021, 159, 43–52. [Google Scholar] [CrossRef]
  35. Pan, T.; Zhang, J.; He, L.; Hafeez, A.; Ning, C.; Cai, K. Silicon enhances plant resistance of rice against submergence stress. Plants 2021, 10, 767. [Google Scholar] [CrossRef]
  36. Gowda, R.; Rani, K.U.; Roopashree, B.; Sowmya, K.J. Validating protocol and deciphering the nanoparticulate seed treatment in enhancing seed quality of soybean, pigeon pea, and groundnut. Int. J. Plant Soil Sci. 2023, 35, 94–103. [Google Scholar] [CrossRef]
  37. Singh-Sangwan, N.E.E.L.A.M.; Abad Farooqi, A.H.; Singh Sangwan, R. Effect of drought stress on growth and essential oil metabolism in lemongrasses. New Phytol. 1994, 128, 173–179. [Google Scholar] [CrossRef]
  38. Ibrahim, M.S.C.; Meng, T.H.; Ahmad, A.; Ghazali, M.S.M.; Abdullah, W.R.W.; Chuen, N.L. Potential of nanosilicon dioxide extraction from silicon-rich agricultural wastes as a plant growth promoter. Adv. Nat. Sci. Nanosci. Nanotechnol. 2022, 13, 033001. [Google Scholar] [CrossRef]
  39. Akhtar, N.; Ilyas, N. Role of nanosilica in boosting the activities of metabolites in Triticum aestivum facing drought stress. Plant Soil 2022, 477, 99–115. [Google Scholar] [CrossRef]
  40. Shashikanthalu, S.P.; Ramireddy, L.; Radhakrishnan, M. Stimulation of the germination and seedling growth of Cuminum cyminum L. seeds by cold plasma. J. Appl. Res. Med. Aromat. Plants 2020, 18, 100259. [Google Scholar] [CrossRef]
  41. Dorri, M.A.; Kamkar, B.; Aghdasi, M.; Safahani, A.R. Germination and seedling growth of Silybum Marianum as a medicinal plant under salinity stress. Plant Breed. Seed Sci. 2019, 79, 25–38. [Google Scholar] [CrossRef]
  42. Navarro, M.; Febles, G.; Torres, V. Conceptual bases for estimating seed vigor through growth indicators and initial development. Pastos Forrajes 2012, 35, 233–246. [Google Scholar]
  43. Steiner, J.J. Seedling rate of development index: Indicator of vigor and seedling growth response. Crop Sci. 1990, 30, 1264–1271. [Google Scholar] [CrossRef]
  44. Finch-Savage, W.E.; Bassel, G.W. Seed vigour and crop establishment: Extending performance beyond adaptation. J. Exp. Bot. 2016, 67, 567–591. [Google Scholar] [CrossRef]
  45. Varban, R.; Vidican, R.; Vârban, D.; Stoie, A.; Gâdea, Ș.; Vâtcă, S.; Stoian, V.; Crișan, I.; Stoian, V. Modelling plant morphometric parameters as predictors for successful cultivation of some medicinal Agastache species. Not. Bot. Horti Agrobot. Cluj-Napoca 2022, 50, 12638. [Google Scholar] [CrossRef]
  46. Hunt, R.; Evans, G.C. Classical data on the growth of maize: Curve fitting with statistical analysis. New Phytol. 1980, 86, 155–180. [Google Scholar] [CrossRef]
  47. Merma Aroni, J.L. Interpolación Chebyshev como Función Membresía en Lógica Difusa para Control de Humedad en Plantas en vivero Forestal. 2017. Available online: https://repositorio.uap.edu.pe/handle/20.500.12990/8931 (accessed on 5 June 2024).
  48. Phukan, U.J.; Mishra, S.; Timbre, K.; Luqman, S.; Shukla, R.K. Mentha arvensis exhibit better adaptive characters in contrast to Mentha piperita when subjugated to sustained waterlogging stress. Protoplasma 2014, 251, 603–614. [Google Scholar] [CrossRef] [PubMed]
  49. Walters, C.; Wheeler, L.M.; Grotenhuis, J.M. Longevity of seeds stored in a genebank: Species characteristics. Seed Sci. Res. 2005, 15, 1–20. [Google Scholar] [CrossRef]
  50. Meir, P.; Wood, T.E.; Galbraith, D.R.; Brando, P.M.; Da Costa, A.C.; Rowland, L.; Ferreira, L.V. Threshold responses to soil moisture deficit by trees and soil in tropical rain forests: Insights from field experiments. BioScience 2015, 65, 882–892. [Google Scholar] [CrossRef] [PubMed]
  51. Kirkham, M.B. Field capacity, wilting point, available water, and the nonlimiting water range. In Principles of Soil and Plant Water Relations; Elsevier: Amsterdam, The Netherlands, 2014; pp. 153–170. [Google Scholar]
  52. Zhang, Y.; Chen, X.; Geng, S.; Zhang, X. A review of soil waterlogging impacts, mechanisms, and adaptive strategies. Front. Plant Sci. 2025, 16, 1545912. [Google Scholar] [CrossRef] [PubMed]
  53. Pardos, J.A. Plant responses to soil waterlogging. For. Syst. 2004, 13, 101–107. [Google Scholar] [CrossRef]
  54. Baracaldo, A.; Carvajal, R.; Romero, A.P.; Prieto, A.; García, F.J.; Fischer, G.; Miranda, D. El anegamiento afecta el crecimiento y producción de biomasa en tomate chonto (Solanum lycopersicum L.), cultivado bajo sombrío. Rev. Colomb. Cienc. Hortícolas 2014, 8, 92–102. [Google Scholar] [CrossRef]
  55. Lichtenthaler, H.K. Vegetation stress: An introduction to the stress concept in plants. J. Plant Physiol. 1996, 148, 4–14. [Google Scholar] [CrossRef]
  56. Quezada, R.A.P.; Ontiveros, J.L.R.; Hernández, V.A.G. Transpiración, potencial hídrico y prolina en zarzamora bajo déficit hídrico. Terra Latinoam. 1999, 17, 125–130. [Google Scholar]
  57. Datta, S.; Taghvaeian, S.; Stivers, J. Understanding Soil Water Content and Thresholds for Irrigation Management. 2017. Available online: https://openresearch.okstate.edu/server/api/core/bitstreams/9465ba33-0677-4818-8075-c8b4e263aa15/content (accessed on 5 June 2024).
  58. Oklahoma State University. Division of Agricultural Sciences and Natural Resources. Determining Feld Capacity Using Continuous Soil Water Content Data. 2025. Available online: https://extension.okstate.edu/fact-sheets/print-publications/pss/determining-field-capacity-using-continuous-soil-water-content-data.pdf (accessed on 5 June 2024).
  59. Zotarelli, L.; Dukes, M.D.; Morgan, K.T. Interpretation of Soil Moisture Content to Determine Soil Field Capacity and Avoid Over-Irrigating Sandy Soils Using Soil Moisture Sensors: ae460/ae460, 2/2010; EDIS: Gainesville, FL, USA, 2010; Volume 2010.
  60. Yan, S.; Weng, B.; Jing, L.; Bi, W. Effects of drought stress on water content and biomass distribution in summer maize (Zea mays L.). Front. Plant Sci. 2023, 14, 1118131. [Google Scholar] [CrossRef]
  61. Fu, Z.; Ciais, P.; Feldman, A.F.; Gentine, P.; Makowski, D.; Prentice, I.C.; Stoy, P.C.; Bastos, A.; Wigneron, J.P. Critical soil moisture thresholds of plant water stress in terrestrial ecosystems. Sci. Adv. 2022, 8, eabq7827. [Google Scholar] [CrossRef]
  62. Estrada-Prado, W.; Lescay-Batista, E.; Álvarez-Fonseca, A.; Maceo-Ramos, Y.C. Niveles de humedad en el suelo en la producción de bulbos de cebolla. Agron. Mesoam. 2015, 26, 112–117. [Google Scholar] [CrossRef]
  63. Parra Quezada, R.A.; Rodríguez Ontiveros, J.L.; González Hernández, V.A. Transpiration, water potential and proline in blackberry under hydric stress. Terra Latinoam. 1999, 17, 125–130. [Google Scholar]
  64. Wood, J.D.; Gu, L.; Hanson, P.J.; Frankenberg, C.; Sack, L. The ecosystem wilting point defines drought response and recovery of a Quercus-Carya forest. Glob. Change Biol. 2023, 29, 2015–2029. [Google Scholar] [CrossRef]
  65. Horvath, D.P.; Anderson, J.V.; Chao, W.S.; Foley, M.E. Knowing when to grow: Signals regulating bud dormancy. Trends Plant Sci. 2003, 8, 534–540, Erratum in Trends Plant Sci. 2004, 9, 12. [Google Scholar] [CrossRef] [PubMed]
  66. Minguez, M.P.; Casanueva, G.M.; de Dios García, J.; Alonso, F.J.G.; Sainz, R.C. Respuesta temporal al ambiente lumínico y la sequía inducida en el regenerado de una masa mixta en el entorno mediterráneo. Cuad. De La Soc. Española Cienc. For. 2019, 45, 1–18. [Google Scholar]
  67. Moradi, P.; Ford-Lloyd, B.; Pritchard, J. Plant-water responses of different medicinal plant thyme (Thymus spp.) species to drought stress conditions. Aust. J. Crop Sci. 2014, 8, 666–673. [Google Scholar]
  68. Yao, N.; Li, Y.; Xu, F.; Liu, J.; Chen, S.; Ma, H.; Chau, H.W.; Li Liu, D.; Li, M.; Feng, H.; et al. Permanent wilting point plays an important role in simulating winter wheat growth under water deficit conditions. Agric. Water Manag. 2020, 229, 105954. [Google Scholar] [CrossRef]
  69. Amissah, L.; Brown, W.H. Wilting, survival, growth, and physiological response of trees and arable crops to drought and shade. Ghana J. For. 2022, 38, 1–20. [Google Scholar]
  70. Valladares, F.; Arrieta, S.; Aranda, I.; Lorenzo, D.; Sánchez-Gómez, D.; Tena, D.; Suárez, F.; Pardos, J.A. Shade tolerance, photoinhibition sensitivity and phenotypic plasticity of Ilex aquifolium in continental Mediterranean sites. Tree Physiol. 2005, 25, 1041–1052. [Google Scholar] [CrossRef] [PubMed]
  71. Guarnaschelli, A.B.; Garau, A.M.; Lemcoff, J.H.; Pathauer, P. Impacto de la sombra y la sequía sobre aspectos fisiológicos y de crecimiento en diversos orígenes de E. globulus subsp. globulus. Boletín Inf. CIDEU 2007, 3, 91–98. [Google Scholar]
  72. Sánchez, C.L.R. Estudios Preliminares Sobre los Efectos de Altas Temperaturas en la Respuesta de Plantas de Tomate (Solanum lycopersicum L.) Sometidas a Estrés por Inundación. Master’s Thesis, Universidad Nacional del Nordeste, Corrientes, Argentina, 2023. [Google Scholar]
  73. Martínez-López, M.; Tinoco-Ojanguren, C.; Martorell, C. Drought tolerance increases with seed size in a semiarid grassland from southern Mexico. Plant Ecol. 2020, 221, 989–1003. [Google Scholar] [CrossRef]
  74. Morales-Barrera, J.; Reséndiz-Muñoz, J.; Cruz-Lagunas, B.; Fernández-Muñoz, J.L.; Godínez-Jaimes, F.; de Jesús Adame-Zambrano, T.; Vázquez-Villamar, M.; Romero-Rosales, T.; Zagaceta-Álvarez, M.T.; Aguilar-Cruz, K.A.; et al. Abiotic stress effect on Agastache mexicana subsp. mexicana Yield: Cultivated in two contrasting environments with organic nutrition and artificial shading. Plants 2024, 13, 2661. [Google Scholar] [PubMed]
  75. Palma-Tenango, M.; Sánchez-Fernández, R.E.; Soto-Hernández, M. A systematic approach to Agastache mexicana research: Biology, agronomy, phytochemistry, and bioactivity. Molecules 2021, 26, 3751. [Google Scholar] [CrossRef] [PubMed]
  76. R Core Team. R: A Language and Environment for Statistical Computing; R Foundation for Statistical Computing: Vienna, Austria, 2020; Available online: https://www.R-project.org/ (accessed on 20 September 2023).
  77. Fox, J.; Weisberg, S. An R Companion to Applied Regression, 3rd ed.; Sage: Thousand Oaks, CA, USA, 2019; Available online: https://cran.r-project.org/web/packages/car/index.html (accessed on 20 September 2023).
  78. Felipe de Mendiburu. Agricolae: Statistical Procedures for Agricultural Research. R Package Version 1.3-5. 2021. Available online: https://cran.r-project.org/web/packages/agricolae/index.html (accessed on 20 September 2023).
  79. Gross, J.; Ligges, U. Nortest: Tests for Normality. R Package Version 1.0-4. 2015. Available online: https://cran.r-project.org/web/packages/nortest/ (accessed on 20 September 2023).
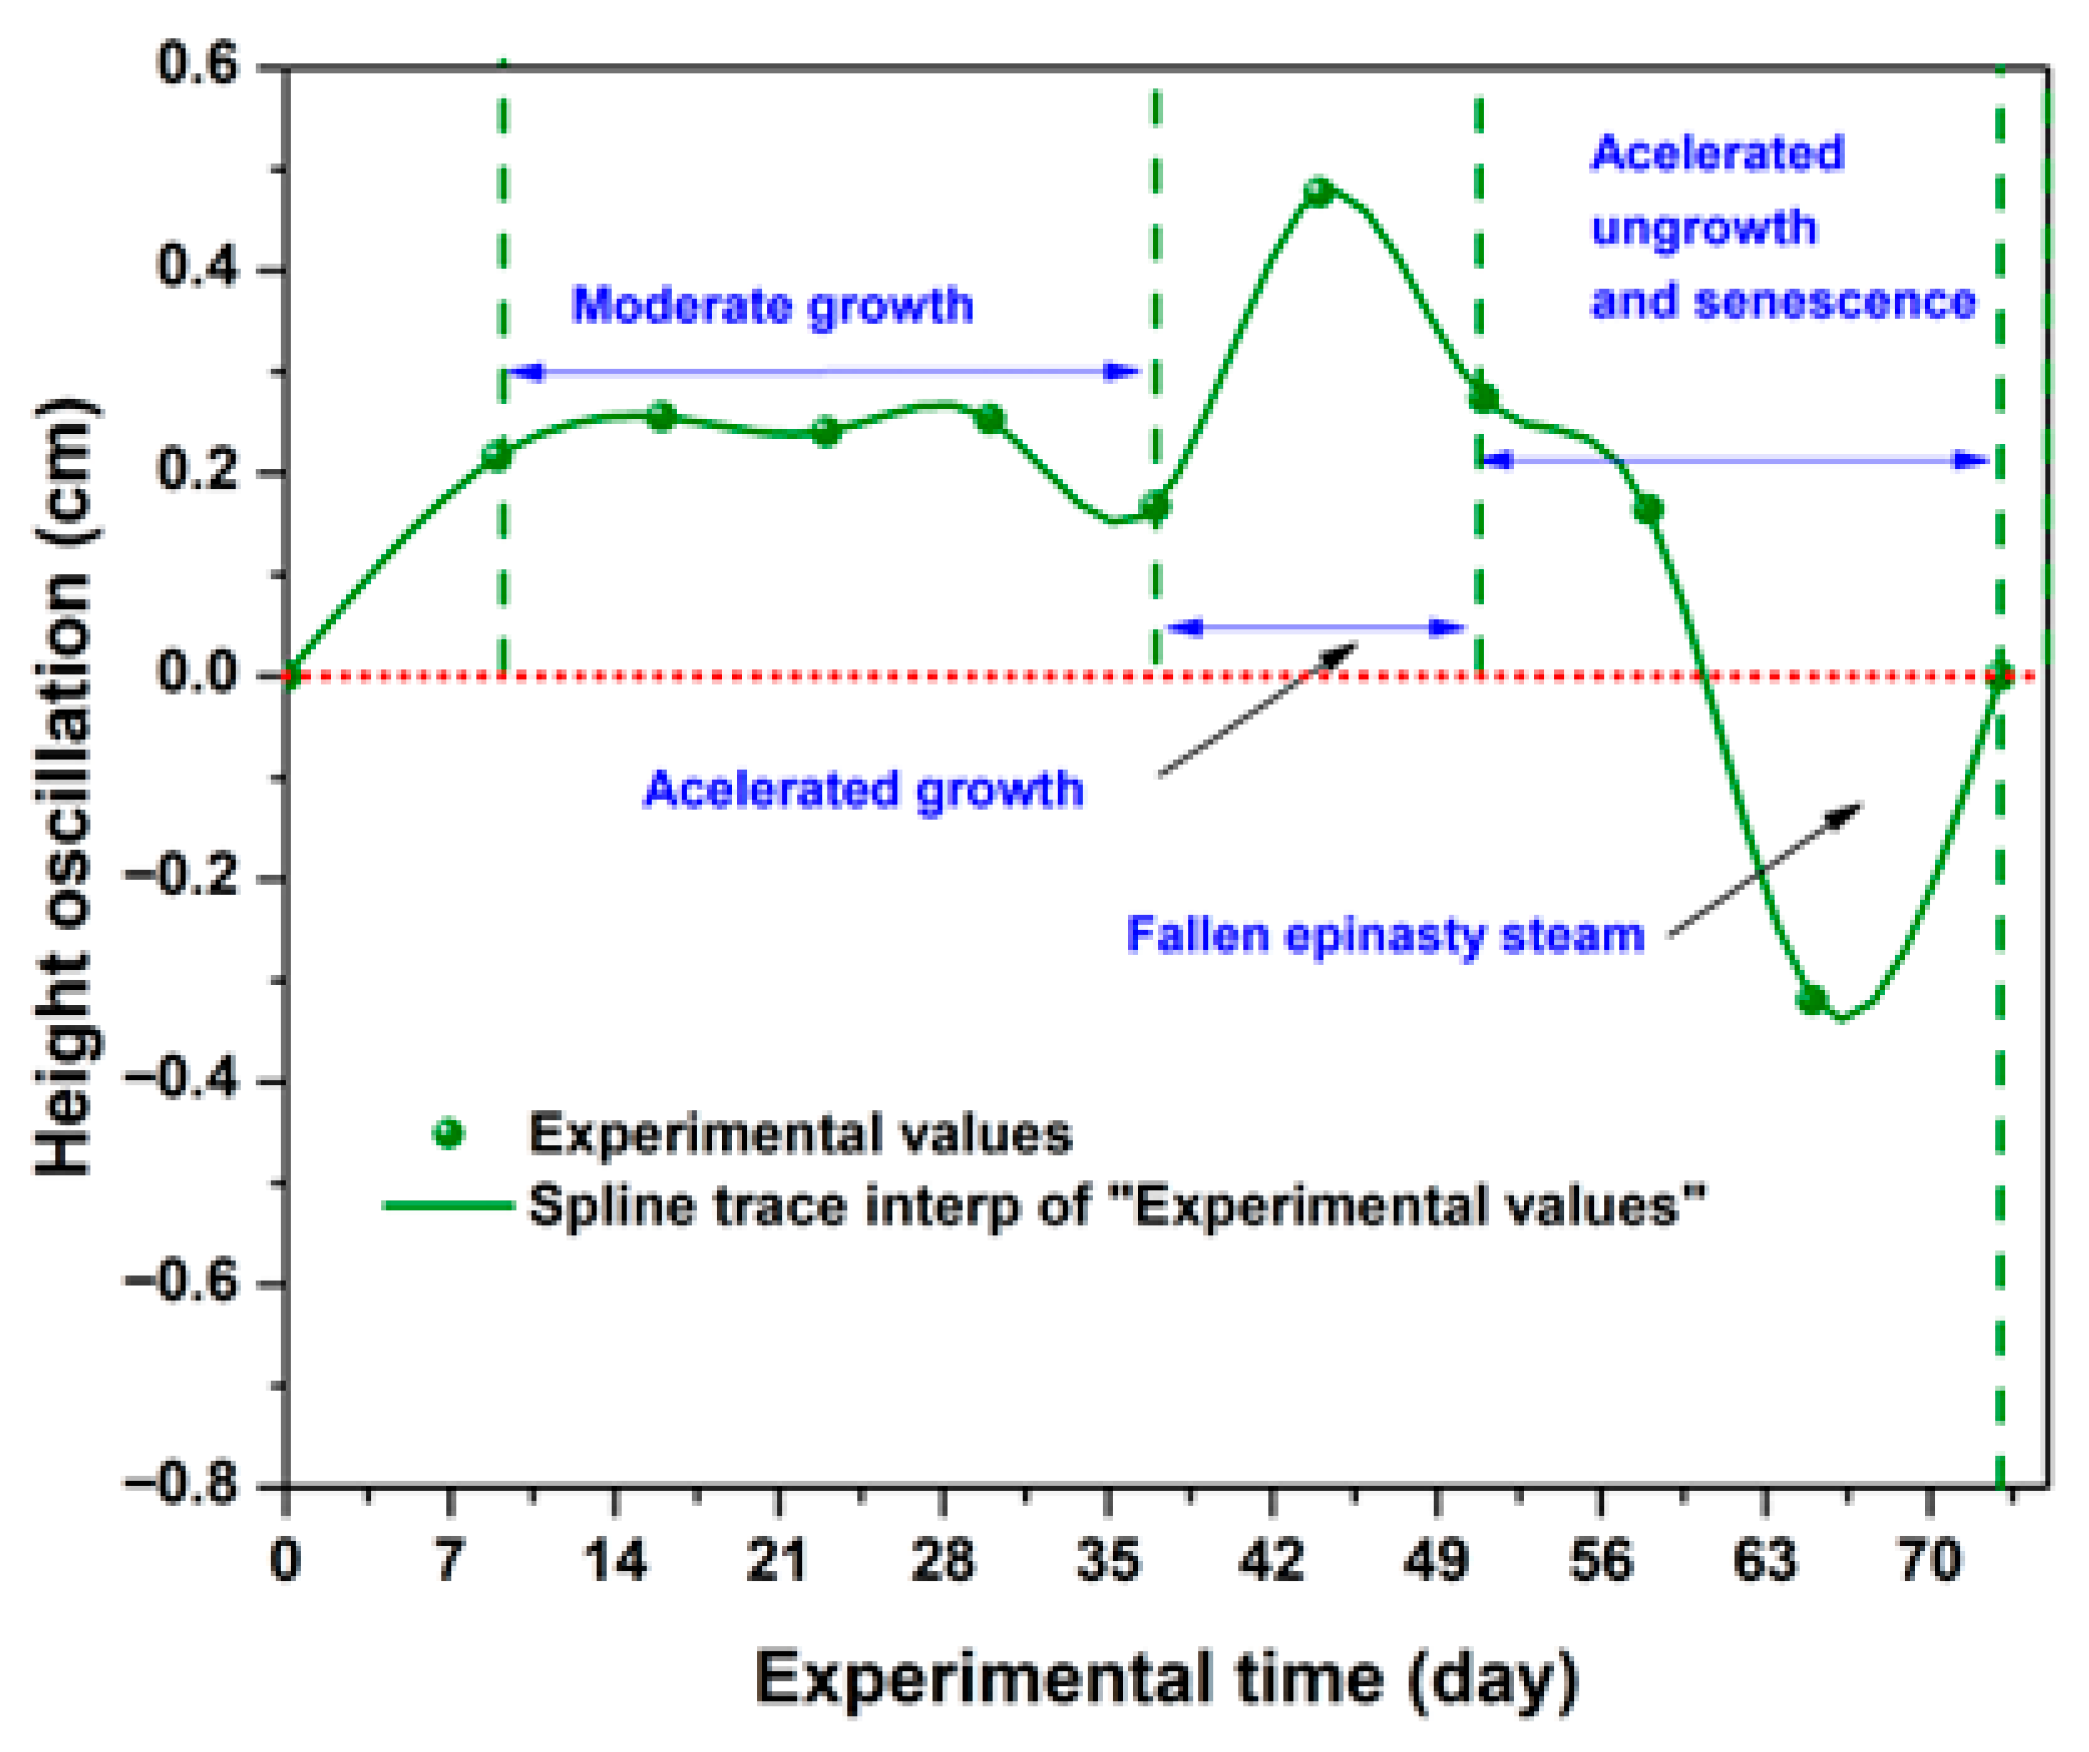
Figure 1. General effect on the growth of the height of plants.
Stresses 05 00063 g001
Figure 2. The general effect of the leaf number.
Stresses 05 00063 g002
Figure 3. (a) The stages S1–S6 are indicated by blue dashed lines. S1 = WS = Waterlogging Stress, S2 = LWS = Low Waterlogging Stress, S3 = FC = field capacity (or without hydric stress), S4 = LDS = Low Drought Stress, S5 = MDS = Medium Drought Stress, and S6 = SDS = Severe Drought Stress. The green curves represent the spline interpolation. Values x , y in blue colour are x = number of days and y = the irrigation level (mm/day) converted into percentage; thus, 100% is the initial value in S1. In the subsequent stages, this value refers to the preserved percentage of the irrigation level in relation to the initial one; for example, in S2, the water regime is 75%, and so on. (b) SI general values. The red numbers indicate the weeks, which are separated by red dash-dot lines. The experimental data points, marked in blue, represent the end of each week, while the spline interpolation curve is shown in green.
Stresses 05 00063 g003
Figure 4. V I T values: (a) of the experiment in general with the weekly oscillation; (b) by the effect of ASL; (c) by the effect of SDL.
Stresses 05 00063 g004
Figure 5. (a) Oscillation of plant height and number of leaves; (b) SI values, both of which are ASL effects.
Stresses 05 00063 g005
Figure 6. (a) Oscillation of plant height and number of leaves; (b) SI values, both of which are SDL effects.
Stresses 05 00063 g006
Figure 7. V I T values by treatment at the end of S6, for treatments 1–12 (see Table 1). V I T values from W9. Black dashed line circles for treatments 1–4, red circles for treatments 5–8, and blue dashed line triangles for treatments 9–12 represent ASL influences of 38%, 87%, and 94%.
Stresses 05 00063 g007
Table 1. Effect of V I T values by Artificial Shade Level and Tukey grouping.
ASLW1W2W3W4W5W6W7W8W9
38%0.21 b3.29 b7.20 a8.58 a6.41 a11.54 a7.49 a7.36 a,b1.96 c
87%2.24 a4.21 b3.98 a5.73 a5.37 a5.31 b5.52 a5.72 b5.13 b
94%1.59 a7.02 a5.92 a8.10 a6.76 a11.74 a10.62 a13.18 a10.02 a
ASL = Artificial Shade Level. By means of multiple comparisons by Tukey’s test, in the same column, values for statistical means with equal letters were not significantly different. W1 = Week 1, W2 = Week 2, W3 = Week 3, W4 = Week 4, W5 = Week 5, W6 = Week 6, W7 = Week 7, W8 = Week 8, and W9 = Week 9.
Table 2. Effect of V I T values by Silicon Dioxide Level and Tukey grouping.
SDLW1W2W3W4W5W6W7W8W9
0.0%1.70 a5.50 a8.81 a9.93 a8.22 a11.38 a9.14 a9.51 a7.02 a
0.2%1.35 a3.95 a5.40 a6.13 a5.96 a8.80 a7.69 a9.48 a5.38 a
0.4%1.53 a5.71 a4.97 a7.13 a5.51 a9.23 a6.94 a7.44 a6.43 a
0.8%0.8 a4.20 a3.63 a6.70 a5.03 a8.71 a7.74 a8.59 a3.97 a
SDL = Silicon Dioxide Level. By means of multiple comparisons by Tukey’s test, in the same column, values for statistical means with equal letters were not significantly different. W1 = Week 1, W2 = Week 2, W3 = Week 3, W4 = Week 4, W5 = Week 5, W6 = Week 6, W7 = Week 7, W8 = Week 8, and W9 = Week 9.
Table 3. ANOVA factorial for V I T design by every week.
Week V I T DFSSMSFpR2
W1ASL247.5123.7522.03<0.01 10.61
SDL35.531.841.710.18
ASL:SDL68.271.381.280.29
General11212.5019.325.93<0.01 20.64
W2ASL24.902.459.05<0.01 30.44
SDL31.740.582.140.11
ASL:SDL61.110.190.690.66
General117.750.702.60<0.01 40.44
W3ASL22.261.131.640.210.18
SDL31.530.510.740.53
ASL:SDL61.750.290.420.86
General115.540.500.730.700.18
W4ASL28.274.141.070.350.24
SDL315.585.191.350.27
ASL:SDL620.153.360.870.53
General1144.004.001.040.440.24
W5ASL23.051.520.400.670.18
SDL313.714.571.210.32
ASL:SDL612.982.160.570.75
General1129.732.700.720.72
W6ASL247.7223.865.30<0.01 50.33
SDL311.813.940.870.46
ASL:SDL620.393.400.750.61
General1179.927.271.610.140.33
W7ASL224.2412.122.870.070.30
SDL36.562.190.520.67
ASL:SDL634.315.721.360.26
General1165.115.921.400.210.30
W8ASL254.2027.104.190.020.30
SDL34.651.550.240.87
ASL:SDL643.357.231.120.37
General11102.219.291.440.200.30
W9ASL2124.8462.4213.15<0.01 60.47
SDL319.626.541.380.27
ASL:SDL68.291.380.290.94
General11152.7513.892.93<0.01 70.47
ASL = V I T by effect of ASL, SDL = Vigour Index by effect of SDL, ASL:SDL = Vigour Index by interaction effect of ASL and SDL, General = V I T general values by treatments effect without taking into account source of variation, DFs = Degrees of freedom, SS = Sum of Squares, MS = Mean Squares. True p-values: 1 p = 5.6 × 10⁻⁷, 2 p = 2.08 × 10⁻⁵, 3 p = 6.5 × 10⁻⁴, 4 p = 1.49 × 10⁻², 5 p = 9.59 × 10⁻³, 6 p = 5.1 × 10⁻⁵, 7 p = 7.3 × 10⁻³.
Table 4. The combination of the input factors, total seeds by treatment, and experiment.
Seeds by Treatment
ASL (%)SDL (%)Total
0.00.20.40.8
38τ1 = 80τ4 = 80τ7 = 80τ10 = 80320
87τ2 = 80τ5 = 80τ8 = 80τ11 = 80320
94τ3 = 80τ6 = 80τ9 = 80τ12 = 80320
Total 240240240240960
ASL = Artificial Shade Level, SDL = Silicon Dioxide Level. τx = number of treatments.
Table 5. Water regime and duration in days for every experimental stage.
Stage/ConceptS1S2S3S4S5S6
Duration days231377715
Accumulated days243744515873
Water regime (mm/day)7.825.863.911.951.391.11
Percentage decrease in water regime *02550758286
% increase or decrease in water regime **50330506572
Note: S1, S2, S3, S4, S5, and S6 refer to Stage 1, Stage 2, Stage 3, Stage 4, Stage 5, and Stage 6, respectively. * Taking into account S1 as reference, ** Taking into account S3 as reference, S1 and S2 were above and S4, S5, and S6 below.
Table 6. Values of λ used in the Box-Cox transformation, and p-values of the Shapiro–Wilk (SW) and Bartlett (B) tests per week.
ParameterW1W2W3W4W5W6W7W8W9
λ 0.1964000.50.50.50.50.50.5
SW0.250.61<0.010.150.470.680.460.640.19
B<0.010.22<0.010.150.140.630.750.370.91
W1 = Week 1, W2 = Week 2, W3 = Week 3, W4 = Week 4, W5 = Week 5, W6 = Week 6, W7 = Week 7, W8 = Week 8, W9 = Week 9.
Disclaimer/Publisher’s Note: The statements, opinions and data contained in all publications are solely those of the individual author(s) and contributor(s) and not of MDPI and/or the editor(s). MDPI and/or the editor(s) disclaim responsibility for any injury to people or property resulting from any ideas, methods, instructions or products referred to in the content.