Article

Varietal Differences of Yield, Morphological, and Biochemical Parameters of Allium cepa L. under Precipitation Excess in Different Phenological Phases

by
Nadezhda Golubkina
1,*,
Olga Romanova
1,
Valery Romanov
1,
Leonid Krivenkov
1,
Tatiana Shevchenko
1,
Otilia Cristina Murariu
2,
Lorenzo Vecchietti
3,
Silvia Brindusa Hamburda
2 and
Gianluca Caruso
4
1
Federal Scientific Vegetable Center, Moscow 143072, Russia
2
Department of Food Technology, “Ion Ionescu de la Brad” Iasi University of Life Sciences, 3 M. Sadoveanu Alley, 700440 Iasi, Romania
3
Hydro Fert s.r.l., 76121 Barletta, Italy
4
Department of Agricultural Sciences, University of Naples Federico II, Portici, 80055 Naples, Italy
*
Author to whom correspondence should be addressed.
Stresses 2023, 3(3), 541-554; https://doi.org/10.3390/stresses3030038
Submission received: 30 May 2023 / Revised: 16 July 2023 / Accepted: 18 July 2023 / Published: 21 July 2023
(This article belongs to the Collection Feature Papers in Plant and Photoautotrophic Stresses)

Abstract

:
Flooding is an important factor, decreasing Allium cepa bulb yield and quality. A comparison, in terms of biometrical and biochemical parameters, of five Allium cepa cultivars, grown at two different locations, characterized by contrasting conditions of water availability, i.e., precipitation excess at the end (A) or at the beginning (B) of plant growth, revealed a significant decrease in bulb weight, height, and diameter, and an increase in oxidative stress parameters, such as total antioxidant activity and polyphenol content, monosaccharides, proline, malonic dialdehyde in the condition of excessive soil humidity at the end of the vegetation period (A). Among the five cultivars studied (Zolotnichok, Zolotie cupola, Black prince, Globus, and Myachkovsky), the lowest variations of the above parameters under precipitation excess at cycle end or beginning were recorded in Zolotnichok and Zolotie cupola, which was in accordance with their high adaptability. Cultivar Myachkovsky showed the highest differences of the parameters examined between A and B conditions. Outer scale biochemical parameters demonstrated the highest stability in both regions. The participation of proline, monosaccharides, total polyphenols, and total antioxidant activity in plant defense against hypoxia, caused by waterlogging, was proved by high correlation coefficients between inner scale parameters (‘r’ from +0.714 to +0.920) and the latter with bulb yield (‘r’ from −0.745 to −0.924). High adaptability cultivars (Zolotie cupola, Zolotnichok, Black prince) showed significantly lower MDA inner/outer scales ratio and lipids outer/inner scales ratio compared to cultivars with moderate adaptability in (B) conditions. The results provide important information regarding biochemical peculiarities of Allium cepa in diverse soil humidity, which should be considered in future breeding activities of onion genotypes, characterized by high adaptability to different water excess conditions.

1. Introduction

Allium cepa, one of the most popular agricultural crops in the world [1], is known for its exclusive biological activity, providing powerful antioxidant, cardio-protective, anti-carcinogenic properties, characterized by immune-modulating and anti-diabetic activity [2]. Significant decreases in onion yield and quality are caused by flooding and high humidity [3]. The degree of the negative flooding effect depends on the rainfall intensity and duration, plant phenological stage, and genotype sensitivity [4]. In this respect, yield loss may reach 50–70% under intensive precipitation during bulb formation [3]. From the physiological point of view, a negative effect of water excess relates to soil oxygen deficiency [5,6] and a decrease in root aerobic respiration. These factors lead to growth inhibition, photosynthesis retardation, reduced ability to accumulate nutrients, decrease in dry matter content, and yield loss [7,8].
Pot experiments with onion seedlings revealed the intensification of secondary metabolites biosynthesis in flooding conditions [9]. Significant protection effect against flooding may be obtained via growth stimulators utilization [10]. Among the latter, aliphatic polyamines (spermidine and spermine) increased Welsh onion tolerance to flooding after preliminary processing with the mentioned drugs [11]. The latter fact is of special interest, as polyamines and proline actively participate in plant protection against environmental stresses, and both are synthetized from one and the same precursor—glutamate [12].
Special attention is being paid to the evaluation of genetic onion tolerance to flooding and selection of the most promising varieties with high adaptability to water excess. Gedam et al. [13] identified 19 out of 100 onion cultivars showing increased resistance to flooding during seed germination. Taking into account the complexity and laboriousness of plant selection based on water excess tolerance, it is very important to evaluate biochemical parameters directly connected with this tolerance to be employed in onion breeding.
Considering the protection function of the outer onion scales to oxidative stress [14,15], a special interest is represented by the biologically active compounds distribution between outer and inner scale tissues, greatly differing in terms of metabolism intensity and antioxidants accumulation [16].
The present work was aimed to evaluate morphological and biochemical changes in onion cultivars, differing in water stress tolerance, grown in diverse geographical regions, characterized by significant differences in humidity levels, using outer and inner scale defense parameters.

2. Results and Discussion

To date, investigations of water stress effect on genetic peculiarities of onion response were achieved, using artificial flooding either in pot experiments [13], or in field conditions [17,18]. Much less is known about onion reactions to natural disasters, caused by flooding. The latter phenomenon is common in the Amur region in Siberia [19], which presents the chance to study Allium cepa resistance to water stress, comparing plant behavior in diverse geographical zones.
The studied onion cultivars present an opportunity to compare the response intensity of plants, differing by their adaptability to water stress impact in different vegetation periods, which is high in Zolotie cupola, Zolotnichok, and Black prince, and moderate in Myachkovsky and Gobus, according to Dobrutskaya et al. [20]. In this respect, in the conditions of the Amur region, the precipitation excess was recorded at the end of onion vegetation (A), while in the Moscow region it occurred in the early vegetative phase, in May (B). According to literature reports, water excess at the last stage of vegetation causes the highest negative effect on onion growth and development [5]. On the contrary, the mean temperatures during the vegetation period did not differ between Amur and Moscow regions and were close to 18.9 °C and 19.3 °C, respectively.

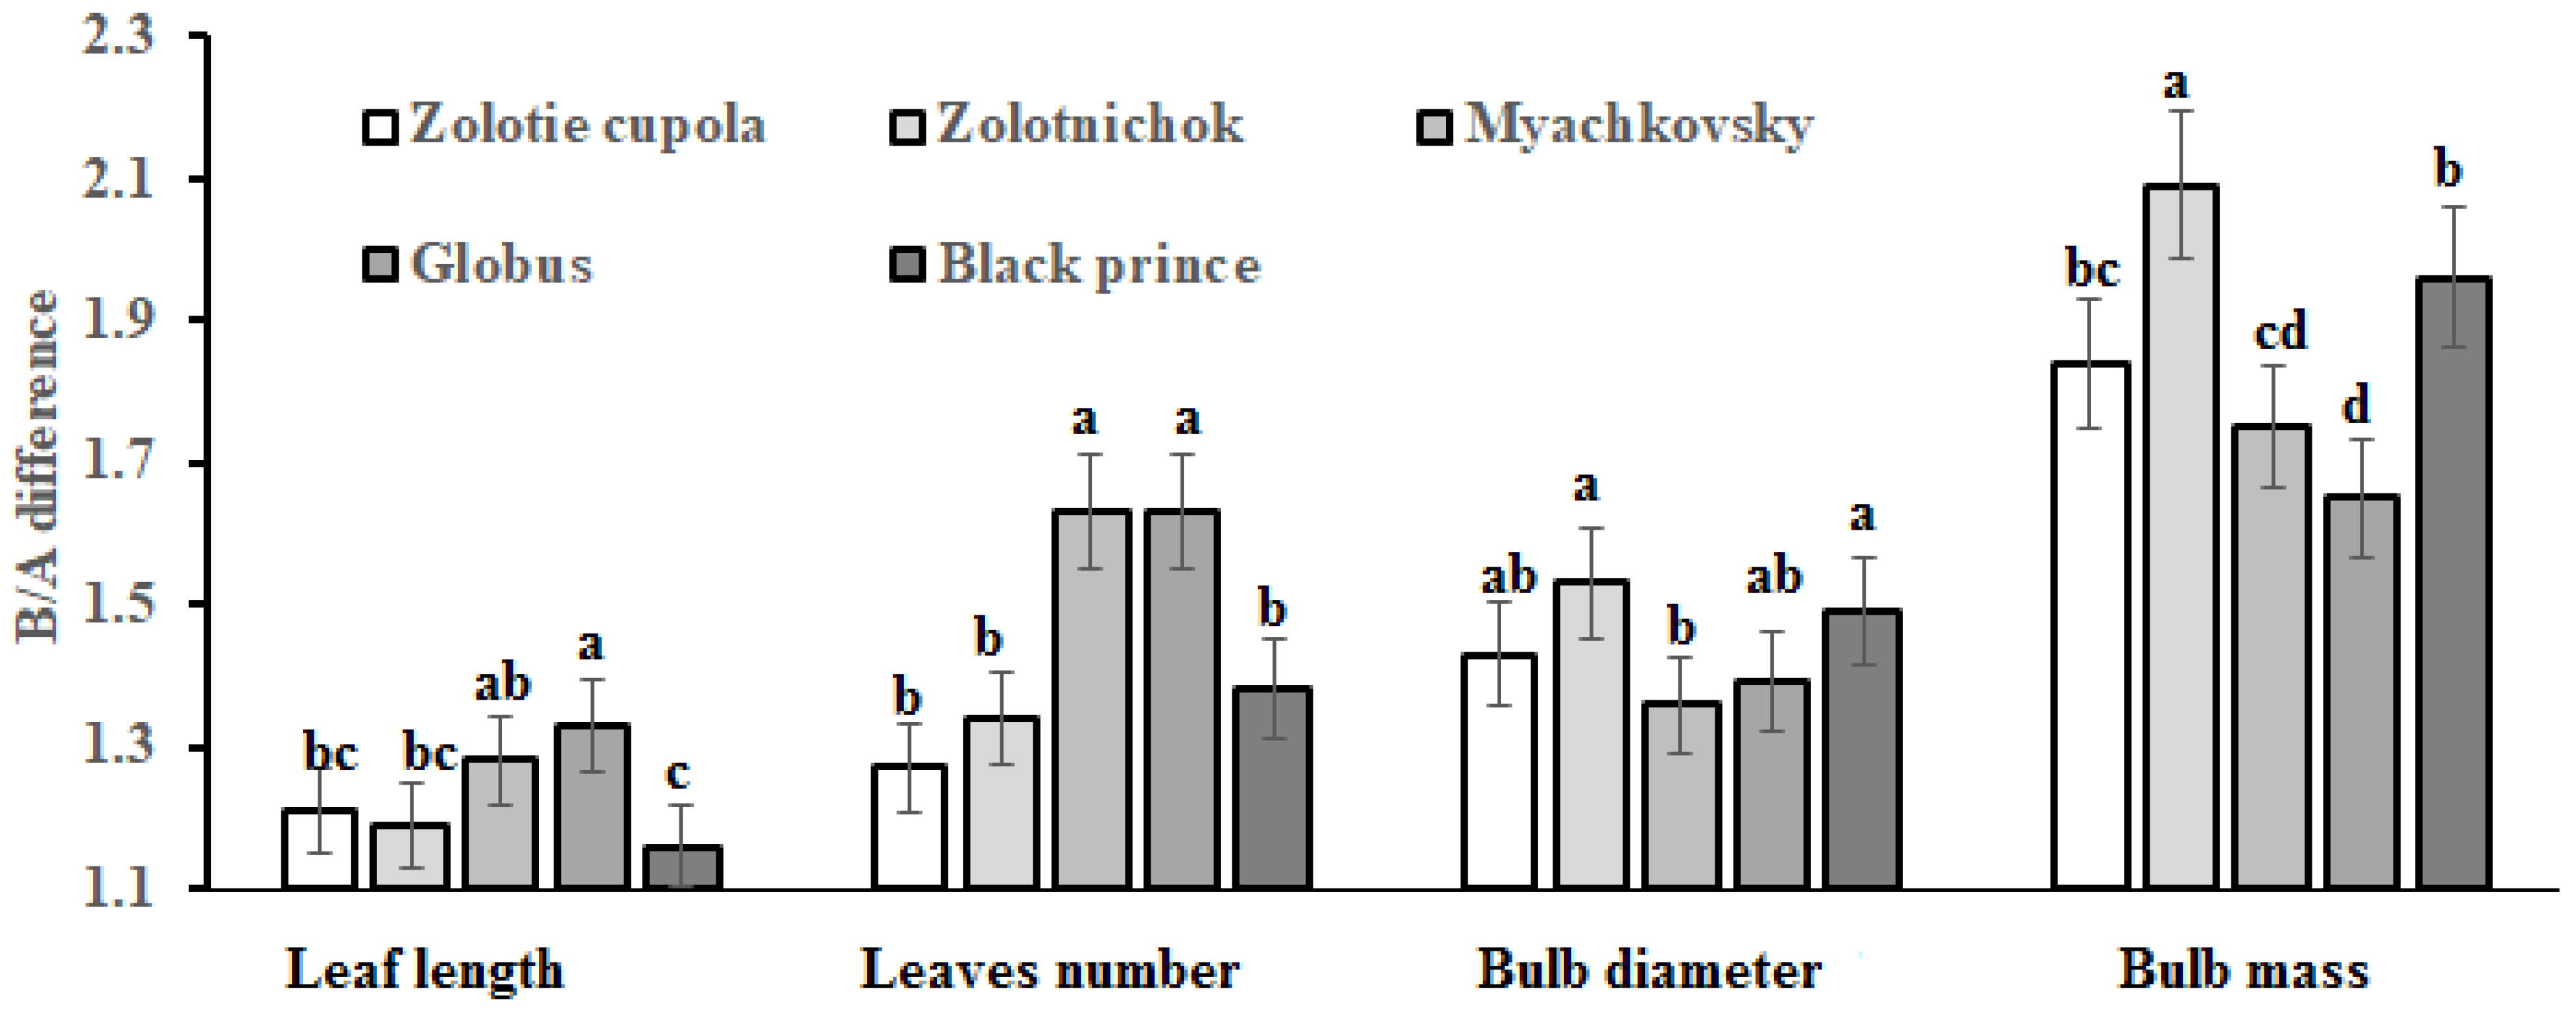
2.1. Morphological Characteristics

Compared to onion crops, grown in early water stress conditions (B), plants grown in late waterlogging (A) demonstrated growth inhibition, characterized by shorter leaves (21% decrease), less leaves number (46% decrease), as well as increased bulb shape index (83%), and significant changes in bulb size, i.e., decrease by 1.17 times in height and 1.44% in diameter (Table 1, Figure 1).
These data are consistent with the reported negative effect of humidity excess at the last stage of onion growth [4]. Genetic differences of Allium cepa response to humidity excess was more pronounced, when flooding occurred at the last stage of plant development (A), with lower adaptability cultivars (Myachkovsky and Globus), showing the least leaves number (Table 1). Furthermore, cultivars with high adaptability were characterized by the most significant differences in bulb weight between early (B) and late (A) humidity excess, i.e., 2.09, 1.75, and 1.96 times for Zolotnichok, Zolotie cupola and Black prince, respectively (Figure 1).
The smallest differences in leaves number of onion, grown in A and B conditions, were detected for cultivars with high adaptability to water excess (Zolotie cupola, Zolotnichok, and Black prince) and the greatest for cultivars of lower adaptability (Myachkovsky and Globus). Less significant differences between highly and moderately adaptive cultivars were recorded for leaf length and bulb diameter (Figure 1). Indeed, among the parameters tested, leaves number and bulb weight proved to be the most sensitive parameters to high humidity stress.

2.2. Biochemical Parameters

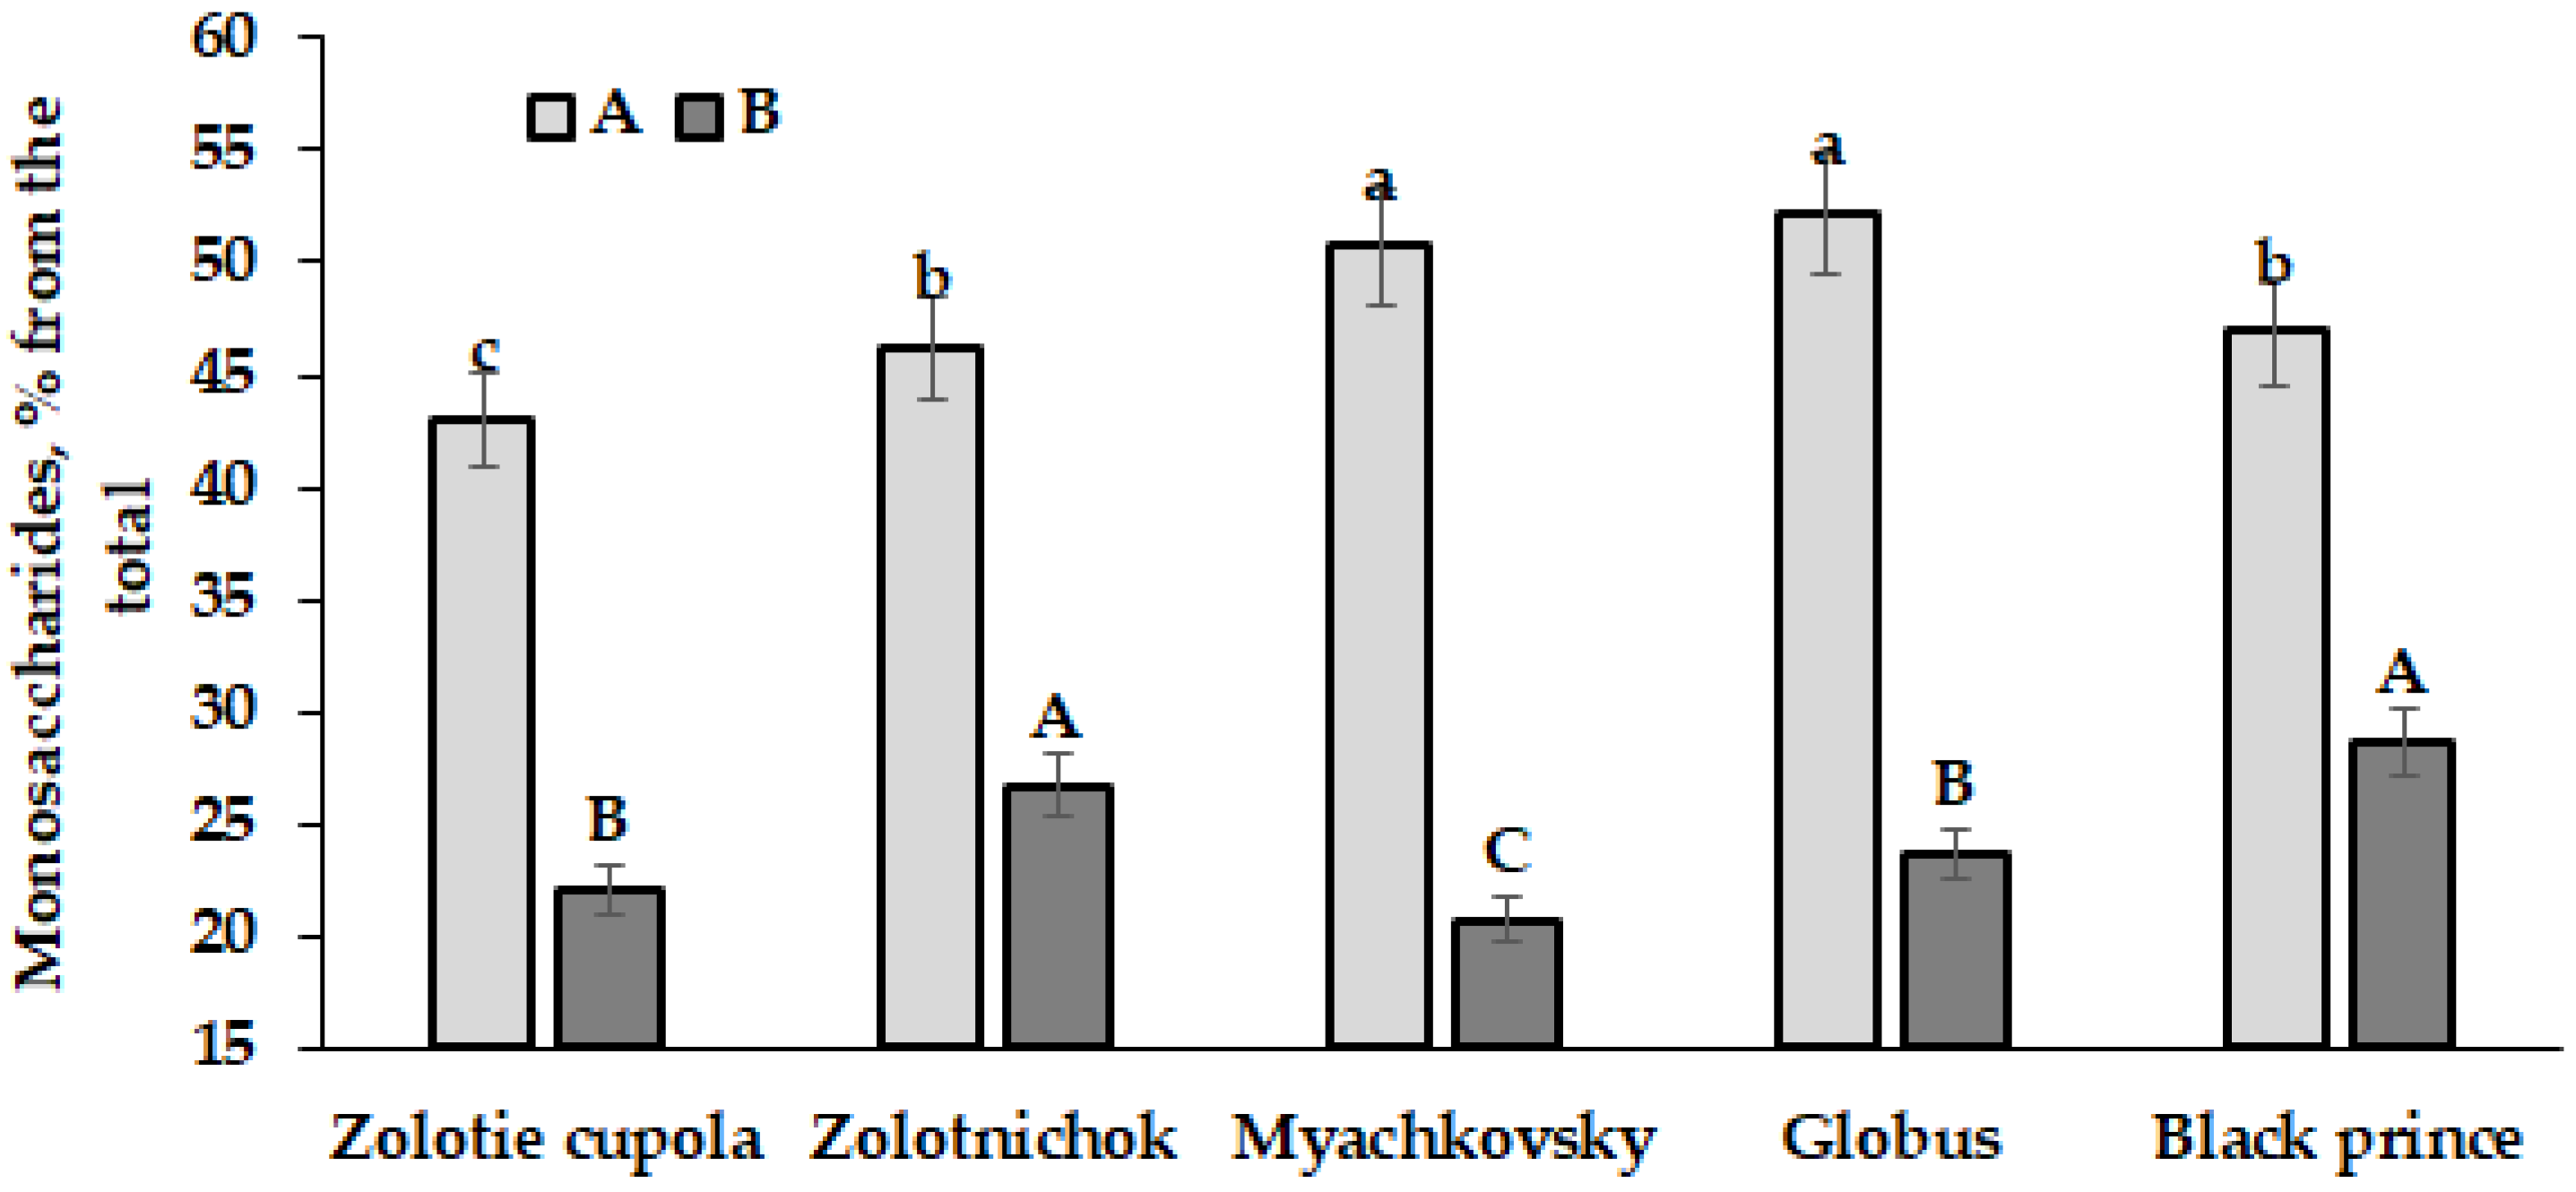
2.2.1. General Patterns and Changes of Biochemical Parameters

Changes of biochemical parameters under stress conditions are directly connected with plant adaptability [21]. The present results indicate a significant 16.5% decrease in dry matter content in onion inner scales in (A) plants, compared to those grown in (B) conditions (Table 2). More than twice an increase in monosaccharides content due to late water stress (A) was in accordance with literature reports, suggesting the significance of monosaccharides in plant water balance [22]. Sugars are known to provide energy for cellular defense responses under stress conditions, participate in defense compounds biosynthesis, and express themselves as metabolic signaling molecules, affecting the expression of many defense genes.
The obtained data indicated that flooding at the late phenological stage (A) not only caused the decrease in the total sugar content (by 1.46 times), but greatly affected monosaccharides occurrence out of the total amount of sugars (Figure 2). Indeed, Figure 2 revealed higher percentage of monosaccharides out of the total amount of saccharides in cultivars with lower adaptability, i.e., Myachkovsky and Globus. In this respect, it is worth mentioning that the absolute values of monosaccharides and total sugar content did not differ significantly in cultivars grown in similar conditions. The results also showed significantly higher differences in total sugar levels in bulbs, produced under high humidity conditions between early and late phenological phases for cultivars with lower adaptability (Myachkovsky and Globus, 1.61–1.64 compared to 1.27–1.42 related to plants with high adaptability).

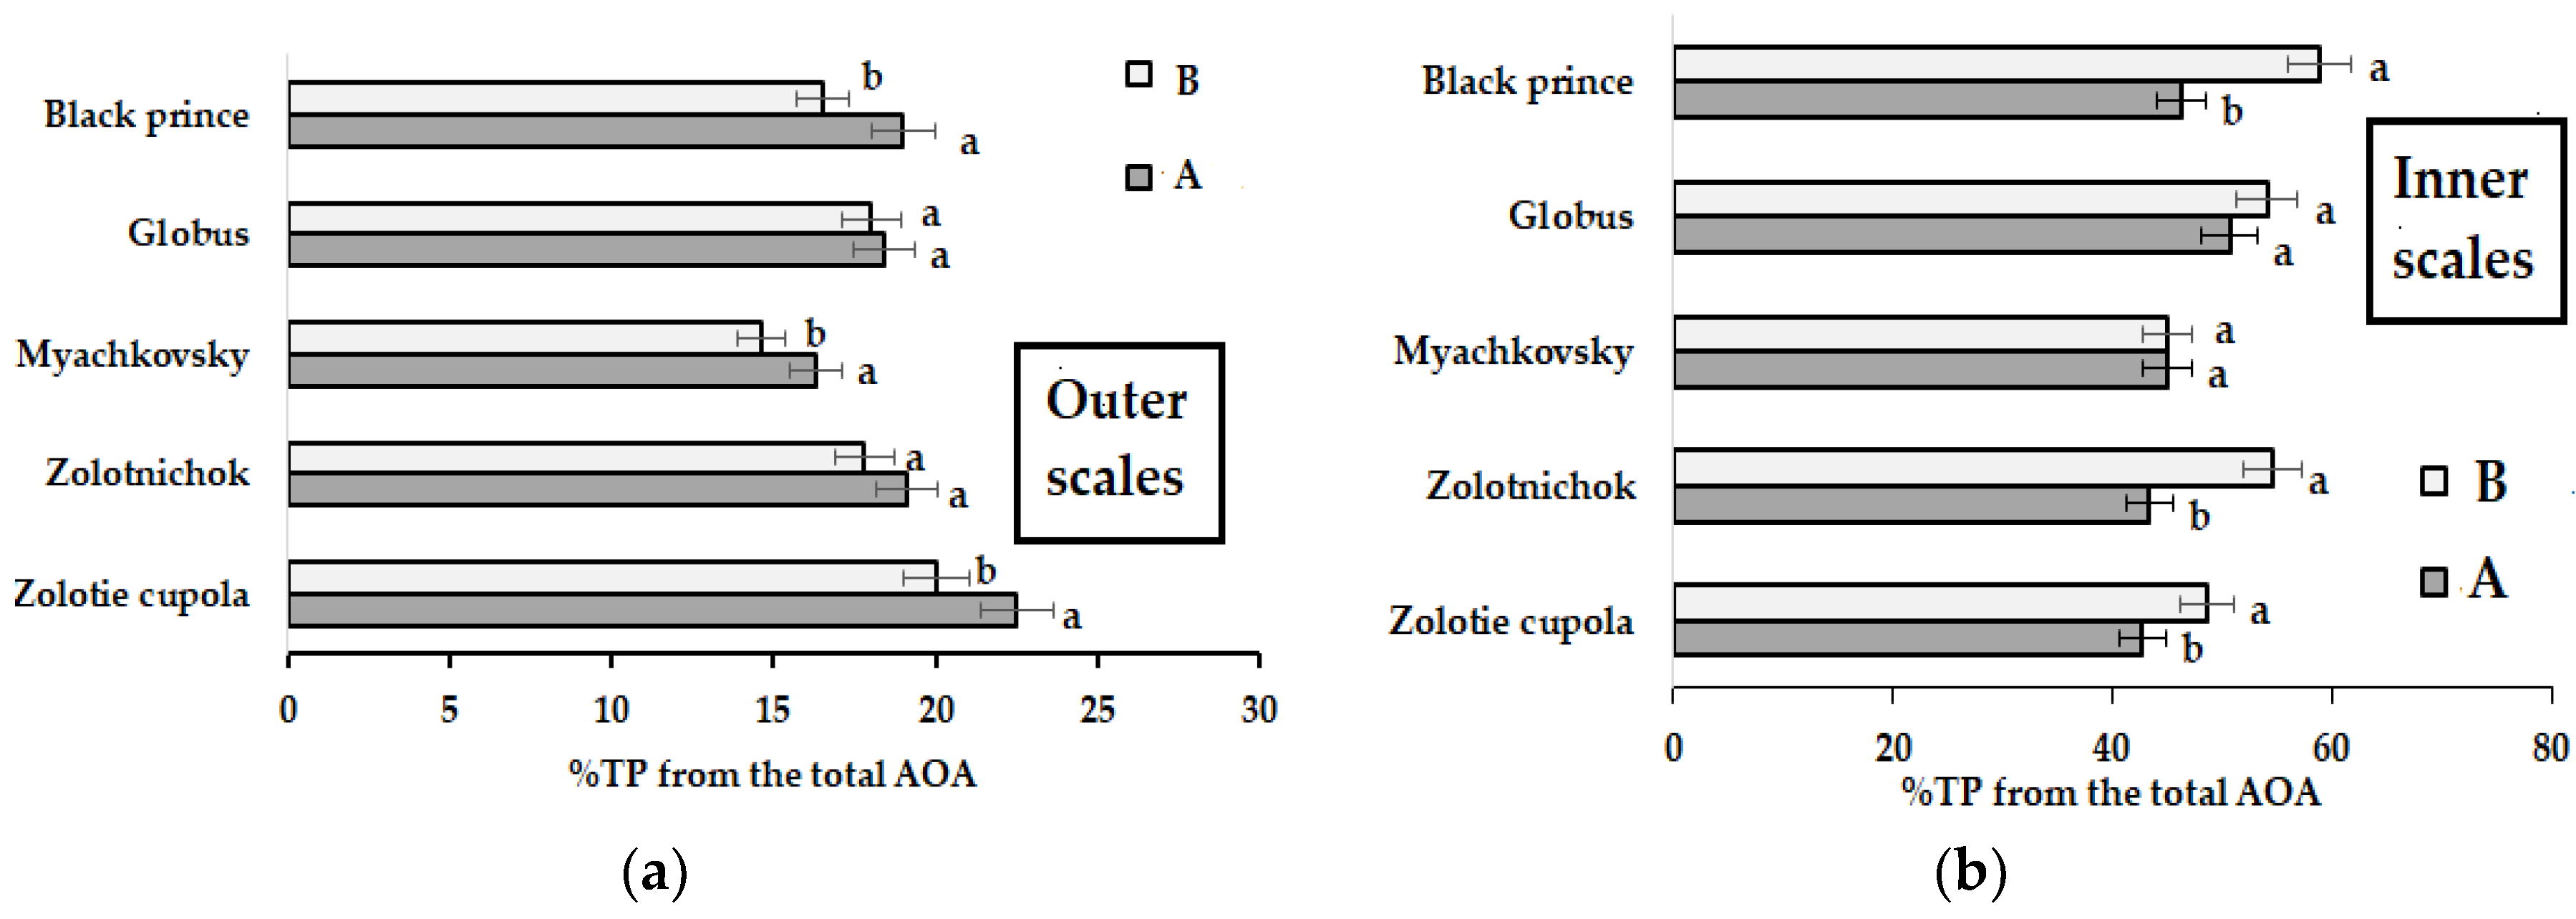
2.2.2. Antioxidant Activity and Phenolics Content

Polyphenols are important secondary metabolites, actively participating in plant adaptability to oxidative stress [23]. In this respect, onion outer scales provide both mechanical and a powerful chemical protection. Indeed, outer/inner AOA ratio in conditions of early waterlogging (B) reached 5, while under late humidity excess conditions (A) this parameter was just 3.4 (Table 3). The results mostly reflect changes in inner scale AOA, whereas the corresponding values of the outer scale did not change significantly.
Higher levels of polyphenol content in bulb inner scales of plants, subjected to high humidity at the end of vegetation period (A), and lacking any significant varietal differences of outer scale total polyphenols in diverse vegetation conditions, were consistent with the AOA data. In general, the proportion of TP in the total AOA of onion outer scales tended to be higher in conditions of high humidity at the end of vegetation (A), than at the early one (B) (Figure 3a), while the opposite relationship was recorded for the inner scales (Figure 3b). Notably, significant differences between (A) and (B) inner scales TP % were found only in cultivars with high adaptability, while Myachkovsky and Globus cultivars demonstrated similar TP (A)/(B) values (Figure 3b).
The ratio outer/inner scales in terms of phenolics showed 1.41 and 1.68 times differences in (A) and (B) conditions, respectively. It is worth remarking the high stability of the outer scale antioxidant status and the significant increase in AOA and TP of inner scales in (A) water stress conditions.

2.2.3. Proline

Different forms of plant stresses are known to increase proline synthesis, able to stabilize membranes, maintain cell turgor, and decrease the concentration of reactive oxygen species [24,25].
The inner scale proline concentration range in (A) stressed plants reached 0.97–2.30 mg g−1 d.w., which was 1.65 times higher than the corresponding value in plants grown in (B) conditions (Table 4). The high coefficient of variation of this parameter under late water stress (A) suggests the significance of genetic peculiarities in the strategy of plant survival.
Interestingly, proline content in onion seeds is a reliable indicator of cultivar tolerance to water stress. Indeed, proline concentrations in Myachkovsky and Globus seeds showed significant differences, compared to stress tolerant cultivars (Zolotie cupola, Zolotnichok, and Black prince) (Table 4). The latter observation is in accordance with the Kijowska-Oberc et al. [26] recommendations about the reliable use of seed proline as a promising biochemical marker of seed desiccation tolerance and storability. Nevertheless, the small sample size does not allow drawing unambiguous conclusions, and further investigations are necessary.

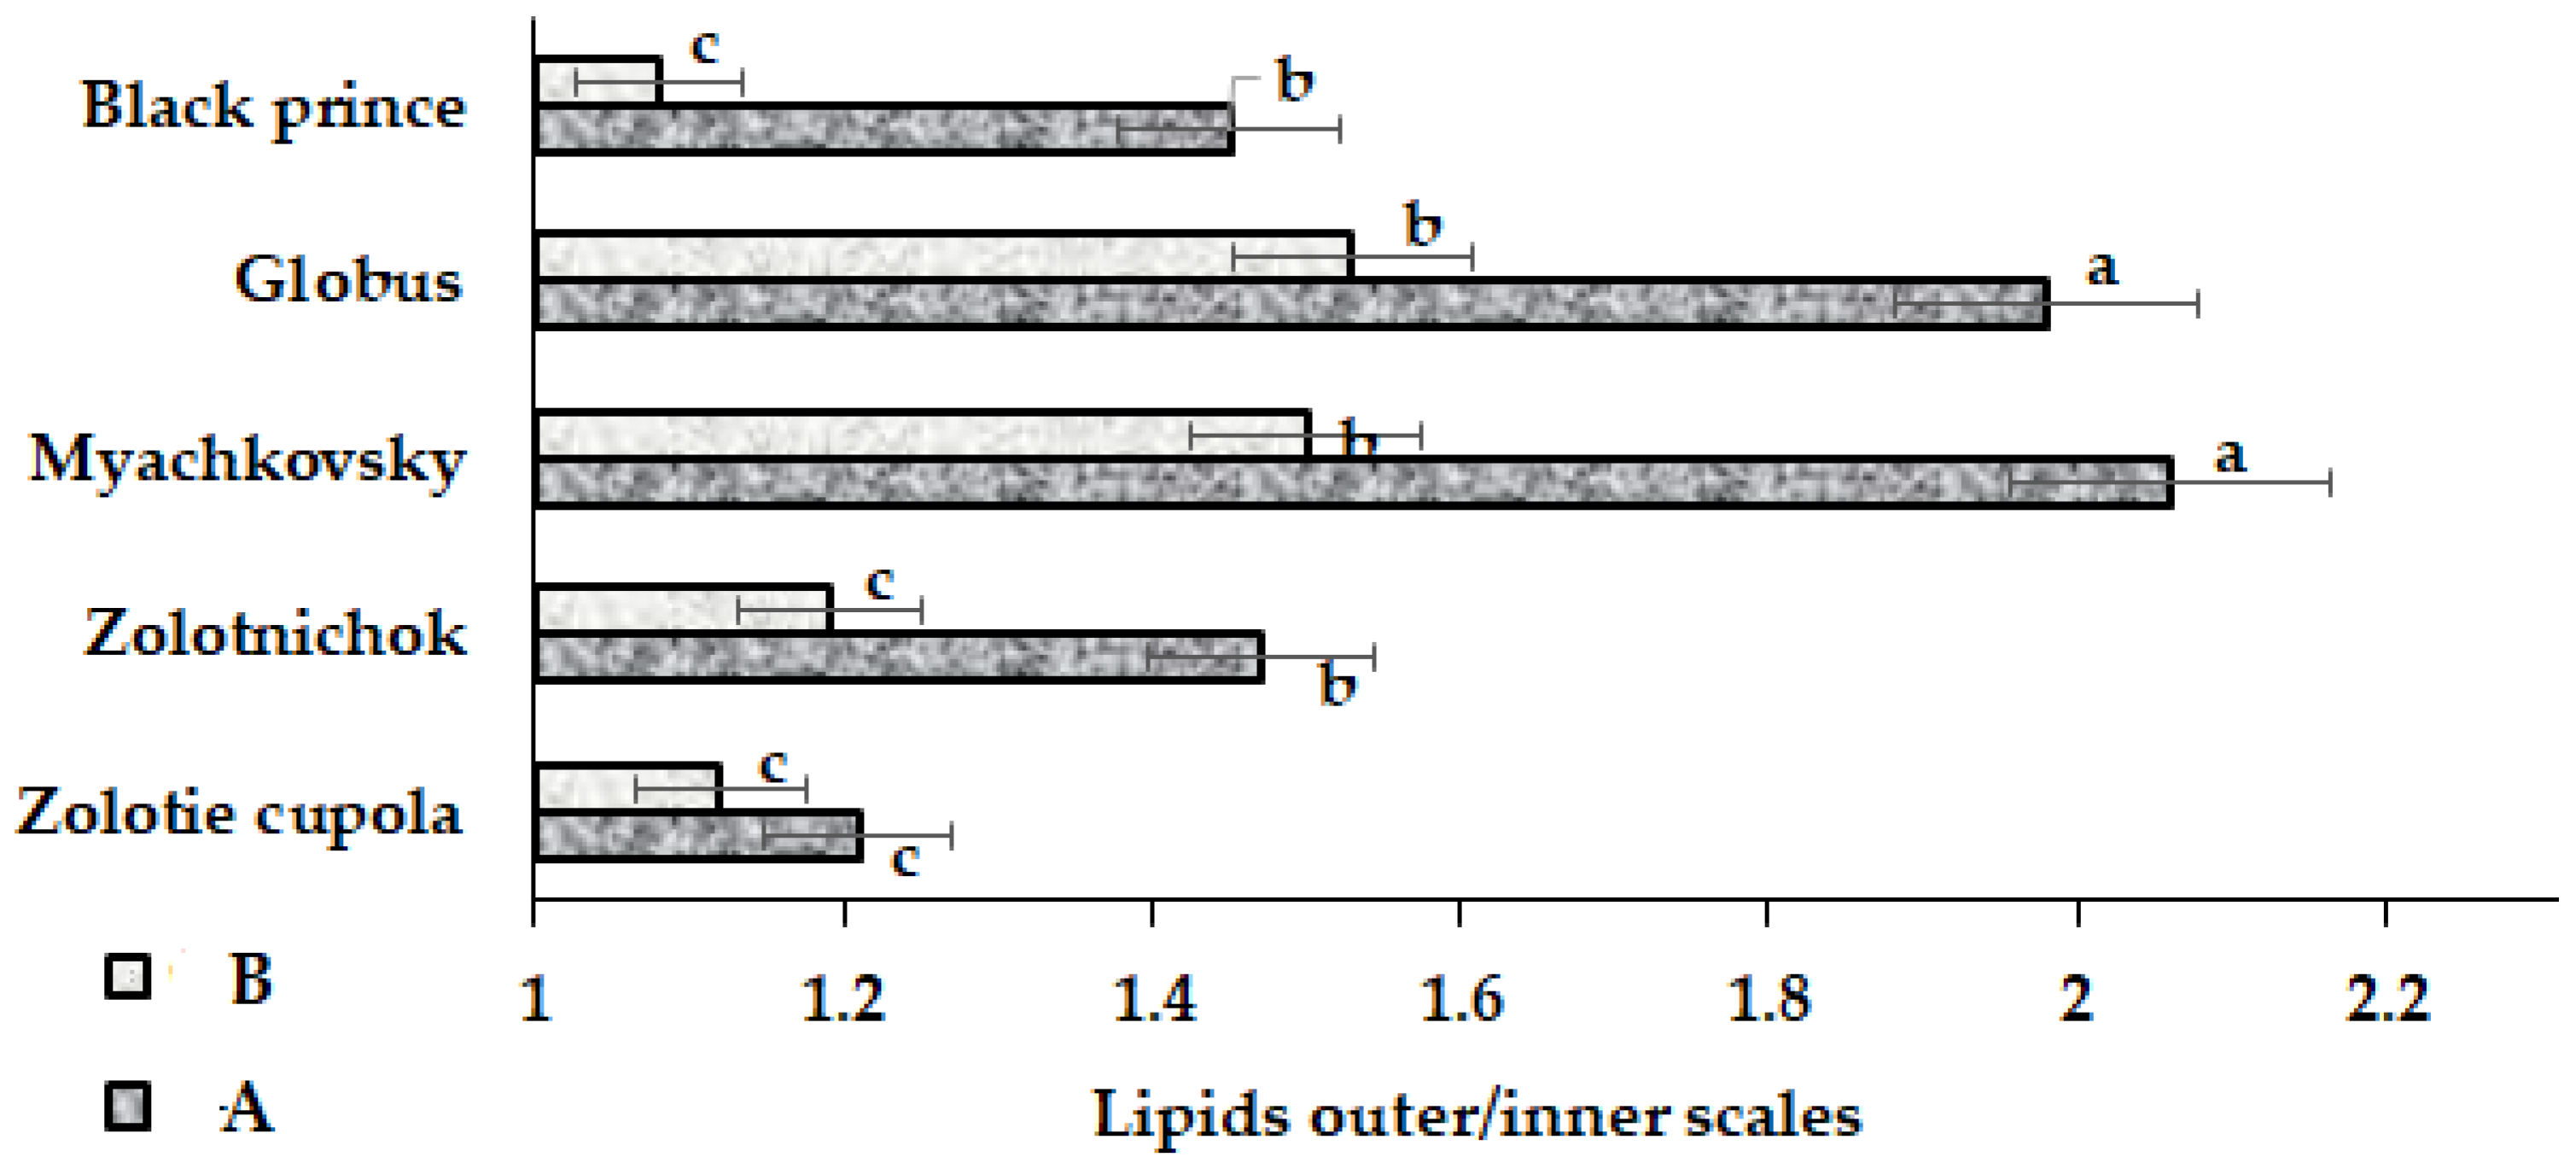
2.2.4. Non-Polar Lipophylic Compounds (Lipids)

Hypoxia and other abiotic stresses are known to stimulate participation of lipids in signaling processes, optimizing cell membrane permeability and eliciting plant tolerance enhancement [27,28]. As an example, according to Pan et al. [29] and Xie et al. [27], waterlogging decreases the content of scale lipids in plant leaves, which stimulates the availability of oxygen to tissues.
Despite the mentioned phenomena and the information about lipids composition and their distribution between outer and inner scales of onion bulbs [30,31], no reports are available, so far, regarding the effect of oxidative stresses on onion bulb lipids accumulation. The predominance of neutral and glycolipids and the extremely low levels of phospholipids in onion provided a hypothesis that lipids do not possess any distinct functional roles in onion [31]. The detected higher lipids content in onion outer scales in the present work (Table 5) are consistent with the data of Bello et al. [30], who reported lipids levels of 15.71% for the outer scales and 14.98% for the inner scales. The low metabolism of bulb outer scale tissues resulted in insignificant differences in lipids content between plants under early and late waterlogging. Interestingly, in the present work outer/inner scale lipids ratio showed much higher values, i.e., 1.21–2.06 and 1.08–1.53 for waterlogging at late and early phenological phases, respectively (Figure 4), compared to 1.05 in the Bello et al. investigation [29]. Furthermore, in conditions of high humidity both at the early and late stages of plant development (B and A), cultivars with lower adaptability showed significantly higher lipids ratio between outer and inner scales (cvs. Myachkovsky and Globus) and lower lipids content in the inner bulb scales (Table 5, Figure 4).
It is also worth noting that the mentioned phenomenon is more pronounced when waterlogging occurs at the late phenological phase (A), than in the early one (B) (Figure 4), suggesting higher stress intensity in the former case. CV value of mean outer/inner scale lipids ratio in plants, grown in A and B conditions, reached 22.6% and 16.1%, respectively, which indirectly implies a reduction of varietal differences of this indicator upon a decrease in stress intensity.
The mentioned facts suggest that outer/inner scale lipids ratio is governed both by genetic factors and by the intensity of environmental stress. Furthermore, the phenomenon of low outer/inner scale lipids ratio in cultivars with decreased adaptability is a valuable indicator of plant tolerance to waterlogging predominantly at stress conditions, though additional investigations are needed to clarify the above issue.

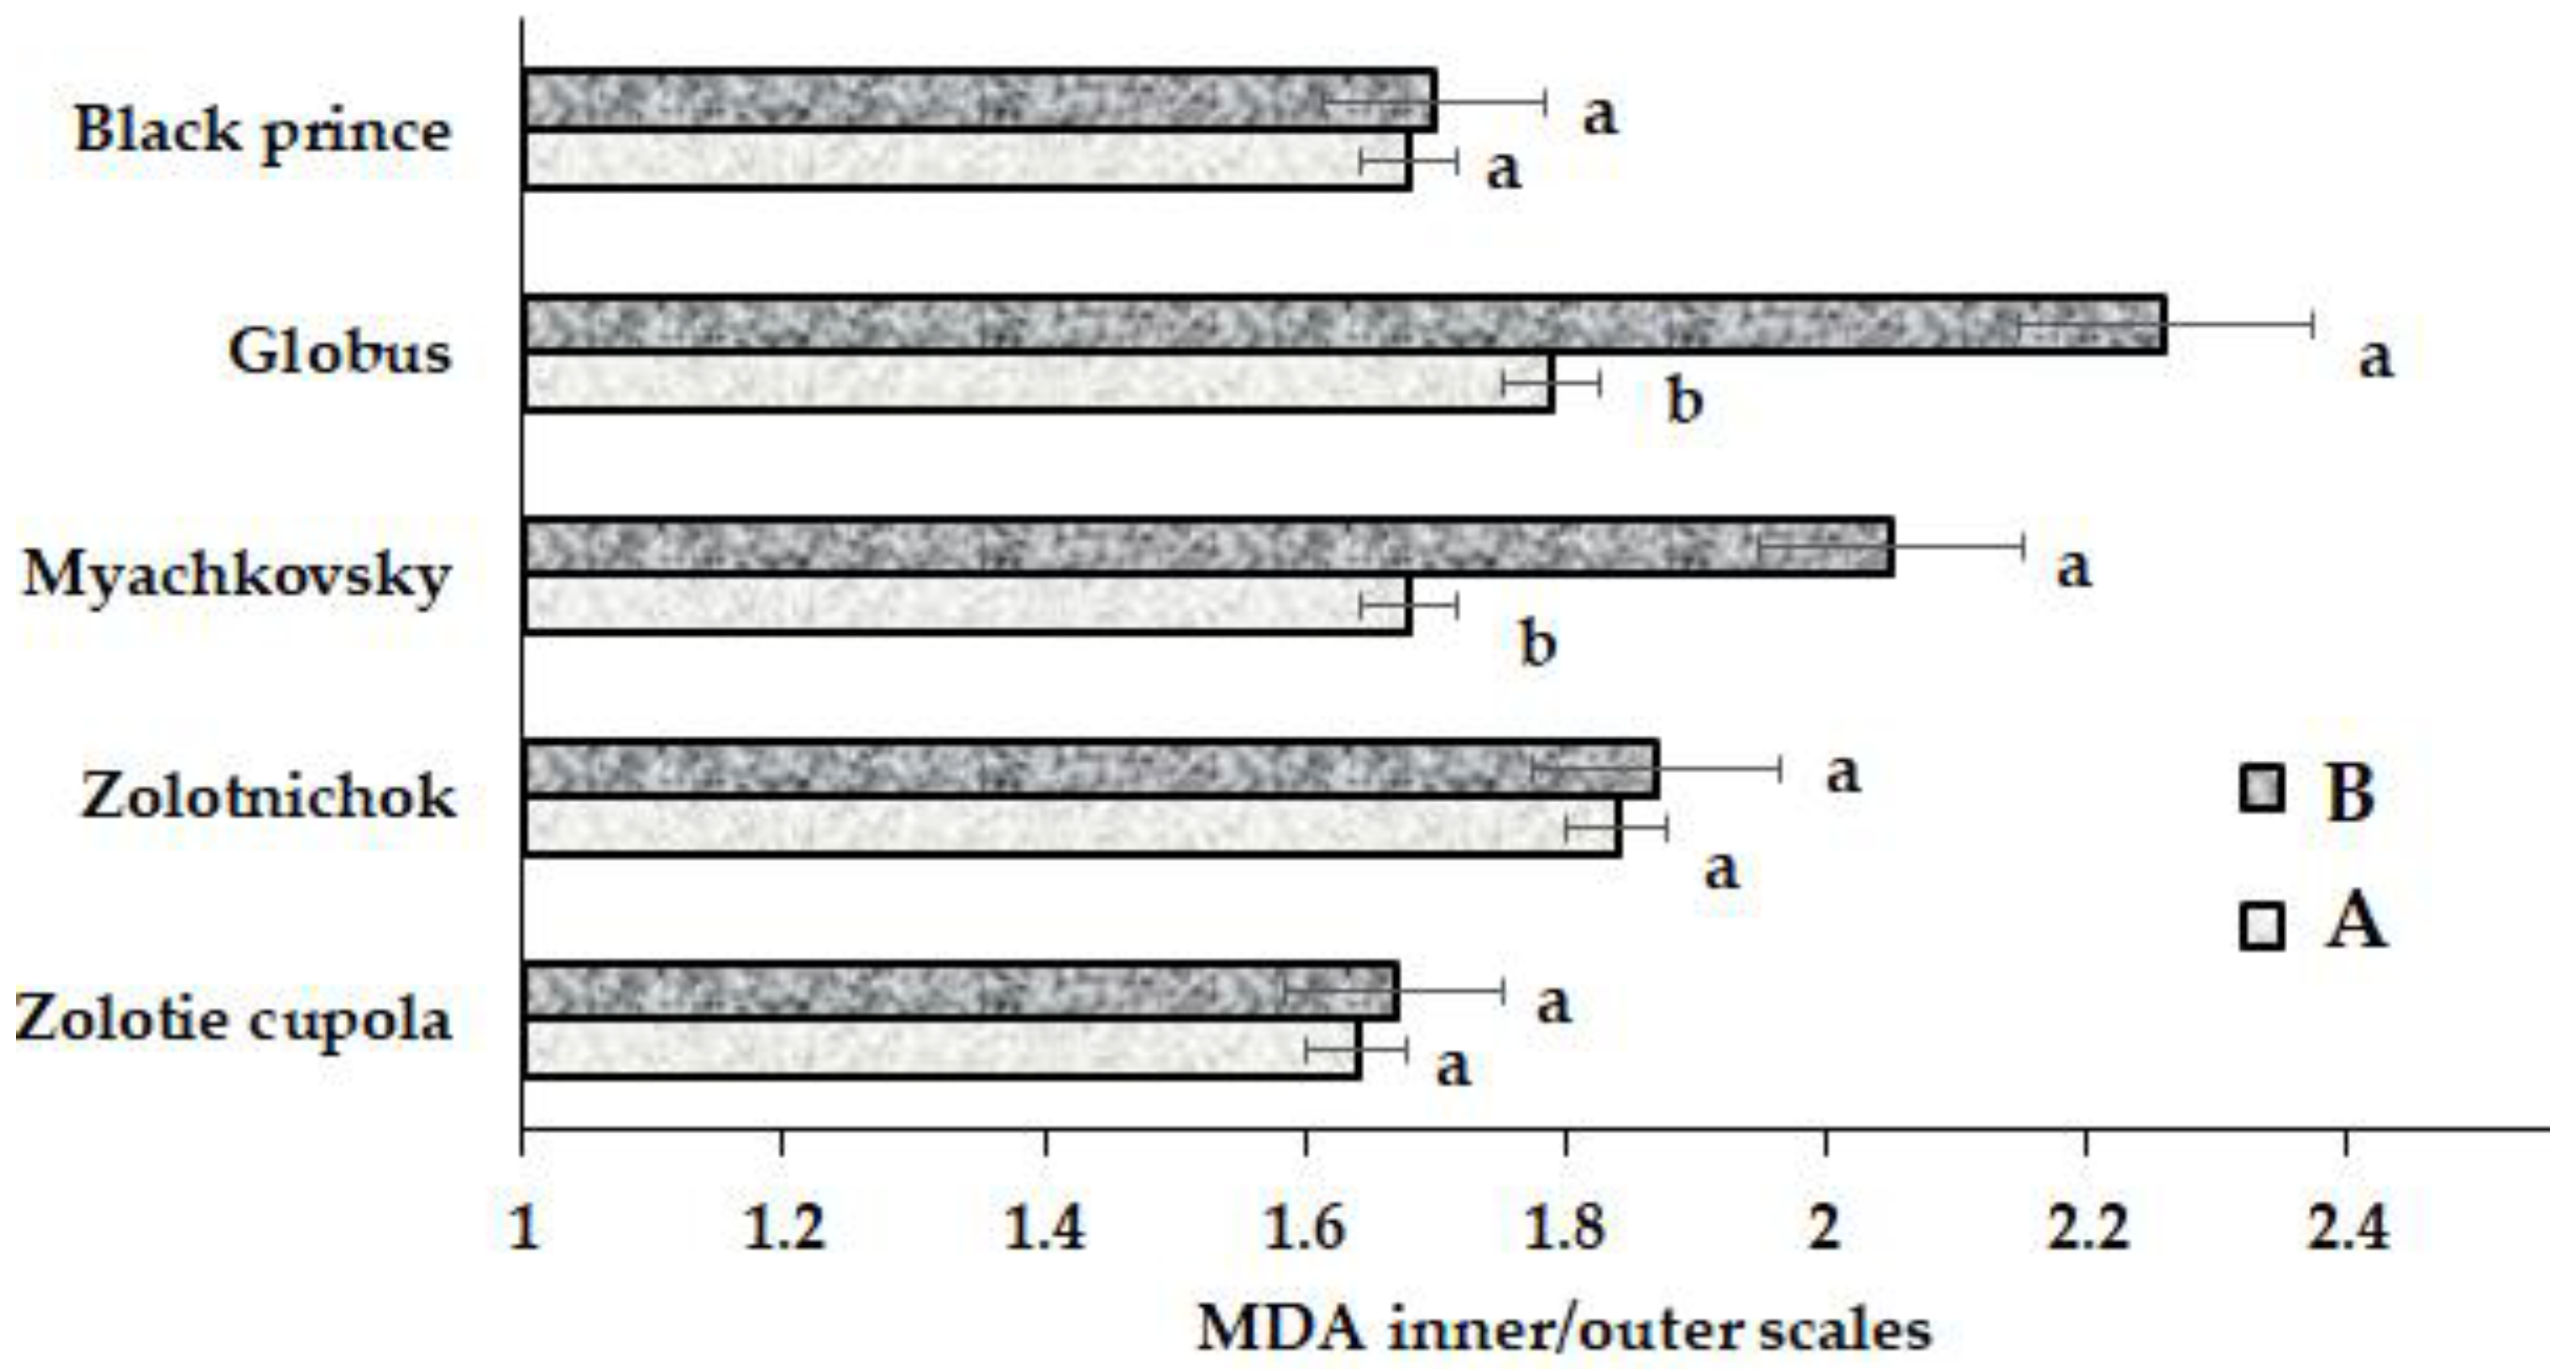
2.2.5. Malonic Dialdehyde (MDA)
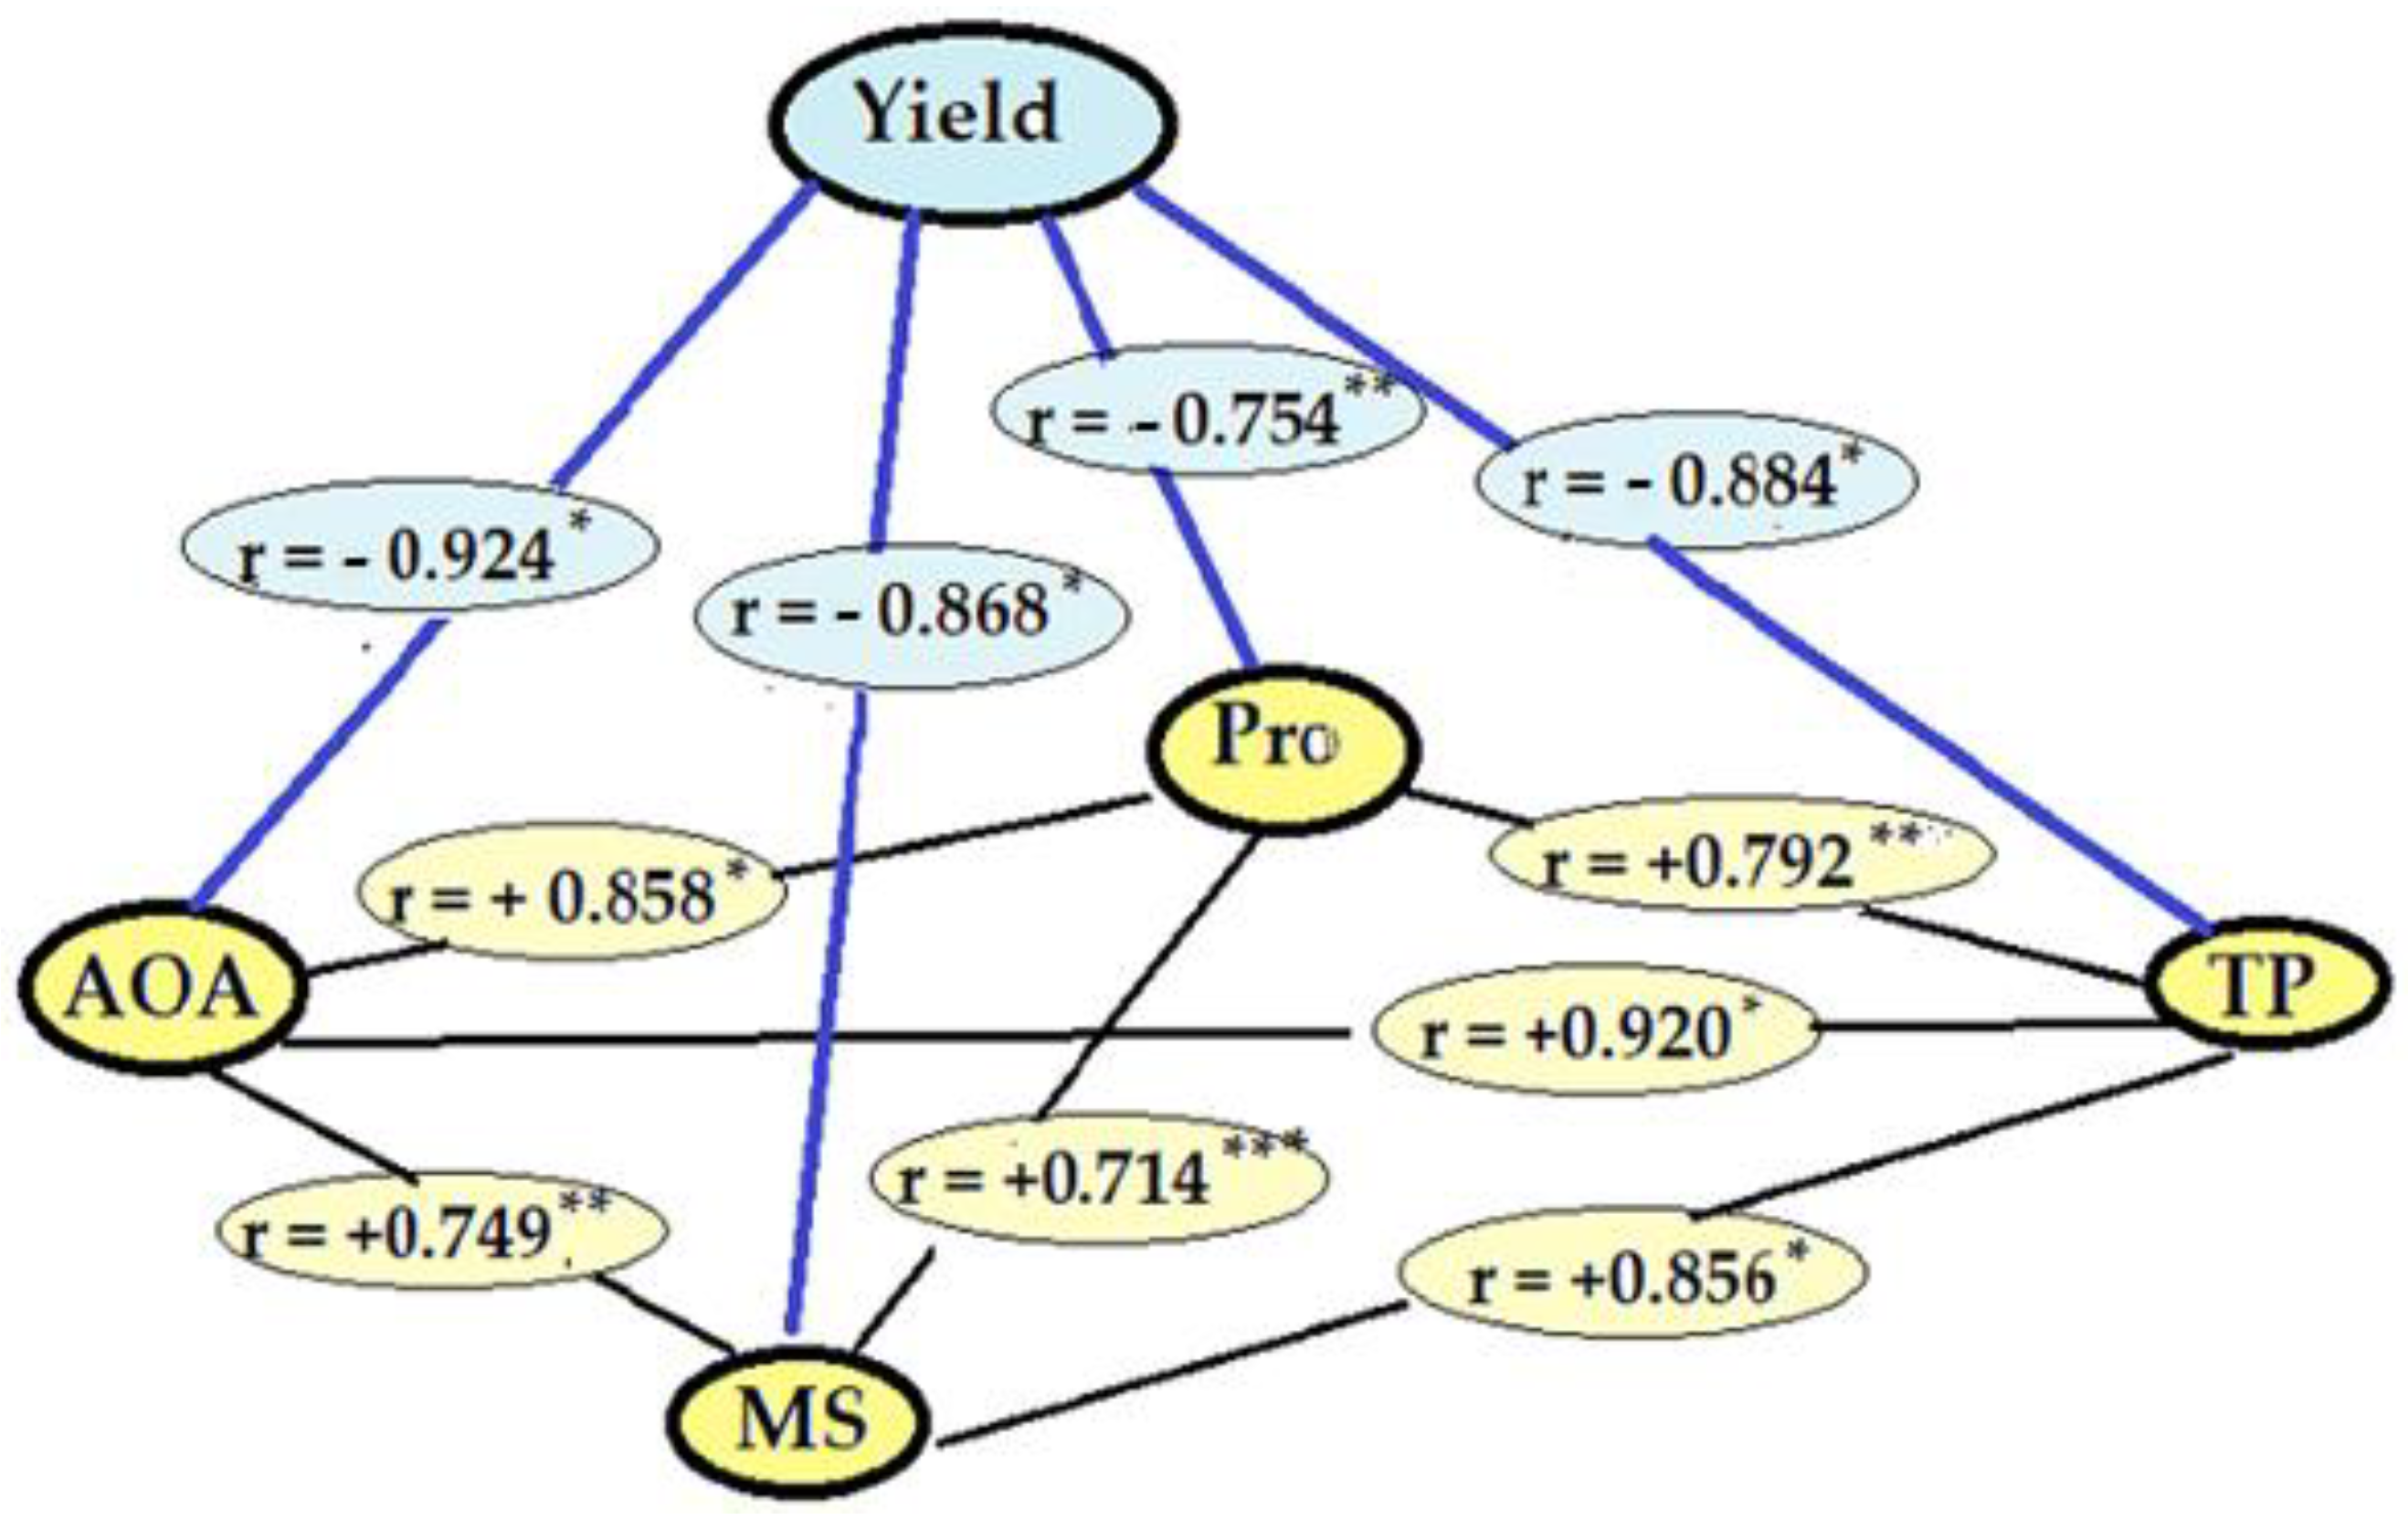
MDA is considered an excellent pattern to evaluate the intensity of lipids peroxidation, caused by oxidative stresses, indicating the level of plant adaptability [32]. The data, presented in Table 6, show significantly higher MDA content in onion inner scales, compared to the outer ones, which is in accordance with the lower metabolism of bulb outer tissues. Absolute parameters of MDA accumulation under different humidity conditions demonstrated few, or lack of, index differences between different cultivars. On the contrary, the inner/outer scales MDA ratio is more informative, providing an opportunity to reveal cultivars with lower adaptability and characterized by the highest values of this parameter under high humidity conditions at the early stages of plant development (B) (Figure 5). Interestingly, MDA content in bulbs under late water stress conditions (A) did not significantly differ, compared to the corresponding values of bulbs produced in conditions of early flooding (B) (Table 6), which suggests the existence of strict maintenance of plant homeostasis despite negative environmental effect.
It may be assumed that these parameters are suitable to monitor different onion cultivars for water stress tolerance, though more intensive investigations are necessary to confirm this hypothesis.

2.2.6. Correlations

The low rate of metabolic processes in onion outer scales resulted in relative stability of biochemical characteristics, which caused insignificant correlation between the outer and inner scale parameter values. The most interesting relationships were recorded for the inner scales (Figure 6).
Among the inner scale parameters, lipids content correlated negatively only with MDA value (r = −0.843, p < 0.001), which was in accordance with variations in lipids oxidation intensity. In this respect, the data indicate lack of significant effect of inner scale lipids content on bulb yield, proving the minor role of lipids in onion yield.
Other parameters tested demonstrated the existence of complex plant defense system in waterlogging stress conditions, combining the participation of proline, carbohydrates, and antioxidants (Figure 6). The data, shown in Figure 6, indicate powerful correlations between natural antioxidants, monosaccharides, and onion bulb yield.
The latter phenomenon is in accordance with the well-known protection strategies of plants against hypoxia [29,33]. The highest coefficients of correlation were recorded between bulb weight and AOA, TP, monosaccharides, and proline values (p < 0.001), revealing significant correlation between onion yield and stress indicators. The results also indicated that MDA levels in onion inner scales correlated only with lipids accumulation (r = −0.843, p < 0.001) and proline (r = +0.712, p < 0.01).
Overall, the mentioned relationships may be considered as a detailed characteristic of onion defense system under waterlogging. Despite the attractiveness of this approach, the presented data (Figure 6) are not exhaustive to indicate cultivars with high stress tolerance which is connected, at least partially, both with the distribution of lipids and MDA between outer and inner scales, and with the polyphenol occurrence to the total antioxidant activity.

3. Material and Methods

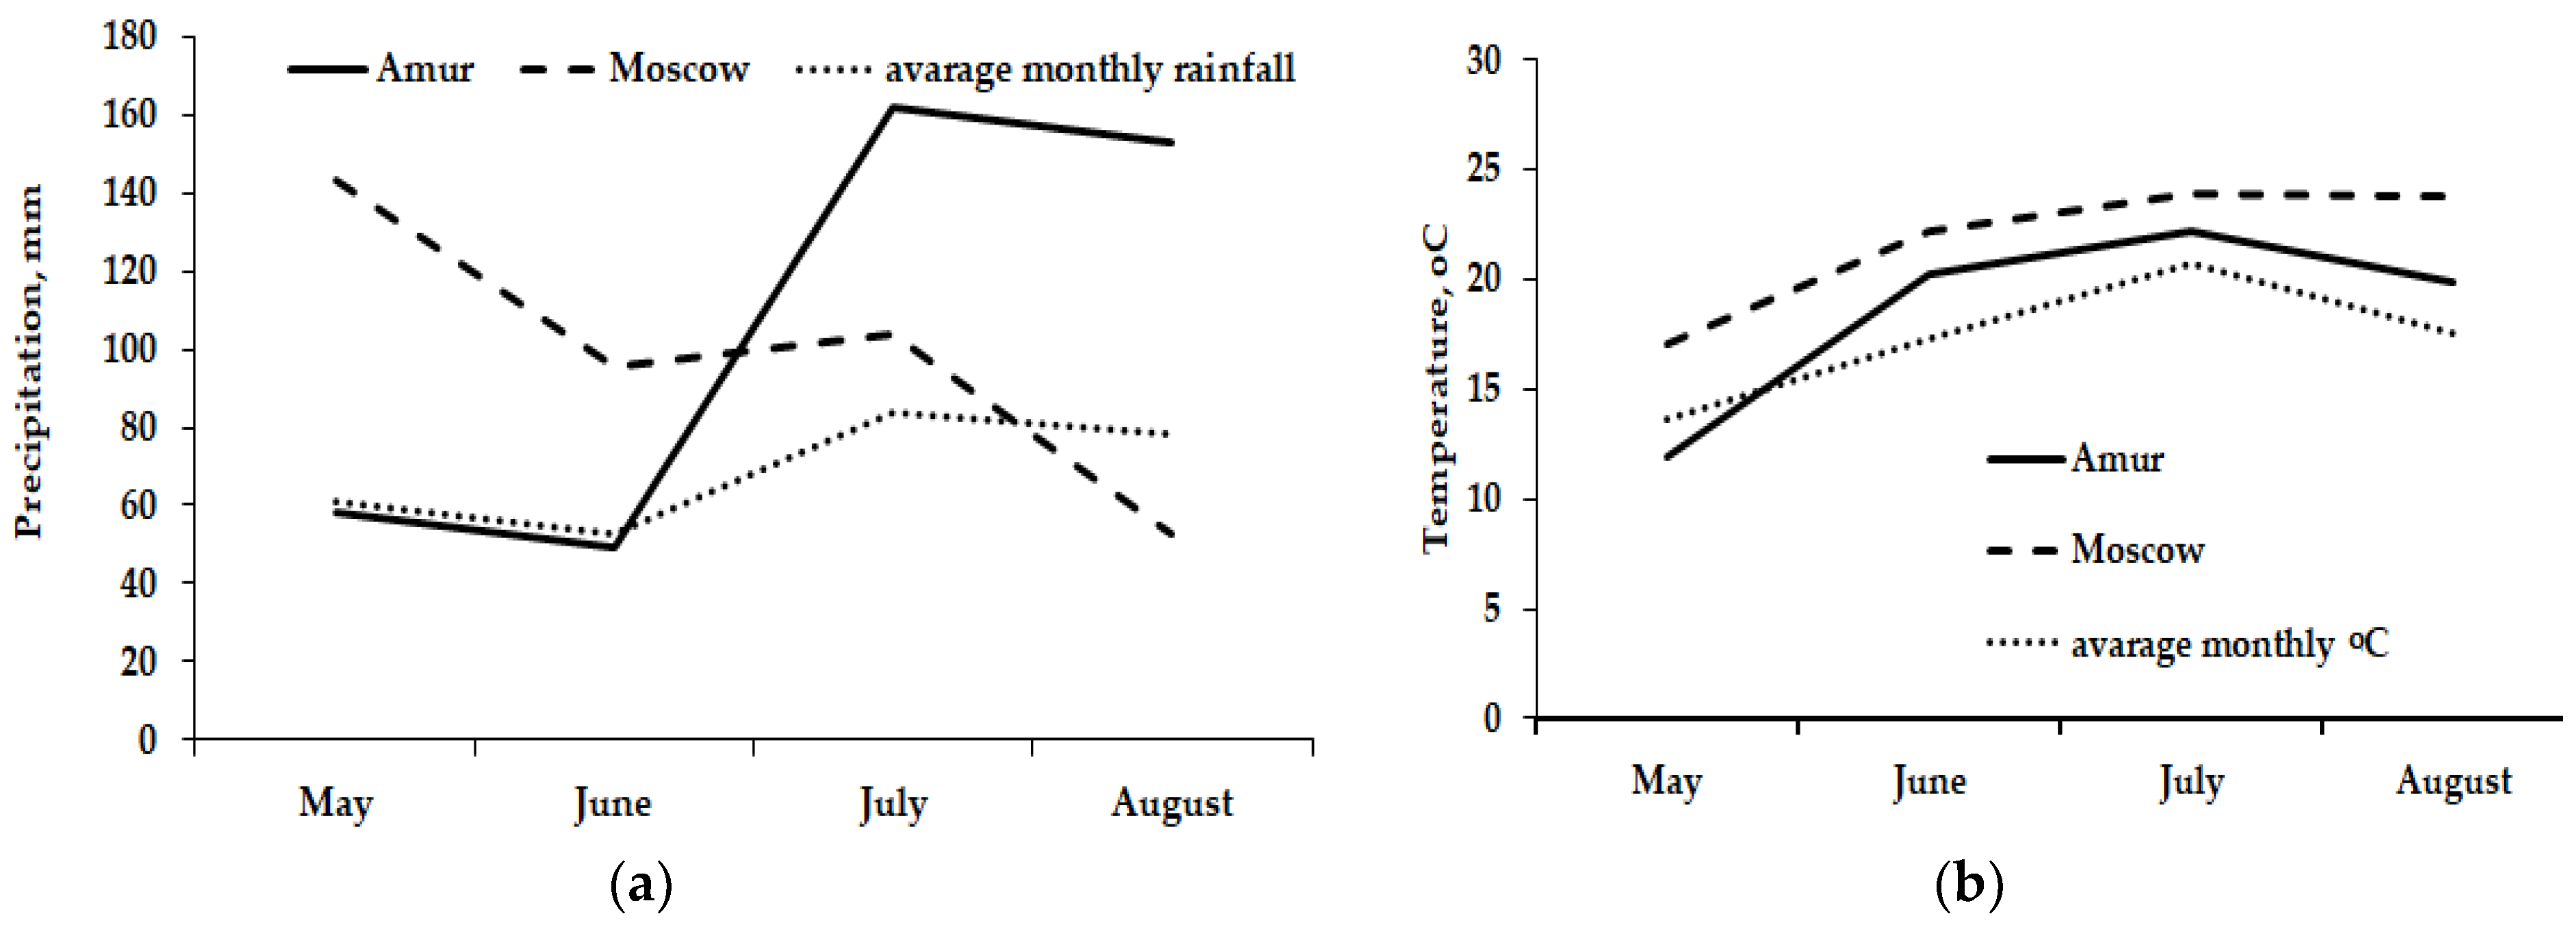
3.1. Experimental Conditions

The research was carried out in 2020, comparing five A. cepa cultivars selected at the Federal Scientific Vegetable Center (Zolotnichok, Zolotie cupola, and Black prince with high adaptability, and Myachkovsky and Globus with moderate adaptability) in two different growing locations in Russia (Moscow and Amur). A randomized complete block design was used, with three replicates, and the experimental unit had a 1.6 m2 surface area containing four rows and 72 plants.
Plants were grown in the regions of Moscow, at the experimental fields of the Federal Scientific Vegetable Center, and of Amur, using the same farming management (Table 7).
In the Moscow region, the trial was conducted in a loam sod podzolic soil with the following initial characteristics: pH 6.2, 2.12% organic matter, 1.32 mg-eq 100 g−1 hydrolytic acidity, 18.5 mg kg−1 mineral nitrogen, 21.3 mg kg−1 ammonium nitrogen, sum of absorbed bases as much as 93.6%, 402 mg kg−1 mobile phosphorous, and 198 mg kg−1 exchangeable potassium. The soils of Amur region are meadow chernozem and alluvial, pH 5.3, with 3.8% organic matter, 2.5 mg-eq 100 g−1 hydrolytic acidity, 0.02–0.35% total nitrogen, 162 mg kg−1 exchangeable potassium, and 65 mg kg−1 mobile phosphorous.
The mean monthly precipitation and temperatures during the vegetation period are shown in Figure 7a,b.
Onion bulb sets were planted on 4 May both in Moscow and in the Amur region, preceded by tomato in Moscow and by cucumber in Amur.
Prior to planting, onion bulb sets of the five mentioned cultivars with 15–25 mm diameter (harvested in 2019 at the Federal Scientific Vegetable Center) were soaked in a diluted solution of potassium permanganate to prevent fungal diseases. Onion sets were placed at 2–4 cm soil depth in 120 cm wide and 135 cm long beds, spaced 7.5 cm along the rows which were 30 cm apart.
Hoeing was carried out to incorporate fertilizers into the soil and remove the crust and weeds. The crops were irrigated by the sprinkling method when soil humidity dropped to 70% water capacity. Water stress was evaluated, determining soil humidity gravimetrically during the vegetation period and defined as the soil humidity content exceeding 75%. Thirty-two onion bulbs per plot, excluding the border plants, were harvested on 20 August, at bulb maturity, when over 50% of the plants had the pseudo-stems softened and the leaves flattened.

3.2. Sample Preparation

After harvesting and removing soil particles, 10 bulb samples were randomly collected in all the 15 plots (five cultivars x three replicates) arranged in each of the two locations (Moscow and Amur) to determine their mean weight, length, and diameter. Then, the onion skins were separated from the bulbs, cut into small pieces, dried at 70 °C to constant weight, and homogenized. The resulting powders were used to determine the total polyphenols content (TP), total antioxidant activity (AOA), proline, malonic dialdehyde (MDA), monosaccharides, and total sugar and non-polar lipophilic compounds content.

3.3. Bulb Shape Index (BSI)

The bulb shape index was calculated by dividing the bulb length (polar diameter) by the bulb width (equatorial diameter):
BSI = polar diameter/equatorial diameter.

3.4. Dry Matter

The dry matter was assessed gravimetrically by drying the samples in an oven at 70 °C until constant weight [34].

3.5. Antioxidant Activity (AOA)

The antioxidant activity of onion outer and inner scales was assessed in 70% ethanolic extracts of dry samples, using a redox titration method [35]. The values were expressed in mg gallic acid equivalents per g of dry weight (mg GAE g−1 d.w.).

3.6. Total Polyphenols (TP)

Total polyphenols were determined in 70% ethanol extracts of dried inner and outer scales, using the Folin–Ciocâlteu colorimetric method, as previously described [35]. One gram of dry homogenates was extracted with 20 mL of 70% ethanol/water at 80 °C for 1 h. The mixture was cooled and quantitatively transferred to a volumetric flask, and the volume was adjusted to 25 mL. The mixture was filtered through filter paper, and 1 mL of the resulting solution was transferred to a 25 mL volumetric flask, to which were added 2.5 mL of saturated Na2CO3 solution and 0.25 mL of diluted (1:1) Folin–Ciocâlteu reagent (ACS Chemicals, NJ, USA). The volume was brought to 25 mL with distilled water. One hour later, the solutions were analyzed through a spectrophotometer (Unico 2804 UV, Suite E, Dayton, NJ, USA), and the concentration of polyphenols was calculated according to the absorption of the reaction mixture at 730 nm. As an external standard, 0.02% gallic acid (WEGO Chem. Group, NY, USA) was used. The results were expressed as mg of Gallic Acid Equivalent per g of dry weight (mg GAE g−1 d.w).

3.7. Proline

Proline concentration was determined according to Ábrahám et al. [36] with a small modification. About 0.05 g of dry onion inner scales homogenate were ground with 10 mL 3% sulfosalicylic acid. The mixture was filtered, and 1 mL of filtrate was mixed with 2 mL of ninhydrin reagent and 2 mL of acetic acid. The resulting solution was heated at 95 °C during an hour. Proline concentration was determined, using the absorption value at 505 nm and a calibration curve built, using proline (Merck, Darmstadt, Germany) solutions with five different concentrations.

3.8. Malonic Dialdehyde (MDA)

About 100 mg of dry inner/outer scales homogenate were heated with 5 mL of 0.5% thiobarbituric acid solution, containing 10% of trichloroacetic acid, at 95 °C during half an hour. The resulting mixture was cooled and filtered, and light absorption value at 532 nm was measured using a spectrophotometer (Unico 2804 UV, Suite E, Dayton, NJ, USA). Malonic dialdehyde concentration was determined, using the extinction value, equal to 155 [37].

3.9. Sugars

Monosaccharides were determined, using the ferricyanide colorimetric method, based on the reaction of monosaccharides with potassium ferricyanide [38]. Total sugars were analogically determined after acidic hydrolysis of water extracts with 20% hydrochloric acid. Fructose was used as an external standard. The results were expressed in % per dry weight.

3.10. Non-Polar Lipophilic Compounds (Lipids)

About 0.1 g of dry inner/outer scales homogenate was mixed with 10 mL of hexane and left at room temperature for 24 h. Lipids concentration was determined using the absorption value at 260 nm and a calibration curve of hexane paraffin solution with different concentrations. The results were expressed in mg-eq paraffin per g of dry weight.

3.11. Statistical Analysis

Data were processed by analysis of variance and mean separations were performed through the Duncan’s multiple range test, with reference to 0.05 probability level, using SPSS software version 27 (Armonk, NY, USA). The mean values of three replicates were presented in this investigation.

4. Conclusions

The present results indicate the complex frame of onion protection against water excess, involving morphological changes; lipids, AOA, and TP distribution between inner and outer bulb scales; and monosaccharides and proline changes in the inner scales. In addition to plant morphological differences under diverse humidity conditions, special biochemical parameters are highly useful. The results entail that MDA and non-polar compounds distribution between inner and outer onion scales, as well as proline levels in plant seeds, may provide promising tools to evaluate plant adaptability under different environmental conditions. Further investigations are needed to confirm the feasibility of this procedure to evaluate the degree of onion adaptability to soil water excess.

Author Contributions

Conceptualization, N.G., L.K. and G.C.; formal analysis, O.C.M., L.V. and S.B.H.; investigation, N.G., O.R., V.R., T.S. and L.K.; methodology, T.S., O.C.M. and S.B.H.; validation, L.V. and G.C.; draft manuscript writing, N.G., L.K. and G.C.; manuscript revision and final editing, N.G., V.R., O.R. and G.C. All authors have read and agreed to the published version of the manuscript.

Funding

This research received no external funding.

Data Availability Statement

Not applicable.

Conflicts of Interest

The authors declare no conflict of interest.

References

  1. FAO (Food and Agriculture Organization of the United Nations). FAOSTAT Statistics Division. Rome, Italy. 2020. Available online: http://www.fao.org/faostat/en/#data (accessed on 29 May 2023).
  2. Golubkina, N.; Caruso, G. Allium cepa. In Nutritional Composition and Antioxidant Properties of Fruits and Vegetables; Jaiswal, A., Ed.; Academic Press: Dublin, Ireland, 2020; Chapter 5; pp. 73–87. [Google Scholar] [CrossRef]
  3. Ghodke, P.H.; Shirsat, D.V.; Thangasamy, A.; Mahajan, V.; Salunkhe, V.N.; Khade, Y.; Singh, M. Effect of water logging stress at specific growth stages in onion crop. Int. J. Curr. Microbiol. Appl. Sci. 2018, 7, 3438–3448. [Google Scholar] [CrossRef] [Green Version]
  4. Pasley, H.R.; Huber, I.; Castellano, M.J.; Archontoulis, S.V. Modeling flood-induced stress in soybeans. Front. Plant Sci. 2020, 11, 62. [Google Scholar] [CrossRef] [Green Version]
  5. Nishiuchi, S.; Yamauchi, T.; Takahashi, H.; Kotula, L.; Nakazono, M. Mechanisms for coping with submergence and waterlogging in rice. Rice 2012, 5, 2. [Google Scholar] [CrossRef] [Green Version]
  6. Posso, D.A.; Borella, J.; Reissig, G.N.; Bacarin, M.A. Root flooding induced changes in the dynamic dissipation of the photosynthetic energy of common bean plants. Acta Physiol. Plant. 2018, 40, 212. [Google Scholar] [CrossRef]
  7. Garcia, N.; da-Silva, C.J.; Cocco, K.L.T.; Pomagualli, D.; de Oliveira, F.K.; da Silva, J.V.L.; de Oliveira, A.C.B.; de Amarante, L. Waterlogging tolerance of five soybean genotypes through different physiological and biochemical mechanisms. Environ. Experim. Bot. 2020, 172, 103975. [Google Scholar] [CrossRef]
  8. Dubey, S.; Kuruwanshi, V.B.; Bhagat, K.P.; Ghodke, P.H. Impact of Excess Moisture in Onion Genotypes (Allium cepa L.) under Climate Change Scenario. Int. J. Curr. Microbiol. Appl. Sci. 2021, 10, 166–175. [Google Scholar] [CrossRef]
  9. Dubey, S.; Kuruwanshi, V.B.; Ghodke, P.H.; Mahajan, V. Biochemical and yield evaluation of onion (Allium cepa L.) genotypes under waterlogging condition. Int. J. Chem. Stud. 2020, 8, 2036–2040. [Google Scholar] [CrossRef]
  10. Wakchaure, G.C.; Minhas, P.S.; Kumar, S.; Khapte, P.S.; Rane, J.; Reddy, K.S. Bulb productivity and quality of monsoon onion (Allium cepa L.) as affected by transient waterlogging at different growth stages and its alleviation with plant growth regulators. Agr. Water Manag. 2023, 278, 108136. [Google Scholar] [CrossRef]
  11. Yiu, J.C.; Liu, C.W.; Fang, D.Y.; Lai, Y.S. Waterlogging tolerance of Welsh onion (Allium fistulosum L.) enhanced by exogenous spermidine and spermine. Plant Physiol. Biochem. 2009, 47, 710–716. [Google Scholar] [CrossRef]
  12. Pál, M.; Tajti, J.; Szalai, G.; Peeva, V.; Végh, B.; Janda, T. Interaction of polyamines, abscisic acid and proline under osmotic stress in the leaves of wheat plants. Sci. Rep. 2018, 8, 12839. [Google Scholar] [CrossRef] [Green Version]
  13. Gedam, P.A.; Shirsat, D.V.; Arunachalam, T.; Ghosh, S.; Gawande, S.J.; Mahajan, V.; Gupta, A.J.; Singh, M. Screening of onion (Allium cepa L.) genotypes for waterlogging tolerance. Front. Plant Sci. 2022, 12, 727262. [Google Scholar] [CrossRef]
  14. Sagar, N.A.; Pareek, S.; Benkeblia, N.; Xiao, J. Onion (Allium cepa L.) bioactives: Chemistry, pharmacotherapeutic functions, and industrial applications. Food Front. 2022, 3, 380–412. [Google Scholar] [CrossRef]
  15. Caruso, G.; Conti, S.; Villari, G.; Borrelli, C.; Melchionna, G.; Minutolo, M.; Russo, G.; Amalfitano, C. Effects of transplanting time and plant density on yield, quality and antioxidant content of onion (Allium cepa L.) in southern Italy. Sci. Hortic. 2014, 166, 111–120. [Google Scholar] [CrossRef]
  16. Galsurker, O.; Doron-Faigenboim, A.; Teper-Bamnolker, P.; Daus, A.; Fridman, Y.; Lers, A.; Eshel, D. Cellular and molecular changes associated with onion skin formation suggest involvement of programmed cell death. Front. Plant Sci. 2017, 7, 2031. [Google Scholar] [CrossRef] [PubMed] [Green Version]
  17. Pelter, G.Q.; Mittelstadt, R.; Leib, B.G.; Redulla, C.A. Effects of water stress at specific growth stages on onion bulb yield and quality. Agric. Water Manag. 2004, 68, 107–115. [Google Scholar] [CrossRef]
  18. Wakchaure, G.C.; Khapte, P.S.; Kumar, S.; Kumar, P.S.; Sabatino, L.; Kumar, P. Exogenous growth regulators and water stress enhance long-term storage quality characteristics of onion. Agronomy 2023, 13, 297. [Google Scholar] [CrossRef]
  19. Kurganova, O.P.; Yavkina, E.N. Sitnikova GV Review of hydrological peculiarities of the flooding in the Amur region with the purpose to establish a complex of sanitary anti- epidemic actions of minimization of social implication. Rospotrebnadzor Act. Emerg. 2014, 1, 29–32. [Google Scholar]
  20. Dobrutskaya, E.G.; Antoshkin, A.A.; Agafonov, A.F.; Dubova, M.B. Evaluation of A. cepa breeding material diversity by adaptability, productivity and bulb quality. Gavrish 2008, 4, 33–37. (In Russian) [Google Scholar]
  21. Toscano, S.; Trivellini, A.; Cocetta, G.; Bulgari, R.; Francini, A.; Romano, D.; Ferrante, A. Effect of preharvest abiotic stresses on the accumulation of bioactive compounds in horticultural produce. Front. Plant Sci. 2019, 10, 1212. [Google Scholar] [CrossRef] [Green Version]
  22. Jeandet, P.; Formela-Luboińska, M.; Labudda, M.; Morkunas, I. The role of sugars in plant responses to stress and their regulatory function during development. Int. J. Mol. Sci. 2022, 23, 5161. [Google Scholar] [CrossRef]
  23. Zeng, F.-S.; Yao, Y.-F.; Wang, L.-F.; Li, W.-J. Polysaccharides as antioxidants and prooxidants in managing the double-edged sword of reactive oxygen species. Biomed. Pharmacother. 2023, 159, 114221. [Google Scholar] [CrossRef]
  24. Hayat, S.; Hayat, Q.; Alyemeni, M.N.; Wani, A.S.; Pichtel, J.; Ahmad, A. Role of proline under changing environments: A review. Plant Signal. Behav. 2012, 7, 1456–1466. [Google Scholar] [CrossRef] [Green Version]
  25. Ghosh, U.K.; Islam, M.N.; Siddiqui, M.N.; Cao, X.; Khan, M.A.R. Proline, a multifaceted signalling molecule in plant responses to abiotic stress: Understanding the physiological mechanisms. Plant Biol. 2022, 24, 227–239. [Google Scholar] [CrossRef]
  26. Kijowska-Oberc, J.; Staszak, A.M.; Wawrzyniak, M.K.; Ratajczak, E. Changes in proline levels during seed development of orthodox and recalcitrant seeds of genus Acer in a climate change scenario. Forests 2020, 11, 1362. [Google Scholar] [CrossRef]
  27. Xie, L.-J.; Zhou, Y.; Chen, Q.W.-F.; Xiao, S. New insights into the role of lipids in plant hypoxia responses. Progress Lipid Res. 2021, 81, 101072. [Google Scholar] [CrossRef]
  28. Hou, Q.; Ufer, G.; Bartels, D. Lipid signaling in plant responses to abiotic stress. Plant Cell Environ. 2016, 39, 1029–1048. [Google Scholar] [CrossRef] [PubMed] [Green Version]
  29. Pan, J.; Sharif, R.; Xu, X.; Chen, X. Mechanisms of waterlogging tolerance in plants: Research progress and prospects. Front. Plant Sci. 2021, 11, 627331. [Google Scholar] [CrossRef] [PubMed]
  30. Bello, M.O.; Olabanji, I.O.; Abdul-Hammed, M.; Okunade, T.D. Characterization of domestic onion wastes and bulb (Allium cepa L.): Fatty acids and metal contents. Int. Food Ress. J. 2012, 20, 2153–2158. [Google Scholar]
  31. Tsiaganis, M.C.; Laskari, K.; Melissari, E. Fatty acid composition of Allium species lipids. J. Food Comp. Anal. 2006, 19, 620–627. [Google Scholar] [CrossRef]
  32. Alché, J.D. A concise appraisal of lipid oxidation and lipoxidation in higher plants. Redox Biol. 2019, 23, 101136. [Google Scholar] [CrossRef]
  33. Tian, L.; Zhang, Y.; Chen, P.; Zhang, F.; Li, J.; Yan, F.; Dong, Y.; Feng, B. How does the waterlogging regime affect crop yield? A global meta-analysis. Front. Plant Sci. 2021, 12, 634898. [Google Scholar] [CrossRef] [PubMed]
  34. ISO (3166)004-97; Method of Dry Matter Determination. Standartinform: Moscow, Russia, 2012.
  35. Golubkina, N.A.; Kekina, H.G.; Molchanova, A.V.; Antoshkina, M.S.; Nadezhkin, S.M.; Soldatenko, A.V. Plants Antioxidants and Methods of Their Determination; Infra-M: Moscow, Russia, 2020; (In Russian). [Google Scholar] [CrossRef]
  36. Ábrahám, E.; Hourton-Cabassa, C.; Erdei, L.; Szabados, L. Methods for determination of proline in plants. In Plant Stress Tolerance. Methods in Molecular Biology (Methods and Protocols); Sunkar, R., Ed.; Humana Press: Totowa, NJ, USA, 2010; Volume 639, Chapter 20, pp. 317–331. [Google Scholar] [CrossRef]
  37. Heath, R.L.; Parker, L. Photoperoxidation in isolated chloroplasts. I. Kinetics and stoichiometry of fatty acid peroxidation. Arch. Biochem. Biophys. 1968, 125, 189–198. [Google Scholar] [CrossRef] [PubMed]
  38. Swamy, P.M. Laboratory Manual on Biotechnology; Rastogi: New Delhi, India, 2008; p. 617. [Google Scholar]
Figure 1. Differences between leaf length and number, and bulb diameter between onion cultivars, grown in conditions of humidity excess at late (A) and early (B) phenological stage. For each cultivar, the values with the same letters do not differ statistically according to Duncan test at p < 0.05.
Stresses 03 00038 g001
Figure 2. Percentage of monosaccharides out of the total sugar level in A. cepa bulbs under waterlogging at different phenological phases. A: water stress at the end of the vegetation period; and B: water stress at the beginning of the vegetation period. For each cultivar, values with the same letters do not differ statistically according to Duncan test at p < 0.05.
Stresses 03 00038 g002
Figure 3. Proportion of polyphenol content (TP) within total antioxidant activity (AOA) of onion outer and inner scales. (a) water stress at the end of the vegetation period; and (b) water stress at the beginning of the vegetation period. For each cultivar, values with the same letters do not differ statistically according to Duncan test at p < 0.05.
Stresses 03 00038 g003
Figure 4. Outer/inner scale lipids ratio in onion cultivated under high humidity at late (A) or early (B) phenological stage. For each cultivar, values with the same letters do not differ statistically according to Duncan test at p < 0.05.
Stresses 03 00038 g004
Figure 5. Differences of MDA inner/outer ratio under waterlogging at different phenological phases. A: water stress at the end of the vegetation period; and B: water stress at the beginning of the vegetation period. For each cultivar, values with the same letters do not differ statistically according to Duncan test at p < 0.05.
Stresses 03 00038 g005
Figure 6. Correlation between bulb weight and antioxidant protection parameters (AOA: total antioxidant activity; TP: total phenolics; Pro: proline; and MS: monosaccharides); * p < 0.001, ** p < 0.01, *** p < 0.05.
Stresses 03 00038 g006
Figure 7. Average monthly precipitation (a) and temperature (b) in the Amur and Moscow regions.
Stresses 03 00038 g007
Table 1. Morphological characteristics of five Allium cepa cultivars, grown in different ecological conditions.
ParameterWater Stress Zolotie CupolaZolot-NichokMyach-KovskyGlobusBlack
Prince
M ± SDCV (%)
Leaf length
(cm)
A55.4 c58.5 bc52.1 c51.8 c58.7 bc56.1 ± 3.25.7
B67.1 a69.5 a66.8 a69.0 a68.1 ab68.1 ± 1.21.8
Leaves numberA8.2 abc7.5 d6.0 d6.3 d7.4 cd7.1 ± 0.913.0
B10.2 a10.1 a9.8 ab10.3 a10.2 q10.1 ± 0.22.0
Bulb diameter (cm)A5.1 b4.7 b5.3 b4.9 b4.9 b5.0 ± 0.24.0
B7.3 a7.2 a7.2 a6.8 a7.3 a7.2 ± 0.22.8
Bulb height (cm)A4.2 cd4.8 bc3.9 d5.0 abc5.0 abc4.6 ± 0.510.9
B5.2 ab5.8 a4.3 cd6.0 a5.7 ab5.4 ± 0.713.0
Bulb shape
index
A0.80 b1.00 a0.70 c1.00 a1.00 a0.9 ± 0.111.1
B0.72 c0.81 ab0.59 d0.87 a0.78 bc0.75 ± 0.113.3
Bulb weight
(g)
A68.9 b67.5 b65.5 b78.4 b70.0 b70.1 ± 6.79.3
B127.0 a141.2 a114.3 a129.3 a137.1 a129.8 ± 10.48.0
A: water stress at the end of the vegetation period; and B: water stress at the beginning of the vegetation period. For each parameter, values with the same letters do not differ statistically according to Duncan test at p < 0.05.
Table 2. Dry matter and sugar content in A. cepa bulbs.
ParameterWater
Stress
Zolotie
Cupola
Zolot-NichokMyach-KovskyGlobusBlack PrinceM ± SDCV (%)
Dry matter (%)A13.6 ab10.2 c13.4 ab13.8 ab12.5 bc 12.7 ± 1.511.8
B15.0 a15.0 a15.5 a14.1 a14.6 a14.8 ± 0.53.4
Monosaccharides (%)A3.4 a3.0 ab3.5 a3.5 a3.0 ab3.3 ± 0.39.1
B2.4 c2.2 c2.3 c2.6 bc2.6 bc2.4 ± 0.28.3
Total sugar (%)A7.9 bc6.5 d6.9 cd6.7 cd6.4 d6.9 ± 0.68.7
B10.9 a8.25 b11.1 a11.0 a9.1 ab10.1 ± 1.312.9
A: water stress at the end of the vegetation period; and B: water stress at the beginning of the vegetation period. For each parameter, values with the same letters do not differ statistically according to Duncan test at p < 0.05.
Table 3. Antioxidant activity and polyphenol content in onion inner and outer scales (mg GAE g−1 d.w.).
ParameterWater StressZolotie
Cupola
Zolot-NichokMyach-KovskyGlobusBlack PrinceM ± SDCV (%)
AOA
Inner scales
A45.4 a45.9 a42.6 ab35.9 bc36.9 bc41.3 ± 4.210.2
B28.6 d28.0 d34.0 c28.1 d27.0 d29.2 ± 7.124.3
AOA
Outer scales
A121.7 b129.5 b157.8 a145.1 ab148.7 a140.6 ± 13.19.3
B129.2 b138.1 ab168.4 a145.4 ab157.0 a147.6 ± 13.89.8
AOA outer/
inner scales
A2.682.823.704.044.033.39 ± 0.6418.9
B4.524.934.955.175.815.08 ± 0.479.2
TP
Inner scales
A19.4 a19.9 a19.2 a18.2 a17.1 a18.8 ± 1.05.3
B13.9 b15.3 b15.3 b15.2 b15.9 b15.1 ± 2.113.9
TP
Outer scales
A27.4 a24.7 a25.8 a26.7 a28.3 a26.6 ± 1.23.8
B25.9 a24.6 a24.6 a26.1 a25.9 a25.4 ± 1.13.1
A: water stress at the end of the vegetation period; and B: water stress at the beginning of the vegetation period. For each parameter, values with the same letters do not differ statistically according to Duncan test at p < 0.05.
Table 4. Accumulation of proline (mg g−1) in bulb inner scales and seeds of A. cepa.
ParameterWater StressZolotie
Cupola
Zolot-NichokMyach-KovskyGlobusBlack PrinceM ± SDCV (%)
Inner Scales
proline
A1.92 b1.66 c2.30 a1.37 c0.97 d1.64 ± 0.5131.1
B0.95 d0.96 d1.34 c0.95 d0.73 e0.99 ± 0.2222.2
A/B proline ratioA2.021.731.721.441.331.65 ± 0.2414.5
Seeds prolineB1.13 a1.12 a0.86 b0.89 b1.12 a1.01 ± 0.1010.0
Seeds/bulb
proline ratio
A0.540.670.370.651.150.68 ± 0.1927.9
B1.081.170.640.941.531.07 ± 0.2321.5
A: water stress at the end of the vegetation period; and B: water stress at the beginning of the vegetation period. Along each line, values with the same letters do not differ statistically according to Duncan test at p < 0.05.
Table 5. Accumulation of non-polar lipids in inner and outer scales of A. cepa bulbs (mg-eq paraphine g−1 d.w.).
ParameterWater StressZolotie CupolaZolot-NichokMyach-KovskyGlobusBlack PrinceM ± SDCV (%)
Inner scalesA19.3 a 18.2 a12.7 c12.7 c18.8 bc16.4 ± 3.320.1
B19.7 a19.3 a15.3 b15.8 b22.0 a18.4 ± 3.016.3
Outer scalesA23.4 ab26.7 ab26.1 ab25.1 ab27.3 a25.7 ± 1.45.4
B22.1 b22.9 b23.0 ab24.2 ab24.5 ab23.3 ± 1.77.3
A: water stress at the end of the vegetation period; and B: water stress at the beginning of the vegetation period. For each parameter and each line, values with the same letters do not differ statistically according to Duncan test at p < 0.05.
Table 6. MDA accumulation in inner and outer scales of onion bulbs (µM g−1 d.w.).
Water StressZolotie
Cupola
Zolot-NichokMyach-KovskyGlobusBlack PrinceM ± SDCV (%)
Inner scalesA0.82 a0.86 a0.94 a0.86 a0.84 a0.86 ± 0.044.7
B0.80 a0.81 a0.86 a0.86 a0.80 a0.83 ± 0.044.8
Outer scalesA0.5 ab0.46 b0.56 a0.48 ab0.50 a0.49 ± 0.048.2
B0.48 ab0.44 bc0.42 bc0.38 c0.47 ab0.43 ± 0.0511.6
A: water stress at the end of the vegetation period; and B: water stress at the beginning of the vegetation period. For each parameter, values with the same letters do not differ statistically according to Duncan test at p < 0.05.
Table 7. Climate parameters in the Russian regions of Moscow and Amur.
ParameterMoscow RegionAmur Region
Geographical coordinates55°39.51′ N, 37°12.23′ E50°19′09″ N, 127°44′12″ E
ClimateTemperate continentalMonsoon
Mean annual temperature (°C)+6.3−1.3
Mean annual precipitation (mm)708550
Mean annual radiation (hours)17312400
Disclaimer/Publisher’s Note: The statements, opinions and data contained in all publications are solely those of the individual author(s) and contributor(s) and not of MDPI and/or the editor(s). MDPI and/or the editor(s) disclaim responsibility for any injury to people or property resulting from any ideas, methods, instructions or products referred to in the content.

