Article

Fertilisation with Potassium Silicate Exerted Little Effect on Production Parameters of Cucumbers Exposed to UV and Drought

Biotechnical Faculty, University of Ljubljana, 1000 Ljubljana, Slovenia
*
Author to whom correspondence should be addressed.
Stresses 2021, 1(3), 142-161; https://doi.org/10.3390/stresses1030012
Submission received: 16 June 2021 / Revised: 13 August 2021 / Accepted: 16 August 2021 / Published: 19 August 2021
(This article belongs to the Special Issue Stress Responses in Crops)

Abstract

:
(1) Background: Cucumbers are highly sensitive to drought and UV-B radiation, which may also act synergistically. Silicon is a beneficial element for plants, as it can alleviate negative effects of different environmental constraints. Studies revealed that fertilisation of cucumbers with silicon showed a variety of positive effects, which increased plant vitality. The aim of this study was to investigate the role of potassium silicate in shaping cucumber traits and in mitigating potential adverse effects of drought and UV radiation. (2) Methods: Plants were exposed to different treatments regarding water availability, UV radiation, and potassium silicate addition. During the experiment, the level of plant-available silicon and total silicon content in the soil were monitored along with soil moisture. At the end of the experiment, the leaf element composition, leaf biochemical and leaf physiological properties were analysed in addition to growth and production parameters of these cucumbers. (3) Results: Among the three studied factors, insufficient water supply had the most negative impact on measured parameters, causing a significant decline in cucumber growth and production. UV radiation had an adverse impact on various studied parameters, while potassium silicate addition negatively affected production parameters. Fertilisation with potassium silicate increased the level of plant-available silicon in the soil and leaf silicon content. (4) Conclusions: Fertilisation with potassium silicate exerted little impact on production parameters of cucumbers exposed to ambient UV radiation and drought. Significant interactions between the studied factors were detected for the aboveground vegetative plant parts.

1. Introduction

Silicon (Si) is a beneficial element not only for grasses, where it presents a crucial structural component, but also for many eudicots [1,2]. Si alleviates negative effects of numerous abiotic and biotic environmental stressors, for example metal toxicity [3,4], and herbivore and pathogen attacks [5,6]. Moreover, it has a beneficial role in plant water management [7] and plant nutrition [8,9]. Si incrustations at the leaf surface may have an important role in protection against enhanced UV radiation [10,11]. Si deficiency in plants results in a lower plant biomass, necrotic and chlorotic leaves, an accelerated senescence process, and a reduced tolerance to pathogens and herbivores [12].
A high Si level in the soil does not necessarily indicate a sufficient amount of plant-available Si in the soil [13,14]. The availability of Si for plants is strongly affected by soil age and its properties, such as pH and the content of clay, organic matter, and different minerals [15]. It is often limited as a result of leaching due to rainfall and irrigation, and because it is bound with, for example, phosphorus and organic carbon. Phytogenic biogenic amorphous Si is an especially important source of bioavailable Si [16]. It plays an important role in drought alleviation, as it significantly increases soil water holding capacity [17]. Nevertheless, Si cycling and, thus, plant-available Si in the soil are now affected on a global level, as biogenic amorphous Si in agricultural systems is being exported due to crop harvesting and increased erosion rates [16].
Fertilisation with Si can rapidly increase the concentration of silicic acid (H4SiO4) in the soil [18]. However, a fertilisation regime and soil properties might significantly affect the absorption of Si [19]. Inconsistent Si absorption by plants is one of the most intriguing facts regarding Si nutrition [20]. The efficiency of uptake of H4SiO4 from the soil solution into plants is species-specific and follows different strategies, namely, rejective, passive, or active [21]. Si uptake is also strongly affected by different environmental factors, including water shortage [22,23,24,25], and even by UV radiation [26,27]. Water shortage can significantly reduce the uptake of Si [21,22,23] and can negatively affect overall crop production [28]. According to one model, the yield of all major crops will likely be reduced by almost 90% by 2100 due to drought [29]. Drought stress can affect the uptake of essential and beneficial elements from the soil. In addition, it may damage membranes of plant cells, inhibit photosynthesis, and affect cell division as well as the cell wall architecture [30], eventually leading to a decrease in plant biomass and yield [28]. UV radiation is an environmental factor that can trigger specific plant traits, such as an increased production of UV-absorbing substances and a compact leaf structure, which enhance the survival of plants under stress conditions. However, excessive UV-B radiation exerts damaging effects on DNA and chloroplasts and induces the formation of reactive oxygen species (ROS) that can further damage the photosynthetic apparatus [31]. Water shortage and UV radiation may act synergistically, as plant resistance to drought is positively related to plant resistance to UV radiation, and vice versa [32]. Recent studies showed that besides being a plant stressor, UV radiation also plays an important role in plant growth and development [33]. Nowadays, however, agricultural practices often exclude UV as an environmental factor in greenhouses or by protecting the plants against hail and herbivores using different covers, which might have adverse effects on plants.
The disposability of Si in the soil is strongly affected by the present agricultural practices. Annual amount of globally removed Si by different crops is estimated to be between 210 and 224 million tons [34], which can result in a decrease in plant-available Si in the soil. Si application is considered as an environmentally friendly practice for increasing crop production [35] and is becoming an important strategy in preventing different stresses [36].
Cucumber (Cucumis sativus L.) is a Si-accumulating eudicot [37] and an important vegetable cultivated on large areas worldwide [38]. Si uptake into cucumber roots is an active process that follows the Michaelis curve and is not concentration-dependent [39]. More than 50% of the Si taken up by roots is transferred to the shoots [37]. Xylem loading of Si in cucumbers is mediated by passive diffusion [1]. Fertilisation of cucumbers with Si showed a variety of positive effects that increased plant vitality [35]. It promotes antifungal activity in cucumber leaves infected by mildew, which is attributed to a phytoalexin identified as a flavonol aglycone rhamnetin [40] that modifies the expression of genes for specific protective enzymes [36]. Si also improves antioxidant potential, photosynthesis [41], and growth under stress due to an excess of nitrate [38]. Si enhances salt tolerance by upregulating the expression of aquaporin genes and, thus, increasing the efficiency of water uptake by roots [42]. Cucumbers are highly sensitive to drought [43] and UV-B radiation [44,45]. A combined treatment with UV-B and drought revealed a synergistic effect of the two factors on cucumbers [46]. In the case of soybean seedlings, the physiological and biochemical response indicated that UV-B radiation had more adverse effects on growth than drought, and that Si mitigated this damage [47].
In the present study, we subjected cucumbers to various treatments regarding light conditions (ambient and reduced UV radiation; the latter simulated the conditions in greenhouses), water availability (sufficient water availability and water shortage), and the presence of Si (fertilisation with potassium silicate (K2SiO3) and naturally available Si). Subsequently, the element composition, leaf biochemical and leaf physiological properties were analysed along with growth and production parameters of these cucumbers. We compared plant responses of cucumbers under these treatments to establish a potential synergy between UV and drought, and to investigate the role of Si in shaping plant traits and in mitigating potential adverse effects of the two environmental factors (UV radiation and water availability).

2. Results

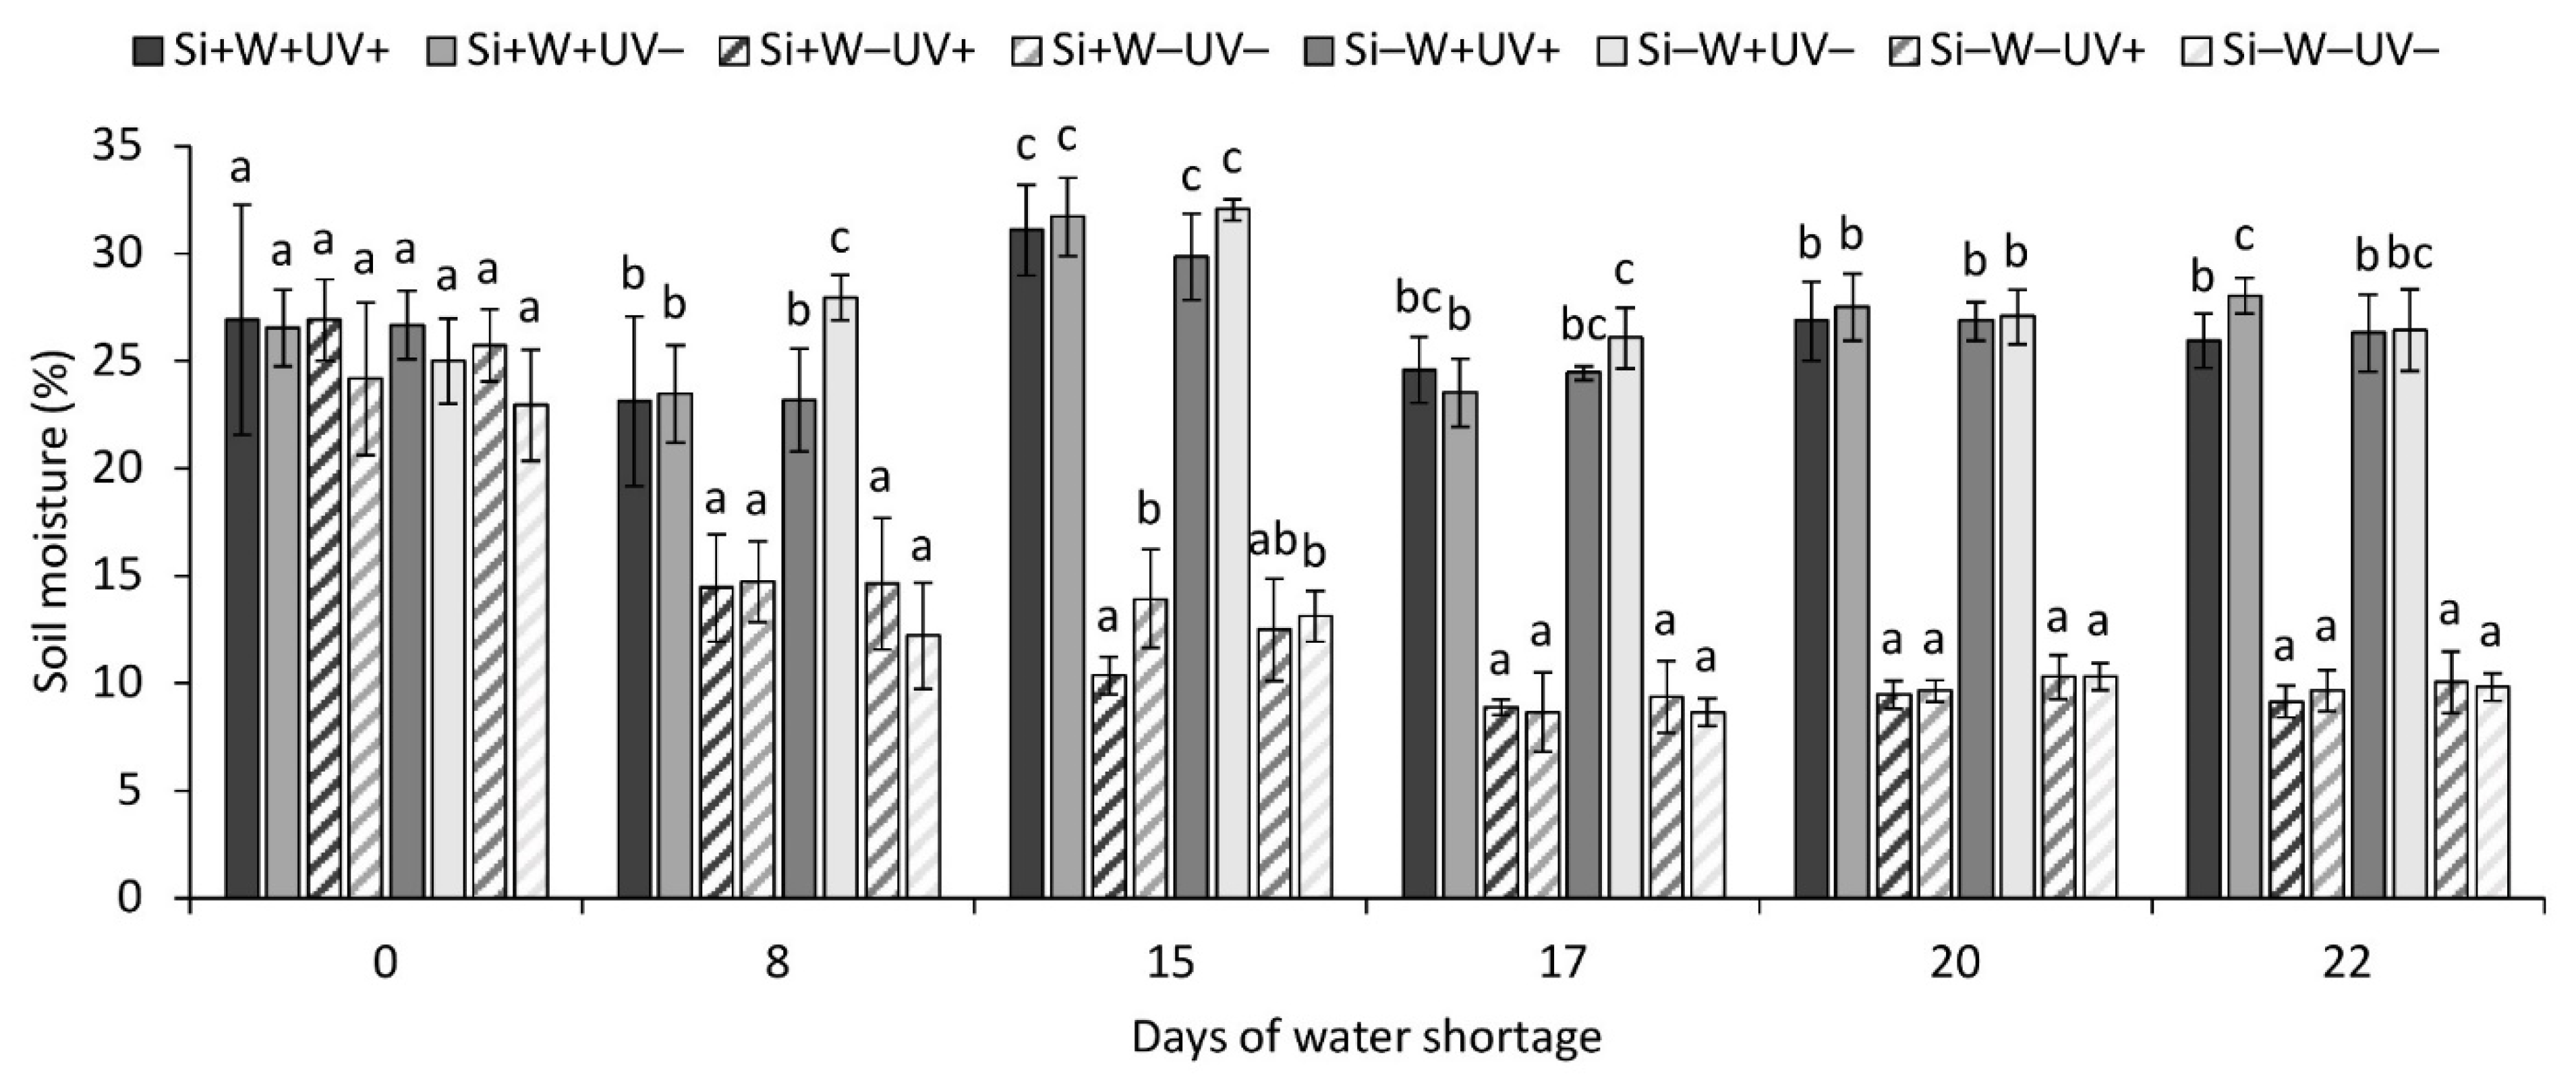
2.1. Environmental Parameters

The overall soil temperature ranged from 22.6 ± 2.9 °C to 23.7 ± 3.6 °C (mean, 22.9 °C; n = 516). During the day, soil temperature ranged from 23.0 ± 3.0 °C to 24.4 ± 4.0 °C (mean, 23.4 °C; n = 307), while during the night, soil temperatures were a bit lower, ranging from 22.0 ± 2.5 °C to 23.6 ± 3.1 °C (mean, 22.5 °C; n = 258). The highest measured values, which were somewhat higher compared to those from all the other treatments, were measured for the Si+W–UV+ treatment. Soil moisture did not differ significantly between the treatments before water shortage, while during water shortage, the difference in soil moisture between the W+ treatments (i.e., Si+W+UV+, Si+W+UV–, Si–W+UV+, Si–W+UV–) and the W– treatments (i.e., Si+W–UV+, Si+W–UV–, Si–W–UV+, Si–W–UV–) was pronounced and significant (p ≤ 0.05; Figure 1). The overall soil moisture during water shortage ranged from 12.0 ± 3.3% to 13.1 ± 4.5% in the four treatments with reduced water availability (mean, 12.7%), and from 25.4 ± 3.4% to 27.1 ± 3.1% in the four treatments with sufficient water availability (mean, 26.0%; n = 25).

2.2. General Observations

With the progression of the experimental period, the cucumber plants from the UV+ treatments were generally smaller and seemed to have a denser habitus than plants from the UV– treatments. In addition, guttation on leaf edges early in the morning was only visible for the W+ leaves and not for the W– leaves. Fruits from the W– pots were often wider on the lower side, resulting in different shapes of the fruits. Especially towards the end of the experimental period, fruits from the W– pots were also softer to the touch, lighter in colour, and had a more pronounced coating compared to the fruits from the W+ pots.

2.3. Leaf Biochemical Traits

For the leaf carotenoid content, there were no significant differences between the treatments. Leaf carotenoids ranged from 0.59 ± 0.18 mg g–1 to 0.90 ± 0.47 mg g−1 (mean, 0.78 mg g−1; n = 10). The leaf chlorophyll a content ranged from 1.99 ± 0.72 mg g−1 to 3.53 ± 1.85 mg g−1 (mean, 2.85 mg g−1; n = 10), while the leaf chlorophyll b content ranged from 1.32 ± 0.51 mg g−1 to 3.28 ± 1.95 mg g−1 (mean, 2.22 mg g−1; n = 10). Factorial ANOVA showed that reduced water availability had a significant positive impact on leaf chlorophyll a and b contents (p ≤ 0.05 for chlorophyll a and p ≤ 0.001 for chlorophyll b). Leaf carotenoids and anthocyanins were significantly affected by the interaction between K2SiO3 addition and water availability (Si × W; p ≤ 0.05 for carotenoids and p ≤ 0.001 for anthocyanins). Under sufficient water availability, these two parameters decreased when K2SiO3 was added, while under water shortage they increased with K2SiO3 addition. Otherwise, the leaf anthocyanin content ranged from 91.38 ± 40.38 a.u. g−1 to 184.42 ± 65.13 a.u. g−1 (mean, 138.49 a.u. g−1; n = 10). Leaf UV-B- and UV-A-absorbing substances contents were positively affected by water shortage (p ≤ 0.001 for both parameters; Table 1 and Table 2). In addition, the leaf UV-B-absorbing substances content was also significantly negatively affected by reduced UV radiation (p ≤ 0.05).
The chlorophyll a to chlorophyll b ratio was significantly negatively affected by water shortage (p ≤ 0.001) and significantly positively affected by reduced UV radiation (p ≤ 0.05; Table 1 and Table 2). The Chlorophyll a to chlorophyll b ratio was also significantly affected by the Si × W interaction (p ≤ 0.01). Under sufficient water availability, it decreased with K2SiO3 addition, while under water shortage it increased under an additional treatment of plants with K2SiO3. The total chlorophyll to carotenoids ratio was significantly positively affected by water shortage, as the total leaf chlorophyll content increased compared to the leaf carotenoid content under reduced water availability (Table 1 and Table 2). As in the case of the chlorophyll a to chlorophyll b ratio, the total chlorophyll to carotenoids ratio was also affected by the Si × W interaction (p ≤ 0.01). An increase with K2SiO3 addition was seen under sufficient water availability, while under water shortage, the total leaf chlorophyll content decreased with K2SiO3 addition in comparison to the leaf carotenoid content.

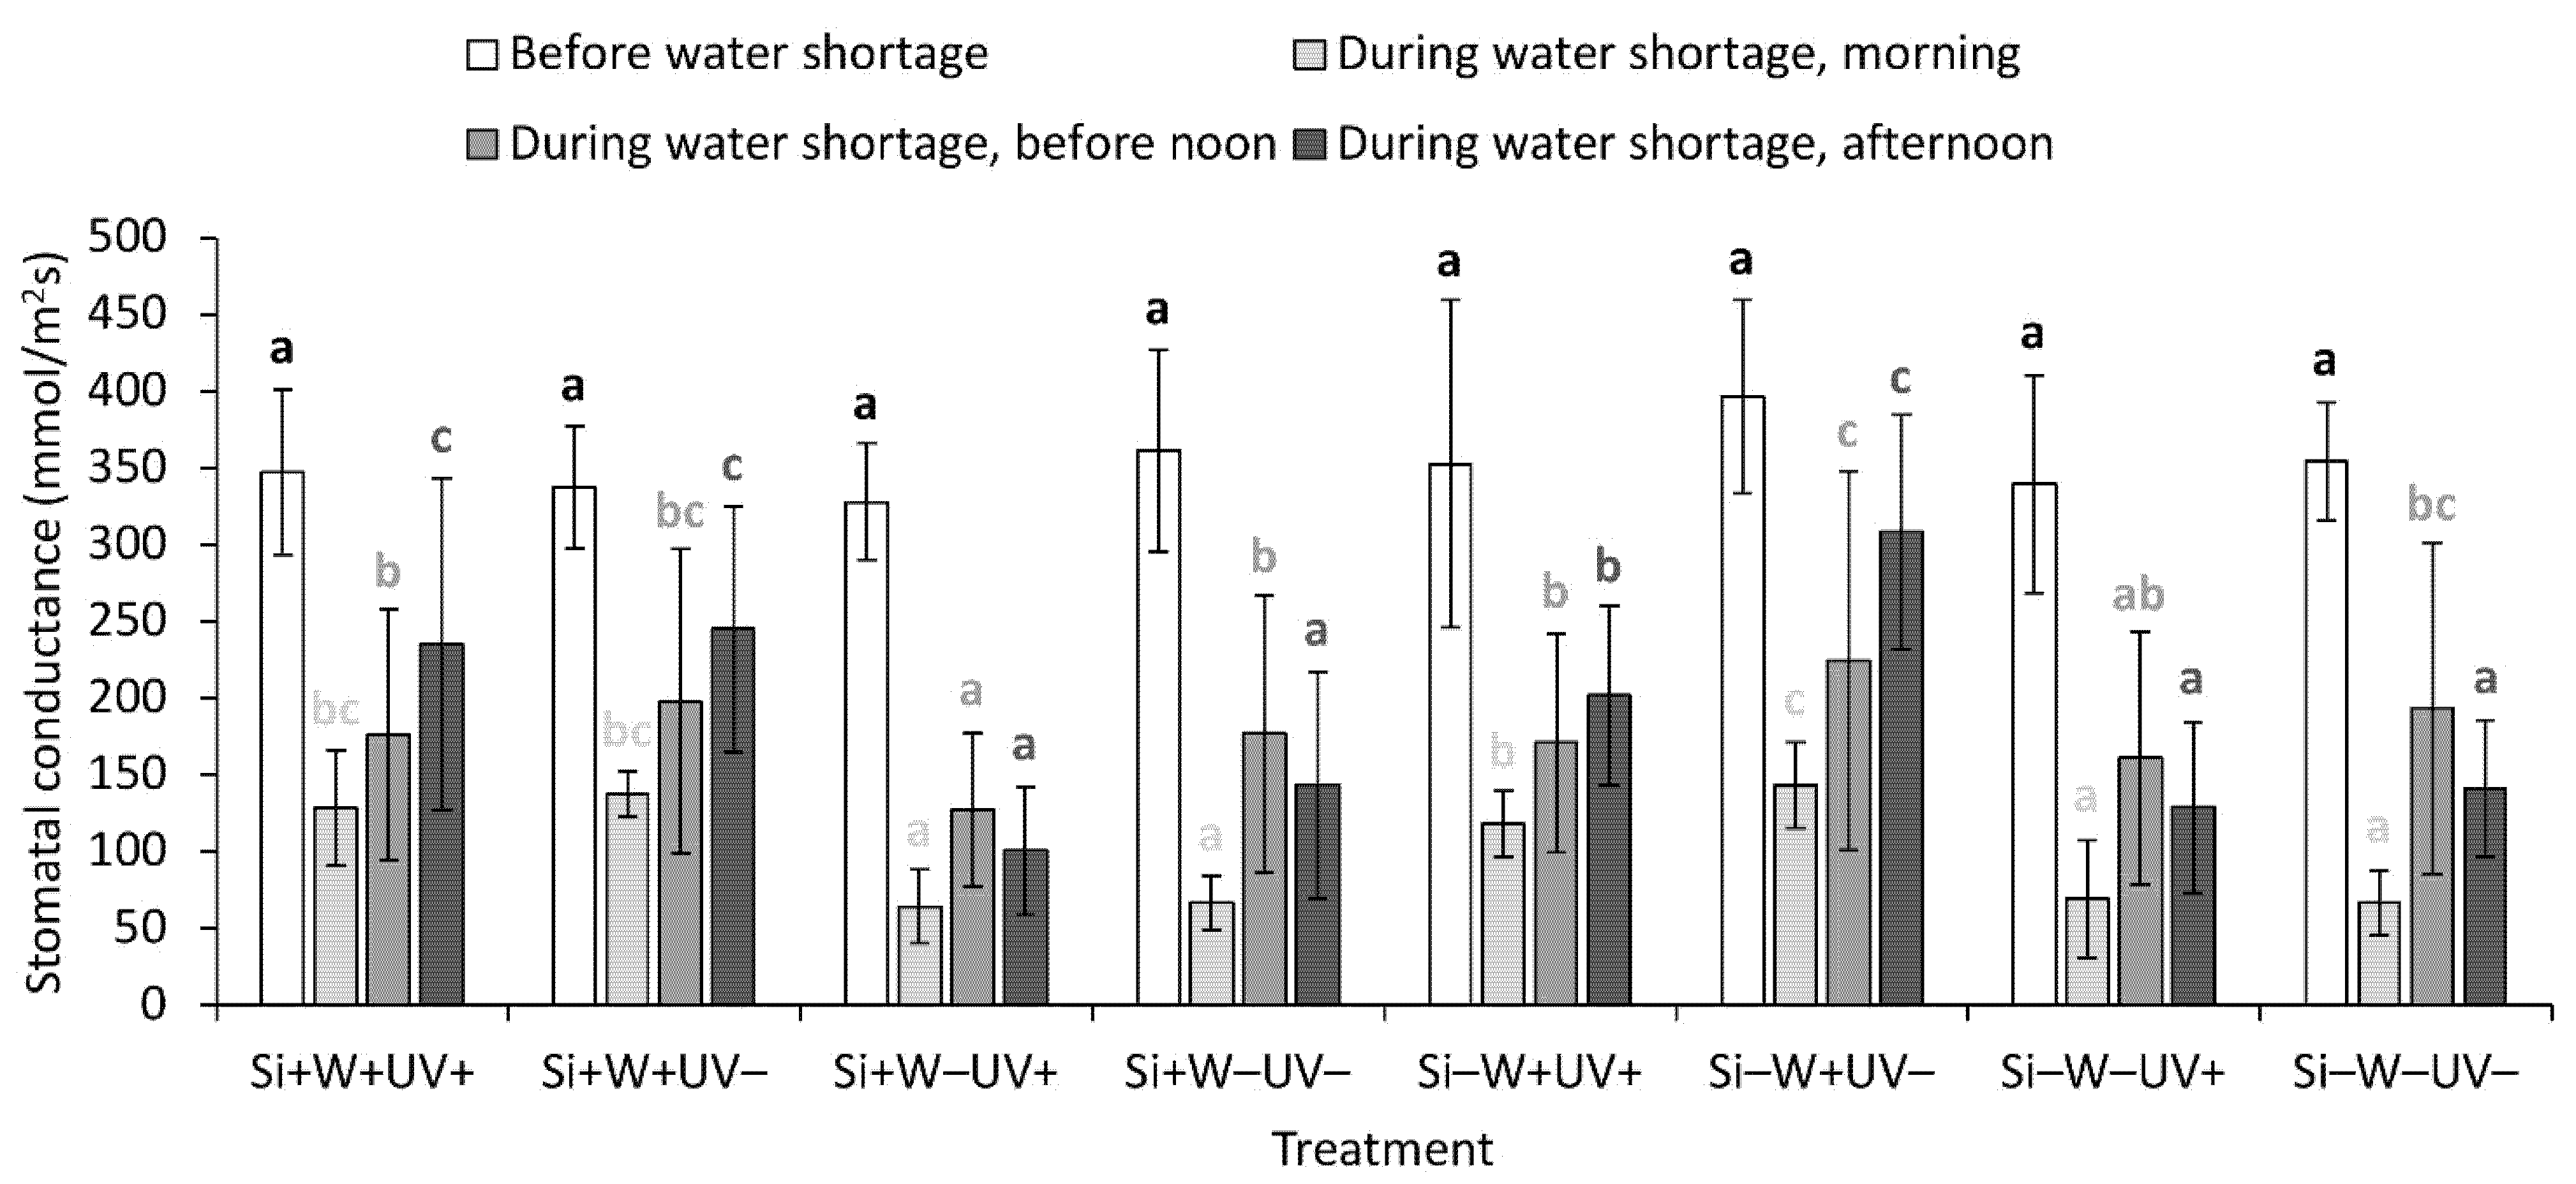
2.4. Leaf Physiological Traits

Photochemical efficiency measurements did not display many significant differences between the eight treatments. According to Fv/Fm, the cucumber plants in this study were not under stress either before or during water shortage. Before water shortage, Fv/Fm ranged from 0.749 ± 0.024 a.u. to 0.767 ± 0.010 a.u. (mean, 0.756 a.u.; n = 20). Fq’/Fm’ before water shortage was rather high and ranged from 0.283 ± 0.079 a.u. to 0.402 ± 0.065 a.u. (mean, 0.335 a.u.; n = 20). During water shortage, the morning measurements for Fv/Fm ranged from 0.749 ± 0.019 a.u. to 0.798 ± 0.007 a.u. (mean, 0.779 a.u.; n = 10). The measurements for Fv/Fm at noon were more variable, ranging from 0.466 ± 0.155 a.u. to 0.743 ± 0.030 a.u. (mean, 0.632 a.u.; n = 20). During the day, the Fv/Fm measurements were again more comparable between the eight treatments, but somehow lower than in the morning, ranging from 0.673 ± 0.040 a.u. to 0.710 ± 0.048 a.u. (mean, 0.689 a.u.; n = 30). Fq’/Fm’ during water shortage was lower compared to the measurements performed before water shortage. It ranged from 0.251 ± 0.078 a.u. to 0.286 ± 0.108 a.u. (mean, 0.266 a.u.; n = 20). Factorial ANOVA revealed a significant impact of water shortage on Fv/Fm during water shortage for the measurements performed in the morning (p ≤ 0.05), at noon (p ≤ 0.01), and during the day (p ≤ 0.05). In the morning and at noon, Fv/Fm was significantly negatively affected by water shortage, while in the afternoon this relation was positive. In addition, Fv/Fm measurements in the morning and at noon were also significantly affected by reduced UV radiation (morning, p ≤ 0.05; noon, p ≤ 0.01), the relation being positive in both cases.
Before water shortage, stomatal conductance did not show any differences between the treatments (Figure 2). These measurements were notably higher compared to the measurements conducted during water shortage. During water shortage, stomatal conductance was significantly negatively affected by reduced water availability in all the three periods of the day (before noon, p ≤ 0.01; morning and afternoon, p ≤ 0.001; Table 2). Before noon and in the afternoon, it was also positively affected by reduced UV radiation (before noon, p ≤ 0.001; afternoon, p ≤ 0.01). For stomatal conductance during water shortage in the afternoon, the interaction between all the three studied factors (i.e., K2SiO3 addition, water availability, ambient UV radiation; Si × W × UV) was also significant (p ≤ 0.05). Under ambient UV radiation, stomatal conductance in the afternoon increased with K2SiO3 addition when water availability was sufficient, while it decreased with K2SiO3 addition under water shortage. On the other hand, under reduced UV radiation, it decreased with K2SiO3 addition under sufficient water availability, and only slightly increased with K2SiO3 addition under water shortage.

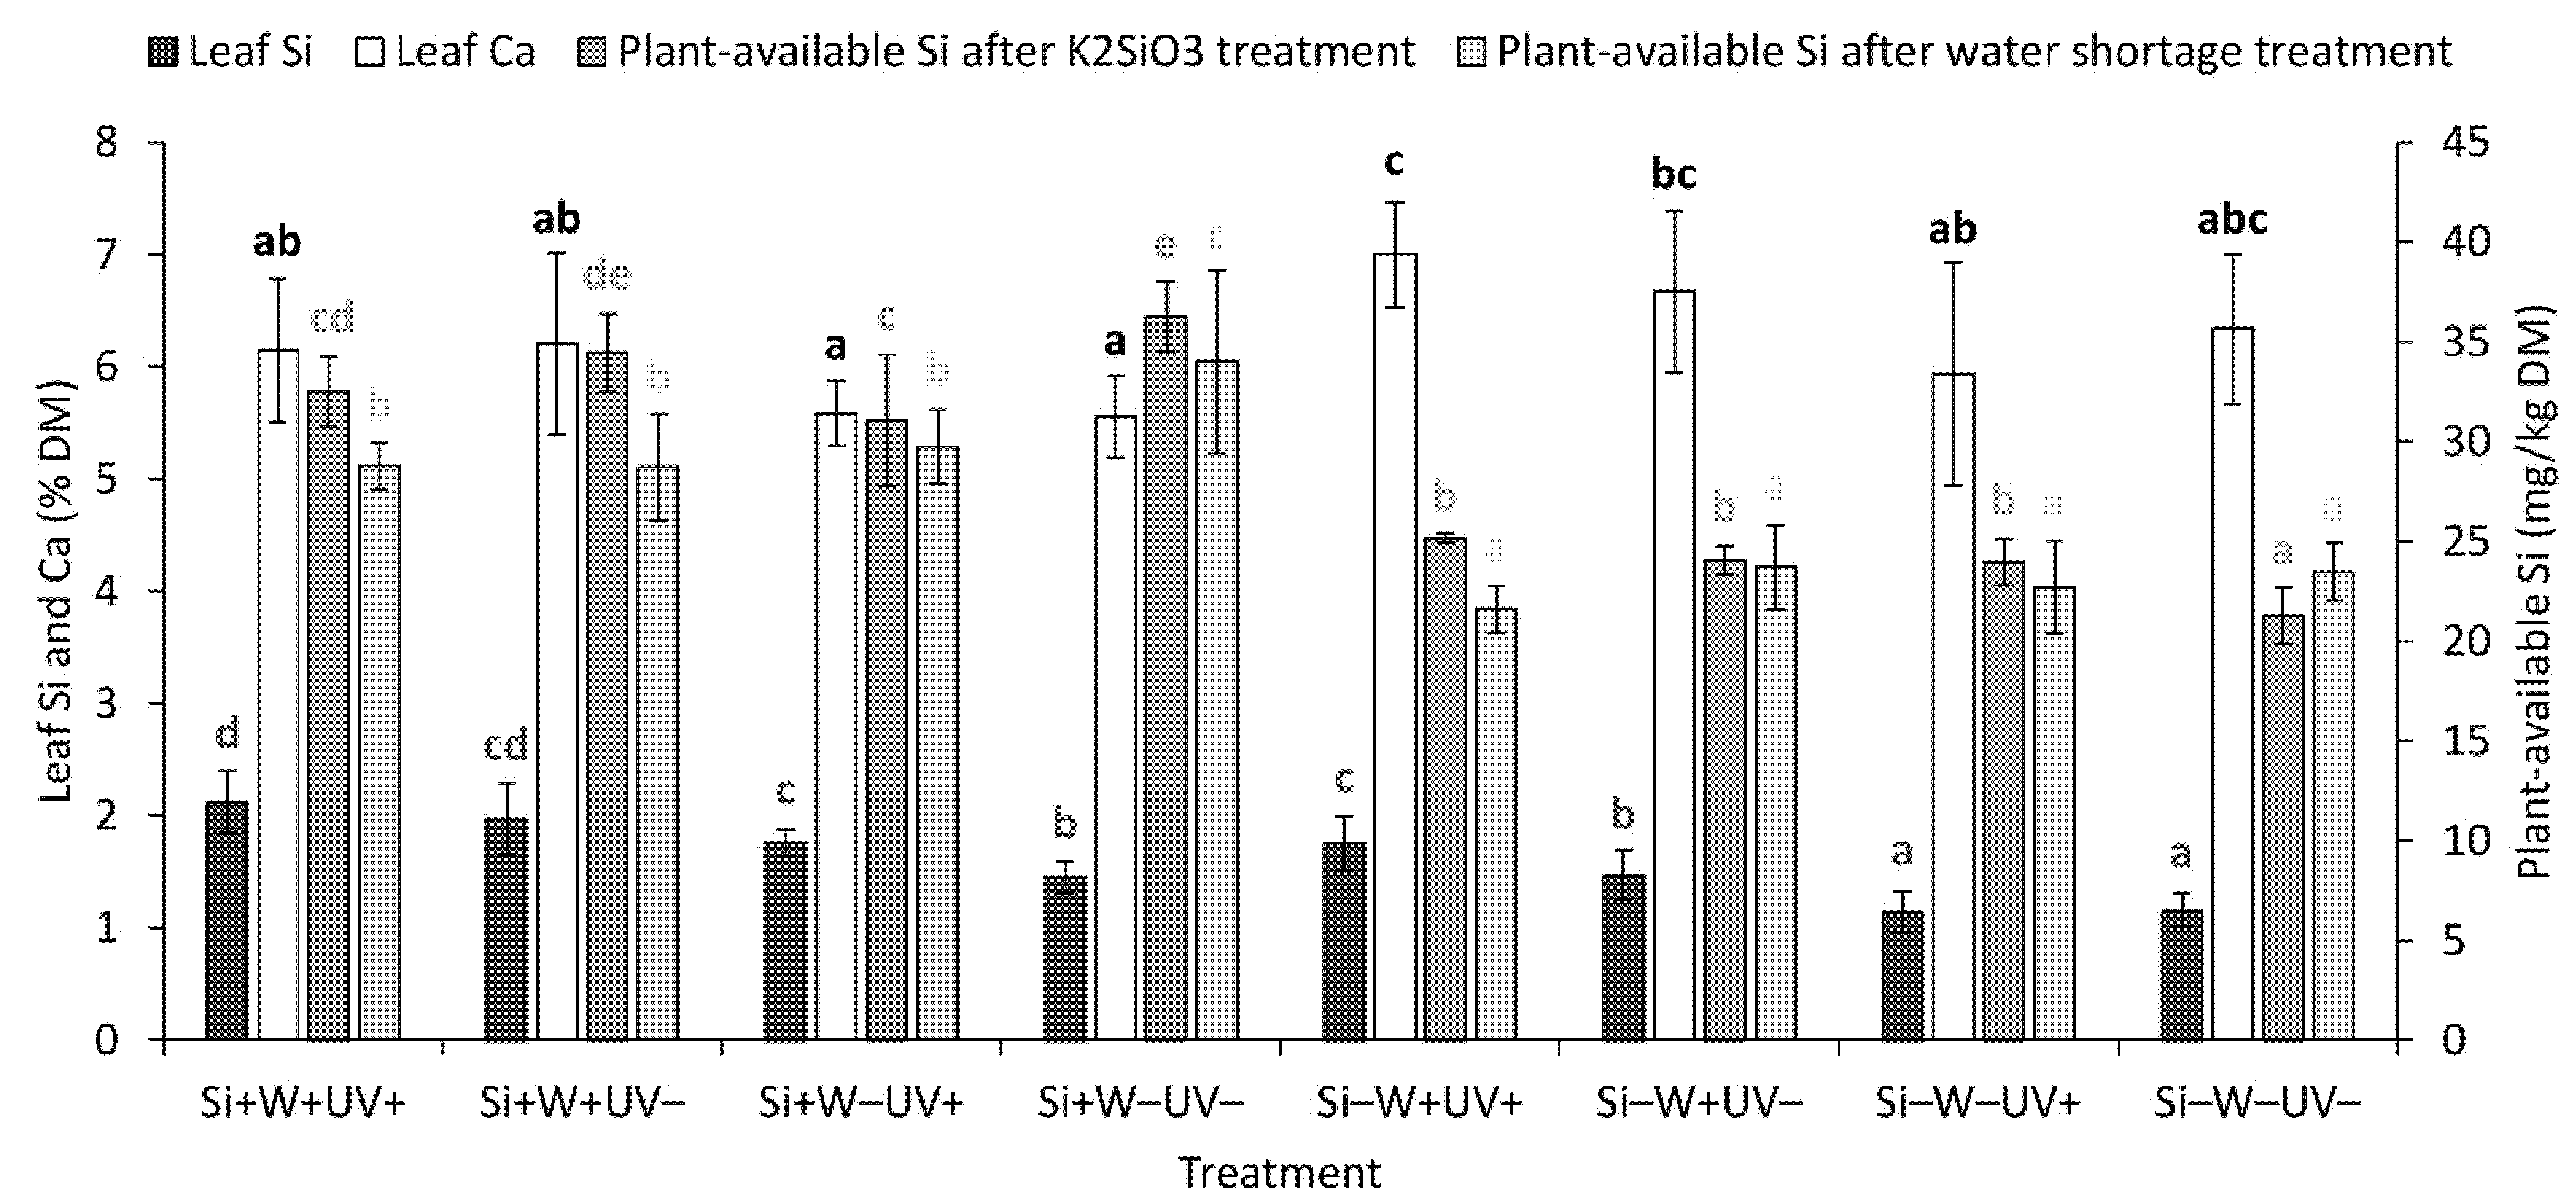
2.5. Leaf and Soil Element Composition and Plant-Available Si Level in the Soil

The leaf Si content was significantly positively affected by K2SiO3 addition (p ≤ 0.001), while it was significantly negatively affected by water shortage (p ≤ 0.001) and reduced UV radiation (p ≤ 0.01; Figure 3, Table 2). The leaf Ca content was also negatively affected by reduced water availability (p ≤ 0.001). However, contrary to the leaf Si content, the leaf Ca content was significantly reduced by K2SiO3 addition (p ≤ 0.01). The leaf P and Cl contents were significantly negatively affected by reduced UV radiation (p ≤ 0.001 for both; Table 1 and Table 2). For the leaf S content, none of the three studied factors (i.e., K2SiO3, water availability, ambient UV radiation) were significant. The only two treatments that differed significantly from each other in the leaf S content were the Si+W+UV– and Si–W–UV+ treatments. The Si × W × UV interaction had a significant impact on the leaf K content (p ≤ 0.05). Under ambient UV radiation, the leaf K content increased with K2SiO3 addition when plants had sufficient water supply but decreased with K2SiO3 addition under water shortage. On the contrary, when plants were grown under reduced UV radiation, the leaf K content increased when K2SiO3 was added and plants were growing under water shortage, while it decreased with K2SiO3 addition under sufficient water availability.
On the day when cucumber plants were planted in pots, the initial plant-available Si level in the soil was 24.81 ± 2.06 mg kg−1 of soil dry matter, the initial total soil Si level was 9.34 ± 1.54% of soil dry matter, the initial total soil Ca level was 4.04 ± 0.10% of soil dry matter, and the initial total soil K level was 1.00 ± 0.10% of soil dry matter. After treatment of the soil in selected pots with K2SiO3, the plant-available Si level in the soil significantly increased (p ≤ 0.01) in all of the four Si+ treatments (i.e., Si+W+UV+, Si+W+UV–, Si+W–UV+, and Si+W–UV–) compared to the initial plant-available Si level in the soil. It was also significantly higher in the Si+ treatments compared to the Si– treatments (i.e., Si–W+UV+, Si–W+UV–, Si–W–UV+, and Si–W–UV–) at the end of the experiment, after the water shortage treatment (Figure 3). The total soil Si level also increased and was somehow higher in all of the Si+ treatments after the K2SiO3 treatment. However, none of these differences were significant (Table 3). After the water shortage treatment, no such trend could be observed for total soil Si levels. After the K2SiO3 treatment, the total soil K level was only significantly higher in the Si+W+UV+ and Si+W+UV– treatments in comparison to the initial total soil K level (p ≤ 0.05). In addition, no significant differences were observed when comparing the initial total soil K level and total soil K levels after the water shortage treatment. The significant positive impact of K2SiO3 addition on the plant-available Si level in the soil was also confirmed by factorial ANOVA (p ≤ 0.001). In addition, factorial ANOVA also showed a significant positive impact of K2SiO3 addition on total soil K levels, but only after the K2SiO3 treatment (p ≤ 0.05) and not after the water shortage treatment. On the other hand, K2SiO3 addition did not seem to affect total soil Si levels according to factorial ANOVA. The plant-available Si level in the soil remained significantly higher compared to the initial level (p ≤ 0.05) even after the water shortage treatment (i.e., at the end of the experiment). In the Si– treatments, the plant-available Si level in the soil after the K2SiO3 treatment and after the water shortage treatment mostly did not differ significantly from the initial level. In all of the treatments, except for Si–W–UV–, the plant-available Si level in the soil decreased from the second measurement, which was conducted after the K2SiO3 treatment, to the third measurement, which was performed at the end of the experiment (after the water shortage treatment). For the Si+W+UV+, Si+W+UV–, and Si–W+UV+ treatments, this decrease was significant (p ≤ 0.01). On the other hand, the total soil Si level did not differ significantly between the second and the third measurement. From the second to the third measurement (i.e., after the K2SiO3 treatment and after the water shortage treatment, respectively), total soil K levels only differed significantly in the Si+W+UV+ treatment.

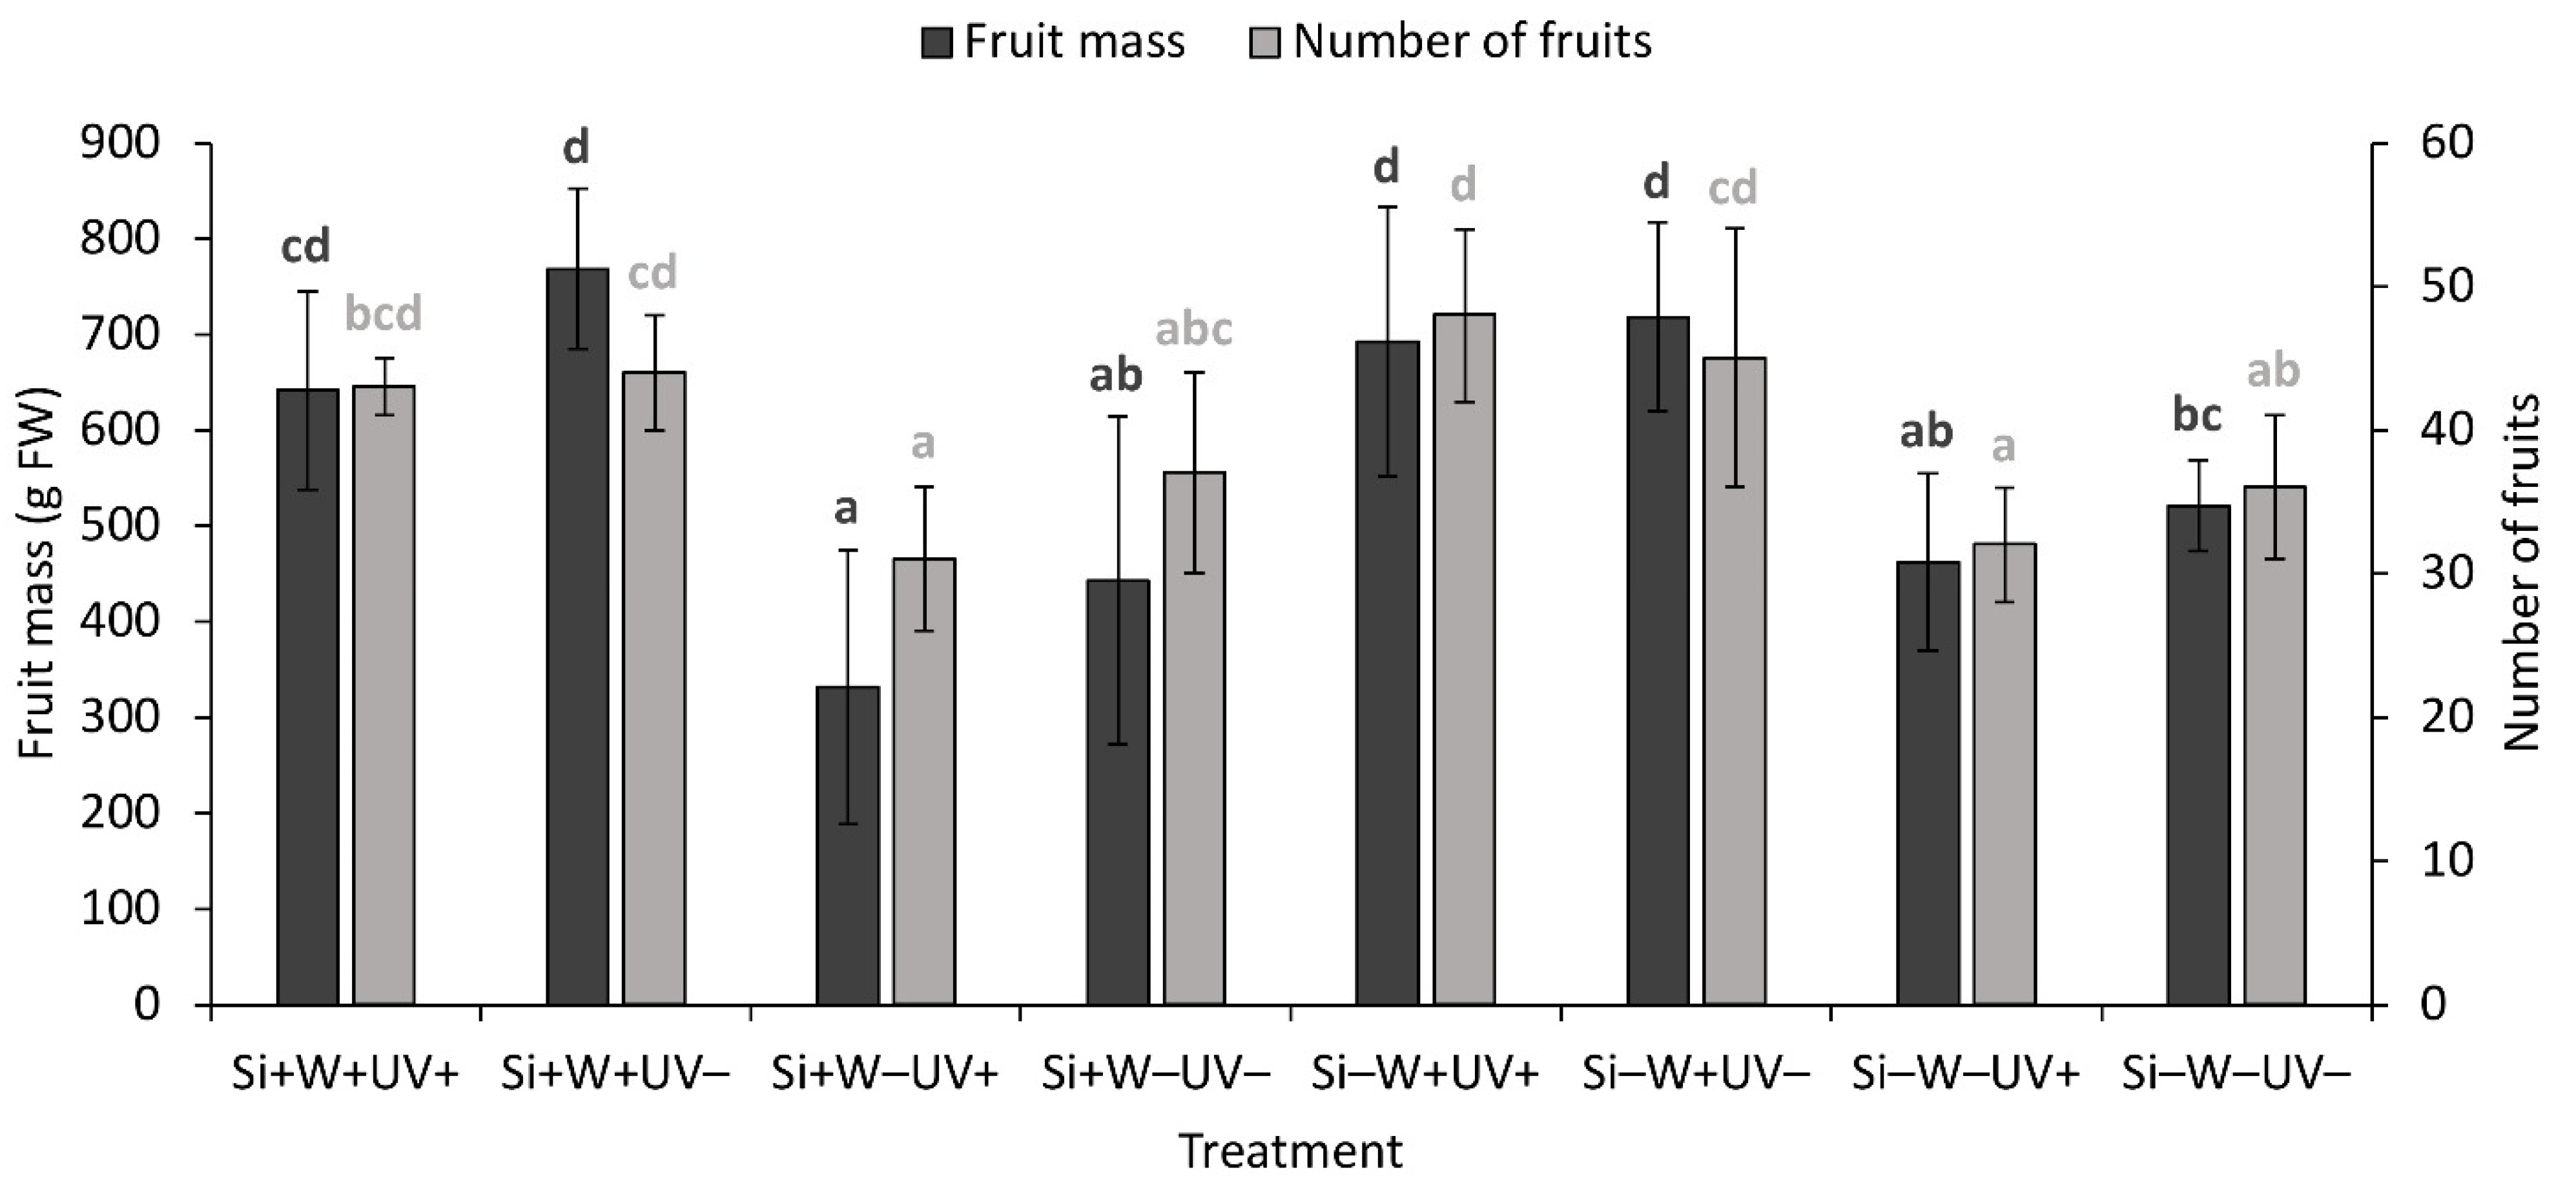
2.6. Plant Biomass and Growth Parameters

As for leaf biomass parameters, the biomass of vital leaves significantly decreased with K2SiO3 addition (p ≤ 0.05) and under reduced water availability (p ≤ 0.001; Table 1 and Table 2). For the dead leaf biomass, the relations with these two factors were just the opposite (p ≤ 0.05 for K2SiO3 addition and p ≤ 0.001 for reduced water availability). The vital leaf biomass was also significantly positively affected by reduced UV radiation (p ≤ 0.01). The stem biomass was only significantly negatively affected by reduced water availability (p ≤ 0.001), while the biomass of all the aboveground vegetative parts was significantly reduced by water shortage (p ≤ 0.001) and increased significantly under reduced UV radiation (p ≤ 0.01). The latter parameter was also significantly affected by the Si × W and Si × W × UV interactions (p ≤ 0.05 for both). For the Si × W interaction, the biomass of the aboveground vegetative parts decreased with K2SiO3 addition under water shortage, while it only slightly increased with K2SiO3 addition under sufficient water availability. When examining the Si × W × UV interaction under ambient UV radiation, the biomass of the aboveground vegetative parts decreased with K2SiO3 addition under water shortage, while it only slightly increased with K2SiO3 addition under sufficient water availability. However, under reduced UV radiation, it only slightly increased with K2SiO3 addition under water shortage and did not change with K2SiO3 addition under sufficient water availability.
The fruit mass and number of fruits were significantly negatively affected by reduced water availability (p ≤ 0.001 for both; Figure 4, Table 1 and Table 2). Moreover, the fruit mass was also significantly increased by reduced UV radiation (p ≤ 0.05). The fruit length was significantly smaller under water shortage (p ≤ 0.05), the fruit upper width was significantly larger under reduced UV radiation (p ≤ 0.01), while the fruit lower width was not affected by any of the three studied factors or their interactions and did not differ between the eight treatments.
The ratio between the biomass of the aboveground vegetative parts and fruit mass did not show any significant differences between the treatments and was not affected by any of the three studied factors (Table 1 and Table 2). SLA increased significantly under water shortage (p ≤ 0.05) but decreased significantly under reduced UV radiation (p ≤ 0.05).

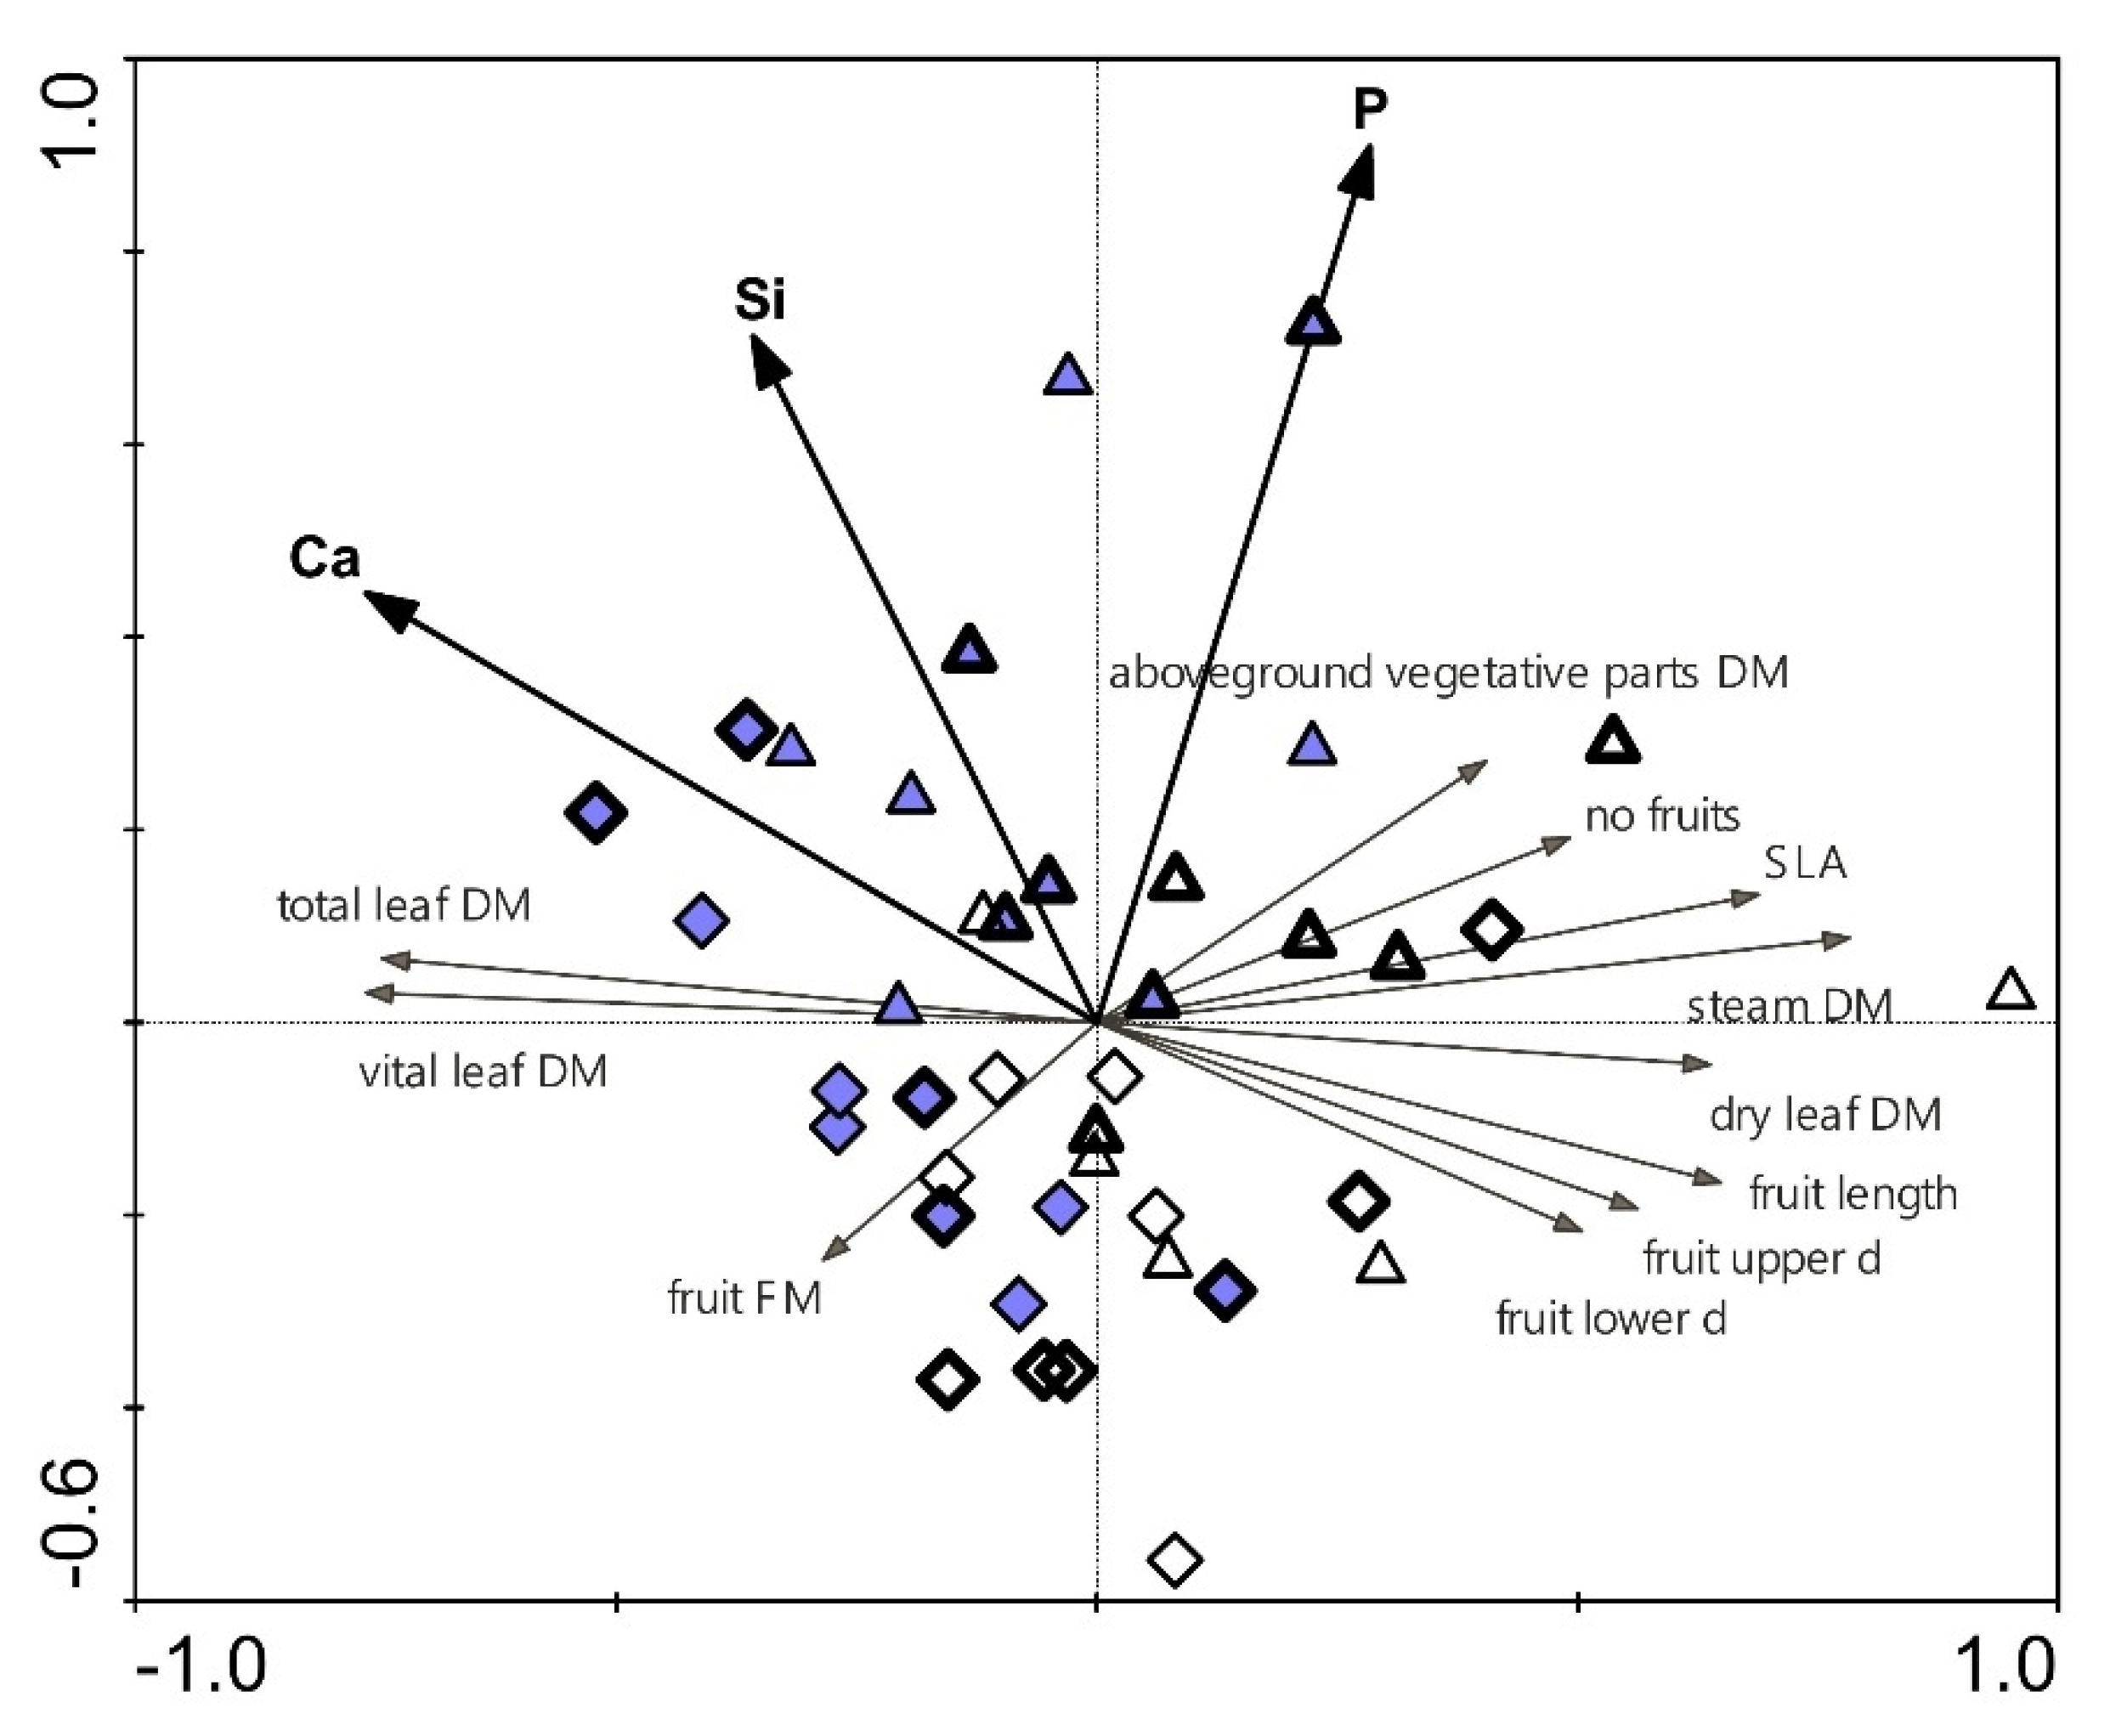
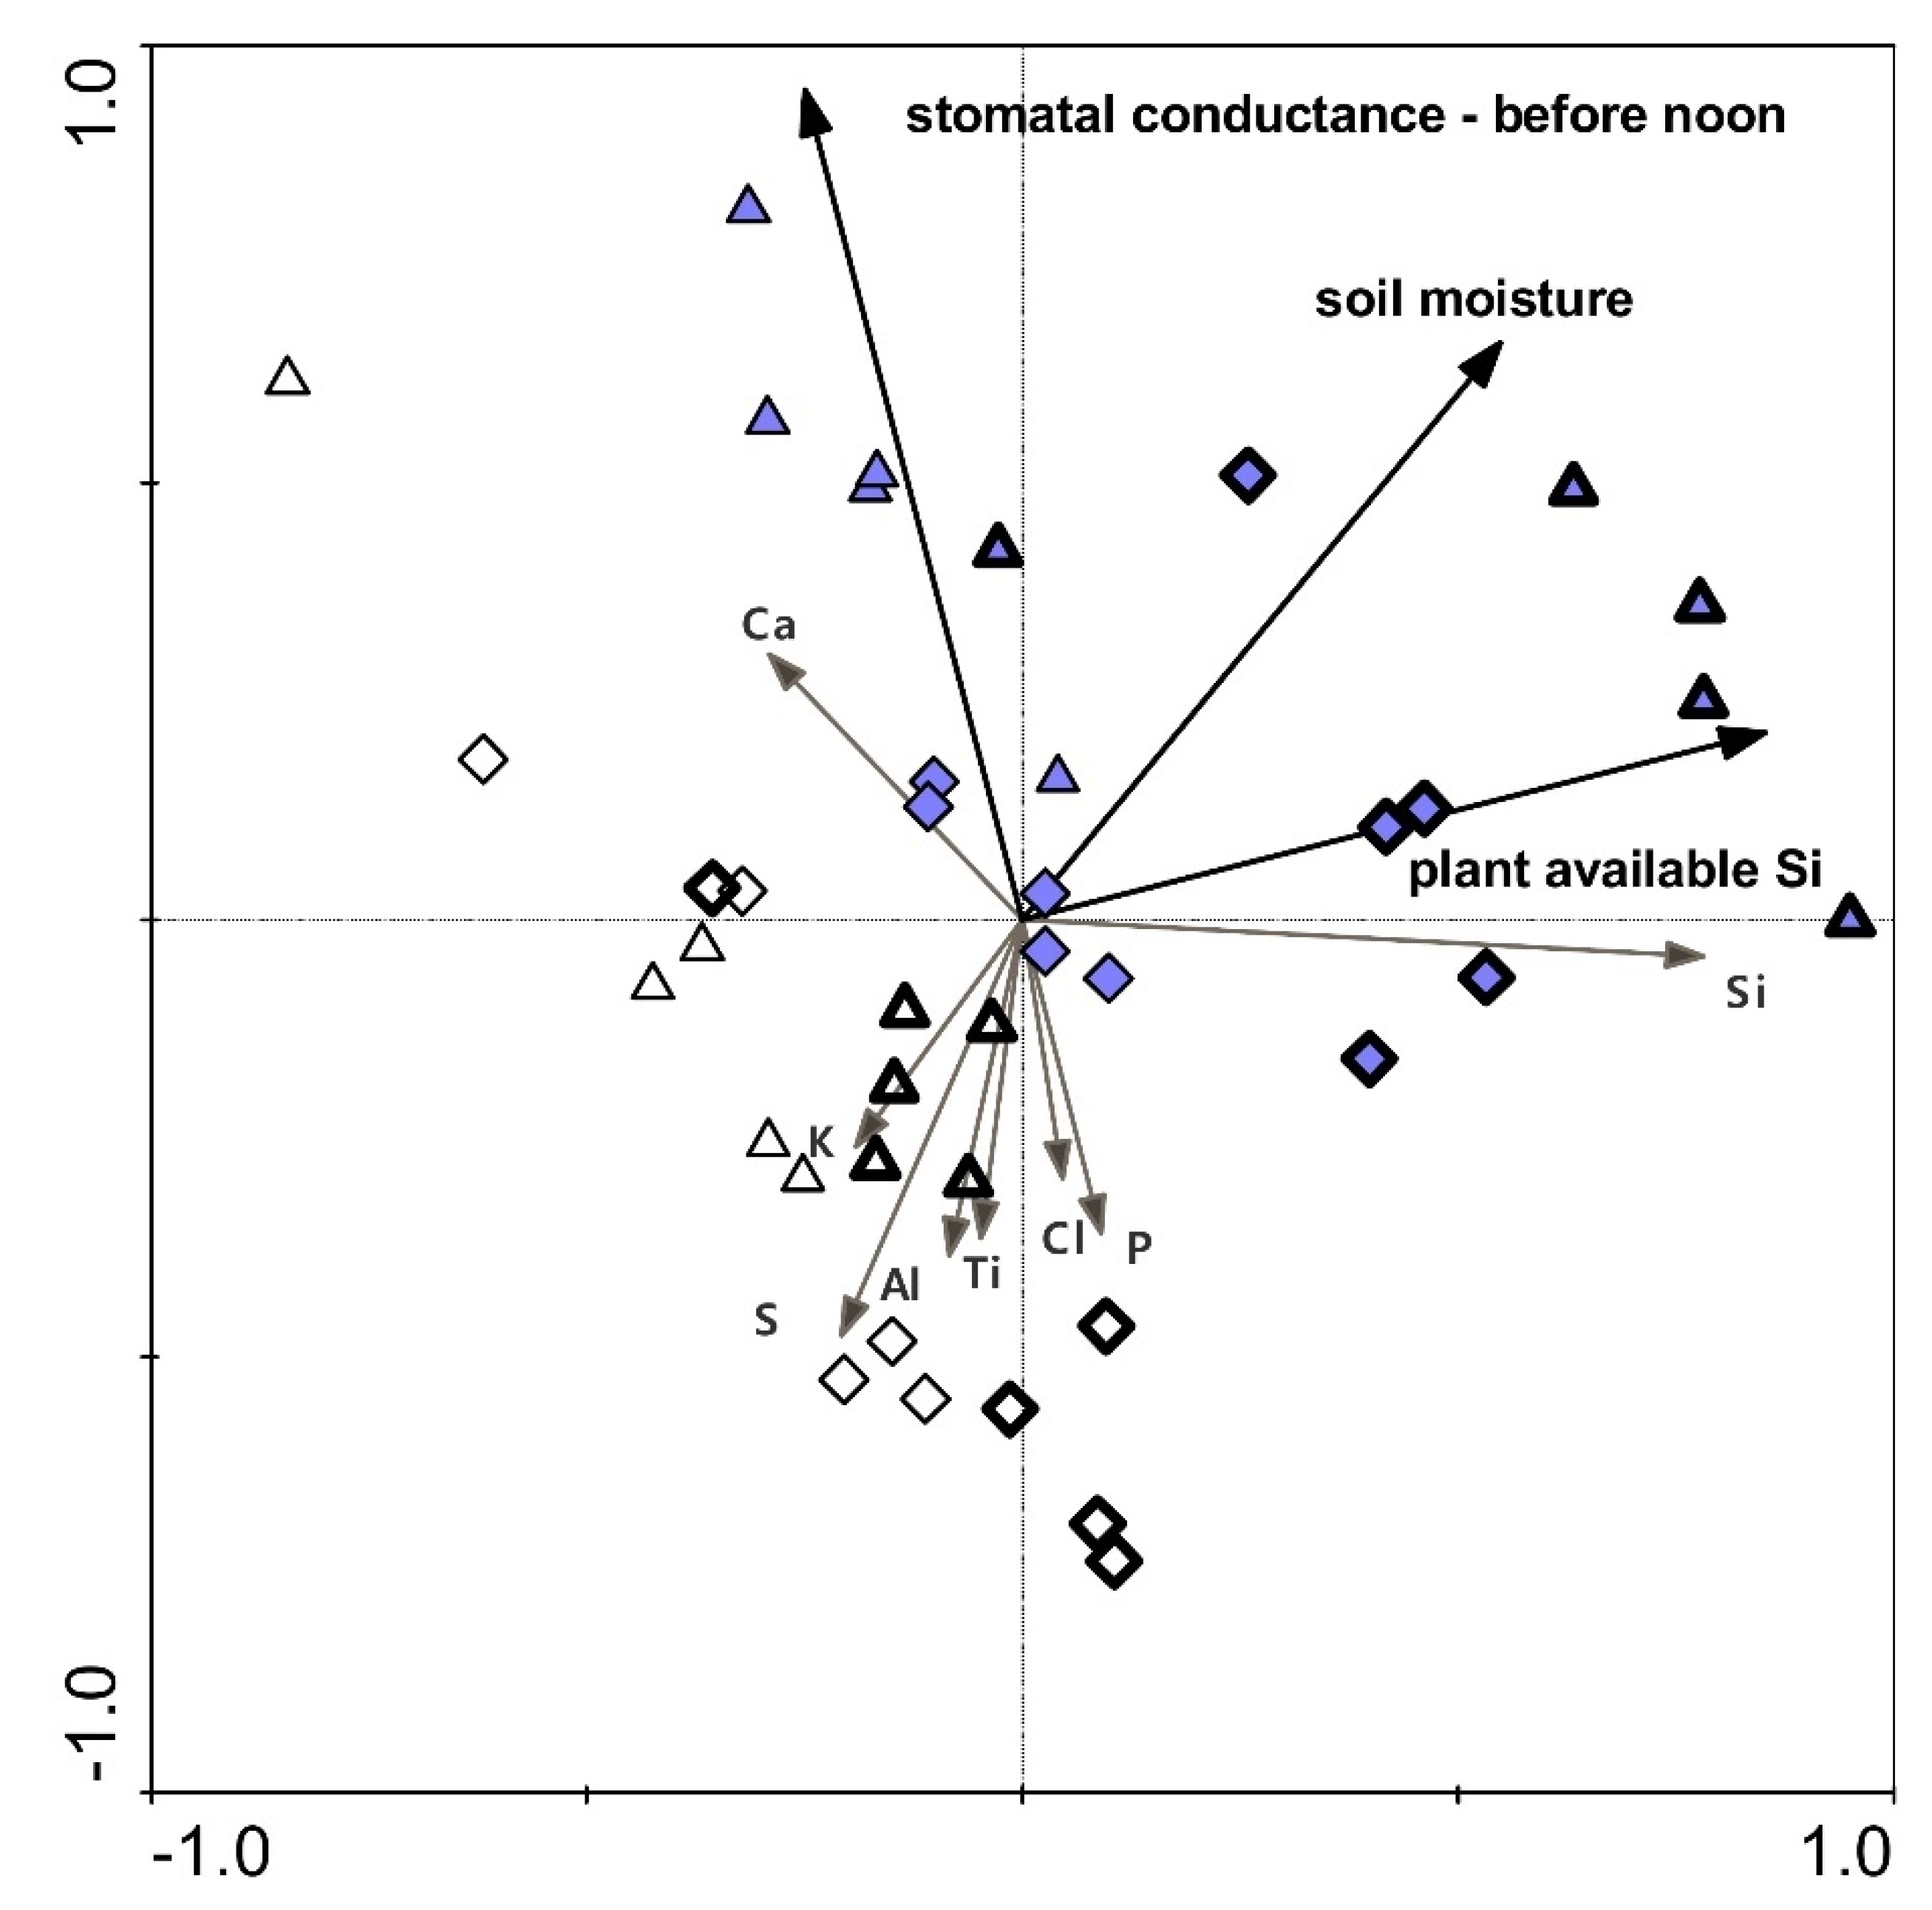
2.7. Relationships between Selected Parameters

As for relationships between the plant biomass and growth parameters, and environmental and leaf physiological parameters, Pearson’s correlation analysis revealed strong positive correlations between the vital leaf biomass and soil moisture during water shortage (p ≤ 0.01), and between the vital leaf biomass and most of the measured leaf physiological parameters (Fv/Fm during water shortage in the morning and at noon, stomatal conductance during water shortage in the morning, before noon, and in the afternoon; p ≤ 0.01 for all; Table 4). Correspondingly, dead leaf biomass was strongly negatively related to all these parameters (p ≤ 0.01). The stem biomass was also strongly positively related to soil moisture during water shortage (p ≤ 0.01) and with stomatal conductance during water shortage, but only in the morning and in the afternoon (p ≤ 0.01 for both). It also showed a significant positive correlation with Fv/Fm during water shortage at noon (p ≤ 0.05). Moreover, the stem biomass was strongly negatively related to Fv/Fm during water shortage during the day (p ≤ 0.01). The biomass of the aboveground vegetative parts and fruit mass were strongly positively related to the same parameters as vital leaves (i.e., soil moisture during water shortage and Fv/Fm during water shortage in the morning and at noon, and stomatal conductance during water shortage in all the three periods of the day; p ≤ 0.01 for all). In addition, the biomass of the aboveground vegetative parts was also significantly negatively related to Fv/Fm during water shortage during the day (p ≤ 0.05). For number of fruits, significant positive correlations were found with soil moisture during water shortage (p ≤ 0.01), Fv/Fm during water shortage in the morning (p ≤ 0.05) and at noon (p ≤ 0.01), and with stomatal conductance during water shortage in the morning (p ≤ 0.01) and in the afternoon (p ≤ 0.01). Fruit length was also positively related to the same parameters as the vital leaf biomass (p ≤ 0.01 for stomatal conductance during water shortage before noon and in the afternoon, and p ≤ 0.05 for the remaining four significant parameters). Fruit upper width only showed positive correlation with Fv/Fm during water shortage at noon (p ≤ 0.05), while fruit lower width and the ratio between the biomass of the aboveground vegetative parts and fruit mass did not show any significant correlations with any of the environmental and leaf physiological parameters. SLA was negatively related to stomatal conductance during water shortage in all the three periods of the day (p ≤ 0.01 in the afternoon and p ≤ 0.05 in the morning and before noon), with Fv/Fm during water shortage in the morning and at noon (p ≤ 0.05), and with soil moisture during water shortage (p ≤ 0.05).
Additional significant correlations were found for some of the leaf element contents. For the leaf Si and Ca contents, a strong positive correlation was found with soil moisture during water shortage (0.578 for leaf Si and 0.472 for leaf Ca; p ≤ 0.01 for both). In addition, for these two elements there was also a strong positive correlation with stomatal conductance during water shortage in the morning (0.501 for leaf Si and 0.318 for leaf Ca; p ≤ 0.01 for both) and in the afternoon (0.354 for leaf Si and 0.453 for leaf Ca; p ≤ 0.01 for both). The leaf Si content was negatively related to leaf chlorophyll a and b contents (−0.353 and −0.374, respectively; p ≤ 0.05 for both), while a positive correlation was found between leaf P content and UV-B-absorbing substances (0.379; p ≤ 0.01). The biomass of the aboveground vegetative parts was strongly positively related to the leaf Si and Ca contents (0.420 and 0.457, respectively; p ≤ 0.01), while no correlation was found with the leaf P content. Additionally, the leaf Ca content positively affected the fruit mass (0.446; p ≤ 0.01). The leaf Si content was strongly positively related to the plant-available Si level in the soil after the K2SiO3 treatment (0.568; p ≤ 0.01), but not after the water shortage treatment. In contrast, the leaf Ca content was negatively affected by the plant-available Si level in the soil both after the K2SiO3 treatment (−0.342; p ≤ 0.05) and after the water shortage treatment (−0.422; p ≤ 0.01). When considering total soil Si, Ca, and K levels, plant-available Si levels in the soil, and leaf Si, Ca, and K contents, we found a significant positive correlation between the leaf Si content and the total soil Si level after the water shortage treatment (0.361; p ≤ 0.05), between the leaf Si content and the plant-available Si level in the soil after the K2SiO3 treatment (0.568; p ≤ 0.01), and between the leaf Si content and the total soil K level after the K2SiO3 treatment (0.366; p ≤ 0.05).
A redundancy analysis (RDA) revealed that leaf Ca, Si, and P contents significantly affected the cucumber biomass and growth parameters (Figure 5). The leaf Ca content explained 25% of the variability (p = 0.001), the leaf P content explained an additional 15% (p = 0.001), and the leaf Si content an additional 5% (p = 0.043) of the variability of the plant biomass and growth parameters. The vital leaf biomass was positively related to the leaf Ca content, and the fruit mass was negatively affected by the leaf P content. Another RDA was run to analyse the relationships between leaf element contents and some of the water availability indicators (i.e., stomatal conductance during water shortage before noon and soil moisture during water shortage) along with the plant-available Si level in the soil after the K2SiO3 treatment (Figure 6). The parameters that reached significance were the plant-available Si level in the soil after the K2SiO3 treatment, which explained 13% (p = 0.001) of the variability, stomatal conductance during water shortage before noon that explained 10% (p = 0.002), and soil moisture during water shortage that explained an additional 6% (p = 0.014) of the variability of leaf element contents. The leaf Si content was strongly positively related to the plant-available Si level in the soil after the K2SiO3 treatment, while the leaf Ca content was negatively related to this parameter. However, the leaf Ca content was strongly positively related to stomatal conductance during water shortage before noon. Leaf Si and Ca contents were negatively related.

3. Discussion

Out of the three studied factors, water shortage had the most negative impact on measured parameters, causing a significant decline in cucumber growth and production. Ambient UV radiation had an adverse impact on various studied parameters, while K2SiO3 addition affected only some of these parameters. Fertilisation with K2SiO3 increased the amount of plant-available Si in the soil and the leaf Si content, while the leaf K content was only slightly affected. A growth analysis revealed that K2SiO3 addition significantly negatively affected the leaf biomass.
Water shortage had a significant positive impact on leaf chlorophyll a and b contents, while the leaf Si content was negatively related to leaf chlorophyll a and b contents. The chlorophyll a to chlorophyll b ratio was significantly negatively affected by water shortage, as also shown by Nyachiro et al. [48], who studied six Triticum aestivum cultivars. On the other hand, reduced UV radiation significantly positively affected this ratio. This is in agreement with the study of Larsson et al. [49], who reported about a negative effect of UV radiation on the chlorophyll a to chlorophyll b ratio in Brassica napus. As observed in our study, Silva et al. [50] reported about a beneficial effect of Si addition under water shortage, as two tomato cultivars showed an increase in the chlorophyll a content with Si addition. However, in the well-watered plants, the chlorophyll a to chlorophyll b ratio decreased with K2SiO3 addition. Sufficient water availability significantly negatively affected the total chlorophyll to carotenoids ratio, while K2SiO3 addition somewhat mitigated this adverse effect. Carotenoids are very important for plants, as they improve light harvesting and prevent photodamage of leaf tissues. The total chlorophylls to carotenoids ratio depends on light conditions and other factors causing stress in plants, including water shortage [51,52]. We observed a significant negative effect of K2SiO3 addition on leaf carotenoid and anthocyanin contents in the well-watered plants, while the contents of these pigments increased with K2SiO3 addition in the water-deprived plants. The latter response is in line with the study from Jamila et al. [53], who reported about higher chlorophyll and carotenoid contents in Si-enriched and salt-stressed Coriandrum sativum. These differences are possibly due to the multiple effects of Si, such as the amelioration of plant water content and photosynthetic activity, and the reduction in oxidative stress [54]. Similar to carotenoids, anthocyanins also protect plants against excessive sunlight, while it was also shown that they may affect plant water loss by decreasing stomatal transpiration [55].
In the present study, water availability affected stomatal conductance in a different manner under different conditions. Under ambient UV radiation, the afternoon values increased with K2SiO3 addition when water availability was sufficient, while they decreased with K2SiO3 addition under water shortage. This might be related to the less efficient Si uptake into plants due to water shortage [23]. Photochemical efficiency measurements showed pronounced daily dynamics; however, different treatments exerted little additional stress to plants. It was previously shown that one of the important mechanisms of drought tolerance is the reduction in assimilation areas, as was also evident in this study. This way, the remaining assimilation areas may retain normal function [25].
The effect of water availability on Si uptake was also shown in the present study. The leaf Si content increased with K2SiO3 addition and was negatively affected by water shortage and reduced UV radiation. The main reason for the latter effect might be the increased water-use efficiency (WUE) in the UV-treated plants and the synergistic effect of UV radiation and drought. In soybean cultivars, Gitz III et al. [56] reported about a positive relationship between UV-B levels and WUE. Similarly, it was shown for different cultivars of spring wheat that WUE significantly increased under the combined conditions of UV-B and water stress [57]. Contrary to the leaf Si content, the leaf Ca content significantly decreased with K2SiO3 addition. This negative relation between Si and Ca was already shown in previous studies [26]. The level of plant-available Si in the soil after K2SiO3 treatment was significantly affected by the interaction between K2SiO3 addition and ambient UV radiation, and also by the interaction of all the three studied factors. This was possibly the consequence of the impact of the three factors on plant water management [58,59,60]. The analysis comprising effects of K2SiO3 addition, water availability, and ambient UV radiation showed no significant impact of K2SiO3 addition on leaf K, S, P, and Cl contents, which might be the result of the species-specific strategies in uptake of different elements [60]. The study of Greger et al. [61], which examined various species, showed that Si addition increased the availability of Ca, P, S, Cl, and some other elements.
The comparison of leaf biomass parameters under the different treatments revealed that the vital leaf biomass significantly decreased with K2SiO3 addition and reduced water availability, while the relation was just the opposite for the dead leaf biomass. This was related to reduced Si availability under water shortage [23]. The leaf biomass was also significantly negatively affected by ambient UV radiation. The allocation of biomass from stems to leaves was observed in plants grown under different light quality after exposure to UV-B [62]. However, Qian et al. [63] showed that the decrease in biomass allocation to leaves was not the result of a UV-A radiation pre-treatment. Therefore, we cannot declare this phenomenon as a UV effect in general.
The biomass of the aboveground vegetative parts was strongly positively related to soil moisture during water shortage and with potential photochemical efficiency. The leaf Si content positively affected the vital leaf biomass, while it was negatively related to leaf chlorophyll a and b contents. This relation with biomass is also evident from the RDA. Si accumulation in plants does not only mitigate different stresses [64], but it also interferes with different carbon compounds; thus, it may positively affect plant economy and production [65]. The RDA run with leaf element contents showed that leaf Ca, Si, and P contents played a significant role in explaining cucumber growth parameters, which was possibly the consequence of a lack of an impact of the three factors on the other elements in the cucumber leaves, as indicated above. The fruit biomass was positively related to the number of fruits. The lowest values were obtained under water shortage and ambient UV radiation, with no respect to Si. Besides water shortage, this effect was presumably also due to UV-B radiation, since previous research showed that the UV-A radiation pre-treatment increased the quality of cucumber seedlings for greenhouse production and did not exert any negative impacts on fruits [63].

4. Materials and Methods

4.1. Experimental Design

Untreated cucumber seeds (Kumare Levina F1; Semenarna Ljubljana, Ljubljana, Slovenia) were sown in small plastic pots filled with purchased commercial soil (Plantella vrtna zemlja; UNICHEM d.o.o., Vrhnika, Slovenia) on 29 May 2019. As germination rate of these seeds was fairly low, we sowed additional cucumber seeds (Kumare Levina F1; Semenarna Ljubljana, Ljubljana, Slovenia) in a plastic mat with moist paper towels on 7 June. On 11 June, small seedlings were transferred into plastic pots containing soil. Up to 20 June, the young cucumber plants were kept in a laboratory. On this day, cucumber plants from both sowing dates were planted into 40 plastic pots (44 cm × 44 cm × 36 cm) containing well-stirred soil from the Ljubljana Botanical Garden (Ljubljana, Slovenia) and purchased commercial soil (Plantella vrtna zemlja; UNICHEM d.o.o., Vrhnika, Slovenia), which were placed in a fenced outdoor research plot (4 m × 6 m; Biotechnical Faculty, University of Ljubljana; 46°03′03.9′′ N, 14°28′14.4′′ E) under two sets of cast polymethyl methacrylate panels ∼150 cm above the soil level in the pots. The first set of panels was transparent for the whole spectrum, including UV-B and UV-A (transmission wavelengths, ≥290 nm; UV+; QUINN CAST UVT; Quinn Plastics, Derrylin, UK), while the second set of panels was transparent for wavelengths of the visible region of the spectrum (transmission wavelengths, ˃380 nm, with UV reduced to ~10%; UV–; QUINN CAST UVT; Quinn Plastics, Derrylin, UK). These two sets accounted for the two UV radiation treatments (UV+ and UV–). Two cucumber plants were planted in each pot. A plastic supporting net was stretched between the pots to provide support for the growing cucumber plants. On 1 July, the first flower buds were observed, and on 10 July, the first fruits started to develop. All plants were watered with the same amount of water up until and including 16 July. From 20 June to 16 July (days 1–27 of K2SiO3 treatment), half of the pots were watered with Si water solution, while the rest of the pots were watered with water only. This provided the Si+ and Si– treatments. For K2SiO3 addition in Si+ pots, 6% K2O3Si was used. K2SiO3 is one of the most commonly used Si fertilisers [66]. The K2SiO3 solution was always well-stirred and prepared right before watering in a watering can. On days 1, 2, 3, and 8 of K2SiO3 treatment, 1 mL of 6% K2SiO3 per 1 L of water was added in the Si+ pots, on days 9, 12, 14, 16, 21, 23, and 26 of K2SiO3 treatment, a twice higher K2SiO3 concentration was used (2 mL L−1 of water), and on day 27, the last day of K2SiO3 treatment, 0.5 mL of 6% K2SiO3 per 1 l of water was added in the Si+ pots. From 17 July, half of the pots were well-watered (W+), while the rest were exposed to water shortage (W–). The pots were randomly divided between the resulting eight treatments (Si+W+UV+, Si+W+UV–, Si+W–UV+, Si+W–UV–, Si–W+UV+, Si–W+UV–, Si–W–UV+, and Si–W–UV–; Si+, K2SiO3 addition; W+, well-watered; UV+, ambient UV radiation; Si–, no treatment with K2SiO3; W–, water shortage; UV–, reduced UV radiation) in such way that not all of the pots of the same treatment were grouped together. Each treatment consisted of five pots (replicates). The experimental period was divided into two important phases. The first phase was the K2SiO3 treatment phase, which lasted from 20 June to 16 July (days 1–27 of K2SiO3 treatment), and the second phase was the water shortage treatment phase, lasting from 17 July until the end of experiment on 13 August (days 1–28 of water shortage). On average, the W+ plants were watered every 2 days (every 1.8 days), while the W– plants, which received four times less water than the W+ plants (∼24% the water of the W+ plants), were watered every 3 days. If any deviation in soil moisture was observed in individual pots compared to the other pots of the same treatment, the amount of added water for these pots was a bit higher/lower compared to the otherwise fixed amount of added water for the rest of the pots from this treatment to maintain as uniform soil moisture as possible in all of the pots within each treatment. The weather conditions during the experiment are presented in Supplementary Table S1.

4.2. Environmental Conditions

Soil moisture was measured before plants were watered. For the initial soil moisture conditions before water shortage, soil moisture was measured in the middle of each pot, whereas later on during water shortage, it was measured in five specified equally distant places per each pot around the cucumber plants and in the middle of them. The measurements were performed using a soil moisture meter (HH2 Moisture Meter; Delta-T Devices, Cambridge, UK) and a moisture sensor (SM150T Moisture Sensor; Delta-T Devices, Cambridge, UK). The initial soil moisture levels were determined at the beginning of the experimental period, on 21 June 2019 (day 2 of K2SiO3 treatment). During water shortage, they were measured an additional five times until the end of the experimental period, namely, on days 8, 15, 17, 20, and 22 of water shortage. Soil temperature was recorded once every 2 h from 1 July to 13 August (from day 12 of K2SiO3 treatment to day 28 of water shortage) using water temperature data loggers (UTBI-001 TidbiT v2; Onset Computer Corporation, Bourne, MA, USA). The sensors were buried between the roots, ∼3 cm deep and as close as possible to the middle of one randomly selected pot per treatment. The collected data were later transferred to a computer via a USB connector, using a U-4 HOBO Optic USB Base Station and a 2-D Coupler (Onset Computer Corporation, Bourne, MA, USA). Along with overall soil temperature from day 12 of K2SiO3 treatment to day 28 of water shortage, the additional two soil temperature parameters presented in this study were soil temperature during the day (from 8:00 h to 20:00 h) and soil temperature during the night (from 22:00 h to 6:00 h).

4.3. Plant Analyses

All of the studied leaf traits were analysed on fully developed vital cucumber leaves, namely, on the third or the fourth leaf from top to bottom of a plant. The initial leaf physiological measurements (i.e., stomatal conductance, potential (Fv/Fm) and effective (Fq’/Fm’) photochemical efficiency of photosystem (PS) II) were carried out on day 1 of water shortage (Fv/Fm at 10:00 h, Fq’/Fm’ at 14:00 h, stomatal conductance at 13:00 h). These parameters were subsequently regularly measured throughout the water shortage treatment phase. During water shortage, Fv/Fm was measured in the morning (day 14 of water shortage at 8:00 h), at noon (day 20 of water shortage at 12:00 h), and during the day (days 7, 10, 14 of water shortage from 10:00 h to 14:00 h). Similarly, stomatal conductance was also measured for three different periods of the day during water shortage, namely, in the morning (days 8, 20 of water shortage at 6:30 h), before noon (days 7, 14 of water shortage at 10:00 h), and in the afternoon (days 14, 20 of water shortage at 14:00 h). Fq’/Fm’ during water shortage was measured on days 7 and 14 of water shortage at 13:00 h. On days 21, 22, and 23 of water shortage, cucumber leaves were sampled for biochemical analyses and for the analysis of specific leaf area (SLA). Two leaves/pot (subsamples) were used for these analyses.
SLA was determined according to dry weight of round leaf cuttings with known leaf area (r = 4 mm). These were dried in an oven (Memmert Model 100–800; Memmert GmbH + Co. KG, Schwabach, Germany) to reach constant weight at 105 °C for 24 h. Four leaf cuttings were obtained from a single sample for a more accurate final value.
During the experimental period, cucumber fruits were harvested every day from day 3 of water shortage until the end of experiment on day 28 of water shortage, except for the weekend days. All of the harvested fruits were counted and separately weighed shortly after they were collected. For the fruits harvested on days 20, 21, 23, 24, and 27 of water shortage, length and width were also measured. Due to variable fruit shapes, fruit width was separately measured for the upper side (where pedicel is located) and for the lower side of the fruits. On day 28 of water shortage, all plant material excluding roots was collected from the pots. The collected cucumber plants were separated into different plant parts, as vital leaves (healthy-looking green leaves), dead leaves (parched brownish leaves), stems, and fruits, for each pot separately. These plant parts were then air-dried in paper bags in the laboratory at 25 °C for two months and subsequently weighed. After weighing, some of the dried plant material from the “vital leaves” category was ground and sifted through a 0.5 mm × 0.5 mm mesh sieve and then used for leaf bulk element analysis.
The category “all leaves” is a sum of biomasses of vital and dead leaves for each treatment. The biomass of the aboveground vegetative parts was calculated as the sum of biomasses of vital and dead leaves, and stems. Additionally, the ratio between the biomass of the aboveground vegetative parts and fruit mass was also calculated.

4.3.1. Leaf Biochemical Traits

The leaf contents of chlorophyll a, chlorophyll b, and carotenoids were determined based on cucumber leaf extracts according to Lichtenthaler and Buschmann [67,68]. The absorbance was measured using a UV/VIS spectrometer (Lambda 25; PerkinElmer, Norwalk, CT, USA) at 470 nm, 645 nm, and 662 nm. The total methanol-soluble UV-B- and UV-A-absorbing substances, and anthocyanins were also extracted from fresh cucumber leaves. Before centrifugation, these leaf extracts were incubated in a refrigerator at 5 °C for 24 h. For UV-B- and UV-A-absorbing substances, absorbance was measured from 280 nm to 319 nm, and from 320 nm to 400 nm, respectively [69]. The extinction values were integrated for each UV region. For leaf anthocyanin contents, absorbance was measured at 530 nm [70].
In addition, chlorophyll a to chlorophyll b ratio and total chlorophylls (the sum of leaf chlorophyll a and b contents) to carotenoids ratio were calculated.

4.3.2. Leaf Physiological Traits

The measurements of chlorophyll fluorescence of the cucumber leaves were carried out using a portable chlorophyll fluorometer (PAM-2100; Heinz Walz GmbH, Effeltrich, Germany). Fv/Fm and Fq’/Fm’ were evaluated according to Schreiber et al. [71]. The leaf stomatal conductance was measured using a steady-state leaf porometer (Decagon Devices, Inc., Pullman, WA, USA), which surveyed the rate of water vapour diffusion via the leaf surfaces. For the morning measurements of leaf stomatal conductance during water shortage, the measurement chamber was dried with a hairdryer after every single measurement to lower the moisture in the chamber, which otherwise increased significantly after every measurement. All of the leaf physiological parameters were measured in situ.

4.3.3. Leaf Bulk Element Analysis

The contents of Si, phosphorus (P), sulphur (S), chlorine (Cl), K, and calcium (Ca) in the cucumber leaves were determined using X-ray fluorescence spectrometry. From 100 mg to 500 mg of dried and powdered leaves was pressed into pellets using a pellet die and a hydraulic press. The 55Fe (25 mCi; Isotope Products Laboratories, Valencia, PA, USA) was used as the primary excitation source for the analysis. The emitted fluorescence radiation was collected by a Si drift diode detector (Amptek, Inc., Bedford, MA, USA) with a 12 μm thick beryllium window. The energy resolution of the spectrometer at count rates <1000 cps was 140 eV at 5.9 keV. The X-ray fluorescence spectrometry analysis was conducted under vacuum and the samples were irradiated for 5000 s to obtain spectra with sufficient statistics [72]. The analysis of the X-ray spectra was carried out using an iterative least-squares programme, as included in the quantitative X-ray analysis system software package [73]. The element quantification from the measured spectra was performed using a quantitative analysis of environmental samples based on the fundamental parameters [74]. The quality assurance for the element analysis was determined using standard reference materials: NIST SRM 1573a (tomato leaves as a homogenised powder), in the form of pressed pellets.

4.4. Soil Analyses

One soil sample (rhizospheric soil from the depth of 0 to 10 cm) was collected from all of the 40 pots twice during the experimental period, namely, after K2SiO3 treatment on day 1 of water shortage, and shortly before the end of water shortage treatment (day 24 of water shortage). At the beginning of the experimental period on day 1 of K2SiO3 treatment, five composite soil samples were collected from 15 randomly selected Si– pots, each sample comprising three subsamples (i.e., every sample contained soils from three randomly chosen Si– pots, wherein each pot was included only once). All of the soil samples were first air-dried for ~2.5 to 3 months, then homogenised with pestle in a mortar, and subsequently sifted through a 0.5 mm × 0.5 mm mesh sieve.
The plant-available Si in the soil was extracted from ~300 mg of dried and powdered soil samples using 0.01 M CaCl2, as described by Korndörfer et al. [75]. These samples were then processed using a commercially available kit (Heteropoly Blue Method (1.600 mg/L SiO2; method number, 8186); Hach Lange GmbH, Düsseldorf, Germany). The absorbance was measured using a spectrometer at 815 nm (DR 3900; Hach Lange GmbH, Düsseldorf, Germany).
Total soil Si, Ca, and K levels were determined from ~300 mg of dried and powdered soil samples. The exact methodology was described in the previous chapter (4.3.3).

4.5. Statistical Analyses

To evaluate normal distributions of the data, Shapiro–Wilk tests were used. Homogeneity of variance from the means was assessed using Levene’s tests. One-way analysis of variance (ANOVA) according to Duncan’s post hoc multiple range tests was used to evaluate the differences between the eight treatments for each measured parameter. To examine the relationships between selected parameters, Pearson’s correlation analysis was carried out. IBM SPSS statistics 22.0 was used for these statistical calculations, with significance accepted at p ≤ 0.05. In addition, to compare plant-available Si levels in the soil after the K2SiO3 treatment and after the water shortage treatment with the initial plant-available Si levels in the soil, Student’s t-tests were performed in Microsoft Excel 2016. The same type of statistical analysis was performed for total soil Si, Ca, and K levels. For the exploratory data analysis, detrended correspondence analysis using the CANOCO for Windows 4.5 programme package was used. Due to the gradient lengths obtained (<3 SD) [76], redundancy analysis was performed to determine whether the variations in plant biomass and growth parameters were related to leaf element contents, and whether the variations in leaf element contents were related to water availability indicators and the plant-available Si level in the soil. The significance of the effects of the variables was determined using Monte Carlo tests with 999 permutations. To avoid collinearity, forward selection of the explanatory variables was used. All of the variables used in the analysis were standardised. Figure 1, Figure 2, Figure 3 and Figure 4 were drawn in Microsoft Excel 2016, while Figure 5 and Figure 6 were generated using CanoDraw for Windows 4.5.

5. Conclusions

Fertilisation with K2SiO3 negatively affected the cucumber leaf biomass and positively affected the leaf Si content, while adversely affecting the leaf Ca content. The leaf K content was only slightly affected. Drought exerted a negative impact on the majority of studied parameters with the exception of chlorophyll contents, which were positively affected by water shortage. Likewise, ambient UV radiation also mostly exerted adverse effects on different parameters. Significant interactions between the studied factors were only detected in a few cases, the most pronounced among them being the effect on the aboveground vegetative plant parts. Fertilisation with K2SiO3 exerted little impact on production parameters of cucumbers exposed to ambient UV radiation and drought.

Supplementary Materials

The following are available online at https://www.mdpi.com/article/10.3390/stresses1030012/s1.

Author Contributions

Conceptualization, A.G. (Aleksandra Golob) and A.G. (Alenka Gaberščik); methodology, M.G. (Mateja Grašič); validation, M.G. (Mateja Grašič) and A.G. (Aleksandra Golob); formal analysis, N.O., M.G. (Mateja Grašič), M.G. (Mateja Germ), and K.V.-M.; writing—original draft preparation, M.G. (Mateja Grašič); writing—review and editing, M.G. (Mateja Germ) and A.G. (Aleksandra Golob); visualization, A.G. (Alenka Gaberščik). All authors have read and agreed to the published version of the manuscript.

Funding

This research was funded by the Slovenian Research Agency, through programme P1-0212 “Biology of Plants”, projects J7-9418, N1-0105, and bilateral project BI-RS/20-21-008.

Institutional Review Board Statement

Not applicable.

Informed Consent Statement

Not applicable.

Data Availability Statement

The data presented in this study are available in article or supplementary material.

Acknowledgments

The authors are grateful to Maria Mravik, Matej Holcar, and Ana Kugovnik for technical assistance during the experiment.

Conflicts of Interest

The authors declare that they have no conflict of interest.

References

  1. Mitani, N.; Ma, J.F. Uptake system of silicon in different plant species. J. Exp. Bot. 2005, 56, 1255–1261. [Google Scholar] [CrossRef] [Green Version]
  2. Epstein, E. Silicon: Its manifold roles in plants. Ann. Appl. Biol. 2009, 155, 155–160. [Google Scholar] [CrossRef]
  3. Rogalla, H.; Römheld, V. Role of leaf apoplast in silicon-mediated manganese tolerance of Cucumis sativus L. Plant Cell Environ. 2002, 25, 549–555. [Google Scholar] [CrossRef]
  4. Maksimović, J.D.; Mojović, M.; Maksimović, V.; Römheld, V.; Nikolic, M. Silicon ameliorates manganese toxicity in cucumber by decreasing hydroxyl radical accumulation in the leaf apoplast. J. Exp. Bot. 2012, 63, 2411–2420. [Google Scholar] [CrossRef] [Green Version]
  5. Yang, L.; Han, Y.; Li, P.; Li, F.; Ali, S.; Hou, M. Silicon amendment is involved in the induction of plant defense responses to a phloem feeder. Sci. Rep. 2017, 7, 4232. [Google Scholar] [CrossRef] [PubMed]
  6. Jadhao, K.R.; Bansal, A.; Rout, G.R. Silicon amendment induces synergistic plant defense mechanism against pink stem borer (Sesamia inferens Walker.) in finger millet (Eleusine coracana Gaertn.). Sci. Rep. 2020, 10, 4229. [Google Scholar] [CrossRef] [PubMed] [Green Version]
  7. Tripathi, D.; Dwivedi, M.M.; Tripathi, D.K.; Chauhan, D.K. Silicon bioavailability in exocarp of Cucumis sativus Linn. Biotech 2017, 7, 386. [Google Scholar] [CrossRef] [PubMed] [Green Version]
  8. Pavlovic, P.; Samardzic, J.; Maksimović, V.; Timotijevic, G.; Stevic, N.; Laursen, K.H.; Hansen, T.H.; Husted, S.; Schjoerring, J.K.; Liang, Y.; et al. Silicon alleviates iron deficiency in cucumber by promoting mobilization of iron in the root apoplast. New Phytol. 2013, 198, 1096–1107. [Google Scholar] [CrossRef] [PubMed]
  9. Neu, S.; Schaller, J.; Dudel, E.G. Silicon availability modifies nutrient use efficiency and content, C:N:P stoichiometry, and productivity of winter wheat (Triticum aestivum L.). Sci. Rep. 2017, 7, 40829. [Google Scholar] [CrossRef]
  10. Klančnik, K.; Vogel-Mikuš, K.; Gaberščik, A. Silicified structures affect leaf optical properties in grasses and sedge. J. Photochem. Photobiol. B 2014, 130, 1–10. [Google Scholar] [CrossRef] [PubMed]
  11. Klančnik, K.; Vogel-Mikuš, K.; Kelemen, M.; Vavpetič, P.; Pelicon, P.; Kump, P.; Jezeršek, D.; Gianoncelli, A.; Gaberščik, A. Leaf optical properties are affected by the location and type of deposited biominerals. J. Photochem. Photobiol. B 2014, 140, 276–285. [Google Scholar] [CrossRef] [PubMed]
  12. Ma, J.F.; Miyake, Y.; Takahashi, E. Silicon as a beneficial element for crop plants. In Silicon in Agriculture; Datnoff, L.E., Snyder, G.H., Korndörfer, G.H., Eds.; Elsevier Science: Amsterdam, The Netherlands, 2001; pp. 17–39. [Google Scholar]
  13. Meunier, J.D.; Sandhya, K.; Prakash, N.B.; Borschneck, D.; Dussouillez, P. pH as a proxy for estimating plant-available Si? A case study in rice fields in Karnataka (South India). Plant Soil 2018, 432, 143–155. [Google Scholar] [CrossRef]
  14. Grašič, M.; Sakovič, T.; Abram, D.; Vogel-Mikuš, K.; Gaberščik, A. Do soil and leaf silicon content affect leaf functional traits in Deschampsia caespitosa from different habitats? Biol. Plant 2020, 64, 234–243. [Google Scholar] [CrossRef]
  15. Tubaña, B.S.; Babu, T.; Datnoff, L.E. A review of silicon in soils and plants and its role in US agriculture: History and future perspectives. Soil Sci. 2016, 181, 393–411. [Google Scholar] [CrossRef] [Green Version]
  16. Schaller, J.; Puppe, D.; Kaczorek, D.; Ellerbrock, R.; Sommer, M. Silicon cycling in soils revisited. Plants 2021, 10, 295. [Google Scholar] [CrossRef]
  17. Schaller, J.; Cramer, A.; Carminati, A.; Zarebanadkouki, M. Biogenic amorphous silica as main driver for plant available water in soils. Sci. Rep. 2020, 10, 2424. [Google Scholar] [CrossRef] [Green Version]
  18. Tubaña, B.S.; Heckman, J.R. Silicon in soils and plants. In Silicon and Plant Diseases; Rodrigues, F.A., Datnoff, L.E., Eds.; Springer International Publishing: Cham, Switzerland, 2015; pp. 7–51. [Google Scholar]
  19. Ouellette, S.; Goyette, M.-H.; Labbé, C.; Laur, J.; Gaudreau, L.; Gosselin, A.; Dorais, M.; Deshmukh, R.K.; Bélanger, R.R. Silicon transporters and effects of silicon amendments in strawberry under high tunnel and field conditions. Front. Plant Sci. 2017, 8, 949. [Google Scholar] [CrossRef]
  20. Coskun, D.; Deshmukh, R.; Sonah, H.; Menzies, J.G.; Reynolds, O.; Ma, J.F.; Kronzucker, H.J.; Bélanger, R.R. The controversies of silicon’s role in plant biology. New Phytol. 2019, 221, 67–85. [Google Scholar] [CrossRef]
  21. Frick, D.A.; Remus, R.; Sommer, M.; Augustin, J.; von Blanckenburg, F. Silicon isotope fractionation and uptake dynamics of three crop plants: Laboratory studies with transient silicon concentrations. Biogeosciences 2020, 17, 6475–6490. [Google Scholar] [CrossRef]
  22. Marschner, H.; Oberle, H.; Cakmak, I.; Römheld, V. Growth enhancement by silicon in cucumber (Cucumis sativus) plants depends on imbalance in phosphorus and zinc supply. Plant Soil 1990, 124, 211–219. [Google Scholar] [CrossRef]
  23. Grašič, M.; Dobravc, M.; Golob, A.; Vogel-Mikuš, K.; Gaberščik, A. Water shortage reduces silicon uptake in barley leaves. Agr. Water Manag. 2019, 217, 47–56. [Google Scholar] [CrossRef]
  24. Grašič, M.; Malovrh, U.; Golob, A.; Vogel-Mikuš, K.; Gaberščik, A. Effects of water availability and UV radiation on silicon accumulation in the C4 crop proso millet. Photochem. Photobiol. Sci. 2019, 18, 375–386. [Google Scholar] [CrossRef] [PubMed]
  25. Grašič, M.; Golob, A.; Vogel-Mikuš, K.; Gaberščik, A. Severe water deficiency during the mid-vegetative and reproductive phase has little effect on proso millet performance. Water 2019, 11, 2155. [Google Scholar] [CrossRef] [Green Version]
  26. Golob, A.; Kavčič, J.; Stibilj, V.; Gaberščik, A.; Vogel-Mikuš, K.; Germ, M. The effect of selenium and UV radiation on leaf traits and biomass production in Triticum aestivum L. Ecotox. Environ. Saf. 2017, 136, 142–149. [Google Scholar] [CrossRef] [PubMed]
  27. Golob, A.; Stibilj, V.; Kreft, I.; Vogel-Mikuš, K.; Gaberščik, A.; Germ, M. Selenium treatment alters the effects of UV radiation on chemical and production parameters in hybrid buckwheat. Acta Agric. Scand. B 2018, 68, 5–15. [Google Scholar] [CrossRef]
  28. Venuprasad, R.; Lafitte, H.; Atlin, G. Response to direct selection for grain yield under drought stress in rice. Crop. Sci. 2007, 47, 285–293. [Google Scholar] [CrossRef]
  29. Li, Y.; Ye, W.; Wang, M.; Yan, X. Climate change and drought: A risk assessment of crop yield impacts. Clim. Res. 2009, 39, 31–46. [Google Scholar] [CrossRef]
  30. Taiz, L.; Zeiger, E. Plant Physiology, 4th ed.; Sinauer Associates: Sunderland, MA, USA, 2006. [Google Scholar]
  31. Takahashi, S.; Badger, M.R. Photoprotection in plants: A new light on photosystem II damage. Trends Plant Sci. 2011, 16, 53–60. [Google Scholar] [CrossRef]
  32. Alexieva, V.; Sergiev, I.; Mapelli, S.; Karanov, E. The effect of drought and ultraviolet radiation on growth and stress markers in pea and wheat. Plant Cell Environ. 2001, 24, 1337–1344. [Google Scholar] [CrossRef]
  33. Björn, L.-O. On the history of phyto-photo UV science (not to be left in skoto toto and silence). Plant Physiol. Biochem. 2015, 93, 3–8. [Google Scholar] [CrossRef]
  34. Savant, N.K.; Datnoff, L.E.; Snyder, G.H. Depletion of plant-available silicon in soils: A possible cause of declining rice yields. Commun. Soil Sci. Plant Anal. 1997, 28, 1145–1152. [Google Scholar] [CrossRef]
  35. Kaushik, P.; Saini, D.K. Silicon as a vegetable crops modulator—A review. Plants 2019, 8, 148. [Google Scholar] [CrossRef] [Green Version]
  36. Leroy, N.; de Tombeur, F.; Walgra, Y.; Cornélis, J.-T.; Verheggen, F.J. Silicon and plant natural defenses against insect pests: Impact on plant volatile organic compounds and cascade effects on multitrophic interactions. Plants 2019, 8, 444. [Google Scholar] [CrossRef] [PubMed] [Green Version]
  37. Nikolic, M.; Nikolic, N.; Liang, Y.; Kirkby, E.A.; Romheld, V. Germanium-68 as an adequate tracer for silicon transport in plants. Characterization of silicon uptake in different crop species. Plant Physiol. 2007, 143, 495–503. [Google Scholar] [CrossRef] [PubMed] [Green Version]
  38. Gou, T.; Yang, L.; Hu, W.; Chen, X.; Zhu, Y.; Guo, J.; Gong, H. Silicon improves the growth of cucumber under excess nitrate stress by enhancing nitrogen assimilation and chlorophyll synthesis. Plant Physiol. Biochem. 2020, 152, 53–61. [Google Scholar] [CrossRef]
  39. Liang, Y.; Si, J.; Römheld, V. Si uptake and transport is an active process in Cucumis sativus. New Phytol. 2005, 167, 797–804. [Google Scholar] [CrossRef] [PubMed]
  40. Fawe, A.; Abou-Zaid, M.; Menzies, J.G.; Bélanger, R.R. Silicon-mediated accumulation of flavonoid phytoalexins in cucumber. Phytopathology 1998, 88, 396–401. [Google Scholar] [CrossRef] [PubMed] [Green Version]
  41. Harizanova, A.; Zlatev, Z.; Koleva, L. Effect of silicon on activity of antioxidant enzymes and photosynthesis in leaves of cucumber plants (Cucumis sativus L.). Turk. J. Agric. Nat. Sci. 2014, 1, 1812–1817. [Google Scholar]
  42. Zhu, Y.-X.; Xu, X.-B.; Hu, Y.-H.; Han, W.-H.; Yin, J.-L.; Li, H.-L.; Gong, H.-J. Silicon improves salt tolerance by increasing root water uptake in Cucumis sativus L. Plant Cell Rep. 2015, 34, 1629–1646. [Google Scholar] [CrossRef]
  43. Liu, S.; Li, H.; Lv, X.; Ahammed, G.J.; Xia, X.; Zhou, J.; Shi, K.; Asami, T.; Yu, J.; Zhou, Y. Grafting cucumber onto luffa improves drought tolerance by increasing ABA biosynthesis and sensitivity. Sci. Rep. 2016, 6, 20212. [Google Scholar] [CrossRef] [Green Version]
  44. Tevini, M.; Iwanzik, W.; Teramura, A. Effects of UV-B radiation on plants during mild water stress II. Effects on growth, protein and flavonoid content. Z. Pflanzenphysiol. 1983, 110, 459–467. [Google Scholar] [CrossRef]
  45. Kanungo, M.; Dubey, A.; Kataria, S. Solar UV-B and UV-A/B exclusion affects growth and antioxidant enzymes in cucumber and wheat. Indian J. Plant Sci. 2013, 2, 63–72. [Google Scholar]
  46. Kubiš, J.; Rybus-Zając, M. Drought and excess UV-B irradiation differentially alter the antioxidant system in cucumber leaves. Acta Biol. Crac. Ser. Bot. 2008, 50, 35–41. [Google Scholar]
  47. Shen, X.; Zhou, Y.; Duan, L.; Li, Z.; Eneji, A.E.; Li, J. Silicon effects on photosynthesis and antioxidant parameters of soybean seedlings under drought and ultraviolet-B radiation. J. Plant Physiol. 2010, 167, 1248–1252. [Google Scholar] [CrossRef]
  48. Nyachiro, J.M.; Briggs, K.G.; Hoddinott, J.; Johnson-Flanagan, A.M. Chlorophyll content, chlorophyll fluorescence and water deficit in spring wheat. Cereal Res. Commun. 2001, 29, 135–142. [Google Scholar] [CrossRef]
  49. Larsson, E.H.; Bornman, J.F.; Asp, H. Influence of UV-B radiation and Cd2+ on chlorophyll fluorescence, growth and nutrient content in Brassica napus. J. Exp. Bot. 1998, 49, 1031–1039. [Google Scholar] [CrossRef]
  50. Silva, O.N.; Lobato, A.K.S.; Ávila, F.W.; Costa, R.C.L.; Oliveira Neto, C.F.; Santos Filho, B.G.; Martins Filho, A.P.; Lemos, R.P.; Pinho, J.M.; Medeiros, M.B.C.L.; et al. Silicon-induced increase in chlorophyll is modulated by the leaf water potential in two water-deficient tomato cultivars. Plant Soil Environ. 2012, 58, 481–486. [Google Scholar] [CrossRef] [Green Version]
  51. Demmig-Adams, B. Carotenoids and photoprotection in plants: A role for the xanthophyll zeaxanthin. Biochim. Biophys. Acta Bioenerg. 1990, 1020, 1–24. [Google Scholar] [CrossRef]
  52. Larcher, W. Physiological Plant Ecology: Ecophysiology and Stress Physiology of Functional Groups, 4th ed.; Springer: Berlin, Germany, 2003. [Google Scholar]
  53. Jamila, F.; Fouad, A.; Zakia, B.; Rachid, B.; Nabil, S.; Rachid, M. Effect of silicon application on Coriandrum sativum (L) under salt stress. Int. J. Sci. Eng. Res. 2019, 10, 26–33. [Google Scholar]
  54. Zhu, Y.; Gong, H. Beneficial effects of silicon on salt and drought tolerance in plants. Agron. Sustain. Dev. 2014, 34, 455–472. [Google Scholar] [CrossRef] [Green Version]
  55. Cirillo, V.; D’Amelia, V.; Esposito, M.; Amitrano, C.; Carillo, P.; Carputo, D.; Maggio, A. Anthocyanins are key regulators of drought stress tolerance in tobacco. Biology 2021, 10, 139. [Google Scholar] [CrossRef] [PubMed]
  56. Gitz III, D.C.; Liu-Gitz, L.; Britz, S.J.; Sullivan, J.H. Ultraviolet-B effects on stomatal density, water-use efficiency, and stable carbon isotope discrimination in four glasshouse-grown soybean (Glyicine max) cultivars. Environ. Exp. Bot. 2005, 53, 343–355. [Google Scholar] [CrossRef]
  57. Zhao, H.; Zhao, Z.; An, L.; Chen, T.; Wang, X.; Feng, H. The effects of enhanced ultraviolet-B radiation and soil drought on water use efficiency of spring wheat. J. Photochem. Photobiol. B 2009, 94, 54–58. [Google Scholar] [CrossRef] [PubMed]
  58. Nogués, S.; Allen, D.J.; Morison, J.I.L.; Baker, N.R. Ultraviolet-B radiation effects on water relations, leaf development, and photosynthesis in droughted pea plants. Plant Physiol. 1998, 117, 173–181. [Google Scholar] [CrossRef] [PubMed] [Green Version]
  59. Saud, S.; Li, X.; Chen, Y.; Zhang, L.; Fahad, S.; Hussain, S.; Sadiq, A.; Chen, Y. Silicon application increases drought tolerance of Kentucky bluegrass by improving plant water relations and morphophysiological functions. Sci. World J. 2014, 2014, 368694. [Google Scholar] [CrossRef]
  60. Hatfield, J.L.; Dold, C. Water-use efficiency: Advances and challenges in a changing climate. Front. Plant Sci. 2019, 10, 103. [Google Scholar] [CrossRef] [Green Version]
  61. Greger, M.; Kaur, H. A review on Si uptake and transport system. Plants 2019, 8, 81. [Google Scholar]
  62. Palma, C.F.F.; Castro-Alves, V.; Morales, L.O.; Rosenqvist, E.; Ottosen, C.-O.; Strid, Å. Spectral composition of light affects sensitivity to UV-B and photoinhibition in cucumber. Front. Plant Sci. 2021, 11, 610011. [Google Scholar] [CrossRef]
  63. Qian, M.; Rosenqvist, E.; Flygare, A.-M.; Kalbina, I.; Teng, Y.; Jansen, M.A.K.; Strid, Å. UV-A light induces a robust and dwarfed phenotype in cucumber plants (Cucumis sativus L.) without affecting fruit yield. Sci. Hortic. 2020, 263, 109110. [Google Scholar] [CrossRef]
  64. Currie, H.A.; Perry, C.C. Silica in plants: Biological, biochemical and chemical studies. Ann. Bot. 2007, 100, 1383–1389. [Google Scholar] [CrossRef]
  65. Schaller, J.; Heimes, R.; Ma, J.F.; Meunier, J.-D.; Feng Shao, J.; Fujii-Kashino, M.; Holger Knorr, K. Silicon accumulation in rice plant aboveground biomass affects leaf carbon quality. Plant Soil 2019, 444, 399–407. [Google Scholar] [CrossRef] [Green Version]
  66. Dallagnol, L.J.; Román Ramos, A.E.; da Rosa Dorneles, K. Silicon use in the integrated disease management of wheat: Current knowledge. In Current Trends in Wheat Research; IntechOpen: London, UK, 2020. [Google Scholar]
  67. Lichtenthaler, H.K.; Buschmann, C. Extraction of photosynthetic tissues: Chlorophylls and carotenoids. Curr. Protoc. Food Anal. Chem. 2001, 1, 165–170. [Google Scholar] [CrossRef]
  68. Lichtenthaler, H.K.; Buschmann, C. Chlorophylls and carotenoids: Measurement and characterization by UV-VIS spectroscopy. Curr. Protoc. Food Anal. Chem. 2001, 1, 171–178. [Google Scholar] [CrossRef]
  69. Caldwell, M.M. Solar ultraviolet radiation as an ecological factor for alpine plants. Ecol. Monogr. 1968, 38, 243–268. [Google Scholar] [CrossRef]
  70. Drumm, H.; Mohr, H. The mode of interaction between blue (UV) light photoreceptor and phytochrome in anthocyanin formation of the Sorghum seedling. Photochem. Photobiol. 1978, 27, 241–248. [Google Scholar] [CrossRef]
  71. Schreiber, U.; Kühl, M.; Klimant, I.; Reising, H. Measurement of chlorophyll fluorescence within leaves using a modified PAM fluorometer with a fiber-optic microprobe. Photosynth. Res. 1996, 47, 103–109. [Google Scholar] [CrossRef] [PubMed]
  72. Nečemer, M.; Kump, P.; Ščančar, J.; Jaćimović, R.; Simčič, J.; Pelicon, P.; Budnar, M.; Jeran, Z.; Pongrac, P.; Regvar, M.; et al. Application of X-ray fluorescence analytical techniques in phytoremediation and plant biology studies. Spectrochim. Acta Part B At. Spectrosc. 2008, 63, 1240–1247. [Google Scholar] [CrossRef]
  73. Vekemans, B.; Janssens, K.; Vincze, L.; Adams, F.; Vanespen, P. Analysis of X-ray spectra by iterative least squares (AXIL): New developments. X-ray Spectrom. 1994, 23, 278–285. [Google Scholar] [CrossRef]
  74. Kump, P.; Nečemer, M.; Rupnik, Z.; Pelicon, P.; Ponikvar, D.; Vogel-Mikuš, K.; Regvar, M.; Pongrac, P. Improvement of the XRF quantification and enhancement of the combined applications by EDXRF and micro-PIXE. In Integration of Nuclear Spectrometry Methods as a New Approach to Material Research; IAEA: Vienna, Austria, 2011; pp. 101–109. [Google Scholar]
  75. Korndörfer, G.H.; Coelho, M.N.; Snyder, G.H.; Mizutani, C.T. Evaluation of soil extractants for silicon availability in upland rice. Rev. Bras. Ciência Solo 1999, 23, 101–106. [Google Scholar] [CrossRef]
  76. Ter Braak, C.J.F.; Šmilauer, P. CANOCO Reference Manual and CanoDraw for Windows User’s Guide: Software for Canonical Community Ordination (Version 4.5); Microcomputer Power: Ithaca, NY, USA, 2002. [Google Scholar]
Figure 1. Soil moisture before (day 0/day 2 of K2SiO3 treatment; n = 5) and during water shortage (days 8, 15, 17, 20, and 22 of water shortage; n = 25) for the eight treatments for cucumber plants. Different letters indicate significant differences between the treatments for each measurement day separately.
Stresses 01 00012 g001
Figure 2. Stomatal conductance before water shortage and during water shortage in the morning (n = 10) and before noon and in the afternoon (n = 15) for cucumber plants grown under the eight different treatments. Different letters indicate significant differences between the treatments for each of the four parameters separately.
Stresses 01 00012 g002
Figure 3. Leaf Si and Ca contents for cucumber plants, grown under the eight treatments (n = 10), and plant-available Si level in the soil after K2SiO3 treatment and after water shortage treatment for the eight treatments (n = 5). Different letters indicate significant differences between the treatments for each of the four parameters separately.
Stresses 01 00012 g003
Figure 4. Fruit mass and number of fruits for cucumber plants, grown under the eight different treatments (n = 85). Different letters indicate significant differences between the treatments for each of the two parameters separately. FW, fresh weight.
Stresses 01 00012 g004
Figure 5. Redundancy analysis plot showing the strength of associations between some of the leaf element contents (Ca, Si, and P) and plant biomass and growth parameters. Symbol characteristics: diamonds, UV–; triangles, UV+; thick line, Si+; thin line, Si–; blue, W+; white, W–; DM, dry matter; FM, fresh mass.
Stresses 01 00012 g005
Figure 6. Redundancy analysis plot showing the strength of associations between some of the water availability indicators (soil moisture during water shortage and stomatal conductance during water shortage before noon) along with plant-available Si level in the soil after Si treatment, and leaf element contents. Symbol characteristics: diamonds, UV–; triangles, UV+; thick line, Si+; thin line, Si–; blue, W+; white, W–.
Stresses 01 00012 g006
Table 1. Leaf biochemical traits, leaf element composition, and other traits for cucumber plants, grown under eight different treatments.
Plant ParametersUnitsTreatment
Si+W+UV+Si+W+UV–Si+W–UV+Si+W–UV–Si–W+UV+Si–W+UV–Si–W–UV+Si–W–UV–
Biochemical
UV-B-ASa.u. g−1280 ± 38 abc242 ± 448 a352 ± 60 d331.5 ± 76.2 cd311 ± 50 bcd248 ± 39 ab350± 40 d328 ± 90 cd
UV-A-ASa.u. g−1470 ± 65 ab426 ± 73 a611 ± 112 c587 ± 133 c514 ± 94.0 abc424 ± 69.9 a576 ± 74 bc538 ± 137 bc
Chl a/chl b 1.28 ± 0.27 ab1.50 ± 0.17 bc1.17 ± 0.18 a1.40 ± 0.20 abc1.53 ± 0.23 bc1.69 ± 0.18 c1.12 ± 0.22 a1.15 ± 0.21 a
Total chl/car 6.92 ± 0.73 abc5.54 ± 0.41 a6.97 ± 1.35 abc6.07 ± 0.92 abc5.98 ± 0.56 ab5.06 ± 0.79 a7.74 ± 2.62 bc8.02 ± 1.97 c
Element composition
P content% of DM0.61 ± 0.18 bc0.41 ± 0.11 ab0.56 ± 0.13 abc0.36 ± 0.18 a0.70 ± 0.15 c0.45 ± 0.09 ab0.54 ± 0.15 abc0.45 ± 0.15 ab
S content% of DM0.26 ± 0.04 ab0.24 ± 0.05 a0.30 ± 0.05 ab0.27 ± 0.08 ab0.32 ± 0.08 ab0.28 ± 0.05 ab0.33 ± 0.08 b0.28 ± 0.06 ab
Cl content% of DM0.35 ± 0.07 c0.18 ± 0.04 a0.29 ± 0.07 bc0.23 ± 0.07 ab0.34 ± 0.08 c0.27 ± 0.04 bc0.27 ± 0.06 bc0.22 ± 0.06 ab
K content% of DM2.00 ± 0.35 b1.57 ± 0.16 a1.88 ± 0.14 ab1.95 ± 0.47 ab1.91 ± 0.26 ab1.89 ± 0.26 ab1.98 ± 0.30 b1.74 ± 0.21 ab
Other
Vital leavesg of DM249.7 ± 37.8 c262.7 ± 29.2 c44.6 ± 17.5 a123.5 ± 73.6 b259.5 ± 31.0 c286.0 ± 18.4 c111.5 ± 56.6 b140.3 ± 24.2 b
Dead leavesg of DM16.4 ± 7.6 ab15.7 ± 2.7 ab29.1 ± 5.4 c20.7 ± 13.2 abc10.9 ± 2.6 a10.7 ± 7.0 a21.3 ± 5.2 bc19.1 ± 6.9 ab
All leavesg of DM266.1 ± 32.7 c278.4 ± 30.6 c73.7 ± 16.2 a144.1 ± 61.1 b270.4 ± 29.1 c296.7 ± 15.5 c132.8 ± 51.7 b159.4 ± 19.1 b
Stemsg of DM264.4 ± 23.9 d256.5 ± 18.3 d174.9 ± 19.6 a216.7 ± 31.6 bc232.5 ± 42.2 cd238.0 ± 21.7 cd205.3 ± 12.6 abc197.5 ± 13.5 ab
Aboveground vegetative partsg of DM530.5 ± 23.6 c535.0 ± 45.3 c248.6 ± 27.2 a360.9 ± 55.8 b502.9 ± 57.6 c534.8 ± 32.8 c338.0 ± 59.1 b356.8 ± 20.7 b
Fruits, lengthmm73.6 ± 12.5 b73.7 ± 12.8 b61.6 ± 10.4 a73.5 ± 14.4 b69.5 ± 14.2 ab72.9 ± 12.1 b72.0 ± 11.3 b70.6 ± 11.8 b
Fruits, upper widthmm23.8 ± 5.8 ab26.6 ± 5.1 b21.4 ± 4.9 a26.7 ± 7.9 b22.5 ± 5.4 ab24.6 ± 5.2 ab24.7 ± 5.3 ab25.0 ± 5.7 ab
Fruits, lower widthmm14.5 ± 3.7 a14.9 ± 4.7 a11.5 ± 2.6 a15.2 ± 4.9 a13.3 ± 3.8 a13.6 ± 3.8 a15.4 ± 3.9 a13.3 ± 3.8 a
Aboveground vegetative parts/fruit mass 0.85 ± 0.19 a0.70 ± 0.08 a0.86 ± 0.34 a0.90 ± 0.29 a0.75 ± 0.18 a0.76 ± 0.13 a0.74 ± 0.05 a0.69 ± 0.07 a
SLAcm2 mg−10.18 ± 0.03 ab0.16 ± 0.02 a0.22 ± 0.03 b0.19 ± 0.04 ab0.21 ± 0.05 b0.19 ± 0.04 ab0.23 ± 0.04 b0.20 ± 0.05 b
Data are means ± SD, n = 5, except for UV-B- and UV-A-AS, and leaf element contents (n = 10 for these parameters). Different superscript letters within each row indicate significant differences (p ≤ 0.05; Duncan tests). AS, absorbing substances; chl, chlorophylls; car, carotenoids; a.u., arbitrary units; DM, dry matter; SLA, specific leaf area.
Table 2. Effects of K2SiO3 addition, water availability, ambient UV radiation, and their interactions on selected parameters for cucumber plants and soil.
ParameterFactorial ANOVA
SiWUVSi × WSi × UVW × UVSi × W × UV
Stomatal conductance, morning §ns ***+ns nsnsnsns
Stomatal conductance, before noon §ns **+***nsnsnsns
Stomatal conductance, afternoon §ns ***+**nsnsns*
Vital leaves****+**nsnsnsns
Dead leaves*+***ns nsnsnsns
All leaves****+**nsnsnsns
Stemsns ***+ns nsnsnsns
Aboveground vegetative partsns ***+***nsns*
Fruit massns ***+*nsnsnsns
Number of fruitsns ***+ns nsnsnsns
Fruits, lengthns *+ns nsnsnsns
Fruits, upper widthns ns **nsnsnsns
Fruits, lower widthns ns ns nsnsnsns
Aboveground vegetative parts/fruit massns ns ns nsnsnsns
SLAns **+nsnsnsns
UV-B-ASns ****+nsnsnsns
UV-A-ASns ***ns nsnsnsns
Chl a/chl bns ***+***nsnsns
Total chl/carns **ns *nsnsns
Leaf Si***+***+**+nsnsnsns
Leaf Pns ns ***+nsnsnsns
Leaf Sns ns ns nsnsnsns
Leaf Clns ns ***+nsnsnsns
Leaf Kns ns ns nsnsns*
Leaf Ca*****+ns nsnsnsns
Plant-available Si, after K2SiO3 treatment***+ns ns ns***ns*
Plant-available Si, after water shortage treatment***+**nsnsnsns
* p ≤ 0.05; ** p ≤ 0.01; *** p ≤ 0.001; ns, not significant; +, positive effect of a significant factor; −, negative effect of a significant factor; Si, K2SiO3 addition; W, water availability; UV, ambient UV radiation; Si × W, interaction between K2SiO3 addition and water availability; Si × UV, interaction between K2SiO3 addition and ambient UV radiation; W × UV, interaction between water availability and ambient UV radiation; Si × W × UV, interaction between K2SiO3 addition, water availability, and ambient UV radiation; AS, absorbing substances; chl, chlorophylls; car, carotenoids. § Measurements conducted during water shortage.
Table 3. Total soil Si, Ca, and K levels after K2SiO3 treatment and after water shortage treatment for the eight treatments.
Soil ParameterUnitsTreatment
Si+W+UV+Si+W+UV–Si+W–UV+Si+W–UV–Si–W+UV+Si–W+UV–Si–W–UV+Si–W–UV–
Total soil Si 1% of DM11.12 ± 1.20 a10.07 ± 0.82 a11.00 ± 1.21 a10.43 ± 1.45 a9.93 ± 1.75 a9.76 ± 1.68 a9.59 ± 1.06 a9.98 ± 1.68 a
Total soil Si 2% of DM10.92 ± 0.29 c9.54 ± 1.01 ab9.84 ± 1.00 abc9.91 ± 0.88 abc10.60 ± 0.53 bc10.44 ± 0.99 bc9.91 ± 1.28 abc9.00 ± 0.95 a
Total soil Ca 1% of DM4.29 ± 0.16 ab4.47 ± 0.24 ab4.70 ± 0.56 b4.28 ± 0.62 ab4.40 ± 0.79 ab4.02 ± 0.25 ab4.44 ± 0.42 ab3.99 ± 0.36 a
Total soil Ca 2% of DM4.34 ± 0.19 b4.20 ± 0.25 ab4.43 ± 0.40 b4.17 ± 0.08 ab4.21 ± 0.34 ab4.39 ± 0.23 b3.97 ± 0.18 a4.14 ± 0.16 ab
Total soil K 1% of DM1.14 ± 0.06 a1.15 ± 0.08 a1.10 ± 0.04 a1.06 ± 0.16 a1.07 ± 0.16 a1.00 ± 0.11 a1.04 ± 0.10 a1.04 ± 0.11 a
Total soil K 2% of DM1.02 ± 0.04 a1.04 ± 0.07 a1.08 ± 0.08 a1.08 ± 0.05 a1.02 ± 0.06 a1.06 ± 0.13 a1.03 ± 0.06 a1.00 ± 0.08 a
Data are means ± SD; n = 5. Different superscript letters within each row indicate significant differences (p ≤ 0.05; Duncan tests). DM, dry matter. 1 After K2SiO3 treatment. 2 After water shortage treatment.
Table 4. Pearson’s correlation coefficients between plant biomass and growth parameters, and environmental and leaf physiological parameters for the cucumber plants in this study.
Plant Biomass and Growth ParametersEnvironmental and Leaf Physiological Parameters
Soil Moisture #Fv/Fm, Morning §Fv/Fm, Noon §Fv/Fm, Day §Fq’/Fm’ §Stomatal Conductance, Morning §Stomatal Conductance, Before Noon §Stomatal Conductance, Afternoon §
Vital leaves0.874 **0.623 **0.589 **−0.2620.1230.833 **0.553 **0.858 **
Dead leaves−0.546 **−0.607 **−0.522 **0.074−0.104−0.568 **−0.540 **−0.668 **
All leaves0.887 **0.610 **0.583 **−0.2740.1220.840 **0.542 **0.857 **
Stems0.699 **0.2390.369 *−0.489 **0.1100.618 **0.3050.553 **
Aboveground vegetative parts0.898 **0.541 **0.561 **−0.366 *0.1280.837 **0.510**0.829 **
Fruit mass0.757 **0.552 **0.495 **−0.1910.2500.702 **0.436 **0.750 **
Number of fruits0.712 **0.326 *0.532 **−0.2600.1670.605 **0.1780.597 **
Fruits, length0.335 *0.340 *0.343 *−0.0790.0230.317 *0.412 **0.428 **
Fruits, upper width0.0790.1130.380 *−0.0770.0270.1040.3120.224
Fruits, lower width0.1590.2860.155−0.077−0.0230.1140.1940.172
Aboveground vegetative parts/fruit mass−0.092−0.310−0.164−0.226−0.238−0.082−0.054−0.215
SLA−0.334 *−0.378 *−0.369 *0.059−0.290−0.386 *−0.331 *−0.450 **
* p ≤ 0.05; ** p ≤ 0.01; Fv/Fm, potential photochemical efficiency; Fq’/Fm’, effective photochemical efficiency. # Means of measurements conducted on days 8, 15, 17, 20, and 22 of water shortage. § Measurements performed during water shortage.
Publisher’s Note: MDPI stays neutral with regard to jurisdictional claims in published maps and institutional affiliations.

