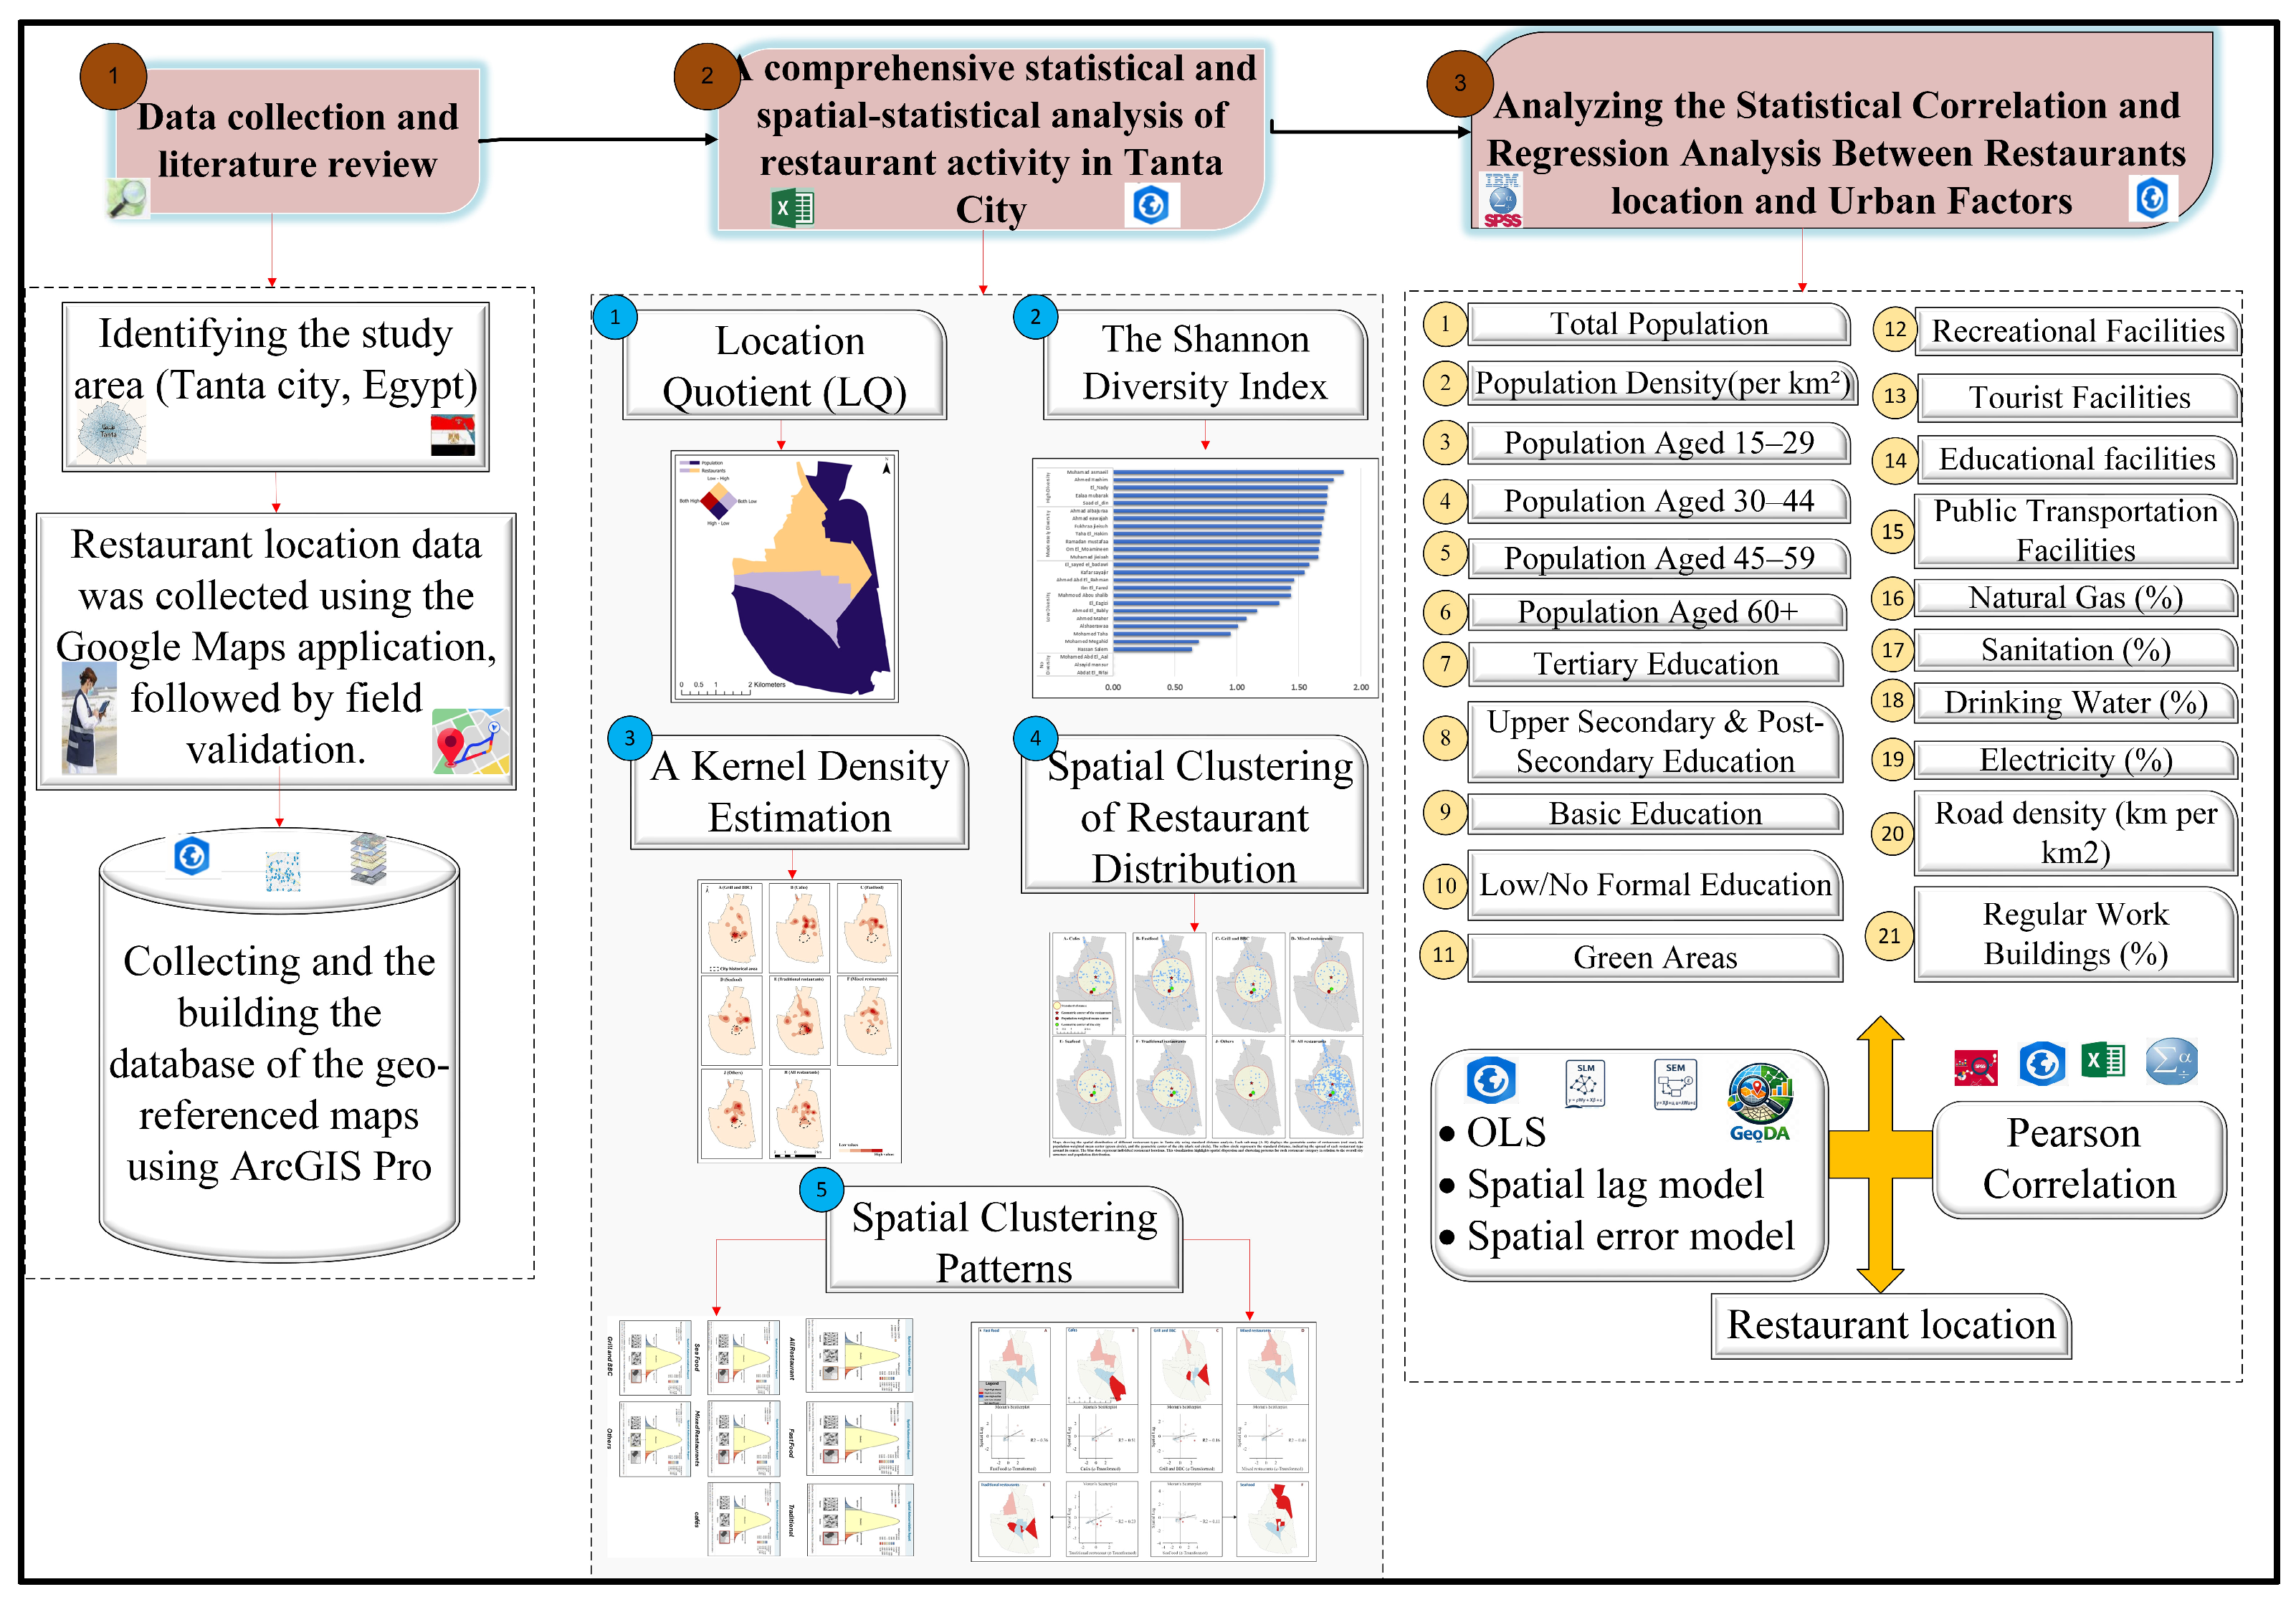
1. Introduction
Urban food geography [
1,
2,
3] has emerged as a critical framework for understanding the spatial organization [
4] and accessibility [
4,
5,
6,
7,
8] of food systems in contemporary cities, linking production, distribution, retail, and consumption with urban infrastructure and broader socio-environmental processes [
9,
10,
11,
12]. In rapidly urbanizing Global South cities, these dynamics are often accompanied by pronounced spatial inequalities, where peripheral and low-income areas experience limited access to diverse and high-quality food outlets [
13,
14].
In Egypt, food is deeply intertwined with cultural, religious, and social identity, and dining out functions as both a social practice and a marker of status [
15]. Restaurants not only reflect local culture but also shape urban experiences related to tourism and recreation [
16,
17]. The sector has gained increasing economic significance, with households allocating approximately 37.1% of income to food and beverages [
18], and the hotel and restaurant sector generating nearly
$13 billion in 2019 [
19]. Despite this importance, the spatial logic governing restaurant distribution in Egyptian cities remains underexplored both theoretically and empirically.
Advanced GIS [
20], spatial statistics, and foodshed analyses have been widely used to identify clustering patterns [
21,
22], central–peripheral dynamics, and local “food deserts” [
23], supporting planning and policy interventions [
24,
25,
26]. However, these approaches remain largely descriptive and often assume spatial independence, overlooking spatial autocorrelation and neighborhood spillover effects. This limitation can bias estimations and obscure latent spatial processes such as micro-accessibility and localized infrastructure effects. Addressing this gap requires integrating spatial econometric approaches; as Abu El Ela [
27] notes, geospatial data is a “key element” of smart city development. Accordingly, this study moves beyond descriptive analysis by incorporating spatial econometric modeling to account for spatial dependence and improve analytical robustness.
Conceptually, spatial agglomeration is often operationalized through clusters or hotspots and refers to the concentration of activities in specific locations beyond the spatial average. This concept has been widely applied across diverse domains, including industrial location analysis, crime geography, and urban service distribution [
28,
29,
30], reflecting its analytical versatility. Spatial clustering can be measured using advanced geostatistical and spatial statistical techniques, such as kernel density estimation (KDE), Location Quotient (LQ), and Moran’s I, which provide insights into patterns of concentration, diversity, and spatial inequality [
31].
Building on this conceptual foundation, the spatial organization of restaurants is closely linked to urban economic and social dynamics. Restaurants tend to agglomerate in central urban areas to maximize visibility, accessibility, and profitability [
32,
33,
34]. Such clustering enhances consumer attraction, facilitates knowledge exchange, improves productivity, and reduces search costs [
35], although proximity may also intensify competition in the absence of functional differentiation [
36]. Moreover, agglomeration generates cumulative advantages within the restaurant sector, as it provides access to a diverse mix of offerings in a single location, allows new establishments to benefit from the attractiveness of existing clusters, and facilitates rapid competitive responsiveness [
37].
Despite the extensive documentation of these patterns, they are often interpreted through a single theoretical lens, either emphasizing hierarchical centrality or flow-based dynamics, without adequately examining their interaction. To address this limitation, this study advances a mechanism-based perspective on restaurant clustering that integrates Central Place Theory (CPT) and Central Flow Theory (CFT). Rather than treating these frameworks as competing explanations, they are conceptualized as complementary processes whose relative influence varies across spatial and socio-economic contexts. This introduces a key theoretical tension: while CPT predicts relatively stable, hierarchy-driven clustering based on population thresholds, CFT emphasizes more fluid, mobility-driven clustering shaped by flows and network interactions. Understanding how these mechanisms interact is essential for explaining spatial inequalities in urban service provision.
Within this framework, CPT and CFT are not directly examined as complete theoretical systems; instead, they are operationalized through measurable proxy variables representing residential demand (e.g., population density) and infrastructural connectivity (e.g., road density). These proxies approximate, but do not fully capture, the underlying mechanisms, particularly the dynamic nature of flow processes. Accordingly, the study introduces a non-linear interaction mechanism between these dimensions, examining whether infrastructural connectivity moderates the relationship between population-based demand and restaurant distribution. It is hypothesized that the interaction between population-based demand (CPT) and infrastructure-driven accessibility (CFT) is non-linear, such that increasing connectivity may eventually offset or weaken the influence of traditional population thresholds.
Despite considerable research in the Global North, most studies on restaurant geographies focus on large metropolitan contexts, leaving mid-sized cities, particularly in the Global South, relatively underexplored. Empirical studies in the UK, the Netherlands, Sweden, and China highlight the role of population density, tourism, urban infrastructure, and cultural preferences in shaping restaurant distribution [
30,
38,
39,
40,
41]. Other research links restaurant density to public health outcomes, such as obesity and stroke, particularly where fast-food outlets cluster near schools or in high-density urban areas [
42,
43,
44]. However, these studies remain limited in two key respects: they are predominantly based on large metropolitan contexts in the Global North, and they rarely integrate hierarchical (CPT) and flow-based (CFT) explanations within a unified analytical framework.
In Egypt, Tanta—a mid-sized city in the Middle Delta represents a particularly suitable case for examining restaurant geography within this context. Between 1984 and 2015, nearly 10 km
2 of agricultural land were converted into urban areas, reflecting increasing tensions between urban growth, environmental sustainability, and service provision [
45]. Tanta’s dual role as a hub of religious tourism, exemplified by the Al-Badawi Mosque, and as an educational center, including Tanta University, significantly shapes patterns of consumer demand, mobility flows, and accessibility. At the same time, its historic commercial core has weakened under processes of urban change and the expansion of informal practices, raising important questions regarding spatial reconfiguration and urban vitality [
46].
These characteristics position Tanta as an appropriate case for examining how multiple spatial mechanisms interact in shaping restaurant distribution beyond large metropolitan contexts, particularly under conditions of mixed centrality and dynamic mobility flows. Moreover, Tanta’s high-density urban fabric and its distinctive role as a Deltaic hub provide a suitable setting for applying spatial econometric models. In this regard, the study moves beyond traditional Ordinary Least Squares (OLS) by employing Spatial Error Modeling (SEM), which accounts for unobserved spatial effects, such as localized economic informalities and micro-accessibility that conventional descriptive approaches fail to capture.
Traditional explanations of urban service distribution have largely emphasized demographic thresholds and spatial gravity. Central Place Theory (CPT) [
47] posits that urban systems are structured as hierarchical networks in which services are distributed according to population thresholds [
48] and consumer travel ranges. Beyond its geometric representation, CPT provides a behavioral explanation for hierarchical clustering: under conditions of limited information, travel costs, and risk aversion, consumers tend to minimize uncertainty by patronizing nearby and familiar locations. This behavior reinforces the concentration of services in higher-order centers while constraining the viability of lower-order locations. Consequently, clustering emerges in a nested hierarchical form, where central areas accumulate higher densities and diversity of restaurants, while peripheral areas remain relatively under-served.
Empirically, CPT implies that restaurant distribution is strongly associated with resident-based and structural variables, such as population size, population density, and socio-economic characteristics (e.g., educational status), which collectively reflect stable demand and threshold conditions. However, such hierarchical stability relies on restrictive assumptions, including spatial uniformity, single-purpose trips, and limited mobility. These assumptions are increasingly violated in rapidly urbanizing contexts, particularly in cities of the Global South, where multi-purpose travel, informal economies, and heterogeneous accessibility conditions prevail.
In contrast, Central Flow Theory (CFT), or Flow Place Theory (FPT), conceptualizes urban space as a dynamic system shaped by flows of people, capital, and information [
49,
50]. Rather than emphasizing equilibrium and hierarchy, CFT interprets clustering as an emergent outcome of mobility patterns and network interactions. High-flow corridors, transport nodes [
51], and activity hubs act as spatial attractors [
52], concentrating restaurants in locations that maximize exposure to transient demand. Under conditions of increased mobility, reduced friction of distance, and diversified trip purposes, clustering becomes more fluid, multi-nodal, and less dependent on traditional centrality.
From an empirical perspective, CFT suggests that restaurant distribution is better explained by flow-related and environmental variables, including urban infrastructure, accessibility conditions, recreational and green areas, and other activity-generating land uses that intensify human movement and interaction.
Integrating CPT and CFT therefore requires distinguishing not only between their conceptual foundations but also between their observable empirical signatures. CPT-driven clustering is expected to dominate in contexts characterized by stable residential demand, strong distance-decay effects, and limited mobility, resulting in statistically significant associations with demographic and socio-economic variables. In contrast, CFT-driven clustering prevails in areas shaped by intense mobility flows, diversified urban functions, and high accessibility, where variables related to the built environment and activity spaces become more explanatory.
Accordingly, this study addresses the following research questions: (1) What are the dominant spatial patterns of restaurant distribution in Tanta? (2) To what extent does the non-linear interaction between residential demand (CPT) and infrastructure flows (CFT) explain restaurant distribution, and does a spatial saturation effect exist? (3) Under what observable spatial conditions do CPT-related and CFT-related variables exhibit stronger statistical associations with restaurant clustering? (4) Where and why do spatial inequalities in restaurant provision emerge?
To operationalize this integrated framework, the study adopts a multi-stage quantitative approach that combines non-spatial and spatial analytical techniques. Initially, Pearson correlation analysis is used to examine the relationships between restaurant distribution and two sets of variables representing CPT and CFT mechanisms. This is followed by multiple linear regression (OLS) to assess their combined explanatory power. To account for spatial dependence and potential spatial autocorrelation, spatial econometric models are subsequently applied, enabling a more robust analysis of the processes shaping restaurant distribution.
This methodological integration is particularly important, as ignoring spatial dependence may lead to biased or inefficient estimates, thereby limiting the explanatory power of traditional models. In the case of Tanta, the use of Z-score standardization and Spatial Error Modeling (SEM) allows for a more robust empirical comparison between CPT-related variables (e.g., population density) and CFT-related variables (e.g., infrastructure), while accounting for spatial autocorrelation in the error structure (Lambda). This improves the reliability of coefficient estimates, although it does not fully eliminate potential omitted variable bias.
By integrating these analytical stages, the study captures both hierarchical and flow-driven patterns of restaurant distribution, while explicitly accounting for spatial dependence in model estimation and interpretation. While CPT explains clustering in terms of population thresholds and centrality, CFT captures mobility-driven dynamics associated with religious tourism, student movement, and informal economic networks. This combined approach enables the identification of hybrid spatial structures and provides a more comprehensive understanding of spatial inequalities, accessibility, and functional diversity in a mid-sized Global South city.
This study aims to examine the spatial distribution, diversity, and inequalities of restaurants in Tanta through an integrated CPT–CFT framework, identifying how hierarchical and flow-based mechanisms interact to shape clustering patterns across urban space. By bridging theoretical models with empirical analysis, the study contributes to urban geography literature by offering a mechanism-based interpretation of restaurant clustering and providing evidence-based insights for urban planning, spatial equity, and service accessibility in mid-sized Global South cities.
Importantly, the study does not seek to definitively test CPT or CFT as complete theoretical systems. Rather, it empirically explores how variables associated with each framework interact under specific urban conditions, providing a context-sensitive interpretation of spatial clustering. In doing so, it provides an empirical operationalization of the interaction between Central Place Theory (CPT) and Central Flow Theory (CFT) by reconceptualizing them as complementary, mechanism-based processes governing urban service distribution.
Specifically, the study contributes to three main ways. First, it moves beyond the traditional static interpretation of CPT by linking hierarchical clustering to observable demographic and socio-economic variables. Second, it refines CFT by grounding flow-based clustering in measurable urban and environmental indicators, such as infrastructure and activity-generating spaces. Third, it introduces a context-dependent perspective on the interaction between the two frameworks, demonstrating how their relative influence varies across space and produces hybrid spatial structures.
Despite these contributions, the analytical scope of the study must be clearly acknowledged. Given the cross-sectional nature of the data and reliance on proxy variables, the study does not establish causal relationships or directly observe dynamic flow processes. Instead, it provides a spatially explicit and statistically informed analysis of how infrastructural connectivity and localized demand jointly shape observable clustering patterns within defined analytical boundaries.
The remainder of the paper is structured as follows: the methodology section describes the study area, data sources, and analytical approach; the results section presents spatial and statistical analyses; the discussion interprets the findings within the CPT–CFT framework; and the conclusion outlines key implications for urban planning and future research.
3. Results
3.1. Spatial Inequality and Service Provision
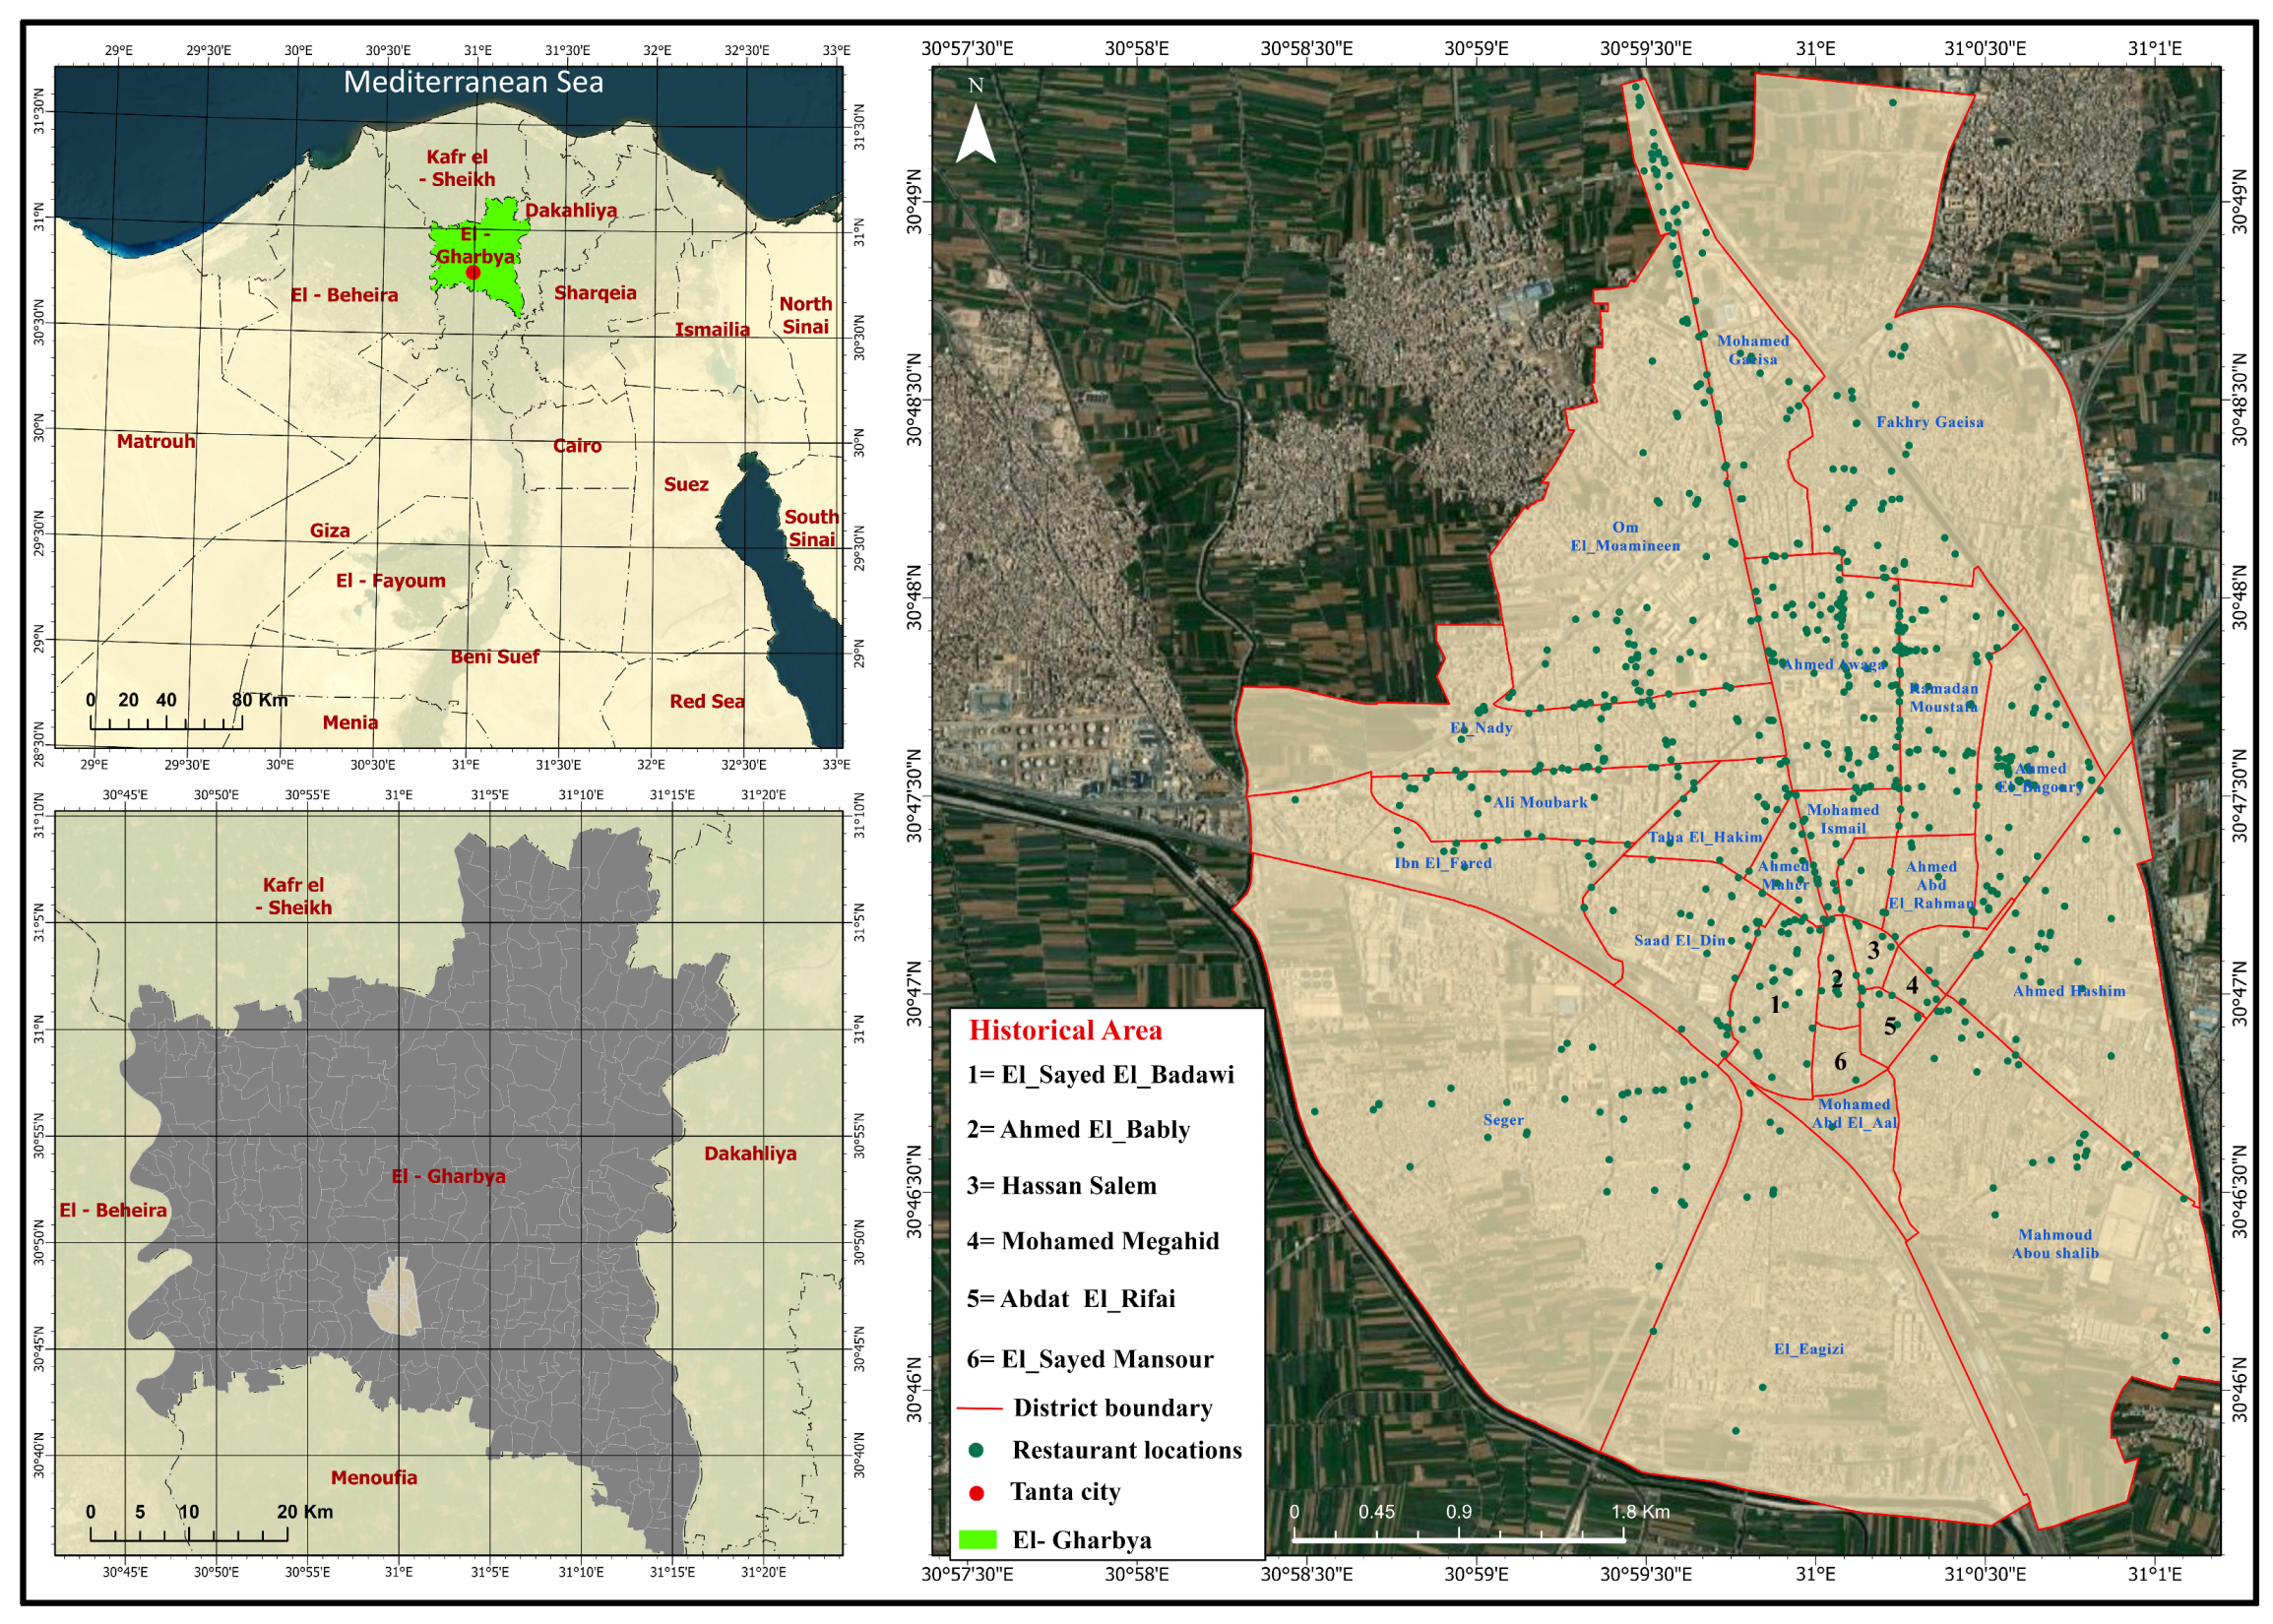
To address RQ1 (spatial patterns) and RQ4 (spatial inequalities), the analysis identifies and interprets significant spatial disparities in the distribution of restaurants across Tanta, moving beyond purely descriptive mapping toward a mechanism-based interpretation grounded in the interaction between demand-based (CPT) and flow-based (CFT) dynamics. Of the 760 restaurants recorded, 47.11% are concentrated in five neighborhoods; Ahmed Awaga, Om El-Moamineen, Ahmed El-Bagoury, Ramadan Moustafa, and Mohamed Gaeisa, although these areas represent only 18.51% of the city’s population. This pronounced spatial imbalance suggests that restaurant concentration cannot be fully explained by population thresholds alone, as assumed by CPT, but appears to be more strongly associated with areas characterized by high accessibility and intensified mobility flows, consistent with a flow-oriented interpretation (CFT).
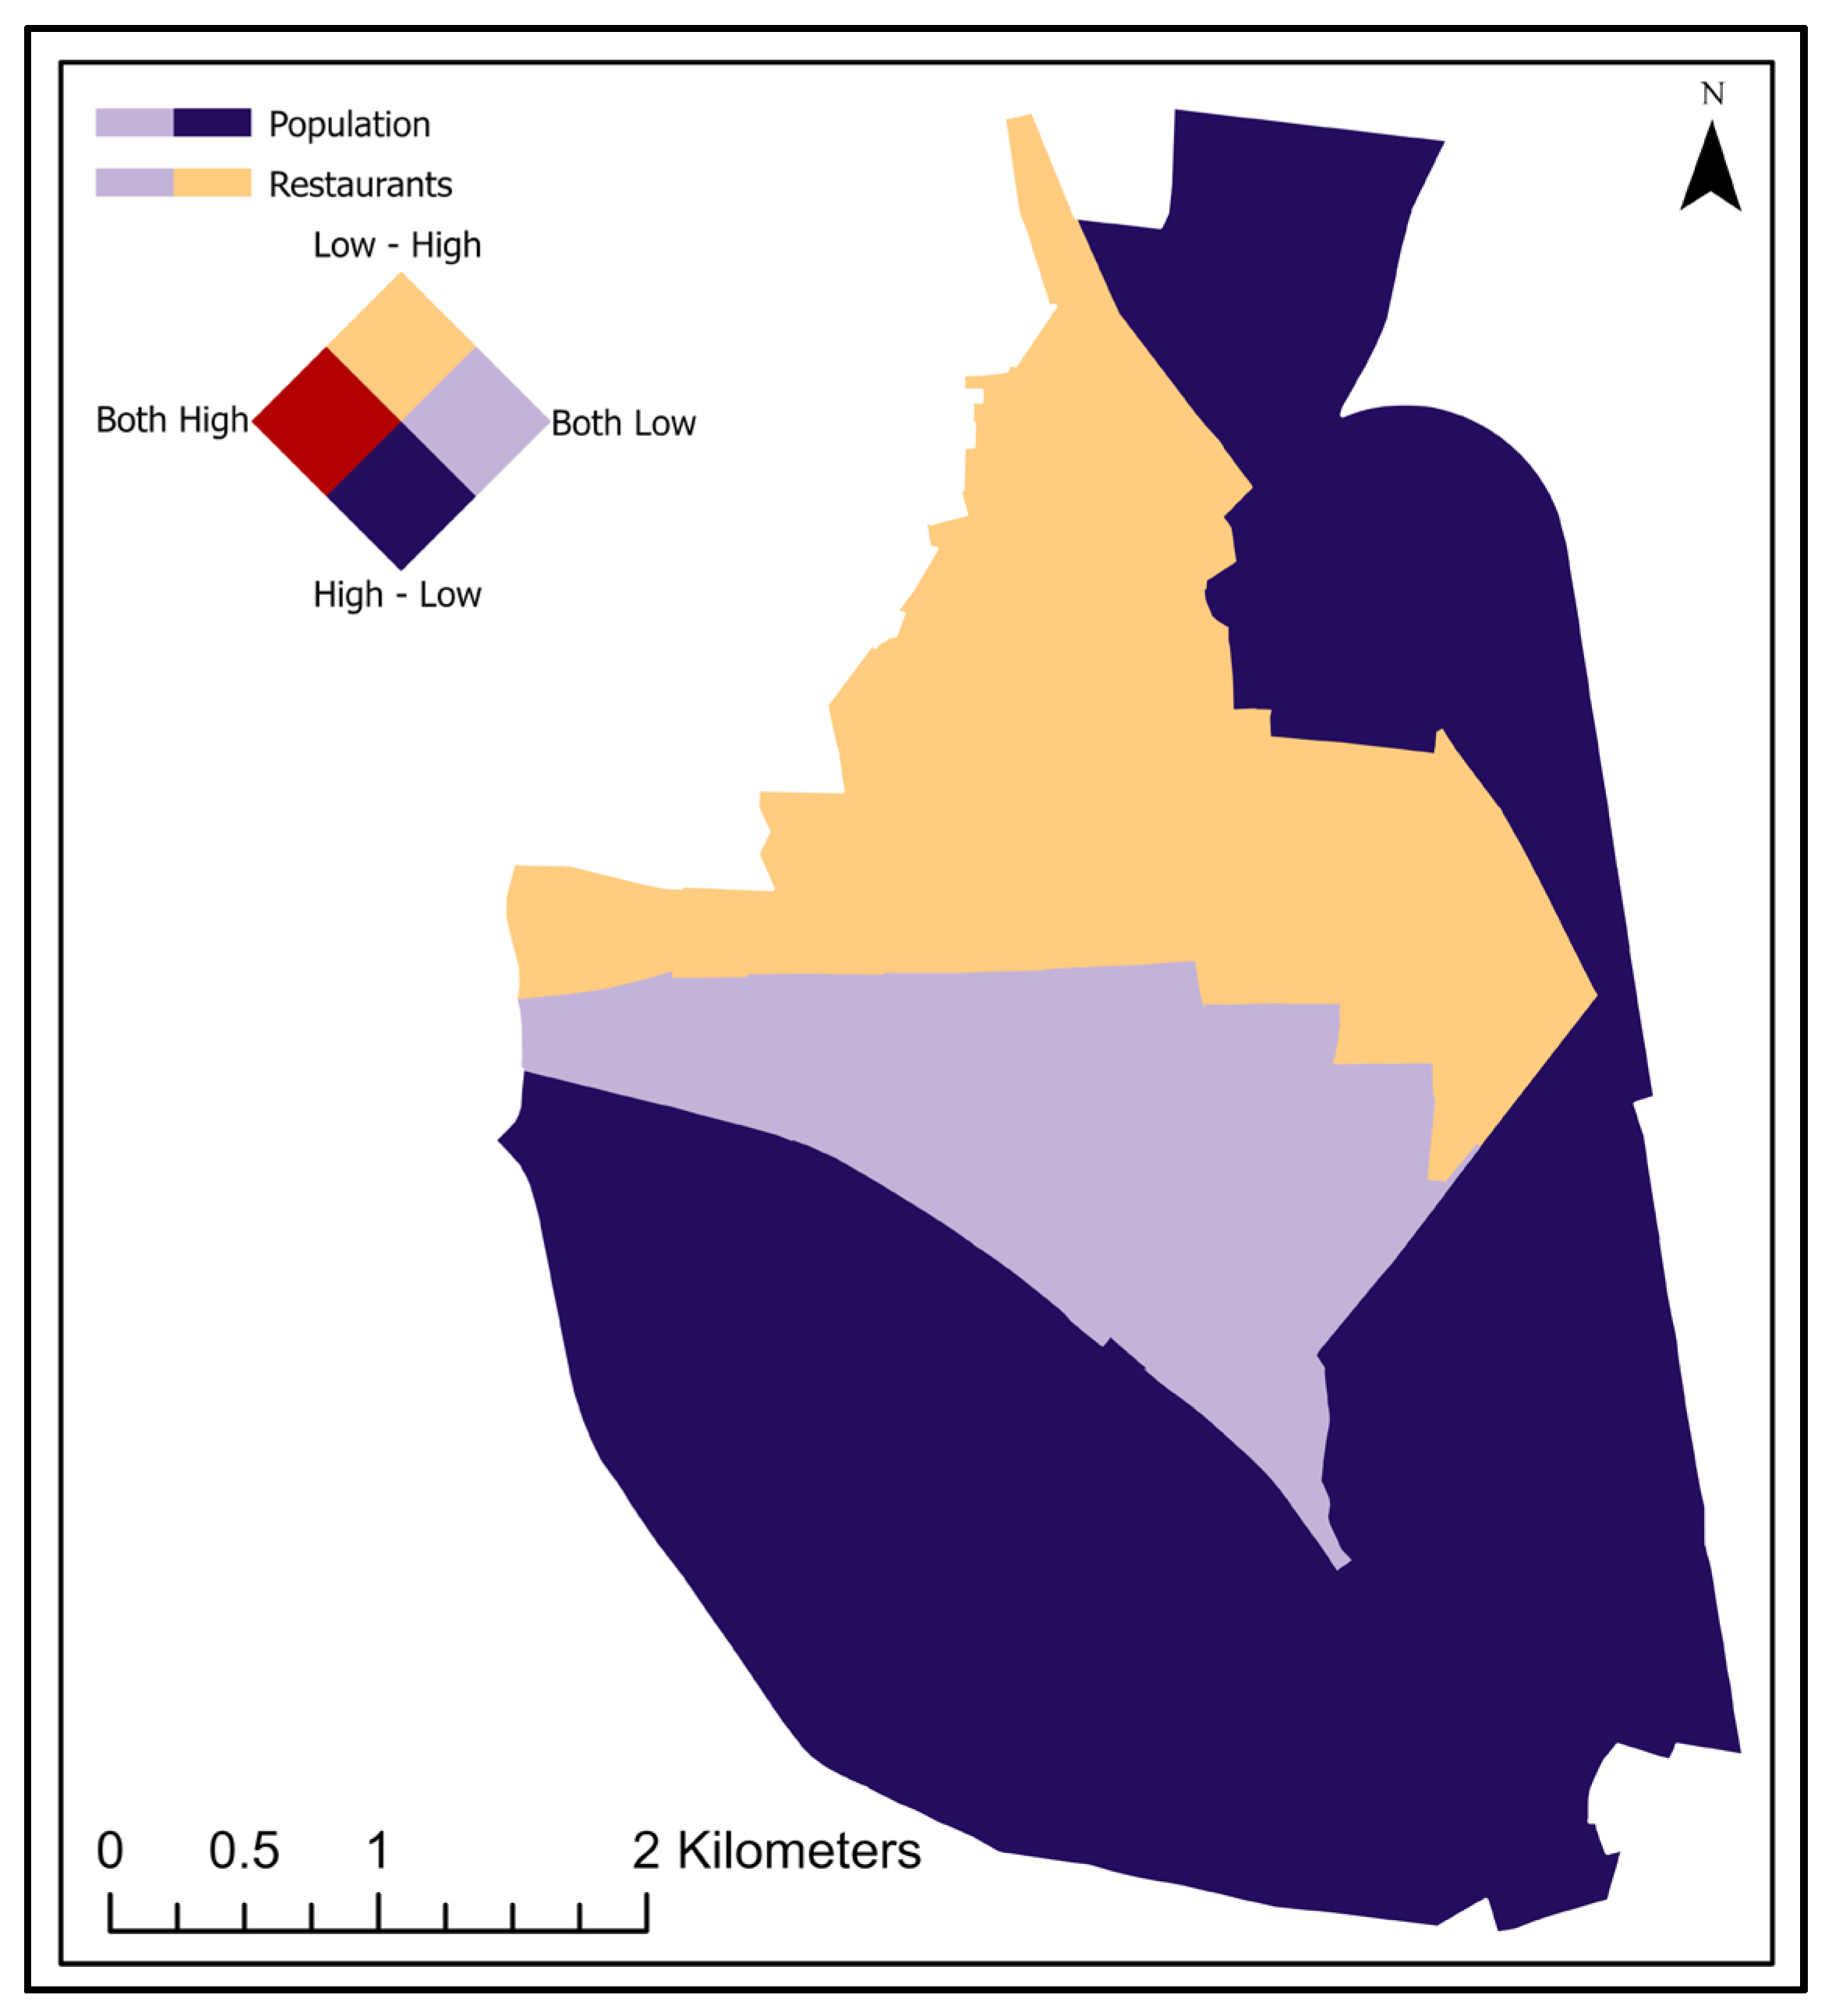
Table 3 presents the Location Quotient (LQ), showing a highly uneven spatial structure. Ahmed El-Bably (LQ = 5.49), Ahmed Awaga (LQ = 4.79), and Mohamed Ismail (LQ = 4.08) emerge as dominant clusters. Rather than definitively reflecting high local demand, these extreme LQ values, particularly in relatively low-population neighborhoods, indicate that clustering may be influenced by spatial advantages linked to network centrality and movement corridors. This pattern can be interpreted as a relative shift from demand-driven (CPT) to flow-influenced (CFT) clustering, where exposure to transient populations potentially outweighs resident-based demand.
Figure 4 introduces a bivariate typology (HH, HL, LH, LL), which provides a spatially explicit framework for distinguishing between CPT-consistent and CPT-divergent patterns of service distribution. HH areas reflect alignment between population demand and service provision (CPT-consistent clustering), whereas HL areas represent under-served zones where population demand is not matched by restaurant availability, indicating spatial inequality. In contrast, LH areas reveal clusters that emerge with limited correspondence to local population demand, highlighting the possible dominance of flow-based mechanisms (CFT), while LL areas reflect structurally marginal zones with limited demand and accessibility. This typology therefore demonstrates that spatial clustering in Tanta is not uniform but varies according to the relative influence of hierarchical and flow-based processes.
Taken together, these findings directly address RQ4 by demonstrating that spatial inequality in Tanta is associated with a partial decoupling between population distribution and service provision, where accessibility, mobility flows, and network position appear to play a more influential role than demographic thresholds alone. This decoupling provides indicative empirical support that qualifies (rather than rejects) the conventional CPT assumption of demand-aligned service distribution and instead supports a context-dependent interpretation in which CFT mechanisms become more prominent in highly accessible urban contexts.
3.2. Categorical Distribution
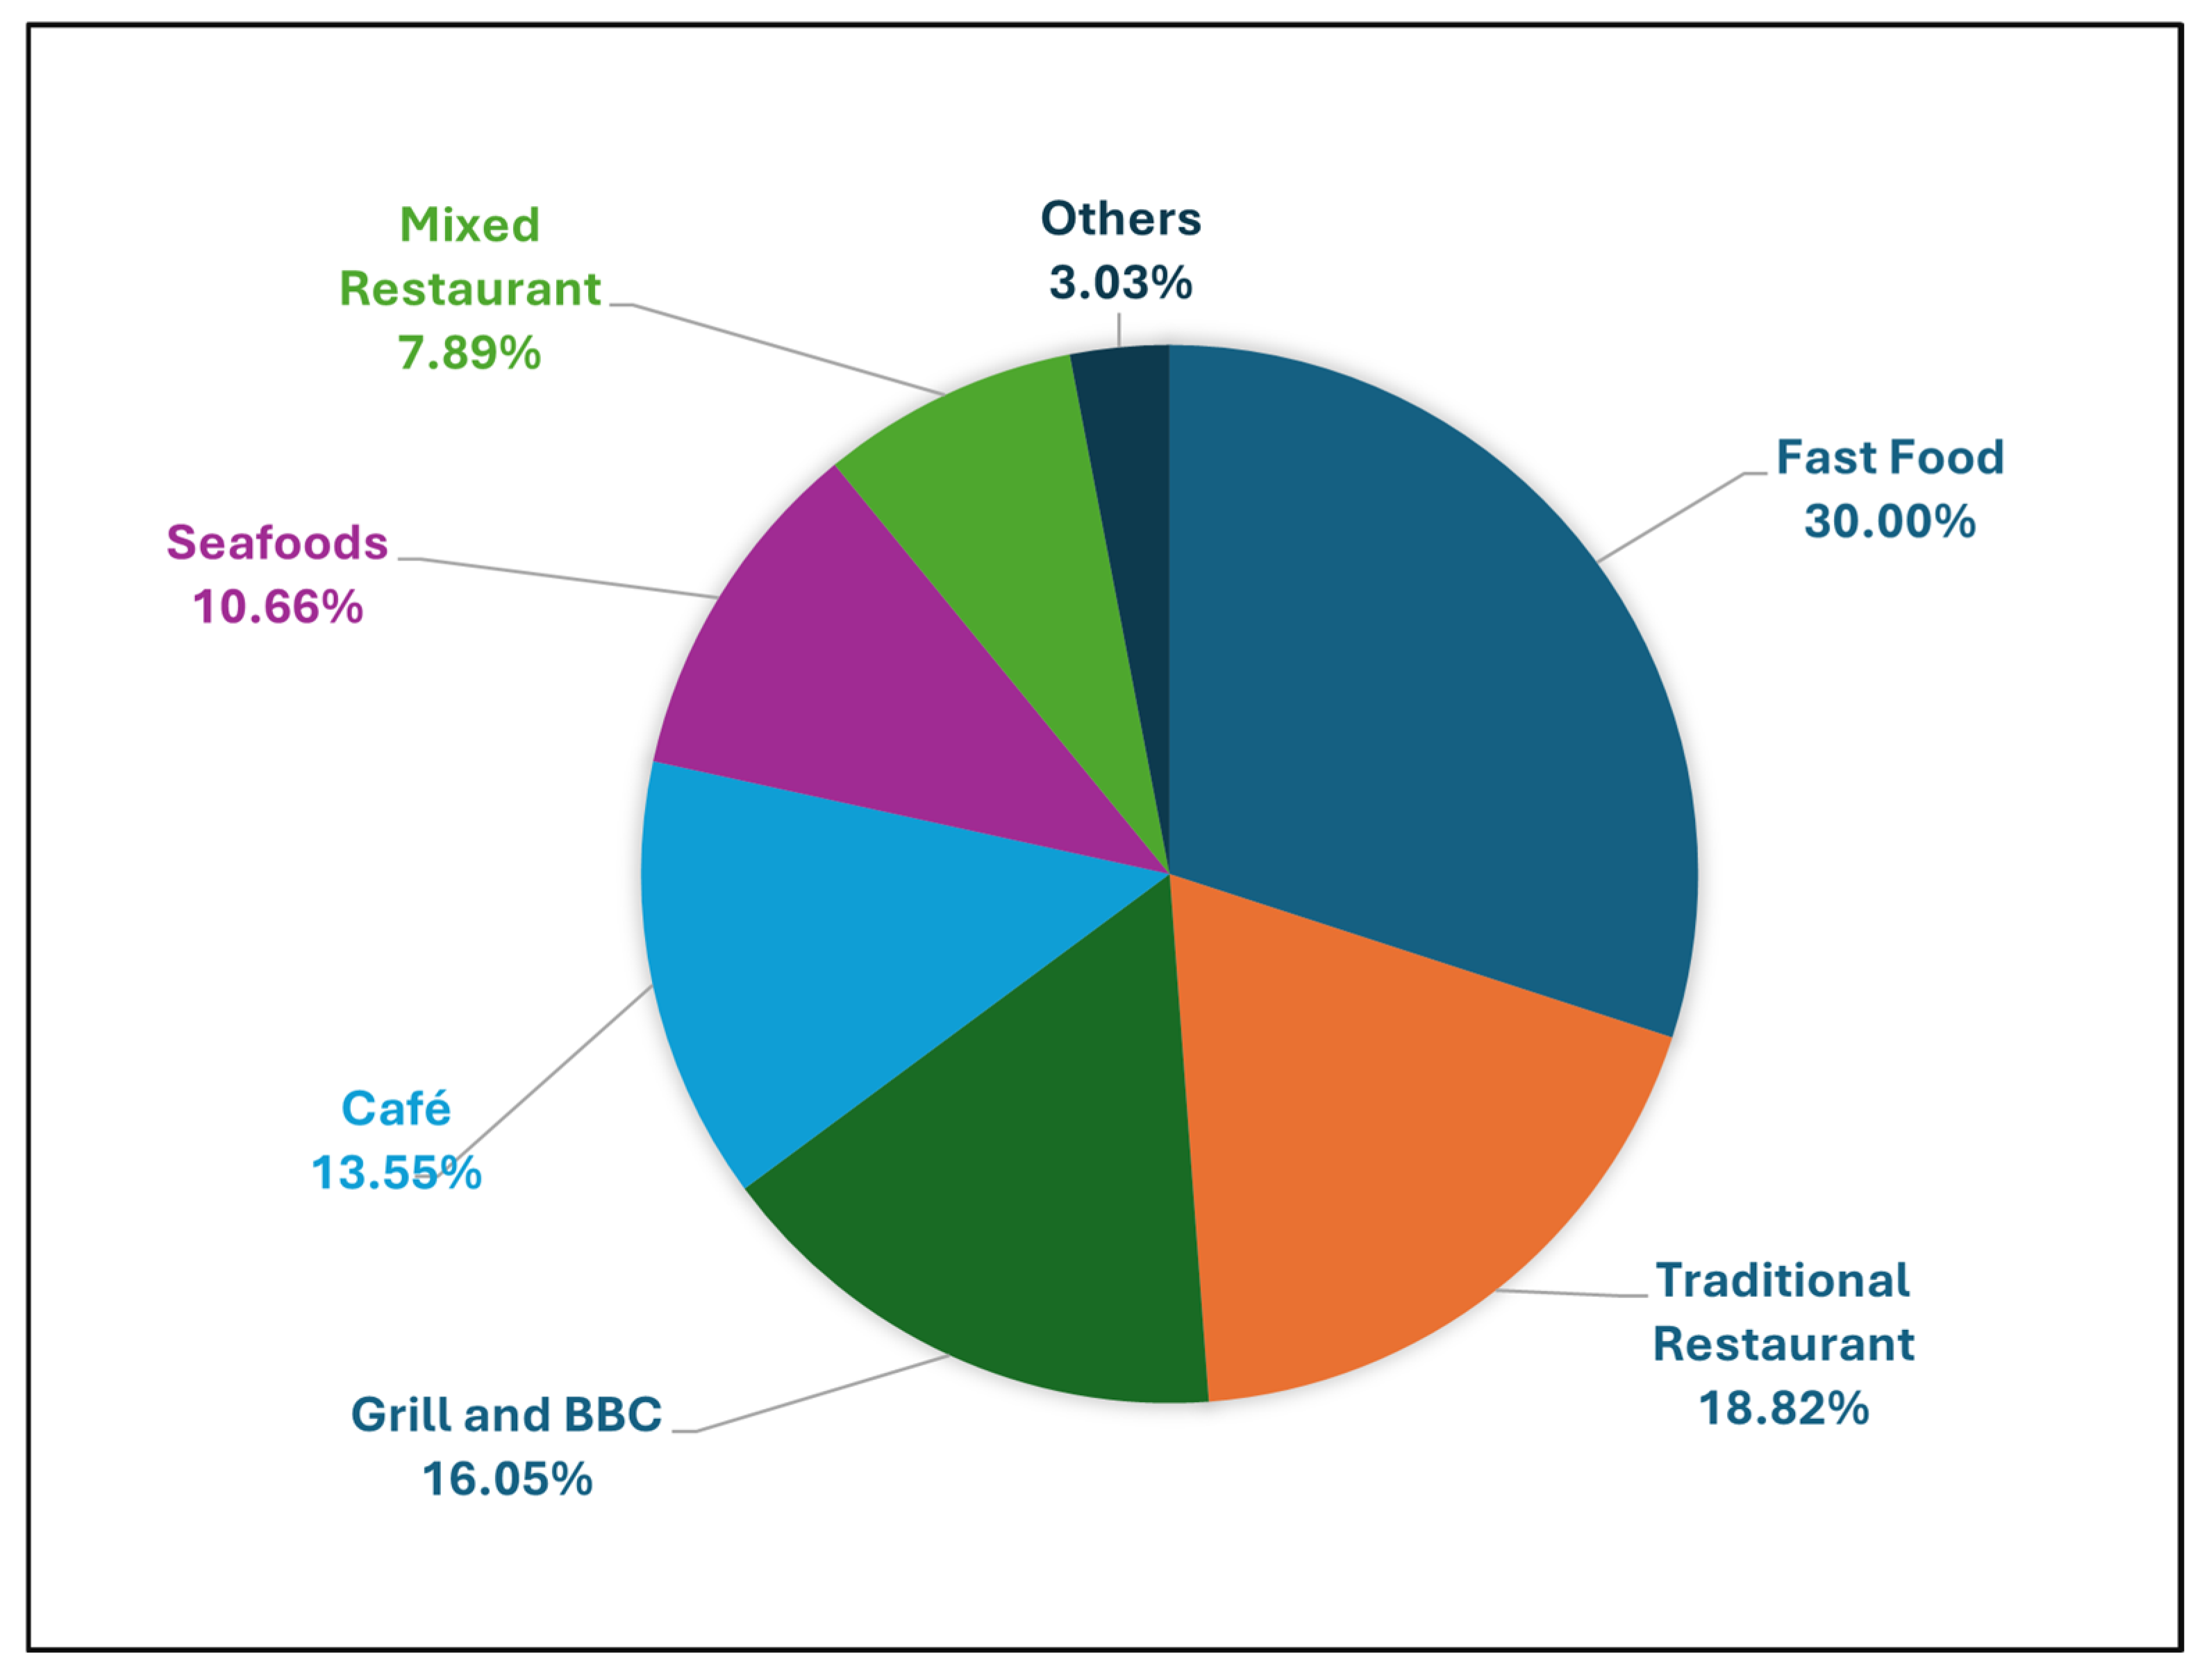
To further address RQ1, the categorical composition of restaurants (
Figure 5) reveals differentiated spatial patterns. Rather than representing simple variation in distribution, these patterns can be interpreted as reflecting distinct underlying spatial mechanisms, indicating that each category responds differently, albeit to varying degrees, to demand structures (CPT) and mobility-driven dynamics (CFT).
Fast-food outlets (30%) exhibit strong clustering in a limited number of neighborhoods. This pattern is not merely a concentration effect but suggests a functional dependence on high pedestrian turnover and transient demand, where visibility and accessibility are critical. This aligns with CFT dynamics, as high turnover and accessibility requirements tend to associate these outlets with dense activity nodes and mobility corridors rather than residential demand alone. Such clustering indicates that fast-food establishments are likely to locate in areas of intensified movement, consistent with flow-influenced agglomeration processes.
Traditional restaurants (18.82%) remain concentrated in Ahmed Awaga, Om El-Moamineen, and Seger, which may reflect CPT-driven persistence tied to historic centrality and relatively stable local demand. This pattern can be associated with embedded socio-cultural practices and habitual consumption, where restaurants rely on repeat customers and established neighborhood identities, broadly consistent with CPT assumptions of threshold demand and spatial stability. Grill and BBQ establishments show localized clustering, suggesting a hybrid spatial logic in which neighborhood-level demand interacts with accessibility and exposure to passing flows, producing intermediate clustering patterns.
Cafés (13.55%) are concentrated in central areas, which appears to reflect CFT-related dynamics associated with leisure flows, student populations, and social interaction spaces rather than purely residential demand. Their spatial distribution highlights the potential importance of activity-based clustering, where proximity to universities, commercial centers, and public spaces may enhance their attractiveness, thereby reinforcing flow-oriented spatial tendencies.
The remaining categories display more dispersed patterns, indicating a relatively lower dependence on centrality and a broader spatial reach across the urban system. This dispersion suggests reduced sensitivity to both strict demand thresholds and high-intensity flows, implying that these categories may operate under more flexible location strategies and serve wider catchment areas.
These patterns address RQ1 by demonstrating that restaurant distribution varies systematically by category, not as a single uniform spatial process, but as a differentiated outcome shaped by the relative and context-dependent influence of CPT and CFT mechanisms across food types. This finding supports the argument that urban food service distribution is better understood through a multi-mechanism perspective rather than a single theoretical lens.
3.3. Functional Diversity and Evenness (SDI)
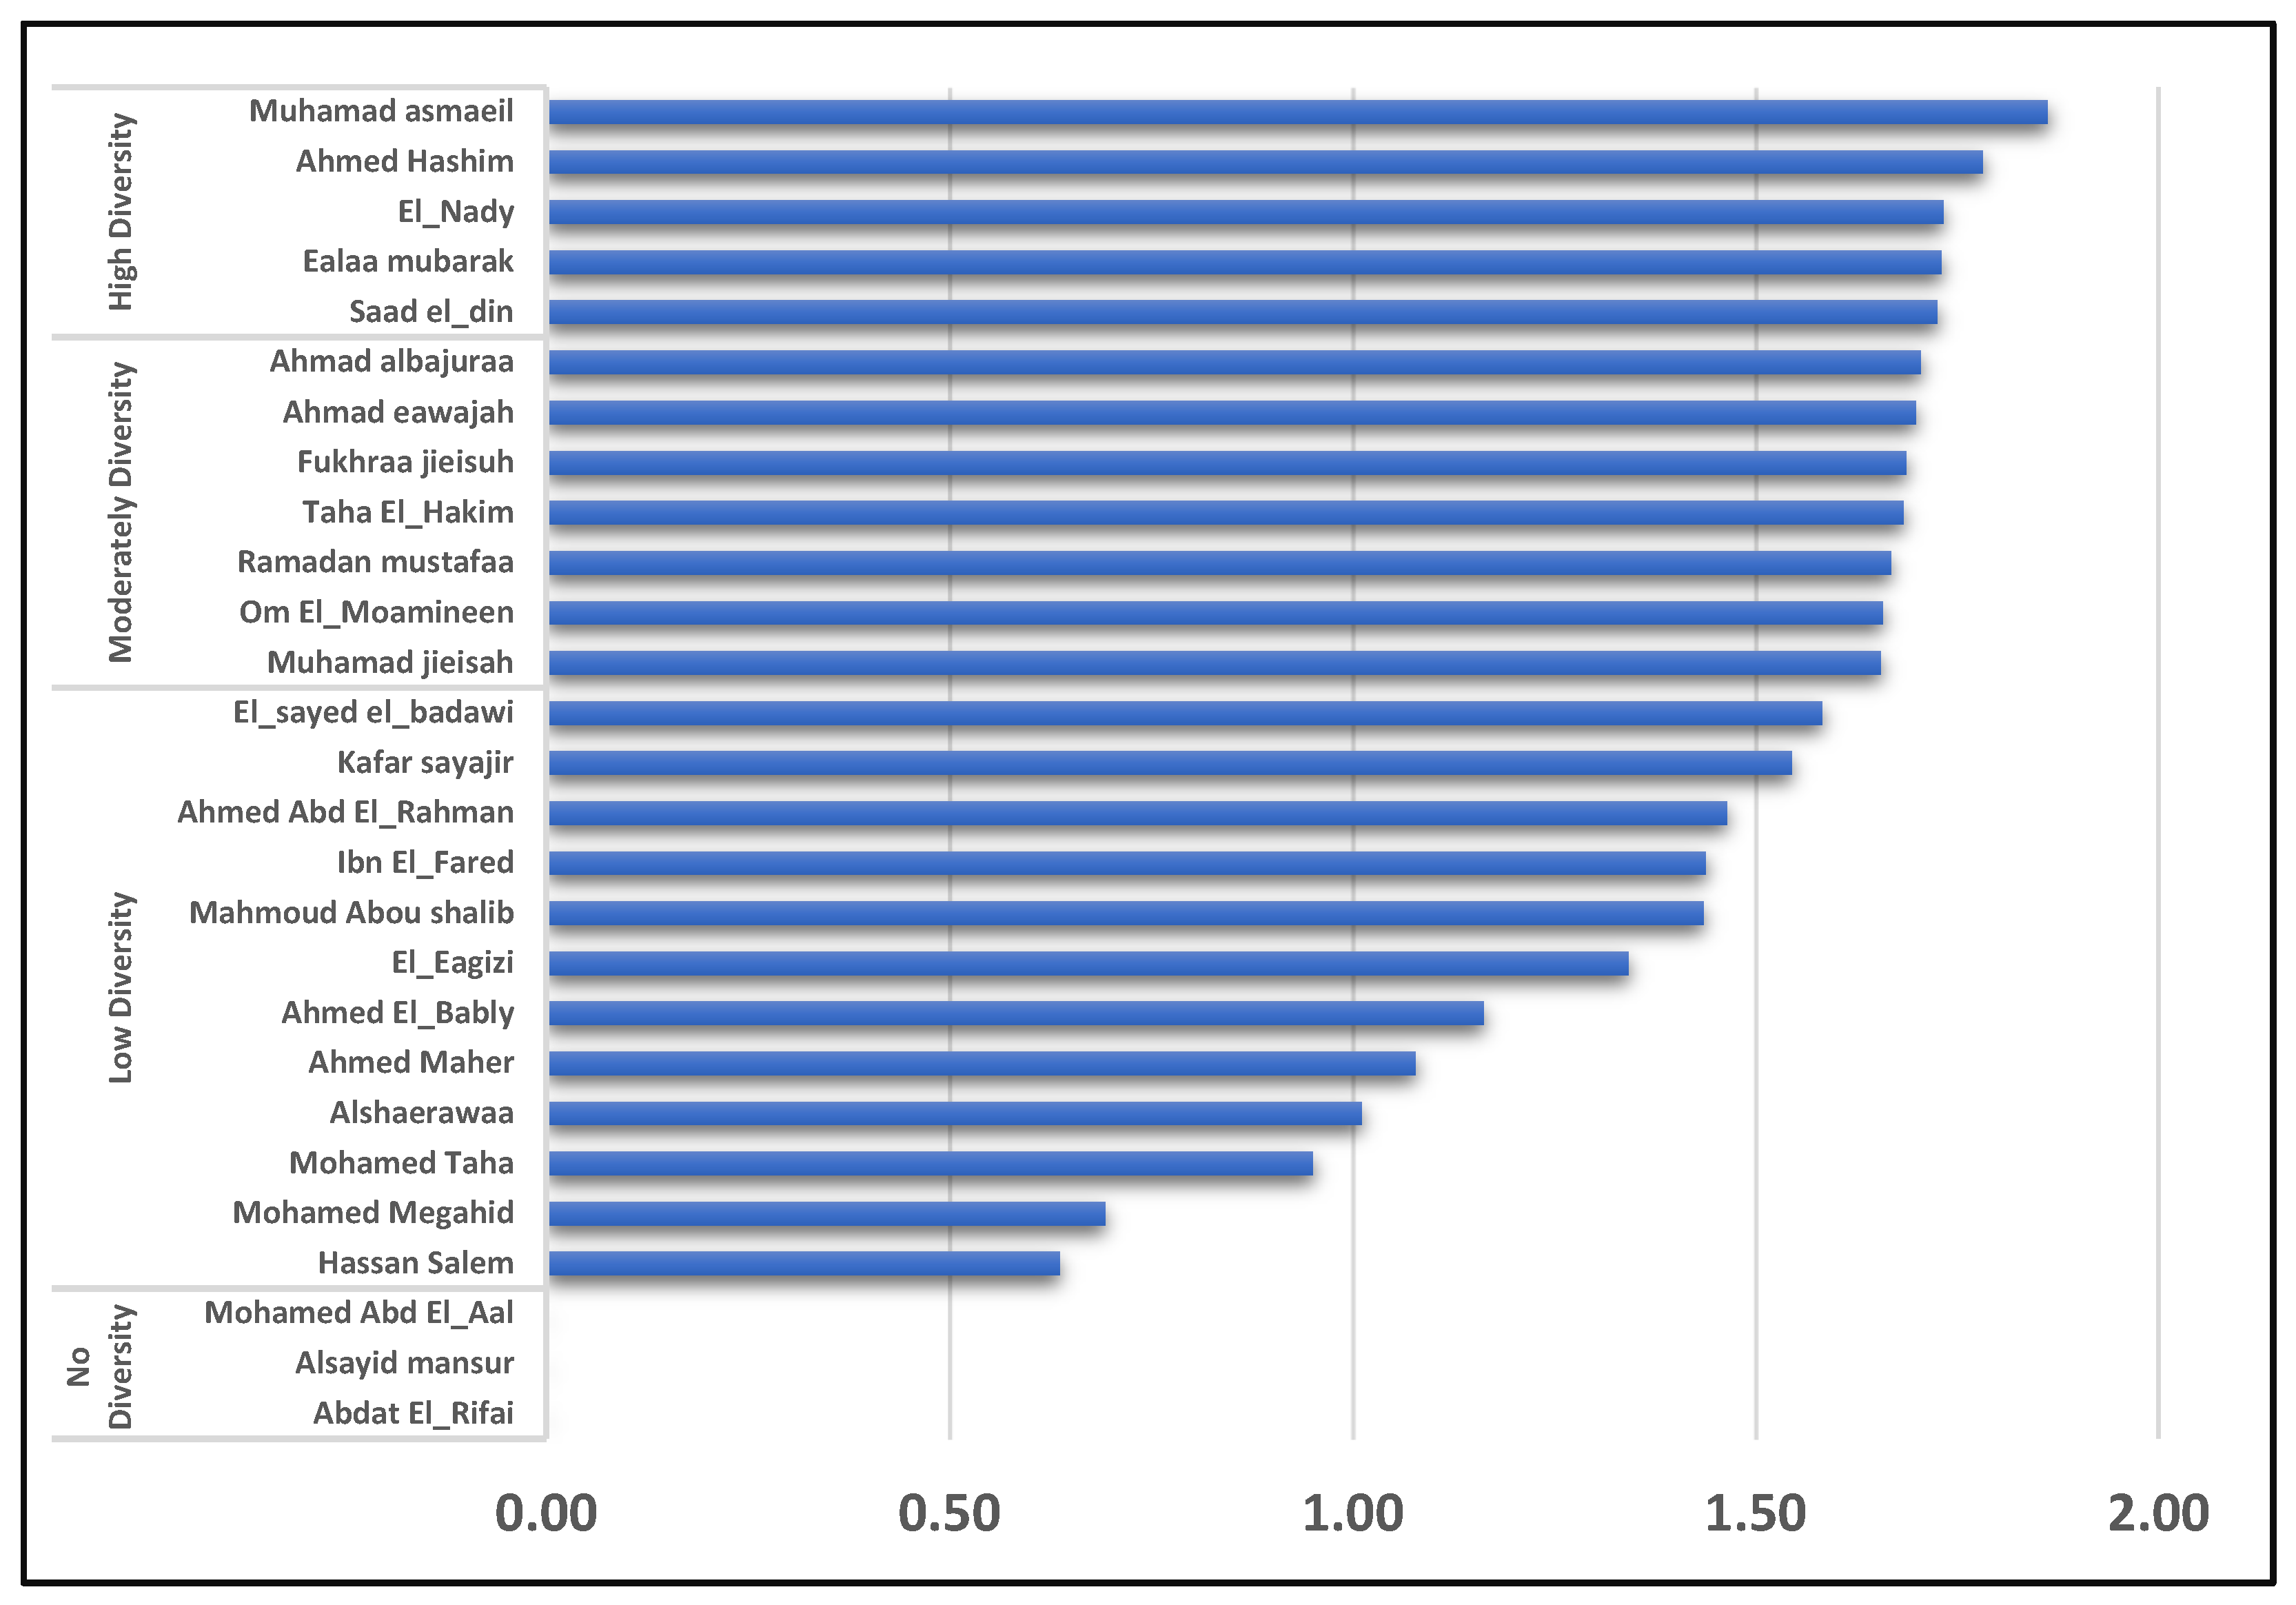
In relation to RQ1 and RQ4, the Shannon Diversity Index (SDI) reveals marked spatial variation in both diversity and evenness (
Figure 6). Rather than reflecting simple differences in the number of establishments, this variation can be interpreted as capturing underlying differences in functional complexity and the ability of neighborhoods to support diversified consumption patterns.
Low-diversity neighborhoods (e.g., Seger, El-Sayed El-Badawi) show constrained functional structures. Despite their relative centrality, the limited diversity suggests that central location alone may be insufficient to generate functional complexity. This pattern may indicate a degree of functional rigidity, implying that historical centrality (CPT) does not necessarily guarantee diversified consumption structures without the presence of continuous and heterogeneous mobility flows (CFT). It also suggests that historical specialization may limit diversification, highlight a potential limitation of CPT when considered in isolation.
High-diversity neighborhoods (e.g., Mohamed Ismail, Ahmed Hashim, El-Nady) exhibit relatively balanced category distributions. This balance can be associated with multifunctional consumption environments, where a wide range of food options coexist within the same spatial context. These areas may function as multifunctional consumption hubs, consistent with CFT environments characterized by higher flow intensity and diversified demand.
Low-diversity neighborhoods (e.g., Seger, El-Sayed El-Badawi) show constrained functional structures. Despite their relative centrality, the limited diversity suggests that central location alone is insufficient to generate functional complexity. This pattern indicates path dependency or functional rigidity, partially contradicting CPT expectations of diversified central services. It implies that historical specialization or entrenched consumption patterns may limit diversification even in hierarchically central areas, highlighting a structural limitation of CPT when considered in isolation.
At the lowest end, neighborhoods such as Abdat El-Rifai show minimal diversity, indicating restricted access and a likely dependence on inter-neighborhood mobility. In these areas, limited local options may lead residents to rely on movement to access diverse food services, potentially reinforcing inequalities in both accessibility and service quality.
These findings extend RQ4 by demonstrating that inequality operates not only in service quantity but also in diversity and evenness, affecting the quality of access to urban food systems. This highlights that spatial inequality is multidimensional, encompassing not only the presence of services (CPT perspective) but also their functional diversity and responsiveness to dynamic demand (CFT perspective).
3.4. Mapping Restaurant Concentration (KDE)
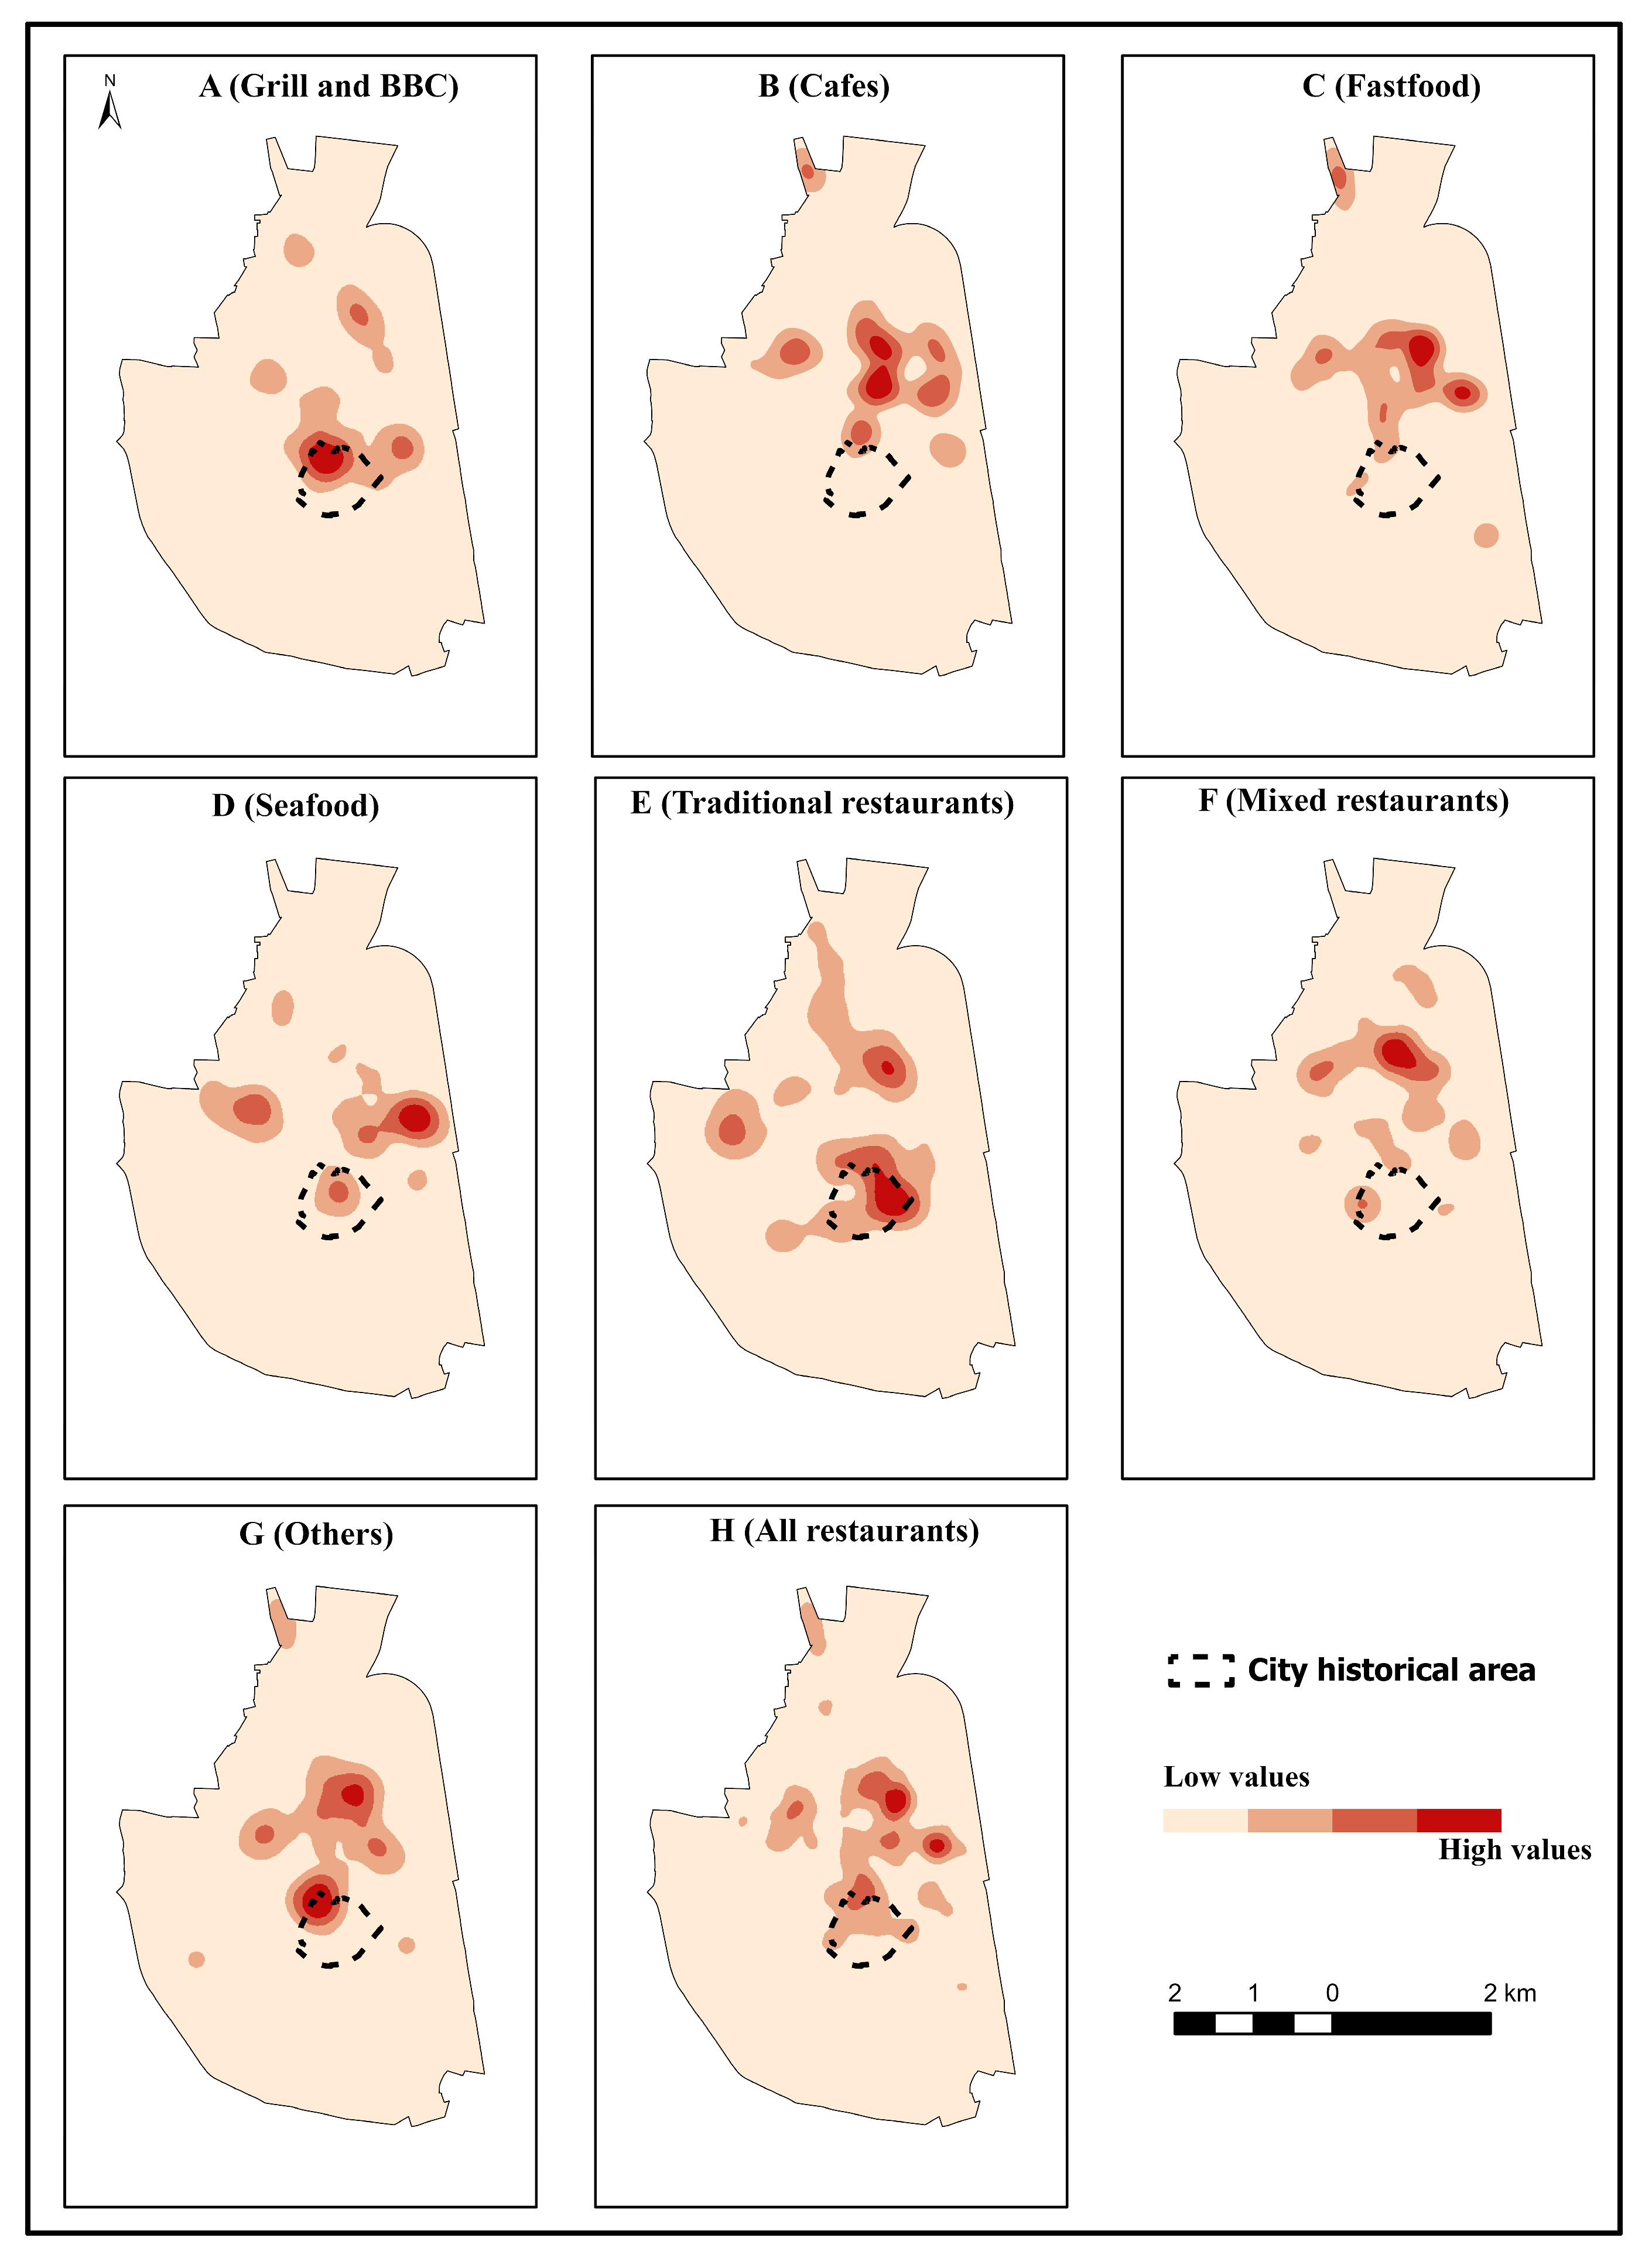
To address RQ2, Kernel Density Estimation (KDE) is employed to examine whether clustering reflects hierarchical (CPT) or flow-based (CFT) mechanisms. Rather than merely identifying spatial concentrations, KDE is used here as an analytical tool to distinguish between competing clustering logics and to reveal the spatial conditions under which each mechanism dominates. The resulting density surfaces indicate the emergence of a polycentric and hybrid urban foodscape in Tanta, shaped by the interaction between hierarchical centrality and mobility-driven flows. Beyond identifying clusters, KDE surfaces reveal spatial inequalities in access to food services, raising critical questions for urban planning. By overlaying KDE outputs with the historic-core boundary (
Figure 7), the analysis distinguishes between density hot spots driven by hierarchical centrality (CPT) and those formed by mobility flows (CFT).
Traditional restaurants as well as grill and BBQ establishments remain tightly anchored in the historic core, indicating a strong dependence on historically embedded centrality and stable demand structures. This reflects centrality sustained by cultural anchors such as El-Sayed El-Badawi Mosque and adjacent markets. These patterns are consistent with CPT, where accumulated accessibility, symbolic value, and long-established consumption practices reinforce hierarchical clustering. Grill and BBQ outlets also extend into adjacent neighborhoods, indicating diffusion outward from a central nucleus. This outward spread suggests a secondary process of spatial spillover, where central agglomeration generates localized expansion into nearby areas. Mixed cuisines radiate along arterial streets, illustrating selective centrality shaped by accessibility and co-location effects. Here, clustering is not purely hierarchical but reflects interaction between centrality and movement, indicating transitional zones between CPT and CFT influence. The composite surface further confirms an exceptionally dense cluster spanning the old commercial district, Tanta Sporting Club, and major corridors such as El-Bahr and El-Nahhas Streets, representing the core of overlapping hierarchical and flow-based forces.
By contrast, cafés and seafood restaurants exhibit clear flow-dependent clustering. Café hot spots align with educational anchors such as Tanta University and high-footfall corridors, reflecting youth-driven leisure and daily mobility flows. This pattern demonstrates that demand is generated not by residential density, but by temporally concentrated activity flows, a defining feature of CFT environments. Seafood restaurants concentrate along arterial road networks in the city’s east and west, indicating niche markets tied to connectivity rather than population density. Their distribution highlights the role of accessibility and pass-through movement in sustaining specialized services, further reinforcing flow-based spatial organization. Together, these patterns highlight the rise of secondary subcenters that expand CPT logic into flow-sensitive urban morphologies.
Fast food outlets display a hybrid configuration: dense clusters in the historic core coexist with linear alignments along El-Bahr and El-Nahhas corridors and near recreational attractors. This dual spatial structure reflects the simultaneous importance of central visibility (CPT) and continuous exposure to high mobility flows (CFT). This duality illustrates how standardized formats benefit from central visibility while also leveraging mobility flows along high-traffic axes, representing a clear empirical manifestation of CPT–CFT interaction.
Overall, KDE reveals a dual centrality regime that is simultaneously core-anchored and flow-extended. Rather than a single dominant spatial logic, restaurant distribution in Tanta emerges from the coexistence and interaction of hierarchical and flow-based mechanisms operating at different spatial scales. While hierarchy-oriented types remain concentrated within the historic core, flow-dependent formats generate emergent corridor-linked subcenters. This differentiated logic not only advances theoretical insights into CPT–CFT interplay but also highlights planning challenges, as uneven access to diverse food services reflects the combined influence of history, infrastructure, and mobility. These findings provide empirical support for a contingency-based interpretation, in which the dominance of CPT or CFT varies according to local spatial conditions, rather than following a uniform urban model.
3.5. Characterizing the Spatial Clustering of Restaurant Distribution
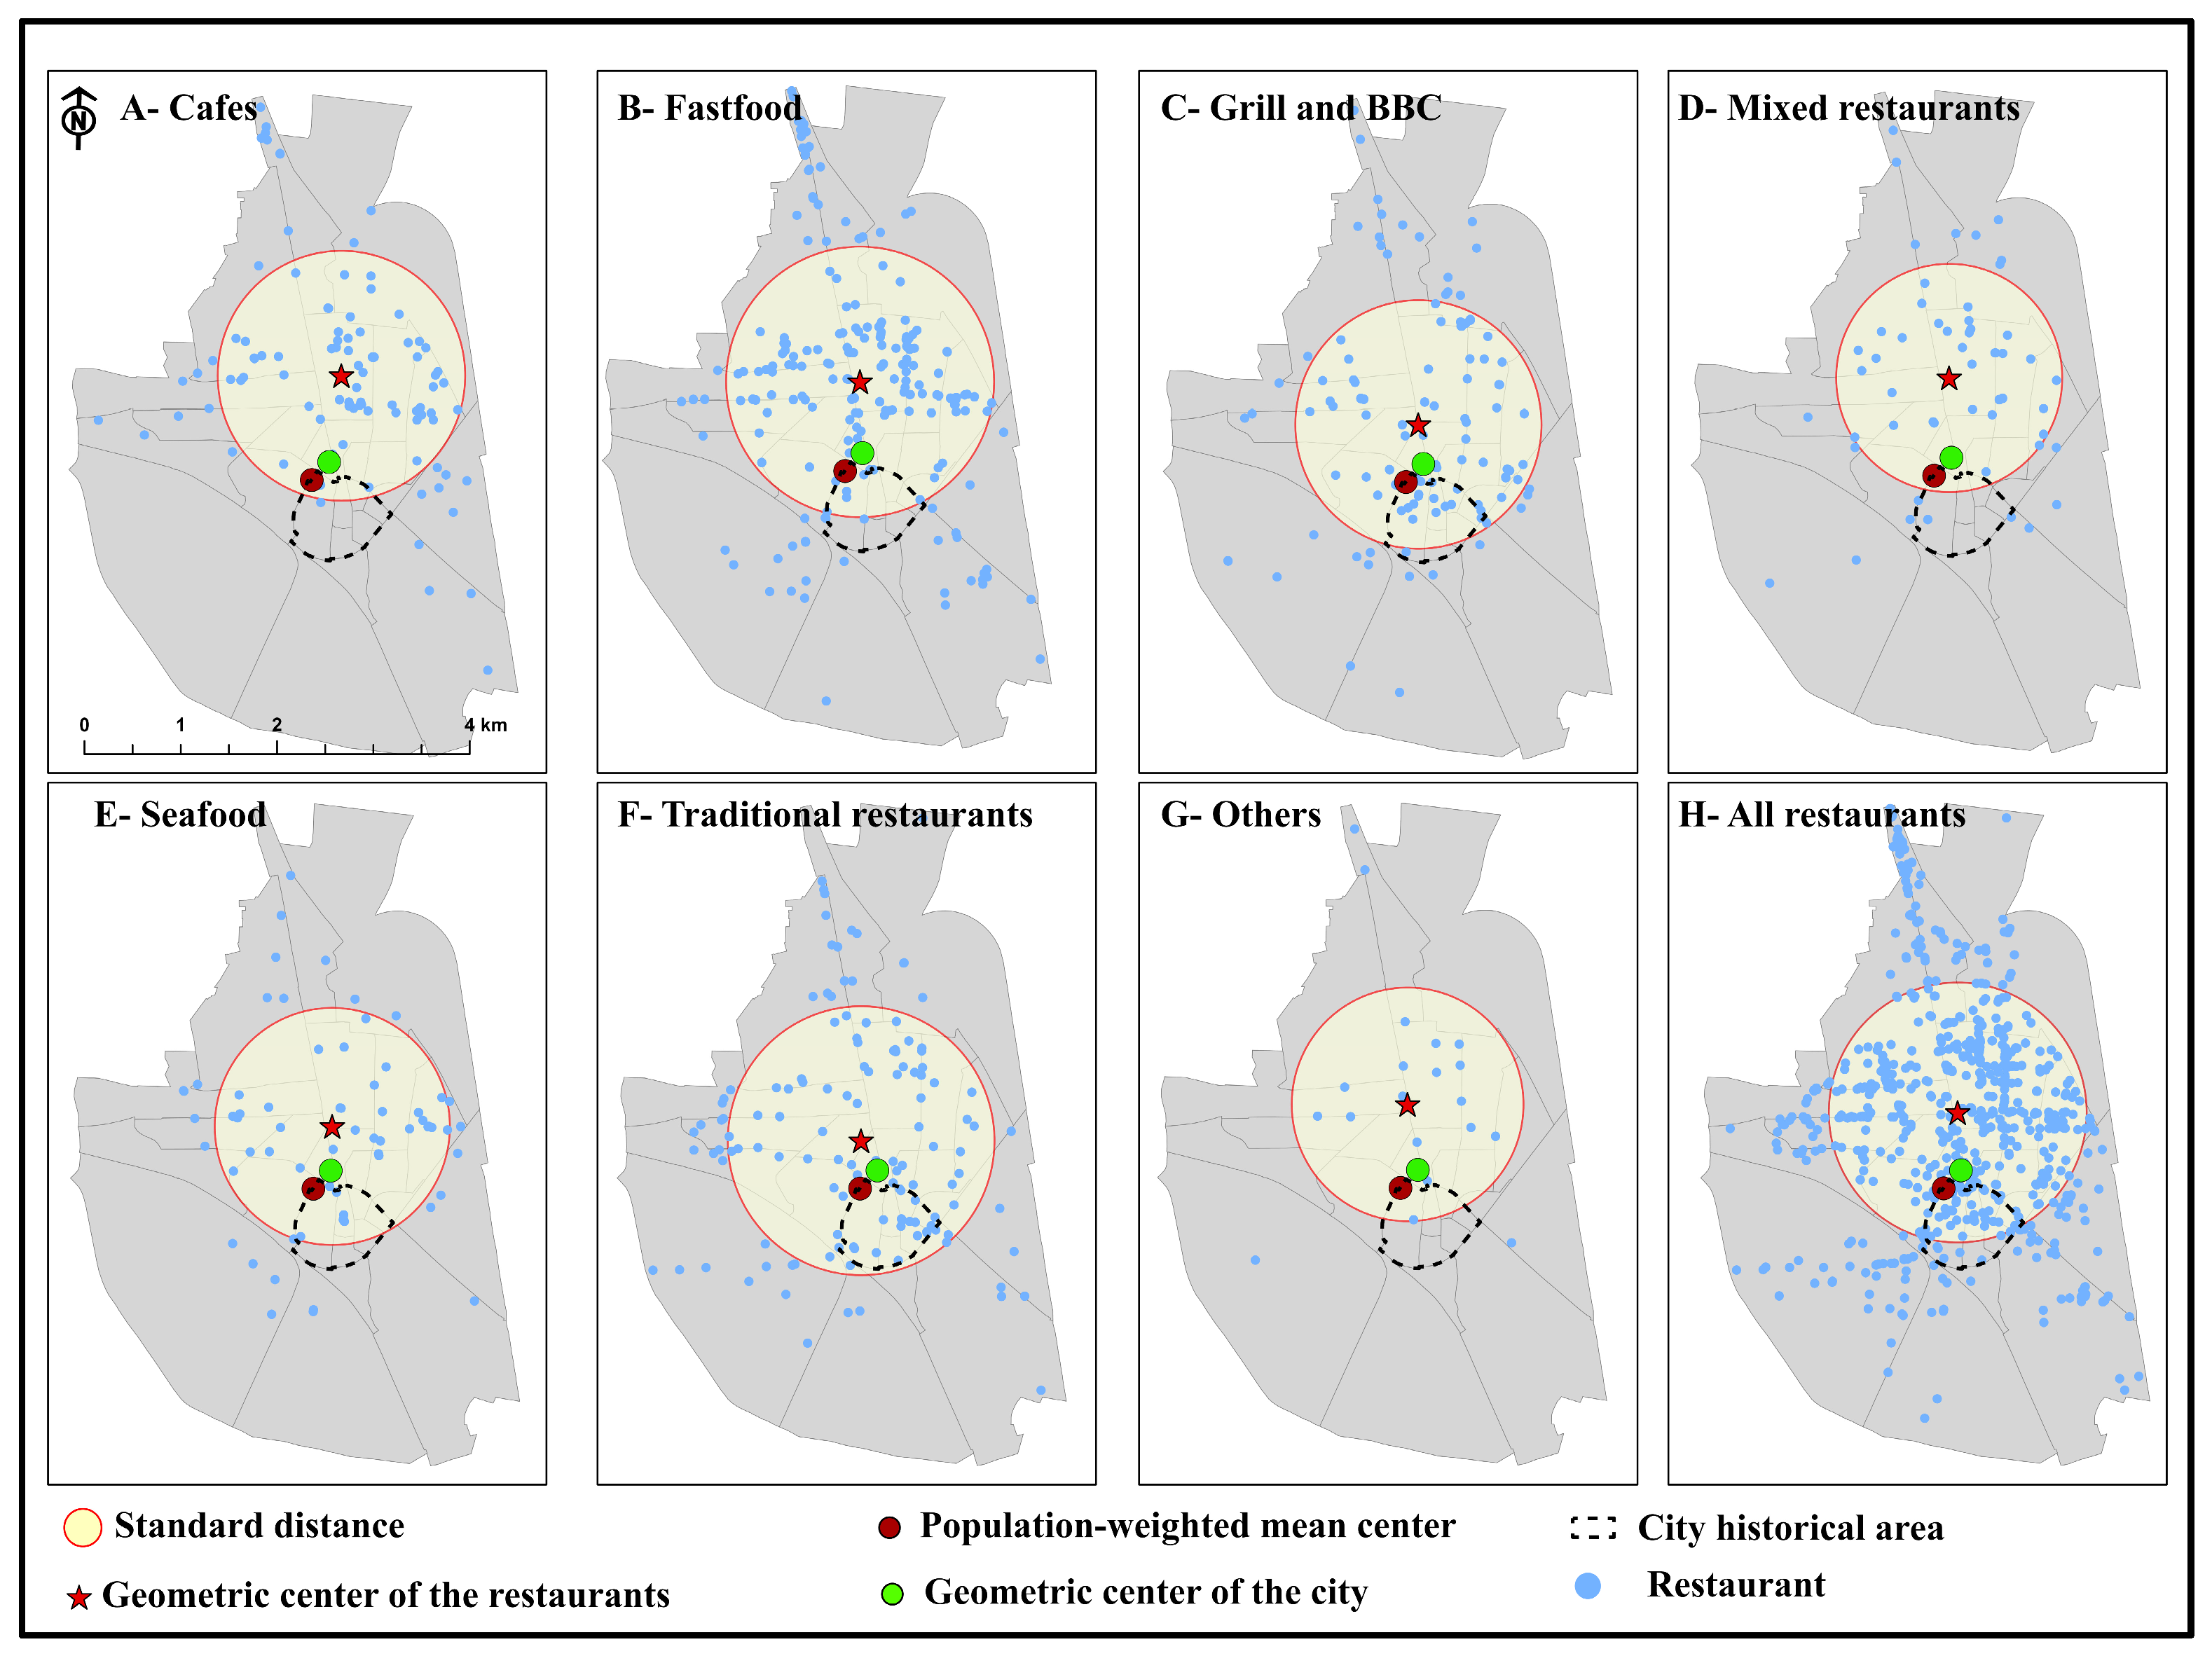
To address RQ3, Global and Local Moran’s I was applied to identify the dominant spatial processes underlying clustering patterns. Rather than merely detecting spatial autocorrelation, these measures are used to distinguish whether clustering arises from localized demand structures (CPT) or from spatial spillovers associated with mobility and network connectivity (CFT). Standard distance analysis provides critical quantitative evidence of how restaurant clustering in Tanta reflects entrenched spatial inequalities and ongoing urban restructuring (
Table 4 and
Figure 8). The overall mean standard distance of 1338.48 m serves as a benchmark for comparing the compactness and dispersion of different restaurant categories across the city.
Low-order services such as fast food (1391.28 m) and traditional restaurants (1384.65 m) exhibit the widest dispersion, indicating their reliance on geographically distributed, everyday demand and their need to maintain proximity to residential populations. This pattern is consistent with CPT, where services with lower thresholds are spatially dispersed to ensure accessibility. By contrast, higher-order or niche services such as seafood (1220.83 m) and mixed cuisines (1173.49 m) show tighter clustering within selective nodes, underscoring their dependence on concentrated consumer flows. This concentration reflects CFT dynamics, where specialized services gravitate toward high-accessibility nodes and benefit from aggregated transient demand. This duality aligns closely with Central Place Theory (CPT), which stresses the role of thresholds and local accessibility, and Central Flow Theory (CFT), which emphasizes mobility and connectivity in sustaining specialized services.
The alignment between restaurant categories and population centers of gravity further illustrates these dynamics (
Figure 8). Traditional restaurants are situated closest to the population-weighted mean center (511.31 m), reinforcing their dependence on stable, resident-based demand structures and confirming CPT-driven spatial logic. In contrast, cafés (1110.67 m) and mixed cuisines (1004.81 m) are much more distant, operating as destination-oriented venues catering to students, visitors, and leisure customers. This spatial displacement indicates that their location strategies are less constrained by residential proximity and more influenced by activity nodes and mobility flows, consistent with CFT mechanisms. This pattern reflects the influence of youth demographics and mobility in shaping food geographies in Global South cities.
Importantly, the geometric center of restaurants lies well beyond Tanta’s historic core, signaling a relocation of commercial gravity. This shift indicates a transition from a monocentric, hierarchy-based structure toward a more polycentric configuration shaped by infrastructure expansion and evolving mobility patterns. This reflects broader trends in secondary cities where urban expansion, motorization, and infrastructural upgrading are producing more polycentric structures. In Tanta, new service clusters are emerging along corridors such as El-Bahr and El-Nahhas Streets and near educational and cultural anchors. These emerging clusters represent flow-driven subcenters that coexist with, and partially reconfigure, traditional CPT-based centrality.
Taken together, these findings demonstrate how Tanta’s restaurant landscape embodies both traditional CPT hierarchies rooted in population demand and contemporary CFT dynamics shaped by flows and connectivity. More importantly, they identify the conditions under which each mechanism dominates: CPT prevails in dispersed, neighborhood-oriented services, while CFT dominates in specialized, destination-oriented and corridor-based activities. For urban planners, this underscores the need to reconcile historic centrality with flow-driven subcenters to ensure equitable access and to manage the transition toward more polycentric and sustainable urban forms. This interpretation moves beyond descriptive clustering to provide a mechanism-based explanation of spatial structure, directly addressing RQ3.
3.6. Spatial Clustering Patterns of Restaurant Distribution
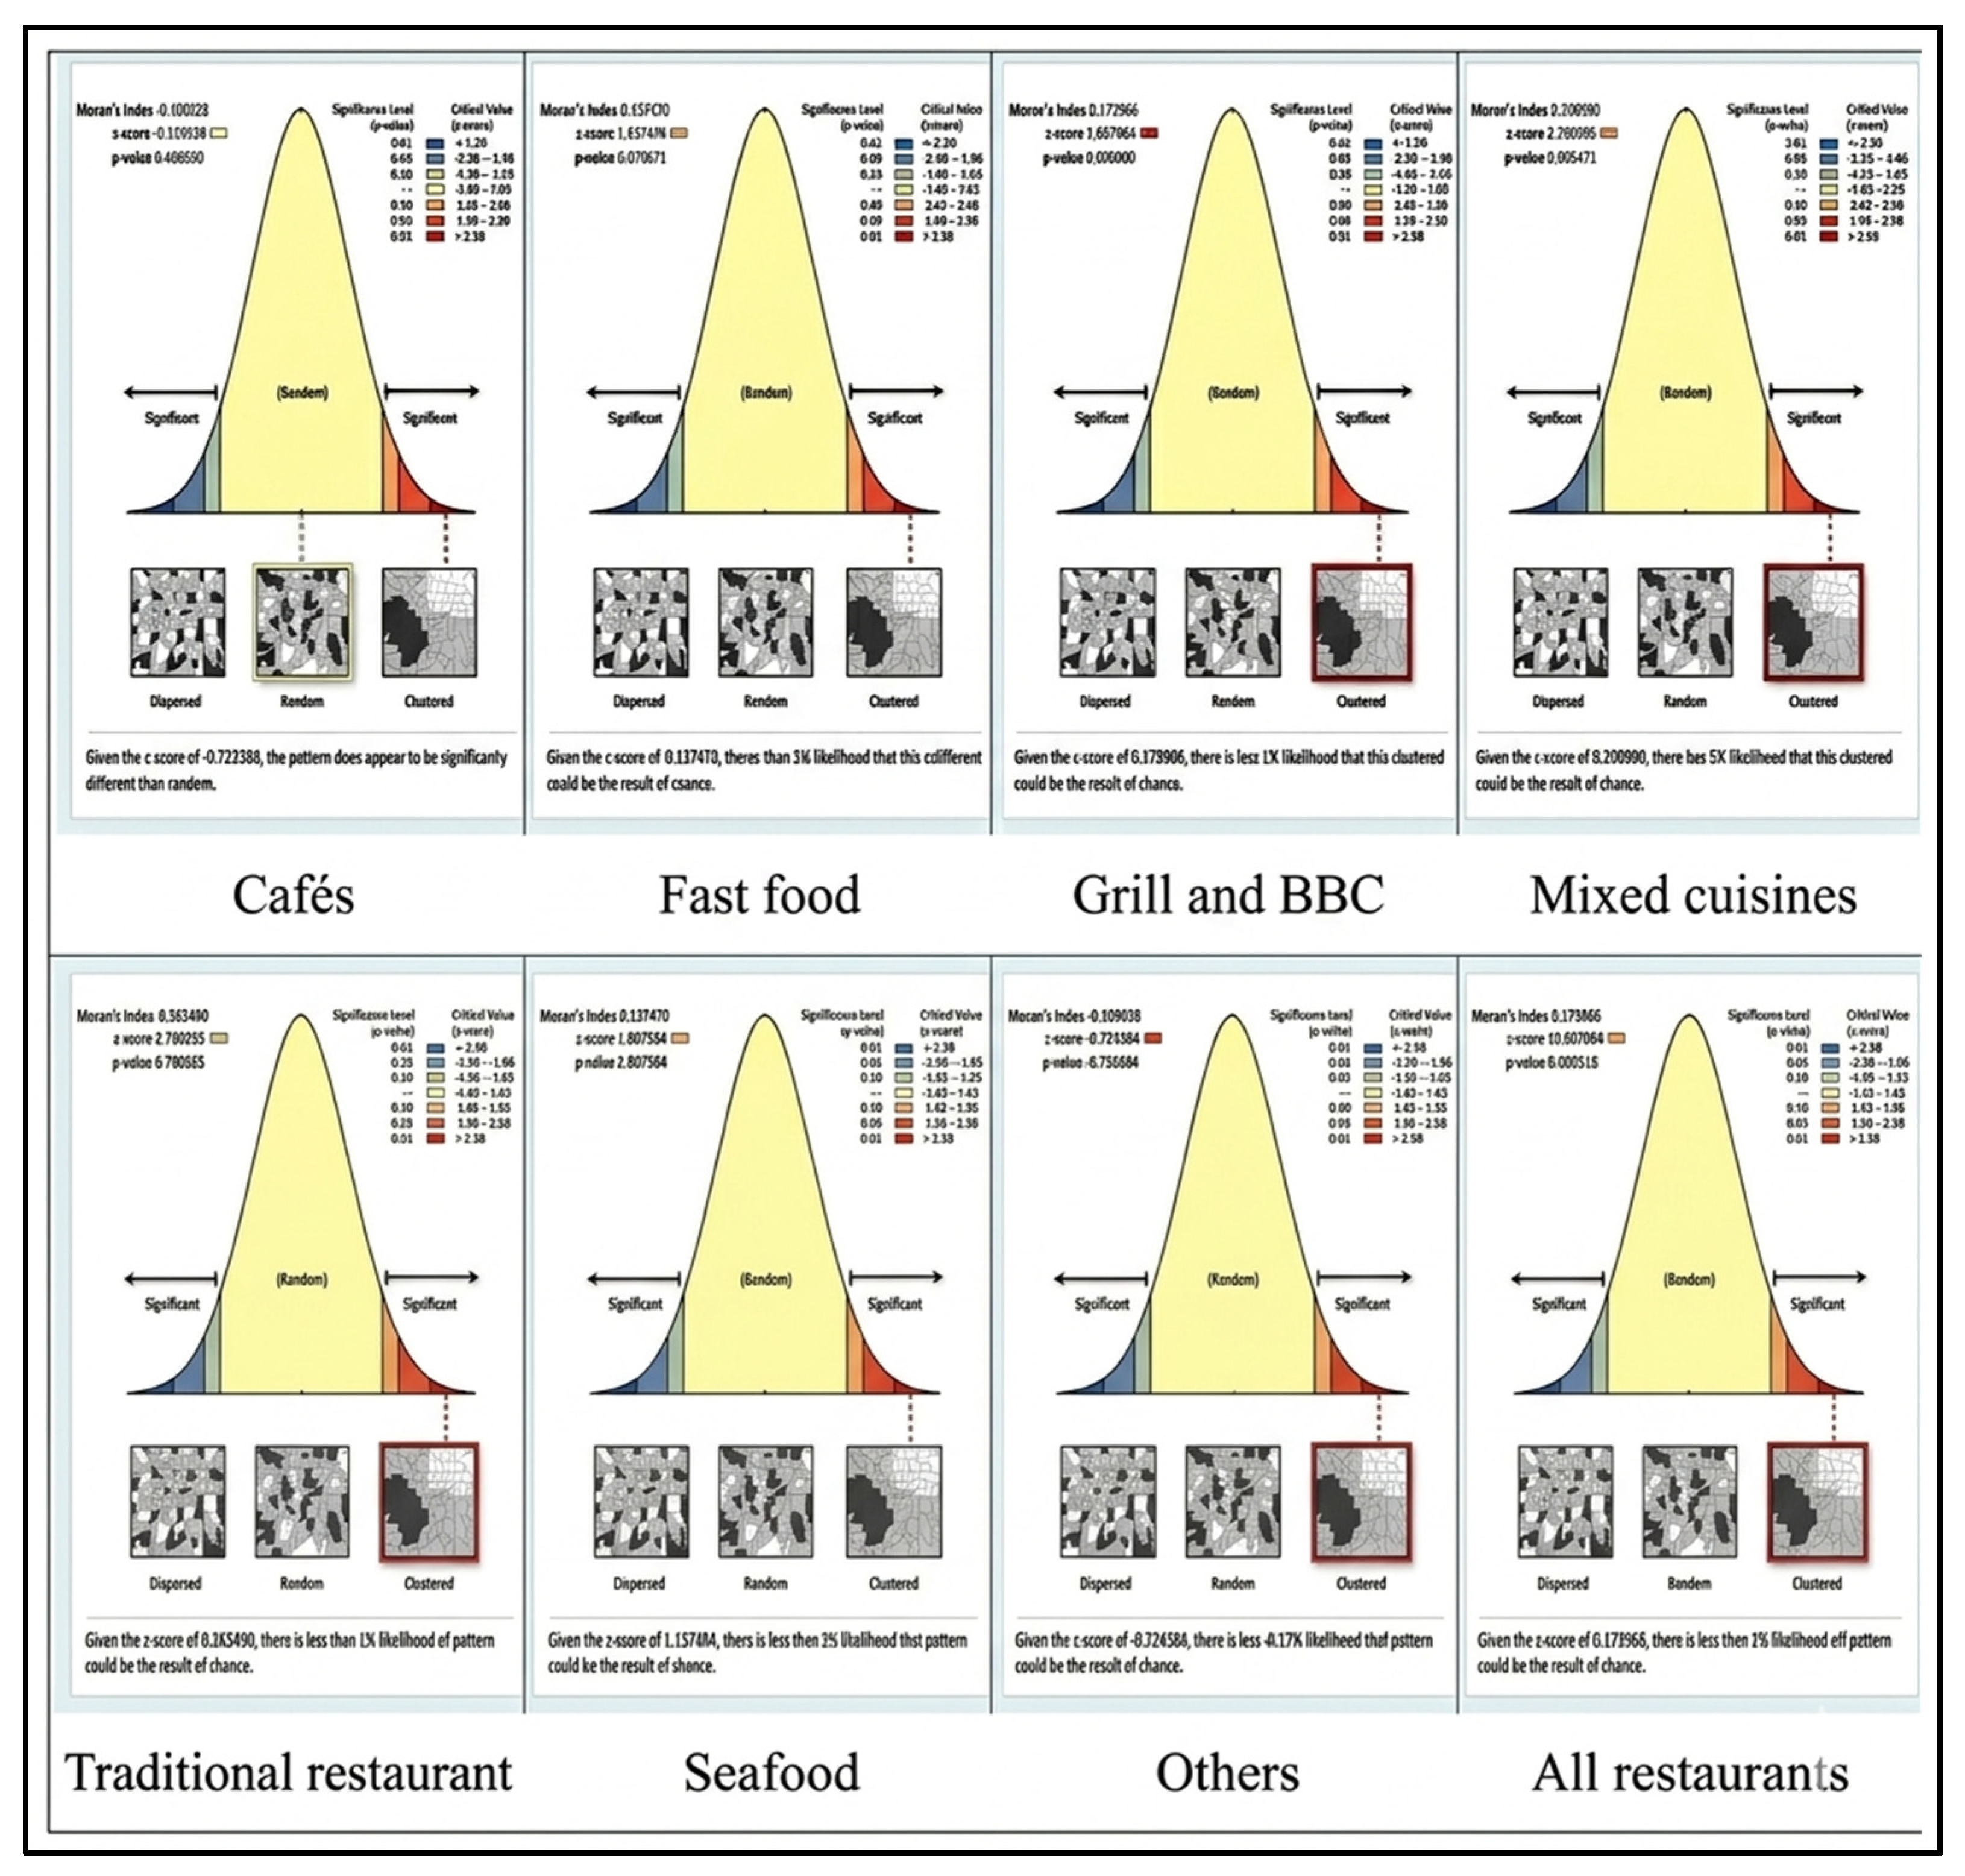
Global Moran’s I analysis (I = 0.173; z = 10.607;
p < 0.01) indicates that restaurants in Tanta are significantly clustered (
Table 5 and
Figure 9), confirming that spatial distribution is structured rather than random and reflecting the presence of underlying organizing mechanisms. While this pattern is consistent with Central Place Theory (CPT), which anticipates concentration of services around attractive urban nodes (
Table 4), the magnitude and spatial configuration of clustering suggest that hierarchical centrality alone is insufficient to explain the observed patterns. The distance between the geometric center of all restaurants and the population gravity centroid (782.84 m) highlights the strong functional connection between service provision and the city’s demographic core, while also indicating a partial spatial shift toward areas influenced by mobility and accessibility.
Disaggregated results reveal distinct spatial hierarchies and flow dynamics. Traditional restaurants, grill and BBQ, and seafood establishments exhibit moderate clustering (Moran’s I = 0.137–0.262; z = 1.807–2.780; p < 0.10–0.01), consistent with CPT-driven logic, as they remain embedded in Tanta’s historic center, particularly around El-Sayed El-Badawi Mosque and adjacent markets. Their moderate clustering intensity reflects stable, demand-based agglomeration, where proximity to resident populations and cultural anchors sustains their spatial persistence. Their alignment with the population centroid underscores their persistence as classic central-place services within the city’s evolving structure.
Conversely, fast-food outlets, cafés, and mixed cuisines show stronger clustering (Moran’s I = 0.358–0.405; z = 3.768–4.314; p < 0.01), yet their geometric centers lie considerably farther from the population centroid. This divergence indicates that clustering intensity is decoupled from residential proximity and instead driven by accessibility and movement patterns. This reflects Central Flow Theory (CFT), as these establishments rely on mobility corridors, university flows, and transient visitors rather than solely neighborhood demand. Thus, higher clustering values correspond to flow-amplified agglomeration, where repeated exposure to moving populations reinforces spatial concentration.
Finally, the “Others” category shows a random pattern (Moran’s I = −0.109), suggesting that these scattered establishments function as niche or opportunistic services that are less dependent on core attraction nodes or mobility flows. Crucially, this random distribution accurately captures the organic, often informal growth dynamics characteristic of Global South cities. These establishments operate outside the formal structural logic of both CPT and CFT, relying instead on micro-local opportunism.
Collectively, these results confirm the coexistence of dual clustering regimes in Tanta: hierarchical CPT-based clustering rooted in historic centrality, and CFT-based clustering driven by flows and corridors. More importantly, they demonstrate that clustering intensity varies systematically according to the dominant mechanism, with moderate clustering reflecting demand-based stability and high clustering reflecting flow-driven amplification. This duality has important implications for spatial equity and planning interventions aimed at balancing core services with emerging flow-oriented subcenters.
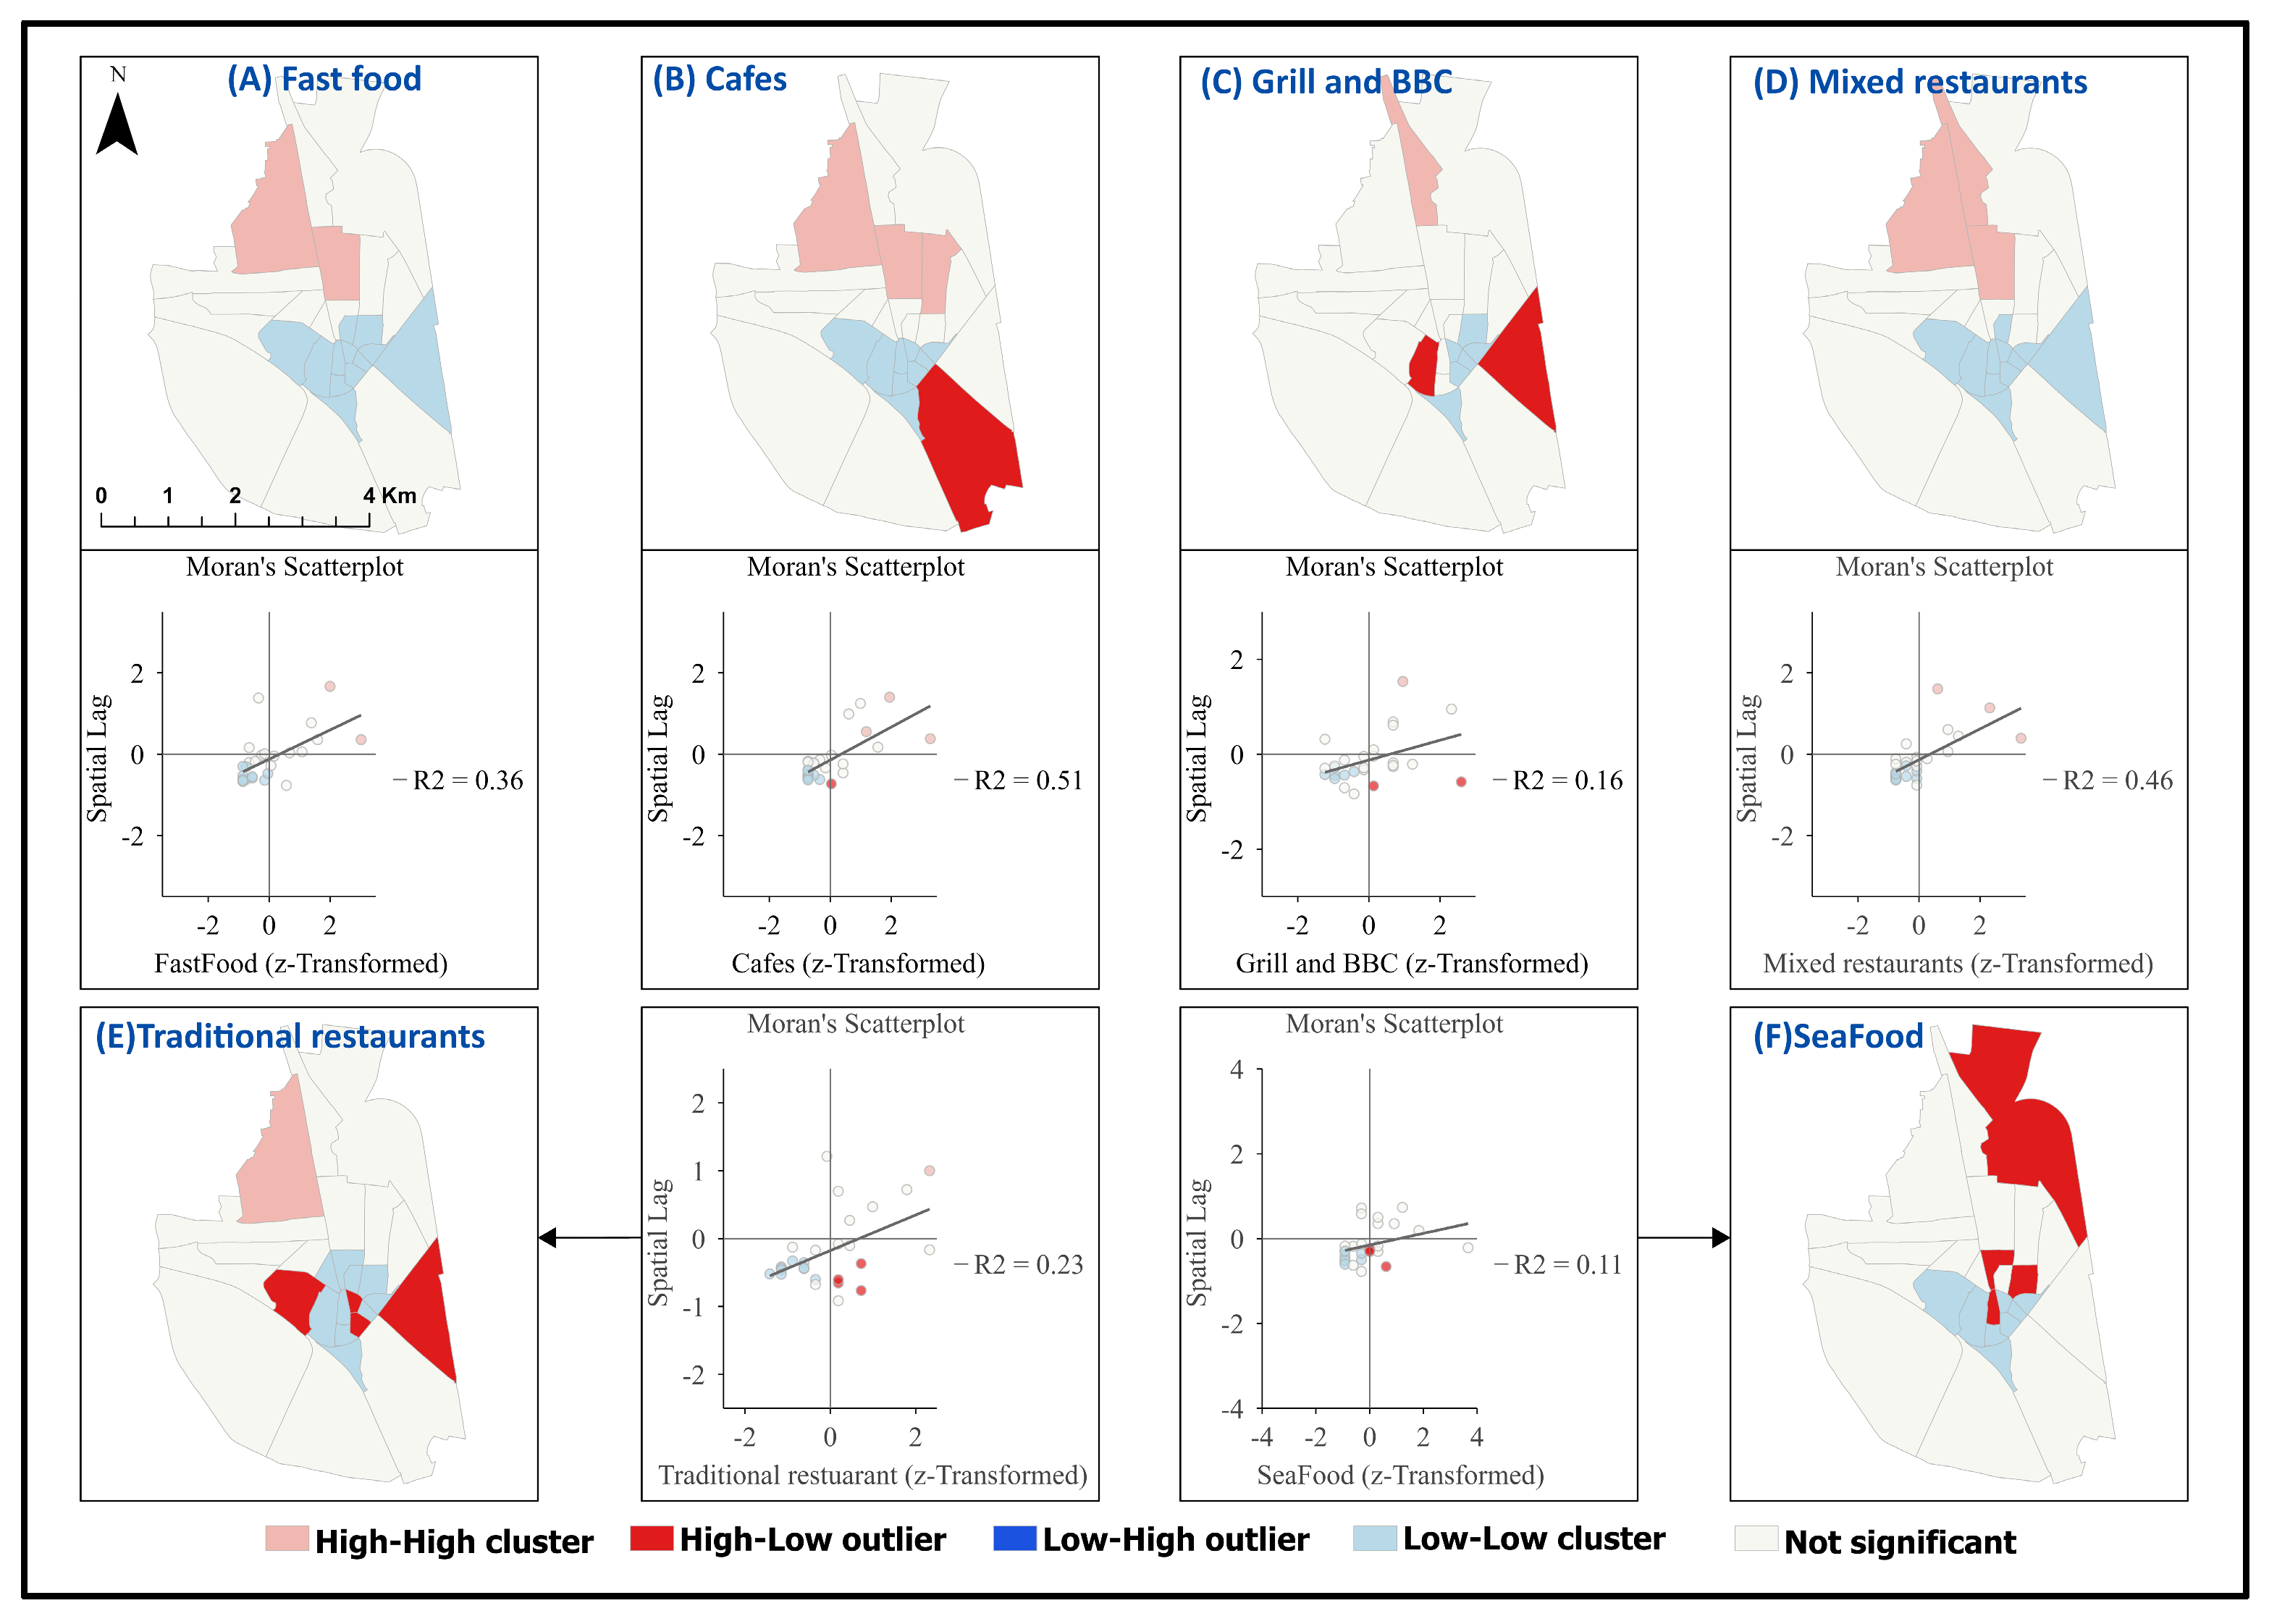
Anselin’s Local Moran’s I (LISA) disaggregates the citywide clustering pattern (
Figure 10), revealing both densely concentrated hot spots (High–High) and weakly agglomerated cold spots (Low–Low), consistent with the hybrid CPT–CFT framework. Rather than simply mapping cluster types, LISA provides a localized perspective on how different spatial mechanisms operate across neighborhoods. These results align with Spatial Lag estimates, which show stronger clustering for cafés (R
2 = 0.51), mixed cuisines (R
2 = 0.46), and fast food (R
2 = 0.36), compared with weaker clustering among seafood (R
2 = 0.11), grill and BBQ (R
2 = 0.16), and traditional restaurants (R
2 = 0.23). This variation further confirms that flow-dependent categories exhibit stronger spatial dependence, reflecting their sensitivity to mobility-driven interactions.
High–High (H–H) clusters dominate the northern and north-central districts, particularly in Om El-Moamineen, Mohamed Gaeisa, and Ahmed Awaga. Each hub reflects distinctive locational advantages: Om El-Moamineen lies on the Cairo–Alexandria agricultural axis, ensuring high traffic and commercial vibrancy; Mohamed Gaeisa benefits from proximity to Tanta University and the Sports Stadium; and Ahmed Awaga leverages its location along Al-Geish Street, a major commercial and transit artery. These hubs function as major service centers, where CPT-based centrality and CFT-driven flows converge, producing reinforced clustering effects and high service intensity.
Conversely, Low–Low (L–L) clusters are concentrated in the historic commercial core (light blue zones in
Figure 10), signaling declining attractiveness of older neighborhoods. This pattern reflects not only saturation but also a relative decline in mobility flows and accessibility compared to emerging urban corridors. From a CPT perspective, this denotes a restructuring of the urban hierarchy; from a CFT perspective, it highlights weakening flows toward historic areas relative to newer, more accessible neighborhoods.
High–Low (H–L) clusters represent atypical nuclei, where dense restaurant activity emerges despite surrounding weak-service areas. These nodes arise from localized demand linked to dense residential blocks or industrial activities. They illustrate transitional spatial forms in which localized CPT effects operate independently from broader citywide flows. Within CPT, they represent emergent sub-centers responding to local socio-economic dynamics; within CFT, they reflect localized flows that remain disconnected from the city’s main mobility corridors. Their presence points to the potential formation of future secondary service hubs, highlighting the dynamic and evolving nature of spatial clustering processes in Tanta.
3.7. Analyzing the Statistical Correlation Analysis (CPT vs. CFT)
To explicitly address RQ2 and RQ3, Pearson’s correlation analysis was conducted to statistically quantify the relationships between restaurant density and 27 neighborhood-level variables, spanning five domains: demographic, educational, infrastructural, urban environmental, and marital status (
Table 6). This multivariate approach provides a systematic basis for identifying the relative strength of associations between urban factors and restaurant distribution, moving beyond purely descriptive spatial analysis toward a more analytically grounded interpretation.
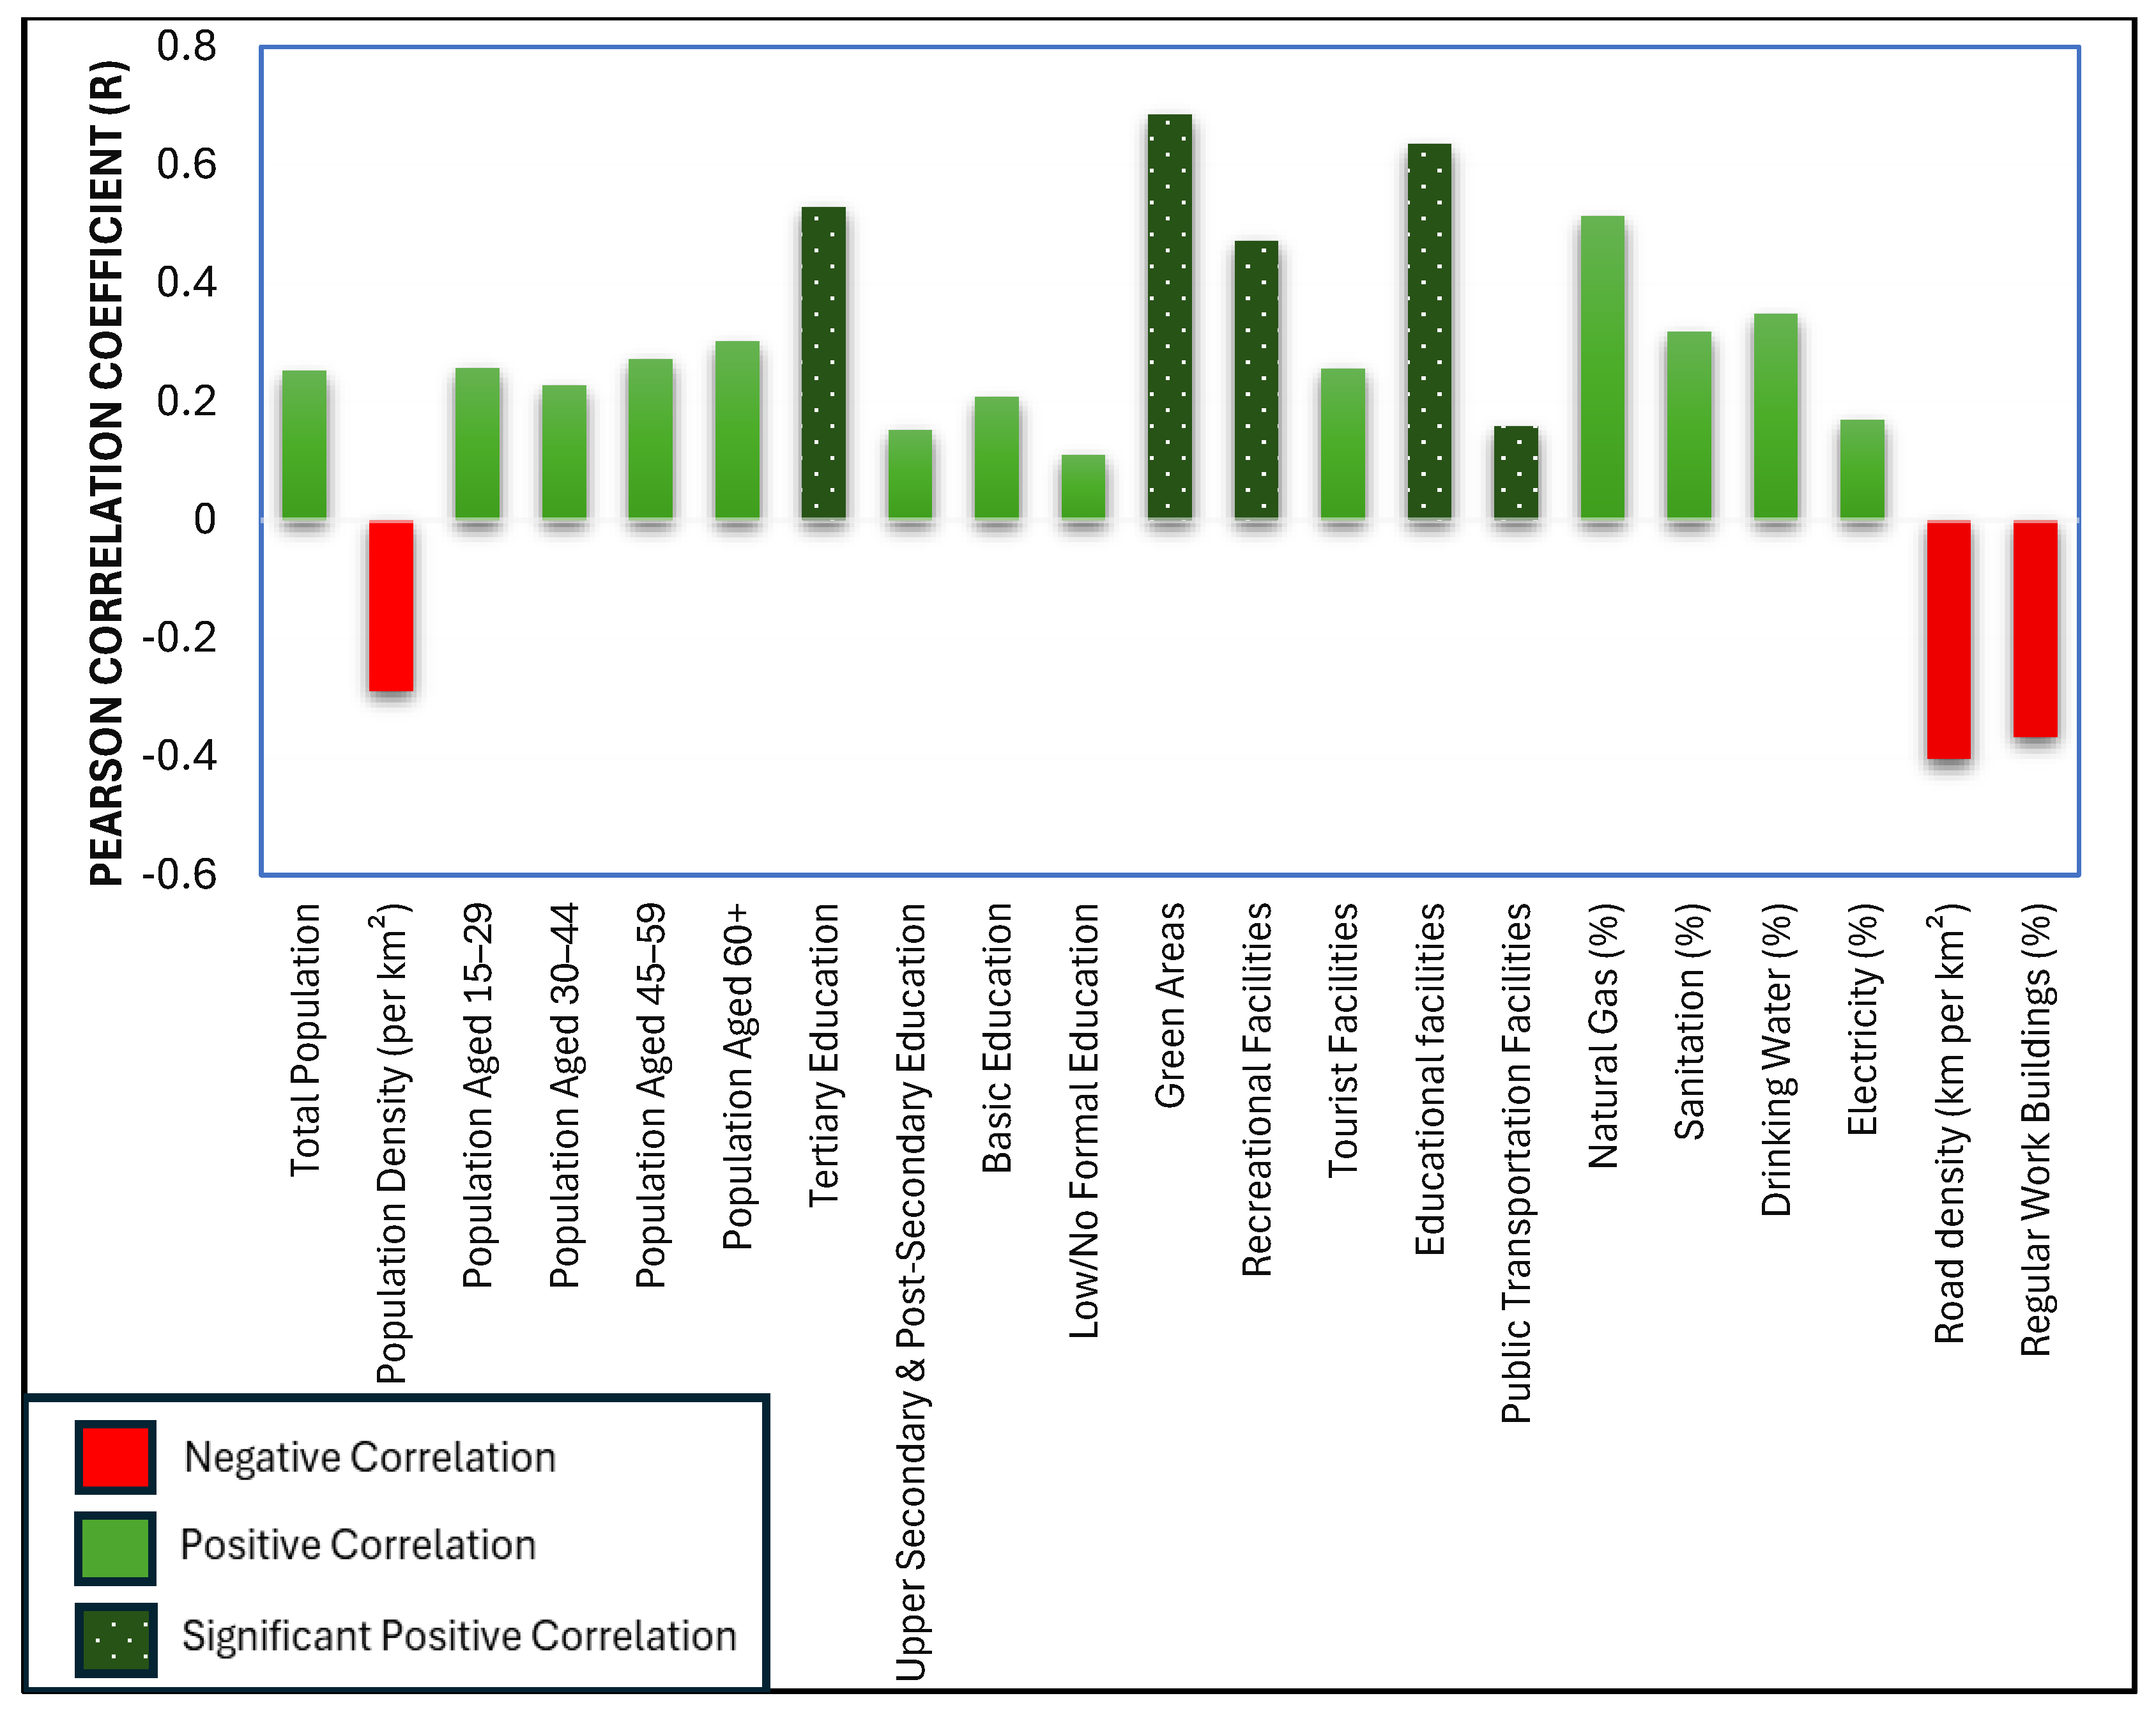
Several variables exhibit statistically significant correlations with restaurant density (
Figure 11), providing important insights into the underlying drivers of Tanta’s foodscape. Notably, the strongest positive association is observed for green areas (r = 0.685,
p < 0.01), indicating that neighborhoods characterized by higher environmental quality and amenity provision tend to attract greater concentrations of restaurants. This pattern aligns with a flow-based interpretation (CFT), where attractive urban environments generate increased human activity and consumption opportunities. This suggests that amenity-driven mobility flows act as a primary mechanism shaping spatial concentration.
Similarly, educational facilities (r = 0.636, p < 0.01) and tertiary education levels (r = 0.529, p < 0.01) display strong positive correlations. The former reflects the role of schools and universities, particularly those associated with Tanta University, as key generators of daily mobility flows, while the latter captures the influence of higher-order demand associated with more educated populations. Taken together, these variables illustrate a convergence between CFT-driven mobility effects and CPT-related demand thresholds, indicating that both mechanisms may operate simultaneously but with varying intensity across space.
Infrastructure also plays a significant role, as indicated by the positive correlation with natural gas availability (r = 0.514, p < 0.01). This suggests that investment-ready environments equipped with modern utilities are more conducive to restaurant development, reflecting structural conditions typically associated with CPT-based service hierarchies. Recreational facilities (r = 0.472, p < 0.05) further support the importance of leisure-oriented activity nodes, consistent with flow-driven clustering mechanisms. These findings highlight the role of enabling infrastructure as an intermediate factor linking hierarchical organization and flow-based dynamics.
Conversely, road density exhibits a statistically significant negative correlation (r = −0.403, p < 0.05). Rather than simply indicating accessibility, this result suggests that highly road-dense areas, often dominated by arterial infrastructure, may be less favorable for restaurant clustering due to reduced pedestrian activity and limited opportunities for localized consumption. This distinction underscores a key CFT insight: not all forms of accessibility generate effective consumption flows, and vehicular connectivity does not necessarily translate into commercial attractiveness.
Importantly, most traditional demographic variables, including total population, population density, and age structure, do not display statistically significant relationships. This finding challenges the conventional CPT assumption that population size alone is a sufficient predictor of service distribution. Instead, the results indicate that restaurant clustering in Tanta is more strongly shaped by contextual and activity-based factors than by static demographic thresholds.
Overall, the findings point to a hybrid spatial structure, in which CPT-related factors (e.g., education level and infrastructure readiness) coexist with, but are often secondary to, CFT-driven dynamics associated with urban amenities, institutional activity, and mobility flows. More importantly, the results identify the conditions under which each mechanism dominates: CFT effects prevail in areas characterized by high amenity value, institutional concentration, and mobility intensity, whereas CPT effects remain relevant in structurally developed and demographically stable environments. This reinforces the argument that restaurant geography in Tanta cannot be explained by a single theoretical lens but rather emerges from the interaction between hierarchical demand structures and flow-based spatial processes. Accordingly, the analysis provides empirical support for a contingency-based interpretation of urban service distribution, directly addressing both RQ2 and RQ3.
3.8. Robustness Check and Spatial Econometric Validation
The econometric analysis was conducted to assess the robustness of the observed spatial relationships. While the Ordinary Least Squares (OLS) model provides initial insights, diagnostic tests indicate the presence of spatial dependence in the residuals, suggesting that non-spatial models may be insufficient to fully capture the underlying processes.
To address this issue, both the Spatial Lag Model (SLM) and the Spatial Error Model (SEM) were considered. SLM accounts for potential spatial spillover effects between neighboring units, whereas the SEM captures spatial dependence arising from unobserved or omitted spatially structured factors. The results indicate that the SEM provides a better statistical fit compared to alternative specifications, implying that spatial dependence is more closely associated with latent spatial structures rather than direct interaction effects.
These findings suggest that restaurant distribution is shaped by a combination of observable variables and unobserved spatial processes, supporting the interpretation of a hybrid CPT–CFT framework, in which both demand-related (CPT) and flow-related (CFT) mechanisms contribute to the observed spatial patterns.
3.8.1. Econometric Baseline and Diagnostic Testing
Ordinary Least Squares (OLS) Results
To establish a baseline understanding of the determinants of restaurant density, an Ordinary Least Squares (OLS) regression model was estimated using standardized variables (
Table 7 and
Supplementary Materials).
The OLS results reveal several statistically significant relationships when robust standard errors are considered. Population density exhibits a positive and significant effect (p < 0.05), indicating that areas with higher population concentration tend to host more restaurants. This finding is only partially consistent with Central Place Theory (CPT), as it captures demand thresholds but does not fully explain spatial concentration patterns.
However, the negative coefficient for tertiary education is counterintuitive from a purely demand-driven perspective. Rather than indicating reduced demand, this result suggests a spatial mismatch between residential socio-economic characteristics and actual consumption spaces, implying that highly educated populations may consume services outside their residential neighborhoods. This finding indirectly supports a shift toward flow-based dynamics (CFT), where consumption is driven by activity spaces rather than residential profiles.
Infrastructure variables also play a significant role. The positive association with natural gas availability reflects investment-ready environments, reinforcing CPT logic related to service hierarchy and infrastructure provision.
Most notably, road density emerges as the strongest predictor (β = 2.108, p < 0.01), highlighting the importance of accessibility and connectivity. However, its interpretation requires caution: while higher connectivity increases exposure, it does not necessarily generate localized consumption. The interaction between population density and road density is negative and significant, indicating that excessive road infrastructure may reduce localized service concentration. This finding is particularly important, as it suggests a non-linear relationship in which connectivity enhances flow but can simultaneously weaken place-based demand, a key insight aligned with Central Flow Theory (CFT).
While the OLS model provides useful initial insights (
Table 8), several limitations must be acknowledged. First, the low adjusted R
2 (0.137) indicates limited explanatory power once model complexity is considered. Second, the non-significant F-statistic suggests that the model, in its classical form, does not fully explain the variation in restaurant density.
More critically, these results point to potential model misspecification arising from omitted spatial processes, which cannot be captured within a non-spatial regression framework. This limitation is theoretically important, as both CPT and CFT inherently imply spatial interaction and dependency, which violates the OLS assumption of independent observations.
Spatial Autocorrelation of OLS Residuals
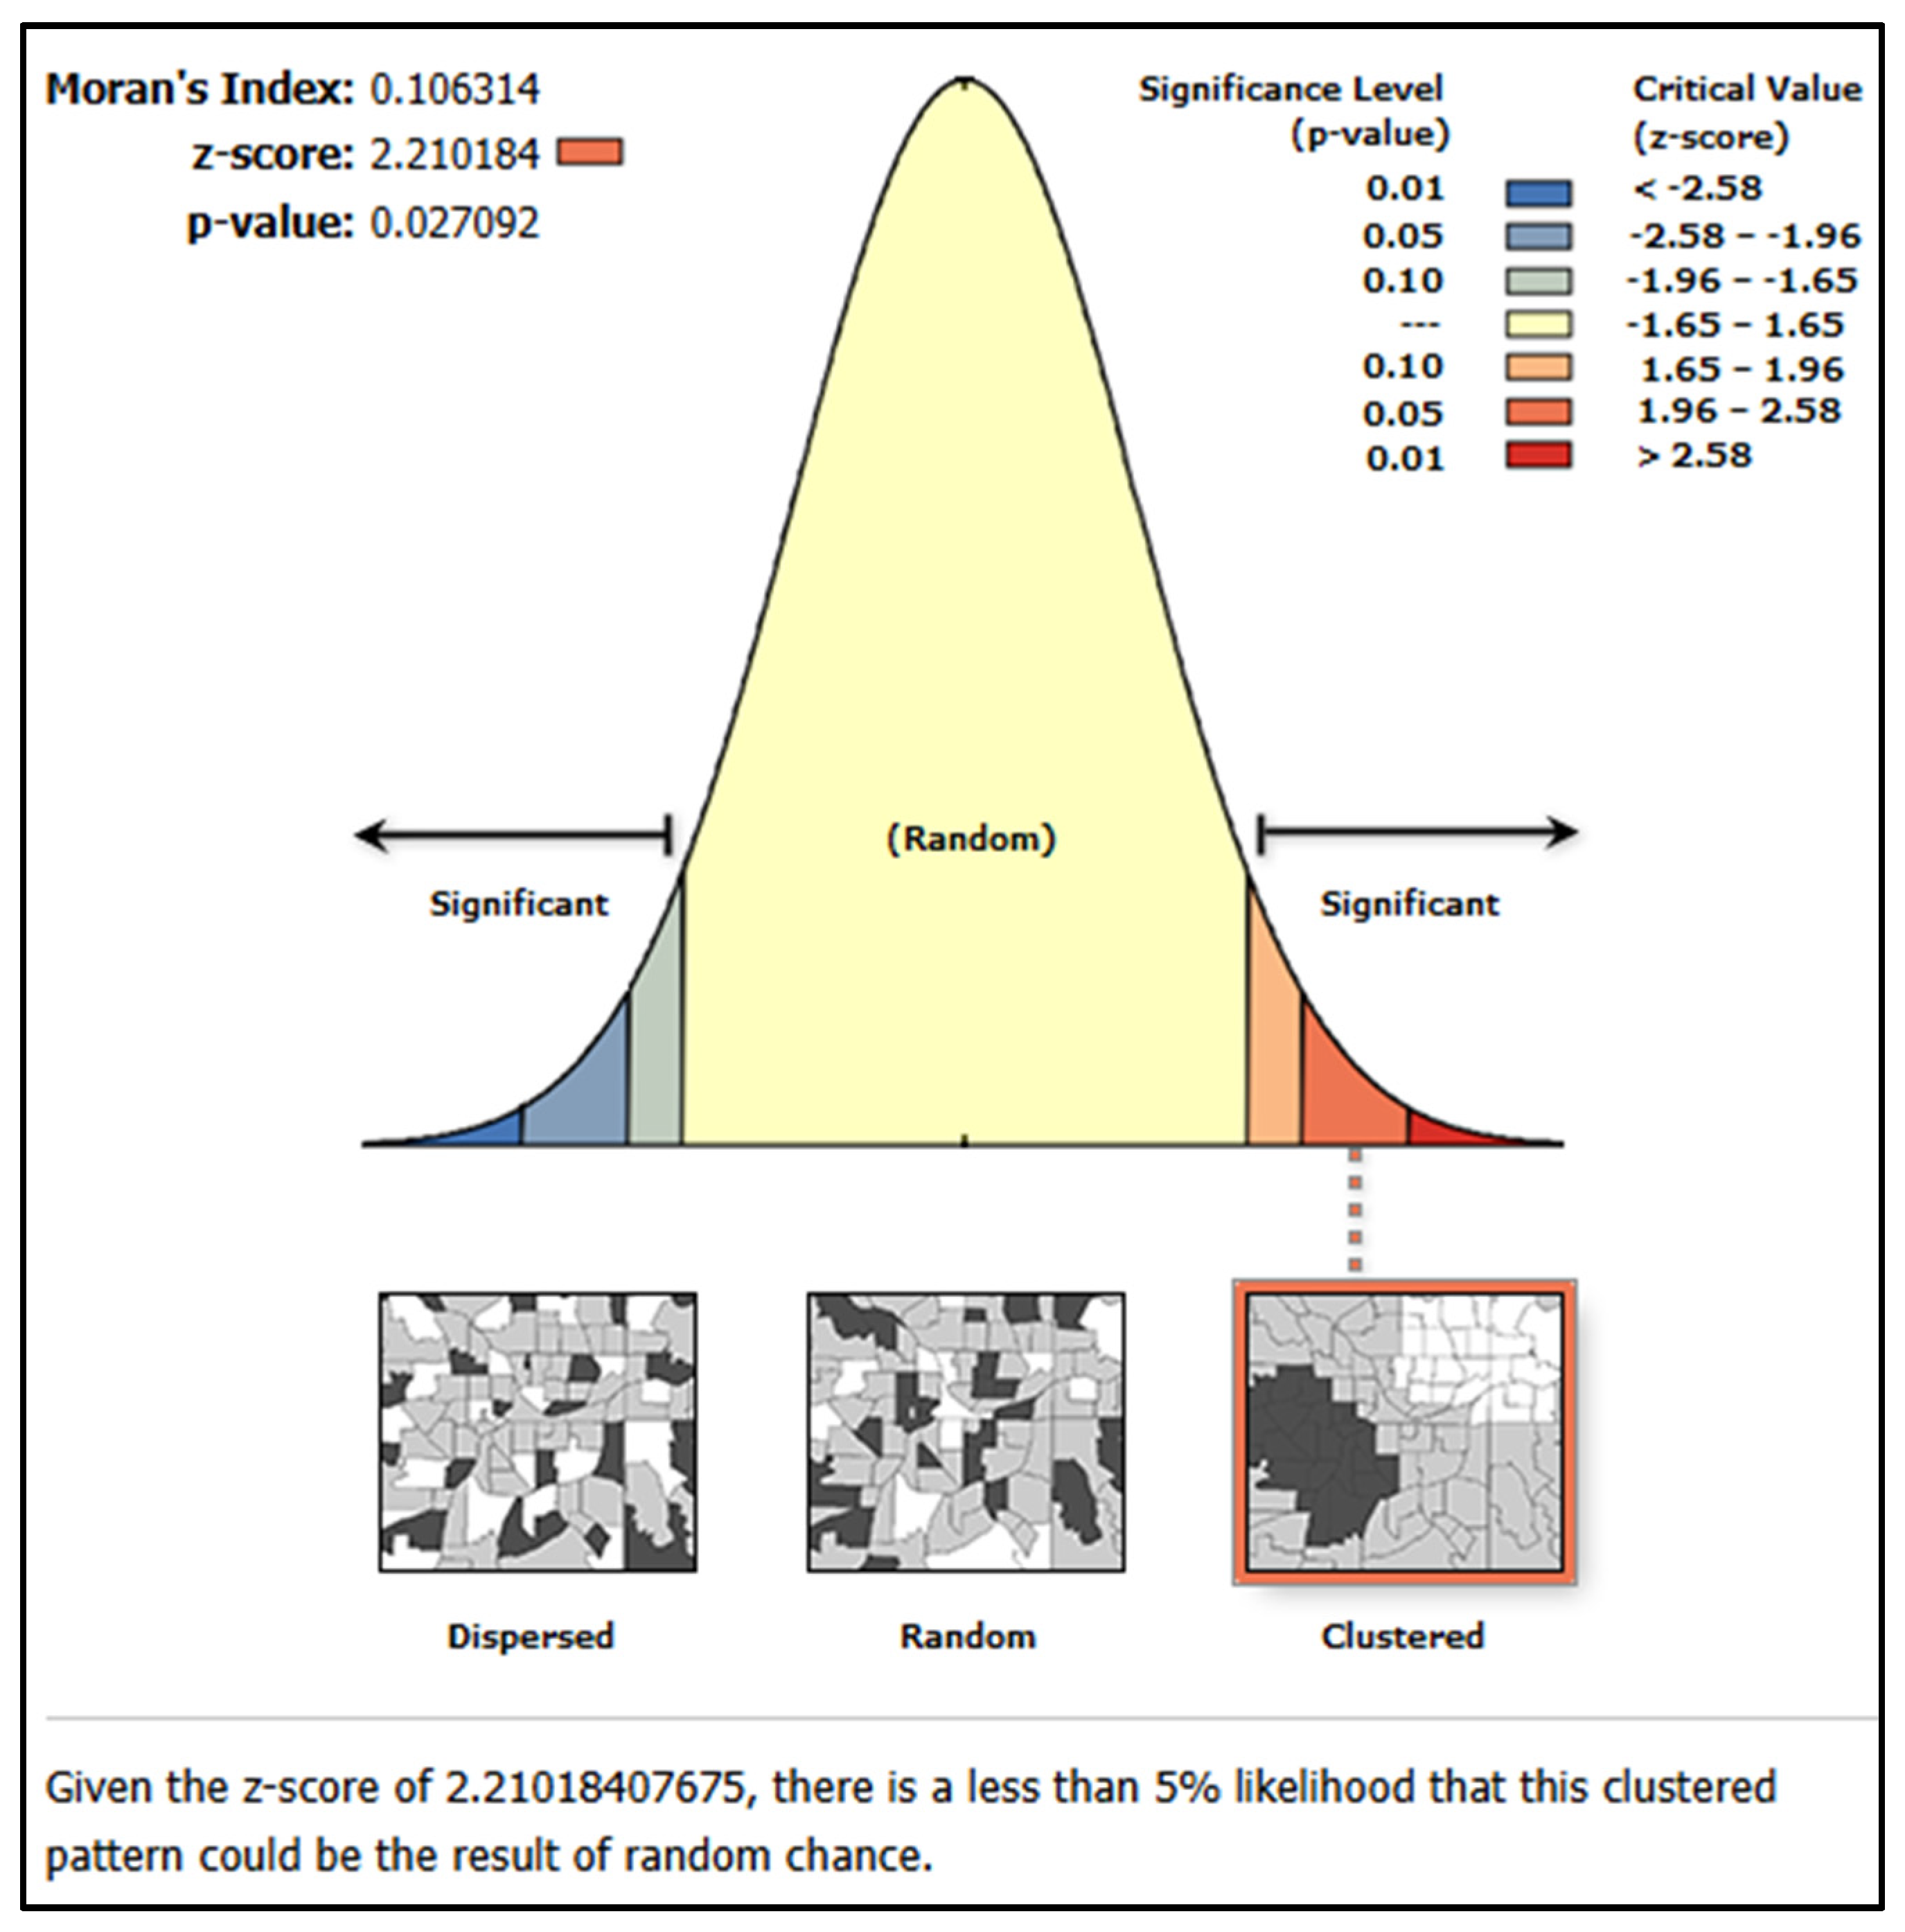
To formally test whether the OLS model adequately captures spatial structure, a Global Moran’s I test was applied to the model residuals (
Table 9 and
Figure 12).
The results in
Table 9 indicate a statistically significant positive spatial autocorrelation in the residuals (
p < 0.05), meaning that unexplained variation is spatially clustered rather than randomly distributed. This finding demonstrates that the OLS model violates the independence of errors assumption, there are unobserved spatial processes influencing restaurant distribution, and nearby neighborhoods share similar unexplained characteristics. Although the magnitude of Moran’s I is moderate, its statistical significance confirms the presence of systematic spatial dependence.
From a theoretical perspective, this spatial clustering of residuals provides strong empirical support for flow-based mechanisms (CFT). Specifically, it suggests that restaurant location decisions are influenced by neighboring spatial contexts. Accessibility, mobility, and network effects extend beyond local boundaries. Demand is not purely local (contra CPT), but spatially interconnected. Thus, residual clustering reflects spillover effects and inter-neighborhood dependencies, which cannot be captured by non-spatial regression models.
3.8.2. Implications for Model Selection
The presence of spatial autocorrelation in the residuals clearly indicates that the OLS model is mis-specified. Ignoring this spatial dependence would lead to biased coefficient and misleading inference. Accordingly, spatial econometric approaches are required. This transition from OLS to spatial models is not only a statistical correction but also a theoretical necessity, as it allows the model to capture flow-based spatial processes (CFT) alongside hierarchical structures (CPT).
Spatial Econometric Validation and Model Comparison
To explicitly account for spatial interaction effects, a Spatial Lag Model (SLM) was estimated (
Table 10 and
Supplementary Material). This model incorporates a spatially lagged dependent variable to capture interdependencies between neighboring observations.
The spatial lag coefficient (ρ = 0.437, p < 0.05) confirms the presence of positive spatial spillover effects, indicating that restaurant density in one neighborhood is influenced by neighboring areas. This provides direct empirical support for interdependent spatial processes consistent with CFT.
However, the Likelihood Ratio (LR) test for spatial lag dependence is not statistically significant (p = 0.105), suggesting that spillover effects alone do not fully explain spatial dependence. In other words, interaction between neighboring areas exists, but it is not the dominant mechanism.
To address spatial dependence in the error structure, a Spatial Error Model (SEM) was estimated (
Table 11).
The SEM results provide strong statistical evidence that spatial dependence is primarily embedded in the error term rather than the dependent variable. The Lambda coefficient (λ = 0.695, p < 0.001) is large and highly significant, indicating that there are unobserved spatial processes influencing restaurant distribution. These processes are spatially correlated across neighborhoods. OLS residual clustering is effectively captured by SEM. Importantly, the Likelihood Ratio test is significant (p = 0.029), confirming that the SEM specification provides a statistically superior representation of spatial dependence compared to non-spatial models.
As shown in
Table 12, model performance exhibits a clear sequential improvement from OLS to spatial specifications, confirming that spatial processes are fundamental to explaining the distribution of restaurants. Both the Spatial Lag Model (SLM) and the Spatial Error Model (SEM) outperform the baseline OLS model, indicating that ignoring spatial dependence leads to incomplete and potentially biased interpretations. However, the SEM demonstrates superior performance compared to the SLM, as evidenced by its lower Akaike Information Criterion (AIC), higher explanatory power (R
2), and statistically significant Likelihood Ratio (LR) test. Moreover, the magnitude and significance of the spatial parameter (λ) in the SEM exceed those of the spatial lag coefficient (ρ) in the SLM, suggesting a stronger and more robust form of spatial dependence.
Importantly, these results provide insights into the nature of spatial processes underlying restaurant distribution. While the SLM captures direct spatial spillover effects—consistent with flow-based dynamics as conceptualized in Central Flow Theory (CFT), the SEM reveals that spatial dependence is more deeply embedded in unobserved factors and latent spatial structures. This indicates that the observed clustering patterns are not solely the result of direct inter-neighborhood interactions, but also reflect omitted spatial variables such as micro-accessibility, localized economic conditions, and informal activity patterns. Consequently, the SEM offers a more comprehensive and statistically robust representation of the spatial mechanisms shaping the urban foodscape.
The spatial econometric results provide robust empirical evidence supporting a hybrid spatial structure governing restaurant distribution. On the one hand, elements consistent with Central Place Theory (CPT) remain observable, particularly in the moderate influence of population density and the role of infrastructural readiness (e.g., natural gas), reflecting demand-based and hierarchical service organization. On the other hand, the results more strongly emphasize the role of Central Flow Theory (CFT), as evidenced by the significance of road density, the negative interaction between population density and road infrastructure, and the presence of strong spatial dependence.
This interaction effect is particularly revealing, indicating that increased connectivity can offset or even override traditional population-based demand thresholds. In such contexts, accessibility and movement flows become more decisive than residential density, shifting the underlying logic of service location from static demand (CPT) to dynamic flow-based mechanisms (CFT). Accordingly, restaurant distribution in Tanta is best understood as the outcome of an interaction between hierarchical structures and mobility-driven processes, rather than being governed by a single theoretical framework.
A key finding emerging from the spatial econometric analysis is that spatial dependence is primarily captured through the error structure rather than through direct spatial lag effects. The magnitude and high statistical significance of the spatial error coefficient (λ = 0.695, p < 0.001) indicate the presence of strong unobserved spatial processes influencing restaurant distribution.
This suggests that a substantial portion of spatial clustering cannot be explained solely by the observed explanatory variables but is instead driven by latent factors such as micro-level accessibility, informal economic dynamics, localized consumer behavior, and fine-scale variations in urban form. These findings directly address concerns regarding model specification by demonstrating that the observed spatial patterns are not artifacts of omitted variable bias but rather reflect inherently complex and spatially structured urban processes.
Based on comparative model performance and diagnostic testing, the Spatial Error Model (SEM) is selected as the most appropriate specification for explaining restaurant distribution in Tanta. This selection is supported by several criteria. First, the SEM exhibits the highest explanatory power (R2 = 0.534), indicating a substantial improvement over both OLS and SLM. Second, it achieves the lowest Akaike Information Criterion (AIC = 75.44), reflecting superior model efficiency and reduced information loss. Third, the Likelihood Ratio test for spatial error dependence is statistically significant (p = 0.029), confirming that the inclusion of spatial error structure meaningfully improves model performance.
In contrast, while the Spatial Lag Model captures some degree of spatial interaction, its weaker statistical support suggests that direct spillover effects alone are insufficient to explain the observed spatial configuration. Therefore, the SEM provides a more robust and theoretically consistent framework for capturing the underlying spatial processes.
The results unequivocally demonstrate that spatial dependence is a defining feature of restaurant distribution in Tanta and must be explicitly accounted for in empirical modeling. The superiority of the Spatial Error Model confirms that this dependence is primarily driven by unobserved spatial structures rather than direct inter-neighborhood spillovers alone. Consequently, conventional non-spatial models such as OLS are insufficient for capturing the complexity of the urban food system. By integrating spatial econometric techniques, this study provides a more accurate and theoretically grounded understanding of how hierarchical demand structures (CPT) interact with mobility-driven dynamics (CFT), offering a comprehensive explanation of spatial inequality and service distribution in the urban context.
4. Discussion
The spatial distribution of restaurants in Tanta exhibits pronounced spatial polarization, a pattern widely observed in urban contexts of the Global South [
17,
69]. Nearly half of all establishments (47.11%) are concentrated in only five neighborhoods that accommodate just 18.51% of the city’s population. While this pattern is broadly consistent with Central Place Theory (CPT), it does not fully conform to its population-based assumptions of demand–service correspondence. In particular, the Spatial Error Model (SEM) provides strong indicative evidence that challenges purely demographic explanations. The high and statistically significant Lambda coefficient (λ = 0.69,
p < 0.00001) suggests that clustering is associated with latent spatial processes, such as micro-accessibility, institutional anchors, and localized economic conditions rather than population thresholds alone. These areas may therefore be interpreted as functioning as higher-order, flow-oriented centers, consistent with dynamics more closely aligned with Central Flow Theory (CFT) [
70,
71].
In contrast, peripheral neighborhoods exhibit marked service deficits, indicating a partial spatial decoupling between residential distribution and service provision. This interpretation is further supported by the significant negative interaction between population density and road density (−2.63, p = 0.014), suggesting a non-linear relationship in which high-capacity mobility corridors may reshape or override localized demand conditions. Taken together, these findings indicate that flow-related dynamics play a substantial though not exclusive role in shaping socio-spatial inequalities, particularly in areas characterized by high accessibility and activity intensity.
Thematic analysis highlights the dominance of fast-food establishments (30% of total outlets), which are strongly clustered in high-traffic zones. While this pattern is consistent with global trends linking fast-food expansion to time scarcity and globalization [
72,
73], its spatial configuration in Tanta points more specifically to mobility-driven demand. This is reflected in their concentration along major corridors and near institutional nodes. Supporting this interpretation, OLS diagnostics identify road density as the most significant positive predictor (Coefficient = 2.10,
p < 0.01), suggesting that accessibility may function as a proxy for flow intensity rather than merely physical connectivity.
Traditional restaurants, by contrast, tend to cluster within culturally cohesive neighborhoods, reinforcing earlier findings on the persistence of place-based food practices [
74,
75,
76]. These establishments appear to rely on relatively stable and habitual demand structures, indicating the continued relevance of CPT-related mechanisms. At the same time, the growth of grill and BBQ outlets and cafés reflect evolving consumption patterns and lifestyle transformations, with cafés increasingly functioning as socio-spatial nodes for youth interaction and informal economic activities [
77,
78,
79]. The positive correlation with tertiary education (r = 0.529) further underscores the role of socio-economic differentiation in shaping contemporary urban foodscapes.
The Shannon Diversity Index reveals significant intra-urban inequalities in functional diversity, consistent with findings from Xi’an, China [
80]. High-diversity neighborhoods tend to align along an east–west axis characterized by strong accessibility and investment, suggesting a spatial association between mobility structures and diversified consumption environments. In contrast, peripheral and historically high-rent areas exhibit lower diversity levels [
81], potentially reflecting forms of functional rigidity. This pattern indicates that historical centrality alone does not necessarily generate diversification in the absence of heterogeneous mobility flows. Rather than implying direct causality, these findings suggest that diversity emerges from the interaction between accessibility, investment dynamics, and localized constraints.
Kernel Density Estimation (KDE) provides a multi-scalar perspective on clustering patterns [
82,
83,
84], revealing the coexistence of multiple spatial logics. Hotspots in the historic core align more closely with CPT expectations, whereas clusters of cafés and seafood establishments near universities and major roads indicate the emergence of flow-influenced sub-centers. The improved performance of the SEM (AIC = 75.44) further supports the interpretation that clustering is shaped by interacting spatial processes rather than a single dominant mechanism.
This duality is also reflected in Local Moran’s I and standard distance analyses. High–High clusters dominate the northern and central sectors, representing areas where demand stability (CPT) and flow intensity (CFT) appear to intersect. Conversely, Low–Low clusters in parts of the historic core may indicate relative decline, saturation, or reduced flow attractiveness rather than simple marginality [
6]. The outward shift of the geometric center further suggests an ongoing transition toward more polycentric spatial configurations. Meanwhile, the “Others” category, which exhibits a near-random pattern, likely reflects more opportunistic or informal spatial behaviors operating beyond formal theoretical structures.
In conclusion, the spatial organization of restaurants in Tanta reflects a dynamic interplay between structural persistence and spatial transformation. Rather than supporting CPT or CFT in isolation, the findings point toward a context-dependent hybrid framework. The improvement from OLS (R2 = 0.369) to SEM (R2 = 0.534) underscores the importance of accounting for spatial dependence, without constituting definitive proof of a single explanatory mechanism. From a planning perspective, these results highlight the need to complement traditional population-based approaches with flow-sensitive strategies that better capture the role of accessibility, mobility, and urban dynamics in shaping service distribution.
The findings of this study may also support spatial decision-making processes by providing evidence-based insights into the distributional patterns and accessibility dynamics of urban food services. The integration of spatial analysis and econometric modeling can help planners and local authorities identify underserved neighborhoods, prioritize areas for service expansion, and evaluate the relationship between mobility structures and commercial concentration. In this sense, the study contributes to more informed and spatially sensitive urban planning approaches, particularly in rapidly growing cities where service inequalities and accessibility challenges remain significant.
5. Conclusions
This study provides a multi-scalar, spatially explicit, and econometrically informed analysis of food service distribution in Tanta. The findings reveal pronounced spatial inequalities, with central neighborhoods exhibiting dense concentrations of restaurants, while peripheral areas experience comparatively limited access. These patterns point to a structurally embedded imbalance in service provision rather than a random spatial distribution.
The results of the Spatial Error Model (SEM) further indicate that spatial dependence plays a significant role in shaping these patterns. The high Lambda value (λ = 0.69, p < 0.00001) suggests the influence of unobserved spatial processes, including accessibility conditions, infrastructural configurations, and network dynamics. However, these results should be interpreted as indicative rather than definitive, reflecting complex spatial interactions rather than a single causal mechanism.
From a policy perspective, the findings suggest the need for a shift from purely population-based allocation toward flow-sensitive planning frameworks. This could be operationalized through targeted interventions such as: (1) improving pedestrian accessibility in high-density but low-connectivity neighborhoods, measured through walkability indices and network centrality metrics; (2) incentivizing food service provision in underserved peripheral areas using zoning adjustments or tax-based instruments; (3) integrating mobility data into urban service planning to better align service locations with actual movement patterns and consumption flows. These measures would allow planners to move beyond static spatial equity assessments toward more dynamic, accessibility-oriented policy frameworks.
Several limitations should be acknowledged. The analysis is based on cross-sectional data and does not capture temporal dynamics; the range of socio-economic variables is constrained by data availability; and the focus on a single case study limits broader generalizability. In addition, the significant spatial dependence captured by the SEM (λ = 0.69) likely reflects the influence of unobserved structural factors that were not explicitly modeled. In the context of Tanta, these may include historical zoning legacies, informal commercial agglomeration practices, and localized real estate investment dynamics that shape land-use configurations beyond currently observed variables. Importantly, such latent factors may not only influence the spatial distribution of restaurants but also interact with the underlying flow-based mechanisms by reinforcing or constraining movement patterns, accessibility hierarchies, and consumer catchment areas. As such, the findings should be interpreted as contextually bounded analytical insights rather than definitive causal claims. Nevertheless, the application of spatial econometric models enhances analytical robustness by accounting for spatial dependence, thereby reducing potential estimation bias.
Future research could extend this work by incorporating longitudinal data, mobility datasets, and more granular socio-economic indicators to better capture the interaction between demand structures and flow dynamics. Comparative studies across multiple cities would also help evaluate the broader applicability of these findings in different urban contexts.
Overall, this study contributes to urban geography by advancing a context-sensitive, mechanism-based interpretation of service distribution. Rather than supporting Central Place Theory (CPT) or Central Flow Theory (CFT) in isolation, the findings suggest that urban food systems are shaped by the interaction between hierarchical demand structures and mobility-driven processes, with their relative influence varying across spatial contexts.





 ,
,