1. Introduction
Pond siltation is one of the most common, yet poorly understood, degradation processes in small water bodies, critical to the sustainability of rural ecosystems and water management. Unlike large reservoirs, ponds are characterized by shallow depth, limited hydraulic connectivity with rivers, and high sensitivity to changes in the catchment area, making them particularly vulnerable to sediment and organic matter accumulation [
1]. Pond siltation not only reduces usable volume and disrupts water supply functions, but also leads to accelerated eutrophication, littoral overgrowth, and reduced biodiversity [
2].
In the context of growing water scarcity and increasing water demand, maintaining the capacity of small water bodies is becoming critical for sustainable water management. Global analysis shows that siltation leads to a reduction in freshwater reserves, degradation of biotopes, and disruption of the hydrological regime, which in turn exacerbates problems of water and food security [
3]. It is projected that by 2100, the world’s water storage capacity will decline by >50% [
4]. This prospect highlights the need to develop accurate sedimentation prediction methods that can aid in water resource planning and management.
The problem is clearly transboundary in nature, as water erosion and sedimentation processes are not limited by national borders and require coordinated efforts at the international level. Sedimentation rates in ponds vary widely depending on the environment, climate conditions, basin/catchment characteristics, and anthropogenic impacts.
A review [
5] analyzed 33 articles, of which 14 found a general increase in sedimentation (siltation) rates, 13 identified a recent decrease, and 5 reported mixed results. This diversity of trends highlights the complexity of sedimentation processes and the need to consider multiple factors when developing predictive models. According to data presented in [
6,
7], approximately 25% of annual sediment runoff enters reservoirs, which leads to their gradual filling and a reduction in their service life. This problem is particularly acute in regions with intensive agricultural activity and rapid urbanization, where anthropogenic factors significantly intensify natural erosion processes.
Siltation of ponds and reservoirs is a complex process caused by multiple factors influencing sedimentation processes. As analysis of modern research shows, only an integrated approach that considers the interaction of climatic, geomorphological, and anthropogenic factors allows for the development of effective sedimentation management strategies [
5]. In the context of global climate change, manifested in an increase in the frequency of extreme hydrological events and changes in precipitation patterns, the problem of siltation is becoming even more acute, requiring the development of adaptive management methods based on forecasting future scenarios [
8].
In the Central Black Earth (Chernozem) macro-region of the European part of Russia, which includes Belgorod Oblast as an administrative region (the region of this study), ponds and small reservoirs play a key role in agriculture, providing irrigation and runoff accumulation under conditions of water resource scarcity, contributing to an increase in the local erosion base, and reducing the volume of slope erosion in the catchment [
9,
10,
11]. As shown by the data of hydrological studies [
12], Belgorod Oblast is characterized by significant siltation of water bodies, which negatively affects their functionality. The study region is characterized by a high degree of agricultural pressure on catchments/basins, which significantly increases erosion processes and sediment influx into water bodies. The average annual estimated potential soil loss in the region was estimated as 3.5 ± 0.3 t/ha [
13]. This situation is exacerbated by the lack of effective erosion management systems and an insufficient number of protective buffer zones along the shores/banks of water bodies.
Estimating bottom sediment thickness is a primary step in studying sedimentation processes. Current research demonstrates a wide range of approaches to measuring bottom sediment volume, ranging from traditional hydrological methods to innovative remote sensing technologies. Sonar methods, particularly single- and multibeam echosounders (SBES/MBES), have become the standard for rapid and non-destructive mapping of the water-bottom interface. These systems allow for the spatial distribution of bottom sediments to be assessed with a vertical accuracy of up to 5 cm under optimal conditions. However, their main limitation is their inability to penetrate the sediment layer to determine its total thickness above the hard (pre-depositional) bed. Sonar effectively displays modern bathymetry, but without additional data it cannot differentiate the original bottom of a reservoir/pond from accumulated sediment [
14]. Therefore, sonar surveys require careful calibration and verification with direct sediment data.
Ground-penetrating radar (GPR) has proven itself as a powerful intermediate tool, combining the broad spatial coverage of sonar with the detailed vertical information of cores. GPR uses electromagnetic waves to probe subsurface structures, allowing the identification of the boundary between loose sediments and the underlying consolidated substrate (e.g., bedrock). In freshwater bodies with low electrical conductivity, GPR provides high-resolution sediment thickness profiles over large areas [
15]. Due to the limitations of depth penetration, with 200 and 400 MHz antennas floating on the water surface, GPR is only suitable for <3–6 m shallow freshwater [
16].
In recent decades, geographic information systems (GIS) and remote sensing have become key tools for assessing sedimentation processes. Although direct probing of reservoir/pond bottoms using optical satellite data is limited by water transparency, indirect methods, such as analyzing changes in bathymetry, reservoir/pond volume, and suspended matter discharge, allow for effective assessment of bottom sediment dynamics. The work [
17] shows how the integration of GIS, remote sensing data and the RUSLE model allows for the quantitative assessment of soil erosion and, as a consequence, the potential sediment influx into river and lake/reservoir/pond systems. A particularly promising approach is the combination of satellite data with field measurements and hydrographic models. This approach allows not only to identify areas of intense siltation but also to predict sediment accumulation rates based on a spatial analysis of terrain, soil cover, and hydrological conditions. Some studies [
18,
19] emphasize that the use of digital elevation models (DEMs), land-use maps, and runoff data obtained using remote sensing significantly improves the accuracy of sedimentation estimates in reservoirs/ponds and lakes.
The rate and spatial patterns of sedimentation are determined by a complex interaction of natural and anthropogenic factors, with the latter becoming dominant in the Anthropocene. Anthropogenic pressure is the main accelerator of sedimentation (siltation) in most managed water bodies. Land-use changes in catchments, particularly deforestation, agricultural expansion, and urbanization, dramatically increase water erosion of the soil, leading to increased sediment runoff in water bodies. A study by Khodadadi et al. [
20] showed that anthropogenic activities have a “noticeable influence” on mass accumulation rates in lake sediments, often overwhelming the natural background signal.
The topographic characteristics of the drainage basin play a special role. Nagle [
21] notes that in tropical regions, the main source of siltation is cultivated steep slopes, where sheet and furrow water erosion are particularly intense. The steeper the slope, the greater the potential for soil loss and sediment transport into surface water bodies. Another key factor influencing siltation is urbanization, which, combined with agricultural activity, leads to a significant deterioration in the environmental state of water bodies. Severe siltation causes a range of negative consequences: reduced water flow, deterioration of water quality, loss of fisheries and recreational value, and the expansion of unusable wetlands [
22]. The hydrodynamic conditions of a reservoir/pond are the main natural factor controlling the location and nature of sediment deposition. The transition from a high-energy river environment to a low-energy lake environment within a reservoir/pond creates an ideal trap for suspended particles. Specific sedimentation patterns are determined by the reservoir/pond morphology, inflow characteristics, and operating conditions. For example, regulated flow can disrupt the natural dynamics of sediment transport, causing unexpected deposition zones or increased erosion in certain areas [
23].
Projections and observations indicate that climate change is leading to more frequent and intense precipitation events in many regions. These extreme rainfall events dramatically increase surface runoff and soil erosion in catchments, leading to increased peak sediments entering water bodies [
24]. This could seriously disrupt future water balances in irrigation systems by 2050 [
25].
Despite significant progress in the study of sedimentation processes, existing research reveals a number of critical gaps that limit the development of effective reservoir/pond siltation management strategies. An analysis of the current scientific literature reveals the lack of a unified methodology for assessing the relative contribution of various factors (climatic, geomorphological, landscape, and anthropogenic) to sedimentation processes [
5]. Calculations based on analytical models do not determine detailed characteristics of the reservoir/pond’s topography, increasing the uncertainty of water loss estimates. This limits the ability to accurately predict siltation in complex landscapes and anthropogenic impacts, where indicators vary significantly even within a single catchment. The introduction of LSTM (Long Short-Term Memory), ANN (Artificial Neural Networks), and MLP into forecasting can improve its accuracy [
26,
27]. In recent years, increasing attention has been paid to the application of machine learning to improve forecast accuracy. Machine learning, particularly LSTM and ANN, effectively handles nonlinear relationships between climate variables and sedimentation. For example, a study by Lucas et al. [
28] demonstrated the successful application of MLP-ANN and Random Forest to sediment volume estimation. Similar models were used, for example, to predict sedimentation for 22 years in the Gobindsagar Reservoir [
29]. Using PCA (Principal Component Analysis), DCA (Dollar-Cost Averaging) and UMAP (Uniform Manifold Approximation and Projection) methods, as well as hierarchical clustering and
k-means algorithms, resilient pond types that differed in their morphometry and environment were identified [
30].
A review of the scientific literature revealed a limited number of articles with comprehensive empirical data on the actual sedimentation (siltation) of reservoirs/ponds. Most existing studies focus on individual ponds [
31,
32], significantly limiting the ability to verify models for predicting reservoir/pond performance. In this regard, the results of the proposed study are intended to (1) contribute to the understanding of the causes of siltation of small artificial water bodies (ponds) using the example of one of the most agriculturally developed regions of Eastern Europe, based on field determination of the volume of bottom sediments in 23 ponds, through the identification of limiting factors in their siltation, and also (2) propose a typification of ponds for predicting the rate of siltation.
Identifying the most significant factors causing pond sedimentation in the Central Russian Upland will enable the development of recommendations for sustainable water resource management based on soil conservation measures. This will also help extend the lifespan of these artificial water bodies. Extrapolating the proposed classification to all ponds in the future will allow for the identification of those ponds most in need of cleaning without carrying out field surveys of the ponds themselves. This will also enable management agencies to make effective decisions without significant time and effort (costly surveys).
2. Materials and Methods
2.1. Study Region
Belgorod Oblast is one of the administrative units (regions) of the Russian Federation, located in the southwest of its European part. It is also situated within the southern and southwestern mega-slopes of the Central Russian Upland, in the basins of the Dnieper River and Don River, and possesses features characteristic of this upland (
Figure 1). Covering primarily the forest-steppe and partially the steppe zones, its territory is a relatively high plain, elevated in the northern part and having weakly defined inclinations to the west-southwest and east-southeast, densely dissected by a network of gullies and small dry (more precisely, seasonally dry) valleys [
33]. The region is located on the same geological formations characteristic of the southern part of the Central Russian Upland: chalk and marl deposits of the Upper Cretaceous are widespread there. However, their surface is covered throughout by loess-like (and ordinary) loams and loess, a distinctive feature of the entire upland.
The region’s climate is temperate continental, characterized by mild winters and hot summers. Air temperatures are influenced by incoming solar radiation and air masses. Significant climate change was noted in the region in the late 20th and early 21st centuries [
34]. The summer season has lengthened by 1.5–2 weeks and the winter period has shortened by 20–25 days. At the same time, an increase in annual average air temperature has been observed, which reduces the depth of soil freezing [
35]. Over the past 50 years, an increase in the length of the growing season by 13–16 days has also been noted [
36]. Of particular concern is the trend toward an increase in the frequency of heavy precipitation events in the forest-steppe zone, interspersed with prolonged dry periods. For example, an increase in the total precipitation during the warm period of the year and the number of days with precipitation ranging from 12.7 to 40 mm have been noted. Such changes in precipitation patterns contribute to an increase in the rate of water erosion of soils, accelerating the siltation of water bodies [
37]. On average, the amount of annual precipitation in the region varies from 500 mm in the eastern part to 630 mm in the western part [
38]. The average value of the moisture coefficient decreased by 9.7%, from 1.0 at the end of the 20th century to 0.84 by 2020. The greatest decrease in this indicator was noted in the southern and central districts of the region: in Belgorod—from 0.93 to 0.67, in Gotna—from 1.10 to 0.80 and in Valuyki—from 0.93 to 0.73. This indicates the transition of most of the territory from the zone of insufficient moisture (1.3 ≥ HCH (Selyaninov’s hydrothermal coefficient of humidification) > 1) to the status of an arid zone (1 ≥ HCH > 0.7) [
39].
Average values of anthropogenic load on the region’s catchments indicate a significant transformation of natural landscapes: cropland accounts for approximately 60.6%, forest cover accounts for 12.2% (in some municipalities up to 6%), and development area, including industrial facilities and the road network, reaches 4.9% [
40]. The construction of roads, settlements, and industrial facilities has reduced the area of natural landscapes, reducing their ability to infiltrate precipitation. This has led to increased stormwater runoff. As a result, even light precipitation causes significant soil erosion [
41]. The low proportion of shrub and tree vegetation in catchments significantly increased soil erosion. Plant roots act as a natural “anchor,” strengthening the soil cover and reducing its mobility under the influence of water and wind. The absence of forest belts in water protection zones deprives the soil of natural protection, increasing the rate of surface runoff and sediment removal. Scientific data has confirmed that forest belts in water protection zones can retain up to 70–87% of sediment and water runoff [
42].
Belgorod Oblast is one of the water-scarce regions of European Russia. Surface water bodies occupy less than 1% of its territory: from 0.2% in the eastern part of the region to 1.35% in its western part. Most of the water bodies in the region are shallow ponds and small rivers, which are prone to swamping and overgrowth of aquatic vegetation near their shores/banks [
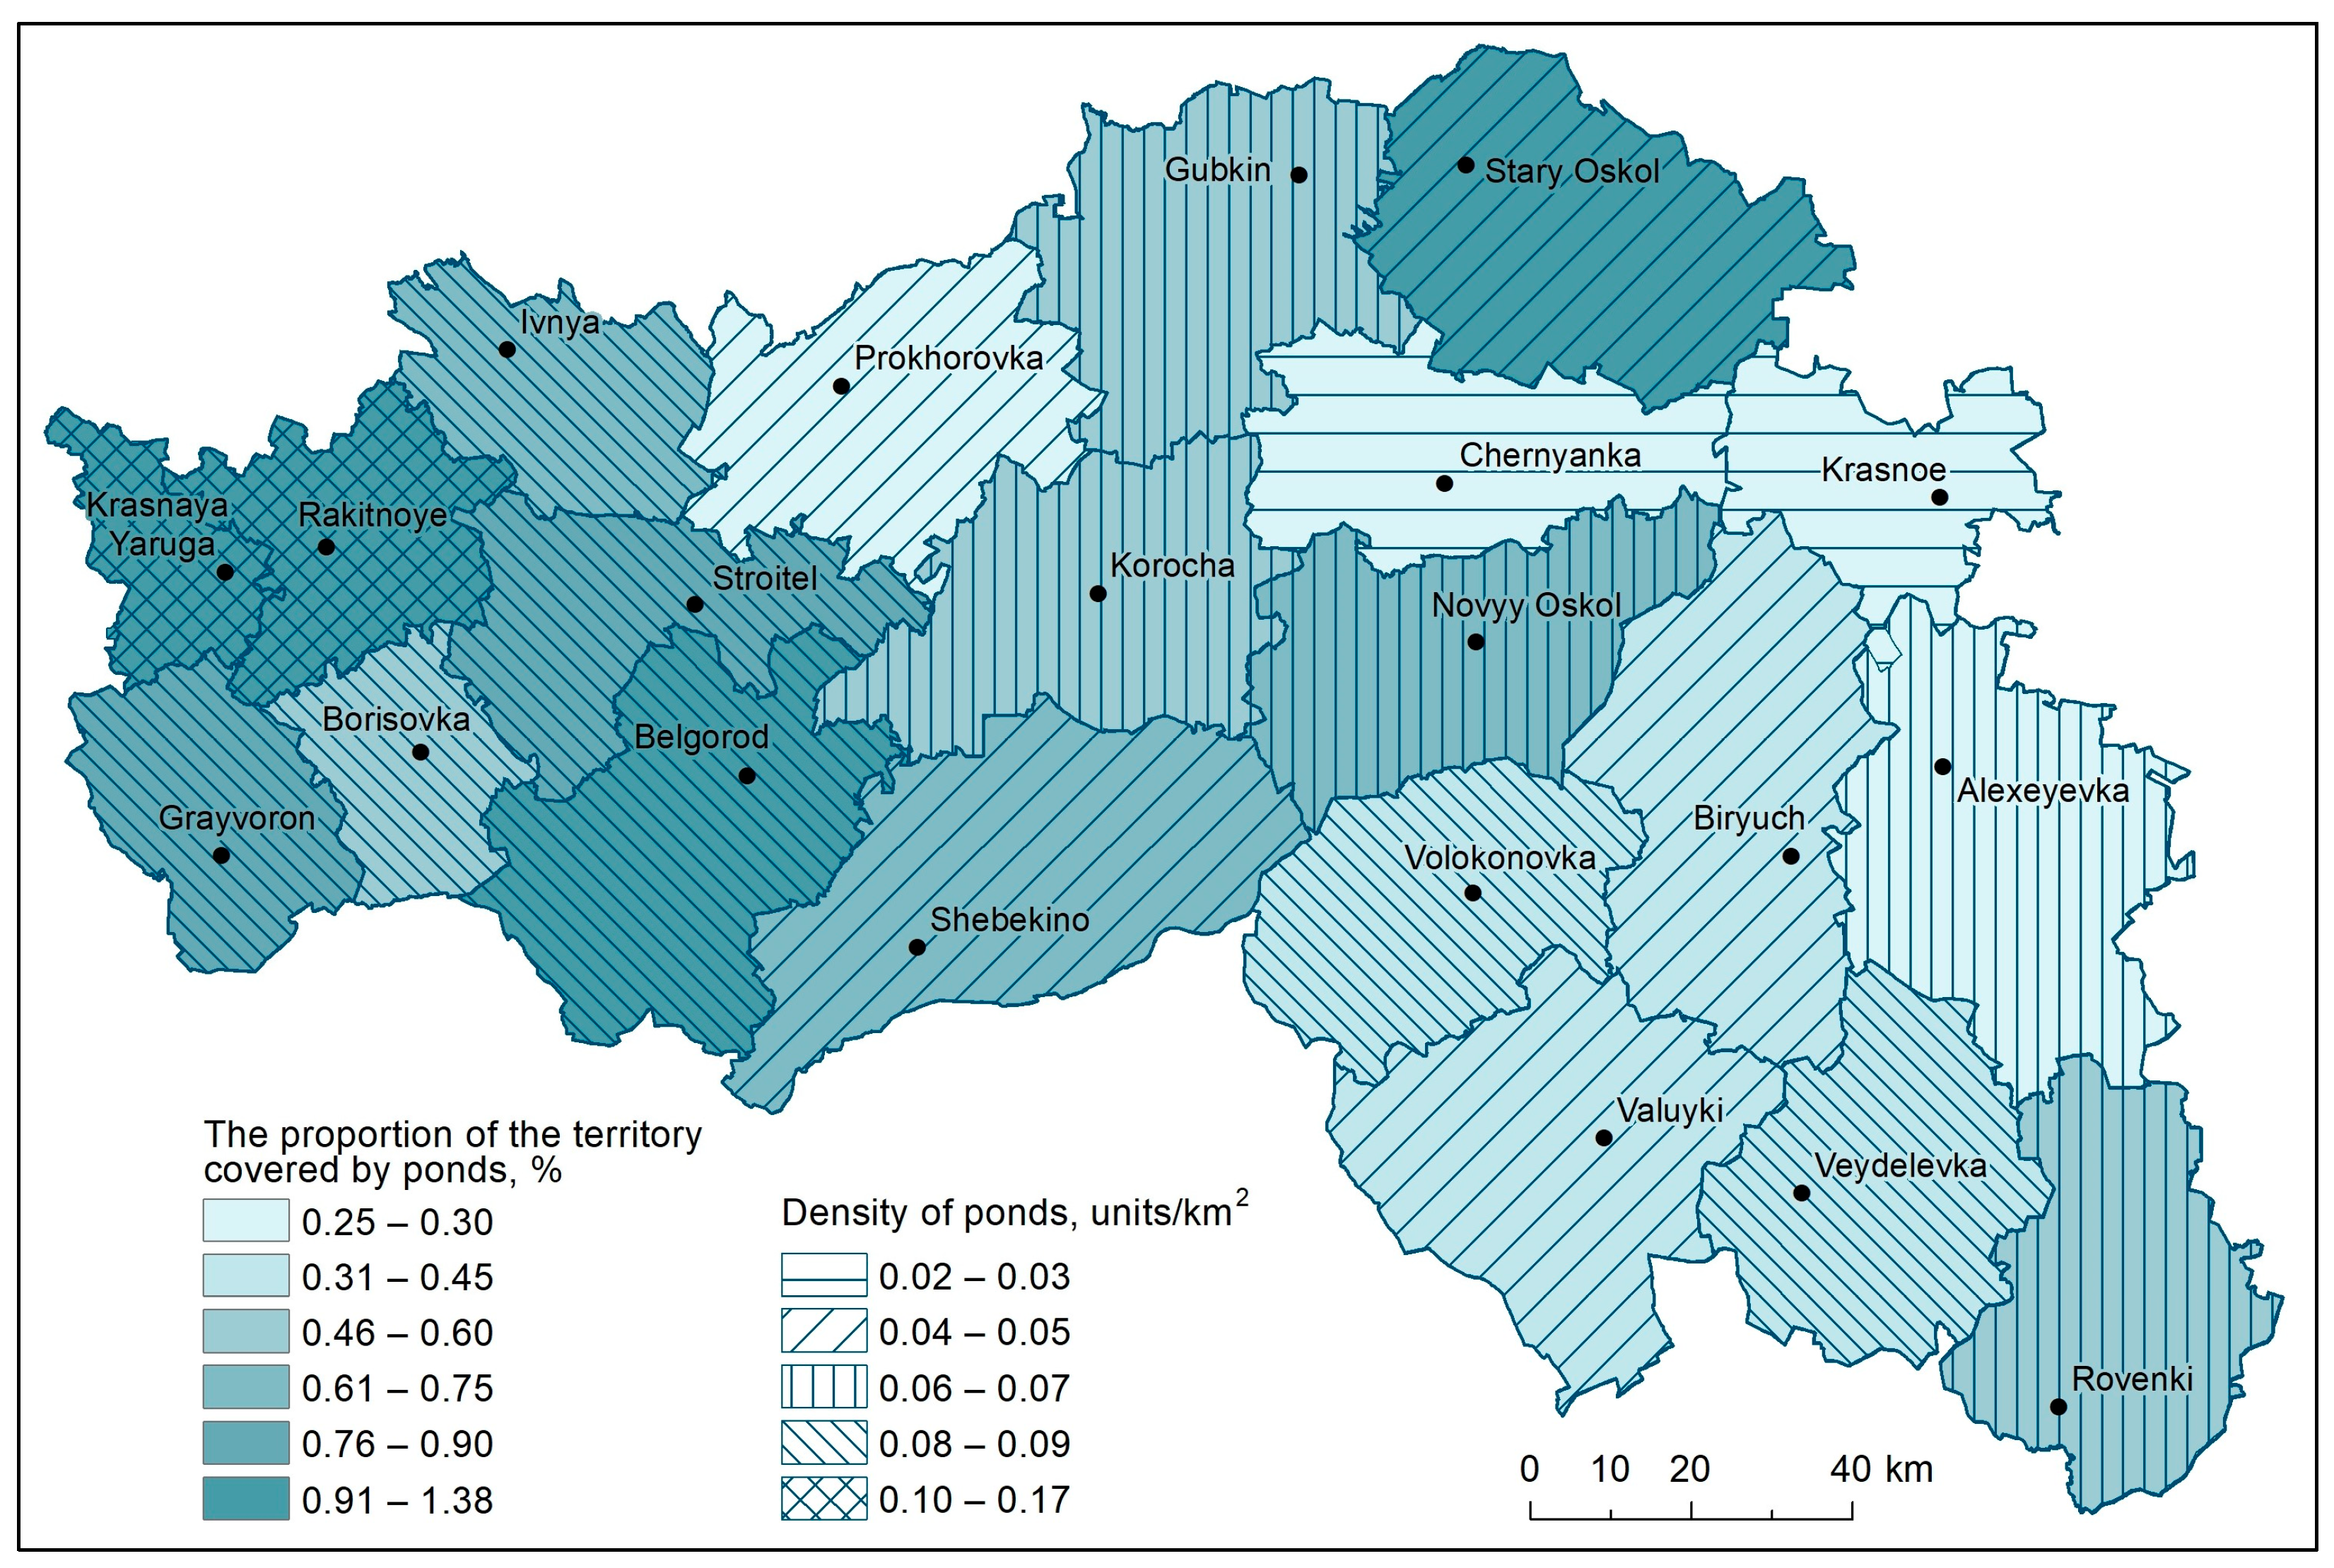
43]. Natural conditions have determined the specifics of the construction and operation of artificial small water bodies, which play a key role in the region’s agricultural landscapes. Hydraulic engineering construction in Belgorod Oblast began in the 1950s and 1960s: approximately 9% of modern ponds and reservoirs were built during this period. Since the 1970s and 1980s, reservoir/pond construction in the region has become widespread: 65% of hydraulic structures were built during this period. The rate of water bodies construction declined in the 1990s, with 20% of hydraulic structures built for agricultural irrigation and fish farming. In total, the region contains over 1200 ponds and reservoirs (
Figure 2). The pond density decreases from west to east. The sublatitudinal change in the area and number of ponds is primarily due to the aridization of the climate from west to east in the region.
The ponds under study are artificially created hydraulic structures designed to solve problems of fish farming, agricultural water supply and recreation. The anthropogenic transformation of the catchment areas of these ponds is expressed by high levels of plowing (on average 48.1%) and a significant percentage of the built-up area, which on average occupies 32.5% of their catchments. Such intensive anthropogenic pressure on the pond catchments indicates their deep integration into the economic structure of the study region.
The total useful volume of the region’s ponds is approximately 400 million m
3, and the total surface area is over 160 km
2 [
44]. Small-volume ponds were constructed in small seasonally dry valleys—ancient (Neopleistocene/Holocene) erosional landforms with overgrown bottoms and slopes formed primarily by linear erosion. The most common parent rocks are loess-like loams and ordinary loams, loess, mantle clays, modern and ancient alluvial and alluvial-deluvial deposits, represented by sands and sandy loams [
45]. No karst phenomena (karst or karst-suffusion sinkholes) were identified in the catchments of the studied ponds. Water bodies in karst depressions were not considered. Most ponds today are heavily silted due to soil and gully erosion within adjacent areas, which is directly related to anthropogenic changes in the structure of catchments. Slope plowing, deforestation, and urbanization have disrupted the natural hydrological regime, increasing surface runoff. A large-scale regional project to clear bottom sediments not only from small water bodies, but also from rivers, showed that it is most expedient to synchronize these measures with the implementation of projects for soil and water conservation development of agricultural landscapes in catchments [
46].
2.2. Study Objects
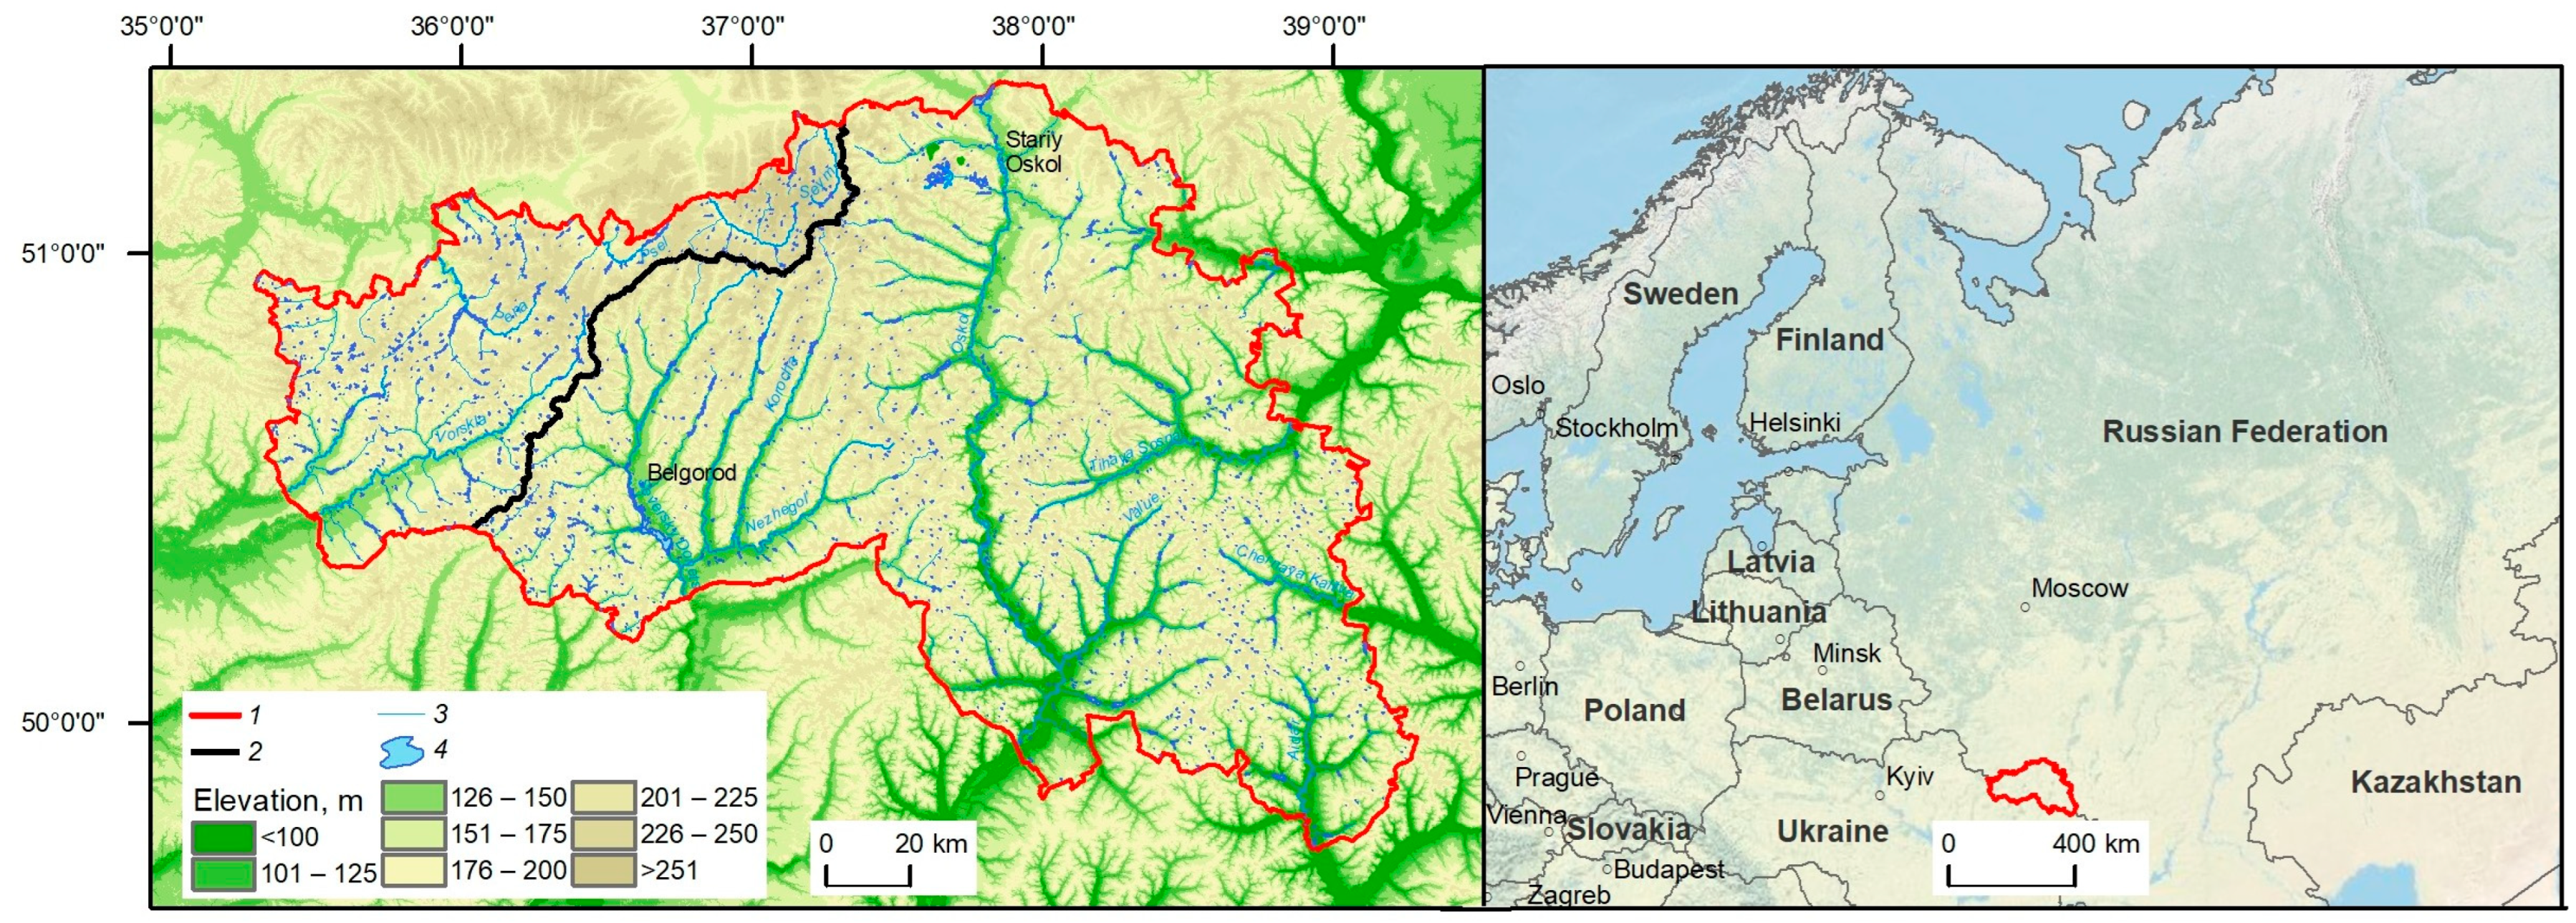
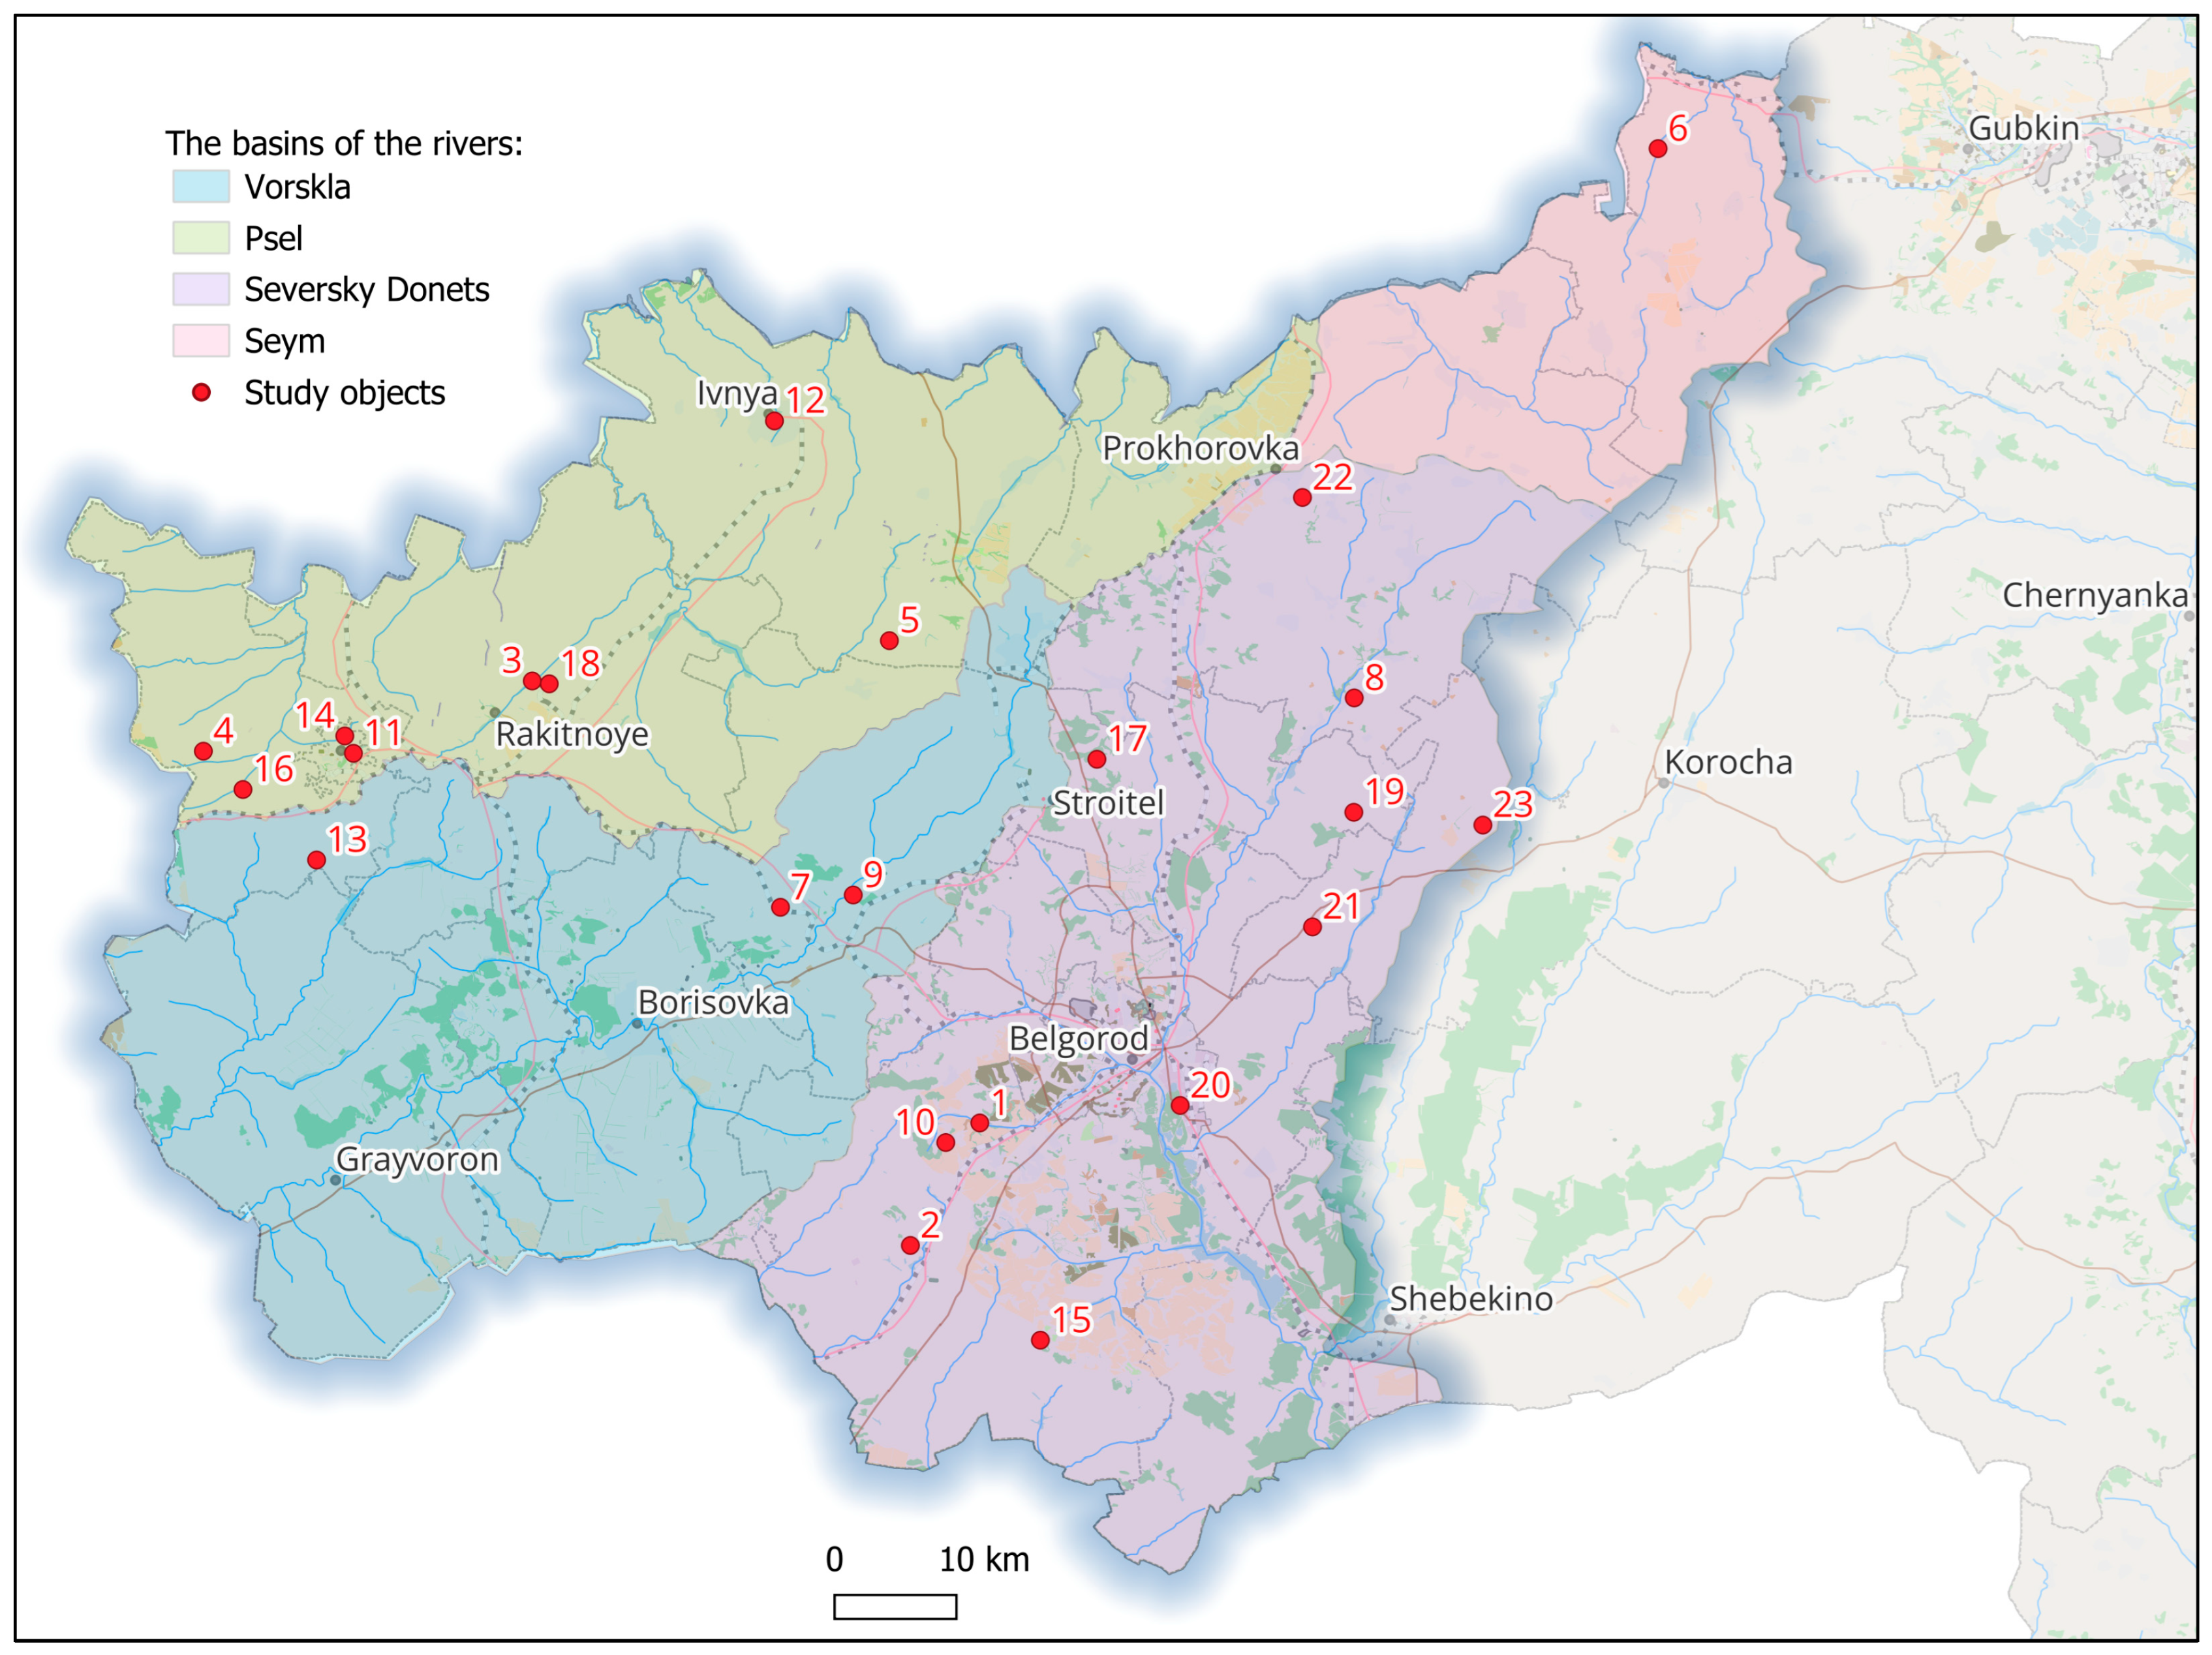
Belgorod Oblast is implementing the “Our Rivers” regional program, which includes scientific research to substantiate water body cleanup measures. Over 100 water bodies (ponds and river sections) in the region have already been cleaned of bottom sediments and removed of tough vegetation, and other measures have been taken. In 2022–2024, the authors of this study carried out field surveys of 23 ponds within Belgorod Oblast (
Figure 3), within the framework of this program. The studied ponds are located in the western part of the region: three of them belong to the Vorskla River basin, 11 to the Seversky Donets River, and 9 to the Psel and Seym rivers.
The study sample included single (or the first in a cascade) ponds of artificial origin in the main river basins of the forest-steppe part of Belgorod Oblast, formed in gullies and small dry valleys (so-called balkas in the region). This sample representatively reflects the characteristics of siltation of water bodies under conditions of intensive agricultural use of catchments under various combinations of some environmental factors (relief, forest cover, and soil cover), but similar climatic conditions.
In addition, all selected ponds are included in the regional program “Our Rivers” and are planned to be cleared of bottom sediments in the next 3–5 years, which will allow for further monitoring of re-siltation processes. This approach will allow us to identify key determinants of sediment accumulation processes and improve the scientifically based typification of small water bodies developed in this study for planning environmental protection measures and optimizing the sequence of rehabilitation work in regional water programs.
All the surveyed ponds were built between 1970 and 1990. As of 2025, the age of each of them ranges from 35 to 55 years, which allows them to be classified as old ponds according to the age classification of Spichakov [
47]. Based on the functional-genetic classification of ponds by Mishon [
48] and the typification by [
49], the studied objects belong to seasonally-dry-valley–gully ponds of artificial origin, created by constructing earthen dams. These ponds are located outside of cascades, which allows them to be classified as single ponds. The ponds are fed by a mixed source, including surface runoff from their catchment area and, to some extent, groundwater. Based on their morphometric characteristics, the vast majority of the ponds are classified as medium-deep (with an average depth of 1–2 m), although a few reach significant depths (3–6 m) and can be classified as ultra-deep (the pond southwest of Komsomolsky village (No. 1), and the pond in Krasny Oktyabr’ village (No. 2)). Most of the studied ponds have an elongated (ribbon-like) shape, a characteristic typical of artificial ponds formed in seasonally dry valleys and gullies. The characteristics of the catchments of the ponds were determined using land-use maps at a scale of 1:10,000 and are presented in
Table 1.
When selecting some parameters that could influence the volume of bottom sediments, their comprehensive reflection of both the geomorphological features of the pond and the characteristics of its catchment area was taken into account. It is these parameters that have a direct impact on siltation processes.
The average (h) and maximum (H) depth of a pond are important characteristics that determine its resistance to the accumulation of sedimentary material. Shallow water bodies have less hydrodynamic stability, which contributes to a decrease in flow velocity and an increase in the sedimentation zone of suspended particles.
The average slope (gradient) of the catchment (α) plays a key role in the dynamics of surface runoff and the transport of suspended particles from the catchment area into the pond itself. With a steeper slope, runoff carries more energy, increasing soil/gully erosion and increasing the volume of sediment runoff entering water bodies.
Forest cover of a catchment (F) is one of the most important factors reducing the intensity of water erosion. Thanks to their extensive root systems, forests retain the topsoil, slow runoff, and facilitate water infiltration through the forest litter.
Cultivated areas, measured by cropland percentage (Pl), are characterized by increased erosion risk. The lack of protective vegetation makes cropland vulnerable to water and wind erosion. As a result, these areas become the main sources of sediments flowing into nearby water bodies.
Annual soil loss (W), averaged over a long period, is a quantitative measure of soil erosion. It depends on many factors, including soil type, climate, terrain slope, percentage of cropland, and percentage of forest cover in the catchment area. High soil loss indicates a significant influx of suspended solids into water bodies, which accelerates sediment accumulation and, consequently, reduces the lifespan of water bodies.
Vertical relief (terrain) dissection (D) serves as an important indicator of the overall activity of relief-forming processes and water flows in catchment areas. It characterizes the difference between the highest and lowest elevations in the catchment area. The higher this indicator, the higher the potential for rapid runoff formation, water erosion, and sediment removal into water bodies.
2.3. Methods
The bottom sediments of the studied ponds have significant differences in grain size composition; therefore, the use of modern methods for determining their thickness (sonar and ground-penetrating radar), which require checking and adjusting the equipment, was excluded. For the field study of bottom thickness, a traditional measurement method was used by measuring the distance from the surface of the bottom sediments to the surface of the pond bottom (its solid base) by smoothly pressing a rod or mark into the bottom sediment of the pond, which was carried out from a boat [
50]. The locations of the survey verticals were marked with a distance between them equal to 0.1 of the cross-section width. Since the bottom sediments have significantly less resistance to penetration, the rod penetrated them without hindrance until it encountered a denser underlying layer. The expected error in vertical measurements is ±3–8 cm. Bottom sediment thickness was calculated as the difference between the initial reading (from the water table to the silt surface) and the final reading (after reaching the dense layer).
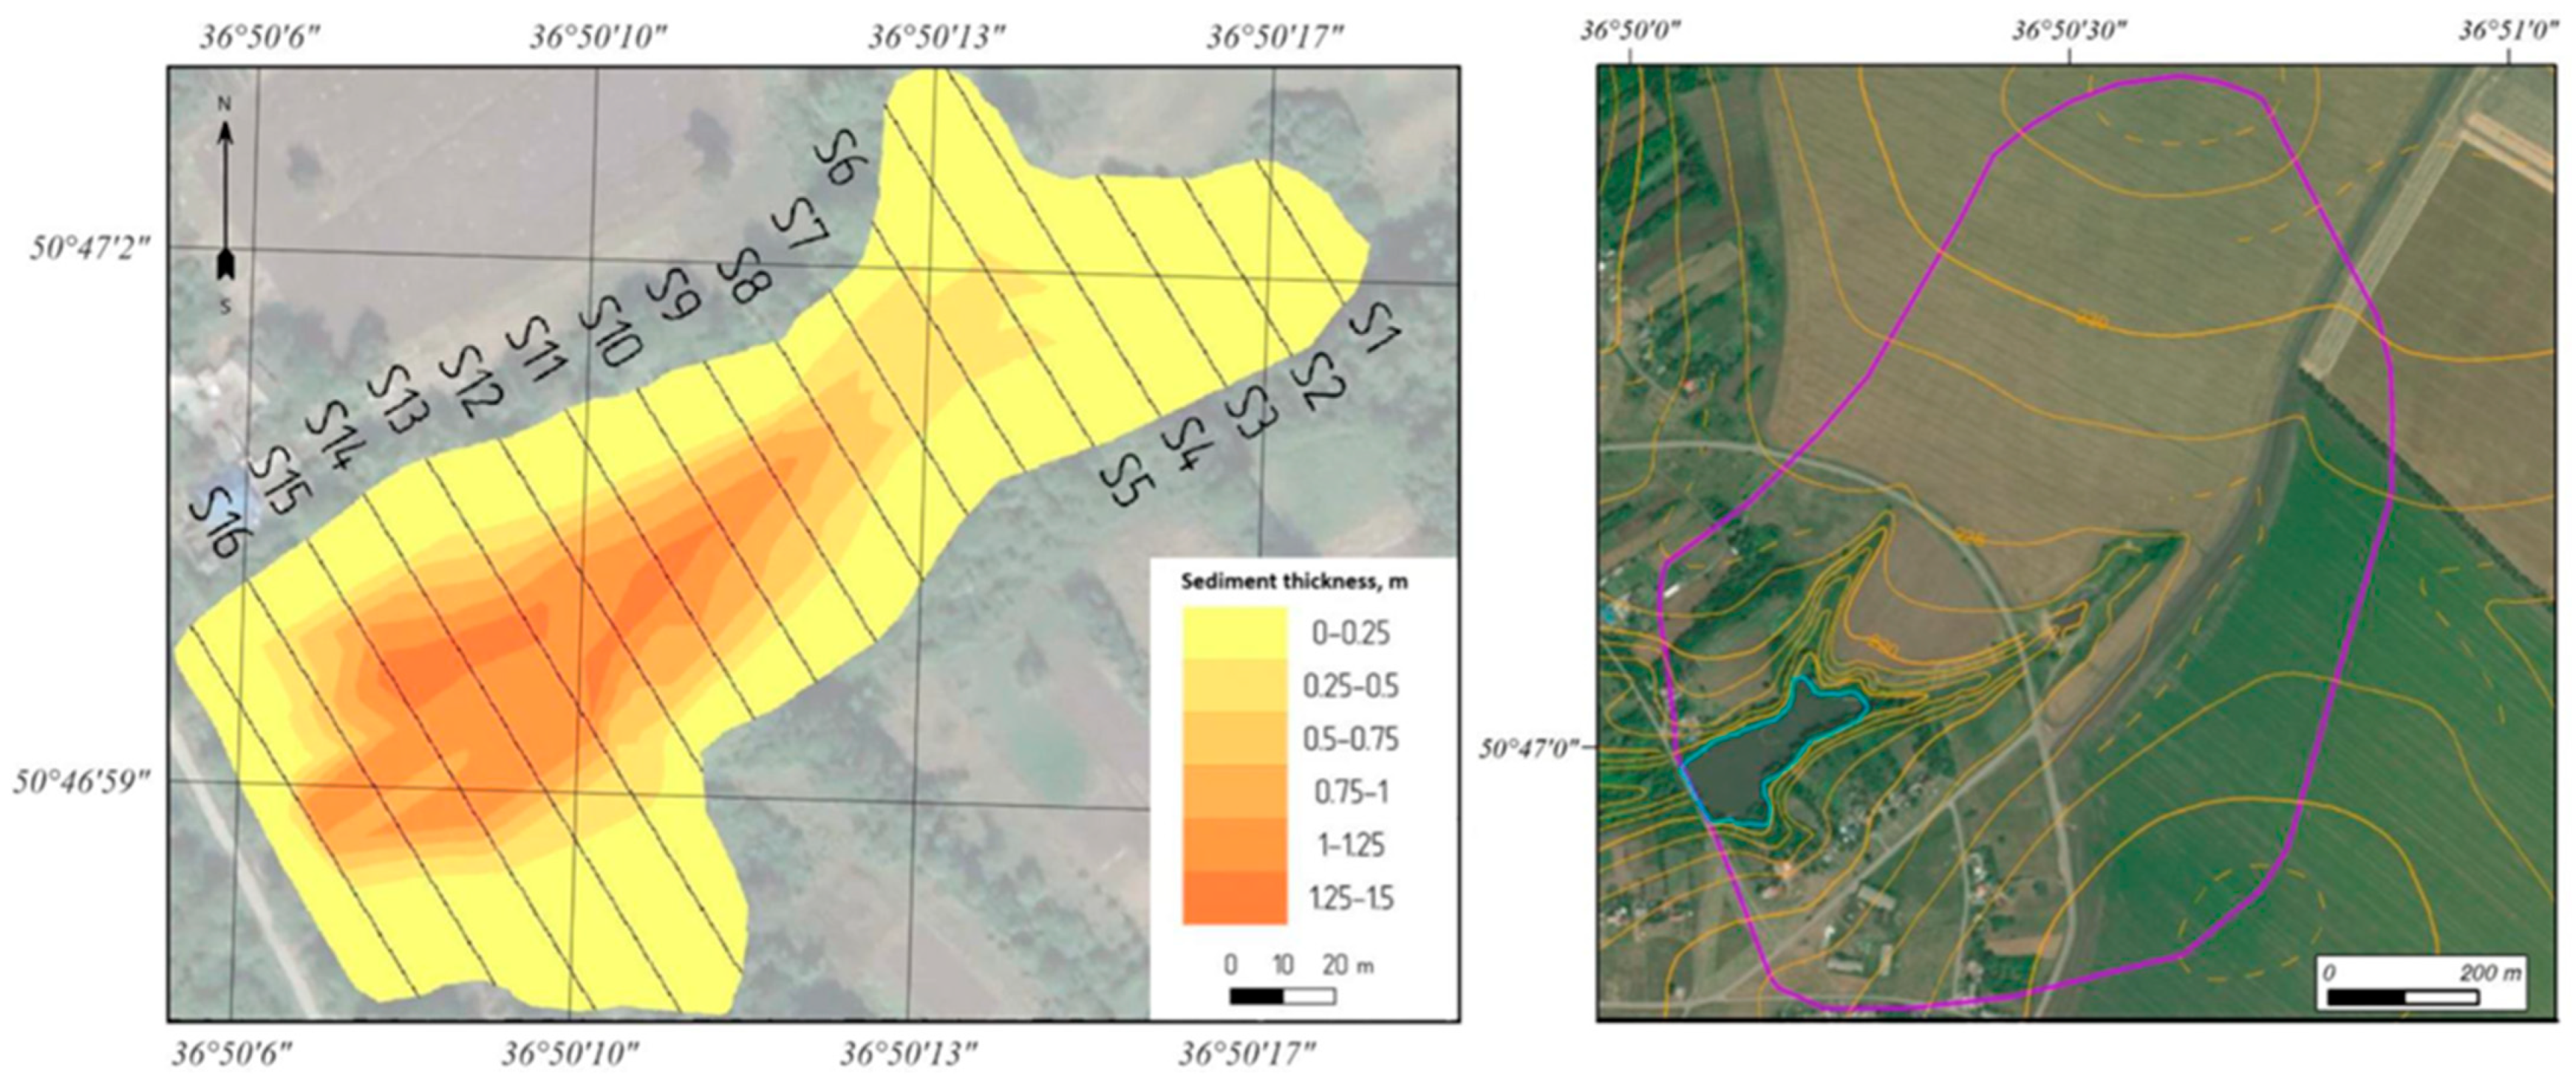
Field data were used to calculate the volume of bottom sediments. Bottom sediment volume was calculated using the vertical cross-section method in the GIS “GEOMIX” (
Figure 4). GEOMIX is Russia’s leading mining and geological information system. It is widely used in calculating career prospects in Russia and has proven its reliability.
The volume of soil washed out from the catchment area was determined by calculation in the ArcGIS 10.5 program. For this purpose, the empirical Formula (1) (V.P. Gerasimenko’s formula [
51]) was used to calculate the average long-term soil loss during snowmelt (
Ws):
where
Ws is the soil loss during snowmelt, t/ha;
I is the coefficient depending on the degree of moisture in the area;
Ŵ is the long-term average zonal soil loss from fallow or compacted cropland, t/ha;
L is the distance from the watershed line to the cross section of a river/creek for which the soil loss is determined (m);
β is the steepness of the slope (in degrees) along a distance of
L (m) from the watershed line; π is the coefficient taking into account the influence of the slope profile on soil loss;
T is the indicator characterizing the influence of the soil type (subtype) on water erosion; λ is the coefficient reflecting the influence of the degree of water erosion of cropland on erosion processes;
Ka is the coefficient showing the impact of the slope aspect on soil loss;
Kp is the coefficient of loss reduction when using soil-protecting agricultural or irrigation techniques on arable land.
The long-term average annual rates of rainfall-induced soil erosion (
Wr) on cropland were calculated using the empirical USLE model based on five main factors determining the intensity of water-erosion processes [
52,
53,
54,
55,
56], adapted to the conditions of European Russia:
where
R is the rainfall factor (MJ mm/ha h);
K is the soil structure destruction factor (t ha h/MJ mm ha);
LS is the slope length and steepness factor;
C is the coefficient of projective soil cover with plant residues;
P is the factor of the degree of soil protection from water erosion. To adjust the
C factor calculated on the basis of the NDVI index [
57,
58] for 5 years (2020–2024) according to MODIS data, a multiplier of 2.16 was used for the average regional value of the
C factor.
After calculating
Ws and
Wr values, their rasters were summed to calculate the average annual soil loss (
W) in t/ha (Formula (3)). To convert these values to soil volume, an average soil density of 1.2 tons per m
3 was used.
The sediment delivery coefficient (SDC; 0 to 1), or sediment delivery ratio, is a key parameter in assessing water erosion processes in ponds’ catchments. It characterizes the proportion of eroded material reaching the reservoir/pond out of the total volume of potentially erodible material. This study utilized the empirical relationship between the sediment delivery coefficient and catchment area obtained by V.N. Golosov:
where
S is the catchment area (km
2). This formula is adapted to the conditions of the European part of Russia [
59] and, compared with the formulas proposed by Lu. et al. [
60], has advantages for application in the conditions of European Russia.
Thus, the use of empirical models of snowmelt- and rainfall-induced water erosion, combined with GIS technologies, allowed us to obtain data on the spatial distribution of soil loss in the study area. The resulting soil loss values, converted to volumetric units considering soil density, as well as the use of a sediment delivery coefficient, enable a more accurate assessment of the impact of water erosion processes on sediment formation within catchments.
2.4. Statistics and Software
To assess the strength and direction of the relationships between natural and anthropogenic factors on pond siltation, Spearman correlation analysis was used. This allowed us to identify nonlinear relationships between variables without assuming normal data [
61]. Microsoft Excel software was used to implement this analysis. The result was a correlation matrix showing the correlation coefficients between all pairs of variables assessed using the Chaddock scale [
62].
To perform statistical analysis procedures, we used the seaborn pandas library and scikit-learn in the Anaconda 3-2024.10-1 distribution. This made it easy to complete all standard steps in the interactive Jupyter Notebook (7.2.2.) environment. Writing the program codes for Anaconda required using a Qwen 3-VL-30B-A3B neural network with search and reasoning functions enabled.
To visualize the results of the correlation analysis, a heatmap was constructed using the seaborn library. The sns.heatmap() command was used for visualization, with parameters defined based on data display requirements: the RdBu_r color palette for clearly distinguishing positive and negative correlations, and the annot=True parameter for displaying correlation coefficient values in cells. To implement the feature importance analysis, factor and cluster analysis, the pandas library was used, which made it possible to load and pre-process source data using the pd.read_csv(‘.csv’) command. The pdpbox library was used to create partial dependence (PDP) graphs.
To identify key factors, the feature importance analysis was performed using the Random Forest method to rank variables according to their importance in explaining changes in sediment volume. This method was chosen due to its ability to account for nonlinear relationships and interactions between variables [
63]. The Random Forest algorithm evaluates feature importance based on the Mean Decrease in Impurity (MDI): the more the variance decreases when partitioning by a feature, the more important it is. Feature importance (Gini coefficient) was calculated using the
Feature_importances_ command, which returns arrays of results reflecting the contribution of each feature to variance reduction across all trees.
To identify hidden relationships between natural and anthropogenic factors and pond siltation, factor analysis was carried out using principal component analysis (PCA). This allowed us to reduce the dimensionality of data by identifying key hidden factors that explained the bulk of the variation in the original variables. Before analysis, the data was standardized using the
StandardScaler class from
scikit-learn, which converts all variables to a single scale with zero mean and one standard deviation. The Kaiser criterion was applied to determine the number of components considered [
64]. This criterion selects components with eigenvalues greater than one. This ensured that the most informative factors were selected, reducing the number of components while maintaining the maximum proportion of explained variance. As a result of the analysis, three components were identified, which together explained more than 70% of the total variance in the data, indicating the high information content of the resulting factor model. To interpret the results of the analysis, a matrix of factor loadings was calculated, reflecting the degree of influence of each initial variable on the selected components. Values in the matrix close to ±1 indicated a strong influence of the variable on the corresponding factor.
To identify hidden group patterns between the natural and anthropogenic characteristics of the studied ponds and their siltation, a cluster analysis was carried out. The analysis was performed without preliminary hypotheses about the structure of the data, which made it possible to objectively identify homogeneous groups of ponds with similar sediment formation conditions [
65]. The initial data was a table containing quantitative indicators for each pond: area, average depth, distance to the nearest road, population density in the adjacent zone, intensity of agricultural impact, and siltation index. Before clustering, all features were standardized using the
StandardScaler command from the
scikit-learn library to eliminate the influence of differences in measurement scales and ensure equal contribution of each parameter to the clustering process.
To construct the dendrogram, hierarchical agglomerative clustering with the Euclidean distance metric was used, which minimizes intra-cluster variance and promotes the formation of compact and well-separated groups [
66]. The linkage matrix was calculated using the
linkage function from the
scipy.cluster.hierarchy module, after which the dendrogram was constructed using the dendrogram function. To objectively select the number of clusters, we additionally calculated the silhouette score for a range of 2 to 9 clusters and determined the optimal number of groups based on the maximum of this score.
2.5. Limitations
The proposed analysis of the influence of natural and anthropogenic factors on pond siltation can be applied to landscape and climatic conditions similar to those of Belgorod Oblast. The calculation of sediment accumulation volumes is associated with the calculation of potential soil losses. To date, adapted regional models have been developed for various regions, considering factors such as topography, vegetation, and soil cultivation technology. Therefore, when applying the proposed approach, it is recommended to use precisely such models. Furthermore, the sediment delivery rate may vary regionally and may depend not only on the catchment area but also on the land use/cover pattern [
60]. Therefore, it is advisable to select studies or carry out your own, adapted to local environmental conditions.
Using a core sample to determine bottom sediment thickness may distort the results if the bottom rocks are loose. However, the solid foundation in the study region consists of clays and loams, the density of which is higher than that of the accumulated bottom sediments. Due to the varying grain size distribution of bottom sediments in various bodies of water, sonar and ground-penetrating radar methods require testing in each body of water using core sampling. This requires additional equipment and a longer study period. This method can be used as an alternative to the rod method and is more reliable.
The sediment delivery coefficient (or sediment delivery ratio) may vary regionally and may depend not only on the catchment area but also on the land use/cover structure of the area.
This study is based on single measurements of bottom sediment volume, which is necessary because the objective is to determine the total volume of accumulated sediment over the pond’s operational life. However, this does not allow for consideration of seasonal and interannual sedimentation dynamics. The lack of long-term observations of sediment accumulation processes makes it difficult to assess long-term trends and the impact of extreme weather events on sedimentation intensity.
3. Results and Discussion
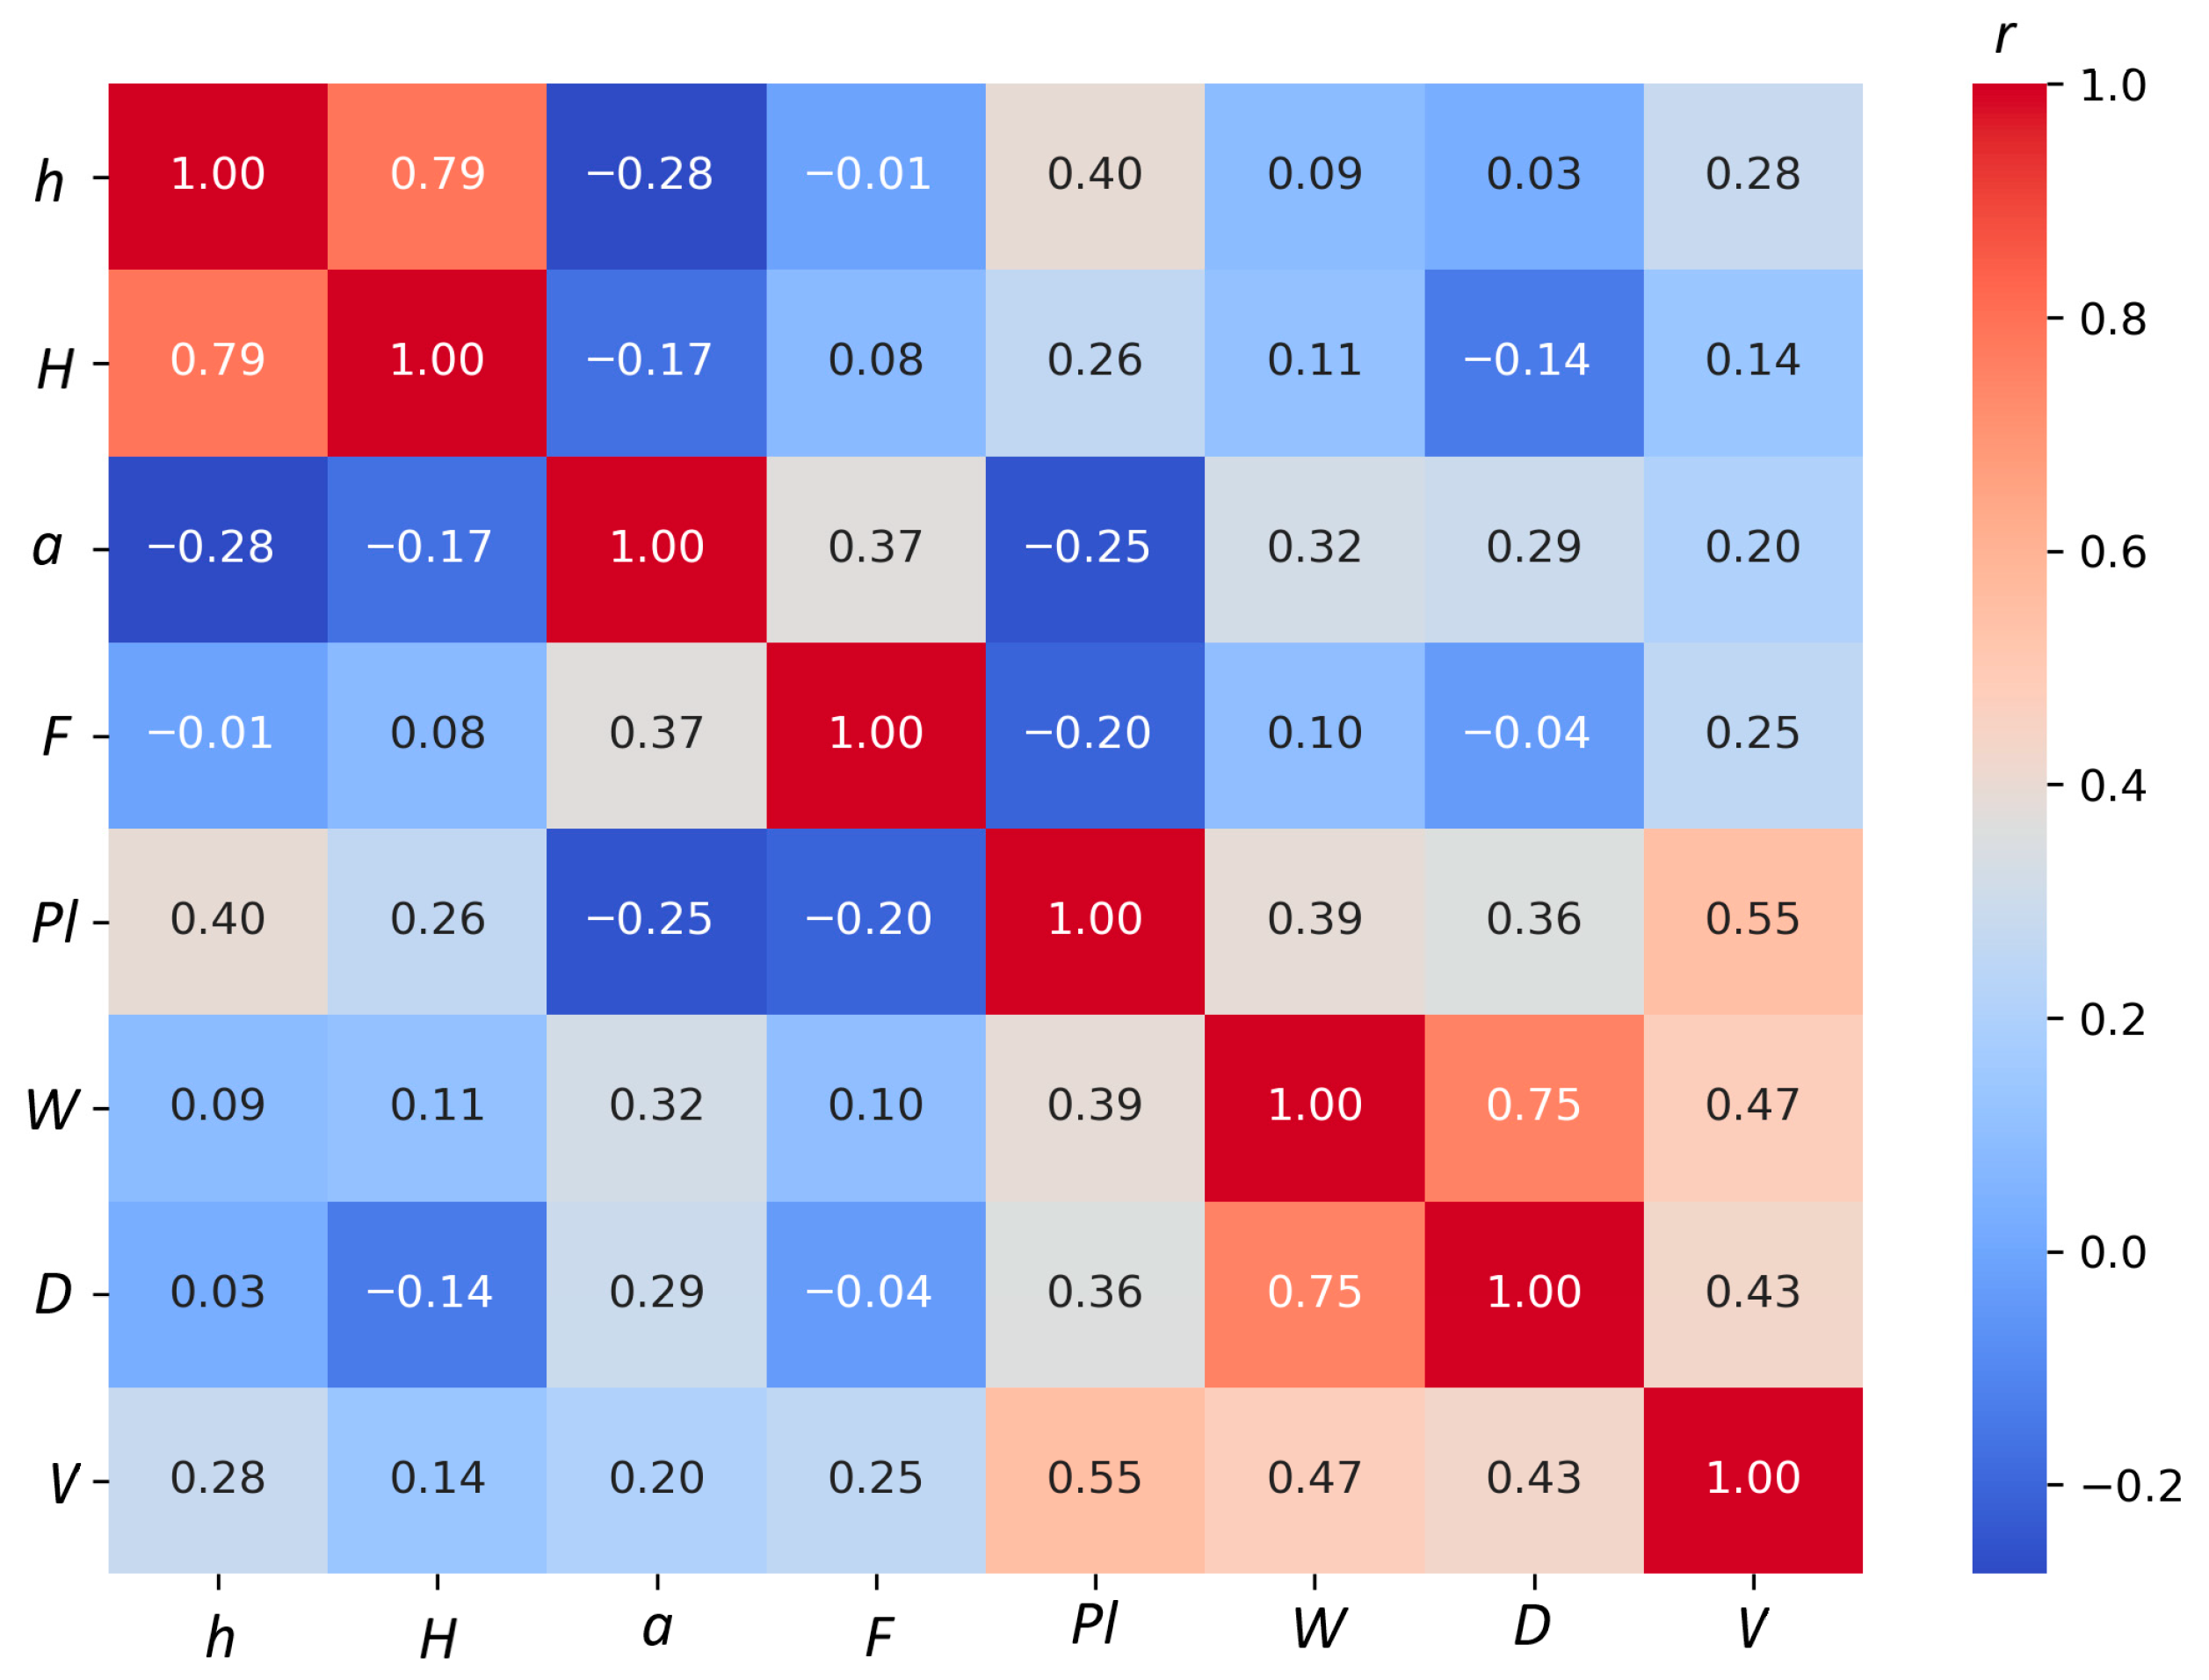
Correlation analysis using Spearman coefficient (
r) showed that the strongest correlation was observed between the volume of bottom sediments and plowing percentage (
r = 0.55,
p < 0.01). This is due to changes in the environmental state of the area (deforestation, plowing of dense steppe and meadow vegetation), the high proportion of fallow crop rotations, where the absence of protective forest belts leads to increased sediment input from agricultural fields, and, consequently, moderate soil erosion (
r = 0.47,
p < 0.05), which directly increases the volume of bottom sediment in the pond (
Figure 5). This is confirmed in [
67,
68]. A moderate correlation (
r = 0.43,
p < 0.05) between siltation volumes and vertical terrain dissection was found. Forest cover, despite the expected reduction in water erosion and the transition of surface runoff into subsurface runoff, demonstrates a weak positive correlation (
r = 0.23), while no statistically significant difference was found (
p = 0.25).
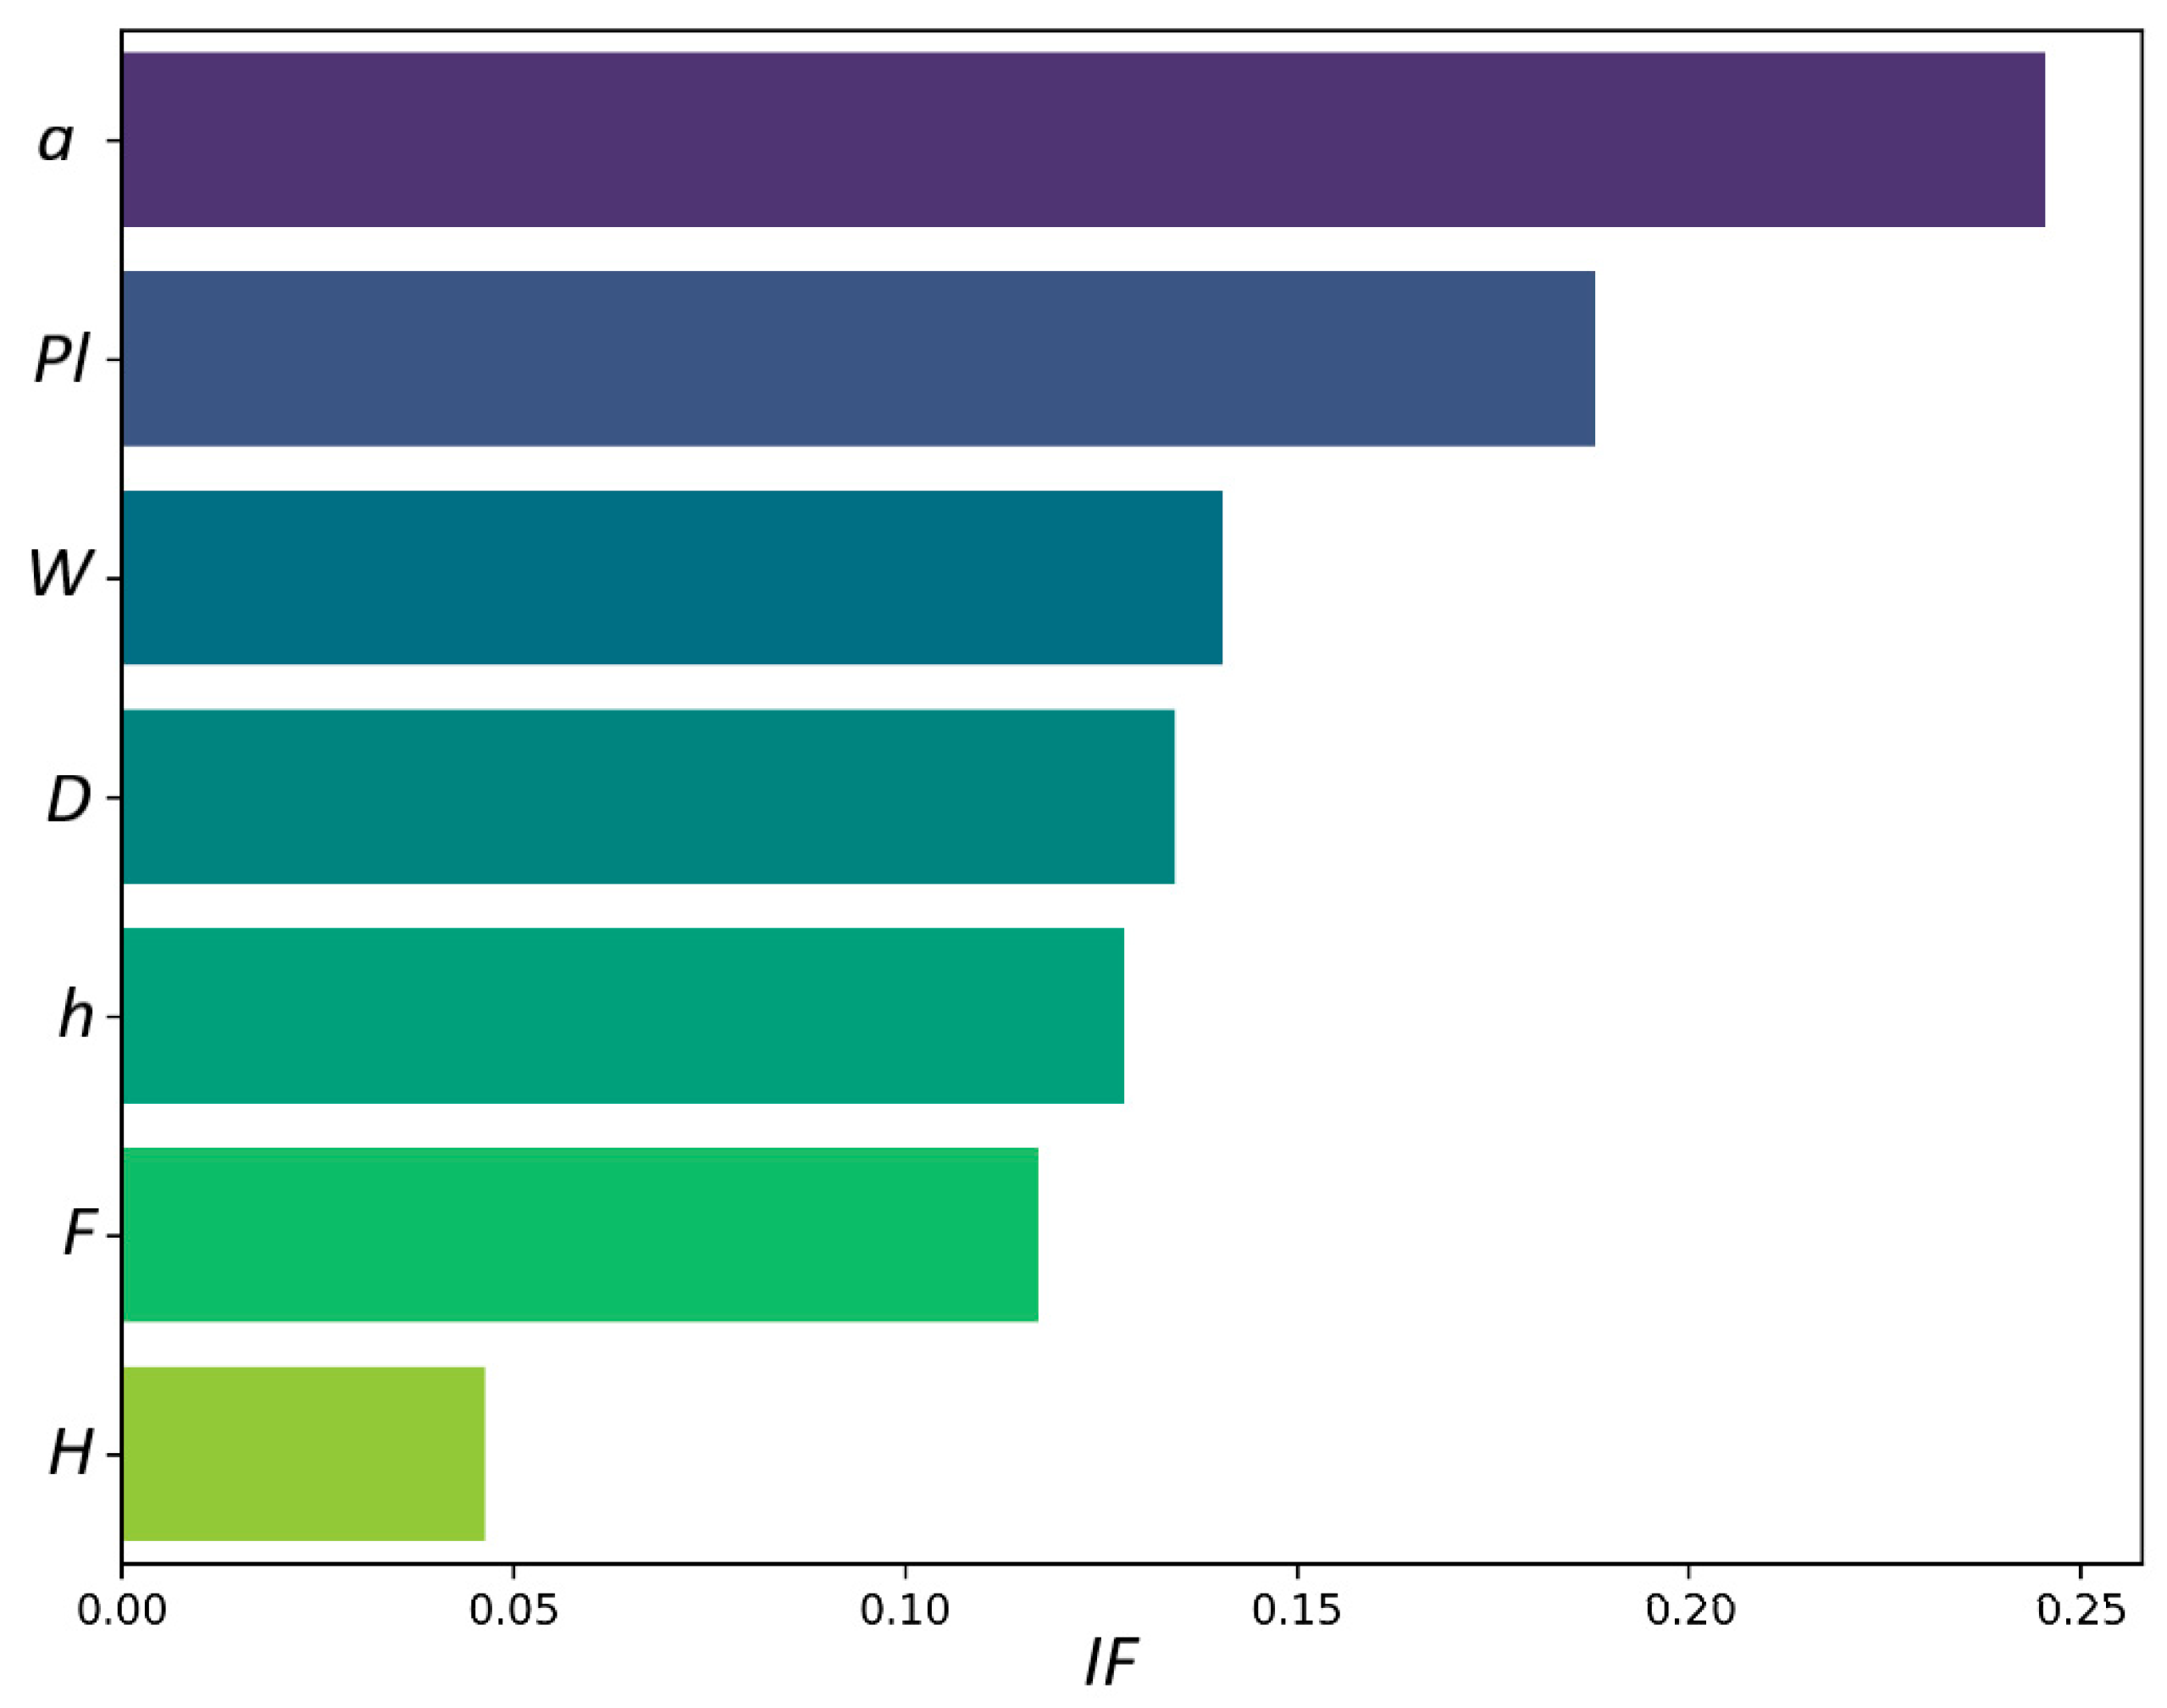
Using the Random Forest method, we determined that the greatest influence on the volume of bottom sediment is exerted by: the average slope of the catchment (24.6%), plowed area (18.8%), and the average annual soil loss (14.1%). The maximum pond depth (
H) has the least influence on siltation (
Figure 6).
Taken together, these parameters demonstrate a significant influence (57.4%). However, the loadings of the remaining factors were less significant, which may indicate a more complex, indirect influence or the presence of hidden relationships between variables.
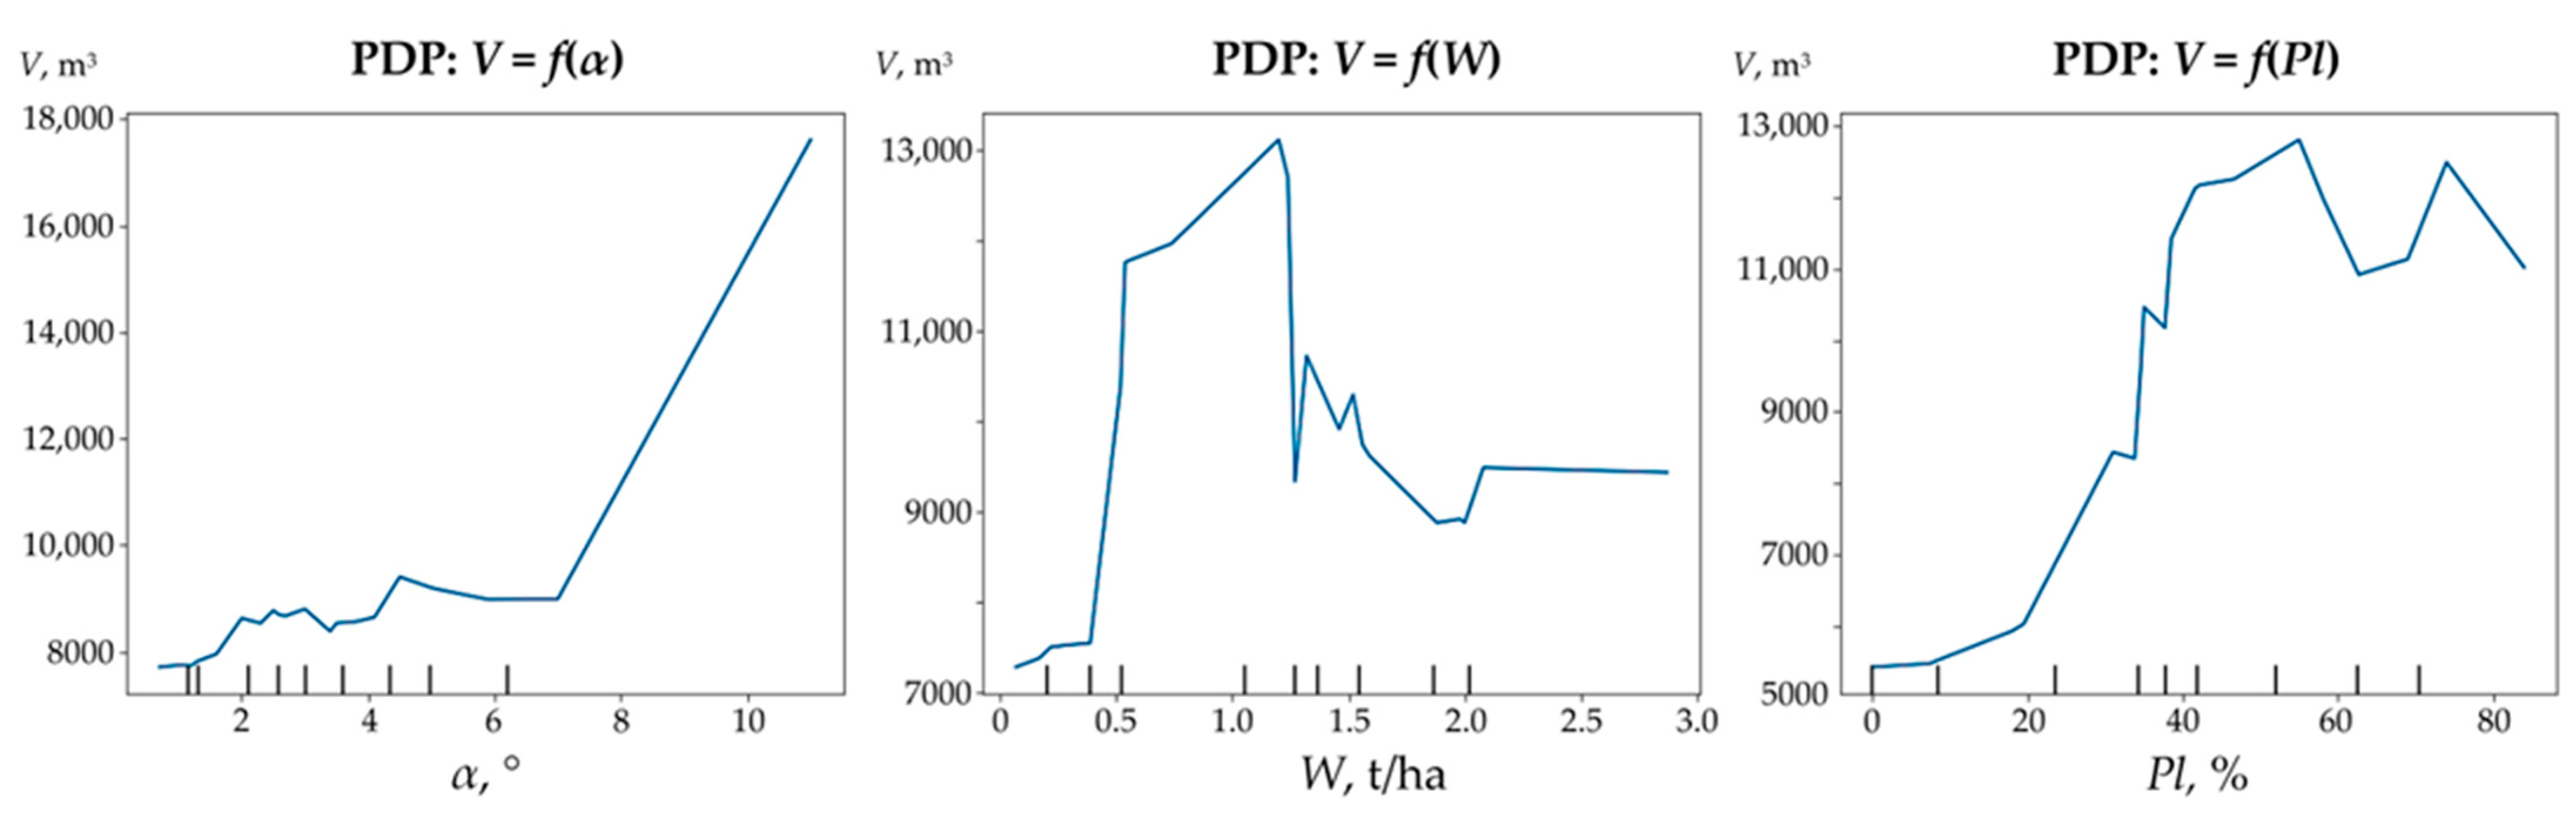
Additionally, partial dependence (PDP) graphs are constructed to analyze the relationship between bottom sediment calculations and the most significant factors (
Figure 7). The analysis showed that the average slope gradient (
α) has a strong influence on the volume of bottom sediments (
V): for
α < 7° the volume remains relatively stable (8000–9000 m
3), while for
α > 7° there is a sharp linear increase up to 17,000 m
3, making it a key factor. Average soil loss (
W) exhibits a non-linear relationship, i.e., an increase or decrease in
W does not result in a proportional increase or decrease in
V. The percentage of soil plowing (
Pl) also significantly influences the volume of bottom sediments: at
Pl < 35%, the volume increases slowly, followed by a sharp increase in sediment volume to 12,000 m
3 at
Pl = 40%, with subsequent fluctuations and a peak of about 13,000 m
3 at
Pl = 55%. This indicates a complex multifactorial relationship with several modes of influence. Therefore, the process of formation of bottom sediments is nonlinear and multicomponent, where it is impossible to single out one dominant factor that determines the volume of sediments.
As a result of factor analysis, three main factors were identified that cover the most significant aspects of data variability (
Table 2).
Factor I explains the largest proportion of variance (38.5%) and shows high positive loadings for variables related to the hydrological characteristics of ponds: high positive factor loadings are observed for such indicators as the average depth to the hard bottom (0.92) and the maximum depth of the pond (0.87).
Factor II is associated with the morphometric characteristics of pond catchments. It explains 23.7% of the variance and is characterized by high factor loadings for the average slope of the catchment (0.91), average runoff (0.89), and vertical terrain dissection (0.82). These indicators influence the intensity of water erosion.
Factor III explains 15.6% of the data variance and is distinguished by clearly contrasting loadings for indicators such as forest cover (0.94) and cropland percentage (−0.93). This allows it to be considered a factor reflecting the influence of natural and anthropogenic conditions on bottom sediment formation. Increasing forest cover can reduce soil erosion by grassing slopes and converting surface runoff into subsurface runoff, which is confirmed by a positive correlation with this factor. In total, these three factors explain 77.8% of the total variance, indicating their high information content and significance in describing the original data.
The data obtained allowed us to conclude that the main factors contributing to the accumulation of bottom sediments in the studied ponds are morphometric parameters related to catchment slope gradient, vertical terrain dissection, and average soil loss. Average soil loss is particularly important, as it serves as an integral indicator of water erosion activity and directly influences the volume of accumulated bottom sediments. Unlike catchment slope (gradient) and vertical terrain dissection, which are relatively constant geomorphological characteristics, the intensity of soil loss can be controlled by regulating the structure of the land within the catchment area.
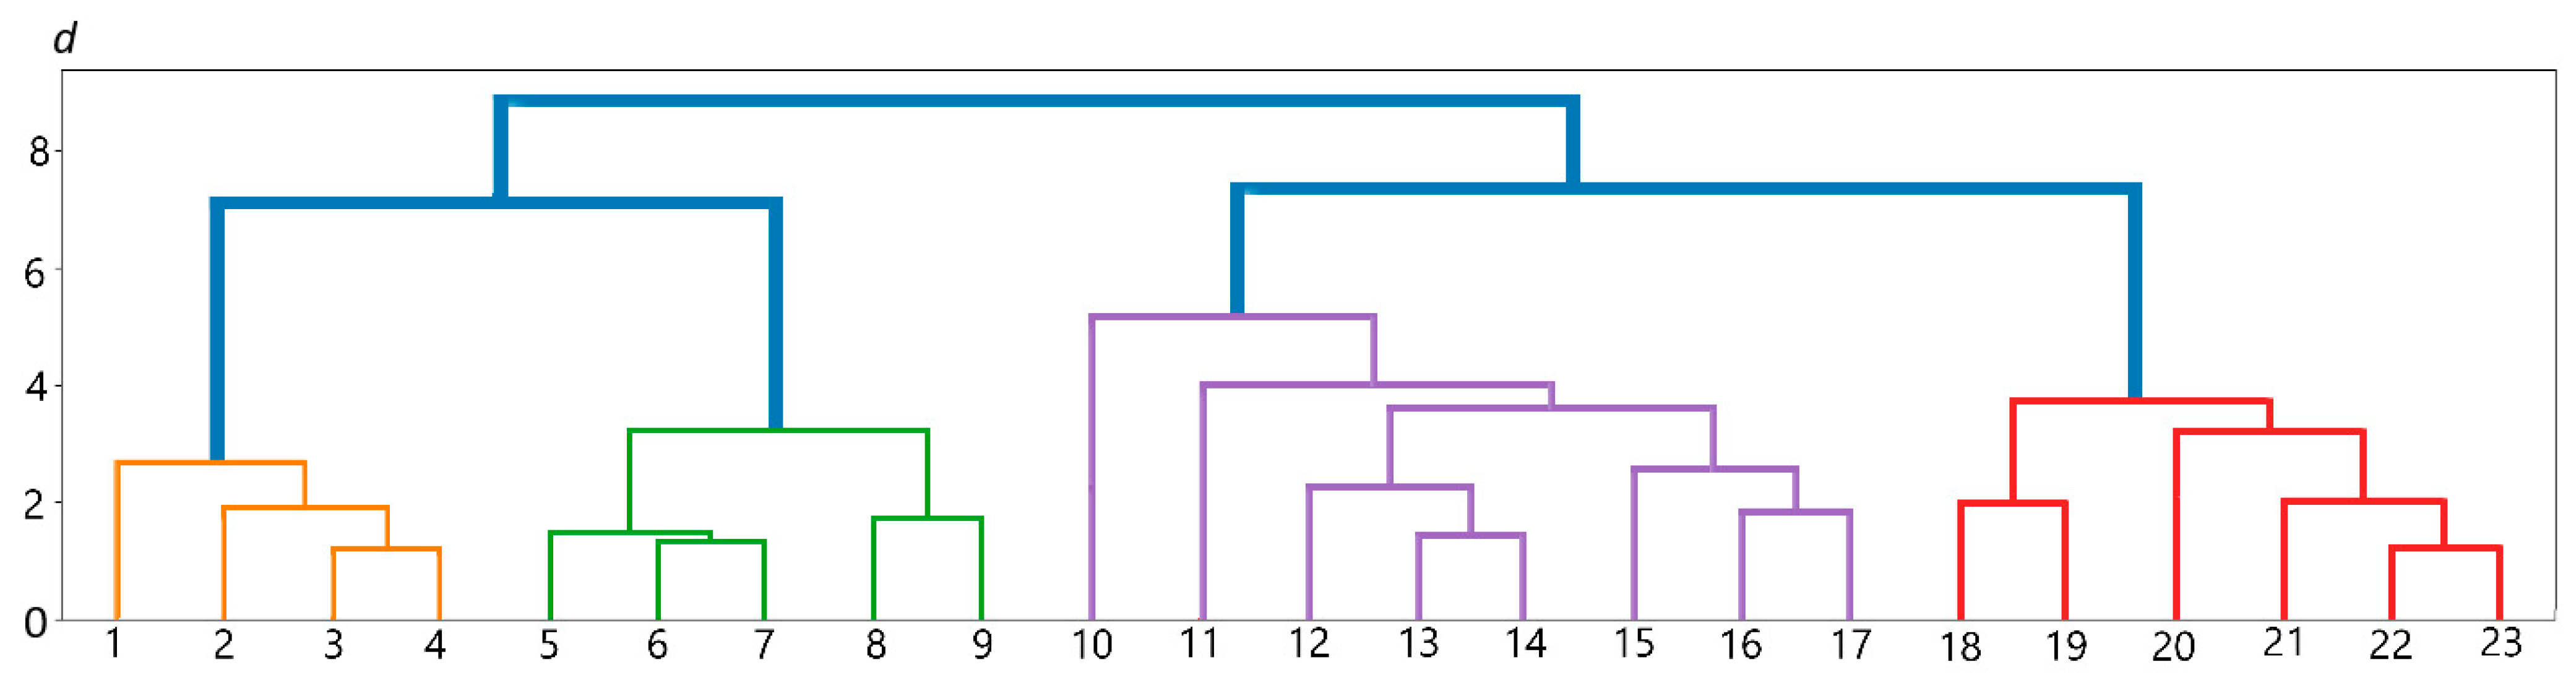
Given the high contribution of each parameter, we propose typifying small artificial water bodies (ponds) using these parameters. This will subsequently allow, even without measuring the sediment thickness in the water body, to propose measures to reduce sediment load based on the determined factors. For this purpose, cluster analysis with a clustering value of
d = 5 was used (
Figure 8).
Type I comprises ponds with the largest volume of bottom sediments (the average value is 10,798 m
3). Characteristic features (
Table 3) of this group include a high level of catchment cultivation (on average 43.5%), a high catchment slope (on average 3.8°), and relatively low forest cover (on average 16.8%), indicating a significant influence of cropland on the formation of surface runoff and the removal of surface sediments.
Type II includes ponds located in catchments with a high proportion of cropland (on average 69.6%) and relatively low slope values (on average 2.3°). Despite the high anthropogenic load, the volume of bottom sediments in this type is slightly less than in the first (on average 10,657.6 m3), which can be explained by the influence of the average slope (gradient) of the catchment. The average soil loss value in this type is 1.9 t/ha, which also indicates the intensity of sediment transport.
Type III is characterized by a high average slope of the pond catchments (on average 5.7°); however, despite this, the average value of the volume of bottom sediments in this group is 9757 m3, which is lower than that of the first two types, which is due to some predominance of forest cover (23.8%) over cropland (21.3%).
Type IV is characterized by the smallest average volume of bottom sediments in the ponds (5215.3 m3) and the lowest average vertical dissection of the relief (24.9 m). The average percentage of cropland in this group is 28.5%, which is lower than in types I and II, but higher than in Type III. However, the key factor reducing the intensity of sediment input is the low average slope of pond catchment area (on average 1.4°). The average soil loss rate in this type is 0.4 t/ha, indicating weak water erosion.
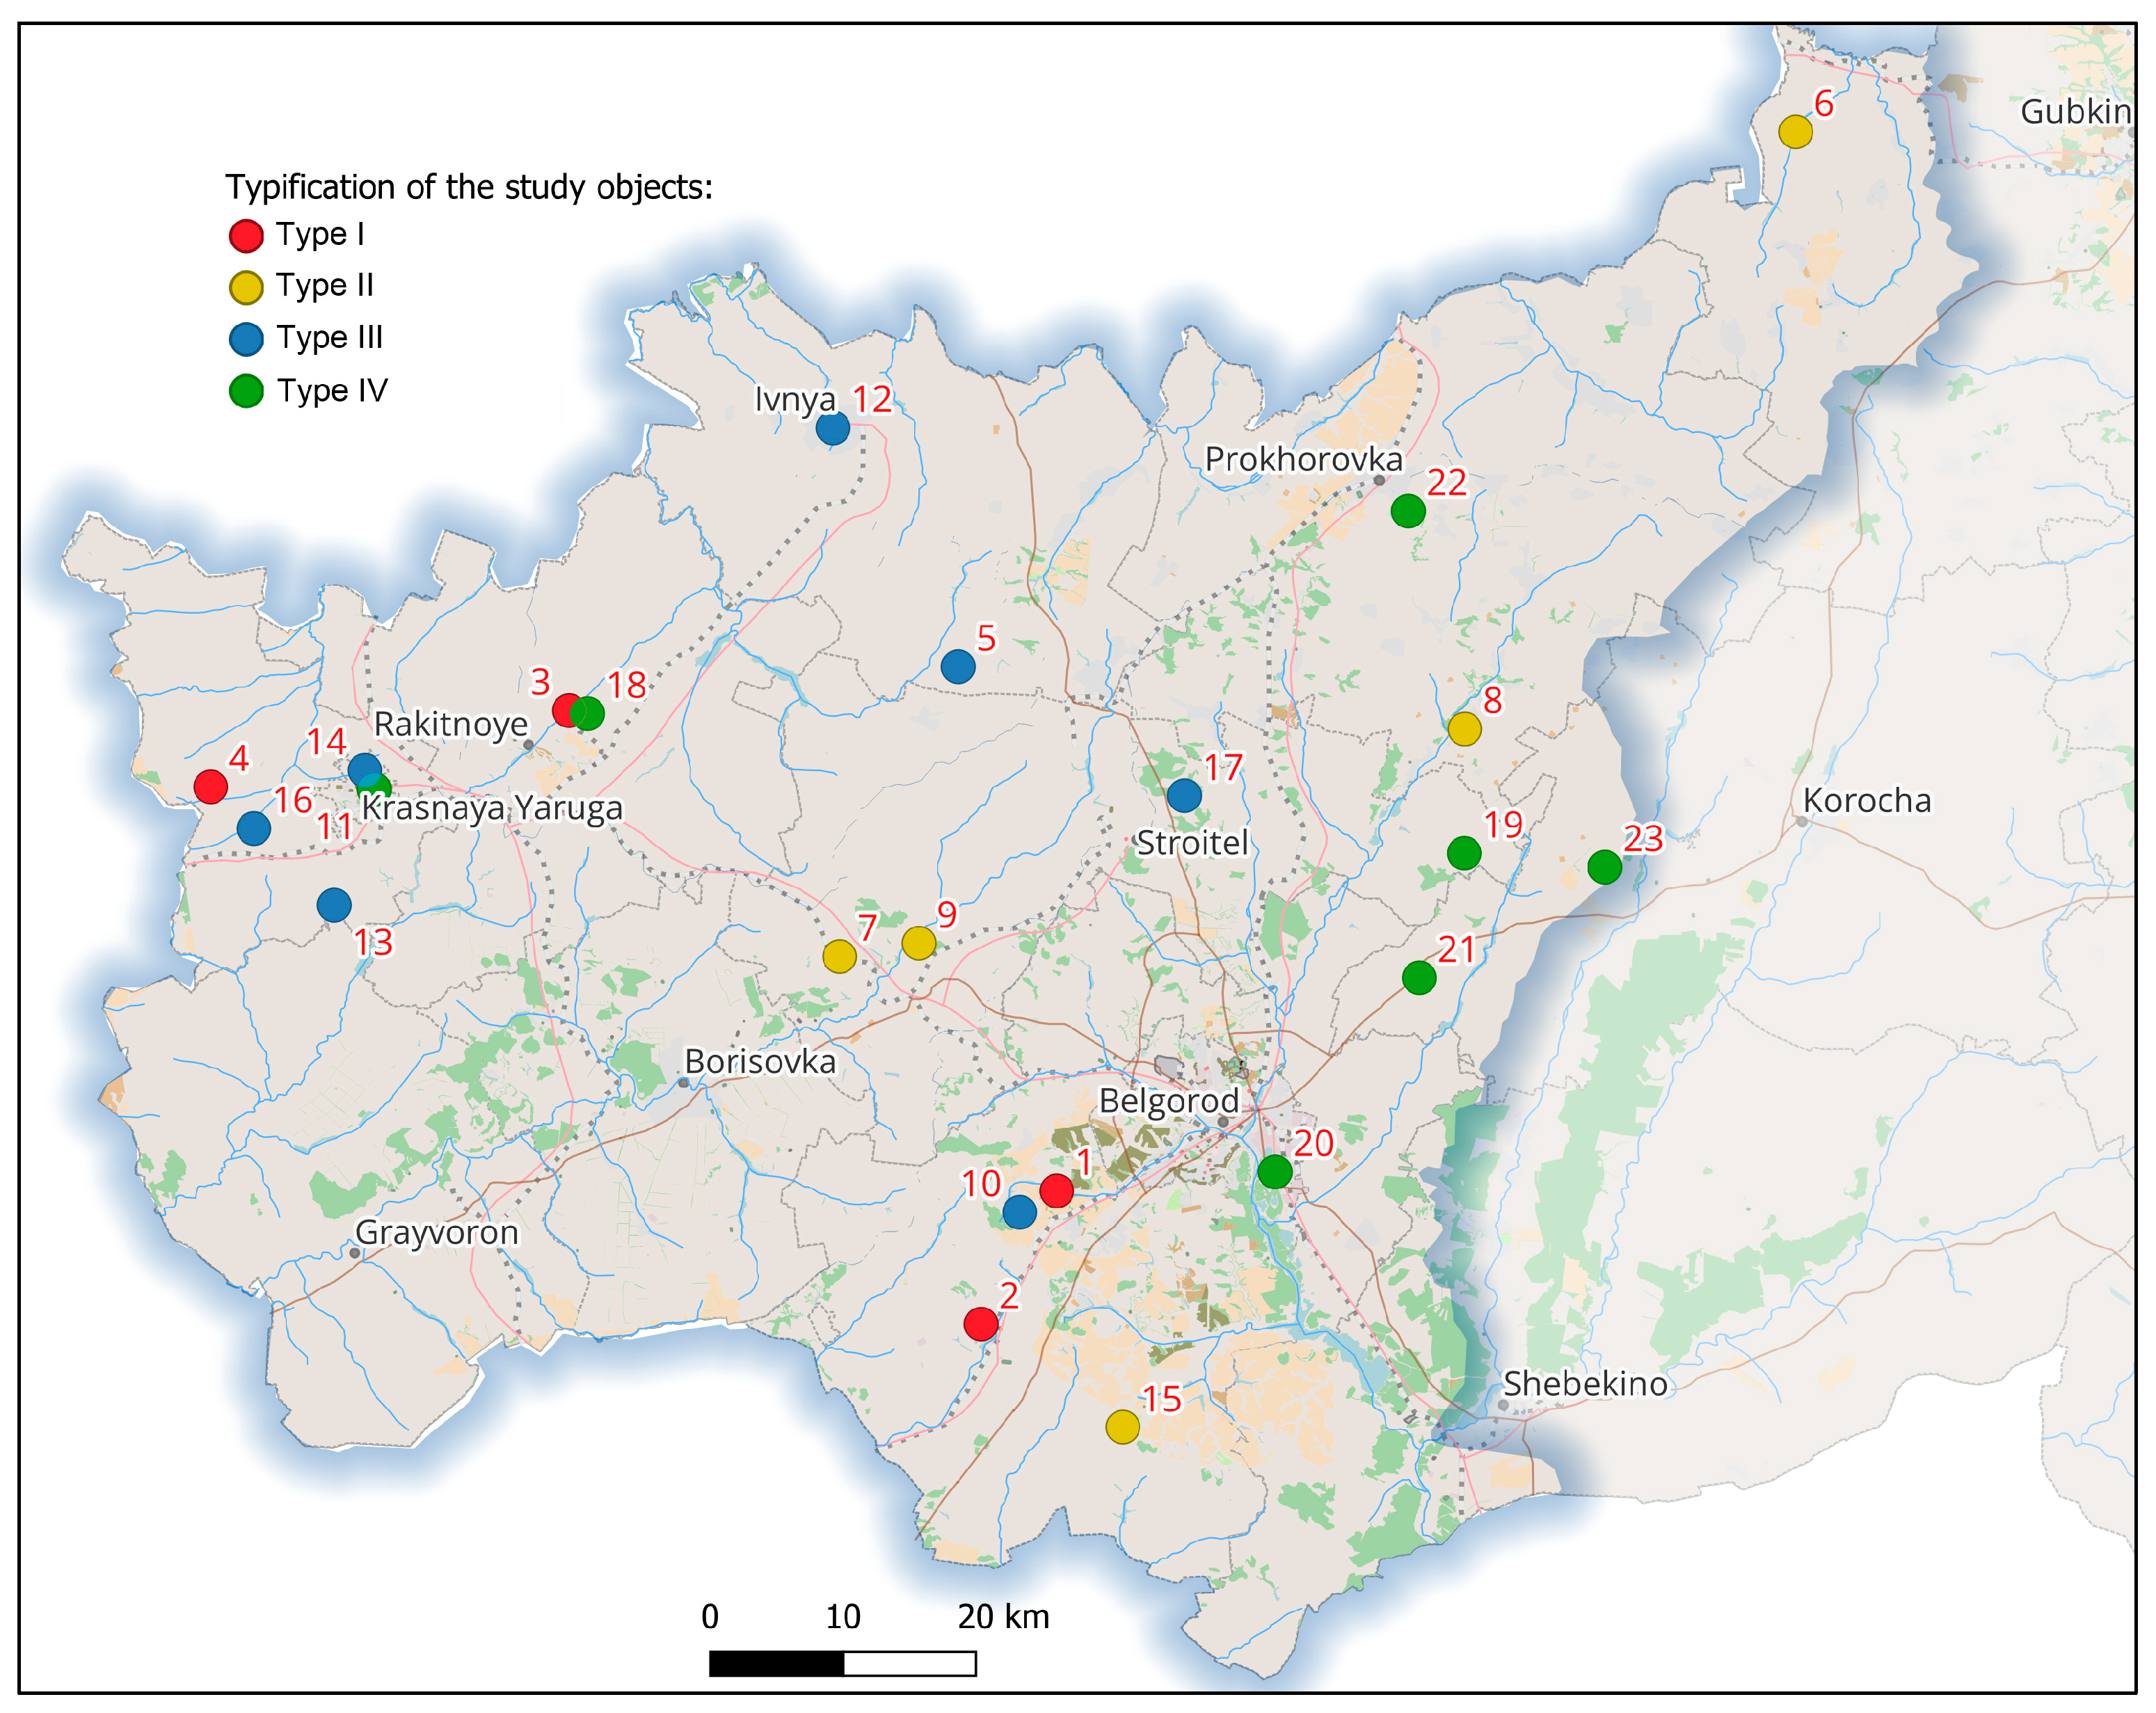
The largest volume of bottom sediments was noted in ponds with high plowing and steep slopes (over 3°) of the catchment, whereas in ponds with more gentle slopes and high forest cover in the catchment, the accumulation of bottom sediments is significantly lower. An analysis of the spatial distribution of ponds belonging to the same type did not reveal any clear patterns in their location, which indicates the complex and ambiguous nature of the relationship between the typology of ponds and their geographical location (
Figure 9).
Individual catchment characteristics play a key role in the typification of ponds and should be considered when developing approaches to their reorganization. Recommendations include a special focus on revising the structure of land within pond catchments, including limiting cropland use and restoring protective forest plantations, which will minimize soil erosion intensity and extend the lifespan of the ponds.
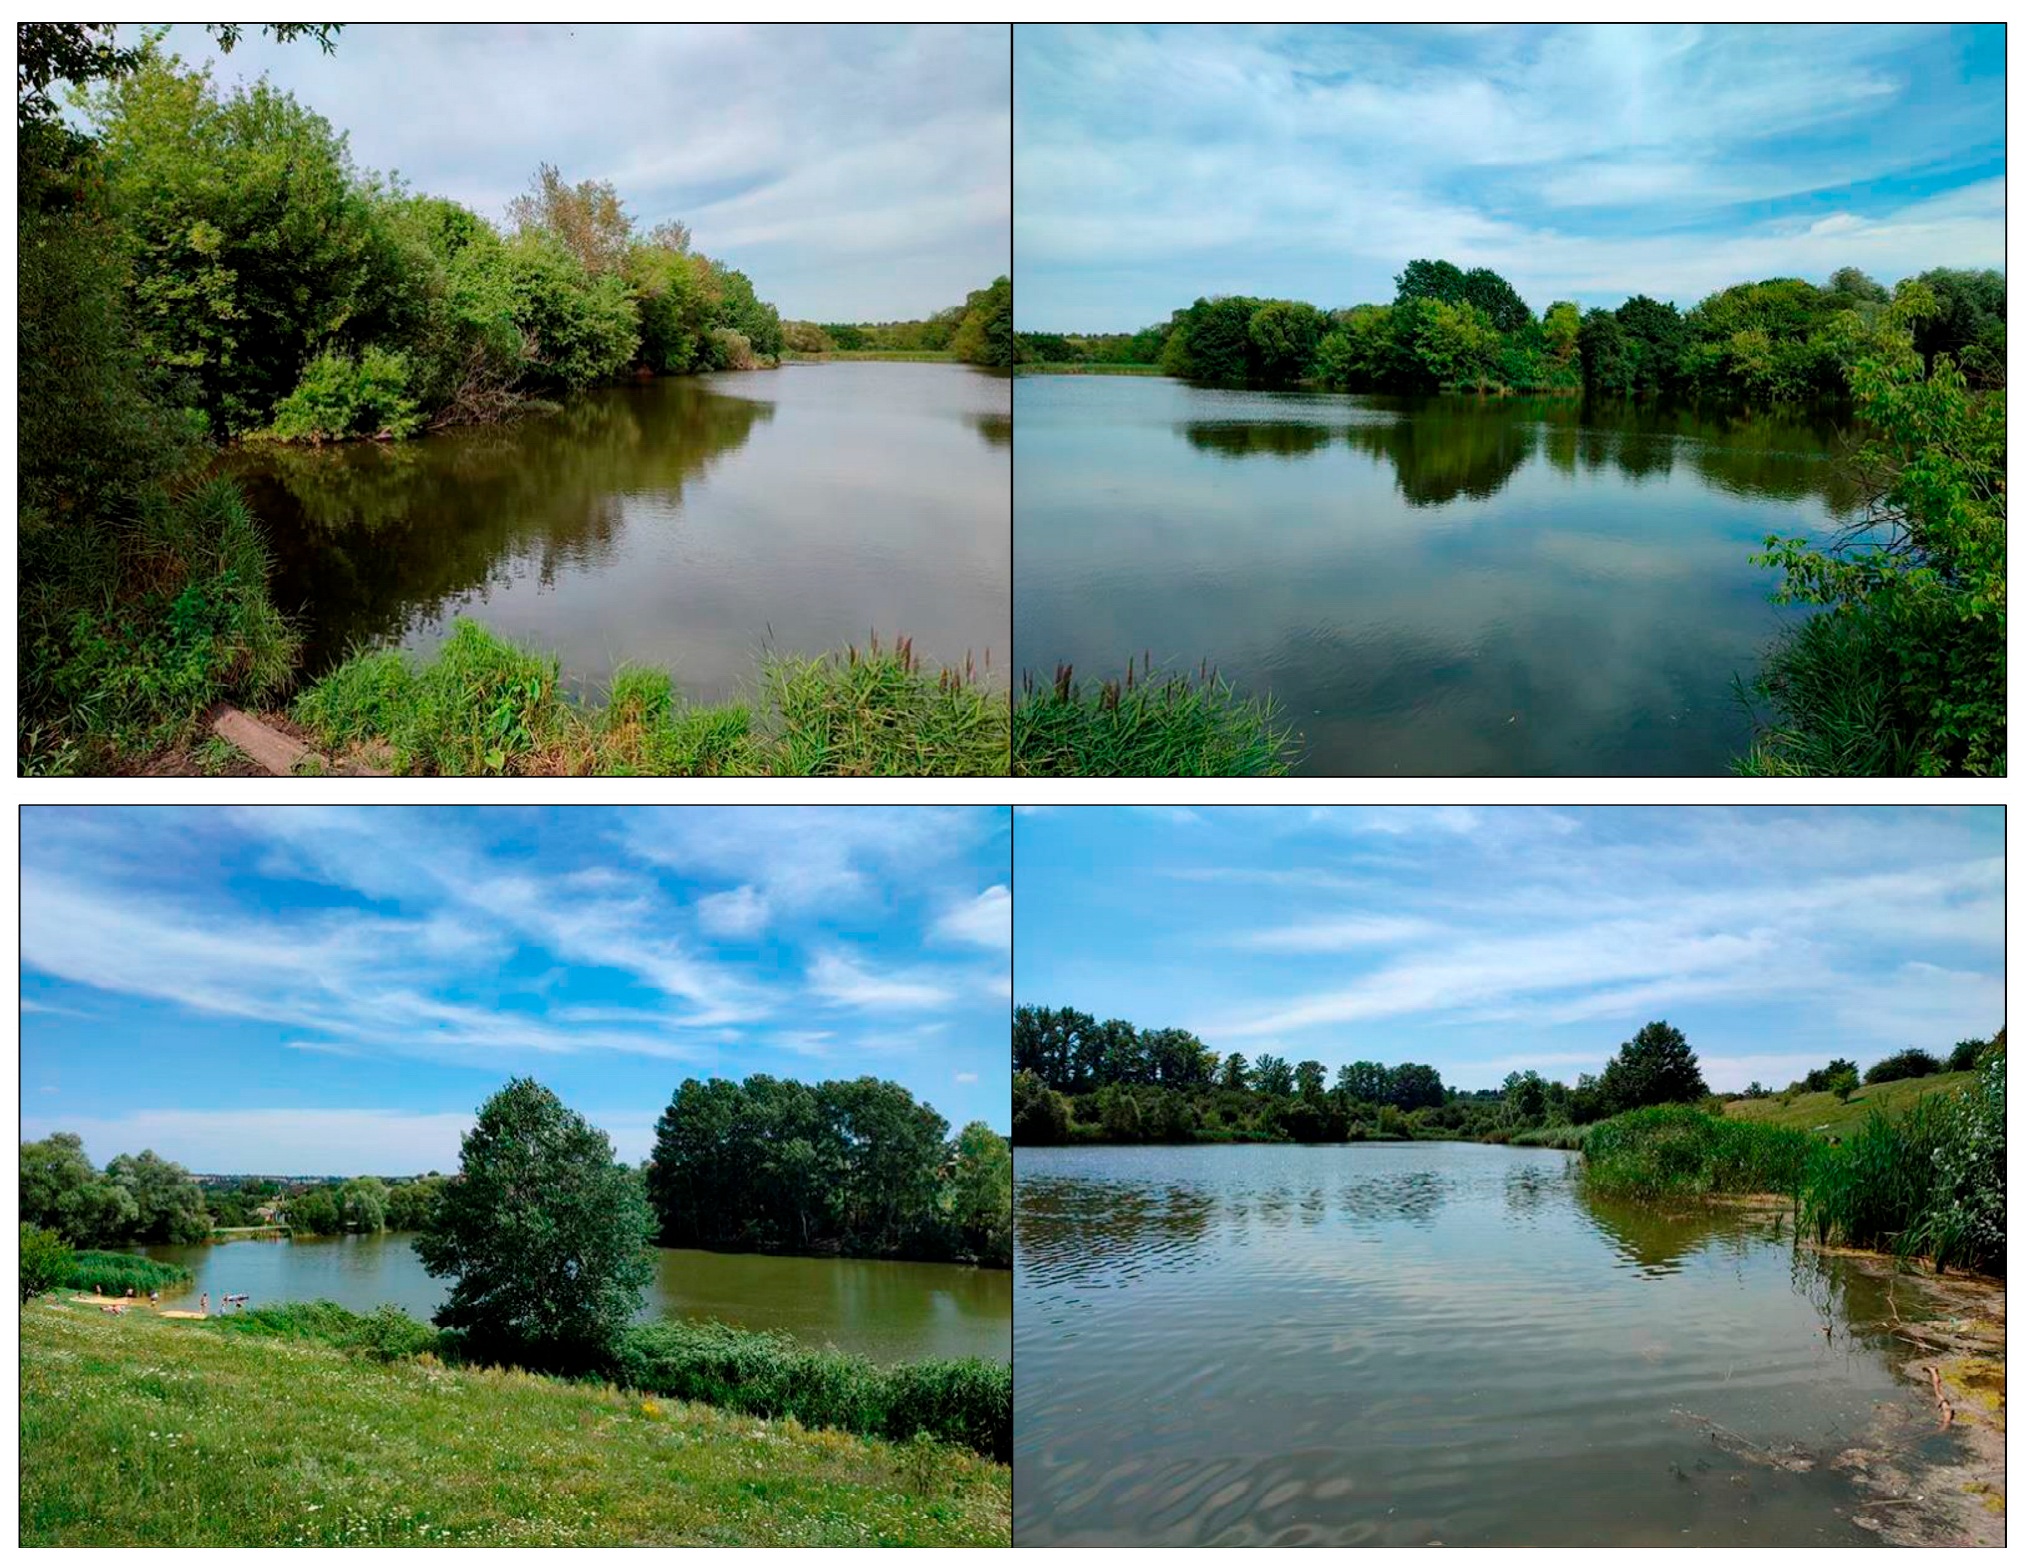
As part of the study, two ponds of different types were selected to validate the chosen calculation methodology. They analyzed sedimentation processes and assessed the impact of hydrological and anthropogenic factors on bottom sediment accumulation. Use periods for these ponds were determined based on mapping data, local resident surveys, and land inventory data in the area. This made it possible to determine the total sedimentation. The first pond, in the village of Krasny Oktyabr’ (
Figure 10), belongs to Type I. It is characterized by high anthropogenic load and the largest volume of bottom sediment, due to intensive soil erosion and steep slopes. The second pond, in the village of Verkhniy Ol’shanets (see
Figure 10), belongs to Type IV, which is characterized by a smaller sediment volume due to the low average slope in the catchment and insignificant soil erosion there. As a result of the study, the following values were obtained (
Table 4).
The adequacy of the chosen calculation method was verified by comparing the calculated volumes of soil washed away during the sediment accumulation period with the results of field measurements. For the studied pond in the village of Krasny Oktyabr’ (Type I), the estimated soil washout volume was 2087–2277 m3 with an actual siltation of 2319 m3, while for the pond in the village of Verkhniy Ol’shanets (Type IV), it was 6224–6743 m3 versus 6825 m3 measured on-site. The deviation of the calculated values from the empirical results did not exceed 10%, which confirms the high accuracy and validity of the proposed theoretical calculations of sediments, and the error may be associated with historical changes in the landscape that are not considered in current models.
Successful verification of sediment calculations based on factors determining bottom sediment accumulation, using specific examples, confirms that the proposed typification allows for predicting the dynamics of siltation in small artificial water bodies. For example, the pond in the village of Krasny Oktyabr’, classified as Type I, accumulates sediment at a rate of 63.6 m3/year. Given the current sediment volume (2319 m3), this indicates a critically short service life of less than 50 years. Meanwhile, the pond in the village of Verkhniy Ol’shanets (Type IV), with an annual sediment influx of 38.7 m3 and an accumulation period of 240–260 years, demonstrates resistance to siltation due to a favorable combination of natural and anthropogenic factors. This demonstrates the possibility of using the proposed classification to assess the resource potential of water bodies: based on the characteristics of the catchment, it is possible to determine the type of pond and predict its operational lifespan. This approach opens up opportunities for targeted management of small water bodies, including the selection of priority areas for restoration and the planning of erosion-control measures in agricultural landscapes.
For the territory of the Central Russian Upland, including the territory of Belgorod Oblast, there are no studies that analyze the influence of land use, morphometric characteristics of the relief, and soil erosion on sedimentation in small artificial water bodies (ponds), as confirmed by field surveys carried out over the entire area of the ponds. Similar studies are more numerous in the rest of Europe. For example, the problem of siltation of small water bodies has been considered in this subcontinent using various model approaches [
69,
70]. The results of solving the inverse issue of factorial assessment of soil erosion rates in catchments based on data on sedimentation rates in reservoirs in various regions of Europe are presented in the work of [
71]. The studies of two catchments in the forest-steppe zone in European Russia are presented in [
67,
68], in which sediment redistribution on slopes and sediment accumulation in ponds were assessed using one column in each, obtained by sampling with a semi-cylindrical hand sampler. The resulting samples were subjected to gamma spectrometric analysis for the content of radioactive
137Cs. These studies revealed that changes in land use and climate conditions lead to changes in sedimentation rates. On average, for the forest-steppe zone with catchment areas of 35.3 km
2 and 140.4 km
2, with 57.5% and 47.2% cropland and average annual soil erosion rates of 6.4 and 5.3 t/ha/year, each of the two studied ponds accumulated bottom sediments at a rate of 18.9 mm/year and 11.8 mm/year, respectively. Our research shows that sedimentation in the pond occurs unevenly, and siltation is significantly influenced by cropland and built-up area, as well as by the morphometric characteristics of the slopes of the catchment area. The work [
72] presents the results of a study of seventeen ponds in the Middle Volga region (eastern European Russia). It is indicated that the average sedimentation rate was 3.8 mm/year. For the ponds we studied in Krasny Oktyabr’ and Verkhniy Ol’shanets, sedimentation was 2.1 mm/year and 1.4 mm/year, respectively (with a catchment area of 0.601 km
2 and 0.893 km
2 and an average annual soil loss of 1.27 and 0.52 t/ha). Given the lower average annual soil loss values than those reported in the aforementioned studies, the data can be considered comparable. Furthermore, in this study, we statistically substantiated the limiting factors of siltation for the first time and typified artificial small water bodies based on them. Our field study of sedimentation volumes and the relationship between them and the characteristics of the catchment and pond for the conditions of western European Russia make our work particularly relevant for this region, as it allows us to adapt an integrated approach to assessing the impact of soil erosion on pond siltation and to increase the reliability of forecasts of their operational life due to still high anthropogenic activity. However, it should also be noted that the climatic conditions (increasing winter air temperatures, decreasing the depth of soil freezing, decreasing snowmelt runoff, etc.) and land-use dynamics that have developed and continue to develop in recent decades in the European part of Russia contribute to a reduction in soil erosion and the associated sediment runoff in regional river basins [
73,
74].
In addition, the proposed research allows us to formulate the following recommendations for sustainable water resources management:
For heavily plowed pond catchments, where it is not possible to reduce cultivated land, it is necessary to introduce soil-protecting crop rotations, saturated with annual and perennial grasses by more than 70%, which will reduce the average annual soil loss from cropland;
To reduce the average soil erosion and increase the forested area, it is necessary to create contour forest belts for erosion-control purposes on at least 2.5% of the cropland area;
To increase the local erosion base and reduce vertical dissection of the relief, it is possible to create cascades of ponds in gullies and small dry valleys, which will reduce sedimentation rates in each of the created artificial water bodies, the creation of silt filters in the upper reaches of gullies and small dry valleys, as well as bulk shaft and ditches along the edges of forest belts.
Based on the identified values of the importance of factors for each proposed type of artificial small water bodies, approaches should be developed that allow timely decisions to be made on the development and implementation of soil protection measures in the catchment area and purification of water bodies depending on the type:
- ▪
For Type I, it is necessary to reduce the volume of bottom sediments by reducing the vertical dissection of the relief, placing its ponds primarily for cleaning from the sediments;
- ▪
For Type II, it is necessary to reduce the area of cropland in pond catchments, including through soil-protecting crop rotations and a reduction in the vertical dissection of the relief, and also move the cleaning of ponds of this type to second place in the queue;
- ▪
For Type III, given the significant average slope of its catchments, careful selection of a soil-protecting crop rotation is necessary. When determining the need for pond cleaning, the cleaning deadline should be calculated (the pond’s service life can be 100 years or more);
- ▪
For Type IV, it is important to determine the pond’s age. A pond should only be included in the list for bottom sediment removal if it is more than 150–200 years old.
5. Conclusions
Ponds play an important landscape-forming role. Their functioning is influenced by various natural and anthropogenic factors, which have varying effects on sedimentation rates. The proposed pond typification system allows for predicting sedimentation rates based on a study of these factors.
A comprehensive assessment of siltation processes in 23 ponds in the western part of Belgorod Oblast revealed a strong relationship between natural and anthropogenic factors that influence the accumulation of bottom sediments. Correlation analysis using the Spearman coefficient showed that the percentage of watershed cultivation has a significant effect (r = 0.55, p < 0.01) on the volume of sediments, while soil loss (r = 0.47, p < 0.05) and vertical dissection of the relief (r = 0.43, p < 0.05) have a moderate effect.
Factor analysis shows that sediment volume is determined by three interrelated groups of factors, which together explain 77.8% of the total variance: (1) hydrological characteristics of ponds (38.5%), represented by average and maximum depth; (2) morphometry of pond catchments (23.7%), characterized by average slope, annual soil loss, and vertical relief dissection; (3) anthropogenic transformation of the catchments (15.6%), determined by contrasting effects of forest cover and the proportion of cropland.
The Random Forest algorithm quantified the relative importance of individual factors, revealing that average pond catchment slope contributes 24.6% to sediment volume variability, cropland share contributes 18.8%, and the average annual soil loss contributes 14.1%. These results confirm that anthropogenic landscape transformation, particularly cropland expansion in “vulnerable” topography, is the dominant factor accelerating sedimentation processes.
Based on the identified patterns, we developed a scientifically based typification of artificial small water bodies (ponds), dividing them into four categories, with practical recommendations for management.
Type I ponds are characterized by the highest sediment volume (on average 10,798 m3) with high plowing of catchment soils (43.5%) and relatively steep catchment slopes (on average 3.8°), and they require priority cleaning; Type II ponds with a high proportion of cropland (69.6%) and relatively gentle slopes (on average 2.3°), accumulating 10,657.6 m3 (on average) of sediment, require cleaning secondarily; Type III ponds have extremely steep catchment slopes (on average 5.7°), but moderate siltation (on average 9757 m3) due to the predominance of forest cover (23.8%) over cropland (21.3%); and Type IV ponds have minimum sediment volumes (on average 5215.3 m3) against the background of relatively low catchment slopes (on average 1.4°) and low water erosion (0.4 t/ha). This typification makes it possible to predict the service life of ponds and plan the priority of measures for their restoration.
The practical implications of this study extend beyond a theoretical understanding of sedimentation processes. Our methodology enables the cost-effective identification of small water bodies in need of immediate rehabilitation within regional conservation programs, eliminating the need for costly initial field surveys. For the regional program “Our Rivers” in Belgorod Oblast, this approach could optimize the annual budget allocation through targeted interventions in the most degraded water bodies.
Globally, as freshwater scarcity increases due to climate change and growing anthropogenic impact on the environment, the conservation of small water bodies is becoming increasingly important for sustainable water use. Our study shows that strategic landscape management at the catchment level (especially the restoration of protective forests in erosion-prone areas, hydraulic structures, and the introduction of soil-conserving agricultural practices) can extend the life of artificial (as well as natural) small water bodies, providing significant economic and environmental benefits.



 ,
,