Article

Kinetic Performance, Leg Stiffness and Gastrocnemius Muscle Activity During Shod and Barefoot Two-Legged Hopping in Elite Female Court Athletes


Sports Biomechanics Laboratory, School of Physical Education and Sports Science, National and Kapodistrian University of Athens, 17237 Daphne, Greece
*
Author to whom correspondence should be addressed.
Biomechanics 2026, 6(3), 60; https://doi.org/10.3390/biomechanics6030060
Submission received: 17 May 2026 / Revised: 13 June 2026 / Accepted: 18 June 2026 / Published: 1 July 2026

Abstract

Background/Objectives: This study investigated kinetic performance, leg stiffness and gastrocnemius muscle (GM) activity during shod and barefoot two-legged hopping in female court athletes, while also assessing potential sport specialization-by-footwear interactions. Methods: Forty-two elite female Volleyball, Basketball, and Handball athletes (n = 14 per group) performed two-legged hopping at 130 bpm under both shod and barefoot conditions. Vertical ground reaction force (Fz) (Kistler forceplate sampling at 1000 Hz) was recorded in synchronization with GM vibromyographic intensity (TSD250, Biopac Systems, sampling at 2000 Hz). Kinetic metrics, kleg and GM activation were analyzed via repeated-measures ANOVA (alpha = 0.05, PSS 30.0). For all metrics, results indicated no significant sport-by-footwear interaction (p > 0.05). Results: Footwear significantly altered hopping kinematics; while absolute contact durations remained constant, relative total and effective contact durations were elongated and shortened, respectively. In the shod condition, kleg increased (+6.1%, p < 0.05) alongside a reduction in GM activation (−7.7%, p < 0.05). Additionally, Fz peak increased (+4.3%, p < 0.05) and occurred relatively earlier in the contact phase (−0.7%, p < 0.05). Conclusions: These findings indicate that footwear acts as a mechanical buffer, enabling a stiffer leg spring and reduced neuromuscular demand. The earlier timing of Fz peak suggests a facilitated eccentric-to-concentric transition, most likely allowing athletes to maintain efficient energy return despite the compliance of the footwear interface.

1. Introduction

Human locomotion mechanics are frequently characterized using a linear spring–mass model, wherein the lower limb functions as a singular compression spring supporting the body’s center of mass [1,2]. Within this theoretical framework, two-legged hopping in place has emerged as the gold-standard protocol for estimating leg stiffness (kleg). Its repeatable, cyclic nature offers a controlled environment to study the “spring-recoil” mechanics that underpin complex dynamic activities, such as running and jumping [3,4]. During the landing phase, synchronized flexion at the ankle, knee, and hip joints facilitates energy absorption—analogous to spring compression—while the subsequent limb extension phase generates the take-off impulse through the release of stored elastic energy [5].
The human neuromuscular system demonstrates remarkable adaptability when interacting with varying environmental constraints. According to the series-spring model, the total stiffness of the system (ktotal) is a composite of kleg and surface stiffness (ksurface) [Equation (1)]. Research by Ferris and Farley [6] and Farley and coworkers [7] established that humans maintain remarkably stable support mechanics (specifically center of mass vertical displacement and ground contact time) across a 1000-fold change in ksurface by inversely modulating kleg. This “stiffness tuning” mechanism optimizes movement efficiency and shields biological structures from excessive loading on high-impedance surfaces, while simultaneously preventing energy dissipation on compliant ones [8].
1 k t o t a l = 1 k l e g + 1 k s u r f a c e + 1 k f o o t w e a r
Athletic footwear introduces a critical third variable into the total stiffness series: the footwear stiffness (kfootwear). Modern sport shoes modify lever mechanics and provide structural rigidity through midfoot shanks and specialized foams, offering potential mechanical advantages over barefoot conditions [9]. Established literature indicates that the neuromuscular system modulates its internal effort based on the degree of external mechanical rigidity [10]. In the absence of this external support, the system must “brace” the joints via increased activation of the muscle–tendon complex to compensate for the lost mechanical rigidity [11]. Paradoxically, studies suggest that wearing highly cushioned footwear may lead to a compensatory increase in kleg as the body attempts to counteract the added compliance of the midsole to maintain a stable ktotal [3]. This interaction between interface properties and the musculoskeletal system aligns with the foundational work of Nigg and Segesser [12], who demonstrated that playing surfaces and footwear characteristics directly influence the mechanical loading and injury risk of the locomotor system. Further supporting this, from an evolutionary and anthropological perspective, differences between barefoot and shod locomotion have also been widely studied. Lieberman and colleagues [13] demonstrated that barefoot and shod running differ fundamentally in foot strike patterns and impact forces, indicating that footwear alters the mechanics of foot–ground interaction and neuromotor control strategies. While footwear standardization is conventional in biomechanical research, evidence suggests that landing mechanics remain consistent even when athletes use their own sport-specific footwear [14]. Furthermore, these footwear effects on stiffness appear most pronounced when hopping frequency is externally constrained, rather than self-selected [15].
Central to the control of these stiffness strategies is the gastrocnemius (GM) muscle, which functions as the primary mediator between internal effort and external interface compliance. As the primary modulator of hopping activity, the GM activation initiates neural activation 85–100 ms prior to ground contact (pre-activation) to mechanically prepare the Achilles tendon for eccentric loading [16]. While the soleus and vastus lateralis contribute via reflexive pathways, the feed-forward activation of the GM is essential for governing the transition from energy dampening to propulsion, thereby regulating the body’s interaction with the ground [5]. To complement this feed-forward command, impact damping is also heavily dependent on passive biological structures—such as joint ligaments and the plantar fascia—which act as mechanical energy absorbers [17]. Concurrently, this acute stiffness regulation involves spinal feedback pathways, where stretch reflex loops (such as the H-reflex) modulate short-latency motor responses to optimize muscle–tendon impedance upon ground contact [18].
This neuromuscular regulation is manifested through alterations in ground contact time (tcontact), which represents the active period of the spring–mass system, during which energy absorption and propulsion occur [1,2,5]. A stiffer neuromuscular strategy is characterized by shorter tcontact, reflecting a leg spring that resists deformation and facilitates efficient elastic energy return [6,7]. Conversely, a more compliant system results in prolonged tcontact, allowing for greater center-of-mass displacement [6,7]. Consequently, by quantifying GM activity specifically during the tcontact window, we gain direct insight into how the human leg-spring system acutely adapts its mechanical impedance to the footwear–surface interface. For court athletes (e.g., Basketball, Volleyball, and Handball players), leg stiffness is a functional adaptation to specific sport demands, providing a stable base for explosive movements and interacting with high-friction surfaces [19,20]. The GM acts as a dynamic stabilizer, for both energy return and impact attenuation (during maneuvers such as cutting and landing), to facilitate the use of legs as “stabilizing springs” capable of rapid stiffness shifts across multiple planes [21,22]. On high-stiffness court surfaces (e.g., hardwood or acrylic), athletes utilize ‘pre-tensing’ strategies—primarily through feed-forward GM activation of the gastrocnemius—to manage high-impact forces and ensure joint stability [23]. Transitioning to barefoot conditions removes the impact-attenuating benefits of footwear foams, necessitating significant increases in ankle joint stiffness to maintain the foot as a rigid lever [24]. This adaptation is characterized by a greater reliance on the gastrocnemius–soleus complex to stabilize the arch and facilitate efficient energy transfer during the contact phase [22].
Crucially, the biomechanical strategies employed by female athletes warrant independent investigation due to their specific susceptibility to lower-limb pathology. While males and females often share preferred hopping frequencies, female athletes generally exhibit lower kleg and reduced passive ankle joint stiffness [25,26]. This diminished baseline stiffness, when coupled with divergent compensatory mechanisms—such as increased reliance on knee and ankle “bracing”—is theorized to contribute to the disproportionately high incidence of non-contact anterior cruciate ligament injuries in female court populations [27,28]. Given that footwear acts as an external mechanical modifier of this stiffness, identifying how specialized court shoes influence these precarious neuromuscular control strategies is not merely a matter of performance optimization, but a critical imperative for clinical safety and injury mitigation.
Beyond these sex-specific clinical considerations, this study also addresses the influence of sport specialization. Volleyball, Basketball, and Handball all demand high-frequency, explosive jump-landing activities [29], yet the prevailing mechanical demands differ by discipline: Volleyball primarily necessitates two-legged landings, Basketball utilizes a hybrid of one- and two-legged strategies, and Handball is predominantly characterized by one-legged maneuvers [21,30,31]. Despite these distinct task profiles, preliminary evidence from submaximal hopping tasks suggests that kinetic performance and leg stiffness do not significantly differ between these disciplines [32].
This suggests the existence of a “convergence” phenomenon. As established by Butler et al. [19], a “U-shaped” relationship exists between extremity stiffness and injury risk; competitive athletes appear to converge on a similar stiffness range to optimize movement efficiency while shielding biological structures from excessive loading—avoiding both the bony injuries associated with excessive stiffness and the soft-tissue strains linked to insufficient stiffness [8,19,20]. However, while it is hypothesized that athletes across court specializations utilize this “stiffness tuning” to maintain constant system stability as interface compliance changes [6,8], this strategy has yet to be empirically verified in high-performance female cohorts.
Despite the established literature on spring–mass mechanics, there remains a gap in understanding how footwear modulates the interplay between neuromuscular strategy and mechanical stiffness in female court athletes—a group at elevated risk for lower-limb injury. Therefore, the purpose of this study was to compare kinetic performance, kleg and GM effort during frequency-constrained shod and barefoot two-legged hopping in female Volleyball, Basketball, and Handball athletes. Additionally, this study sought to verify stiffness convergence among the three groups of court players, despite their specialized mechanical demands. The study tested the following hypotheses (H).
H1. 
Sport Specialization will not interact significantly with footwear. This is grounded in the concept of optimal total stiffness convergence among court athletes, driven by the need for movement efficiency and structural protection [6,8,19].
H2. 
Participants will exhibit significantly altered kinetic performance metrics and higher kleg in shod versus barefoot condition. This is based on “stiffness tuning” [3], where the neuromuscular system compensates for footwear compliance through feed-forward stiffness regulation to maintain system stability. Consequently, shorter total and effective ground contact times are expected.
H3. 
Gastrocnemius activation will be significantly lower in the shod compared to the barefoot condition. This is based on the premise that footwear provides passive mechanical rigidity and impact attenuation; thus, the neuromuscular system requires less feed-forward activation to support landing forces [11,23].

2. Materials and Methods

2.1. Participants

A total of forty-two elite female athletes—comprising Volleyball (n = 14; 25.3 ± 3.1 years), Basketball (n = 14; 27.7 ± 6.3 years), and Handball (n = 14; 21.2 ± 3.7 years) players—participated in the study. Descriptive data regarding training experience and frequency are summarized in Table 1. They all reported no lower-limb injuries in the past 12 months. The research protocol was approved by the School Bioethics Committee and adhered to the Declaration of Helsinki. Exclusion criteria included any current or recent musculoskeletal injury, joint pathology, or concomitant medical condition limiting the performance of repeated two-legged hops. Prior to data collection, all participants provided written informed consent.

2.2. Body Dimensions—Foot Arch Type Screening

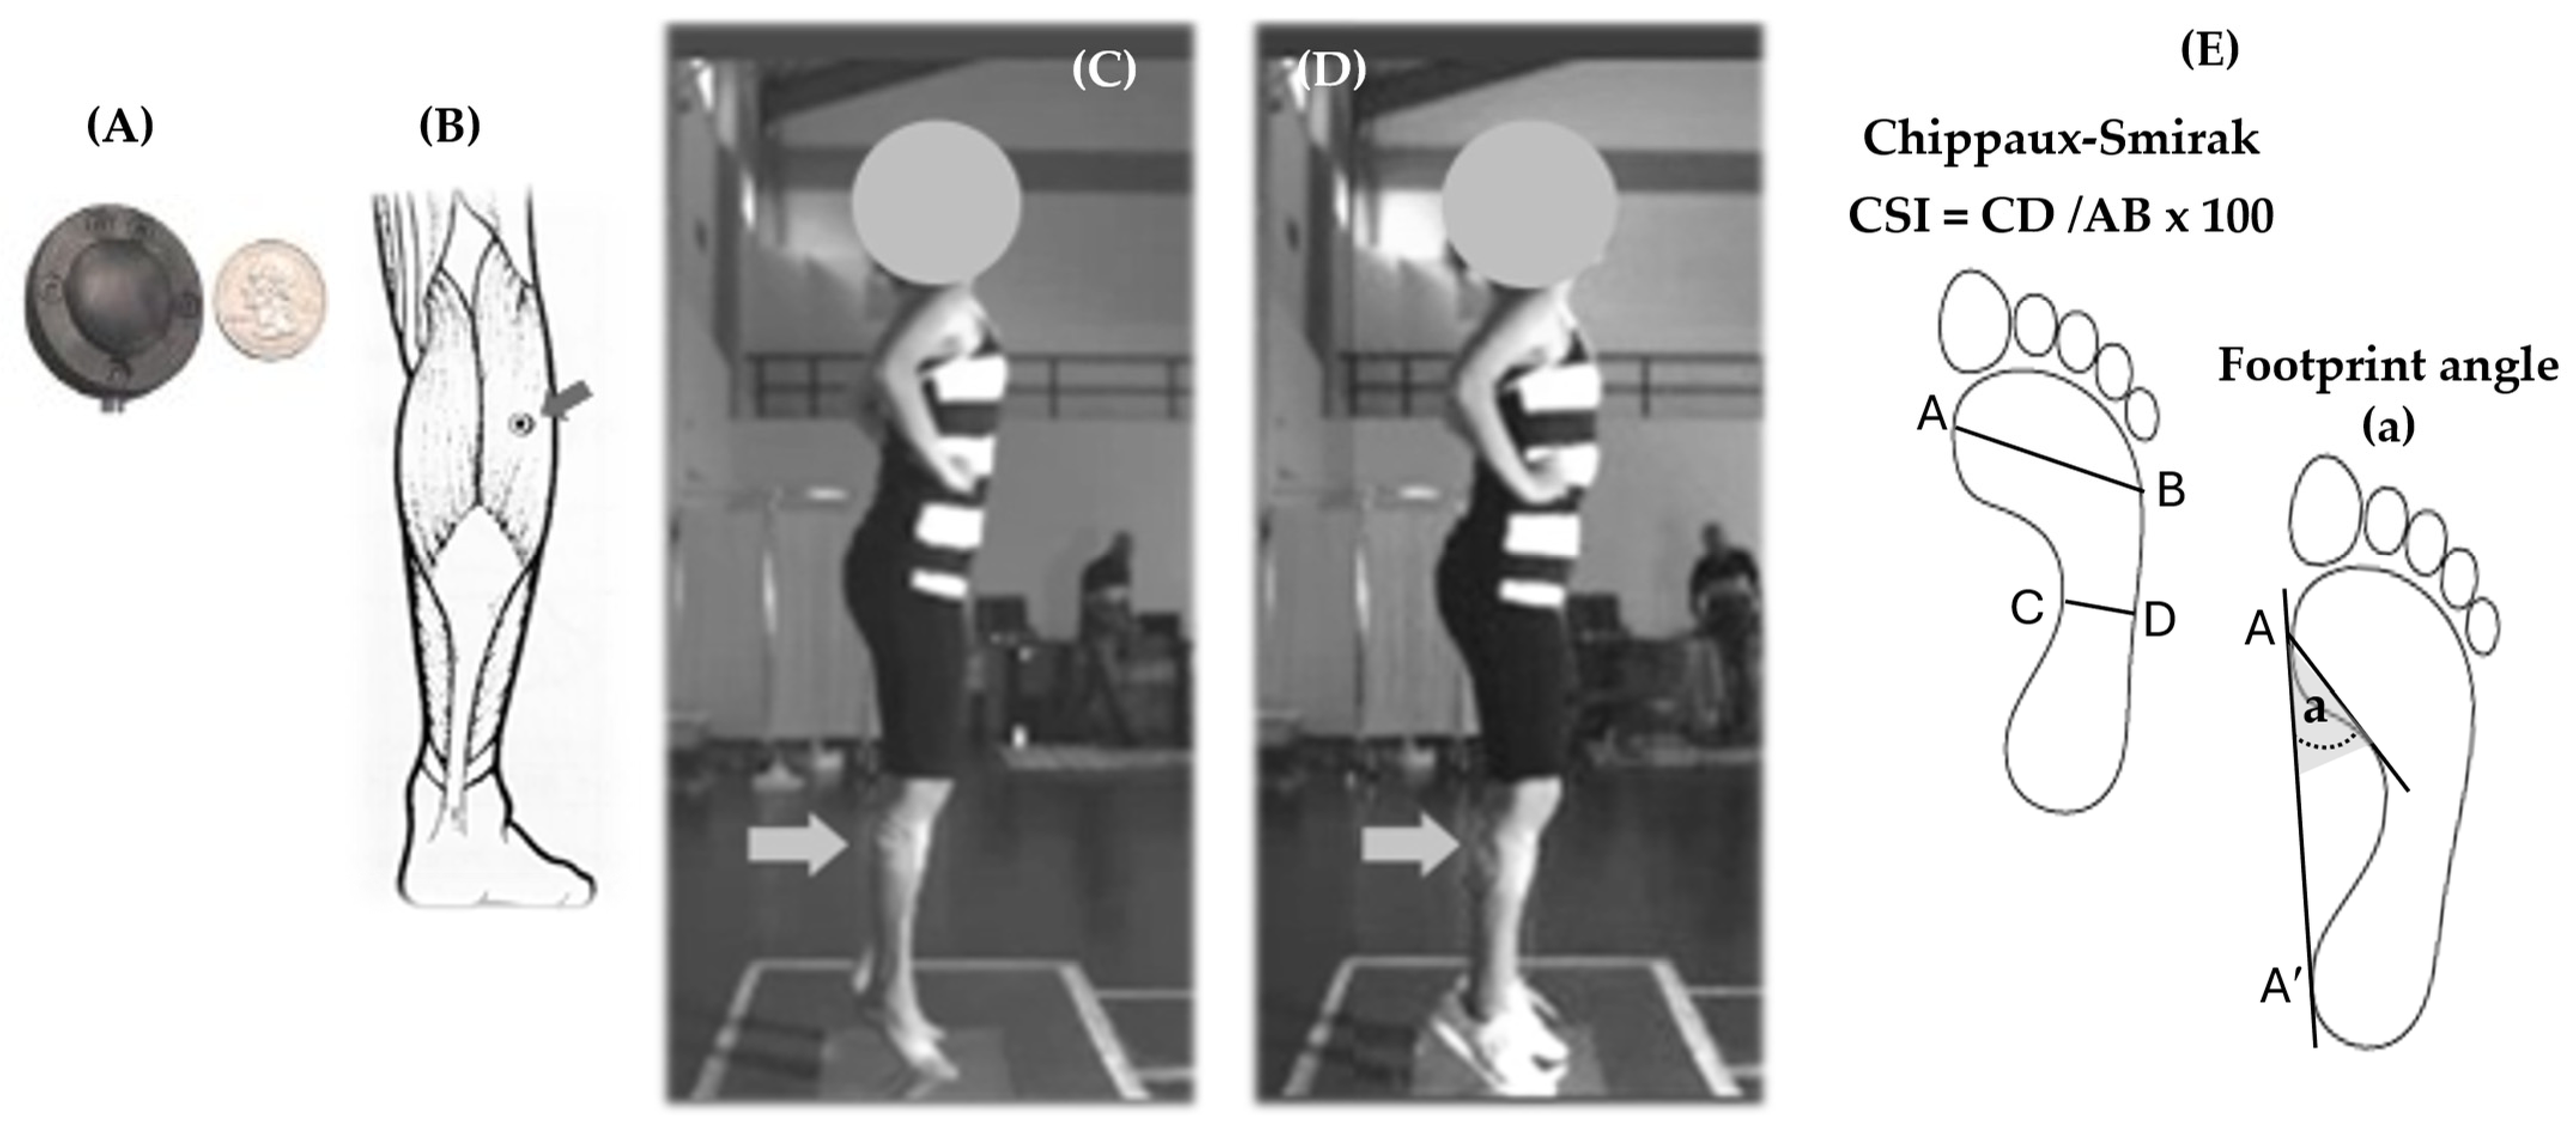
Participants were screened for body dimensions (body mass, body height, lower-limb segmental lengths) (Table 1). To control for foot arch morphology as a potential confounding factor influencing leg stiffness outcomes, foot arch type [17] was quantified using the Chippaux-Smirak Index (CSI) and the Footprint Angle (FPA, in °) [33] (Figure 1). Specifically, the CSI was calculated as the ratio between the minimum width of the midfoot arch (C) to the maximum width of the forefoot (AB), expressed as a percentage: CSI = (C/AB) × 100) (Figure 1). The FPA was defined as the angle formed between the medial tangential line (AA′) and the line connecting the most medial point of the metatarsal head (A) to the most medial point of the midfoot (d) (Figure 1). Foot arch indices (Table 1) were classified according to established criteria: CSI (%): high arch, (0%), normal (0.1–29.9%), middle (30–39.9%), low (40–44.9%), and flat (≥45%); FPA (°): flat (0–29.9°), low (30–34.9°), middle (35–41°), and normal (≥42°). All participants were categorized within the middle foot arch classification, according to the CSI, and in the normal category, according to the FPA (Table 1).

2.3. Lower-Limb Muscle Power

To mitigate explosive lower-limb power as a confounding factor, participants performed a standardized countermovement jump (CMJ) with hands fixed on the hips to eliminate arm-swing momentum. The CMJ represents a gold-standard assessment for evaluating muscular capacity during the stretch-shortening cycle [34] and theoretically shares identical neuromuscular “spring” foundations with bilateral hopping vertical stiffness [35]. Jump height (cm), computed from tflight [Equation (2)], aimed to verify equivalence in baseline neuromuscular status across groups. The application of the CMJ is grounded in its high reliability and validity for assessing the “spring-like” mechanical potential of the lower limbs, which is significantly correlated with the vertical leg stiffness observed during repetitive hopping tasks.
J u m p H e i g h t = 1 2 g t 2
where t = ½ tflight.

2.4. Experimental Procedures

All participants underwent a familiarization protocol and completed the assessments in a single laboratory session. The protocol initiated with a standardized 5 min warm-up (consisting of jogging, targeted dynamic stretching for the lower limb musculature, and short-duration bilateral hopping bouts). Subsequently, participants practiced the experimental task under investigator supervision. During this familiarization period, the investigator provided real-time corrective feedback to ensure procedural fidelity. Familiarization trials (barefoot and shod, synchronized to metronome cueing) were performed directly on the force plate to acclimate participants to the 40 × 60 cm landing area. This period was followed by a 2 min recovery interval prior to data acquisition.

2.5. Double-Legged Hopping Task

Data collection involved two 30 s trials of consecutive bilateral hopping performed in the center of a 40 × 60 cm force plate during which the vertical (Fz) ground reaction force (GRF) was recorded (Kistler, 9286AA, Winterthur, Switzerland, sampling at 1000 Hz, Kistler Measurement, Analysis and Reporting Software v.5.5.1.0.) under two conditions: barefoot and shod (Figure 1). To enhance ecological validity, participants utilized their own standard sport shoes. This approach was grounded on the premise that the global effect of shod conditions would supersede minor inter-brand differences in foam density or tread geometry [14].
Hopping trials were synchronized to an auditory metronome set at 130 bpm (Tempo Perfect Metronome v.2.02a, available at Google Play, https://play.google.com/store/apps/details?id=com.nchsoftware.tempoperfect, assessed from the 21 October till the 30 November 2022). Consistent with prior research, the 130 bpm metronomic tempo corresponds to 2.17 Hz, which aligns with or slightly exceeds the average preferred hopping frequency reported for females [25,28,36,37], thereby promoting linear spring–mass behavior and ensuring a sinusoidal force–time signal [1,2].
During execution, hands were positioned at the waist, feet maintained at a preferred width, and gaze directed forward. Since contact-time instructions can influence stiffness regulation [26], participants were instructed to hop naturally—minimizing secondary movements in joints other than the ankle—and to land in a consistent ankle position relative to take-off. Before the initiation of data collection, participants were exposed to the metronomic signal to facilitate auditory–motor entrainment and ensure stable motor synchronization [38], which for a steady clear sound as the metronomic one is expected to occur within the first 1–3 s of listening, that is, the first 2–10 beats.
If a participant failed to maintain technical standards—such as landing outside the prescribed area—the trial was disregarded and repeated after a 2 min rest (this occurred in only 5 of 112 total trials). Previous barefoot study indicated that 10 hops (after excluding the five ones) allow the calculation of valid leg stiffness and hopping performance metrics which were also confirmed in the shod trials of the present study. Trial validity was confirmed via visual inspection of the vertical ground reaction force series, ensuring standard hopping cycle patterns, and if Fz depicted a single peak, indicative of spring-like hopping [1,2,39], the trial was considered valid. To ensure the same feet placement in the subsequent trial, the foot placement contour (Figure 1E) was marked on the force plate surface for spatial consistency across conditions.

2.6. Hopping Performance Metrics

Kinetic performance metrics (Figure 2) included the peak value of Fz (Fz peak) expressed in multiples of body weight BW, and the durations (all expressed in s) of the hopping cycle (tcycle), contact phase (tcontact), and flight phase (tflight). Effective duty cycle (T/2) was calculated as the contact duration relative to the total hopping cycle duration and was expressed as a percentage of tcycle (%tcycle) (Figure 2). Additionally, the time intervals pre- and post-duty cycle were quantified and expressed as a percentage of tcycle, to examine force development prior to reaching BW thresholds. Finally, hopping height was estimated from flight time [Equation (3)]. For each metric, the value was calculated for every hop across the corresponding segment, with the mean per trial computed prior to grand averaging across both trials for statistical analysis.
H o p p i n g H e i g h t = 1 2 g t 2
where g = 9.81 m/s2 and t = ½ tflight.

2.7. Leg Stiffness

Leg stiffness was computed using the resonant frequency method, assuming a simple spring–mass system, modeling the lower limb as a simple spring–mass system [37]. In this method, leg compression is estimated as half of the spring’s oscillation. The resonant period (T) was derived from the interval representing one-half of the oscillation (T/2), that is, the duration in which the net-GRF (Fi—mg) is positive (Figure 2). Subsequently, kleg was computed [Equation (4)] and expressed in kN/m.
k = m × ω 2
where m = mass and ω = 2π/Τ.
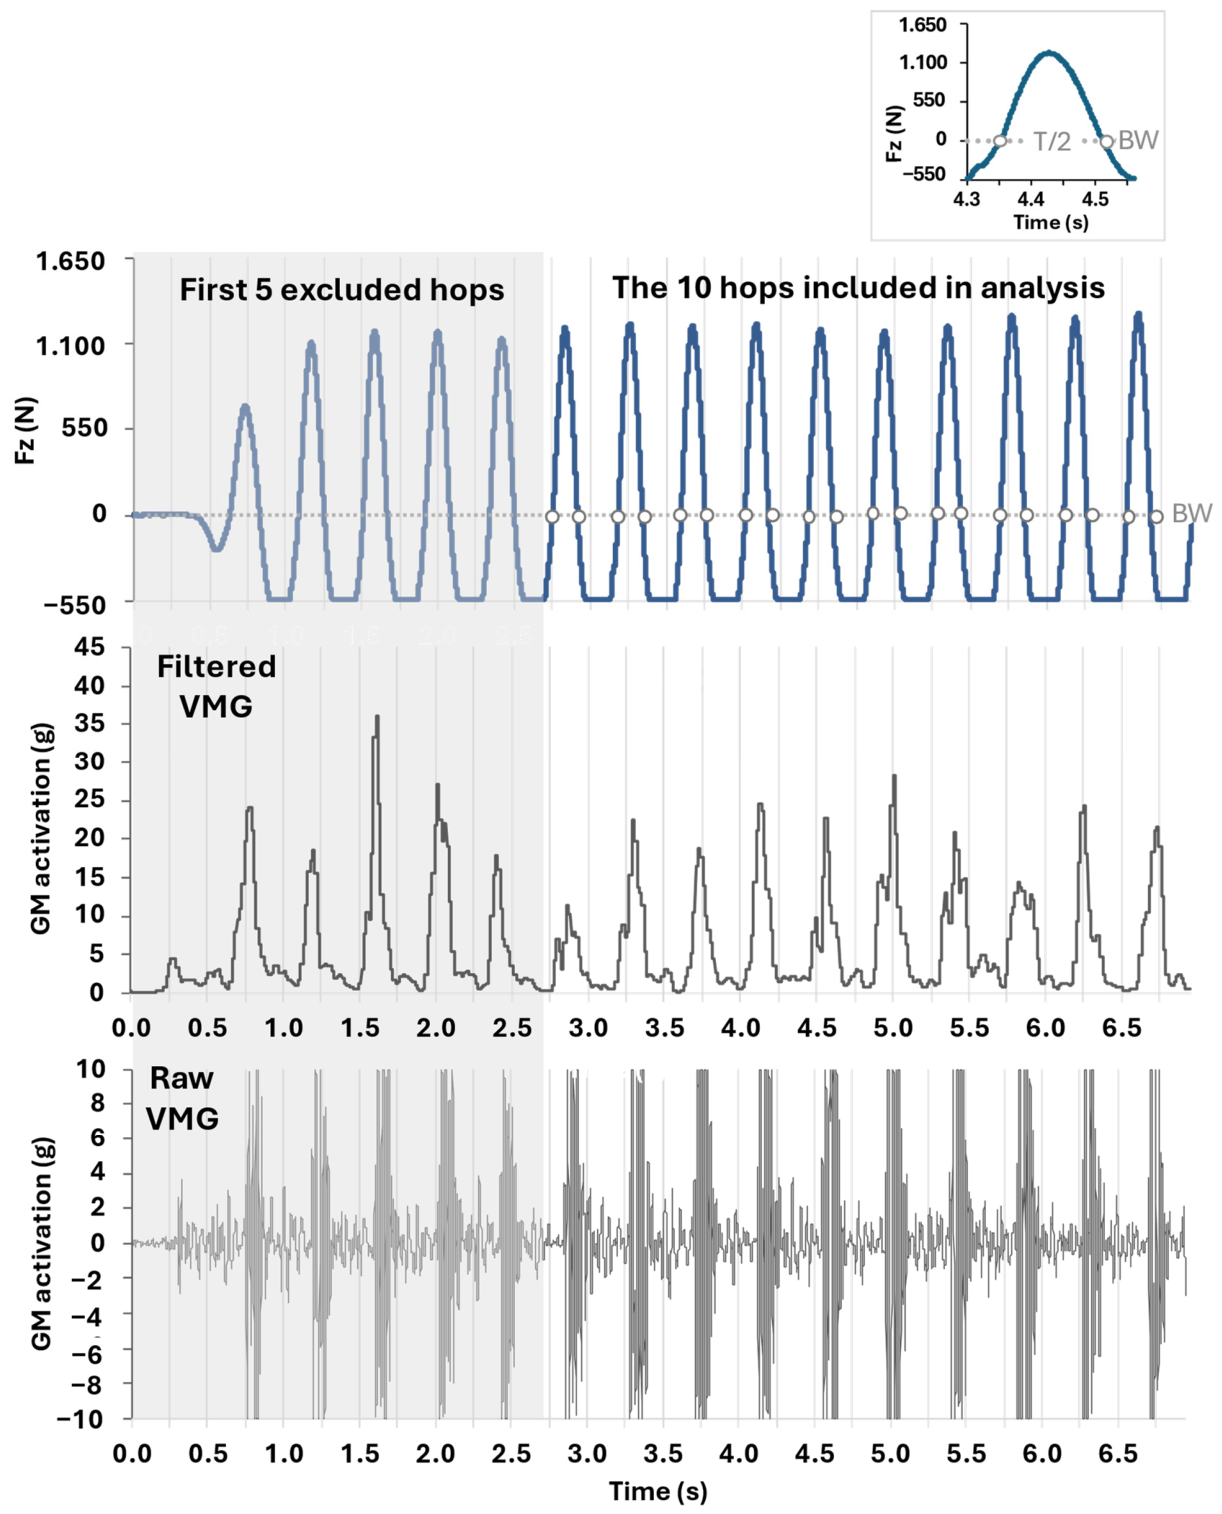
To ensure robust extraction of the resonant period (T/2), otherwise termed the effective Fz duration, the static body weight (BW) recorded during quiet standing was ‘zeroed’ (Figure 2). This baseline adjustment involved a numerical subtraction of the BW value from the raw Fz curve within the data acquisition software. Consequently, under this procedure, the Fz signal during the flight phase yields negative values equal to −1 BW (Figure 1 and Figure 2). This transformation enabled the application of a zero-crossing algorithm (Matlab R2025b, The Mathworks Inc., Natick, MA, USA) to precisely detect the two time points defining T/2 (Figure 2—zeroed BW crossings). Following this detection, the participant’s personal BW was added back to each Fz peak value to ensure absolute kinetic accuracy for final reporting. To identify standard contact and flight phases, the same zero-crossing procedure was applied using the original BW (non-zeroed) as the criterion value (Figure 2—BW crossings). Each detection was visually inspected to validate the temporal location of critical time points. For each trial, a 10-hop average was computed, and the two-trial average was used for statistical analysis.

2.8. Vibromyographic (VMG) Activity

In synchronization with Fz recording, the activity of the lateral gastrocnemius (GM) of the right lower limb (Figure 2) was also recorded using a vibromyography (VMG) transducer (TSD250, interfaced via the Biopac MP150 analog-to-digital converter, sampling at 2000 Hz, using the AcqKnowledge 5.0 software, Biopac Systems, Inc., Santa Barbara, CA, USA). The sensor employs sensitive microelectromechanical systems accelerometers to monitor and record low-frequency mechanical vibrations originating within the muscle, reflecting the mechanical contraction of muscle fibers.
The GM was selected as the target musculature based on its established role as the principal modulator of hopping mechanics and energy management within the lower limb] [5]. The Biopac TSD250A VMG transducer was secured to the lateral head of the GM using a specialized medical adhesive. To ensure optimal placement over the muscle belly, the sensor was applied while the participants stood on their toes—a position that elicits maximal GM activation [40]—in accordance with the standardized guidelines proposed by Cram and Kasman [41]. The Biopac TSD250A VMG transducer is an accelerometric sensor that detects the muscle vibration and outputs a voltage proportional to that acceleration.
Vibromyography was chosen to monitor GM activity due to its capacity to directly quantify the mechanical response of the muscle belly during high-frequency, dynamic loading. While surface electromyography is the conventional standard for neural drive (recording electrical excitation), VMG offers a distinct advantage in studying leg stiffness: it captures the mechanical vibrations generated by motor unit activation, which are directly related to the muscle-tendon unit’s ability to dampen impact forces and facilitate elastic recoil [1,2]. Recent evidence supports the efficacy of VMG in dynamic environments where EMG signal quality may be compromised by movement artifacts [3,4]. Studies have demonstrated that VMG signals correlate strongly with mechanical force during rapid loading cycles [42,43], providing a more direct insight into the muscle’s mechanical impedance compared to the electrical precursors captured by EMG. By focusing on the VMG signal, which increases linearly with contraction intensity, this study captures the ‘mechanical output’ of the GM—the primary variable governing the transition from energy dampening to propulsion during the hopping cycle.
The VMG signal was processed using the integrated filtering module within Acqknowledge 5.0 software, which utilizes a Wavelet Packet Analysis algorithm (Sonostics (Endicott, NY, USA)/BIOPAC). This algorithm is validated to isolate contractile vibrations, while maintaining a linear correlation with mechanical muscle effort (BIOPAC VMG White Paper). The software applies a scaling factor of 50 V/g (based on the predefined sensitivity of the MP150 system) to the raw voltage values, to convert the physical acceleration of the muscle fibers into gravity (g) units. Thus, the muscle vibrations are linearly scaled to the contractile force.
The Biopac/Sonostics Wavelet Packet Analysis algorithm transforms the raw data (sampled at 2000 Hz) into a smoothed mechanical profile using specialized band-pass filtering (targeting the 5 Hz–100 Hz range) to eliminate low-frequency movement artifacts (e.g., sensor sway during the hopping task) and high-frequency noise. Subsequently, rectification converts all negative amplitude values to positive to facilitate power and volume analysis. Finally, an RMS transformation was applied using a 50 ms moving window to calculate the Root Mean Square (RMS), resampling the signal to 62 Hz. This produces the “envelope” seen in Figure 2-Center, representing the effective power or “mechanical intensity” of the GM in units of gravity (g). For each participant, following the application of the VMG filtering module (Acqknowledge software (Figure 2-Center), the GM intensity during tcontact was calculated for each one of the 10 hops. The 10-hop mean per participant was utilized in the subsequent statistical analysis.

2.9. Justification of Contact Phase Analysis

Data analysis was delimited strictly to the contact phase—defined as the interval from initial contact to take-off as identified by the Kistler force plate—as this period constitutes the active phase of the spring–mass system where energy absorption and propulsion occur [1,5,6]. By temporally aligning the peak of the RMS series (RMSmax) with Fz peak, the study evaluates shifts in “stiffness tuning” strategies employed by athletes when transitioning between barefoot and shod conditions [5,24]. This alignment analysis determines whether the mechanical peak of the muscle undergoes a temporal shift earlier in the contact phase, to compensate for the absence of shoe-derived cushioning and to dampen impact-related vibrations.

2.10. Visual Monitoring

To maintain technical proficiency and procedural adherence, sagittal plane kinematics were captured using a high-speed digital camera (Basler ac645-100gm, sampling at 100 Hz, Basler AG, Ahrensburg, Germany) in synchronization with the vertical ground reaction force (Fz) and VMG recordings. System integration was facilitated via AcqKnowledge 5.0 software (Biopac Systems, Inc., Santa Barbara, CA, USA), which served as the master trigger for simultaneous data acquisition across the camera, force plate, and VMG sensors. This synchronization ensured precise alignment of temporal mechanical events (e.g., initial contact, peak force) with muscle fiber vibrations and visual body orientation.
The camera was mounted at a 0.80 m height, aligned orthogonally to the sagittal plane of the participant. Horizontal distance was standardized to guarantee full-body visibility—specifically of the shoulder, hip, knee, and ankle joints—throughout the complete hopping cycle. Video data were utilized for post hoc visual inspection to verify that participants maintained the prescribed posture (hands at mid-waist) and to exclude hops characterized by secondary movements (e.g., excessive trunk lean or arm swinging) that might have confounded the leg stiffness results. Subsequent visual inspection confirmed that all hops were technically properly performed.

2.11. Statistical Analysis

The sample size was determined a priori using G*Power software [44] (version 3.1.9.7, Heinrich-Heine-Universität Düsseldorf, Düsseldorf, Germany, https://www.psychologie.hhu.de/arbeitsgruppen/allgemeine-psychologie-und-arbeitspsychologie/gpower, assessed on 10 October 2022). Based on a two-way mixed ANOVA design (within–between interaction), the total sample size of n = 42 participants (n = 14 per sport group) was estimated as sufficient to detect a large effect size (f = 0.40) with a significance level (alpha) of 0.05 and a target power (1 − beta) of 0.90.
Data normality was verified via the Shapiro–Wilk test, and homogeneity of variance was assessed using Levene’s test. To confirm adherence to the hopping tempo (130 bpm), a one-sample t-test was conducted against the target frequency. Differences in participant characteristics between groups were evaluated using one-way ANOVA; where Levene’s test was non-significant (p > 0.05), Bonferroni post hoc comparisons and eta-squared (η2) effect sizes were reported. If Levene’s test was significant (p < 0.05), the Games-Howell post hoc correction and omega-squared (ω2) were applied.
Kinetic performance, kleg, and GM activity were analyzed using a 3 × 2 mixed-model ANOVA to evaluate the interaction between sport specialization (between subjects) and footwear condition (within subjects), as well as their respective main effects. If Mauchly’s test indicated a violation of sphericity, the Greenhouse-Geisser correction was applied. Partial eta-squared (ηp2) was reported as an indicator of effect size for ANOVA results. All statistical procedures were performed using SPSS version 30.0 (IBM Statistics, Armonk, NY, USA), with significance set at p < 0.05.

3. Results

3.1. Adherence to Metronome Tempo

Visual inspection verified that all hops exhibited a single Fz peak, confirming spring-like mechanics [1,2,39]. Across all groups, one-sample t-test confirmed that participants adhered strictly to the 130 bpm tempo. (Volleyball: 126.6 ± 8.6, p = 0.161, Basketball: 130.6 ± 3.0, p = 0.430, Handball 129.2 ± 2.3, p = 0.216, Total: 129.1 ± 5.0, p = 0.174) with non-significant inter-group differences (F = 1.793, p = 0.160). The maximum deviation from the set tempo did not exceed 2%, ensuring that frequency-dependent effects on stiffness remained controlled [6].

3.2. Performance Metrics

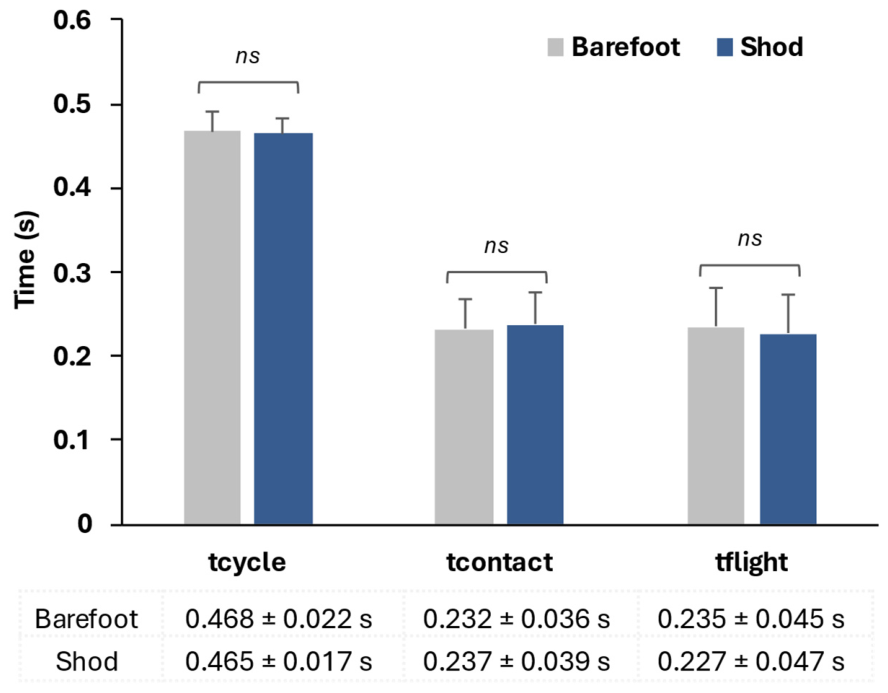
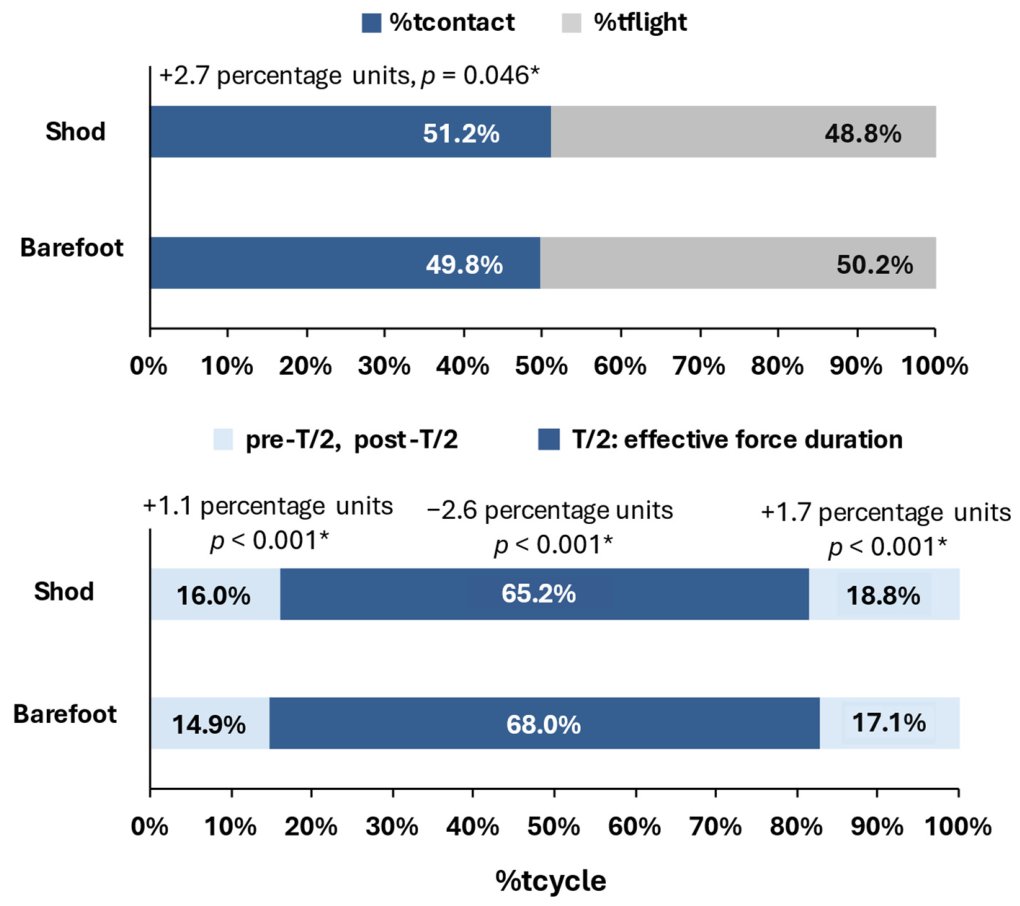
The two-way mixed ANOVA revealed no significant interaction between sport specialization and footwear condition across all performance metrics (p > 0.05, Table A1). Consequently, the main effect of footwear is presented for the total sample (N = 42). No significant change was found in absolute temporal performance metrics (tcycle: −0.6%, p = 0.307, tcontact: +2.1%, p = 0.097, tflight: −3.3%, p = 0.058) (Figure 2) as well as in hopping height (barefoot: 7.1 ± 2.6 cm, shod: (−6.1%) 6.7 ± 2.6 cm, p = 0.109). However, the relative timing metrics yielded significant changes in the shod condition, depicted as +2.7% units increase in tcontact relative to tcycle (100%) (Figure 3), and −3 percentage units decrease in effective force duration (T/2) relative to tcontact (100%) (Figure 4).
Fz peak was significantly increased (+4.3%) in the shod condition (barefoot: 2173.0 ± 465.6 N, shod: 2265.5 ± 520.8 N, p = 0.013). In the shod condition, Fz peak occured at the same absolute time from contact initiation (barefoot: 0.112 ± 0.020 s, shod: 0.113 ± 0.021 s, p = 0.458), but at a significantly lower relative time (−0.6 percentage units) (barefoot: 48.0 ± 2.1% tcontact, shod: 47.3 ± 2.3% tcontact, p = 0.010).

3.3. Leg Stiffness and GM Effort

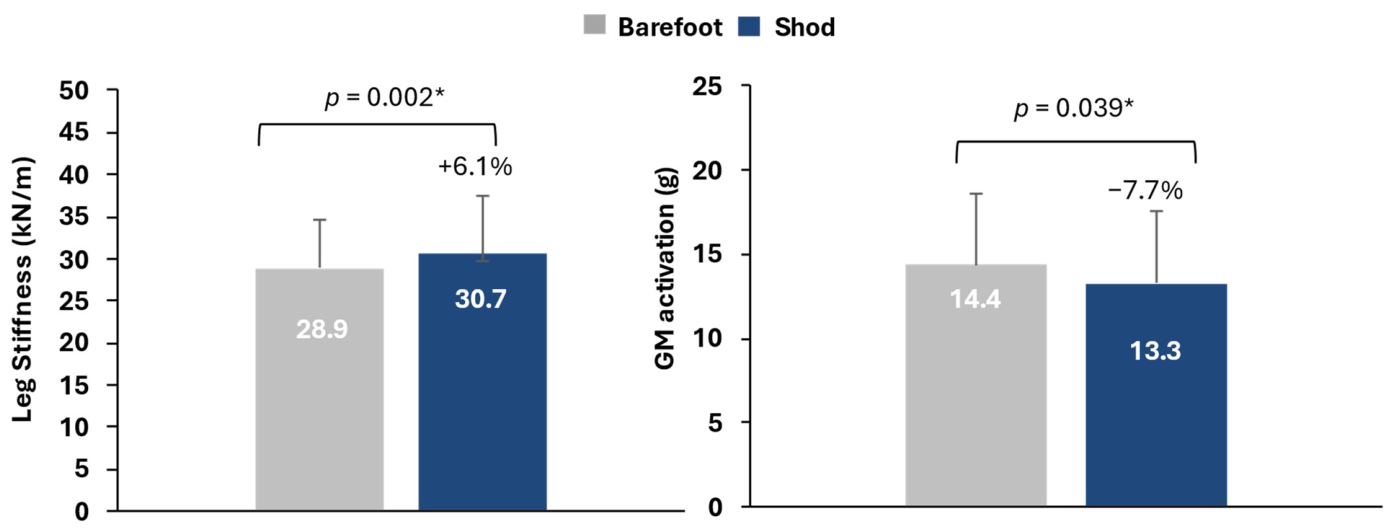
In the shod condition, kleg exhibited a significant increase (+6.1%) compared to barefoot (p = 0.002) (Figure 5-Left), whereas a significant reduction in GM effort was observed during tcontact phase, with VMG intensity decreasing by −7.7% (p = 0.039) (Figure 5-Right).

4. Discussion

The purpose of this study was to assess the effect of footwear on kinetic performance, kleg, and GM activity during frequency-constrained two-legged hopping, and also to verify potential stiffness convergence among the Volleyball, Basketball, and Handball court athletes, despite the specialized mechanical demands of their specialization. Thus, the study tested three hypotheses concerning: (H1) whether sport specialization would interact with footwear, (H2) whether participants would exhibit significantly altered kinetic performance and higher kleg in the shod compared to the barefoot condition, and (H3) whether the GM activation would be lower in the shod than in the barefoot condition.
The findings indicate that sport specialization did not significantly interact with footwear to affect hopping performance (with remarkably similar vertical ground reaction force, Fz, profiles), kleg, or GM activation, suggesting a common biomechanical strategy among Volleyball, Basketball, and Handball athletes. This convergence emerges despite distinct chronic loading profiles: Volleyball and Basketball players typically experience about double the landing loads of Handball players, and the proportion of single- versus double-legged landings differs across sports [21,30,31].
The primary explanation for these null findings is the concept of optimal stiffness convergence, driven by the need for movement efficiency and biological structure protection [6,8,19], which demonstrated a U-shaped relationship between extremity stiffness and injury risk, with both excessively high and excessively low stiffness associated with increased injury. Thus, competitive athletes across court sports may converge toward a similar stiffness range to avoid extremes that would either elevate loading rates and bony injury risk (e.g., stress fractures) or predispose to soft-tissue strains. For female athletes, this convergence is vital, as they generally demonstrate lower kleg and reduced passive joint stiffness than males [25,26], a profile linked to higher injury risks [28]. For court athletes, maintaining a stable stiffness range is a functional adaptation that supports explosive movements on high-friction surfaces [20]. Although individual joint strategies might vary slightly, global limb stability appears to be prioritized. Court athletes may therefore increase stiffness to ensure that the lower limbs function as effective “stabilizing springs,” regardless of sport-specific training background in Basketball, Volleyball, or Handball [19,20].
However, a scientifically rigorous and balanced interpretation dictates that this absence of statistically significant differences between sports disciplines must be interpreted with caution, as a null statistical result is not definitive proof of absolute strategic equality. Several alternative methodological factors within our experimental design may have contributed to these findings and must be balanced against our convergence hypothesis. First, given our sample size of N = 14 participants per group, the statistical model may have been exposed to an elevated risk of a Type II error, potentially lacking the statistical power necessary to detect highly subtle, discipline-specific neuromuscular variations. Second, permitting athletes to utilize their own heterogeneous, non-standardized personal training footwear—rather than a single laboratory-controlled shoe model—undoubtedly injected mechanical ‘noise’ into our baseline data via differing stack heights and midsole compliance profiles. Finally, the bilateral vertical hopping protocol utilized in this study is inherently sub-maximal and non-specific. While vertical hopping is an established surrogate for evaluating global spring–mass mechanics, it lacks the multi-planar cutting, rapid lateral deceleration, and maximal loading profiles unique to competitive court match play, which may be required to unmask true discipline-specific adaptations. Consequently, while an optimal biological convergence remains a compelling conceptual framework for these athletes, it must be interpreted as a hypothesis rather than a definitive conclusion until validated across larger cohorts, fully standardized equipment controls, and sport-specific functional tasks.
Across all sport groups, wearing shoes induced a significant change in the temporal structure of the hopping pattern, with an increase in relative contact time (tcontact) and a decrease in relative effective force duration, while absolute temporal measures remained unchanged. During tcontact, the lower limb behaves as a spring–mass system, where joint flexion facilitates energy absorption (compression), and extension generates the take-off impulse [1,5]. In our study, shod hopping height decreased by 0.4 cm (non-significant), but shod dynamics showed a significant increase in Fz peak (+4.3%) and an earlier peak relative to tcontact (−0.7 percentage units). In addition, kleg increased (+6.1%) and GM activation decreased (−7.7%) in the shod condition, indicating reduced GM effort despite higher leg stiffness.
These findings are consistent with previous studies and theory. Participants were expected to demonstrate higher kleg in the shod condition, which is explained by stiffness tuning theory [3]: the neuromuscular system perceives the shoe’s midsole as added compliance. To maintain a stable kleg despite the alterations in the series of stiffnesses employed in the system, the body “over-braces” the limb, creating a stiffer biological spring to limit energy dissipation within the footwear foam [8]. The observed changes in hopping performance metrics in the shod condition—specifically the relative reduction in effective contact phase duration—are mathematically and mechanically related to the increase in kleg [3,4,7,37]. A stiffer system requires smaller vertical center-of-mass displacement (i.e., less “compression” of the leg spring), producing a more rigid hopping style, typically associated with less time spent on the ground [19]. This adaptation is consistent with the concept of stable support mechanics, in which the motor system prioritizes consistent movement dynamics (jump height, center-of-mass motion) across different interface conditions [6]. The minimal change in hopping height in our data, despite the altered footwear compliance, offers empirical support for effective stiffness tuning.
This “stiff-spring” behavior is further evidenced by the earlier (–0.7%) relative timing of Fz peak, likely facilitated by GM pre-activation to counteract footwear compliance [45]. The GM activation, 85–100 ms prior to contact [16], prepares the Achilles tendon for eccentric loading, thus governing the transition from energy dampening to propulsion [5]. To maintain energy return in the presence of footwear compliance, athletes appear to accelerate the transition from the eccentric to concentric action (amortization phase) [46]. The reduction (–7.7%) in GM activation during tcontact in the shod condition is consistent with evidence that the neuromuscular system modulates effort according to external mechanical rigidity [10]. The impact-attenuating and supportive properties of the midsole reduce the need for high feed-forward GM activation to provide landing support [11,23]. Thus, footwear can act as a mechanical buffer, allowing athletes to maintain stability with lower GM contractile intensity [10].
On the high-stiffness surfaces typical of courts (e.g., hardwood, acrylic), athletes rely on pre-tensing strategies, primarily via feed-forward GM activation, to manage high impact forces and ensure joint stability [23]. When transitioning to barefoot conditions, they lose the impact-attenuating benefits of shoe foams and must increase ankle joint stiffness to preserve the foot’s role as a rigid lever [24]. This adaptation is characterized by a greater reliance on the gastrocnemius-soleus complex or arch stabilization and efficient energy transfer during contact [22]. By increasing mechanical effort at maximal flexion, GM helps maintain stable kleg despite changes in external series stiffness introduced by footwear. The near-simultaneous occurrence of maximum leg compression and peak GM activation [Figure 5] offers a mechanical insight into stiffness tuning, marking the point of maximum tension in the muscle–tendon unit during the eccentric–concentric transition. This peak likely reflects the system acting as a “stiff biological spring” that resists energy loss into the shoe foam.
Collectively, these findings indicate that lower-limb stiffness regulation emerges from an integrated interaction between footwear properties, surface characteristics, and neuromuscular control. Within this framework, female court athletes appear capable of rapidly recalibrating limb impedance to preserve spring–mass behavior and movement efficiency despite changes in external mechanical compliance.
The stiffness values reported in the present study should be considered within the limitations of the calculation method (resonant frequency method), which, as discussed earlier, assumes synchronous occurrence of Fz peak and leg compression, which does not always hold. This assumption may lead to over- or underestimation of leg stiffness; however, the values reported here remain within ranges described in previous studies. Moreover, the fixed hopping frequency limits generalization to a preferred, self-selected frequency, as the temporal constraint may restrict natural lower-limb behavior and could induce artificial differences across trial segments. However, the fixed hopping frequency set by a metronome tempo of 130 bpm is a common methodological choice used to promote linear spring–mass behavior (i.e., a sinusoidal force–time profile) and to minimize non-linear patterns [1,2]. Furthermore, due to the significant surface-by-hopping frequency interaction [15], a constrained, rather self-selected hopping frequency was expected to facilitate the emergence of leg stiffness differences attributable to the footwear-surface interface.
One should also take into account that the hopping trials were conducted on a highly rigid, metallic platform interface rather than a standard sports court surface (e.g., hardwood or acrylic). According to spring–mass mechanics established by Ferris & Farley [6], the human leg-spring system dynamically adjusts to surface constraints by altering its internal stiffness to keep the combined ‘surface-plus-leg’ stiffness stable. On an unyielding metal boundary, athletes typically decrease vertical leg stiffness by increasing joint flexion or altering the activation timing of the gastrocnemius to cushion the higher peak impact forces [19]. Therefore, while our findings accurately capture the acute neuromuscular adjustments between shod and barefoot conditions on a rigid instrumented surface, the absolute values for ground contact time tcontact and GM activation intensity may vary when transitioning to actual court-playing environments.
An additional consideration is that participants wore their personal habitual training running shoes during shod trials rather than a standardized model. This heterogeneity could theoretically introduce statistical ‘noise’ via varying midsole densities and stack heights, potentially reducing the model’s sensitivity to detect subtle mechanical variations between the three sports disciplines. However, evidence suggests that overall kinetic patterns and load symmetry remain remarkably consistent even when athletes utilize their own habitual footwear instead of a laboratory-standardized alternative [14]. Furthermore, while different running shoe geometries can alter transient loading rates, they have been shown to exert minimal influence on the underlying lower extremity kinematics and movement strategies [24]. These footwear-specific impacts on joint and leg-spring stiffness also appear heavily dependent on pacing constraints; these effects are most pronounced when hopping frequency is artificially driven by an external metronome, whereas self-selected frequency tasks allow the neuromuscular system to naturally modulate foot and ankle function to achieve consistent mechanics [15]. Therefore, while the use of personal training shoes may have introduced minor baseline variance, our utilization of a self-selected hopping pace likely minimized these confounding footwear effects. Nonetheless, future studies utilizing a fully standardized shoe model across all cohorts are warranted to completely rule out subtler equipment–discipline interactions.

5. Conclusions

The findings of this study depict a unified biomechanical strategy among Volleyball, Basketball, and Handball athletes, who appear to converge toward a stable leg stiffness. However, several alternative methodological factors within our experimental design may have contributed to these findings and must be balanced against our convergence hypothesis. The use of sport shoes alters the timing characteristics of hopping by elongating contact time (tcontact) and shortening the effective force duration, thereby making the leg spring functionally stiffer. Although kleg increased during shod hopping, GM activation decreased, indicating that, in the presence of the shoe’s structural support, the neuromuscular demand for accommodating landing forces and providing stabilization is reduced. This “stiffness tuning” response allows athletes to perceive footwear as added compliance and to increase kleg to preserve system stability and limit energy dissipation within the foam. Finally, the earlier timing of Fz further suggests a more rapid transition from the eccentric to the concentric phase, helping to maintain energy return despite the compliant interface.

Author Contributions

Conceptualization, O.T. and E.R.; methodology, O.T. and E.R.; formal analysis, O.T. and E.R.; investigation, O.T. and E.R.; data curation, O.T., A.E. and E.R.; writing—original draft preparation, O.T., A.E. and E.R.; writing—review and editing, O.T., A.E., E.R., K.B. and K.B. and E.R.; visualization, A.E. and E.R.; supervision, E.R. and K.B.; project administration, E.R., I.B. and K.B. All authors have read and agreed to the published version of the manuscript.

Funding

This research received no external funding.

Institutional Review Board Statement

The study was conducted in accordance with the Declaration of Helsinki and approved by the Ethics Committee of the School of Physical Education and Sport Science, National and Kapodistrian University of Athens, Greece (protocol code 1419/19 October 2022).

Informed Consent Statement

Informed consent was obtained from all subjects involved in the study.

Data Availability Statement

The data are not publicly available due to ethical restrictions.

Acknowledgments

We thank George Vagenas for his valuable contribution to the advancement of statistical reasoning and understanding.

Conflicts of Interest

The authors declare no conflicts of interest.

Abbreviations

The following abbreviations are used in this manuscript:
FzVertical Ground Reaction Force
klegLeg Stiffness
bmpBeats Per Minute
GMGastrocnemius Muscle (Lateral)
VMGVibromyography
SDStandard Deviation
CVCoefficient of Variation

Appendix A

Table A1. Descriptive Statistics (Mean ± SD) per sport group in the barefoot and shod conditions, as well as the statistics for the Sport Group X Footwear Interaction produced by one-way Anova for independent measures (SPSS 30.0, IBM Statistics, Armonk, NY, USA). Across all metrics, the Sport Group X Footwear Interaction was not significant (p > 0.05).
Barefoot ConditionShod ConditionSport Group X Footwear
Interaction Statistics
Volleyball
(N = 14)
Basketball
(N = 14)
Handball
(N = 14)
Total
(N = 42)
Volleyball
(N = 14)
Basketball
(N = 14)
Handball
(N = 14)
Total
(N = 42)
FSig.Partial
η2
Observed Power
kleg (kN/m)28.97 ± 5.3429.08 ± 5.5728.67 ± 6.4828.91 ± 5.6831.65 ± 6.3530.08 ± 6.6130.31 ± 7.7530.68 ± 6.790.8670.4280.0430.188
Fz peak (N)2242 ± 5032091 ± 4402186 ± 4742173 ± 4662343 ± 5172149 ± 4952305 ± 5652266 ± 5210.2640.7700.0130.089
tcycle (s)0.478 ± 0.0340.46 ± 0.010.465 ± 0.0090.468 ± 0.0220.468 ± 0.020.459 ± 0.0110.468 ± 0.0160.465 ± 0.0172.3390.1100.1070.445
tflight (s)0.238 ± 0.0590.23 ± 0.0470.237 ± 0.0270.235 ± 0.0450.225 ± 0.0580.221 ± 0.0450.236 ± 0.0380.227 ± 0.0470.8340.4420.0410.183
tcontact (s)0.238 ± 0.040.23 ± 0.0430.228 ± 0.0260.232 ± 0.0360.241 ± 0.0430.238 ± 0.0430.232 ± 0.0340.237 ± 0.0390.2910.7490.0150.093
tFzpeak (s)0.114 ± 0.0230.111 ± 0.0210.11 ± 0.0180.112 ± 0.020.115 ± 0.0250.114 ± 0.0210.11 ± 0.0160.113 ± 0.0210.1800.8360.0090.076
T/2 (s)0.159 ± 0.0140.154 ± 0.0170.154 ± 0.0120.156 ± 0.0140.153 ± 0.0130.153 ± 0.0180.151 ± 0.0130.153 ± 0.0151.7440.1880.0820.344
pre T/2 (s)0.036 ± 0.0160.035 ± 0.0140.036 ± 0.0110.036 ± 0.0140.04 ± 0.0180.039 ± 0.0140.038 ± 0.0130.039 ± 0.0150.1170.8900.0060.067
post T/2 (s)0.043 ± 0.0140.04 ± 0.0140.039 ± 0.0070.041 ± 0.0120.048 ± 0.0140.045 ± 0.0140.043 ± 0.010.045 ± 0.0130.0970.9080.0050.064
Height (m)7.44 ± 3.466.78 ± 2.457.1 ± 1.617.11 ± 2.576.64 ± 3.16.27 ± 2.37.11 ± 2.26.67 ± 2.520.8010.4560.0390.177
tcontact (%tcycle)50.3 ± 9.850.2 ± 9.849 ± 5.649.8 ± 8.552.1 ± 10.951.9 ± 9.549.6 ± 7.551.2 ± 9.30.3240.7250.0160.098
tflight (%tcycle)49.7 ± 9.849.8 ± 9.851 ± 5.650.2 ± 8.547.9 ± 10.948.1 ± 9.550.4 ± 7.548.8 ± 9.30.3240.7250.0160.098
tFzpeak (%tcontact)47.8 ± 2.148.3 ± 2.247.9 ± 1.948.0 ± 2.047.4 ± 2.647.8 ± 2.246.8 ± 2.047.3 ± 2.30.7850.4630.0390.174
T/2 (%tcontact)67.9 ± 6.468.1 ± 6.467.8 ± 4.368.0 ± 5.665.1 ± 6.065.4 ± 5.865.8 ± 5.065.4 ± 5.50.1960.8230.0100.078
pre T/2 (%tcontact)14.51 ± 3.9114.9 ± 3.4715.22 ± 3.2814.88 ± 3.4815.73 ± 4.2616.01 ± 3.1616.28 ± 3.6816.01 ± 3.640.0200.9800.0010.053
post T/2 (%tcontact)17.62 ± 3.2816.98 ± 3.2416.94 ± 1.8917.18 ± 2.8219.58 ± 2.8918.6 ± 2.9118.27 ± 1.8618.82 ± 2.60.3110.7350.0160.096
g (1 g = 9.81 m/s2)14.02 ± 5.1214.33 ± 3.9514.83 ± 3.7914.39 ± 4.2312.3 ± 4.1314.51 ± 4.813.04 ± 3.9613.29 ± 4.311.5630.2220.0740.312

References

  1. Blickhan, R. The spring-mass model for running and hopping. J. Biomech. 1989, 22, 1217–1227. [Google Scholar] [CrossRef] [PubMed]
  2. McMahon, T.A.; Cheng, G.C. The mechanics of running: How does stiffness couple with speed? J. Biomech. 1990, 23, 65–78. [Google Scholar] [CrossRef] [PubMed]
  3. Bishop, M.; Fiolkowski, P.; Brunt, D.; Williams, B.; Horodyski, M. Athletic footwear, leg stiffness, and running kinematics. J. Athl. Train. 2006, 41, 387–392. [Google Scholar] [PubMed]
  4. Farley, C.T.; Morgenroth, D.C. Leg stiffness primarily depends on ankle stiffness during human hopping. J. Biomech. 1999, 32, 267–273. [Google Scholar] [CrossRef] [PubMed]
  5. Kuitunen, S.; Ogiso, K.; Komi, P.V. Leg and joint stiffnessi n human hopping. Scand. J. Med. Sci. Sports. 2011, 21, e159–e167. [Google Scholar] [CrossRef] [PubMed]
  6. Ferris, D.P.; Farley, C.T. Interaction of leg stiffness and surface stiffness during human hopping. J. Appl. Physiol. 1997, 82, 15–22. [Google Scholar] [CrossRef] [PubMed]
  7. Farley, C.T.; Houdijk, H.H.; Van Strien, C.; Louie, M. Mechanism of leg stiffness adjustment for hopping on surfaces of different stiffnesses. J. Appl. Physiol. 1998, 85, 1044–1055. [Google Scholar] [CrossRef] [PubMed]
  8. Kerdok, A.E.; Biewener, A.A.; McMahon, T.A.; Weyand, P.G.; Herr, H.M. Energetics and mechanics of human running on surfaces of different stiffnesses. J. Appl. Physiol. 2002, 92, 469–478. [Google Scholar] [CrossRef] [PubMed]
  9. Li, J.; Wu, K.; Ye, D.; Deng, L.; Wang, J.; Fu, W. Effects of barefoot and shod conditions on the kinematics and kinetics of the lower extremities in alternating jump rope skipping—A one-dimensional statistical parameter mapping study. Bioengineering 2023, 10, 1154. [Google Scholar] [CrossRef] [PubMed]
  10. Ferri-Caruana, A.; Cardera-Porta, E.; Gene-Morales, J.; Saez-Berlanga, A.; Jiménez-Martínez, P.; Juesas, A.; Colado, J.C. Barefoot vs shod walking and jogging on the electromyographic activity of the medial and lateral gastrocnemius. J. Biomech. 2024, 176, 112371. [Google Scholar] [CrossRef] [PubMed]
  11. Divert, V.; Mornieux, G.; Baur, H.; Mayer, F.; Belli, A. Mechanical comparison of barefoot and shod running. Int. J. Sports Med. 2005, 26, 593–598. [Google Scholar] [CrossRef] [PubMed]
  12. Nigg, B.M.; Segesser, B. The influence of playing surfaces on the load on the locomotor system and on football and tennis injuries. Sports Med. 1988, 5, 375–385. [Google Scholar] [CrossRef] [PubMed]
  13. Lieberman, D.E.; Venkadesan, M.; Werbel, W.A.; Daoud, A.I.; D’Andrea, S.; Davis, I.S.; Mang’eni, R.O.; Pitsiladis, Y. Foot strike patterns and collision forces in habitually barefoot versus shod runners. Nature 2010, 463, 531–535. [Google Scholar] [CrossRef] [PubMed]
  14. Luftglass, A.R.; Peebles, A.T.; Miller, T.K.; Queen, R.M. The impact of standardized footwear on load and load symmetry. Clin. Biomech. 2021, 88, 105421. [Google Scholar] [CrossRef] [PubMed]
  15. Birch, J.V.; Kelly, L.A.; Farris, D.J. The effects of surface stiffness on human hopping frequency preference and the underlying neuromuscular function of the foot and ankle. Scand. J. Med. Sci. Sports 2025, 35, e70067. [Google Scholar] [CrossRef] [PubMed]
  16. Jones, G.M.; Watt, D.G. Observations on the control of stepping and hopping movements in man. J. Physiol. 1971, 219, 709–727. [Google Scholar] [CrossRef] [PubMed]
  17. Ker, R.; Bennett, M.; Bibby, S.; Kester, R.; Alexander, R.M. The spring in the arch of the human foot. Nature 1987, 325, 147–149. [Google Scholar] [CrossRef] [PubMed]
  18. Dyhre-Poulsen, P.; Simonsen, E.B.; Voigt, M. Dynamic control of muscle stiffness and H reflex modulation during hopping and jumping in man. J. Physiol. 1991, 437, 287–304. [Google Scholar] [CrossRef] [PubMed]
  19. Butler, R.J.; Crowell, H.P.; Davis, I.M. Lower extremity stiffness: Implications for performance and injury. Clin. Biomech. 2003, 18, 511–517. [Google Scholar] [CrossRef] [PubMed]
  20. Pezeshk, A.F.; Sadeghi, H.; Shariatzadeh, M.; Ilbeigi, S. Shifting joint regulation: The influence of hard spring surfaces on lower limb mechanics during hopping. Proc. Inst. Mech. Eng. Part P J. Sports Eng. Technol. 2025. [Google Scholar] [CrossRef]
  21. Struzik, A.; Pietraszewski, B.; Zawadzki, J. Biomechanical analysis of the jump shot in basketball. J. Hum. Kinet. 2014, 42, 73–79. [Google Scholar] [CrossRef] [PubMed]
  22. Wang, D.; Liu, Y.; Zhang, Z.; Wang, L. Stiffness characteristics of the lower extremities in Women’s Chinese Basketball Association competition athletes: Normative values and position differences. Front. Bioeng. Biotechnol. 2025, 13, 1527730. [Google Scholar] [CrossRef] [PubMed]
  23. Lin, Z.-J.; Chang, J.-B.; Chang, K.-L.; Tang, W.-T. The Influence of Court Surfaces on Lower Limb Muscle Activation of Tennis Run-and-Stroke. ISBS Proc. Arch. 2023, 41, 74. Available online: https://commons.nmu.edu/isbs/vol41/iss1/74 (accessed on 16 June 2026).
  24. Sinclair, J.; Atkins, S.; Taylor, P.J. The effects of barefoot and shod running on limb and joint stiffness characteristics in recreational runners. J. Mot. Behav. 2016, 48, 79–85. [Google Scholar] [CrossRef] [PubMed]
  25. Granata, K.P.; Padua, D.A.; Wilson, S.E. Gender differences in active musculoskeletal stiffness. Part II. Quantification of leg stiffness during functional hopping tasks. J. Electromyogr. Kinesiol. 2002, 12, 127–135. [Google Scholar] [CrossRef] [PubMed]
  26. Hobara, H.; Inoue, K.; Omuro, K.; Muraoka, T.; Kanosue, K. Determinant of leg stiffness during hopping is frequency-dependent. Eur. J. Appl. Physiol. Occup. Physiol. 2011, 111, 2195–2201. [Google Scholar] [CrossRef] [PubMed]
  27. Maloney, S.J.; Fletcher, I.M. Lower limb stiffness testing in athletic performance: A critical review. Sports Biomech. 2021, 20, 1091–1109. [Google Scholar] [CrossRef] [PubMed]
  28. Padua, D.A.; Carcia, C.R.; Arnold, B.L.; Granata, K.P. Gender differences in leg stiffness and stiffness recruitment strategy during two-legged hopping. J. Mot. Behav. 2005, 37, 111–125. [Google Scholar] [CrossRef] [PubMed]
  29. Bedo, B.L.S.; Cesar, G.M.; Andrade, V.L.; Moura, F.A.; Palucci Vieira, L.H.; Aquino, R.; Domingos, M.B.; Santiago, P.R.P. Landing mechanics of basketball and volleyball athletes: A kinematic approach. Hum. Mov. 2022, 23, 80–88. [Google Scholar] [CrossRef]
  30. Skazalski, C.; Whiteley, R.; Bahr, R. High jump demands in professional volleyball—Large variability exists between players and player positions. Scand. J. Med. Sci. Sports 2018, 28, 2293–2298. [Google Scholar] [CrossRef] [PubMed]
  31. Rousanoglou, E.; Noutsos, K.; Bayios, I.; Boudolos, K. Ground reaction forces and throwing performance in elite and novice players in two types of handball shot. J. Hum. Kinet. 2014, 40, 49–55. [Google Scholar] [CrossRef] [PubMed]
  32. Tata, O.; Emmanouil, A.; Barzouka, K.; Boudolos, K.; Rousanoglou, E. Does the selected segment within a two-legged hopping trial alter leg stiffness and kinetic performance values and their variability? Methods Protoc. 2025, 8, 152. [Google Scholar] [CrossRef] [PubMed]
  33. Cavanagh, P.R.; Rodgers, M.M. The arch index: A useful measure from footprints. J. Biomech. 1987, 20, 547–551. [Google Scholar] [CrossRef] [PubMed]
  34. Gathercole, R.J.; Sporer, B.C.; Stellingwerff, T.; Sleivert, G.G. Comparison of the capacity of different jump and sprint field tests to detect neuromuscular fatigue. J. Strength Cond. Res. 2015, 29, 2522–2531. [Google Scholar] [CrossRef] [PubMed]
  35. Dalleau, G.; Belli, A.; Viale, F.; Lacour, J.R.; Bourdin, M. A simple method for field measurements of leg stiffness in hopping. Int. J. Sports Med. 2004, 25, 170–176. [Google Scholar] [CrossRef] [PubMed]
  36. Demirbüken, I.; Yurdalan, S.U.; Savelberg, H.; Meijer, K. Gender specific strategies in demanding hopping conditions. J. Sports Sci. Med. 2009, 8, 265–270. [Google Scholar] [PubMed] [PubMed Central]
  37. Farley, C.T.; Blickhan, R.; Saito, J.; Taylor, C.R. Hopping frequency in humans: A test of how springs set stride frequency in bouncing gaits. J. Appl. Physiol. 1991, 71, 2127–2132. [Google Scholar] [CrossRef] [PubMed]
  38. Nozaradan, S.; Peretz, I.; Keller, P.E. Individual differences in rhythmic cortical entrainment correlate with predictive behavior in sensorimotor synchronization. Sci. Rep. 2016, 6, 20612. [Google Scholar] [CrossRef] [PubMed]
  39. Rousanoglou, E.N.; Boudolos, K.D. Rhythmic performance during a whole body movement: Dynamic analysis of force-time curves. Hum. Mov. Sci. 2006, 25, 393–408. [Google Scholar] [CrossRef] [PubMed]
  40. Okada, M. An electromyographic estimation of the relative muscular load in different human postures. J. Hum. Ergol. 1972, 1, 75–93. [Google Scholar] [CrossRef]
  41. Cram, J.R.; Kasman, G.S. Introduction to Surface Electromyography; Aspen Publishers: Gaithersburg, MD, USA, 1998. [Google Scholar]
  42. Beck, T.W.; Housh, T.J.; Cramer, J.T.; Weir, J.P.; Defreitas, J.M.; Mielke, M.; Palmer, T.B. Mechanomyographic amplitude and frequency responses during dynamic muscle actions: A comprehensive review. BioMed. Eng. Online 2005, 4, 67. [Google Scholar] [CrossRef] [PubMed]
  43. Ibitoye, M.O.; Hamzaid, N.A.; Zuniga, J.M.; Hasnan, N.; Wahab, A.K.A. Mechanomyographic parameter extraction methods: An appraisal for clinical applications. Sensors 2014, 14, 22940–22970. [Google Scholar] [CrossRef] [PubMed]
  44. Faul, F.; Erdfelder, E.; Lang, A.-G.; Buchner, A. G*Power 3: A flexible statistical power analysis program for the social, behavioral, and biomedical sciences. Behav. Res. Methods 2007, 39, 175–191. [Google Scholar] [CrossRef] [PubMed]
  45. Wang, I.L.; Chen, Y.M.; Zhang, K.K.; Gou, M.; Li, J.Q.; Jiang, Y.H. Effects of the weight of shoes on calf muscle simulation. J. Foot Ankle Res. 2020, 13, 47. [Google Scholar] [CrossRef] [PubMed]
  46. Rabita, G.; Couturier, A.; Lambertz, D. Influence of training background on the relationships between plantarflexor intrinsic stiffness and overall musculoskeletal stiffness during hopping. Eur. J. Appl. Physiol. 2008, 103, 163–171. [Google Scholar] [CrossRef] [PubMed]
Figure 1. Experimental configuration and biomechanical data acquisition. (A) Biopac MP150 Vibromyography (VMG) transducer with U.S. quarter for scale. (B) Anatomical placement of the VMG transducer on the lateral head of the gastrocnemius muscle (arrow denotes sensor location). (C,D) Representative sagittal plane video frames during (C) barefoot and (D) shod two-legged hopping; participants maintained a standardized upright trunk posture and hand position to isolate vertical spring–mass dynamics. (E) The Chippaux-Smirak and footprint angle (a) indices used for arch type classification (their detailed calculation is described in Section 2.2).
Biomechanics 06 00060 g001
Figure 2. Representative time-series data during two-legged hopping. (Top): Vertical ground reaction force (Fz) with an inset detail of a single contact phase (T/2 = effective Fz duration, BW = body weight). The shaded area marks the first discarded 5 hops to avoid neuromuscular adaptation, followed by the 10 hops used to compute leg stiffness. The horizontal dotted line depicts body weight (BW) with the circles marking the effective Fz durations. Before hopping initiation, BW was recorded with the participant standing and then numerically subtracted (“zeroed”) in the acquisition software so that Fz during the flight phase appears as −1 BW. (Center): Filtered vibromyographic (VMG) signal of the lateral gastrocnemius muscle, processed with a dedicated VMG filter (AcqKnowledge), analogous to band-pass-filtered accelerometry used to isolate vibration-induced muscle displacements. (Bottom): Raw VMG signal of the lateral gastrocnemius sampled at 2000 Hz, prior to filtering and displacement/oscillation analysis. The temporal synchronization across all panels illustrates the correspondence between Fz and gastrocnemius activation.
Biomechanics 06 00060 g002
Figure 3. Means values and standard deviations for the absolute temporal metrics of hopping performance in the barefoot (grey bar) and the shod (blue bar) conditions. All differences between the shod and the barefoot conditions were non-significant (tcycle: −0.60%, p = 0.307, tcontact: −2.10%, p = 0.103, and tflight: −3.3%, p = 0.059, where 100% corresponds to the barefoot condition). ns = no significant.
Biomechanics 06 00060 g003
Figure 4. Relative timing metrics of hopping performance in the shod and the barefoot conditions. Top: tcontact and tflight relative to tcycle (100%). Bottom: effective force duration (T/2), as well as pre-T/2 and post-T/2 duration relative to tcontact (100%). The units of percentage difference are noted. * significant difference at p ≤ 0.05.
Biomechanics 06 00060 g004
Figure 5. (Left): Leg stiffness in kN/m. (Right): Gastrocnemius muscle (GM) activation in g. Data is presented as mean values and standard deviations in the barefoot (grey bars) and the shod (blue bars) conditions. The percentage (%) of difference between the barefoot (100%) (grey bars) and the shod (blue bars) conditions is also noted. * significant difference at p ≤ 0.05.
Biomechanics 06 00060 g005
Table 1. Characteristics of the participants. Mean ± SD (%CV), homogeneity test (Levene) and one-way Anova statistics for among group comparison.
Volleyball
(VB)
Basketball
(BB)
Handball
(HB)
TotalLevene
(p Value)
ANOVAPost Hoc
(p Value)
F (df 2, 41)
(p Value)
Effect
Size
VB
vs.
BB
VB
vs.
HB
BB
vs.
HB
Training
Experience (yrs)
14.4 ± 4.4
(30.7)
18.4 ± 6.2
(33.6)
10.4 ± 2.0
(18.9)
14.4 ± 5.5
(38.3)
4.467
(0.018) *
10.790
(0.520)
0.3180.1510.016 *0.001 *
Training
Frequency (days/week)
7 ± 1.8
(26.3)
8.1 ± 1.8
(22.2)
6 ± 0.6
(9.2)
7.0 ± 1.7
(24.4)
4.910
(0.013) *
6.680
(0.983)
0.2130.1890.2690.002 *
Body Height
(cm)
180. 5 ± 5.9
(3.3)
174.1 ± 9.6
(5.5)
172.7 ± 2.8
(1.6)
175.8 ± 7.4
(4.2)
8.497
(0.001) *
5.322
(<0.001)
0.1710.1120.001 *0.858
Body mass
(kg)
74.8 ± 7.8
(10.5)
69.8 ± 11.5
(16.4)
70.1 ± 9.0
(12.9)
71.6 ± 9.6
(13.4)
0.273
(0.762)
1.175
(<0.001)
0.0570.5400.6171.000
Lower
Extremity Length
(cm)
96 ± 4.5
(4.7)
87.8 ± 5.0
(5.7)
86.5 ± 2.0
(2.3)
90.1 ± 5.8
(6.4)
7.385
(0.002) *
22.143
(0.296)
0.502<0.001 *<0.001 *0.635
Thigh Length
(cm)
45.9 ± 4
(8.7)
43.6 ± 3.2
(7.3)
43.5 ± 1.1
(2.5)
44.3 ± 3.1
(7.1)
5.921
(0.006) *
2.736
(0.319)
0.0760.2390.1200.996
Tibia Length
(cm)
50.1 ± 2.3
(4.6)
44.3 ± 3.0
(6.8)
43 ± 1.2
(2.9)
45.8 ± 3.9
(8.4)
8.089 (0.001) *37.893
(0.003) *
0.6370.000 *0.000 *0.343
Foot arch classification indices
C.S.I. (%)31.6 ± 7.7
(24.5)
32.8 ± 7.5
(22.8)
34.6 ± 5.6
(16.3)
33.0 ± 7.0
(21.1)
0.230
(0.796)
0.665
(0.009) *
0.0331.0000.7771.000
FPA (°)50.6 ± 4.9
(9.6)
50.2 ± 7.1
(14.1)
50.5 ± 3.9
(7.7)
50.5 ± 5.3
(10.5)
1.875
(0.167)
0.018
(<0.001) *
0.0011.0001.0001.000
Note: * significant difference at p ≤ 0.05. Foot arch classification indices: (a) CSI (%): high arch, (0%), normal (0.1–29.9%), middle (30–39.9%), low (40–44.9%), flat (≥45%); (b) FPA (°): flat (0–29.9°), low (30–34.9°), middle (35–41°), normal (≥42°). If Levene’s test was non-significant (p > 0.05), Bonferroni post hoc comparisons were conducted, and eta-squared (η2) was reported as the effect size. If Levene’s test was significant (p < 0.05), the Games-Howell post hoc correction was used, and omega-squared (ω2) was reported as a less biased estimate of the effect size.
Disclaimer/Publisher’s Note: The statements, opinions and data contained in all publications are solely those of the individual author(s) and contributor(s) and not of MDPI and/or the editor(s). MDPI and/or the editor(s) disclaim responsibility for any injury to people or property resulting from any ideas, methods, instructions or products referred to in the content.