Article

Factor Analysis of Gait Parameters and Patient-Reported Outcome Measures in Women with Hip Osteoarthritis: A Pilot Study


1
Department of Rehabilitation, Kyushu University Hospital, Fukuoka 812-8582, Japan
2
Graduate School of Health Sciences, Yamagata Prefectural University of Health Sciences, Yamagata 990-2212, Japan
3
Department of Orthopedic Surgery, Graduate School of Medical Sciences, Kyushu University, Fukuoka 812-8582, Japan
*
Authors to whom correspondence should be addressed.
Biomechanics 2026, 6(2), 49; https://doi.org/10.3390/biomechanics6020049
Submission received: 4 April 2026 / Revised: 16 May 2026 / Accepted: 22 May 2026 / Published: 27 May 2026

Abstract

Background: Gait performance (spatiotemporal and kinetic parameters), physical function (range of motion [ROM] and muscle strength), quality of life (QOL), and other patient-reported outcome measures (PROMs) are interrelated in patients with hip osteoarthritis (HOA). However, the latent structure of these multifaceted factors remains unclear. Therefore, this study aimed to identify the latent factors underlying these multiple indices and investigate their associations. Methods: A total of 33 women with unilateral HOA were included in this study. Gait performance was evaluated using a three-dimensional motion analysis system to extract gait speed, step length, cadence, peak joint power for each phase (hip joint: H1peak–H3peak; ankle joint: A1peak–A2peak), and corresponding joint work (hip joint: H1work–H3work; ankle joint: A1work–A2work). Physical function was assessed by measuring the ROM and muscle strength of the hip and ankle on the affected side. Patient-reported QOL was assessed using the Japanese Orthopaedic Association Hip-Disease Evaluation Questionnaire (JHEQ). Factor analysis was performed, with the number of factors fixed at four. Results: The Kaiser–Meyer–Olkin measure was 0.64, indicating “mediocre” sampling adequacy. Factor 1 (comprehensive gait performance) included gait speed, step length, cadence, H2peak, H3peak, A1peak, and hip/ankle strength. Factor 2 (Lower Limb Support in Early Stance and Control of the Stance-to-Swing Transition) included H1peak, A2peak, H1work, A2work, and ankle dorsiflexion ROM. Factor 3 (functional relationship between the hip and ankle joints) included H2work, H3work, hip ROM, and ankle plantarflexion strength. Factor 4 represented the JHEQ subscales: Pain, Movement, and Mental. These four factors explained 73.21% of the total variance. Conclusions: Gait impairment in women with HOA exhibits a multidimensional factor structure encompassing physical function (muscle strength and ROM), biomechanical control of gait (joint power and work), and gait performance (spatiotemporal parameters). Furthermore, gait-related factors may constitute a domain independent of QOL as assessed by PROMs.

1. Introduction

Hip osteoarthritis (HOA) is a degenerative joint disease that frequently affects middle-aged and older individuals. In Japan, HOA is more prevalent among women than men [1,2], and the number of patients is on the rise [3]. HOA limits activities of daily living and reduces walking ability, thereby significantly impacting quality of life (QOL) [4,5]. Walking ability has been reported to be closely related to QOL [6,7].
Previous studies on the spatiotemporal parameters of walking ability have shown that individuals with HOA exhibit reduced gait speed [8,9,10] and step length [9,11,12] compared with healthy individuals. Furthermore, joint moments are widely measured as kinetic gait parameters and have been reported to be closely associated with pain, muscle weakness, and limited range of motion (ROM) [13,14,15,16,17,18]. Although joint moments are suitable for assessing mechanical loading characteristics at the individual joint level, their ability to directly evaluate motor control characteristics, such as propulsive and braking forces during gait, is limited. Conversely, joint power, calculated as the product of joint moment and angular velocity, is an index that can differentiate between energy generation (positive power) and absorption (negative power) by muscle groups [19]. Joint power enables the assessment of temporal and functional roles, such as whether muscles function as a propulsive source or contribute to braking and shock absorption [20,21]. Given that propulsion and braking in gait are achieved through coordination among lower limb joints, joint power is an essential metric for understanding gait strategies and inter-joint compensatory movements. Previous studies on individuals with HOA have reported that declines in hip joint function are associated with increased ankle joint involvement in maintaining propulsive force during gait [18,22]. Particularly, a trade-off relationship is thought to exist between power generation at the hip and ankle joints [23,24], whereby a decline in the hip’s propulsive function leads to a compensatory increase in power generation by the ankle plantar flexors to maintain gait propulsion. Conversely, knee joint power during walking primarily contributes to shock absorption [25]. It plays an important role in the loading response during the early stance phase [26,27] and transition to the swing phase [28]. However, its direct contribution to propulsion is considered relatively minor compared with hip and ankle joint power [29,30]. Therefore, an analysis focusing on hip and ankle joint power is necessary to elucidate gait propulsion strategies in individuals with HOA.
Recently, the importance of patient-reported outcome measures (PROMs) has been increasingly emphasized [31,32,33]. PROMs are subjective assessment tools that reflect individual QOL. Previous studies have reported that limited ROM and restrictions in activities of daily living are strongly associated with decreased satisfaction with treatment [34,35]. Although several studies have investigated the associations between muscle strength, spatiotemporal and kinetic gait parameters, and PROMs, with some reports indicating partial correlations [6,36,37], others have shown that the link between motor function improvement and PROMs is limited [38,39]. Consequently, no consensus has been reached on the relationship between objective metrics and subjective measures.
Previous studies have examined bivariate associations between various factors. However, these indices are multifaceted and interrelated. Therefore, fully capturing the complete clinical picture through individual analyses alone is difficult. Integrating the correlation structures among numerous indices and clarifying the common functional foundations underlying these parameter groups are crucial for a comprehensive understanding of gait impairment in HOA. However, to the best of our knowledge, no study has integrated these indices to examine their underlying structure. Therefore, this study aimed to simultaneously evaluate spatiotemporal parameters, kinetic parameters, motor function, and PROMs in women with HOA and explore the latent structure among these factors using factor analysis. For this purpose, these indices were conceptualized within a hierarchical framework comprising physical function (muscle strength and ROM), biomechanical control of gait (joint power and work), gait performance (spatiotemporal parameters), and QOL assessed by PROMs to examine the factor structure of these functional aspects. Notably, joint power and work are biomechanical indicators of energy generation and absorption during gait. Therefore, the analysis primarily focused on these parameters to interpret motor control characteristics. We hypothesized that joint power would reflect gait control functions and capture a dimension distinct from PROMs, which reflects QOL. Furthermore, these indices may be organized as separate or only partially overlapping latent functional characteristics.

2. Materials and Methods

2.1. Participants

A total of 33 women who were diagnosed with unilateral HOA at the Orthopedic Department of our hospital between August 2024 and October 2025 and admitted for total hip arthroplasty were included in this study (Table 1). The diagnosis and severity of HOA were determined by an orthopedic specialist with >10 years of clinical experience based on a comprehensive assessment of clinical symptoms and plain X-ray findings. HOA severity was determined using the Japanese Orthopaedic Association’s stage classification for hip osteoarthritis [40].
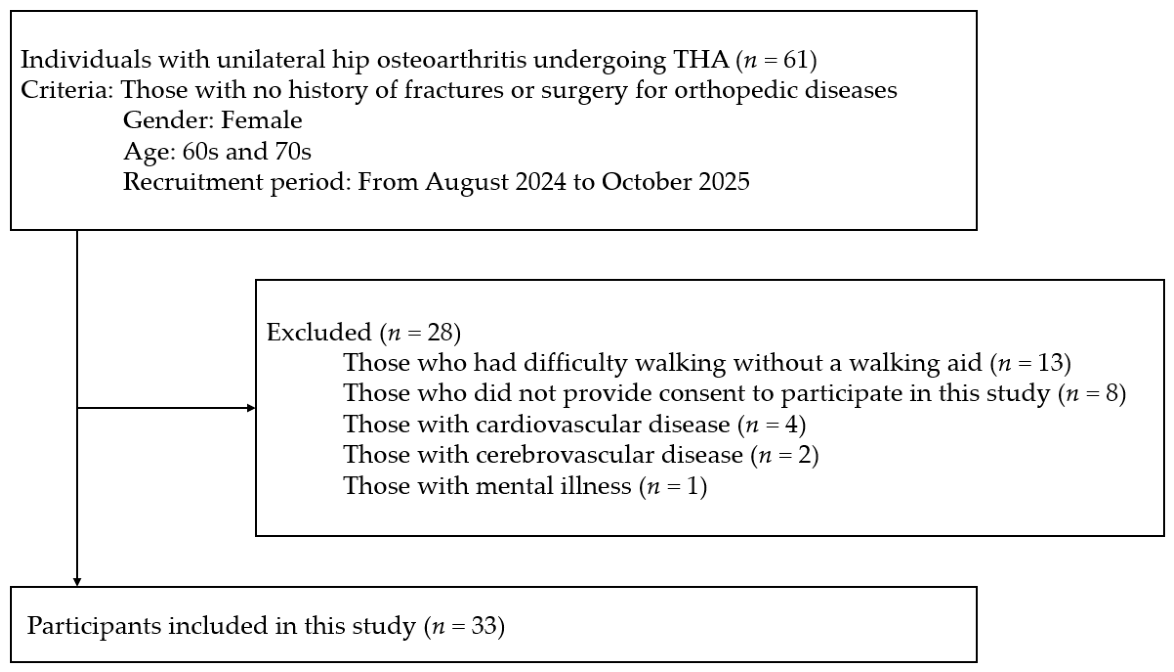
The inclusion criteria included women in their 60s and 70s with no history of fractures or surgery for orthopedic diseases. The exclusion criteria included women who had difficulty walking without a walking aid, those who did not provide consent to participate in this study, and those with cardiovascular, cerebrovascular, or psychiatric diseases (Figure 1). This study was approved by the Ethics Review Committee of Kyushu University Hospital (Approval No. 24087-00). The study’s purpose and methods were explained in writing to all participants, and consent was obtained before the study was conducted.

2.2. Tasks

Participants were instructed to walk 8 m in a straight line. The PROM was administered before gait measurement, whereas ROM and muscle strength measurements were performed after the gait assessment to avoid any influence on gait performance.

2.3. Measurement Procedures

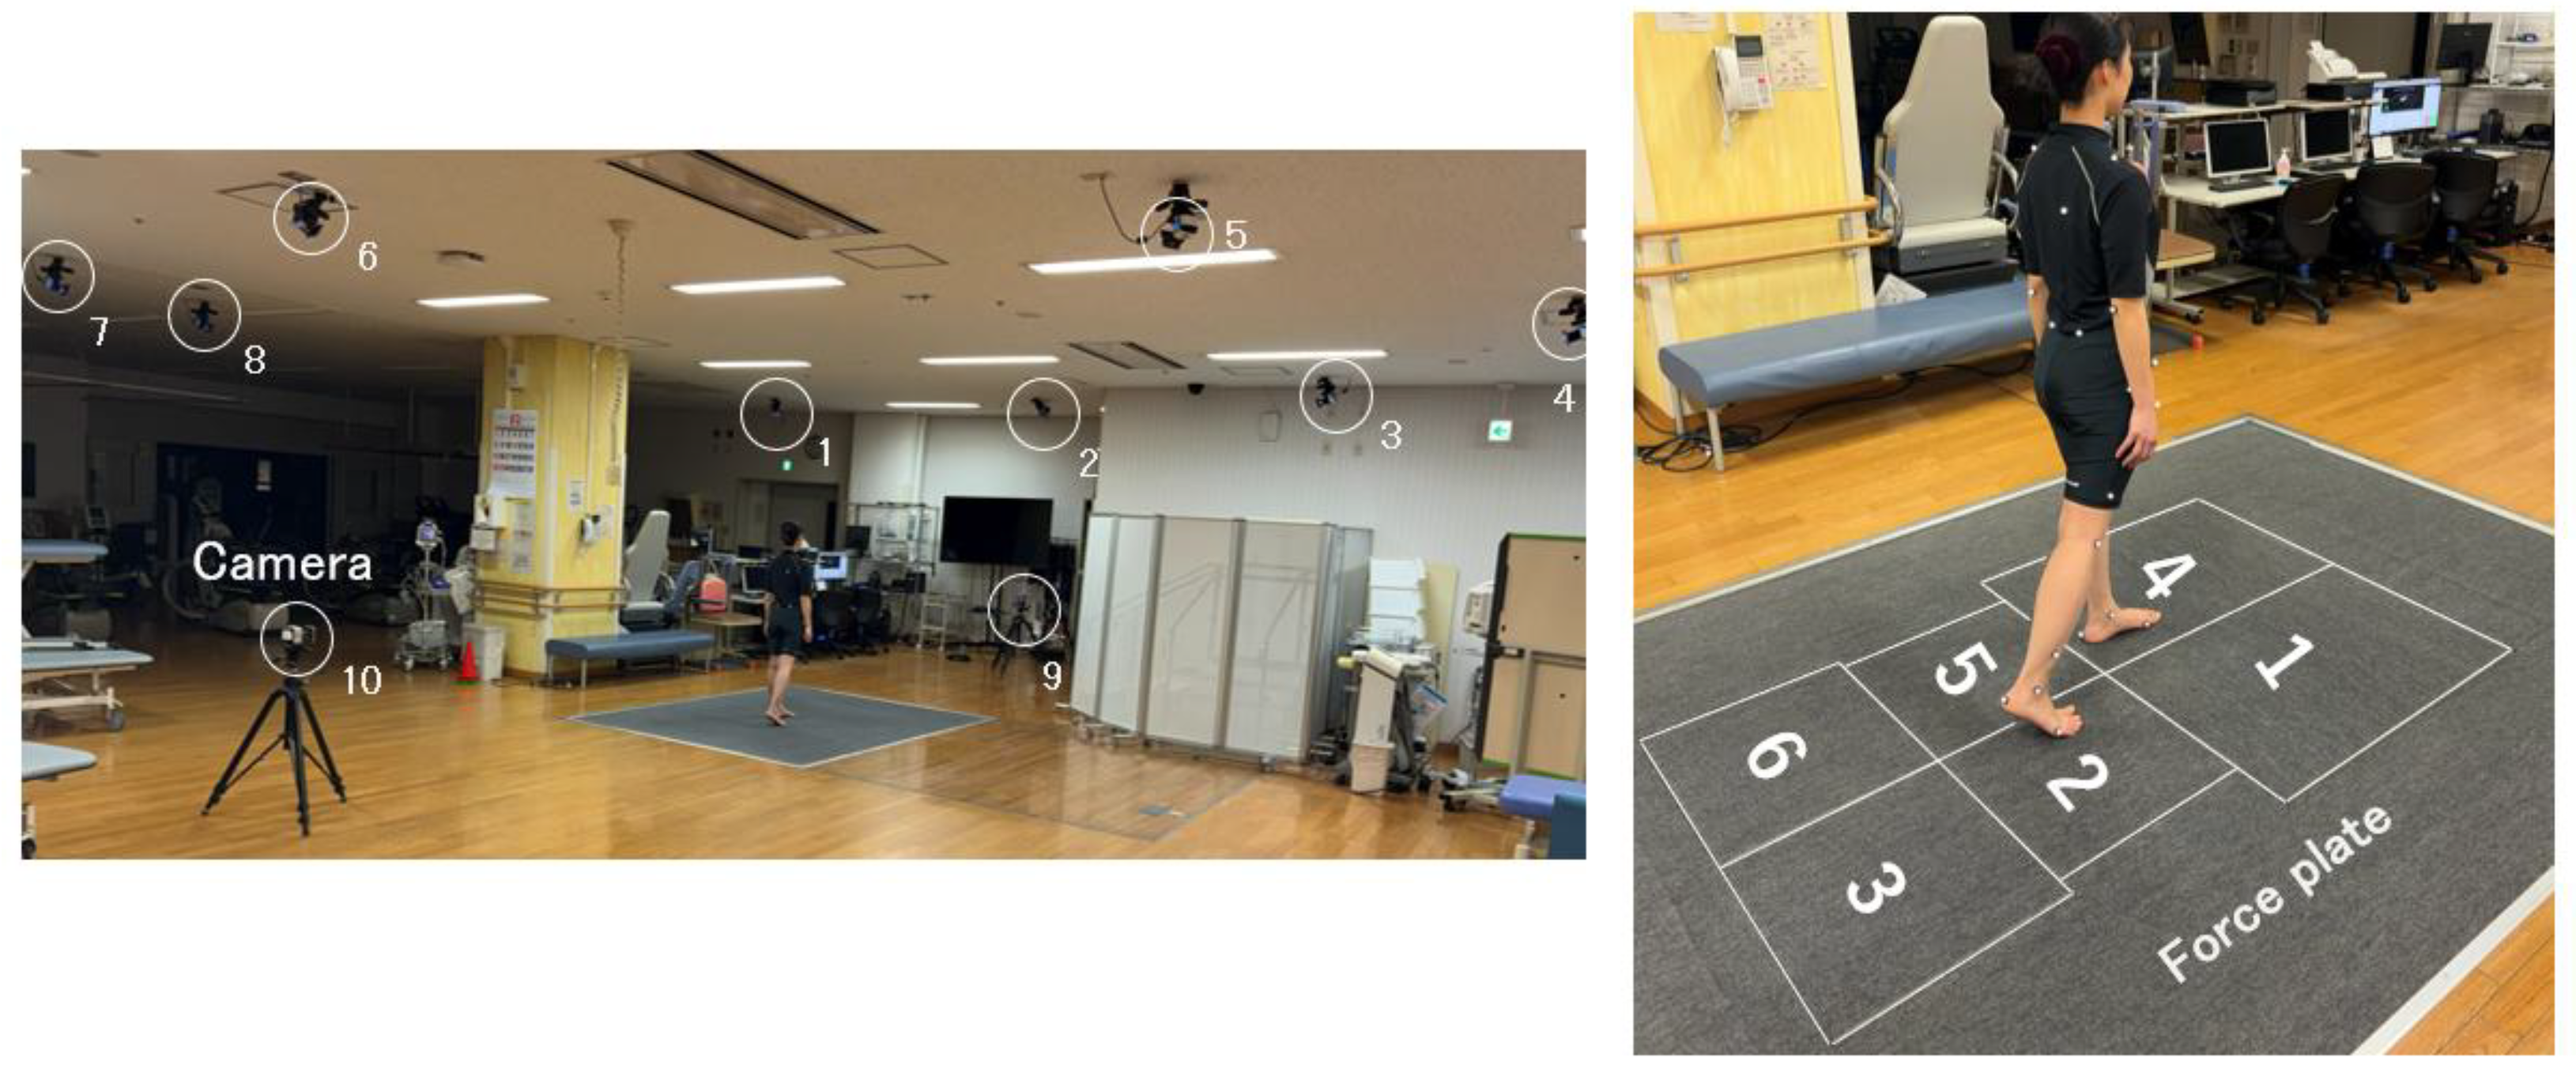
Kinetic data during gait were measured using an optical motion capture system. This system consisted of a three-dimensional motion analysis device equipped with 10 VICON MX-T infrared cameras (Vicon Motion Systems, Oxford, UK) and six force plates (Advanced Mechanical Technology, Waltham, MA, USA) (Figure 2). ROM was measured using a goniometer (OG Wellness, Okayama, Japan), and muscle strength was measured using a handheld dynamometer (Anima, Tokyo, Japan). The Japanese Orthopaedic Association Hip-Disease Evaluation Questionnaire (JHEQ) was used as a PROM [41,42].

2.3.1. Gait

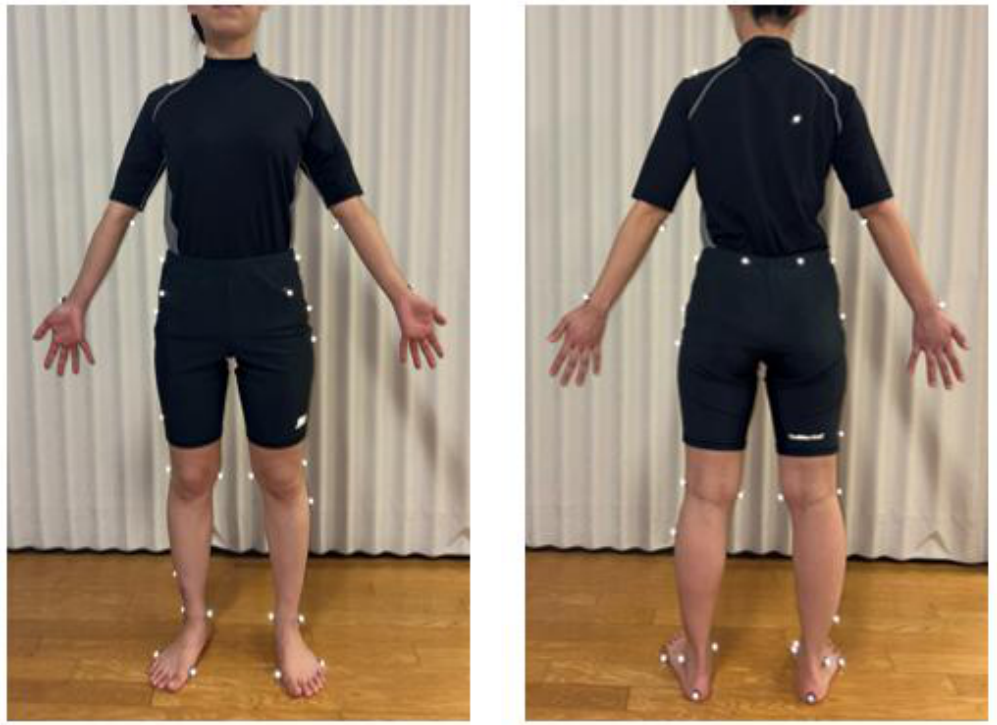
Motion capture was performed using a seven-segment rigid body model comprising the bilateral feet, shanks, thighs, and pelvis. The model was constructed using 33 infrared reflective markers (9.5 mm in diameter) attached to the participant’s body, following the method described by Kito et al. [43] (Figure 3). The sampling frequency of the three-dimensional motion analysis device and force plates was set at 100 Hz. Gait measurements were performed on an 8 m indoor level walkway consisting of a 3 m acceleration zone, a 2 m steady-state walking section, and a 3 m deceleration zone. Participants walked barefoot to eliminate the influence of footwear and were instructed to walk at a self-selected comfortable speed, ensuring that they did not step on the boundaries between the six force plates (three on each side). Six trials were recorded for each participant.

2.3.2. ROM

ROM for hip flexion, hip extension, and ankle dorsiflexion was measured on the affected side. Hip flexion and ankle dorsiflexion were assessed in the supine position, and hip extension was assessed in the prone position. Three measurements were performed for each motion for each participant.

2.3.3. Muscle Strength

Muscle strength was assessed through resistance exercises using maximal voluntary contraction, following the method described by Mentiplay et al. [44]. Measurements were performed on the affected side for hip flexion, hip extension, ankle dorsiflexion, and ankle plantar flexion. Hip flexion was measured in the seated position, hip extension was measured in the prone position, and ankle dorsiflexion and plantar flexion were measured in the supine position. A single measurement was taken for each muscle group to minimize fatigue and pain exacerbation. Three practice trials were performed at submaximal effort before the actual measurement.

2.3.4. JHEQ

The JHEQ is a PROM developed to assess the QOL of individuals with HOA. The JHEQ comprises a hip pain intensity scale and 20 items (Table 2). Hip pain intensity was evaluated using a visual analog scale (VAS), with scores categorized into five levels: 4 points for ≤20 mm, 3 points for 21–40 mm, 2 points for 41–60 mm, 1 point for 61–80 mm, and 0 points for >80 mm. The 20 items are rated on a five-point scale ranging from 0 to 4, with 0 indicating “strongly agree,” 1 indicating “agree,” 2 indicating “uncertain,” 3 indicating “disagree,” and 4 indicating “strongly disagree.” The JHEQ comprises three subscales: Pain (VAS and Q1–6), Movement (Q7–13), and Mental (Q14–20). The maximum score for each subscale is 28, and the total score is 84. The higher the scores, the better the QOL [41,42].

2.4. Data Analysis

The analyzed variables included spatiotemporal gait parameters [gait speed (m/s), step length (m), and cadence (steps/min)]; kinetic gait parameters [hip flexion/extension joint power, ankle plantar flexion/dorsiflexion joint power (W/kg), and hip flexion/extension joint work, ankle plantar flexion/dorsiflexion joint work (J/kg)]; ROM on the operated side [hip flexion/extension, and ankle dorsiflexion (°)]; muscle strength on the operated side [hip flexion/extension, ankle dorsiflexion/plantar flexion (Nm/kg)]; and the PROM scores assessed using the three JHEQ subscales—Pain, Movement, and Mental (0–28 points each).

2.4.1. Gait Data Analysis

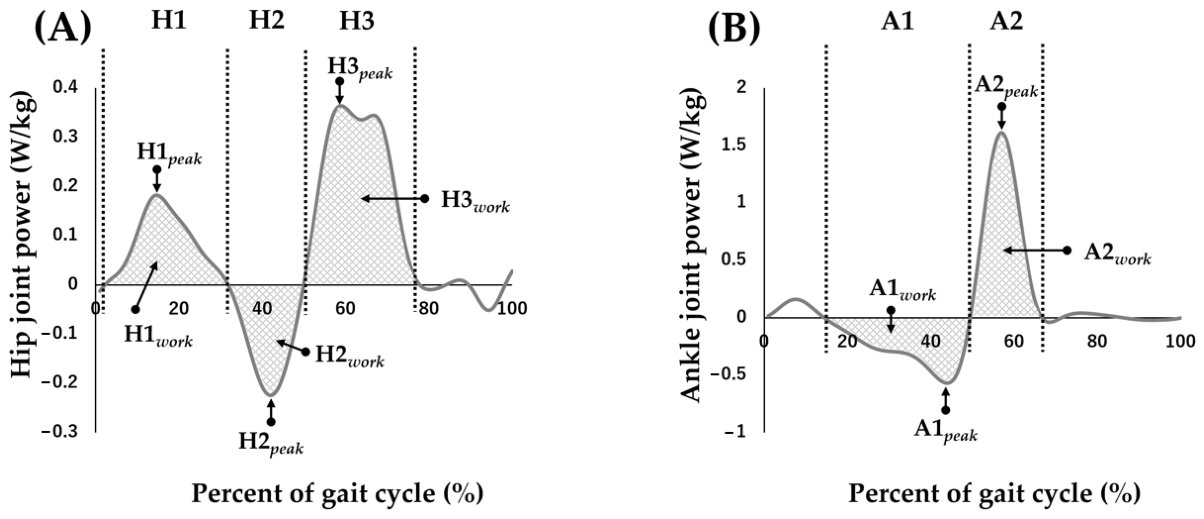
Gait parameters, including gait speed, step length, cadence, hip flexion and extension joint power, ankle plantar flexion and dorsiflexion joint power, and hip and ankle joint work, were calculated using Vicon Nexus version 2.12 (Vicon Motion Systems, Oxford, UK). The marker coordinate and ground reaction force data were filtered before data processing using low-pass Butterworth filters with cutoff frequencies of 6 and 10 Hz, respectively, to reduce noise [18,45]. The analyzed interval covered one gait cycle beginning with the initial contact of the affected side. The initial contact was defined as the time point at which the vertical ground reaction force exceeded 20 N [46]. Since hip and ankle power reflect the distinct functional roles of muscle groups during the gait cycle, the characteristic peak values for energy generation (positive power) and absorption (negative power) in each phase (H1peak–H3peak and A1peak–A2peak) were defined based on the nomenclature of Winter et al. [18,47] (Figure 4). The peak values were manually identified and extracted using spreadsheet software (Excel; Microsoft, Redmond, WA, USA). Additionally, all waveforms were visually inspected, and the data were reevaluated and corrected when an obvious detection error was suspected. The joint power values were normalized to the body weight. Furthermore, joint work (H1work–H3work and A1work–A2work) was calculated by time-integrating the power values over each respective phase. Particularly, it was calculated as the time integral of the joint power curve for each phase (i.e., the integral of the power–time curve) and treated as a signed value, with positive values indicating energy generation and negative values indicating energy absorption, without conversion to absolute values. Of the six trials recorded, three that captured the gait cycle of the affected side without any errors were selected, and the mean of these trials was used as the representative value for each parameter.

2.4.2. ROM Data Processing

The mean of three measurements for each movement direction was used as the representative value.

2.4.3. Muscle Strength Data Processing

The distance from the manual resistance site to the anatomical landmarks, the greater trochanter for the hip and the lateral malleolus for the ankle, was measured and defined as the moment arm length to determine muscle strength as a joint moment [48,49]. The joint moment was calculated by multiplying the measured force by this distance and normalizing it to the body weight. A single measurement for each muscle was used as the representative value.

2.4.4. JHEQ Score Calculation

The JHEQ subscale scores (Pain, Movement, and Mental) were calculated and used as representative values for subsequent statistical analyses.

2.5. Statistical Analysis

Factor analysis was performed to extract the latent factors underlying each parameter. The principal axis factoring was used for the factor extraction.
Let Z be the data matrix of the standardized p variables to be analyzed as shown in Equation (1), where Z is the standardized observed data matrix and n is the sample size. The correlation matrix R is defined by Equation (2), where T denotes the transpose. Each observed variable is assumed to consist of common factors and unique factors, and the common factor model is expressed by Equation (3), where F represents the common factor matrix, A the factor loading matrix, and ε the unique factors. The correlation structure is expressed by Equation (4), where Ψ is a diagonal matrix whose diagonal elements represent the unique variances.
Z = z 11 z 12 … z 1 p ⋮ ⋮ ⋮ z n 1 z n 2 … z n p
R = 1 n − 1 Z T Z
Z = F A T + ε
R = A A T + Ψ
An orthogonal rotation (Varimax rotation) was applied to enhance interpretability. Varimax rotation orthogonally transforms the factor axes to maximize the variance of factor loadings. The criteria of eigenvalues > 1.0 (Kaiser criterion) [50] and the shape of the scree plot were comprehensively evaluated to determine the number of factors. Consequently, a four-factor model was determined to be the most appropriate. Therefore, the analysis was performed with the number of factors fixed at four. Factor scores were calculated using the regression method, which estimates the latent factor scores based on the standardized values of the observed variables and factor structure. No custom weighting was applied.
Sampling adequacy was evaluated using the Kaiser–Meyer–Olkin (KMO) test, and items with an absolute factor loading of ≥0.5 were considered to contribute significantly to the factor [51]. All statistical analyses were performed using IBM SPSS Statistics version 29.0 (IBM, Armonk, NY, USA).

3. Results

3.1. Measured Parameters

Table 3 shows the values of the measured parameters.

3.2. Factor Analysis

According to the established KMO criteria, a KMO value of ≥0.90 is considered marvelous, 0.80–0.89 is considered meritorious, 0.70–0.79 is considered middling, 0.60–0.69 is considered mediocre, 0.50–0.59 is considered miserable, and <0.50 is considered unacceptable [52]. In this study, the KMO measure of sampling adequacy was 0.64, indicating mediocre sampling adequacy. Furthermore, Bartlett’s test of sphericity was significant (p < 0.001), confirming that the correlation matrix was not an identity matrix. Table 4 shows the factor loadings for each parameter. Factor analysis revealed that the four identified factors accounted for 73.21% of the total variance. The variance explained by each factor was 37.36% for Factor 1, 15.24% for Factor 2, 10.94% for Factor 3, and 9.67% for Factor 4. Factor 1 included variables with factor loadings of ≥0.5: gait speed, step length, cadence, H2peak, H3peak, A1peak, hip flexion, hip extension, and ankle dorsiflexion strength. Factor 2 included H1peak, A2peak, H1work, A2work, and ankle dorsiflexion ROM. Factor 3 included H2work, H3work, hip flexion ROM, hip extension ROM, and ankle plantar flexion strength. Factor 4 comprised the JHEQ subscales (Pain, Movement, and Mental).

4. Discussion

In this study, factor analysis was performed to categorize a diverse range of metrics in individuals with HOA, including gait performance (spatiotemporal and kinetic parameters), physical function (ROM and muscle strength), and QOL (subjective satisfaction). The analysis identified four factors. Factor 1 represented comprehensive gait performance, Factor 2 reflected stance-phase control during gait, Factor 3 represented the functional relationship between the hip and ankle joints, and Factor 4 included indicators of QOL. These are the latent factors representing the multifaceted structure of gait performance, physical function, and subjective assessments in HOA. The significance of this study lies in the integrated organization of numerous correlated indices, clearly demonstrating the functional aspects shared by each parameter group. Furthermore, given that QOL was identified as a factor independent of gait performance and physical function, improvements in gait and physical function may not directly translate into enhanced subjective outcomes, underscoring the need for multifaceted evaluation.

4.1. Factor 1: Comprehensive Gait Performance

Factor 1 was characterized by high factor loadings on gait speed, step length, cadence, H2peak, H3peak, A1peak, hip flexion, hip extension, and ankle dorsiflexion strength. This factor exhibited a structure characterized by greater gait speed and step length alongside a lower cadence, reflecting a gait strategy based on a long step with a low cadence. Gait speed is generally determined by the product of step length and cadence [53]. However, these findings indicate that a gait strategy characterized by increased step length is associated with better gait performance in individuals with HOA.
Individuals with HOA exhibit reduced muscle strength around the hip joint compared with healthy individuals [54]. This impact has been reported to extend to muscle weakness throughout the affected lower limb [55]. Additionally, decreased lower limb muscle strength is associated with reduced gait speed, leading to mobility limitations during activities of daily living [56]. Therefore, Factor 1 strongly reflects lower limb muscle strength and constitutes the foundation of gait performance. Furthermore, Factor 1 shows high contributions from H2peak, H3peak, and A1peak. Conversely, given that the corresponding joint work does not contribute to Factor 1, this factor can be interpreted as primarily reflecting instantaneous energy generation and absorption capacity as a foundational metric of gait performance.
Regarding gait efficiency, the stretch-shortening cycle (SSC) of the hip and ankle flexors and extensors has been reported to reduce mechanical energy demand and enhance walking efficiency [57,58]. Particularly, H3peak contributes to the initiation of the swing phase [47,59], with much of its energy supplied by elastic energy stored during the preceding H2peak [19]. In this study, the high factor loadings of H2peak and H3peak indicate that Factor 1 reflects energy transfer mediated by the hip SSC during swing initiation. Conversely, although A1peak contributed to Factor 1, the contribution of the subsequent A2peak was minimal. This finding indicates that energy generation using the ankle SSC is less prominent than that using the hip SSC in individuals with HOA, indicating that the hip plays a more central role in gait control. Therefore, Factor 1 is interpreted as a comprehensive gait performance factor that determines gait speed by reflecting muscle-strength-based, hip-centered energy control mechanisms.

4.2. Factor 2: Lower Limb Support in Early Stance and Control of the Stance-to-Swing Transition

Factor 2 showed high factor loadings for H1peak, A2peak, H1work, A2work, and ankle dorsiflexion ROM. These parameters reflect functions related to lower limb support during early stance and control of the stance-to-swing transition.
H1peak is observed during early stance and has been reported to result from the concentric contraction of the hip extensors [47]. Since H1peak and H1work are indicators of hip stability during early stance [60], the hip joint contributes to stability through instantaneous energy generation and sustained work. Although A2peak is generally considered to reflect forward propulsion by the ankle [19,47], its association with ankle plantarflexion strength and gait speed was not strong in this study. However, A2peak plays a role in facilitating knee flexion through ankle plantarflexion to control the stance-to-swing transition and generating propulsive force [61]. In this study, the contribution of A2peak and A2work to Factor 2 indicates their involvement in regulating the transition from the late stance to the swing phase, mediated not only by instantaneous joint power but also by sustained joint work.
Schmitt et al. [22] reported that individuals with HOA tend to exhibit increased ankle dorsiflexion during late stance, whereas Mueller et al. [62] reported a strong correlation between ankle dorsiflexion ROM and ankle power. In this study, the contribution of ankle dorsiflexion ROM to Factor 2 indicates that it is a crucial element in facilitating the output of ankle joint power and work, thereby supporting the transition from the late stance to the swing phase. Factor 2 captures hip stabilization during early stance and stance-to-swing transition regulation via ankle function from the perspectives of joint power and work.

4.3. Factor 3: Functional Relationship Between the Hip and Ankle Joints

Factor 3 showed high factor loadings for hip flexion and extension ROM, ankle plantarflexion strength, H2work, and H3work. H2work represents energy absorption (negative value). In this study, its factor loading was negative (−0.704), indicating that higher factor scores correspond to H2work values moving toward zero, representing a decrease in the absolute magnitude of energy absorption. Therefore, this factor may be associated with diminished energy absorption by the hip flexors after mid-stance [63]. Conversely, H3work represents energy production (positive value). It had a positive factor loading (0.763), indicating that higher factor scores are associated with greater energy production during early swing.
The extraction of joint work rather than joint power is a defining characteristic of Factor 3. Although joint power indicates the peak of instantaneous energy generation or absorption, joint work reflects the cumulative energy over a specific phase of the gait cycle [24,64]. Therefore, Factor 3 captures alterations in cumulative energy utilization patterns from late stance to early swing rather than the magnitude of instantaneous energy output. This indicates a potential shift in the balance between energy absorption and production within the hip SSC during the transition from late stance to early swing [65].
Limitations in hip flexion and extension ROM have been observed in individuals with HOA [13,66], and a decrease in the hip flexion moment from mid-stance onward has been reported [13]. Furthermore, a complementary trade-off relationship has been reported between the hip flexion and ankle plantarflexion moments during the transition from late stance to early swing [18,23,24,67]. Previous studies have shown that reduced hip function in individuals with HOA is associated with increased involvement of the ankle plantar flexors [18,23,68]. In this study, the inclusion of ankle plantarflexion strength in Factor 3 demonstrates a pattern consistent with these findings, and this factor is interpreted as reflecting the reciprocal involvement of hip swing initiation and ankle function. However, no definitive conclusion can be drawn on whether these relationships represent a direct compensatory mechanism due to the cross-sectional nature of the study.

4.4. Factor 4: QOL

Factor 4 showed high factor loadings for the three JHEQ subscales (Pain, Movement, and Mental), which were extracted independently of the spatiotemporal gait parameters, kinetic gait parameters, and physical function indicators. The PROM is an indicator for assessing treatment efficacy, including pain and postoperative satisfaction, and is a comprehensive measure of QOL [41,69,70,71]. The composition of Factor 4, as measured by the JHEQ subscales, indicates that it reflects subjectively perceived symptoms, functional difficulties in daily life, and psychological aspects in individuals with HOA. Furthermore, the fact that this factor emerged as a latent structure independent of objective gait performance, such as gait speed and joint power, and physical function metrics indicates that improvements in gait and physical function do not necessarily coincide with QOL enhancements for individuals with HOA. Treatment efficacy may not adequately reflect patients’ actual living experience and satisfaction if evaluated solely based on improvements in gait ability, muscle strength, and ROM. Therefore, objective functional assessments and subjective evaluations capture distinct dimensions of the patient experience, highlighting the clinical importance of using both in a comprehensive evaluation. Previous studies have shown that psychosocial factors, such as pain catastrophizing [72], kinesiophobia [73], and social roles or living environments [74], mediate the relationship between physical function and QOL. Although these factors were not evaluated in this study, they represent underlying variables that may influence this relationship and should be considered in future studies.

4.5. Comprehensive Interpretation of the Factor Structure

In this study, the peak joint power and joint work for the same joint were extracted as distinct factors. For instance, H2peak contributed to Factor 1, whereas H2work contributed to Factor 3, indicating that peak power and work possess different structural characteristics. These findings indicate that the instantaneous energy generation/absorption capacity (peak power) and the cumulative energy utilization over a specific duration (work) are not necessarily governed by the same motor control mechanisms. Peak joint power reflects the maximal energy output capability over a short duration and depends primarily on instantaneous neuromuscular control strategies, such as muscle contraction velocity characteristics and the recruitment patterns of high-threshold motor units [75,76]. Conversely, joint work reflects the total energy expenditure during a specific phase of the gait cycle [29,77] and is influenced by factors such as the sustained activity of low-to-medium-threshold motor units [78]. Therefore, peak power and work reflect energy control characteristics at different time scales and may possess distinct components within neuromuscular control strategies.
In this study, A1work did not exhibit an absolute factor loading of ≥0.5 on any factor and did not belong to a specific factor. This finding indicates that A1work reflects composite elements that are difficult to explain through a single functional characteristic compared with other indices. The early stance phase corresponding to A1work is a transition phase in which shock absorption, load response, and preparation for propulsion overlap [27,79] and is characterized by the simultaneous involvement of multiple motor functions [80]. Therefore, it may reflect data on temporal and functional scales that differ from those captured by the factors extracted in this study. The factor structure in this study underscores the importance of evaluating energy control in gait from the distinct perspectives of “instantaneous output characteristics” and “cumulative energy utilization” and indicates that A1work possesses multifaceted characteristics that are not fully captured within this framework.

4.6. Limitations and Future Directions

This study has several limitations. First, this was a pilot study with a relatively small sample size. The measure of sampling adequacy was 0.64, which was classified as “mediocre” based on the established criteria. Although acceptable, it cannot be considered sufficiently high. Generally, a sample size ranging from 3 to 20 times the number of variables is recommended for factor analysis [81]. However, this study did not meet this criterion. In particular, the subject-to-variable ratio was substantially below commonly recommended levels for stable factor analysis. Consequently, the extracted factor structure may be sample-dependent, imposing constraints on the stability and reproducibility of the results. Therefore, further studies with larger sample sizes are needed to verify the stability of the factor structure extracted in this study. Second, this study was limited to women in their 60s and 70s with unilateral advanced or terminal-stage HOA. Therefore, caution should be exercised when generalizing the findings to different sexes, age groups, and bilateral cases. Additionally, differences in disease severity may influence joint function, pain, and inter-joint coordination strategies. Therefore, future studies should include a more diverse population with varying disease severity. Third, the study’s cross-sectional design precludes the determination of causal relationships between factors. Longitudinal studies are needed to clarify whether hip dysfunction is associated with altered ankle motor strategies and whether these adaptations contribute to secondary functional changes. Fourth, although the analysis focused primarily on joint power, direct evaluations of neuromuscular activity, such as electromyographic analysis, were not performed. Therefore, the extent to which the extracted factors correspond to the actual muscle activation patterns remains unclear. Fifth, muscle strength measurements were based on a single maximum effort trial. Although this clinically practical approach was adopted to minimize participant pain and fatigue, a single-trial measurement is susceptible to variability, potentially compromising the reliability of the assessment. Consequently, the muscle strength indices may be subject to measurement error. Therefore, caution should be exercised when interpreting the results.
In light of these limitations, future studies should verify the factor structure’s reproducibility by increasing sample size and population diversity, clarify causal relationships through longitudinal studies, and conduct comprehensive analyses, including muscle activity assessment and validation of the reliability of various assessment indices, such as muscle strength. Such efforts can further clarify the relationship between gait strategies and QOL in patients with HOA.

5. Conclusions

This study comprehensively evaluated the spatiotemporal and kinetic gait parameters, physical function, and QOL in women with HOA to investigate the latent structure through factor analysis. The analysis identified four independent factors: comprehensive gait performance based on muscle strength and hip-dominant energy control; stance control functions, including the stance-to-swing transition; the functional relationship between the hip and ankle joints; and subjective QOL. These findings indicate that gait impairment in women with HOA exhibits a multidimensional factor structure encompassing physical function (muscle strength and ROM), biomechanical control of gait (joint power and work), and gait performance (spatiotemporal parameters). Furthermore, gait-related factors constitute a domain independent of patient-reported QOL assessed by the PROM. These findings support our hypothesis that joint power is structured into multiple functional factors, whereas the PROM is extracted as an independent factor from these objective measures. One crucial clinical implication of this study is that improvements in gait performance do not necessarily correlate with enhancements in patients’ subjective QOL. This finding underscores the importance of comprehensively evaluating physical function and the PROM as independent indices in future rehabilitation interventions. Larger-scale, multicenter, longitudinal studies are needed to verify the reproducibility of the factor structure obtained in this study.

Author Contributions

Y.N. (Yuki Nasu), S.H., T.F., K.O., T.T., K.K., Y.N. (Yasuharu Nakashima), N.M., T.S. and H.K. contributed to the conception and design of this study. Y.N. (Yuki Nasu) wrote the manuscript, and H.K. supervised and advised on data analysis and contributed to the interpretation of the results. All authors have read and agreed to the published version of the manuscript.

Funding

This research received no external funding.

Institutional Review Board Statement

This study was approved by the Ethics Committee of Kyushu University Hospital (Approval No. 24087-00). The participants received a detailed description of the study, including a brief description of the protocol. Before participation, the participants provided written informed consent. The participants confirmed that participation was voluntary and understood that they could withdraw from the study at any time without penalty. They also understood that the study adhered to the ethical principles outlined in the Declaration of Helsinki.

Informed Consent Statement

Informed consent was obtained from all study participants. After the initial screening, consent was provided by the participants to participate in this study.

Data Availability Statement

The original data presented in this study are publicly available in the institutional repository of Yamagata Prefectural University of Health Sciences, at https://yachts.repo.nii.ac.jp/records/2000147 (accessed on 13 May 2026).

Acknowledgments

The author gratefully acknowledges the contributions of the co-authors and all study participants. Special thanks are due to Hiroshi Katoh for his extensive guidance in research planning, data analysis, and manuscript drafting.

Conflicts of Interest

The authors declare no conflicts of interest.

Abbreviations

The following abbreviations are used in this manuscript:
HOAhip osteoarthritis
QOLquality of life
ROMrange of motion
PROMspatient-reported outcome measures
THAtotal hip arthroplasty
JHEQJapanese Orthopaedic Association Hip-Disease Evaluation Questionnaire
VASvisual analogue scale
KMOKaiser–Meyer–Olkin
SSCstretch-shortening cycle

References

  1. Sato, T.; Yamate, S.; Utsunomiya, T.; Inaba, Y.; Ike, H.; Kinoshita, K.; Doi, K.; Kawano, T.; Shiomoto, K.; Hara, T.; et al. Life Course Epidemiology of Hip Osteoarthritis in Japan: A Multicenter, Cross-Sectional Study. J. Bone Jt. Surg. Am. 2024, 106, 966–975. [Google Scholar] [CrossRef] [Scilit]
  2. Sato, T.; Yamaguchi, R.; Utsunomiya, T.; Inaba, Y.; Ike, H.; Kinoshita, K.; Doi, K.; Kawano, T.; Shiomoto, K.; Hara, T.; et al. Etiology and clinical trends in hip osteoarthritis in Japan: Insights from a multicenter cross-sectional study. J. Orthop. Sci. 2025, 31, 187–193. [Google Scholar] [CrossRef] [Scilit]
  3. GBD 2021 Osteoarthritis Collaborators. Global, regional, and national burden of osteoarthritis, 1990–2020 and projections to 2050: A systematic analysis for the Global Burden of Disease Study 2021. Lancet Rheumatol. 2023, 5, e508–e522. [Google Scholar] [CrossRef] [Scilit]
  4. Shinonaga, A.; Tanaka, S.; Tsuru, T.; Sato, Y.; Taguchi, M.; Takane, R. Does self-reported physical activity relate to physical function and walking ability in female patients with hip osteoarthritis? A cross-sectional multicenter study. Physiother. Theory Pract. 2025, 41, 299–308. [Google Scholar] [CrossRef] [Scilit] [PubMed]
  5. Hawker, G.A. Osteoarthritis is a serious disease. Clin. Exp. Rheumatol. 2019, 37, 3–6. [Google Scholar]
  6. Rosenlund, S.; Holsgaard-Larsen, A.; Overgaard, S.; Jensen, C. The Gait Deviation Index Is Associated with Hip Muscle Strength and Patient-Reported Outcome in Patients with Severe Hip Osteoarthritis-A Cross-Sectional Study. PLoS ONE 2016, 11, e0153177. [Google Scholar] [CrossRef] [Scilit] [PubMed]
  7. Riglet, L.; Bourredjem, A.; Laroche, D.; Benguella, L.; Binquet, C.; Maillefert, J.F.; Ornetti, P.; Gueugnon, M. Hip disability and Osteoarthritis Outcome Score trajectories and prognostic factors for functional decline: A 3-year follow-up study. Ann. Phys. Rehabil. Med. 2025, 68, 101893. [Google Scholar] [CrossRef] [Scilit]
  8. Miura, N.; Nagai, K.; Tagomori, K.; Ikutomo, H.; Okamura, K.; Okuno, T.; Nakagawa, N.; Masuhara, K. Plantar pressure distribution during standing in women with end-stage hip osteoarthritis. Gait Posture 2020, 76, 39–43. [Google Scholar] [CrossRef] [Scilit] [PubMed]
  9. Ritsuno, Y.; Morita, M.; Mukaino, M.; Otsuka, K.; Kanaji, A.; Yamada, J.; Saitoh, E.; Matsumoto, M.; Nakamura, M.; Otaka, Y.; et al. Determinants of Gait Parameters in Patients With Severe Hip Osteoarthritis. Arch. Phys. Med. Rehabil. 2024, 105, 343–351. [Google Scholar] [CrossRef] [Scilit]
  10. Constantinou, M.; Barrett, R.; Brown, M.; Mills, P. Spatial-temporal gait characteristics in individuals with hip osteoarthritis: A systematic literature review and meta-analysis. J. Orthop. Sports Phys. Ther. 2014, 44, 291–B7. [Google Scholar] [CrossRef] [Scilit]
  11. Tateuchi, H.; Akiyama, H.; Goto, K.; So, K.; Kuroda, Y.; Ichihashi, N. Strategies for increasing gait speed in patients with hip osteoarthritis: Their clinical significance and effects on hip loading. Arthritis Res. Ther. 2021, 23, 129. [Google Scholar] [CrossRef] [Scilit] [PubMed]
  12. Kiko, Y.; Ogata, T.; Uchitomi, H.; Matsubara, M.; Miyake, Y.; Wada, Y. Three-dimensional foot trajectory in female patients with end-stage hip osteoarthritis during walking. Sci. Rep. 2022, 12, 9843. [Google Scholar] [CrossRef] [Scilit]
  13. Eitzen, I.; Fernandes, L.; Nordsletten, L.; Risberg, M.A. Sagittal plane gait characteristics in hip osteoarthritis patients with mild to moderate symptoms compared to healthy controls: A cross-sectional study. BMC Musculoskelet. Disord. 2012, 13, 258. [Google Scholar] [CrossRef] [Scilit]
  14. Constantinou, M.; Loureiro, A.; Carty, C.; Mills, P.; Barrett, R. Hip joint mechanics during walking in individuals with mild-to-moderate hip osteoarthritis. Gait Posture 2017, 53, 162–167. [Google Scholar] [CrossRef] [Scilit]
  15. Hurwitz, D.E.; Hulet, C.H.; Andriacchi, T.P.; Rosenberg, A.G.; Galante, J.O. Gait compensations in patients with osteoarthritis of the hip and their relationship to pain and passive hip motion. J. Orthop. Res. 1997, 15, 629–635. [Google Scholar] [CrossRef] [Scilit]
  16. Zeni, J., Jr.; Pozzi, F.; Abujaber, S.; Miller, L. Relationship between physical impairments and movement patterns during gait in patients with end-stage hip osteoarthritis. J. Orthop. Res. 2015, 33, 382–389. [Google Scholar] [CrossRef] [Scilit]
  17. Steingrebe, H.; Stetter, B.J.; Sell, S.; Stein, T. Effects of Hip Bracing on Gait Biomechanics, Pain and Function in Subjects With Mild to Moderate Hip Osteoarthritis. Front. Bioeng. Biotechnol. 2022, 10, 888775. [Google Scholar] [CrossRef] [Scilit]
  18. Tateuchi, H.; Tsukagoshi, R.; Fukumoto, Y.; Oda, S.; Ichihashi, N. Immediate effects of different ankle pushoff instructions during walking exercise on hip kinematics and kinetics in individuals with total hip arthroplasty. Gait Posture 2011, 33, 609–614. [Google Scholar] [CrossRef] [Scilit]
  19. Whittington, B.; Silder, A.; Heiderscheit, B.; Thelen, D.G. The contribution of passive-elastic mechanisms to lower extremity joint kinetics during human walking. Gait Posture 2008, 27, 628–634. [Google Scholar] [CrossRef] [Scilit] [PubMed]
  20. Siegel, K.L.; Kepple, T.M.; Stanhope, S.J. Joint moment control of mechanical energy flow during normal gait. Gait Posture 2004, 19, 69–75. [Google Scholar] [CrossRef] [Scilit] [PubMed]
  21. Hu, Z.; Ren, L.; Hu, D.; Gao, Y.; Wei, G.; Qian, Z.; Wang, K. Speed-Related Energy Flow and Joint Function Change During Human Walking. Front. Bioeng. Biotechnol. 2021, 9, 666428. [Google Scholar] [CrossRef] [Scilit]
  22. Schmitt, D.; Vap, A.; Queen, R.M. Effect of end-stage hip, knee, and ankle osteoarthritis on walking mechanics. Gait Posture 2015, 42, 373–379. [Google Scholar] [CrossRef] [Scilit]
  23. Lewis, C.L.; Ferris, D.P. Walking with increased ankle pushoff decreases hip muscle moments. J. Biomech. 2008, 41, 2082–2089. [Google Scholar] [CrossRef] [Scilit] [PubMed]
  24. Kawaji, H.; Kojima, S. Ankle-hip joint trade-off in normal gait: Exploring the kinematic influence of the medial longitudinal arch of the foot. Gait Posture 2025, 116, 47–52. [Google Scholar] [CrossRef] [Scilit] [PubMed]
  25. Kanayama, A.; Minami, M.; Yamamoto, S.; Ohmine, T.; Fujiwara, M.; Murakami, T.; Okuno, S.; Ueba, R.; Iwata, A. Examination of the Impact of Strength and Velocity of the Knee and Ankle on Gait Speed in Community-Dwelling Older Adults. Healthcare 2022, 10, 2093. [Google Scholar] [CrossRef] [Scilit]
  26. Nagano, H.; Tatsumi, I.; Sarashina, E.; Sparrow, W.A.; Begg, R.K. Modelling knee flexion effects on joint power absorption and adduction moment. Knee 2015, 22, 490–493. [Google Scholar] [CrossRef] [Scilit]
  27. Toda, H. Loading rate during weight acceptance: Differential contributions of the knee and contralateral ankle with aging. Gait Posture 2026, 128, 110185. [Google Scholar] [CrossRef] [Scilit]
  28. Anderson, F.C.; Goldberg, S.R.; Pandy, M.G.; Delp, S.L. Contributions of muscle forces and toe-off kinematics to peak knee flexion during the swing phase of normal gait: An induced position analysis. J. Biomech. 2004, 37, 731–737. [Google Scholar] [CrossRef] [Scilit] [PubMed]
  29. Farris, D.J.; Sawicki, G.S. The mechanics and energetics of human walking and running: A joint level perspective. J. R. Soc. Interface 2012, 9, 110–118. [Google Scholar] [CrossRef] [Scilit]
  30. Montgomery, J.R.; Grabowski, A.M. The contributions of ankle, knee and hip joint work to individual leg work change during uphill and downhill walking over a range of speeds. R. Soc. Open Sci. 2018, 5, 180550. [Google Scholar] [CrossRef] [Scilit]
  31. Karimijashni, M.; Abtahi, F.; Abbasalipour, S.; Ranjbar, P.; Dabbagh, A.; Westby, M.; Ramsay, T.; Beaulé, P.E.; Poitras, S. Functional Patient-Reported Outcome Measures After Hip or Knee Arthroplasty: A Systematic Review and Content Analysis Using the International Classification of Functioning, Disability, and Health. Arthritis Care Res. 2024, 76, 1703–1722. [Google Scholar] [CrossRef] [Scilit]
  32. Lundgren-Nilsson, Å.; Dencker, A.; Palstam, A.; Person, G.; Horton, M.C.; Escorpizo, R.; Küçükdeveci, A.A.; Kutlay, S.; Elhan, A.H.; Stucki, G.; et al. Patient-reported outcome measures in osteoarthritis: A systematic search and review of their use and psychometric properties. RMD Open 2018, 4, e000715. [Google Scholar] [CrossRef] [Scilit]
  33. Stern, B.Z.; Pila, S.; Joseph, L.I.; Rothrock, N.E.; Franklin, P.D. Patients’ perspectives on the benefits of feedback on patient-reported outcome measures in a web-based personalized decision report for hip and knee osteoarthritis. BMC Musculoskelet. Disord. 2022, 23, 806. [Google Scholar] [CrossRef] [Scilit] [PubMed]
  34. Fukui, K.; Kaneuji, A.; Sugimori, T.; Ichiseki, T.; Matsumoto, T.; Hiejima, Y. Clinical assessment after total hip arthroplasty using the Japanese Orthopaedic Association Hip-Disease Evaluation Questionnaire. J. Orthop. 2015, 12, S31–S36. [Google Scholar] [CrossRef] [Scilit] [PubMed]
  35. Tanaka, H.; Yamada, N.; Kurishima, H.; Mori, Y.; Sakamoto, T.; Oyama, M. The intraoperative hip range of motion in total hip arthroplasty predicts postoperative patient’s satisfaction for cutting toenails and putting on sock. J. Orthop. Sci. 2022, 27, 1060–1066. [Google Scholar] [CrossRef] [Scilit] [PubMed]
  36. Kurihara, Y.; Ohsugi, H.; Matsuda, T.; Tosaka, T.; Endo, Y.; Tsuneizumi, Y.; Tsukeoka, T. Early postoperative relationship between patient-reported outcome measures and gait biomechanical factors after total hip arthroplasty. Gait Posture 2022, 91, 14–18. [Google Scholar] [CrossRef] [Scilit]
  37. Wu, T.; Lohse, K.R.; Van Dillen, L.; Song, K.; Clohisy, J.C.; Harris, M.D. Are Abnormal Muscle Biomechanics and Patient-reported Outcomes Associated in Patients With Hip Dysplasia? Clin. Orthop. Relat. Res. 2023, 481, 2380–2389. [Google Scholar] [CrossRef] [Scilit]
  38. Naili, J.E.; Hedström, M.; Broström, E.W. Changes of and interrelationships between performance-based function and gait and patient-reported function 1 year after total hip arthroplasty. J. Orthop. Traumatol. 2019, 20, 14. [Google Scholar] [CrossRef] [Scilit]
  39. Kannan, A.S.; Hartwell, M.J.; Grace, T.; Hammond, E.; Soriano, K.K.J.; Souza, R.B.; Zhang, A.L. Correlating Biomechanical Gait Analysis With Patient-Reported Outcomes After Hip Arthroscopy for Femoroacetabular Impingement Syndrome. Orthop. J. Sports Med. 2022, 10, 23259671221121352. [Google Scholar] [CrossRef] [Scilit]
  40. Yoshitani, J.; Nakamura, T.; Ueshima, K.; Ebara, H.; Kabata, T.; Tsuchiya, H. Reliability of radiographic evaluations of the stage of osteoarthritis of the hip joint and an approach to improve the staging criteria. J. Orthop. Sci. 2017, 22, 905–908. [Google Scholar] [CrossRef] [Scilit]
  41. Matsumoto, T.; Kaneuji, A.; Hiejima, Y.; Sugiyama, H.; Akiyama, H.; Atsumi, T.; Ishii, M.; Izumi, K.; Ichiseki, T.; Ito, H.; et al. Japanese Orthopaedic Association Hip Disease Evaluation Questionnaire (JHEQ): A patient-based evaluation tool for hip-joint disease. The Subcommittee on Hip Disease Evaluation of the Clinical Outcome Committee of the Japanese Orthopaedic Association. J. Orthop. Sci. 2012, 17, 25–38. [Google Scholar] [CrossRef] [Scilit] [PubMed]
  42. Seki, T.; Hasegawa, Y.; Ikeuchi, K.; Ishiguro, N.; Hiejima, Y. Reliability and validity of the Japanese Orthopaedic Association hip disease evaluation questionnaire (JHEQ) for patients with hip disease. J. Orthop. Sci. 2013, 18, 782–787. [Google Scholar] [CrossRef] [Scilit]
  43. Kito, N.; Shinkoda, K.; Yamasaki, T.; Kanemura, N.; Anan, M.; Okanishi, N.; Ozawa, J.; Moriyama, H. Contribution of knee adduction moment impulse to pain and disability in Japanese women with medial knee osteoarthritis. Clin. Biomech. 2010, 25, 914–919. [Google Scholar] [CrossRef] [Scilit] [PubMed]
  44. Mentiplay, B.F.; Perraton, L.G.; Bower, K.J.; Adair, B.; Pua, Y.H.; Williams, G.P.; McGaw, R.; Clark, R.A. Assessment of Lower Limb Muscle Strength and Power Using Hand-Held and Fixed Dynamometry: A Reliability and Validity Study. PLoS ONE 2015, 10, e0140822. [Google Scholar] [CrossRef] [Scilit] [PubMed]
  45. Matsuda, T.; Watanabe, J.; Sotokawa, T.; Shishime, T.; Katoh, H. Estimation of the External Knee Adduction Moment Using Inertial Measurement Unit Sensors on the Shank and Lower Back: A Pilot Study. J. Funct. Morphol. Kinesiol. 2025, 10, 356. [Google Scholar] [CrossRef] [Scilit]
  46. Lambrecht, S.; Harutyunyan, A.; Tanghe, K.; Afschrift, M.; De Schutter, J.; Jonkers, I. Real-Time Gait Event Detection Based on Kinematic Data Coupled to a Biomechanical Model. Sensors 2017, 17, 671. [Google Scholar] [CrossRef] [Scilit]
  47. Winter, D.A.; Eng, P. Kinetics: Our window into the goals and strategies of the central nervous system. Behav. Brain Res. 1995, 67, 111–120. [Google Scholar] [CrossRef] [Scilit]
  48. Awwad, D.H.; Buckley, J.D.; Thomson, R.L.; O’Connor, M.; Carbone, T.A.; Chehade, M.J. Testing the Hip Abductor Muscle Strength of Older Persons Using a Handheld Dynamometer. Geriatr. Orthop. Surg. Rehabil. 2017, 8, 166–172. [Google Scholar] [CrossRef] [Scilit]
  49. Eek, M.N.; Kroksmark, A.K.; Beckung, E. Isometric muscle torque in children 5 to 15 years of age: Normative data. Arch. Phys. Med. Rehabil. 2006, 87, 1091–1099. [Google Scholar] [CrossRef] [Scilit]
  50. Kaiser, H.F. The Application of Electronic Computers to Factor Analysis. Educ. Psychol. Meas. 1960, 20, 141–151. [Google Scholar] [CrossRef] [Scilit]
  51. Hagoort, I.; Vuillerme, N.; Hortobágyi, T.; Lamoth, C.J.C. Age and walking conditions differently affect domains of gait. Hum. Mov. Sci. 2023, 89, 103075. [Google Scholar] [CrossRef] [Scilit]
  52. Kaiser, H.F. An Index of Factorial Simplicity. Psychometrika 1974, 39, 31–36. [Google Scholar] [CrossRef] [Scilit]
  53. Egerton, T.; Danoudis, M.; Huxham, F.; Iansek, R. Central gait control mechanisms and the stride length-cadence relationship. Gait Posture 2011, 34, 178–182. [Google Scholar] [CrossRef] [Scilit]
  54. Loureiro, A.; Constantinou, M.; Diamond, L.E.; Beck, B.; Barrett, R. Individuals with mild-to-moderate hip osteoarthritis have lower limb muscle strength and volume deficits. BMC Musculoskelet. Disord. 2018, 19, 303. [Google Scholar] [CrossRef] [Scilit] [PubMed]
  55. Loureiro, A.; Mills, P.M.; Barrett, R.S. Muscle weakness in hip osteoarthritis: A systematic review. Arthritis Care Res. 2013, 65, 340–352. [Google Scholar] [CrossRef] [Scilit]
  56. LaRoche, D.P.; Millett, E.D.; Kralian, R.J. Low strength is related to diminished ground reaction forces and walking performance in older women. Gait Posture 2011, 33, 668–672. [Google Scholar] [CrossRef] [Scilit] [PubMed]
  57. Komi, P.V. Stretch-shortening cycle: A powerful model to study normal and fatigued muscle. J. Biomech. 2000, 33, 1197–1206. [Google Scholar] [CrossRef] [Scilit]
  58. Zelik, K.E.; Huang, T.W.; Adamczyk, P.G.; Kuo, A.D. The role of series ankle elasticity in bipedal walking. J. Theor. Biol. 2014, 346, 75–85. [Google Scholar] [CrossRef] [Scilit]
  59. McGibbon, C.A. Toward a better understanding of gait changes with age and disablement: Neuromuscular adaptation. Exerc. Sport Sci. Rev. 2003, 31, 102–108. [Google Scholar] [CrossRef] [Scilit]
  60. Beijersbergen, C.M.I.; Granacher, U.; Gäbler, M.; DeVita, P.; Hortobágyi, T. Hip mechanics underlie lower extremity power training-induced increase in old adults’ fast gait velocity: The Potsdam Gait Study (POGS). Gait Posture 2017, 52, 338–344. [Google Scholar] [CrossRef] [Scilit]
  61. Lipfert, S.W.; Günther, M.; Renjewski, D.; Seyfarth, A. Impulsive ankle push-off powers leg swing in human walking. J. Exp. Biol. 2014, 217, 1218–1228. [Google Scholar] [CrossRef] [Scilit]
  62. Mueller, M.J.; Minor, S.D.; Schaaf, J.A.; Strube, M.J.; Sahrmann, S.A. Relationship of plantar-flexor peak torque and dorsiflexion range of motion to kinetic variables during walking. Phys. Ther. 1995, 75, 684–693. [Google Scholar] [CrossRef] [Scilit]
  63. Zhong, L.; Kwong, P.W.; Zhang, J.J.; Sidarta, A.; Yu, C.C. Gait kinetics before and after total hip arthroplasty in people with unilateral hip osteoarthritis. PLoS ONE 2025, 20, e0326502. [Google Scholar] [CrossRef] [Scilit]
  64. Sasaki, K.; Neptune, R.R.; Kautz, S.A. The relationships between muscle, external, internal and joint mechanical work during normal walking. J. Exp. Biol. 2009, 212, 738–744. [Google Scholar] [CrossRef] [Scilit] [PubMed]
  65. Queen, R.M.; Sparling, T.L.; Schmitt, D. Hip, Knee, and Ankle Osteoarthritis Negatively Affects Mechanical Energy Exchange. Clin. Orthop. Relat. Res. 2016, 474, 2055–2063. [Google Scholar] [CrossRef] [Scilit] [PubMed]
  66. Porta, M.; Pau, M.; Leban, B.; Deidda, M.; Sorrentino, M.; Arippa, F.; Marongiu, G. Lower Limb Kinematics in Individuals with Hip Osteoarthritis during Gait: A Focus on Adaptative Strategies and Interlimb Symmetry. Bioengineering 2021, 8, 47. [Google Scholar] [CrossRef] [Scilit]
  67. Ishihara, M.; Higuchi, Y.; Yonetsu, R.; Kitajima, H. Plantarflexor training affects propulsive force generation during gait in children with spastic hemiplegic cerebral palsy: A pilot study. J. Phys. Ther. Sci. 2015, 27, 1283–1286. [Google Scholar] [CrossRef] [Scilit]
  68. Lewis, C.L.; Garibay, E.J. Effect of increased pushoff during gait on hip joint forces. J. Biomech. 2015, 48, 181–185. [Google Scholar] [CrossRef] [Scilit]
  69. Gwynne-Jones, D.P.; Sullivan, T.; Wilson, R.; Abbott, J.H. The Relationship Between Preoperative Oxford Hip and Knee Score and Change in Health-Related Quality of Life After Total Hip and Total Knee Arthroplasty: Can It Help Inform Rationing Decisions? Arthroplast. Today 2020, 6, 585–589.e581. [Google Scholar] [CrossRef] [Scilit]
  70. Iwasa, M.; Ando, W.; Uemura, K.; Hamada, H.; Takao, M.; Sugano, N. Association between magnitude of femoral head collapse and quality of life in patients with osteonecrosis of the femoral head. Mod. Rheumatol. 2023, 33, 416–421. [Google Scholar] [CrossRef] [Scilit]
  71. Vickery, N.J.; Fowler, A.J.; Prowle, J.; Pearse, R. Association between multimorbidity and quality of life after hip replacement surgery: Analysis of routinely collected patient-reported outcomes. Br. J. Anaesth. 2025, 134, 203–211. [Google Scholar] [CrossRef] [Scilit]
  72. Aalders, M.B.; van der List, J.P.; Keijser, L.C.M.; Temmerman, O.P.P.; Benner, J.L. The role of pain catastrophising on subjective function and pain following total hip arthroplasty: A prospective comparative study of 531 patients with 2-year follow-up. HIP Int. 2025, 35, 290–300. [Google Scholar] [CrossRef] [Scilit]
  73. Hidaka, R.; Tanaka, T.; Hashikura, K.; Oka, H.; Matsudaira, K.; Moro, T.; Matsuda, K.; Kawano, H.; Tanaka, S. Association of high kinesiophobia and pain catastrophizing with quality of life in severe hip osteoarthritis: A cross-sectional study. BMC Musculoskelet. Disord. 2023, 24, 388. [Google Scholar] [CrossRef] [Scilit]
  74. Rat, A.C.; Coste, J.; Pouchot, J.; Baumann, M.; Spitz, E.; Retel-Rude, N.; Le Quintrec, J.S.; Dumont-Fischer, D.; Guillemin, F. OAKHQOL: A new instrument to measure quality of life in knee and hip osteoarthritis. J. Clin. Epidemiol. 2005, 58, 47–55. [Google Scholar] [CrossRef] [Scilit]
  75. Cormie, P.; McGuigan, M.R.; Newton, R.U. Developing maximal neuromuscular power: Part 1—biological basis of maximal power production. Sports Med. 2011, 41, 17–38. [Google Scholar] [CrossRef] [Scilit]
  76. Reid, K.F.; Fielding, R.A. Skeletal muscle power: A critical determinant of physical functioning in older adults. Exerc. Sport Sci. Rev. 2012, 40, 4–12. [Google Scholar] [CrossRef] [Scilit]
  77. Teixeira-Salmela, L.F.; Nadeau, S.; Milot, M.H.; Gravel, D.; Requião, L.F. Effects of cadence on energy generation and absorption at lower extremity joints during gait. Clin. Biomech. 2008, 23, 769–778. [Google Scholar] [CrossRef] [Scilit]
  78. De Luca, C.J.; Contessa, P. Biomechanical benefits of the Onion-Skin motor unit control scheme. J. Biomech. 2015, 48, 195–203. [Google Scholar] [CrossRef] [Scilit]
  79. Kuo, A.D.; Donelan, J.M.; Ruina, A. Energetic consequences of walking like an inverted pendulum: Step-to-step transitions. Exerc. Sport Sci. Rev. 2005, 33, 88–97. [Google Scholar] [CrossRef] [Scilit]
  80. Worthen-Chaudhari, L.; Bing, J.; Schmiedeler, J.P.; Basso, D.M. A new look at an old problem: Defining weight acceptance in human walking. Gait Posture 2014, 39, 588–592. [Google Scholar] [CrossRef] [Scilit]
  81. Mundfrom, D.J.; Shaw, D.G.; Ke, T.L. Minimum Sample Size Recommendations for Conducting Factor Analyses. Int. J. Test. 2005, 5, 159–164. [Google Scholar] [CrossRef] [Scilit]
Figure 1. Flowchart of participant selection criteria.
Biomechanics 06 00049 g001
Figure 2. Measurement environment. Six force plates (numbered 1–6) were placed at the center of the walkway. The numbers in the figure indicate the position of each force plate. Participants were asked to walk unidirectionally along an 8 m straight walkway. The walkway was divided into a 3 m acceleration zone, a central 2 m steady-state walking zone, and a 3 m deceleration zone. The participants passed over the force plates during the steady-state walking zone. The stepping sequence on the force plates was standardized according to the measured limb. When the measured limb was the right lower extremity, participants stepped on force plates 3, 5, and 1; when the measured limb was the left lower extremity, they stepped on force plates 6, 2, and 4.
Biomechanics 06 00049 g002
Figure 3. Placement of the infrared reflective markers. Infrared reflecting markers were attached to 33 landmarks (i.e., left and right acromia, olecranon processes, styloid processes of the radius, superior edges of the iliac crests, anterior superior iliac spine, posterior superior iliac spine, the point 1/3 from the greater trochanter on the line connecting the greater trochanter and anterior superior iliac spine, thigh, lateral and medial epicondyles, shank, lateral and medial malleoli, calcaneal tuberosities, first and fifth metatarsal heads, and right scapula).
Biomechanics 06 00049 g003
Figure 4. Joint power for a representative participant during one gait cycle: (A) hip joint and (B) ankle joint. Positive and negative values indicate power production and absorption, respectively. H1, H2, and H3 represent hip extensor power production, hip flexor power absorption, and hip flexor power production, respectively. A1 and A2 correspond to ankle plantar flexor power absorption and production, respectively. H1peak–A2peak and H1work–A2work indicate the peak joint power and joint work for each phase, respectively.
Biomechanics 06 00049 g004
Table 1. Participants’ basic demographic characteristics (n = 33).
Age (years)68.8 ± 4.6
Height (cm)155.0 ± 5.1
Weight (kg)56.6 ± 8.8
BMI (kg/m2)23.6 ± 3.5
Affected side (right/left)18/15
Right side
JOA criteria (pre-stage/early stage/advanced stage/terminal stage)
0/0/5/13
Left side
JOA criteria (pre-stage/early stage/advanced stage/terminal stage)
0/0/4/11
Values are presented as mean ± SD. BMI: body mass index; JOA: Japanese Orthopaedic Association.
Table 2. The JHEQ.
Table 2. The JHEQ.
Pain (0–28)
VASHow severe is your hip pain?
1Even when I am at rest, my hip is painful.
2My hip is painful when I sit in a chair.
3I feel pain in my hip when I start to move.
4I cannot move my hip joint freely because of the pain.
5The pain in my hip joint prevents me from moving with strength.
6Because of hip joint pain, I occasionally cannot sleep well.
Movement (0–28)
7It is difficult for me to climb up and down stairs.
8It is difficult for me to get up from the floor and tatami.
9It is difficult for me to squat.
10It is difficult for me to use a Japanese-style toilet.
11It is difficult to get in and out of a bathtub.
12It is difficult to cut my toenails.
13It is difficult to put on my socks.
Mental (0–28)
14Because of hip joint disease, I sometimes get irritated or feel nervous.
15Because of hip joint disease, I feel dispirited and avoid going out.
16Because of hip joint disease, I feel anxiety about my livelihood/daily life.
17Because of hip joint disease, I feel dissatisfied with my health.
18My hip joint condition deeply affects my well-being.
19Because of hip joint disease, it is difficult for me to actively undertake various things.
20Because of hip joint pain, sometimes participation in local events and neighborhood relationships does not go smoothly for me.
Table 3. Summary of the measured parameters.
Measured Parameters
Spatiotemporal gait parameters
 Gait speed (m/s)0.86 ± 0.20
 Step length (m)0.48 ± 0.09
 Cadence (steps/min)107.6 ± 15.0
Kinetic gait parameters
 H1peak (W/kg)0.28 ± 0.18
 H2peak (W/kg)−0.20 ± 0.14
 H3peak (W/kg)0.39 ± 0.23
 A1peak (W/kg)−0.47 ± 0.14
 A2peak (W/kg)1.62 ± 0.64
 H1work (J/kg)3.31 ± 2.41
 H2work (J/kg)−2.21 ± 1.92
 H3work (J/kg)6.68 ± 3.56
 A1work (J/kg)−8.62 ± 2.79
 A2work (J/kg)19.10 ± 7.77
ROM
 Hip flexion (°)85.9 ± 17.0
 Hip extension (°)4.6 ± 7.1
 Ankle dorsiflexion (°)10.1 ± 6.1
Muscle strength
 Hip flexion (Nm/kg)0.55 ± 0.13
 Hip extension (Nm/kg)0.51 ± 0.15
 Ankle dorsiflexion (Nm/kg)0.17 ± 0.05
 Ankle plantar flexion (Nm/kg)0.21 ± 0.07
JHEQ
 Pain9.2 ± 5.0
 Movement6.4 ± 6.2
 Mental12.3 ± 5.9
Values are presented as mean ± SD.
Table 4. Factor loadings of the parameters for each factor.
Factor 1Factor 2Factor 3Factor 4
Gait speed (m/s)0.989−0.071−0.005−0.080
Step length (m)0.990−0.0410.001−0.075
Cadence (steps/min)−0.7810.1800.2340.136
H1peak (W/kg)−0.1960.7930.3320.048
H2peak (W/kg)0.987−0.081−0.084−0.055
H3peak (W/kg)0.988−0.0690.052−0.058
A1peak (W/kg)0.988−0.084−0.009−0.083
A2peak (W/kg)−0.1560.893−0.0140.001
H1work (J/kg)−0.1260.7490.186−0.076
H2work (J/kg)0.0010.018−0.7040.372
H3work (J/kg)−0.005−0.0570.7630.281
A1work (J/kg)0.153−0.477−0.1060.136
A2work (J/kg)0.0530.845−0.243−0.075
Hip flexion ROM (°)−0.150−0.0160.5650.463
Hip extension ROM (°)−0.0660.3420.5430.209
Ankle dorsiflexion ROM (°)−0.2210.559−0.2040.293
Hip flexion strength (Nm/kg)0.992−0.0620.011−0.067
Hip extension strength (Nm/kg)0.993−0.0510.030−0.062
Ankle dorsiflexion strength (Nm/kg)0.7660.0200.431−0.034
Ankle plantar flexion strength (Nm/kg)0.4570.1760.5530.001
JHEQ: Pain−0.227−0.1770.0610.812
JHEQ: Movement−0.1130.1110.0730.790
JHEQ: Mental−0.2970.0600.0080.542
Eigenvalue8.593.502.522.22
Variance explained (%)37.3615.2410.949.67
Cumulative variance (%)37.3652.6063.5473.21
Factor loadings ≥ |0.50| are shown in bold.
Disclaimer/Publisher’s Note: The statements, opinions and data contained in all publications are solely those of the individual author(s) and contributor(s) and not of MDPI and/or the editor(s). MDPI and/or the editor(s) disclaim responsibility for any injury to people or property resulting from any ideas, methods, instructions or products referred to in the content.