Article

The Effect of Intra-Abdominal Pressure on Lower-Body Power in College Baseball Pitchers: An Exploratory Study

1
RC13 Sports, Phoenix, AZ 85050, USA
2
ArmCare, 225 5th Ave, Suite 2, Indialantic, FL 32903, USA
3
Sports Performance Research Institute New Zealand, Auckland University of Technology, Auckland 1010, New Zealand
4
Human Performance Laboratories, Department of Kinesiology, Louisiana Tech University, Ruston, LA 71270, USA
5
Department of Occupational Therapy, Huntington University, Peoria, AZ 85381, USA
6
Chicago White Sox, Major League Baseball, Chicago, IL 60616, USA
*
Author to whom correspondence should be addressed.
Biomechanics 2026, 6(2), 53; https://doi.org/10.3390/biomechanics6020053
Submission received: 10 February 2026 / Revised: 14 May 2026 / Accepted: 18 May 2026 / Published: 1 June 2026
(This article belongs to the Section Sports Biomechanics)

Abstract

Background/Objectives: Baseball pitching injuries associated with fatigue-induced mechanisms may be attributed to change in lower-body power. In this study, a stretch-resistant belt (theorized to increase intra-abdominal pressure) was studied to determine if it influenced countermovement jump (CMJ) power pre- and post-pitching. Methods: Thirteen college athletes participated in three separate, randomized pitching sessions of forty pitches to evaluate the CMJ performance impacts owed to wearing a team-issued baseball belt versus a belt that was configured with the intent to raise intra-abdominal pressure (IAP). The three belt conditions were; (1) the team-issued belt, standard belt (SB), (2) the IAP-configured belt worn at regular length (RIAP), and the IAP-configured belt fastened two inches with the tightest cinch (2IN). Maximum jump heights were measured on a Jumpmat and captured with hands on hips. Data was integrated to compute jump power and the eccentric utilization ratio, being the ratio of a full stretch CMJ to a static CMJ biased to concentric power. Static CMJ testing had pitchers hold the bottom position for 5 s before takeoff. Repeated measures ANOVA with a post hoc Bonferroni correction determined significant differences; subject-specific interactions were identified. Results: Most athletes maintained or improved performance post-pitching with the RIAP with less variability in coordinating stretch-shortening responses. On a group level, RIAP had greater post-pitching CMJ height and power versus 2IN (p < 0.03) and had less CMJ power loss compared to SB and 2IN belt conditions (p < 0.02). IAP was not directly measured, yet this exploratory study provides preliminary evidence that a 5 mm, theoretical IAP design, via a stretch-resistant belt can influence pre- and post-pitching lower-body neuromuscular performance in collegiate pitchers. Conclusions: The RIAP condition showed less performance decline inferring fatigue resistance, preserved max CMJ height, and lessened post-pitch CMJ power loss. Maximal cinching tended to compromise post-pitch lower-body power and inferred the need to individualize the stretch-resistant belt, designed to increase intra-abdominal pressure, for performance and injury protection benefits.

1. Introduction

Baseball pitching requires fine whole-body coordination in a way that each segment generates, absorbs, and transfers mechanical energy into subsequent segments in the kinetic chain [1,2,3]. Pitchers may need to have powerful yet efficient kinetic chain to maximize their ball velocity while optimizing the amount of mechanical load on each segment to avoid overuse injuries due to repetitive throwing movements over time [4,5]. Proximal segments (trunk and pelvis) may play a particularly important role in optimizing energy transfer in high velocity throwing, as mechanical energy flowing from the upper torso into the throwing arm correlated more with ball velocity than energy transferred from other segments [1]. The proximal segments generate the largest angular momentum during baseball pitching compared to other anatomical regions [6], and it may be beneficial for pitchers to optimize the proximal segment movement in order to achieve high ball velocity. As an example, it was reported that pitchers with better lumbopelvic control at pre-season assessment were able to pitch more innings with less hits and walks per inning in the subsequent season, potentially indicating that greater stability of the proximal body could improve pitching performance and reduce fatigue-induced injury risk [7].
MLB has mentioned fatigue is the most critical factor to regulate in causing overuse arm injuries to baseball pitchers [8,9]. Many studies have found changes in pitching biomechanics and decreased physical capacity (e.g., range of motion, strength, and proprioception) following simulated-game throwing sessions [9,10,11,12,13]. Altered pitching biomechanics is likely a result of decreased physical capacity from repetitive, highly demanding throwing movements, and may cause undesirable mechanical loading to the throwing arm that can overwhelm soft-tissue structures [13]. Thus, optimized proximal mechanics can assist in reducing arm injury rates that have escalated among baseball pitchers at all competitive levels by minimizing regional and global fatigue [14,15]. Major League Baseball (MLB) states that the greatest risk factor for pitchers is overuse and fatigue and sets the guidelines and strength training paradigms for youth pitchers to maximize baseball performance while increasing competitive safety [8]. The baseball literature has thoroughly studied the assessment of core strength in baseball pitchers, therefore the improvement of it through exercise according to MLB guidelines can improve whole-body movement efficiency in the delivery [8]. The Valsalva maneuver is a core stabilization technique traditionally used and studied in weight lifting that may improve the control of proximal rotation in pitchers by amplifying co-contraction of the core and diaphragmatic muscle coordination [16,17]. The Valsalva maneuver requires an athlete to hold their breath to close the glottis and raise intra-abdominal pressure (IAP) to enhance force generation from the segments above and below the proximal segments when lifting weights [16,17]. This technique may be more apparent in sports such as tennis, as grunting can be heard that can amplify co-contraction and stiffness of proximal muscle groups to provide enhanced lumbopelvic control during dynamic movements [18]. When the Valsalva maneuver is adopted during baseball pitching, pitchers may be able to generate more force from the lower and upper limbs with increased deceleration and stability in proximal segments [17,19]. The coordination of proximal stiffness and control of rotation can lead to enhanced pitching performance and improved momentum exchange between the trunk and throwing arm [20]. Previous studies identified a positive influence in pitchers wearing a specialized belt, theorized to raise IAP, as pre-game arm strength (internal, external rotation, scaption, and pinch grip) [21] as well as ball velocity and throwing accuracy improved during simulated competition [22]. Although IAP was not directly measured, these two studies support the idea that a functional belt may regulate a sport-specific Valsalva maneuver to raise IAP and enhance force output from the limbs through effective proximal control during dynamic movements [16,23,24].
Previous research identified decreases in force and power output metrics from a countermovement jump (CMJ) assessment after pitchers threw a simulated game as well as throughout a season [11,25]. Both eccentric (i.e., descending) and concentric (i.e., ascending) phase force and power output showed moderate-to-large decline after a simulated game and into mid-season in both studies, indicating neuromuscular fatigue in the lower body due to pitching [11,25]. Although its relationship with pitching performance or fatigue after pitching might be less prominent than CMJ, static jump has also been used to evaluate the physical capacity of baseball pitchers [26,27,28]. Some studies mentioned that static jump may be a more suitable fatigue evaluation protocol than CMJ as CMJ masks the decrease in force output capacity due to its prolonged active state and the use of the stretch-shortening cycle during the eccentric phase [29,30]. Indeed, static jump height decreased after soccer players performed a simulated soccer game session while CMJ height did not change [30]. Given that an increased IAP-configured belt can raise arm strength, ball velocity, and pitching accuracy [21,22], the influence of its use on lower-body fatigue still remains unclear. Therefore, the purpose of this study was to explore the effect of a specialized belt designed to raise IAP on lower-body power in college baseball pitchers and examine pre- and post-pitching responses to infer more effective proximal muscle coordination.
It is believed that athletes using the stretch-resistant, 5 mm thick baseball belt, designed in theory to raise IAP, will experience greater neuromuscular performance with less lower-body power fatigue compared to when they use the 1 mm thick, highly elastic, baseball belt that is typically worn by collegiate baseball pitchers.
Reduced lower body function, represented by shortening stride length and attenuating ground reaction force, has been shown to reduce dynamic stability of the forearm musculature. Therefore, this work conceptualizes a theoretical framework involving varying levels of core muscle activation that inspires future studies to directly measure IAP using a stretch-resistant belt and examine how varying IAP levels could maintain lower body function and preserve medial elbow strength.

2. Materials and Methods

Thirteen collegiate pitchers participated in this study (height, 1.86 ± 0.06 m; body mass, 88.5 ± 8.31 kg; age, 20.6 ± 1.39 years) after providing written informed consent. The consent form for participation was distributed to all participants and signed. All procedures were approved by the Institutional Review Board at Arizona Christian University in accordance with federal guidelines (21 CFR 56.108). Before data collection, participants’ heights and weights were recorded prior to completing standardized dynamic warm-up emphasizing the upper and lower extremities, followed by an individualized throwing progression to prepare the upper extremity for high-intensity pitching. Athletes were conditioned prior to the study, working with the college’s strength and conditioning staff, and followed a consistent training plan of similar exercise selections and prescriptions.
A randomized number table offering six unique combinations of ABC conditions designated the intervention rotation for each participant according to belt-type condition. After a randomized experimental order was established for each athlete, three separate, simulated bullpen sessions would be undertaken either wearing (1) the athlete’s standard, team-issued baseball belt (SB); (2) a specialized intra-abdominal pressure belt that theoretically raises IAP worn at their waist length and typical belt tension (RIAP); and (3) the same specialized IAP-configured belt tightened an additional 2 inches beyond standard fit (2IN) to increase trunk constraint (Core Technology Inc., Irvine, CA, USA). The IAP belt was fabricated from a rigid, interwoven material designed to resist stretch and measured approximately 5 mm in thickness, compared to an approximate 1 mm thickness typical of conventional, elastic, baseball belts. All belts were worn at the waist and secured through standard uniform belt loops; however, the IAP belt was individually sized to each pitcher based on waist circumference measured while wearing baseball pants. This customized fit preserved belt stiffness and thickness, enhancing core stabilization by promoting proximal muscle co-contraction, which was further accentuated in the cinched condition.
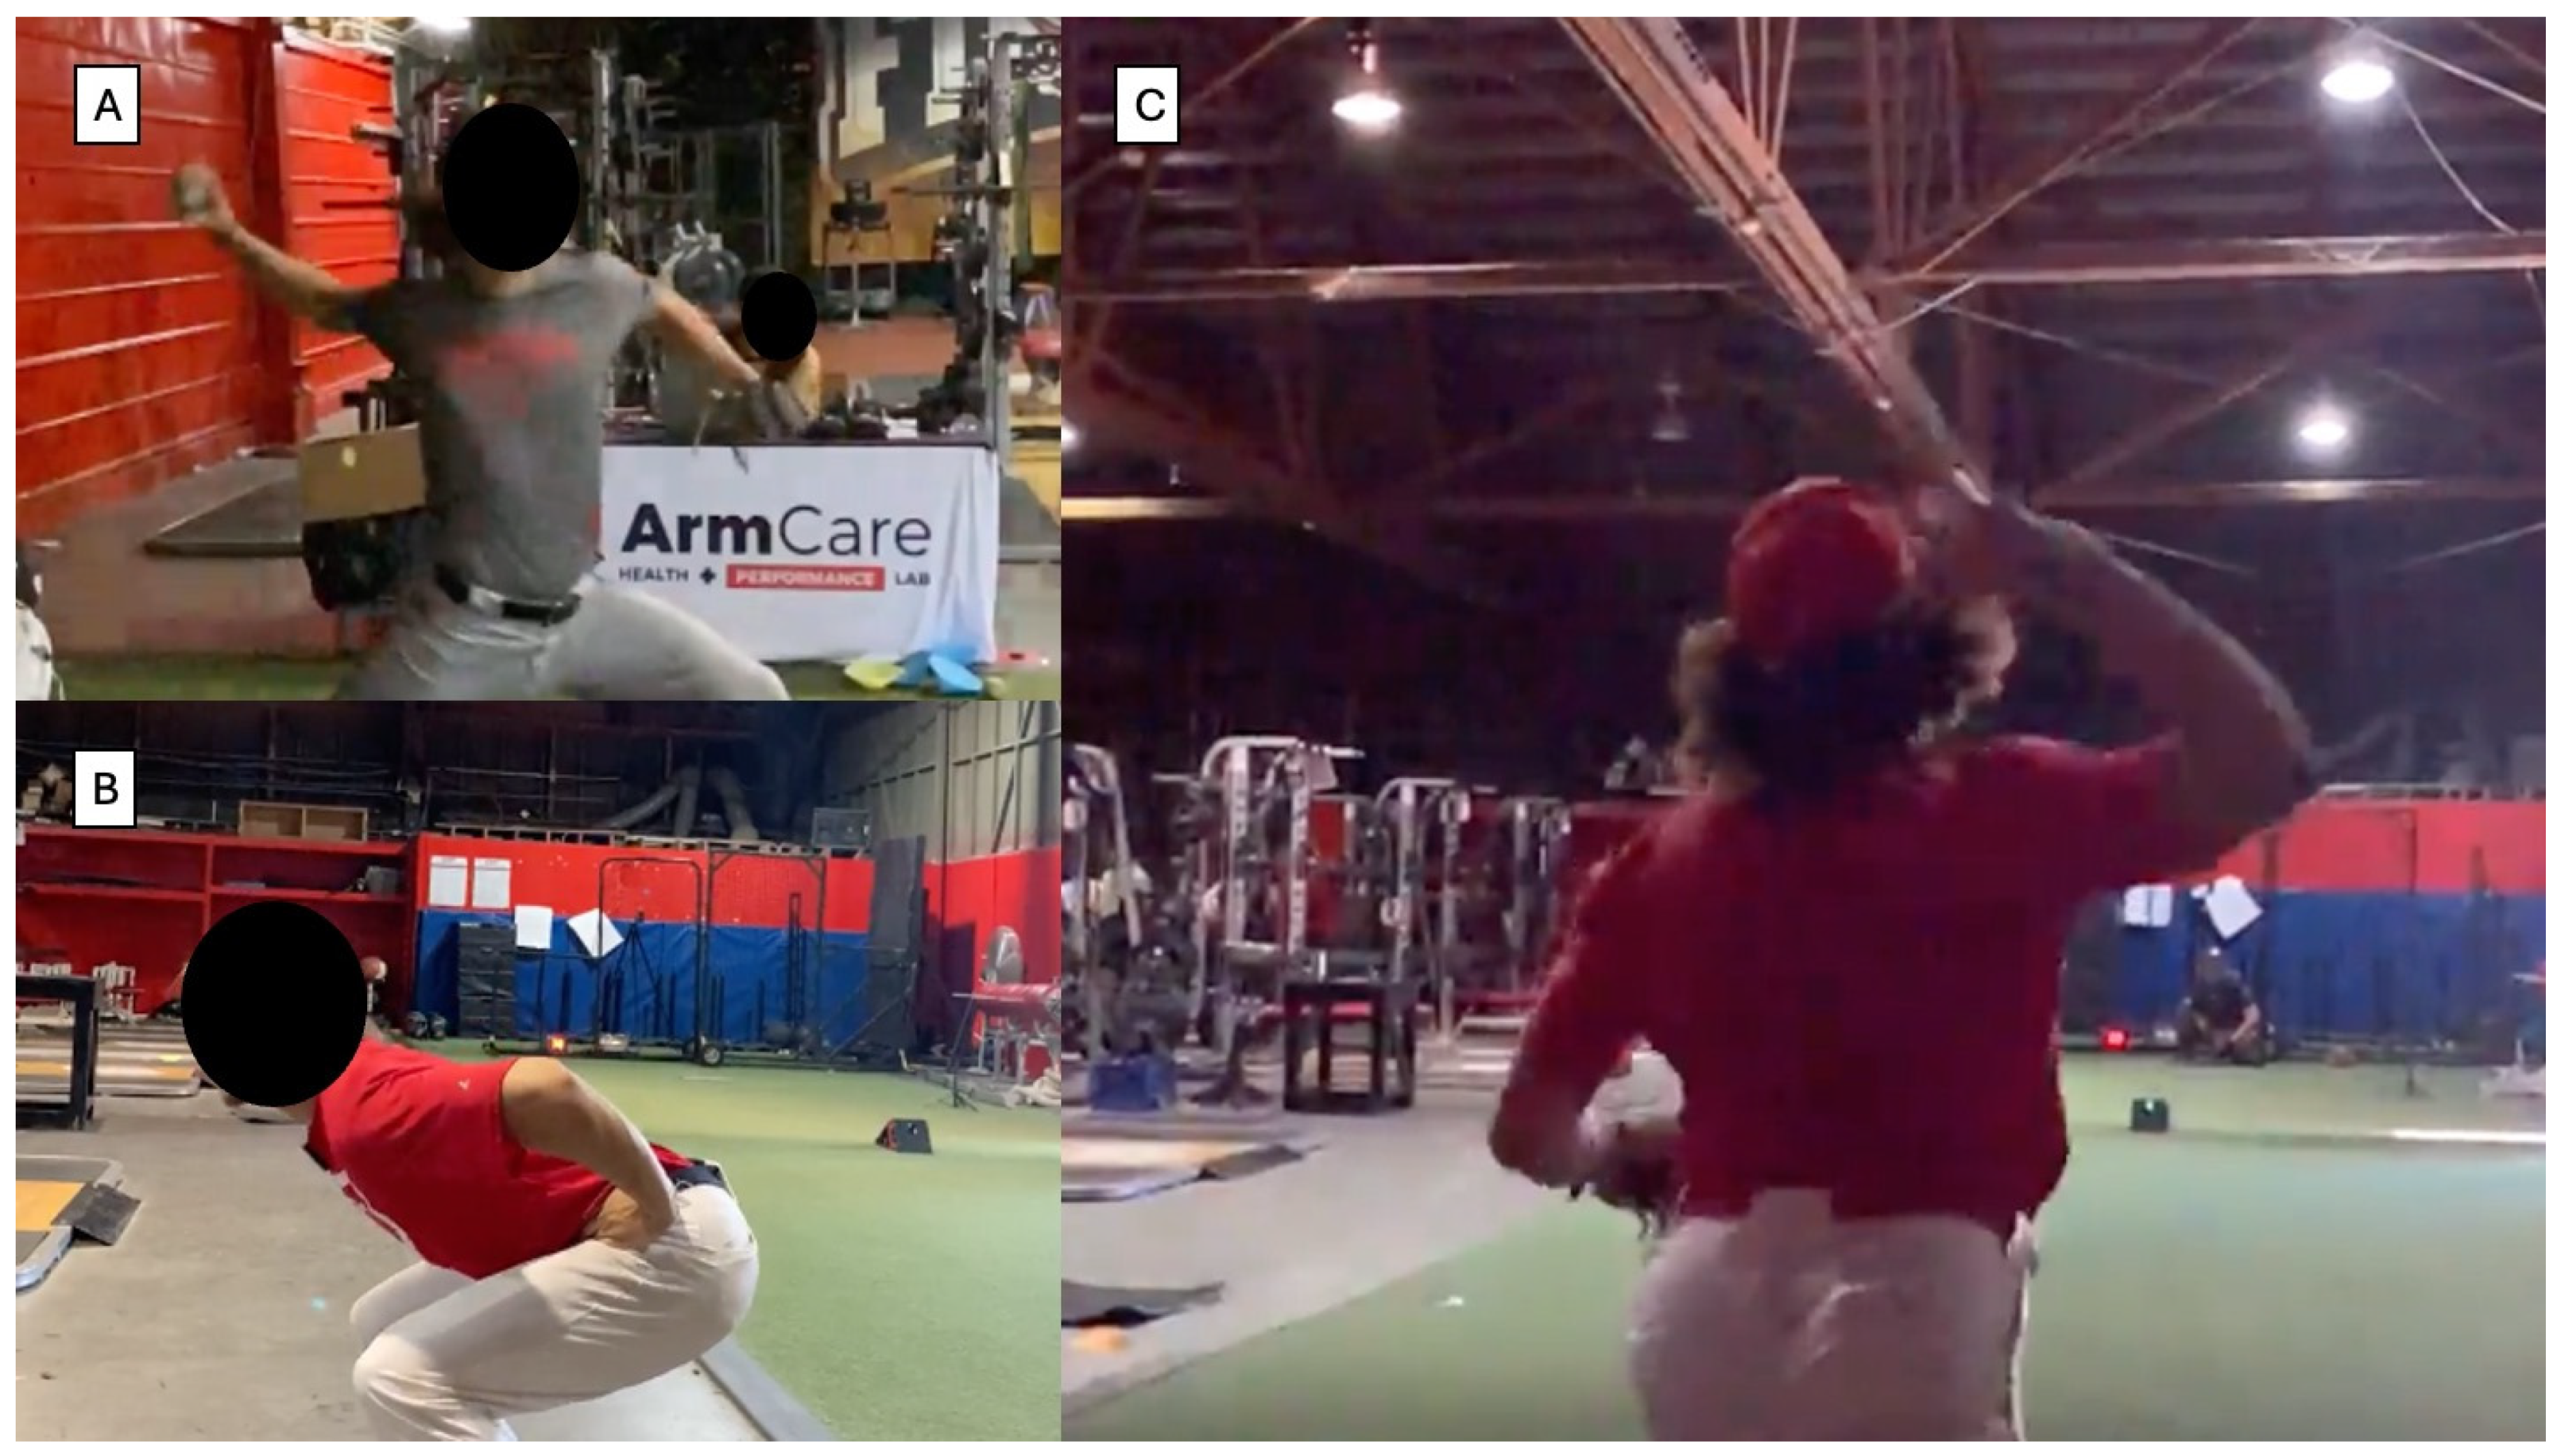
Across all testing sessions, pitchers threw a total of 159 pitches, inclusive of pre-inning warm-up throws. Each bullpen consisted of two simulated innings of 20 pitches per inning (40 total pitches), delivered in a standardized sequence of two fastballs followed by one change-up. The per-inning pitch allocation of 20 pitches was selected as it is commonly observed in competitive play at the collegiate level. Pitch-to-pitch rest intervals were fixed at 15 s, with a 5 min recovery period between innings. To elicit competitive intent and maximal effort, ball velocity was recorded using a handheld radar device capable of measuring speeds up to 130 mph (Pocket Radar, Santa Rosa, CA, USA), with velocity feedback displayed in real time on an LED monitor. Pitch outcomes (balls and strikes) were called by a professional catcher and verified by the principal investigator prior to inclusion in the analysis. A minimum washout period of 72 h separated each bullpen session. Figure 1 shows pitchers wearing the stretch-resistant belt and their standard team belt during pitching and when testing their jump performance pre and post simulated games.

2.1. Lower-Body Power Assessments

Lower-body power testing occurred after throwing-arm strength assessments (that are published elsewhere) for both pre- and post-game simulated competitions. Before lower-body power assessments, the standardized warm-up procedure for the lower body was administered by team strength coaches who oversaw the fitness programming for the baseball team athletes. The warm-up included a 10-yard distance, as the athlete went through a series of front-to-back runs; side-to-side lateral movements, such as shuffles and skipping movements; and dynamic stretching for the lower body with lunge variations (forward, backward, and lateral). After the warm-up, athletes underwent three testing conditions that evaluated jump height and regulated the amount of elastic contribution imparted by stretch-shortening. The static countermovement jump (SCMJ) had athletes with their hands on hips going to the lowest point in their jump and an examiner counted five seconds before the athlete exploded upward. The countdown at the bottom position reduced the amount of elastic contribution by the stretch-shortening couple and depicted more concentric-focused assessment of power. The countermovement jump (CMJ) followed where athletes continued to have their hands on their hips yet were allowed to use a countermovement from a standing position to increase the stretch-shortening effect of the lower body. The maximum jump values denoted the highest-level effort and were expressed as maximum countermovement jump (MAXCMJ) and maximum static countermovement jump (MAXSCMJ). Maximum performances, illustrated as the highest possible jump data pre- and post-pitching, were used to represent peak neuromuscular output while reducing variability from submaximal or inconsistent trials. Overall, peak trials reduced the impact of within-subject variability and the potential of inconsistent efforts across repeated trials. Each condition had the athletes rotate between each jump that approximated 1 min of rest between trials and performed three jumps each for both the SCMJ and the CMJfor a total of 6 jumps. Vertical jump heights for each trial were collected using a Jump Mat (JustJump, Probotics, Huntsville, AL, USA) that had a receiver that displayed the vertical jump height that was manually recorded for each athlete by an examiner who had been trained to detect jump compensations, such as favoring a side or attempting extra-preparatory movements prior to take-off. Athletes were not allowed to tuck jump as artificial airtime would distort actual vertical jump heights but were allowed to raise their toes to better absorb landings and reinforce maximum intent to get as high as possible off the mat. The same jump testing sequence starting with the SCMJ followed by the CMJ occurred after simulated pitched games to examine changes in lower body power pre and post pitching.

2.2. Statistical Computation

Maximum jump heights, depicting the highest neuromuscular and neuromechanical output for each jump type, were analyzed (MAXCMJ and MAXSCMJ) using the Sayers peak power calculation [31]. This computation occurred for each maximum jump trial once the data was manually entered into a CSV on a password-protected computer. This published predictive equation integrates the weight of the athlete and the height of the jump to derive a power value in Watts (W). The maximum eccentric utilization ratio (MEUR) was calculated between the maximum static countermovement jump and the maximum countermovement jump within each belt condition to indicate the eccentric contribution to jump height above the concentric performance of the static jump. Higher ratios indicated a greater degree of elasticity contributed to the overall jump height. Coefficients of variation in maximum eccentric utilization ratios—the eccentric utilization ratio coefficient of variation (EURCV)—depicted variability was also calculated to indicate neuromechanical inconsistencies between trials. Subject-specific data were analyzed for subject-specific responses. Percentages represented the number of athletes for the belt condition that produced the greatest positive differentials between pre-game and post-simulated games. A positive differential in lower-body performance was considered one that showed fatigue resistance, as players who saw increased jump height after games saw potentiating effects. Higher belt performance on a subject-specific level was considered the one with the highest percentage of athletes seeing greater differentials in lower-body power data, either prior to games or after them.
No reference studies were available in this first exploratory study. As a result, an a priori through power analysis on an IAP-configured belt was computed; therefore, a risk of being underpowered and the presence of Type II errors exist. To achieve initial findings on a group level, a two-factor repeated-measures ANOVA was conducted to examine lower-body power responses between belt condition and time point (pre- or post-simulated game) that compared the influence of IAP. Bonferroni-corrected paired post hoc comparisons were performed where appropriate with an a priori of 0.05 to indicate significant findings between conditions and time points. To show effect size, a partial eta squared (ηp2) computation indicated the proportion of variance explained by each effect. Partial eta squared magnitudes were as follows; small (0.01), medium (0.06), and large (0.14). A Cohen’s dz statistic was used for repeated measures pairwise comparisons to determine if results were clinically relevant and scaled by the following magnitude effects: small (0.20), medium (0.50), large (0.80), and very large (1.20+).

3. Results

3.1. Subject-Specific Data

The subject-specific analyses are descriptive in nature and are not conclusions derived from parametric measurement. Percentages represent the proportion of athletes (n = 13) for whom a given belt condition produced (1) the best value at a given time point (Pre or Post) and (2) an even or positive change from Pre to Post within the same belt condition to denote neuromechanical maintenance or an improvement in performance. An improvement in performance was construed as a potentiating effect of belt condition. For EURCV, a decrease in post values from pre-pitching approaching zero was treated as the favorable direction, as it was interpreted as reduced variability and a lower effect of fatigue. Table 1 indicates the percentage of athletes presenting the best lower-body power values for pre- and post-pitching across the three different belt conditions. Table 2 represents the percentage of athletes who maintained or improved lower-body power performance after simulated games from baseline assessment within each belt condition. Higher percentages indicate more athletes displaying potentiation (greater lower-body power) in accordance with each belt condition.
Across subjects, belt condition influenced both absolute lower-body power values and the likelihood of maintaining performance following simulated pitching. For maximal squat countermovement jump height (MAXSCMJ), the standard belt (SB) produced the highest post-pitch values in 62% of athletes, whereas the cinched belt (2IN) produced the highest post-pitch value in only 8% of athletes. However, when examining within-belt pre-to-post change, the RIAP belt demonstrated the highest percentage of athletes who maintained or improved MAXSCMJ (46%), compared with SB (38%) and 2IN (15%). Similar patterns were observed for squat countermovement jump power (SCMJPWR), with RIAP demonstrating the greatest proportion of maintained/improved responses (46%).
For maximal countermovement jump height (MAXCMJ) and countermovement jump power (CMJPWR), RIAP demonstrated the greatest proportion of athletes who maintained or improved from pre- to post-pitching (62% for both variables), whereas SB showed maintenance/improvement in 46% of athletes and 2IN in 23%. In terms of absolute post-pitch values, SB most frequently produced the highest post-pitch MAXCMJ (54%), whereas IAP most frequently produced the highest post-pitch CMJPWR (54%).
For the variability measurement of the eccentric utilization ratio (EURCV), RIAP most frequently produced the lowest baseline variability (54%), whereas post-pitching, the lowest EURCV was most observed under 2IN and RIAP (46% each). For MAXEUR, SB most frequently produced the lowest variability value both pre- (46%) and post-pitching (46%).

3.2. Repeated Measures Analyses

A two-factor repeated-measures ANOVA (time × belt condition) with Bonferroni correction revealed select belt-dependent differences in lower-body power metrics following simulated pitching bouts for the group. Both pre- and post-pitching variability measures in EURCV, a measure representing stretch-shortening variability between eccentric and concentric countermovement jumps, did not differ between belt conditions. This may infer consistency in pitchers’ ability to coordinate stretching, energy storage, and recoil that was not altered by belt type. No other statistically significant differences were seen on a group level for pre-pitch countermovement jump metrics (Table 3).
After pitching, the SB condition demonstrated significantly higher CMJ heights for MAXSCMJ with large effects (p = 0.03, dz = 0.83) versus 2IN, and RIAP indicated significantly greater CMJPWR than 2IN with large effects (p = 0.01, dz = 1.01). No significant differences were detected for SCMJPWR, MAXCMJ, EURCV, or MAXEUR post-pitching across belt conditions, yet a series of trends approaching significance (p = 0.07) emerged for SCMJPWR and MAXCMJ (Table 4). Significant post-pitching declines with very large effects were seen in maximum SCMJ (p < 0.001, dz = 1.29), as well as declines with medium effects for MAXCMJ (p < 0.02, dz= −0.76) for the 2IN condition. SB and RIAP pre-to-post pitching lower-body jump heights were not statistically different (Table 5). For CMJ power, Table 6 indicated that static and dynamic power significantly declined for 2IN with very large effects seen for SCMJPWR (p < 0.001, dz = 1.29) and medium effects for CMJPWR (p < 0.02, dz= −0.76). SB and RIAP belt conditions maintained pre-to-post jump power as values were not significantly different across time points (Table 6). Across all time points, MAXEUR—expressed as a ratio between the MAXCMJ and the MAXSCMJ—did not significantly differ and was not significantly different between belt conditions. However, as previously mentioned, repeatable coordination between MAXCMJ and MAXSCMJ—expressed as the EURCV—was less variable with RIAP belt use.

4. Discussion

The principal finding is that belt type and settings were associated with differences in lower-body power expression after pitching, despite minimal differences at baseline. The study’s hypothesis was partially supported. Among collegiate baseball pitchers, the RIAP and 2IN settings for the stretch-resistant, 5 mm thick baseball belt did not unanimously outperform the SB. However, the regular IAP-configured belt demonstrated more favorable outcomes versus the 2IN condition for most pre- and post-pitching data, as well as maintaining lower-body power from pre-to-post time points. Therefore, the IAP-configured belt setting designed to regulate IAP must be further individualized between extremes, as intermediate settings may express greater lower-body power at both pre- and post-pitching time points.
Cinching the belt (2IN) appears to compromise post-pitching static jump height, as well as countermovement jump height and power. Statistically significant declines in jump performance may be related to altered trunk mechanics and could alter force transmission through the kinetic chain arising from potential over-constriction of the intra-abdominal region. In contrast, the IAP-configured belt set at the regular belt length showed a non-significant trend (p = 0.07) to preserve maximal jump height and increase post-pitching CMJ power. In future, a larger sample size may illustrate and support the theory that moderate intra-abdominal pressure—rather than maximal restriction—optimizes neuromuscular efficiency under fatigue.
Biomechanical research can extend the current exploratory study to reveal pitching performance and durability benefits if lower-body power late in throwing bouts is maintained when wearing a stretch-resistant belt that supports, but does not constrain, trunk mechanics. Given that lower-extremity power is preserved and consistently transfers energy to the throwing arm, upper-extremity loading may be more controlled and tolerated. These findings may have theoretical implications for fatigue management and performance maintenance. However, no direct measures of injury risk or joint loading were assessed in this study, and such interpretations should be viewed as speculative. Future research incorporating functional measures for the throwing arm, biomechanical, and longitudinal injury tracking is required to evaluate these relationships [21]. North American professional pitchers are at elevated risk for throwing-arm surgery based on throwing velocity, competitive exposure, and lack of tracked workloads [15,32,33]. Despite published overuse and load-based factors in this population, one of the strongest health influences that is emerging in physiologic study is investigating throwing-arm strength [34,35,36,37]. Risk potential is elevated in North American professional pitchers as they have been evidenced to have the weakest throwing arms at the highest level of play. The researchers revealed significant strength losses over the course of games and a true deciding factor between healthy and unhealthy players [35,37]. It is expected that throwing arm weakness in the current, collegiate cohort has similar tendencies. The interaction and connection of the IAP-configured belt on lower-body power ties to throwing arm strength performance seen in other work [21]. An exploratory investigation demonstrated that the IAP-configured belt was a strength potentiator for the throwing arm, as greater than 80% of the pitchers participating in the case study elevated their relative arm strength, while more than 90% saw a boost in absolute grip strength because of wearing the specialized belt [21]. Given aggregation of these results, future research may demonstrate that the theorized regulation IAP may be relevant for future investigation into injury-related outcomes through a lower-body-power throwing-arm-strength connection that is improved by optimizing core function. Although this early data presents positive implications for amplifying motor control for strength and power, to substantiate this mechanism, a much more detailed study involving kinematic and kinetic analyses is warranted to further delineate biomechanical impacts with larger sample populations and across different skill cohorts.
The subject-specific analysis from this work provided practical insight into which belt configuration most consistently supported lower-body power under fatigue. Across the primary power outcomes (MAXSCMJ, SCMJPWR, MAXCMJ, and CMJPWR), the IAP belt demonstrated the highest percentage of athletes who maintained or improved performance from pre- to post-pitching, suggesting a tendency toward greater preservation of explosive capacity during acute throwing-related fatigue. In contrast, the cinched belt condition (2IN) consistently demonstrated the lowest percentages of maintained/improved responses for the primary power outcomes, suggesting that excessive constriction may be associated with reduced lower-body power output following pitching. On a subject-specific level, from pre-to-post pitching, most athletes responded better with either the RIAP, or 2IN compared to SB, but this was not consistent when evaluated with a repeated measures ANOVA.
Notably, the belt that most often produced the best absolute post-pitch values was not always the belt that best preserved performance. For example, SB most frequently produced the highest post-pitch jump heights, whereas, on a subject-specific level, RIAP more consistently minimized performance decline or supported positive differentials from pre- to post-pitching. However, with respect to group-level effects, this distinction was not found statistically significant at the group level. In pitching, durability and late-bout performance depends not only on peak output but also on the ability to maintain force production and coordination as fatigue accumulates. The present findings support the interpretation that regulated intra-abdominal pressure assistance may facilitate more stable force transfer through the trunk–pelvis complex, thereby preserving lower-extremity power expression after pitching without the potential mechanical restrictions imposed by a cinched belt. From an implementation standpoint, these results suggest that an IAP-oriented belt strategy may be more advantageous when the goal is to maintain explosive lower-body performance across a pitching bout, whereas an overly tightened belt may be detrimental. Future work should pair these subject-level response profiles with intermediate settings on the IAP-configured belt to determine a more granular, and individualized, level of understanding in how much IAP assistance is needed for each player to optimize their delivery.
Given the exploratory design and sample size, findings should be interpreted with caution. Future work examining how preserving lower-body power translates into meaningful reductions in upper-extremity loading or improved pitching performance is needed, as several studies have presented UCL surgical risk with altered jump kinetics [38,39]. Mayberry et al. [39] were able to determine that altered performance in eccentric braking force in the jump descent, concentric force in explosive take-off, and concentric impulse—being the time of concentric force applied to the ground—could independently and collectively contribute to the carrying out of Tommy John Surgery. Although a similar jump strategy to the one presented in the current study indicated injury detection, the mechanism between the ground reaction force kinetics in jumping and throwing arm kinetics was not clarified until a recent study by Qiao et al. [38]. In the mechanistic study, a biomechanical effect between countermovement jump performance and the rate of elbow varus torque loading indicated the potential of injury surveillance through evaluating lower-body power [38]. In the study, an increase in lower-body power related to an increase in the rate of loading that the forearm muscles, biceps, and triceps supply in resisting opening of the medial elbow [38]. On a subject-specific level, early findings for the IAP-configured belt at regular length showed that lower-body power could be regulated well from pre-to-post-pitching assessments that could give rise to a more consistent rate of loading to the throwing arm. In the case of the SB and 2IN, large increases in lower-body power were seen pre-pitching. Theoretically, if significant group effects arise in studying a larger sample size for parametric testing, it is possible that injury risk could increase if stretch resistance is not optimized and elicits a lower-body power surge that does not parallel increased throwing arm strength [21].
Fatigue-induced injury risks can be associated with changes in lower body force and power [40,41]. Crotin et al. [34] identified that extended play may have a stride-length-shortening effect due to lower-body fatigue that may weaken the dynamic stabilizers of the medial elbow. Other work has shown changes in core and lower body mechanics, namely altered lower body lead leg block (effect of the lead leg stopping forward momentum by pushing back) and changes in trunk position that may be less taxing on the core musculature [10,42]. To fully grasp the effects, it is recommended that extended-play research (throwing over 100 pitches per simulated game) be undertaken to examine the extent that the IAP-configured belt impacts lower body biomechanics, such as stride length, lead-knee position and joint excursion, as well as propulsion mechanics from the drive leg. An ideal IAP-configured belt setting could be achieved if minimal lower-body power changes are detected, and lower-body movement profiles remain consistent. As a result, the risk of elevated rates of medial elbow-joint loading and depreciating dynamic stabilizer strength could be minimized for the throwing arm [21,34,40,41].
Contraction tempo, indicated by static, and countermovement jumping performance, as well as the eccentric utilization ratio statistics, communicate the ability to develop power from a quasi-isometric state that is likened more to the drive leg. The drive leg countermovement action for pitchers has static elements (some joints not changing joint positions in short time frames) as coordination of the drive limb focuses action around overcoming the static position of the knee joint to dynamically extend and produce power [21,43,44]. In connection to our pre-post testing design, on a subject-specific level, the IAP-configured belt showed better static jump performance for 2IN pre-pitching, and a tie post-pitching for SB and RIAP. With parametric testing on a variety of belt settings, 3D motion capture, and a higher-powered sample size, future work may indicate an optimum for stretch resistance that illustrates improved static overcome by dynamic concentric power for drive leg propulsion.
As it relates to the stride knee, substantial research has been undertaken to look at the stretch shortening effects in amplifying fastball velocity [45,46,47]. The stride leg behaves differently as some deliveries provide more co-contraction and less joint excursion, while others have large range of motions and express very high knee extension joint powers [43,47,48]. To examine relationships with greater stretch shortening, the MAXCMJ and CMJPWR metrics were evaluated in relation to the belt condition. On a subject-specific level, a greater percentage of athletes maintained or improved MAXCMJ with the IAP-configured belt worn at regular length and presented the best CMJPWR post-pitching. This indicates that the SB and 2IN condition, two extremes in intra-abdominal compression, did not optimize the core region to maintain vertical jump height and power, yet repeated measures analysis showed 2IN to produce significantly less lower-body power with medium to large effects from pre-to-post pitching.
The MAXEUR indicates the elastic efficiency of both static and countermovement jump power. The eccentric utilization ratio could be simplified as a measure of eccentric stretch-shortening performance to concentric shortening performance. A higher value indicates a greater elastic stretch response, while a lower value indicates the potential of an athlete being more force driven, and concentrically biased in their production of power. On a subject-specific level, most athletes wearing the SB saw greater countermovement jump performance relative to static jump performance. Similarly, from pre-to-post pitching, subject-specific data revealed that the 2IN and RIAP had higher MAXEUR indicating that certain individuals raise their eccentric utilization of stretch-shortening with higher amounts of constriction after pitch accumulation. However, when evaluating group effects, the IAP-configured belt, theorized to raise and assist in the co-contraction of the core region, did not improve MAXEUR, nor did it alter the stretch-shortening relationship between the eccentric, loading-recoil countermovement jumps, and the more forceful static concentric jump.
To examine stretch-shortening variability in the eccentric utilization ratio (EURCV), most athletes indicated the SB condition to offer the highest absolute elasticity and highest variability on a subject-specific level. In contrast, the RIAP condition demonstrated the lowest baseline variability (54%), while the 2IN and the RIAP condition had the least variability in eccentric utilization ratios on a subject-specific level post-pitching, while SB had the highest MAXEUR. For repeated measures analyses, no clear differences in MAXEUR or EUR were observed between belt conditions.
Collectively, the findings from this study reveal more subject-specific benefits in wearing the RIAP belt, but on a group-effects level, RIAP performed statistically better than 2IN with large effects (p = 0.01, dz = 1.01) at the post-pitching time point only and maintained pre-to-post pitching performance while 2IN showed statistically large jump height and power declines. Overall findings infer the need to determine an optimum in regulating proximal stiffness for efficient rotation (rather than maximal restriction) that may help maintain lower-extremity power under throwing-related fatigue, a factor increasingly linked to altered mechanics and elevated upper-extremity loading [21,49]. Larger, controlled studies incorporating direct IAP quantification and game-relevant workloads are warranted to determine individualized belt settings and clarify whether preserving lower-body power translates to meaningful reductions in arm stress and improved pitching durability.

5. Limitations

Although the present study demonstrates potentially favorable effects of wearing a specialized belt designed to augment intra-abdominal pressure (IAP) on lower-body-power outcomes, several limitations should be considered when interpreting these findings. First, this investigation was designed as an exploratory case study examining subject-specific changes in countermovement jump performance under differing belt conditions and assumed changes in IAP levels. As no prior studies have systematically evaluated the effects of externally facilitated IAP modulation on CMJ-derived power metrics in baseball pitchers, reference data were unavailable to inform an a priori power analysis. Consequently, the present study may be underpowered, and in conjunction with the small sample size (N = 13), the likelihood of a Type II error remains elevated. Larger cohorts will be necessary to confirm whether the observed trends extend beyond individual responder profiles and represent true population-level effects of IAP-configured belt use.
Workload and training exposure prior to undertaking the study, and potentially between testing sessions or training sessions with the team, could not be fully standardized in this collegiate population who have randomness in their competitive, academic and personal schedules. However, athletes had prior experience with the jump strategies tested in this exploratory study through regularly scheduled team testing throughout the college season. Thus, experimental familiarity was present in the testing methods. Results may differ if undertaken with novice athletes or if experimental methods are completely novel with no prior learning effect. Further, jump testing came after isometric testing for the throwing arm that could have potentiated pre- and post-pitching jump performance. Although standard across subjects, the potentiating effects of arm strength testing on lower-body power had not been evaluated but offer an interesting topic for future study. Throwing-arm-strength evaluation was logistically prioritized as the first functional measure that allowed the research team to determine if a pitcher was physically ready for the throwing demands. As a precautionary plan, the research team felt that if pitchers demonstrated fatigue, or poor arm-strength recovery, they could readily reschedule their bullpen sessions to later dates, provide more rest, reduce risk of injury, and avoid unnecessary jump testing. Throughout the study, athletes continued to participate in team-mandated pitching, throwing, strength training, and conditioning activities, while also engaging in self-directed training between sessions. As a result, inter-individual variability in neuromuscular fatigue, recovery status, and recent training load may have influenced CMJ performance and contributed to differences in participant-specific responses, while recording jump averages—rather than maximum performance—may also produce different results. Such workload variability represents a potential covariate that may partially account for the heterogeneous responses observed across belt conditions.
Finally, direct quantification of intra-abdominal pressure was not performed. As a result, actual IAP levels likely varied across individuals despite standardized belt settings, potentially contributing to differences in CMJ responses. Future studies incorporating direct or indirect measures of IAP would allow for more precise dose–response analyses linking specific IAP levels to changes in lower-body power. Moreover, some individual improvements in CMJ performance may be attributable to factors such as segmental anthropometrics, neuromuscular coordination strategies, or training history rather than the belt intervention itself. Controlling for these covariates in future work may help clarify the independent contribution of IAP augmentation to lower-body power performance.
In summary, while the present findings suggest that a stretch-resistant, externally facilitated, IAP-configured belt may aid in preserving or enhancing lower-body power following pitching-related fatigue, these results should be interpreted cautiously. Expanding this exploratory work to larger, more controlled cohorts with direct IAP measurement is warranted to establish both statistical significance and meaningful effect sizes. Therefore, interpreting the results of the current study should be considered inferential at this time. Despite these limitations, the present study provides preliminary evidence supporting the role of IAP modulation as a potential strategy for maintaining explosive lower-body performance in baseball pitchers.

6. Conclusions

This exploratory study provides preliminary evidence that 5 mm stretch-resistant belt, configured to raise intra-abdominal pressure (IAP), can influence pre- and post-pitching lower-body neuromuscular performance in collegiate pitchers. The RIAP condition showed more fatigue resistance, preserved max CMJ height, and lessened post-pitch CMJ power loss. Maximal cinching tended to compromise post-pitch lower-body power and inferred the need to individualize IAP-configured belt settings that may show greater performance and injury protection benefits with more extensive studies and direct IAP measurement.

Author Contributions

Conceptualization, R.L.C.; methodology, R.L.C.; software, M.B. and M.S.; validation, R.L.C., M.S. and M.B.; formal analysis, M.B. and M.S.; investigation, R.L.C.; resources, R.L.C.; data curation, M.B.; writing—original draft preparation, R.L.C. and M.S.; writing—review and editing, R.L.C. and M.S.; visualization, R.L.C.; supervision, R.L.C.; project administration, R.L.C.; funding acquisition, R.L.C. All authors have read and agreed to the published version of the manuscript.

Funding

This research received no external funding.

Institutional Review Board Statement

The study was conducted according to the guidelines of the Declaration of Helsinki, and approved by the Institutional Review Board at Arizona Christian University in accordance with federal guidelines (21 CFR 56.108).

Informed Consent Statement

Informed consent was obtained from all subjects involved in the study.

Data Availability Statement

Public data access is not available do to privacy and ethical restrictions.

Acknowledgments

We are grateful for the diligent work of Jamie Balivec, Richard Gannon III, and Brock Johnson for their dedicated work collecting data, preparing the athletes for simulated games, and in catching pitchers over the course of the study. The researchers would also like extend gratitude to the varsity baseball program at Arizona Christian University and for the participation of the players in this work. Lastly, we extend our appreciation to Core Technology USA Inc. for their dedicated effort to sports science in injury prevention through sponsoring this exploratory study.

Conflicts of Interest

One of the co-authors owns and operates a consulting firm focused on throwing arm injury protection and rehabilitation and contributes to the technological design, implementation, and education for a company focused on reducing throwing arm injury risks with a validated portable monitoring tool and companion smartphone application. No authors of this work hold ownership roles, patents, or other financial interests tied to the product or outcomes in this study.

References

  1. Howenstein, J.; Kipp, K.; Sabick, M.B. Energy Flow Analysis to Investigate Youth Pitching Velocity and Efficiency. Med. Sci. Sports Exerc. 2019, 51, 523–531. [Google Scholar] [CrossRef]
  2. Pryhoda, M.K.; Sabick, M.B. Lower body energy generation, absorption, and transfer in youth baseball pitchers. Front. Sports Act. Living 2022, 4, 975107. [Google Scholar] [CrossRef]
  3. Aguinaldo, A.L.; Buttermore, J.; Chambers, H. Effects of Upper Trunk Rotation on Shoulder Joint Torque among Baseball Pitchers of Various Levels. J. Appl. Biomech. 2007, 23, 42–51. [Google Scholar] [CrossRef]
  4. Aguinaldo, A.L.; Escamilla, R.F. Segmental Power Analysis of Sequential Body Motion and Elbow Valgus Loading During Baseball Pitching: Comparison Between Professional and High School Baseball Players. Orthop. J. Sports Med. 2019, 7, 2325967119827924. [Google Scholar] [CrossRef]
  5. Davis, J.T.; Limpisvasti, O.; Fluhme, D.; Mohr, K.J.; Yocum, L.A.; ElAttrache, N.S.; Jobe, F.W. The Effect of Pitching Biomechanics on the Upper Extremity in Youth and Adolescent Baseball Pitchers. Am. J. Sports Med. 2009, 37, 1484–1491. [Google Scholar] [CrossRef]
  6. Lin, H.; Su, F.; Nakamura, M.; Chao, E.Y.S. Complex chain of momentum transfer of body segments in the baseball pitching motion. J. Chin. Inst. Eng. 2003, 26, 861–868. [Google Scholar] [CrossRef]
  7. Chaudhari, A.M.W.; McKenzie, C.S.; Borchers, J.R.; Best, T.M. Lumbopelvic control and pitching performance of professional baseball pitchers. J. Strength Cond. Res. 2011, 25, 2127–2132. [Google Scholar] [CrossRef]
  8. Pitch Smart. MLB.com. Available online: https://www.mlb.com/pitch-smart (accessed on 27 November 2025).
  9. Birfer, R.; Sonne, M.W.; Holmes, M.W. Manifestations of muscle fatigue in baseball pitchers: A systematic review. PeerJ 2019, 7, e7390. [Google Scholar] [CrossRef]
  10. Escamilla, R.F.; Barrentine, S.W.; Fleisig, G.S.; Zheng, N.; Takada, Y.; Kingsley, D.; Andrews, J.R. Pitching Biomechanics as a Pitcher Approaches Muscular Fatigue during a Simulated Baseball Game. Am. J. Sports Med. 2007, 35, 23–33. [Google Scholar] [CrossRef] [PubMed]
  11. Yeh, H.-C.; Ho, C.-A.; Hsieh, C.-H.; Lau, H.-T.; Chang, E.-Y.; Hsu, C.-W.; Lin, W.-H.; Ho, C.-S. The impact of accumulated pitching counts on performance and lower body neuromuscular fatigue in baseball players: A simulated game analysis. Sports Biomech. 2025, 24, 3624–3636. [Google Scholar] [CrossRef] [PubMed]
  12. Tripp, B.L.; Yochem, E.M.; Uhl, T.L. Recovery of Upper Extremity Sensorimotor System Acuity in Baseball Athletes After a Throwing-Fatigue Protocol. J. Athl. Train. 2007, 42, 452–457. [Google Scholar]
  13. Okoroha, K.R.; Meldau, J.E.; Lizzio, V.A.; Meta, F.; Stephens, J.P.; Moutzouros, V.; Makhni, E.C. Effect of Fatigue on Medial Elbow Torque in Baseball Pitchers: A Simulated Game Analysis. Am. J. Sports Med. 2018, 46, 2509–2513. [Google Scholar] [CrossRef] [PubMed]
  14. Erickson, B.J.; Nwachukwu, B.U.; Rosas, S.; Schairer, W.W.; McCormick, F.M.; Bach, B.R.; Bush-Joseph, C.A.; Romeo, A.A. Trends in Medial Ulnar Collateral Ligament Reconstruction in the United States: A Retrospective Review of a Large Private-Payer Database From 2007 to 2011. Am. J. Sports Med. 2015, 43, 1770–1774. [Google Scholar] [CrossRef]
  15. Conte, S.; Camp, C.L.; Dines, J.S. Injury Trends in Major League Baseball Over 18 Seasons: 1998–2015. Am. J. Orthop. Belle Mead NJ 2016, 45, 116–123. [Google Scholar] [PubMed]
  16. Miyamoto, K.; Iinuma, N.; Maeda, M.; Wada, E.; Shimizu, K. Effects of abdominal belts on intra-abdominal pressure, intramuscular pressure in the erector spinae muscles and myoelectrical activities of trunk muscles. Clin. Biomech. 1999, 14, 79–87. [Google Scholar] [CrossRef] [PubMed]
  17. Frank, C.; Kobesova, A.; Kolar, P. Dynamic Neuromuscular Stabilization & Sports Rehabilitation. Int. J. Sports Phys. Ther. 2013, 8, 62–73. [Google Scholar]
  18. Callison, E.R.; Berg, K.E.; Slivka, D.R. Grunting in tennis increases ball velocity but not oxygen cost. J. Strength Cond. Res. 2014, 28, 1915–1919. [Google Scholar] [CrossRef]
  19. Crotin, R.L.; Iniguez, X.R.; Carlson, E.M. Proximal Chain Strength and Coordination Concepts to Maximize Injury Protection and Transfer of Training Effects for Competitive Baseball Players. Strength Cond. J. 2024, 46, 224–233. [Google Scholar] [CrossRef]
  20. Ramsey, D.K.; Crotin, R.L. Effect of Stride Length on Overarm Throwing Delivery: Part II: An Angular Momentum Response. Hum. Mov. Sci. 2016, 46, 30–38. [Google Scholar] [CrossRef]
  21. Crotin, R.L.; Conforti, C. An Exploratory Study on Subject-Specific Throwing Arm Strength Responses to a Novel Intra-Abdominal Pressure Belt Worn by Collegiate Baseball Pitchers. Sports 2025, 13, 113. [Google Scholar] [CrossRef]
  22. Crotin, R.L.; Conforti, C. A Case Study Exploring the Effects of a Novel Intra-Abdominal Pressure Belt on Fastball and Change-Up Velocity, Command, and Deception Among Collegiate Baseball Pitchers. Appl. Sci. 2024, 14, 10471. [Google Scholar] [CrossRef]
  23. Walters, S.; Hoffman, B.; MacAskill, W.; Johnson, M.A.; Sharpe, G.R.; Mills, D.E. The control of respiratory pressures and neuromuscular activation to increase force production in trained martial arts practitioners. Eur. J. Appl. Physiol. 2021, 121, 3333–3347. [Google Scholar] [CrossRef] [PubMed]
  24. Zink, A.J.; Whiting, W.C.; Vincent, W.J.; McLaine, A.J. The effects of a weight belt on trunk and leg muscle activity and joint kinematics during the squat exercise. J. Strength Cond. Res. 2001, 15, 235–240. [Google Scholar]
  25. Stone, B.L.; Schilling, B.K. Neuromuscular Fatigue in Pitchers Across a Collegiate Baseball Season. J. Strength Cond. Res. 2020, 34, 1933–1937. [Google Scholar] [CrossRef]
  26. Amonette, W.E.; Vazquez, J.; Coleman, A.E. Cross-Sectional Analysis of Ground Reaction Forces During Jumps in Professional Baseball Players. J. Strength Cond. Res. 2023, 37, 1616–1622. [Google Scholar] [CrossRef]
  27. Wong, R.; Laudner, K.; Amonette, W.; Vazquez, J.; Evans, D.; Meister, K. Relationships Between Lower Extremity Power and Fastball Spin Rate and Ball Velocity in Professional Baseball Pitchers. J. Strength Cond. Res. 2023, 37, 823–828. [Google Scholar] [CrossRef]
  28. Yanagisawa, O.; Taniguchi, H. Changes in lower extremity function and pitching performance with increasing numbers of pitches in baseball pitchers. J. Exerc. Rehabil. 2018, 14, 430–435. [Google Scholar] [CrossRef]
  29. Bobbert, M.F.; Casius, L.J.R. Is the Effect of a Countermovement on Jump Height due to Active State Development? Med. Sci. Sports Exerc. 2005, 37, 440–446. [Google Scholar] [CrossRef]
  30. Robineau, J.; Jouaux, T.; Lacroix, M.; Babault, N. Neuromuscular Fatigue Induced by a 90-Minute Soccer Game Modeling. J. Strength Cond. Res. 2012, 26, 555–562. [Google Scholar] [CrossRef] [PubMed]
  31. Sayers, S.P.; Harackiewicz, D.V.; Harman, E.A.; Frykman, P.N.; Rosenstein, M.T. Cross-validation of three jump power equations. Med. Sci. Sports Exerc. 1999, 31, 572–577. [Google Scholar] [CrossRef] [PubMed]
  32. Chalmers, P.N.; Erickson, B.J.; Ball, B.; Romeo, A.A.; Verma, N.N. Fastball Pitch Velocity Helps Predict Ulnar Collateral Ligament Reconstruction in Major League Baseball Pitchers. Am. J. Sports Med. 2016, 44, 2130–2135. [Google Scholar] [CrossRef] [PubMed]
  33. Bakshi, N.K.; Inclan, P.M.; Kirsch, J.M.; Bedi, A.; Agresta, C.; Freehill, M.T. Current Workload Recommendations in Baseball Pitchers: A Systematic Review. Am. J. Sports Med. 2020, 48, 229–241. [Google Scholar] [CrossRef]
  34. Crotin, R.; Ramsey, D. Grip Strength Measurement in Baseball Pitchers: A Clinical Examination to Indicate Stride Length Inefficiency. Int. J. Sports Phys. Ther. 2021, 16, 1330–1337. [Google Scholar] [CrossRef]
  35. Erickson, B.J.; Buchheit, P.; Rauch, J.; Ciccotti, M.G.; Paul, R.; Cohen, S.B. Change in Grip and Pinch Strength Over the Course of a Game in Professional Baseball Pitchers. Sports Health Multidiscip. Approach 2025, 17, 1272–1278. [Google Scholar] [CrossRef]
  36. Hattori, H.; Akasaka, K.; Otsudo, T.; Hall, T.; Amemiya, K.; Mori, Y.; Sakaguchi, K.; Tachibana, Y. Changes in medial elbow elasticity and joint space gapping during maximal gripping: Reliability and validity in evaluation of the medial elbow joint using ultrasound elastography. J. Shoulder Elb. Surg. 2020, 29, e245–e251. [Google Scholar] [CrossRef]
  37. Michener, L.A.; Barrack, A.J.; Liebeskind, B.Y.; Zerega, R.J.; Sum, J.C.; Crotin, R.L.; Plummer, H.A. Professional Baseball Player Type and Geographic Region of Origin Impacts Shoulder External and Internal Rotation Strength. Int. J. Sports Phys. Ther. 2021, 16, 1126–1134. [Google Scholar] [CrossRef]
  38. Qiao, M.; Crotin, R.L.; Szymanski, D.J. An Inferential Investigation Into Countermovement Jump Determinants of Ulnar Collateral Ligament Injuries in Collegiate Baseball Pitchers. Am. J. Sports Med. 2025, 53, 1202–1209. [Google Scholar] [CrossRef]
  39. Mayberry, J.; Mullen, S.; Murayama, S. What Can a Jump Tell Us About Elbow Injuries in Professional Baseball Pitchers? Am. J. Sports Med. 2020, 48, 1220–1225. [Google Scholar] [CrossRef]
  40. Olsen, S.J.; Fleisig, G.S.; Dun, S.; Loftice, J.; Andrews, J.R. Risk Factors for Shoulder and Elbow Injuries in Adolescent Baseball Pitchers. Am. J. Sports Med. 2006, 34, 905–912. [Google Scholar] [CrossRef] [PubMed]
  41. Kline, D.; Fischer, S.K.; Bullock, G.S.; Kissenberth, M.J.; Shanley, E.; Thigpen, C.A. Risk Factors and Injury Prevention in the Throwing Athlete. Arthrosc. Sports Med. Rehabil. 2025, 7, 101037. [Google Scholar] [CrossRef] [PubMed]
  42. Erickson, B.J.; Sgori, T.; Chalmers, P.N.; Vignona, P.; Lesniak, M.; Bush-Joseph, C.A.; Verma, N.N.; Romeo, A.A. The Impact of Fatigue on Baseball Pitching Mechanics in Adolescent Male Pitchers. Arthrosc. J. Arthrosc. Relat. Surg. 2016, 32, 762–771. [Google Scholar] [CrossRef]
  43. Matsuda, R.; Hirano, Y.; Umakoshi, J.; Kimura, A. Energy flows with intentional changes in leg movements during baseball pitching. Front. Sports Act. Living 2025, 7, 1534596. [Google Scholar] [CrossRef] [PubMed]
  44. De Swart, A.F.M.J.; Van Trigt, B.; Wasserberger, K.; Hoozemans, M.J.M.; Veeger, D.H.E.J.; Oliver, G.D. Energy flow through the lower extremities in high school baseball pitching. Sports Biomech. 2025, 24, 2916–2930. [Google Scholar] [CrossRef] [PubMed]
  45. Dowling, B.; Manzi, J.E.; Raab, G.; Coladonato, C.; Dines, J.S.; Fleisig, G.S. The relationship among lead knee extension, fastball velocity and elbow torque in professional baseball pitchers. Sports Biomech. 2022, 23, 2664–2674. [Google Scholar] [CrossRef]
  46. Dowling, B.; Hodakowski, A.; Brusalis, C.M.; Luera, M.J.; Smith, C.D.; Verma, N.N.; Garrigues, G.E. Influence of Lead Knee Extension on Ball Velocity and Elbow Varus Torque in Professional and High School Baseball Pitchers. Orthop. J. Sports Med. 2024, 12, 23259671241257539. [Google Scholar] [CrossRef] [PubMed]
  47. Solomito, M.J.; Garibay, E.J.; Cohen, A.; Nissen, C.W. Lead knee flexion angle is associated with both ball velocity and upper extremity joint moments in collegiate baseball pitchers. Sports Biomech. 2024, 23, 2626–2636. [Google Scholar] [CrossRef]
  48. Ramsey, D.K.; Crotin, R.L. Stride Length Impacts on Sagittal Knee Biomechanics in Flat Ground Baseball Pitching. Appl. Sci. 2022, 12, 995. [Google Scholar] [CrossRef]
  49. Ramsey, D.K.; Crotin, R.L. Influence of Stride Length on Pelvic–Trunk Separation and Proximal Plyometrics in Baseball Pitching. Life 2025, 15, 1440. [Google Scholar] [CrossRef]
Figure 1. Images illustrating belt types and how they were worn to evaluate lower-body power characteristics before and after two simulated innings pitched: (A) pitcher wearing IAP-configured belt that is black in color at two-inches cinched; (B) pitcher at the bottom position of the countermovement jump wearing the IAP-configured belt that is black in color and worn at regular length; and (C) pitcher wearing his team-issued belt worn at regular length that is red in color.
Biomechanics 06 00053 g001
Table 1. Percentage of athletes with the best value within each belt condition at each time point.
VariableTimepoint2IN (Cinched)RIAPSB (Standard)Highest % (Best Value)
MAXSCMJPre38%23%38%2IN,
MAXSCMJPost8%31%62%
SCMJPWRPre38%31%31%2IN
SCMJPWRPost23%38%38%SB, IAP
MAXCMJPre38%31%38%2IN, SB
MAXCMJPost8%38%54%SB
CMJPWRPre31%31%38%SB
CMJPWRPost0%54%46%IAP
EURCVPre31%54%15%IAP
EURCVPost46%46%8%2IN, IAP
MAXEURPre31%31%46%SB
MAXEURPost23%38%46%SB
If ties occurred (equal best values), athletes were counted in each tied belt condition. 2IN, Configured intra-abdominal pressure belt worn with two-inch cinch; RIAP, Configured intra-abdominal pressure belt worn at regular length; SB, Standard belt worn at regular length; MAXSCMJ, Maximum Static Countermovement Jump; SCMJPWR, Static Countermovement Jump Power; MAXCMJ, Maximum Countermovement Jump; CMJPWR, Countermovement Jump Power; EURCV, Eccentric Utilization Ratio Coefficient of Variation; MAXEUR, Maximum Eccentric Utilization Ratio.
Table 2. Percentage of athletes who maintained or improved lower-body power metrics from pre-to-post pitching within each belt condition.
Variable2IN (Cinched)RIAPSB (Standard)Highest % (Maintained/Improved)
MAXSCMJ15%46%38%IAP
SCMJPWR15%46%31%IAP
MAXCMJ23%62%46%IAP
CMJPWR23%62%46%IAP
EURCV54%38%38%2IN
MAXEUR62%62%54%2IN, IAP
Maintenance/improvement defined as equal to or greater power outcomes in the post-game analysis versus pre-game; for EURCV, values closer to zero were considered favorable. 2IN, Configured intra-abdominal pressure belt worn with two-inch cinch; RIAP, Configured intra-abdominal pressure belt worn at regular length; SB, Standard belt worn at regular length; MAXSCMJ, Maximum Static Countermovement Jump; SCMJPWR, Static Countermovement Jump Power; MAXCMJ, Maximum Countermovement Jump; CMJPWR, Countermovement Jump Power; EURCV, Eccentric Utilization Ratio Coefficient of Variation; MAXEUR, Maximum Eccentric Utilization Ratio.
Table 3. Significant pre-pitching belt-related differences in lower body performance.
Variable2IN Mean ± SD [95% CI]RIAP Mean ± SD [95% CI]SB Mean ± SD [95% CI]F (df1, df2)pPartial ηp2 [95% CI]Significant Bonferroni Pairwise Effects
MAXSCMJ (cm)23.18 ± 2.34 [21.77, 24.60]22.96 ± 2.48 [21.46, 24.46]23.32 ± 2.68 [21.71, 24.94]F(2, 24) = 0.500.620.040 [0.014, 0.218] (small)NS
SCMJPWR (W)5523.04 ± 525.66 [5205.39, 5840.70]5498.13 ± 549.66 [5165.97, 5830.29]5526.69 ± 530.45 [5206.14, 5847.23]F(2, 24) = 0.140.870.012 [0.004, 0.271] (small)NS
MAXCMJ (cm)27.93 ± 2.73 [26.28, 29.58]27.78 ± 2.77 [26.11, 29.45]28.14 ± 2.98 [26.34, 29.94]F(2, 24) = 0.440.650.035 [0.003, 0.310] (small)NS
CMJPWR (W)6254.80 ± 594.69 [5895.43, 6614.16]6240.56 ± 615.95 [5868.34, 6612.78]6269.11 ± 594.61 [5909.80, 6628.43]F(2, 24) = 0.110.900.009 [0.002, 0.309] (trivial)NS
EURCV (CV)2.67 ± 1.26 [1.91, 3.43]2.50 ± 2.04 [1.27, 3.73]2.93 ± 1.41 [2.08, 3.78]F(2, 24) = 0.200.820.016 [0.002, 0.319] (small)NS
MAXEUR (%)1.24 ± 0.06 [1.20, 1.27]1.24 ± 0.06 [1.20, 1.28]1.25 ± 0.06 [1.21, 1.29]F(2, 24) = 0.190.830.016 [0.003, 0.273] (small)NS
Lower-body-power outcomes in the pre-game analysis; for EURCV, values closer to zero were considered favorable. No significant differences were seen across IAP-configured belts or standard belt. No Bonferroni-corrected pairwise belt differences were identified at the pre-pitching time point. 2IN, Configured intra-abdominal pressure belt worn with two inch cinch; RIAP, Configured intra-abdominal pressure belt worn at regular length; SB, Standard belt worn at regular length; MAXSCMJ, Maximum Static Countermovement Jump; SCMJPWR, Static Countermovement Jump Power; MAXCMJ, Maximum Countermovement Jump; CMJPWR, Countermovement Jump Power; EURCV, Eccentric Utilization Ratio Coefficient of Variation; MAXEUR, Maximum Eccentric Utilization Ratio.
Table 4. Significant post-pitching belt-related differences in lower-body performance.
Variable2IN Mean ± SD [95% CI]RIAP Mean ± SD [95% CI]SB Mean ± SD [95% CI]F (df1, df2)pPartial ηp2 [95% CI]Significant Bonferroni Pairwise Effects
MAXSCMJ (cm)22.36 ± 2.50 [20.85, 23.87]22.98 ± 2.29 [21.60, 24.36]23.11 ± 2.38 [21.67, 24.54]F(2, 24) = 3.690.040.235 [0.102, 0.580] (large)SB vs. 2IN: p = 0.033; dz = 0.83 [0.12, 1.54] (large)
SCMJPWR (W)5396.14 ± 542.77 [5068.15, 5724.13]5500.51 ± 530.62 [5179.86, 5821.15]5493.48 ± 495.83 [5193.85, 5793.11]F(2, 24) = 3.090.070.205 [0.050, 0.549] (large)NS
MAXCMJ (cm)27.05 ± 2.86 [25.32, 28.78]27.74 ± 2.80 [26.05, 29.43]27.76 ± 3.14 [25.87, 29.66]F(2, 24) = 3.010.070.201 [0.083, 0.650] (large)NS
CMJPWR (W)6118.41 ± 628.96 [5738.33, 6498.48]6234.63 ± 603.46 [5869.96, 6599.30]6211.00 ± 588.10 [5855.62, 6566.39]F(2, 24) = 3.370.050.220 [0.097, 0.491] (large)RIAP vs. 2IN: p = 0.010; dz = 1.01 [0.26, 1.76] (large)
EURCV (CV)3.56 ± 2.28 [2.18, 4.93]2.94 ± 1.96 [1.75, 4.13]3.38 ± 1.75 [2.33, 4.44]F(2, 24) = 0.380.690.031 [0.018, 0.320] (small)NS
MAXEUR (%)1.24 ± 0.06 [1.21, 1.28]1.25 ± 0.06 [1.21, 1.28]1.25 ± 0.07 [1.21, 1.29]F(2, 24) = 0.080.920.007 [0.004, 0.196] (trivial)NS
Lower-body-power outcomes in the post-game analysis; for EURCV, values closer to zero were considered favorable. The regular IAP-configured belt performed better than the 2IN belt setting for most lower-body power measures and was equivalent in most cases to the SB. Maximum jump heights were statistically similar between the RIAP and SB. Large effects were seen between SB static jump height and 2IN, and RIAP max countermovement jump height and power than 2IN. In both instances, 2IN performed significantly less on lower body power measures post-pitching. 2IN, Configured intra-abdominal pressure belt worn with two inch cinch; RIAP, Configured intra-abdominal pressure belt worn at regular length; SB, Standard belt worn at regular length; MAXSCMJ, Maximum Static Countermovement Jump; SCMJPWR, Static Countermovement Jump Power; MAXCMJ, Maximum Countermovement Jump; CMJPWR, Countermovement Jump Power; EURCV, Eccentric Utilization Ratio Coefficient of Variation; MAXEUR, Maximum Eccentric Utilization Ratio.
Table 5. Pre-to-post pitching changes in lower body jump height within each belt condition.
VariableBeltPre Mean ± SD [95% CI]Post Mean ± SD [95% CI]Δ Post–Pre [95% CI]pCohen’s dzInterpretation
MAXSCMJ2IN23.18 ± 2.34 [21.77, 24.60]22.36 ± 2.50 [20.85, 23.87]−0.82 [−1.21, −0.44]<0.001−1.29 (very large)Significant decline
MAXSCMJRIAP22.96 ± 2.48 [21.46, 24.46]22.98 ± 2.29 [21.60, 24.36]0.02 [−0.60, 0.63]0.960.02 (small)Maintained
MAXSCMJSB23.32 ± 2.68 [21.71, 24.94]23.11 ± 2.38 [21.67, 24.54]−0.22 [−0.88, 0.45]0.49−0.20 (small)Maintained
MAXCMJ2IN27.93 ± 2.73 [26.28, 29.58]27.05 ± 2.86 [25.32, 28.78]−0.88 [−1.59, −0.18]0.02−0.76 (medium)Significant decline
MAXCMJRIAP27.78 ± 2.77 [26.11, 29.45]27.74 ± 2.80 [26.05, 29.43]−0.04 [−0.76, 0.68]0.90−0.03 (small)Maintained
MAXCMJSB28.14 ± 2.98 [26.34, 29.94]27.76 ± 3.14 [25.87, 29.66]−0.38 [−1.16, 0.41]0.32−0.29 (small)Maintained
Lower-body jump height outcomes to evaluate fatigue impacts. The regular IAP-configured belt performed similarly to the standard belt in maintaining performance, while the 2IN had lower jump heights. 2IN, Configured intra-abdominal pressure belt worn with two-inch cinch; RIAP, Configured intra-abdominal pressure belt worn at regular length; SB, Standard belt worn at regular length; MAXSCMJ, Maximum Static Countermovement Jump; MAXCMJ, Maximum Countermovement Jump.
Table 6. Pre-to-post pitching changes in lower-body jump power within each belt condition.
VariableBeltPre Mean ± SD [95% CI]Post Mean ± SD [95% CI]ΔPost–Pre [95% CI]pCohen’s dzInterpretation
SCMJPWR2IN5523.04 ± 525.66 [5205.39, 5840.70]5396.14 ± 542.77 [5068.15, 5724.13]−126.90 [−186.45, −67.35]<0.001−1.29 (very large)Significant decline; reduced concentric power
SCMJPWRRIAP5498.13 ± 549.66 [5165.97, 5830.29]5500.51 ± 530.62 [5179.86, 5821.15]2.37 [−92.33, 97.07]0.9570.02 (small)Maintained static jump power
SCMJPWRSB5526.69 ± 530.45 [5206.14, 5847.23]5493.48 ± 495.83 [5193.85, 5793.11]−33.21 [−135.26, 68.84]0.492−0.20 (small)Maintained static jump power
CMJPWR2IN6254.80 ± 594.69 [5895.43, 6614.16]6118.41 ± 628.96 [5738.33, 6498.48]−136.39 [−245.10, −27.68]0.018−0.76 (medium)Significant decline; impaired stretch-shortening power
CMJPWRRIAP6240.56 ± 615.95 [5868.34, 6612.78]6234.63 ± 603.46 [5869.96, 6599.30]−5.93 [−116.86, 105.00]0.909−0.03 (small)Maintained
CMJPWRSB6269.11 ± 594.61 [5909.80, 6628.43]6211.00 ± 588.10 [5855.62, 6566.39]−58.11 [−179.30, 63.08]0.317−0.29 (small)Maintained
Lower-body jump power outcomes to evaluate fatigue impacts. The IAP-configured belt at regular length, and the standard belt, both performed better at maintaining lower body power than the 2IN belt setting. 2IN, Configured intra-abdominal pressure belt worn with two-inch cinch; RIAP, Configured intra-abdominal pressure belt worn at regular length; SB, Standard belt worn at regular length; SCMJPWR, Static Countermovement Jump Power; CMJPWR, Countermovement Jump Power.
Disclaimer/Publisher’s Note: The statements, opinions and data contained in all publications are solely those of the individual author(s) and contributor(s) and not of MDPI and/or the editor(s). MDPI and/or the editor(s) disclaim responsibility for any injury to people or property resulting from any ideas, methods, instructions or products referred to in the content.