


Effects of Gait Speed and Sole Adjustment on Shoe–Floor Angles: Measurement Using Shoe-Type Sensor


Abstract
1. Introduction
2. Materials and Methods
2.1. Participants
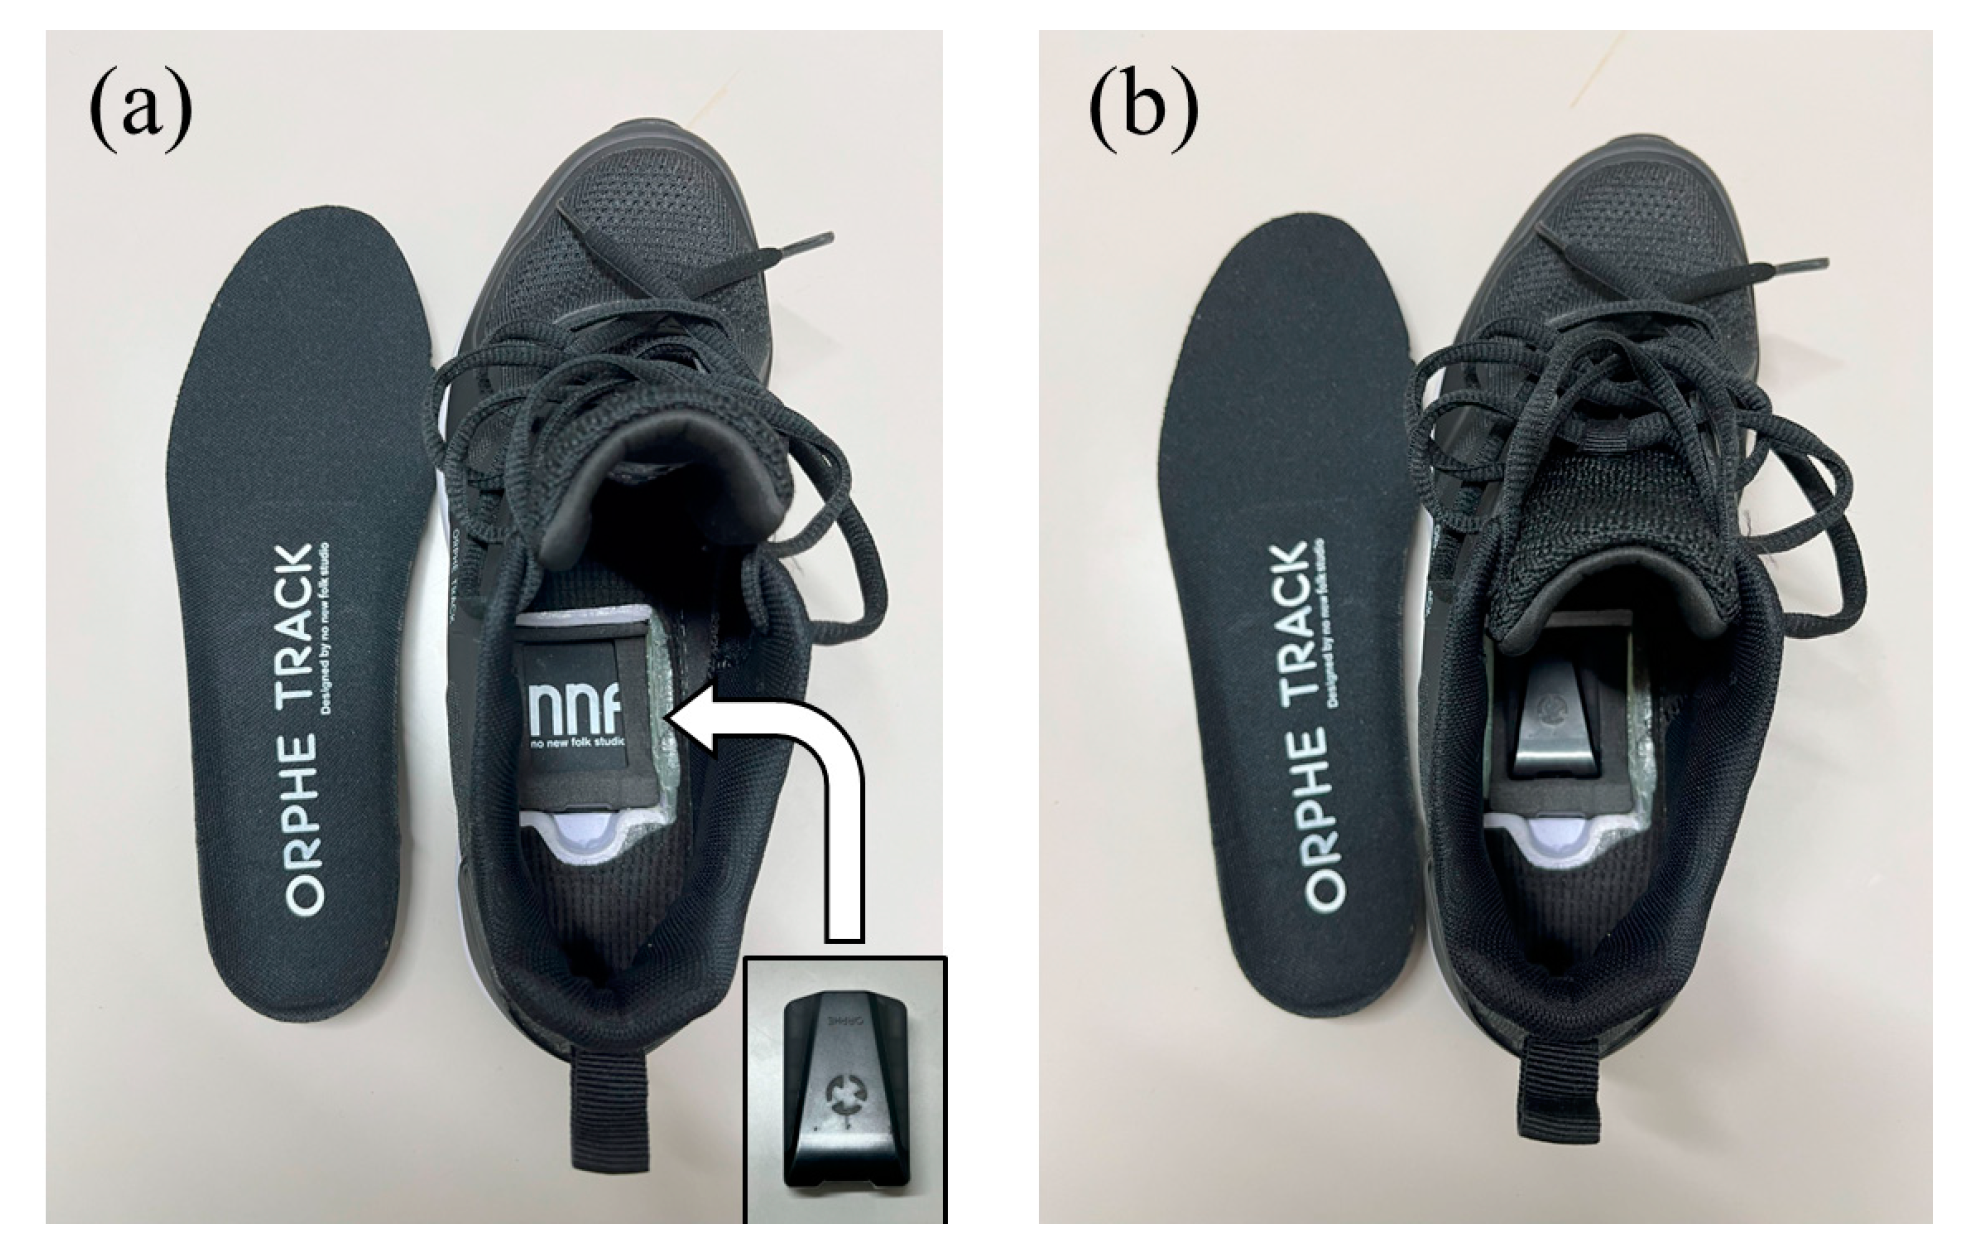
2.2. Procedure
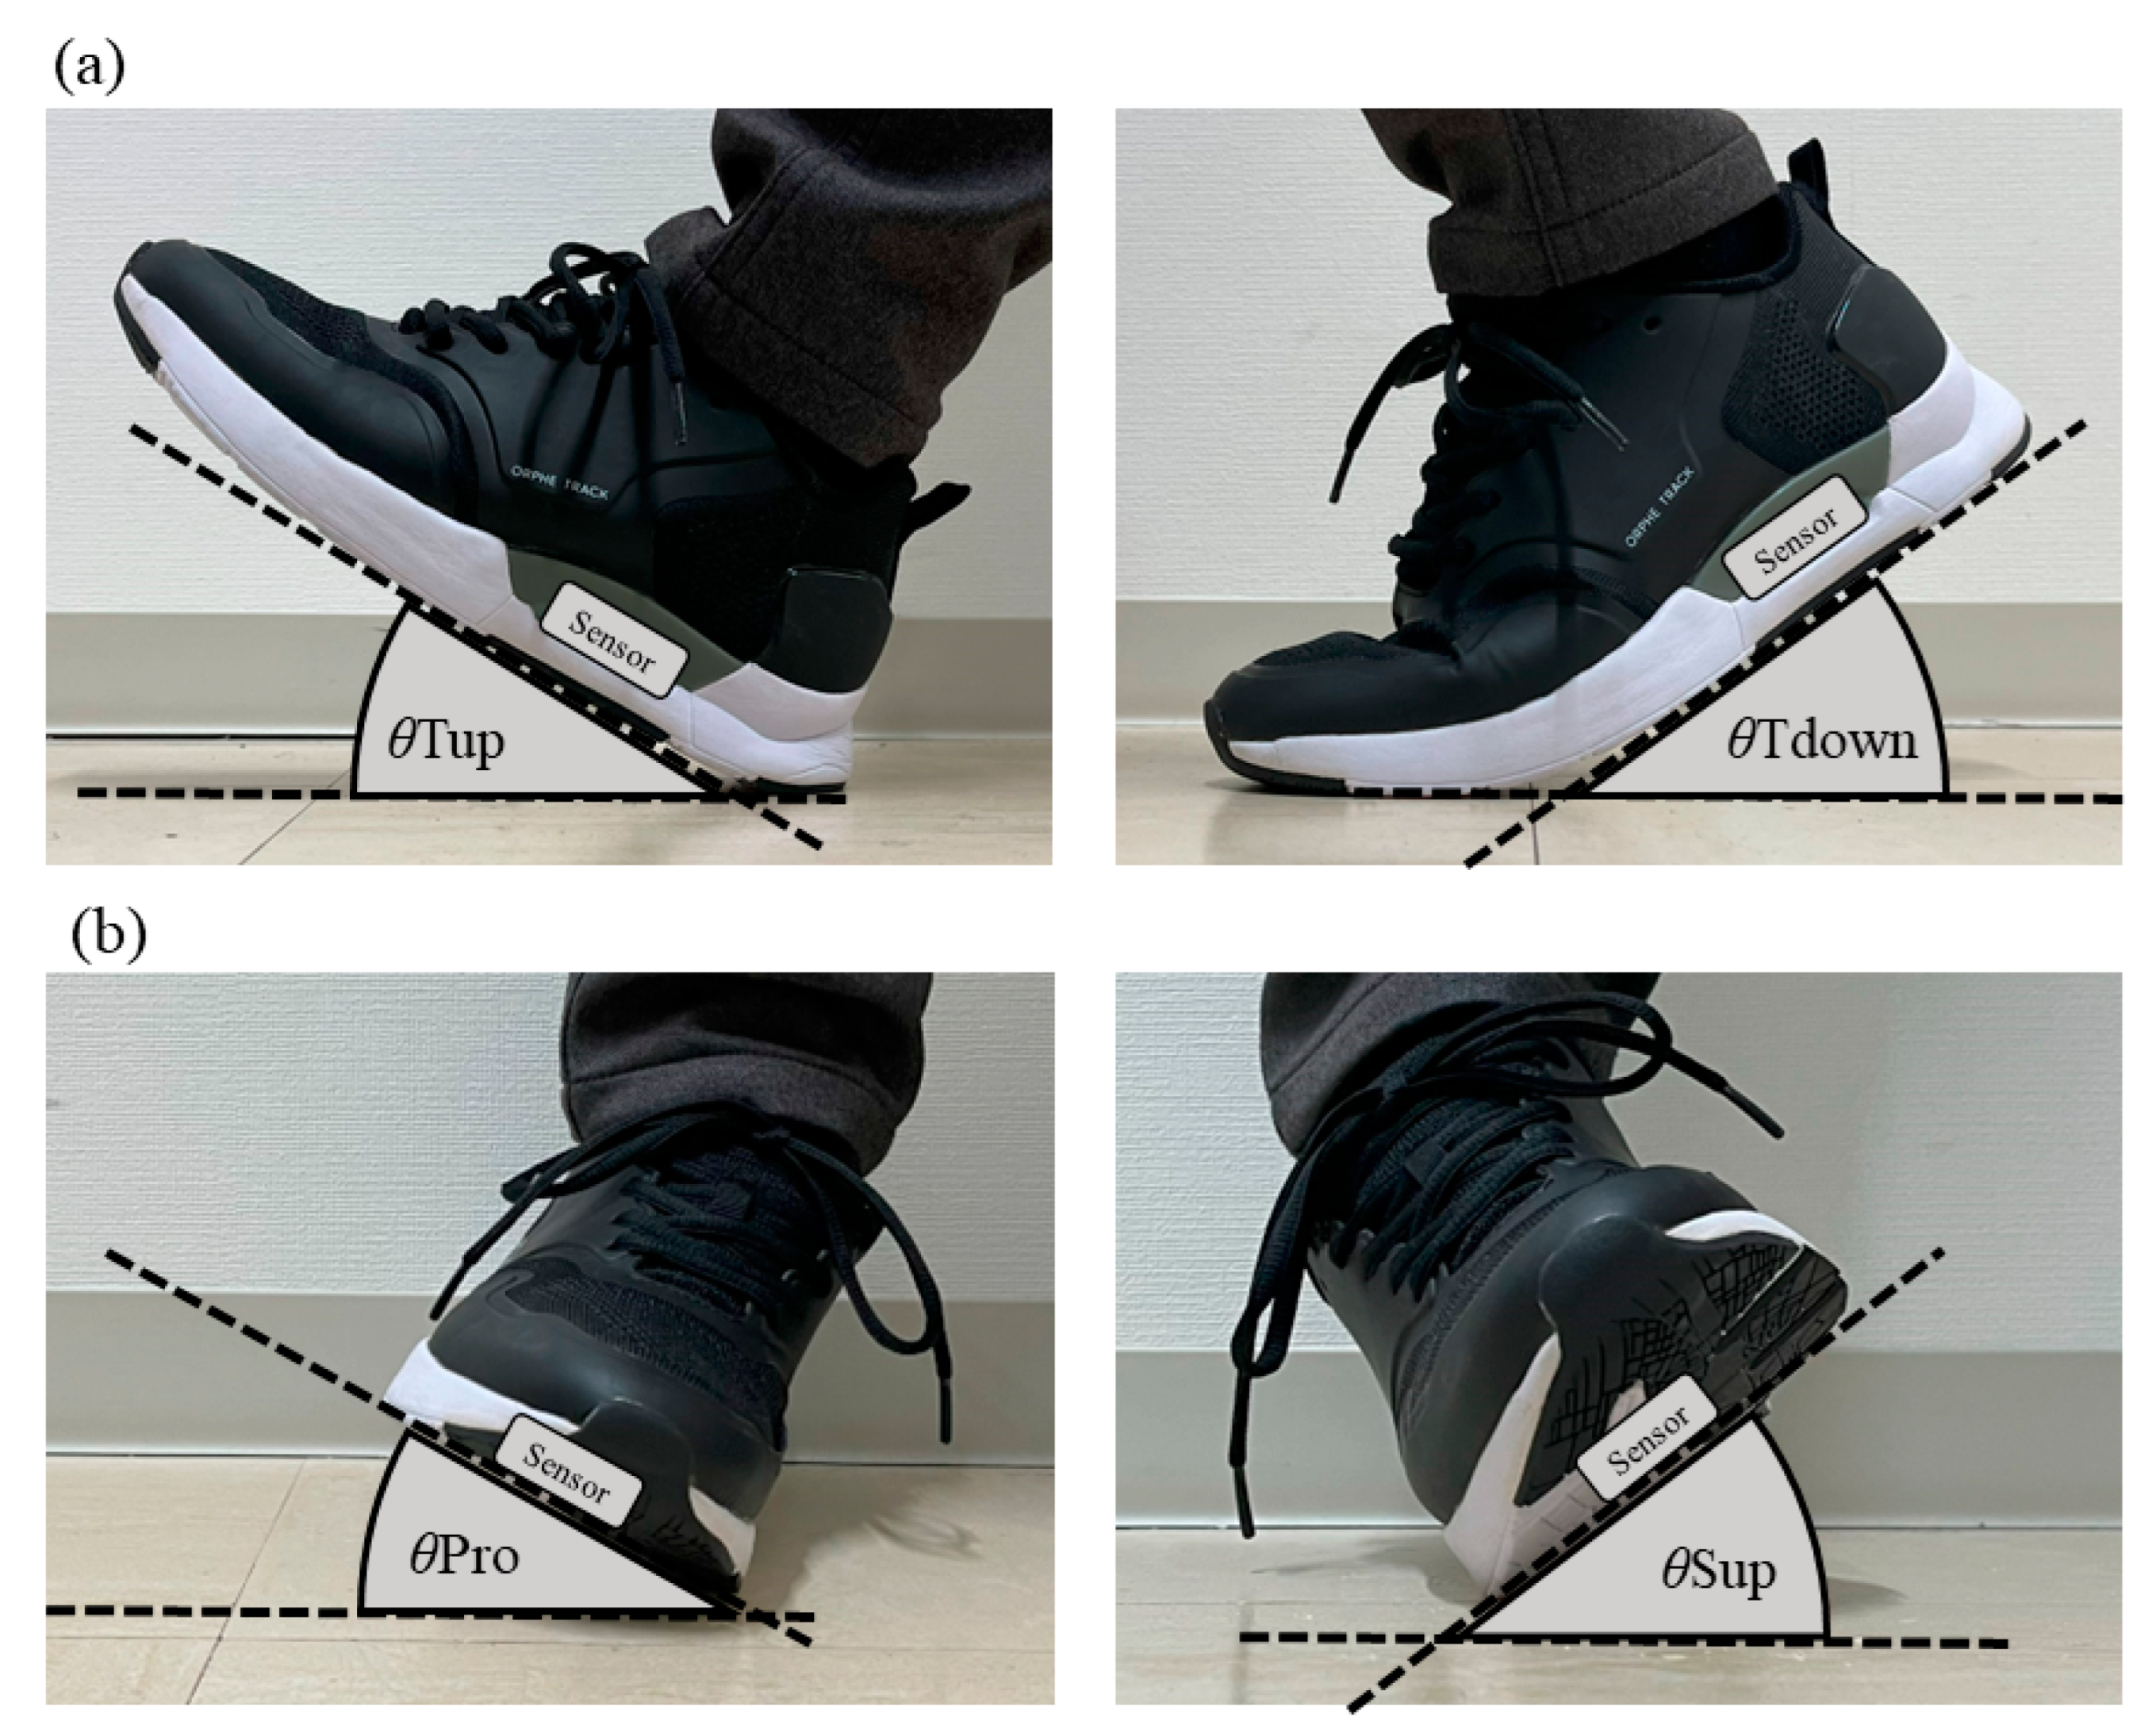
2.3. Data Analysis
2.4. Statistical Analysis
3. Results
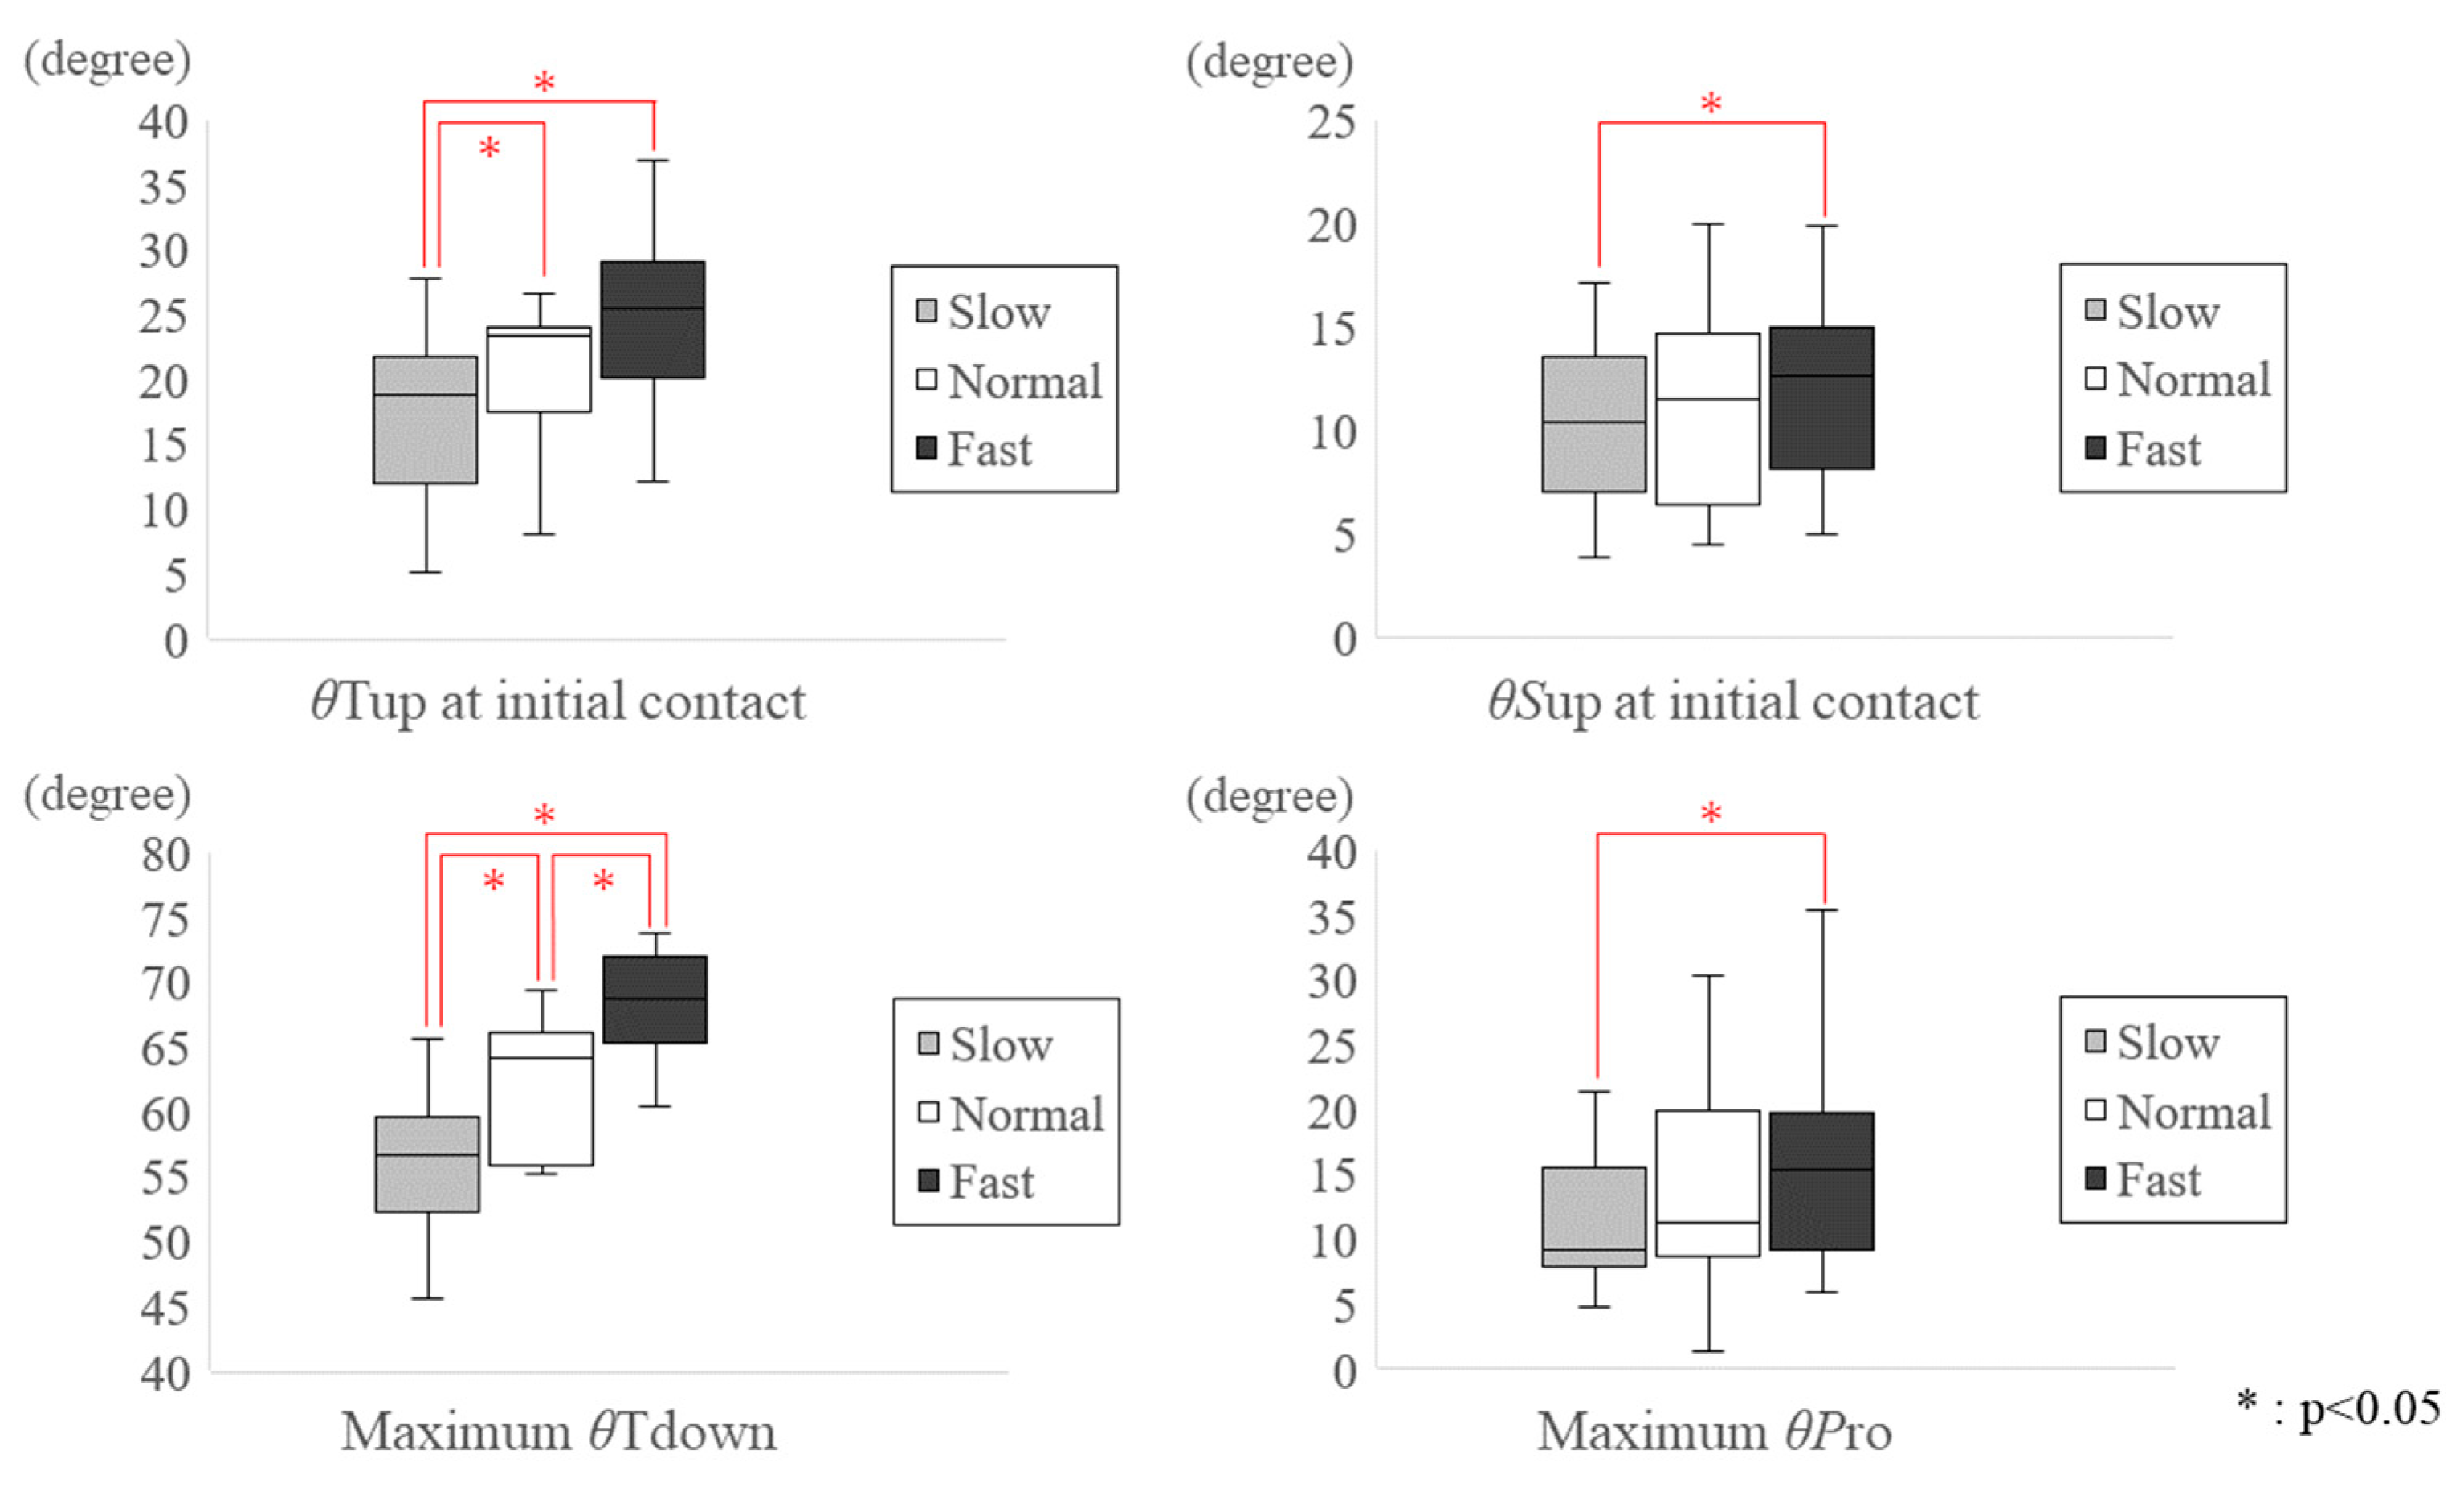
3.1. Change in Magnitude of SFA with Gait Speed
3.2. Change in Magnitude of SFA with Sole Adjustment
3.3. Change in Timing of SFA with Gait Speed and Sole Adjustment
4. Discussion
5. Conclusions
Supplementary Materials
Author Contributions
Funding
Institutional Review Board Statement
Informed Consent Statement
Data Availability Statement
Acknowledgments
Conflicts of Interest
References
- Franklin, S.; Grey, M.J.; Heneghan, N.; Bowen, L.; Li, F.X. Barefoot vs common footwear: A systematic review of the kinematic, kinetic and muscle activity differences during walking. Gait Posture 2015, 42, 230–239. [Google Scholar] [CrossRef] [PubMed]
- Keenan, G.S.; Franz, J.R.; Dicharry, J.; Della Croce, U.; Kerrigan, D.C. Lower limb joint kinetics in walking: The role of industry recommended footwear. Gait Posture 2011, 33, 350–355. [Google Scholar] [CrossRef] [PubMed]
- Lythgo, N.; Wilson, C.; Galea, M. Basic gait and symmetry measures for primary school-aged children and young adults whilst walking barefoot and with shoes. Gait Posture 2009, 30, 502–506. [Google Scholar] [CrossRef] [PubMed]
- Zhang, X.; Paquette, M.R.; Zhang, S. A comparison of gait biomechanics of flip-flops, sandals, barefoot and shoes. J. Foot Ankle Res. 2013, 6, 45. [Google Scholar] [CrossRef]
- Oeffinger, D.; Brauch, B.; Cranfill, S.; Hisle, C.; Wynn, C.; Hicks, R.; Augsburger, S. Comparison of gait with and without shoes in children. Gait Posture 1999, 9, 95–100. [Google Scholar] [CrossRef]
- Sacco, I.C.; Akashi, P.M.; Hennig, E.M. A comparison of lower limb EMG and ground reaction forces between barefoot and shod gait in participants with diabetic neuropathic and healthy controls. BMC Musculoskelet. Disord. 2010, 11, 24. [Google Scholar] [CrossRef]
- Vienne, A.; Barrois, R.P.; Buffat, S.; Ricard, D.; Vidal, P.P. Inertial Sensors to Assess Gait Quality in Patients with Neurological Disorders: A Systematic Review of Technical and Analytical Challenges. Front. Psychol. 2017, 8, 817. [Google Scholar] [CrossRef]
- Menz, H.B.; Lord, S.R.; Fitzpatrick, R.C. Acceleration patterns of the head and pelvis when walking on level and irregular surfaces. Gait Posture 2003, 18, 35–46. [Google Scholar] [CrossRef]
- Moe-Nilssen, R.; Helbostad, J.L. Interstride trunk acceleration variability but not step width variability can differentiate between fit and frail older adults. Gait Posture 2005, 21, 164–170. [Google Scholar] [CrossRef]
- Smidt, G.L.; Arora, J.S.; Johnston, R.C. Accelerographic analysis of several types of walking. Am. J. Phys. Med. 1971, 50, 285–300. [Google Scholar]
- Yentes, J.M.; Raffalt, P.C. Entropy Analysis in Gait Research: Methodological Considerations and Recommendations. Ann. Biomed. Eng. 2021, 49, 979–990. [Google Scholar] [CrossRef] [PubMed]
- Hausdorff, J.M. Gait dynamics, fractals and falls: Finding meaning in the stride-to-stride fluctuations of human walking. Hum. Mov. Sci. 2007, 26, 555–589. [Google Scholar] [CrossRef] [PubMed]
- Brégou Bourgeois, A.; Mariani, B.; Aminian, K.; Zambelli, P.Y.; Newman, C.J. Spatio-temporal gait analysis in children with cerebral palsy using, foot-worn inertial sensors. Gait Posture 2014, 39, 436–442. [Google Scholar] [CrossRef] [PubMed]
- Wert, D.M.; Brach, J.; Perera, S.; VanSwearingen, J.M. Gait biomechanics, spatial and temporal characteristics, and the energy cost of walking in older adults with impaired mobility. Phys. Ther. 2010, 90, 977–985. [Google Scholar] [CrossRef] [PubMed]
- Moyer, B.E.; Chambers, A.J.; Redfern, M.S.; Cham, R. Gait parameters as predictors of slip severity in younger and older adults. Ergonomics 2006, 49, 329–343. [Google Scholar] [CrossRef]
- Baba, T.; Watanabe, M.; Ogihara, H.; Handa, S.; Sasamoto, K.; Okada, S.; Okuizumi, H.; Kimura, T. Validity of temporo-spatial characteristics of gait as an index for fall risk screening in community-dwelling older people. J. Phys. Ther. Sci. 2023, 35, 265–269. [Google Scholar] [CrossRef]
- Menz, H.B.; Dufour, A.B.; Riskowski, J.L.; Hillstrom, H.J.; Hannan, M.T. Foot posture, foot function and low back pain: The Framingham Foot Study. Rheumatology 2013, 52, 2275–2282. [Google Scholar] [CrossRef]
- Kuhman, D.J.; Paquette, M.R.; Peel, S.A.; Melcher, D.A. Comparison of ankle kinematics and ground reaction forces between prospectively injured and uninjured collegiate cross country runners. Hum. Mov. Sci. 2016, 47, 9–15. [Google Scholar] [CrossRef]
- Uno, Y.; Ogasawara, I.; Konda, S.; Yoshida, N.; Otsuka, N.; Kikukawa, Y.; Tsujii, A.; Nakata, K. Validity of Spatio-Temporal Gait Parameters in Healthy Young Adults Using a Motion-Sensor-Based Gait Analysis System (ORPHE ANALYTICS) during Walking and Running. Sensors 2022, 23, 331. [Google Scholar] [CrossRef]
- van Hoeve, S.; Leenstra, B.; Willems, P.; Poeze, M.; Meijer, K. The effect of age and speed on foot and ankle kinematics assessed using a 4-segment foot model. Medicine 2017, 96, e7907. [Google Scholar] [CrossRef]
- Finley, F.R.; Cody, K.A. Locomotive characteristics of urban pedestrians. Arch. Phys. Med. Rehabil. 1970, 51, 423–426. [Google Scholar] [PubMed]
- Jung, T.; Kim, Y.; Kelly, L.E.; Wagatsuma, M.; Jung, Y.; Abel, M.F. Comparison of Treadmill and Overground Walking in Children and Adolescents. Percept. Mot. Ski. 2021, 128, 988–1001. [Google Scholar] [CrossRef] [PubMed]
- Madgwick, S.O.; Harrison, A.J.; Vaidyanathan, A. Estimation of IMU and MARG orientation using a gradient descent algorithm. In Proceedings of the 2011 IEEE International Conference on Rehabilitation Robotics, Zurich, Switzerland, 29 June–1 July 2011; Volume 2011, p. 5975346. [Google Scholar] [CrossRef]
- Huang, C.; Nihey, F.; Ihara, K.; Fukushi, K.; Kajitani, H.; Nozaki, Y.; Nakahara, K. Healthcare Application of In-Shoe Motion Sensor for Older Adults: Frailty Assessment Using Foot Motion during Gait. Sensors 2023, 23, 5446. [Google Scholar] [CrossRef] [PubMed]
- Ensink, C.J.; Hofstad, C.; Theunissen, T.; Keijsers, N.L.W. Assessment of Foot Strike Angle and Forward Propulsion with Wearable Sensors in People with Stroke. Sensors 2024, 24, 710. [Google Scholar] [CrossRef]
- Costa, B.L.; Magalhães, F.A.; Araújo, V.L.; Richards, J.; Vieira, F.M.; Souza, T.R.; Trede, R. Is there a dose-response of medial wedge insoles on lower limb biomechanics in people with pronated feet during walking and running? Gait Posture 2021, 90, 190–196. [Google Scholar] [CrossRef]
- Menant, J.C.; Steele, J.R.; Menz, H.B.; Munro, B.J.; Lord, S.R. Effects of walking surfaces and footwear on temporo-spatial gait parameters in young and older people. Gait Posture 2009, 29, 392–397. [Google Scholar] [CrossRef]


| Parameters | Condition | Average (SD) | Median (IQR) | p-Value of Shapiro–Wilk Test |
|---|---|---|---|---|
| θTup at Initial contact | ||||
| Normal | 21.4 (6.3) | 23.3 (18.6–23.9) | 0.49 | |
| Slow | 17.3 (6.0) | 18.8 (14.3–21.3) | 0.54 | |
| Fast | 25.3 (6.3) | 25.4 (20.8–28.9) | 0.97 | |
| Medial | 21.4 (6.7) | 24.0 (16.9–26.2) | 0.10 | |
| Lateral | 19.1 (5.9) | 21.8 (15.5–22.9) | 0.04 * | |
| θSup at Initial contact | ||||
| Normal | 11.1 (4.2) | 11.5 (7.7–13.8) | 0.57 | |
| Slow | 10.2 (3.7) | 10.4 (7.6–12.9) | 0.92 | |
| Fast | 12.0 (4.3) | 12.6 (8.2–14.5) | 0.71 | |
| Medial | 9.4 (3.5) | 9.6 (6.5–11.9) | 0.98 | |
| Lateral | 12.6 (4.1) | 11.6 (10.4–14.6) | 0.20 | |
| Maximum θTdown | ||||
| Normal | 61.9 (5.1) | 64.2 (56.5–65.8) | 0.06 | |
| Slow | 56.0 (5.1) | 56.6 (52.2–59.4) | 1.00 | |
| Fast | 68.5 (4.0) | 68.7 (66.0–71.8) | 0.29 | |
| Medial | 61.4 (3.9) | 62.2 (58.5–64.2) | 0.75 | |
| Lateral | 60.9 (3.8) | 58.9 (58.4–63.9) | 0.09 | |
| Maximum θPro | ||||
| Normal | 14.2 (7.7) | 11.3 (9.1–18.8) | 0.33 | |
| Slow | 11.2 (4.7) | 9.2 (8.4–13.2) | 0.02 * | |
| Fast | 17.1 (9.5) | 15.3 (9.8–19.1) | 0.04 * | |
| Medial | 12.5 (6.1) | 11.4 (8.7–14.2) | 0.21 | |
| Lateral | 13.5 (7.9) | 10.8 (7.7–18.8) | 0.52 | |
| Timing of maximum θTdown | ||||
| Normal | 70.1 (2.0) | 70 (68–71.5) | 0.03 * | |
| Slow | 71.3 (1.4) | 71 (70–72.5) | 0.32 | |
| Fast | 67.9 (1.8) | 67 (67–69.5) | 0.29 | |
| Medial | 69.7 (1.8) | 69 (68.5–70.5) | 0.10 | |
| Lateral | 69.8 (1.4) | 70 (69–71) | 0.45 | |
| Timing of maximum θPro | ||||
| Normal | 74.7 (4.9) | 72 (71–76) | <0.01 * | |
| Slow | 76.8 (3.4) | 77 (74.5–78) | 0.31 | |
| Fast | 71.9 (3.9) | 71 (69–73) | 0.03 * | |
| Medial | 75.8 (4.1) | 74 (73–77) | 0.03 * | |
| Lateral | 75.3 (4.7) | 75 (72–76.5) | 0.12 | |
| % Gait Cycle (% GC) | Normal | Slow | Fast | Medial | Lateral |
|---|---|---|---|---|---|
| Toe down | 70 | 71 | 67 * | 69 | 70 |
| Pronation | 72 | 77 | 71 * | 74 | 75 |
Disclaimer/Publisher’s Note: The statements, opinions and data contained in all publications are solely those of the individual author(s) and contributor(s) and not of MDPI and/or the editor(s). MDPI and/or the editor(s) disclaim responsibility for any injury to people or property resulting from any ideas, methods, instructions or products referred to in the content. |
© 2024 by the authors. Licensee MDPI, Basel, Switzerland. This article is an open access article distributed under the terms and conditions of the Creative Commons Attribution (CC BY) license (https://creativecommons.org/licenses/by/4.0/).
Share and Cite
Hashiguchi, Y.; Numabe, T.; Goto, R. Effects of Gait Speed and Sole Adjustment on Shoe–Floor Angles: Measurement Using Shoe-Type Sensor. Biomechanics 2024, 4, 595-604. https://doi.org/10.3390/biomechanics4040042
Hashiguchi Y, Numabe T, Goto R. Effects of Gait Speed and Sole Adjustment on Shoe–Floor Angles: Measurement Using Shoe-Type Sensor. Biomechanics. 2024; 4(4):595-604. https://doi.org/10.3390/biomechanics4040042
Chicago/Turabian StyleHashiguchi, Yu, Tsuguru Numabe, and Ryosuke Goto. 2024. "Effects of Gait Speed and Sole Adjustment on Shoe–Floor Angles: Measurement Using Shoe-Type Sensor" Biomechanics 4, no. 4: 595-604. https://doi.org/10.3390/biomechanics4040042
APA StyleHashiguchi, Y., Numabe, T., & Goto, R. (2024). Effects of Gait Speed and Sole Adjustment on Shoe–Floor Angles: Measurement Using Shoe-Type Sensor. Biomechanics, 4(4), 595-604. https://doi.org/10.3390/biomechanics4040042