Article

Development of Ti PVD Films to Limit the Carburization of Metal Powders during SPS Process

by
Maria-Rosa Ardigo-Besnard
1,*,
Aurélien Besnard
2,
Mathias Moser
1 and
Florian Bussière
1
1
Laboratoire Interdisciplinaire Carnot de Bourgogne (ICB), UMR 6303 CNRS, Université Bourgogne Franche-Comté, BP 47870, CEDEX, 21078 Dijon, France
2
Arts et Metiers Institute of Technology, LaBoMaP, Université Bourgogne Franche-Comté, HESAM Université, 71250 Cluny, France
*
Author to whom correspondence should be addressed.
Solids 2021, 2(4), 395-406; https://doi.org/10.3390/solids2040025
Submission received: 26 October 2021 / Revised: 11 November 2021 / Accepted: 30 November 2021 / Published: 3 December 2021
(This article belongs to the Special Issue Solids in Europe)

Abstract

:
Spark plasma sintering technique is used for the fabrication of dense materials with a fine-grained microstructure. In this process, a powder is placed into a graphite mold and a uniaxial pressure is applied by two graphite punches. A graphite foil is inserted between the punches and the powder and between the mold and the powder to ensure good electrical, physical and thermal contact. One of the major drawbacks during sintering of metal powders is the carburization of the powder in contact with the graphite foils. In this study, a PVD coating of titanium was applied on the graphite foils in contact with the metal powder (pure iron). The results are promising, as the investigations show that the application of a Ti PVD film of 1.5 and 1.1 µm thickness is effective to completely avoid the carburization of iron powder. Carbon diffuses inside the PVD film during sintering. In parallel, iron diffusion was revealed inside the Ti coating of 1.5 µm thickness. On the other hand, a Ti PVD film of 0.5 µm thickness provides a protection against carbon diffusion just on the sides in contact with the mold, proving that the coating thickness represents an important parameter to consider.

1. Introduction

Spark plasma sintering (SPS) is a powder metallurgy technique allowing for the elaboration of dense materials with a fine-grained microstructure [1]. In this process, the powder is inserted into a mold and the densification is provided by a pulsed electric current and a uniaxial pressure, simultaneously applied [2,3]. The tooling (punches and die) is typically, but not exclusively, made of graphite. Heating of the system is mainly assured by Joule effect; however, the conduction in the powder induces electrical discharges and high-temperature plasma, which also contribute to the densification process [4]. The insertion of a graphite foil between the powder and the mold (die and punches) is necessary in order to ensure a good electric, physical and thermal contact [5]. After sintering, the graphite foil sticks on both mold and part, and is ripped off during the opening of the mold. The sintered part is then cleaned by sand blasting and the mold by simple friction.
Due to the high temperatures and pressures that can be attained during SPS (of the order of some thousands °C and some hundreds MPa, respectively, depending also on the composition of the tooling), a wide variety of materials in form of powder can be consolidated: ceramics, metals, composites and polymers [6,7,8,9,10,11]. One of the main advantages of the SPS process is the use of high heating and cooling rates (of the order of several hundred °C·min−1), shortening the sintering time and limiting the grain growth [2,3,4,12,13]. On the other hand, microstructural heterogeneities could sometimes be observed between the core and the surface of the sample in the case of big parts, due to the important temperature gradients inside the sintering chamber [2]. Moreover, one of the major issues due to the use of graphite foils is the reaction between the carbon and the powder, leading to the formation of secondary and usually undesirable phases at the surface of the sintered sample and to carbon diffusion towards the bulk [14]. This phenomenon is particularly significant in the case of the sintering of metal powders, typically steels. Previous studies performed on an austenitic and a duplex stainless steel showed, after 10 min SPS at 1200 °C under 50 MPa, the formation of a layer of carbides, having a thickness ranging from about 100 to 250 µm, respectively, from the surface of the sintering sample to the bulk (see Supplementary Materials, Figure S1a,b). In the case of the austenitic steel, energy-dispersive X-ray (EDX) maps clearly revealed that carbon diffused at steel grain boundaries during sintering (see Supplementary Materials, Figure S1a). If the sintered part is machined afterwards, the surface carbides can be removed; however, the diffusion of carbon at grains boundaries remains an irreversible phenomenon, affecting the structural integrity and reducing the mechanical and, more generally, the durability properties of the material. For these reasons, the problem of the carbon contamination of the metallic powders during SPS process must be considered with special attention.
Solutions already exist to try to limit the reaction between the powder and the graphite foil. A sprayed layer of boron nitride (BN), bonded with a silicone adhesive, can be applied on the graphite foils to avoid carbon diffusion. However, BN is an electrical insulator and the BN layer may be discontinuous and crack if too thick. It is reported in literature that the use of BN spray does not completely prevent carbon diffusion, as carbides formation at grains boundaries and inside the grains is observed [15]. Formation of nitrides can also occur [16]. Another solution reported in literature is the use of graphite foils with a nano layer of sputtered gold. However, in the case of sintering of ceramic materials, this solution reduces but not fully suppresses secondary phase formation at the sample surface [16]. Moreover, gold is expensive and not adapted to a large-scale utilisation. Finally, an alumina (Al2O3) layer can also be used, but Al2O3 is an electrical insulator and modifies the current distribution and, as a consequence, the heating repartition inside the powder during sintering [16,17].
The underlying idea of the present study is to suggest a cost affordable, large-scale solution to limit the carburization of metal powders during sintering. In this aim, a thin layer (with thickness in the range of the µm) of titanium was applied on graphite foils by physical vapor deposition (PVD) technique. Titanium was chosen because it is a carbide-forming element [18] and it has a melting point of 1668 °C, making its use suitable for sintering a wide variety of metals and metallic alloys. Some authors report that the C-Fe-Ti ternary system is not in favour of the formation of the cementite Fe3C [19,20]. Moreover, titanium is a better electrical conductor than graphite. Indeed, the electrical resistivity of titanium is of 0.42 × 10⁻⁶ Ω·m, lower than graphite foils (1 × 10⁻⁵ Ω·m in plane and 5 × 10⁻⁴ trough thickness). In contrary to manual spraying, PVD technique allows a fine control of the film thickness and a uniform covering of the surfaces, even in the case of complex shapes [21]. Large surfaces can be coated, making this technique appropriate to an industrial-scale use. In this study, titanium-coated graphite foils were tested during sintering of pure iron. Indeed, pure iron is a simple system and allows to avoid the influence of alloying elements during diffusion phenomena. Moreover, the mobility of titanium in iron is lower than that of iron in titanium [22,23], reducing the risk of contamination of the sintered powder. Three titanium coating thicknesses were tested: 0.5, 1.1 and 1.5 µm. The results are promising and show that carburization of iron powder was completely suppressed using titanium films of 1.5 and 1.1 µm and just partially limited in the case of the titanium film of 0.5 µm thickness. Moreover, in all cases, titanium did not diffuse inside iron during sintering, excluding any risk of contamination of the metallic powder during SPS process.

2. Materials and Methods

Iron powder with particle size ranging between 20 and 180 µm was supplied by Höganäs (Sweden). Samples were sintered using a SPS HPD 125 apparatus (FCT system, Germany). A cylindrical graphite mold of 30 mm inner diameter, 90 mm outer diameter and 50 mm height was filled with the iron powder (about 28 g) to obtain a disk of 30 mm in diameter and 5 mm in height. Coated or uncoated graphite foils (0.35 mm thickness) were previously inserted between the powder and the mold (the die and the graphite punches). Sintering was performed at 1050 °C for 10 min in vacuum (10−2 mbar) under a pressure of 70 MPa. The heating and the cooling rate were 50 °C·min−1 and more than 100 °C·min−1, respectively.
Ti coatings on the graphite foils were performed in an industrial DC magnetron PVD system KS40V (Kenosistec, Binasco, Italy). The substrate holder oscillates in front of the titanium target (99.95 at.% purity, 406 × 127 × 6 mm in dimension) with a solid angle of 30° and a minimal target-to-substrate distance of 95 mm. The nominal speed was 0.7 rpm. 80 sccm of pure argon were injected to obtain a working pressure of 0.43 Pa. An electrical power of 1500 W was applied on the target (U = 340 V, I = 4.41 A) during the deposition. Three deposition lengths were used: 10, 20 and 30 min, corresponding to a number of scan of 73, 142 and 212 (a scan is a half oscillation).
Figure 1 presents the scheme of both systems.
Three coating thicknesses were obtained: 0.5, 1.1 and 1.5 µm (±0.1). In all cases, Ti coating is formed by pyramid-shaped grains and covers perfectly the graphite foil (see Supplementary Materials, Figure S2).
Globally, four sintering tests were carried out: one with graphite foils without Ti coating that will be the reference and three using graphite foils with Ti coatings having different thickness.
After sintering, the samples were cut, embedded in resin and polished using SiC papers (down to 4000 grit) and diamond paste (down to 1 µm). For each sample, microstructural investigations of top and bottom areas, as well as of the sides, were performed using a Zeiss AxioVert A1 optical microscope (OM) after Nital 3% etching (3 mL HNO3 and 97 mL C2H5OH). These characterisations were completed by elementary analyses carried out with a JEOL JSM-7600F scanning electron microscope (SEM) (Jeol, Tokyo, Japan) equipped with a field emission gun (FEG) and coupled with an energy dispersive X-ray spectrometer (EDX) (Berg Engineering & Sales Company, Rolling Meadows, IL, USA). Microhardness profiles were performed on the top and the side of the sintered samples with a Vickers indenter and a load of 100 gf (0.98 N) using a Wilson Tukon 1102/1202 tester.

3. Results and Discussion

3.1. Sintering of Pure Iron Using Graphite Foils without Coating

Figure 2 shows the top zone of the sintered iron sample (in the direction of the punches), after Nital 3% etching. This kind of etching is typically used to reveal cementite and pearlite in carbon steels as it attacks preferentially the ferrite. The bottom of the sample was identical from a microstructural point of view and it is not presented.
A carburization zone of about 400 µm depth formed at the surface of the sample, in direct contact with the graphite foil. Five zones can be distinguished moving from the sample surface to the bulk (up to about 720 µm depth), as indicated in Figure 2.
A magnification of zone 1 is presented in Figure 3.
OM image coupled with SEM observation after chemical etching confirmed the formation of lamellar pearlite, cementite at grain boundaries and ferrite surrounding cementite. If the presence of pearlite and cementite can be obviously associated to a hypereutectoid steel composition, the presence of ferrite is generally unexpected. However, this abnormal phase was observed for the first time in hypereutectoid steels at the beginning of the 20th century [24] and its presence was then confirmed by several authors [25,26,27,28]. Recent studies [27,28] reported that abnormal ferrite grows beneath the eutectoid temperature. At about 700 °C, abnormal ferrite forms were very likely from proeutectoid cementite, as a result of the carbon re-balance due to the depletion induced by the formation of proeutectoid cementite. On the other hand, at temperatures lower than 700 °C, the growth of abnormal ferrite is likely induced by pearlite formation and the presence of cementite phase seems not be necessary [28]. In all cases, these studies show that abnormal ferrite is a typical phase forming in hypereutectoid steel below eutectoid temperature, during the decomposition of austenite.
Figure 4 displays OM and SEM images of zone 2 after Nital etching. Only lamellar pearlite was revealed, indicating the typical composition of a eutectoid steel and confirming a lower carbon diffusion than in zone 1.
OM characterisations of zone 3 after chemical etching (Figure 5) shows the presence of lamellar pearlite and ferrite, typically associated to a hypoeutectoid steel composition.
Finally, zone 4 and 5 are both formed by ferrite grains having different size (Figure 2), indicating the occurrence of recovery and recrystallization phenomena, often reported in literature in the case of alloys elaborated by SPS [29,30], followed by grain growth [15].
Zones 1 to 5 can be correlated to the Fe-C diagram (Figure 6): the displacement from zone 1 at the surface of the sintered sample in contact with the graphite foil to zone 5 in the bulk corresponds to a movement from the right to the left in the Fe-C diagram, i.e., from the zone enriched in carbon to pure iron.
OM images of the side of the iron sample, in contact with the graphite foil surrounding the mold, are shown in Figure 7.
The chemical etching revealed that the depth of the carburization zone is of the order of 100 µm, much lower than that measured in the case of the top (and the bottom) of the sample. The zone 1, composed by lamellar pearlite, cementite and abnormal ferrite did not form, suggesting that carburization phenomenon is slower on the side of the sample, compared to the top and the bottom. Zone 2, constituted by lamellar pearlite and zone 3, containing lamellar pearlite and grains of ferrite, are both present. In zone 4, ferrite grains, whose size slightly increase moving towards the bulk, are visible. It is worth noting that, at a same distance to the surface, the ferrite grains did not attain the same size previously observed in zone 5, suggesting that crystallization occurred, but grain growth phenomenon was limited and just at a beginning stage.

3.2. Sintering of Pure Iron Using Graphite Foils Coated with a Ti PVD Film

Figure 8 presents the OM views of the top and side of the iron samples sintered using graphite foils with Ti coatings having thicknesses of 1.5 (Figure 8a,b), 1.1 (Figure 8c,d) and 0.5 µm (Figure 8e,f). The first important observation that can be made is that the carburization of iron powder during SPS is completely avoided when the graphite foil is coated with a Ti PVD film of 1.5 and 1.1 µm thickness (Figure 8a,d). In these latter, only ferrite grains are observed. In the case of the Ti coating of 0.5 µm thickness, the carburization is avoided only on the side of the sample (Figure 8f), but not on the top (and the bottom) (Figure 8e), where a carburization layer having a heterogeneous thickness can be observed (from nearly no carburization to the reference thickness). All the samples (top and side views) show evidence of recrystallization and grain growth, in agreement with the phenomenon occurring during SPS.
In order to investigate the diffusion phenomena occurring during sintering, the interface between the iron sintered sample and the graphite foil coated with the 1.5 µm thick Ti film was analyzed. Figure 9 displays an OM magnification and a SEM image taken with low angle back-scattered electron detector (LABE). The coating, having a thickness of about 1.5 µm, is still visible in both micrographies. SEM observation highlights the presence of a white phase inside the coating, due to a Z contrast. Ti coating presents several cracks due to sample metallographic preparation.
EDX analyses of the coating performed after SPS process (Figure 10) indicate that the white phase (points 6 and 7) is enriched in iron. Even if carbon quantification by EDX is difficult, carbon values are still given for comparison. Points 4 and 5, corresponding to darker phases inside the Ti coating, present a high amount of carbon compared to other analyzed points. It is worth noting that the atomic percentages reported in Figure 10 do not exactly correspond to the local composition of the different analyzed phases, due to the interaction volume of the SEM electron beam (about 1 µm3), and they don’t allow determination of their stoichiometry. Anyway, they give interesting information about elementary diffusion phenomena. According to Ti-C equilibrium diagram [18], the nonstoichiometric TiC phase is always in equilibrium with Ti. However, the presence of a solid solution of carbon inside the Ti coating cannot completely be excluded, even if it is present in a very tiny amount. On the other hand, FeTi and TiC are the most probable phases in points 6 and 7, as suggested by C-Fe-Ti isothermal section at 1000 °C [19,20]. However, the exact determination of the nature and stoichiometry of the formed phases would require finer analyses, which are out the scope of the present paper. No Z contrast below the Ti coating, inside iron sintered sample, is visible in the SEM image of Figure 9 and Figure 10, proving, together with EDX maps (see Supplementary Materials, Figure S3), that titanium did not diffuse in iron during SPS process, excluding any contamination of the substrate during sintering.
As it can clearly be observed in Figure 8c,d, an effective protection against carbon diffusion from graphite foil was also obtained with the 1.1 µm thick Ti coating. Surprisingly, in this case, iron did not diffuse sufficiently in titanium coating to form the TiFe, as revealed by EDX elementary maps (Figure 11). As reported in literature, the diffusion rate of carbon in titanium is higher than the diffusion rate of iron in titanium [31]. The present results suggest that the presence on TiC phase reduces the diffusion rate of iron in titanium, inhibiting the formation of TiFe. 1.1 µm is a sufficient coating thickness to avoid carbon contamination of the iron substrate during SPS and, in parallel, elementary diffusion phenomena between the coating and the substrate.
Finally, OM observation revealed that a Ti coating of 0.5 µm in thickness is not completely effective to prevent carbon contamination of the top and bottom zones of the iron sintered sample (Figure 8e). A magnification of the area where the carburization thickness is more significant (Figure 11) shows the presence of the five zones previously identified in the sintered sample, when graphite foil without coating was used. Zone 5, corresponding to big ferrite grains, is not visible in Figure 12, due to the figure size, but clearly observable in Figure 8e.
Despite this unsatisfactory result, it is interesting to note that carburization was completely avoided on the side of the sintered sample, where Ti coating is still visible (Figure 8f). A difference in carburization kinetic between the top (and bottom) of the sample and the side has been also evidenced when sintering was performed using graphite foil without coating. The top (and bottom) of the samples and the side are not exposed to the same mechanical stress during sintering nor to the same current flows. This may partially explain the loss of the coating protective properties. A minimum Ti coating thickness probably exists, between 1.1 and 0.5 µm, assuring complete protection against carbon diffusion and further tests are planned to optimize this parameter.

3.3. Mechanical Properties

Figure 13 presents the microhardness profiles of the different iron sintered samples.
The microhardness profiles confirm the OM observations. On the top (Figure 13a), the sample sintered using graphite foil without coating and the one sintered with a 0.5 µm thick Ti coating present exactly the same hardness evolution: a high hardness of about 300 HV0.1 from the surface to a depth of 200 µm, corresponding to zones 1 and 2, followed by a decrease to 100 HV0.1 at a depth of 400 µm, corresponding to zone 3 and ending with a constant hardness of 100 HV0.1, corresponding to zones 4 and 5, the pure iron. The samples sintered using graphite foils with 1.5 and 1.1 µm thick Ti coatings present, from the surface to the bulk, the low hardness of 100 HV0.1., confirming the absence of carburization. These values are in agreement with the one reported in the literature for pure ferrite (60 HV) and the eutectoid steel (250 HV) [32]. The values of the present study are slightly higher due to the fine-grained microstructure obtained by SPS. On the side (Figure 13b), the sample sintered using graphite foil without coating presents the same evolution observed on the top of the sample, except the depth of the carburization, that is smaller (i.e., 200 µm compared to the 400 µm on the top). All samples sintered using Ti-coated graphite foils present a constant hardness value, corresponding to that of iron.
Globally, the preliminary results obtained in the present study are promising and, even if further tests and characterizations are necessary, especially to understand the Fe and C diffusion mechanisms in Ti, they show that a thin PVD film deposited on graphite foils can represent a good and large-scale solution to reduce carbon contamination of metallic powder during SPS process.

4. Conclusions

In this study, a Ti PVD coating was applied on graphite foils to avoid the carburization of iron powders during SPS process. Three Ti films thicknesses were tested: 0.5, 1.1 and 1.5 µm.
The main findings can be summarized as follows:
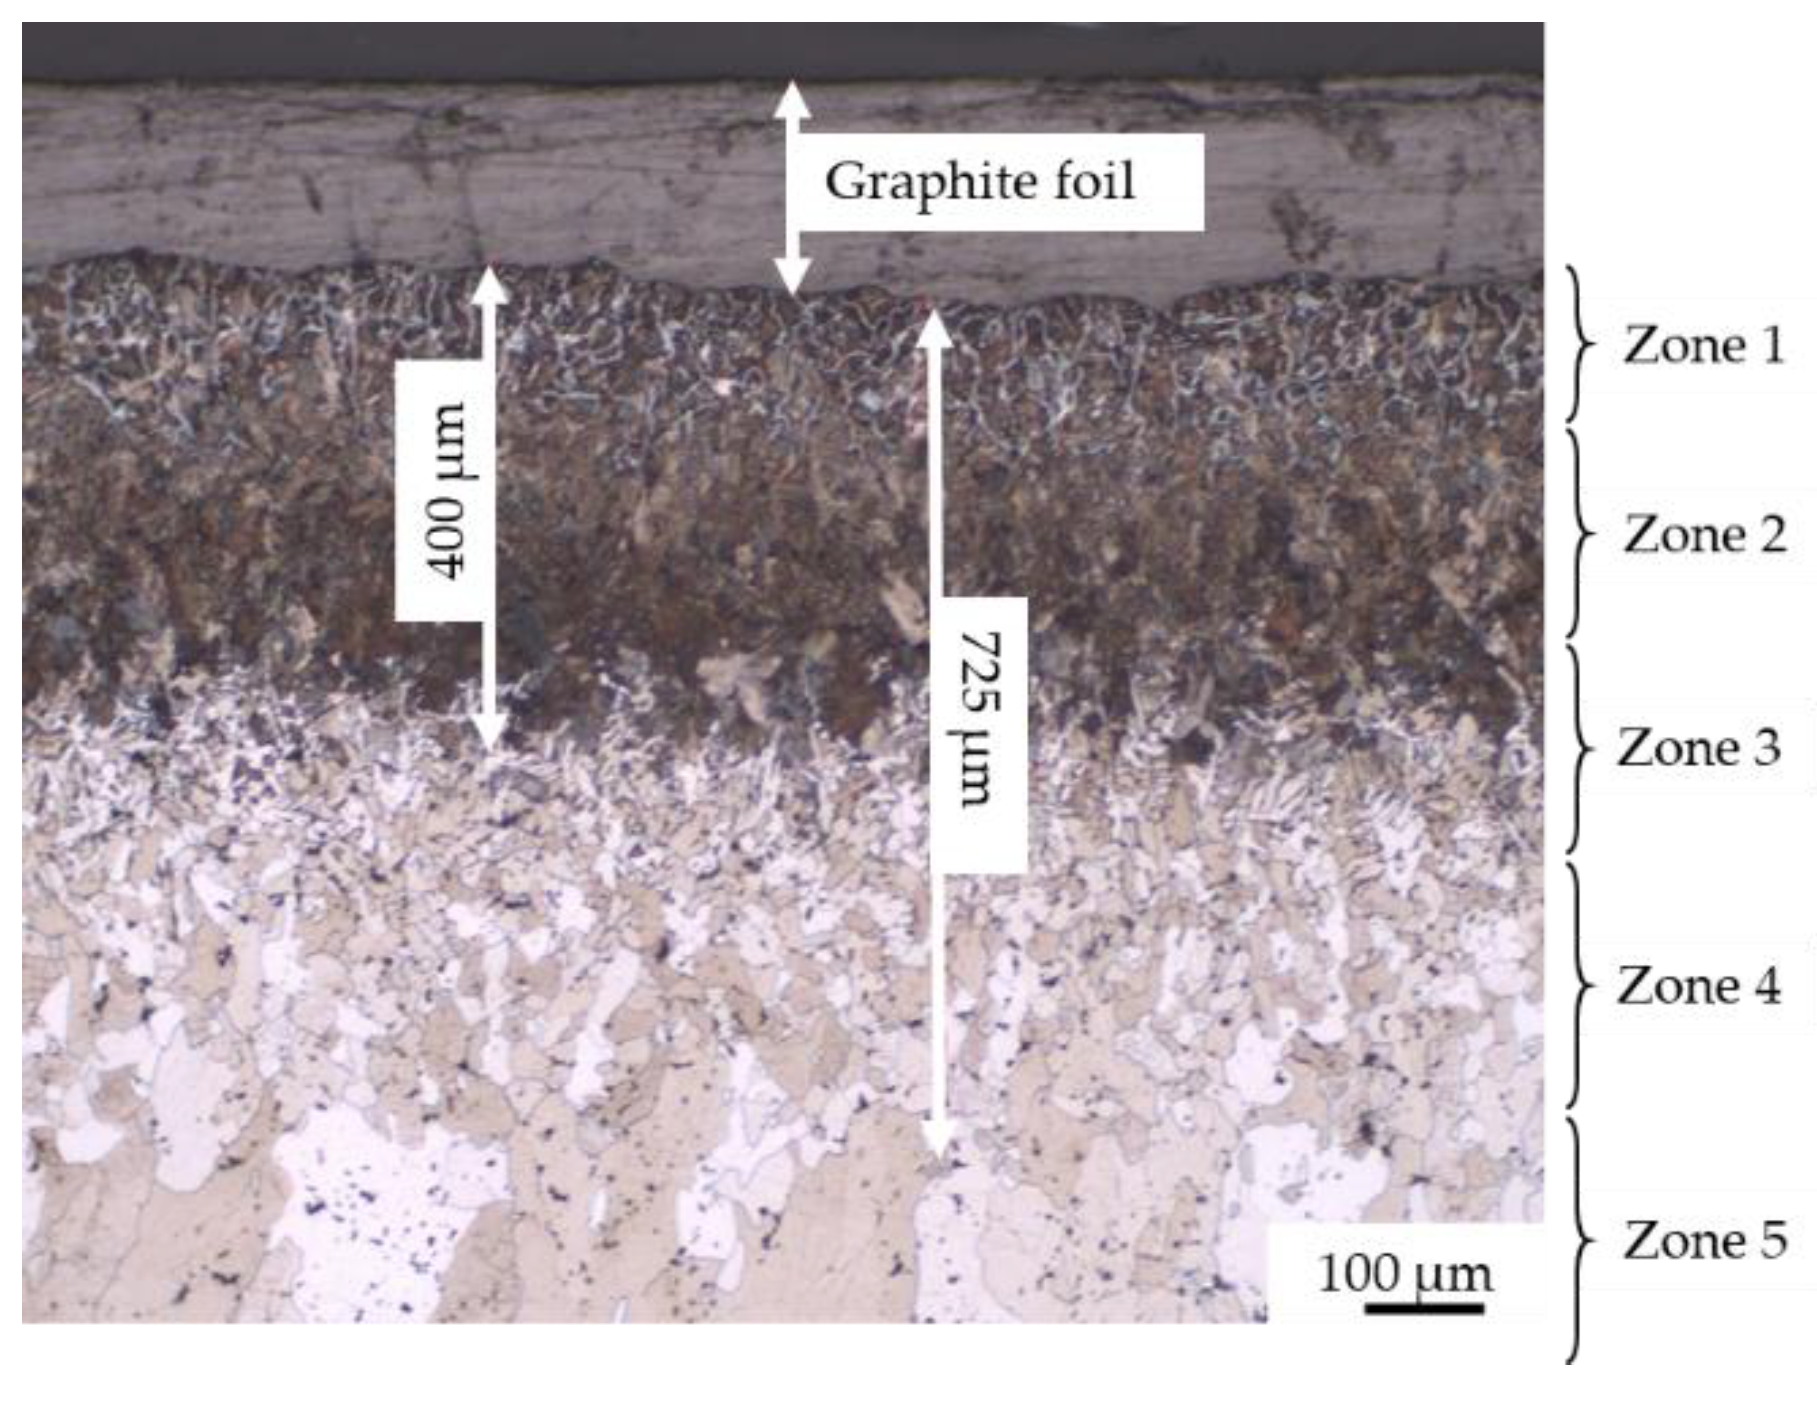
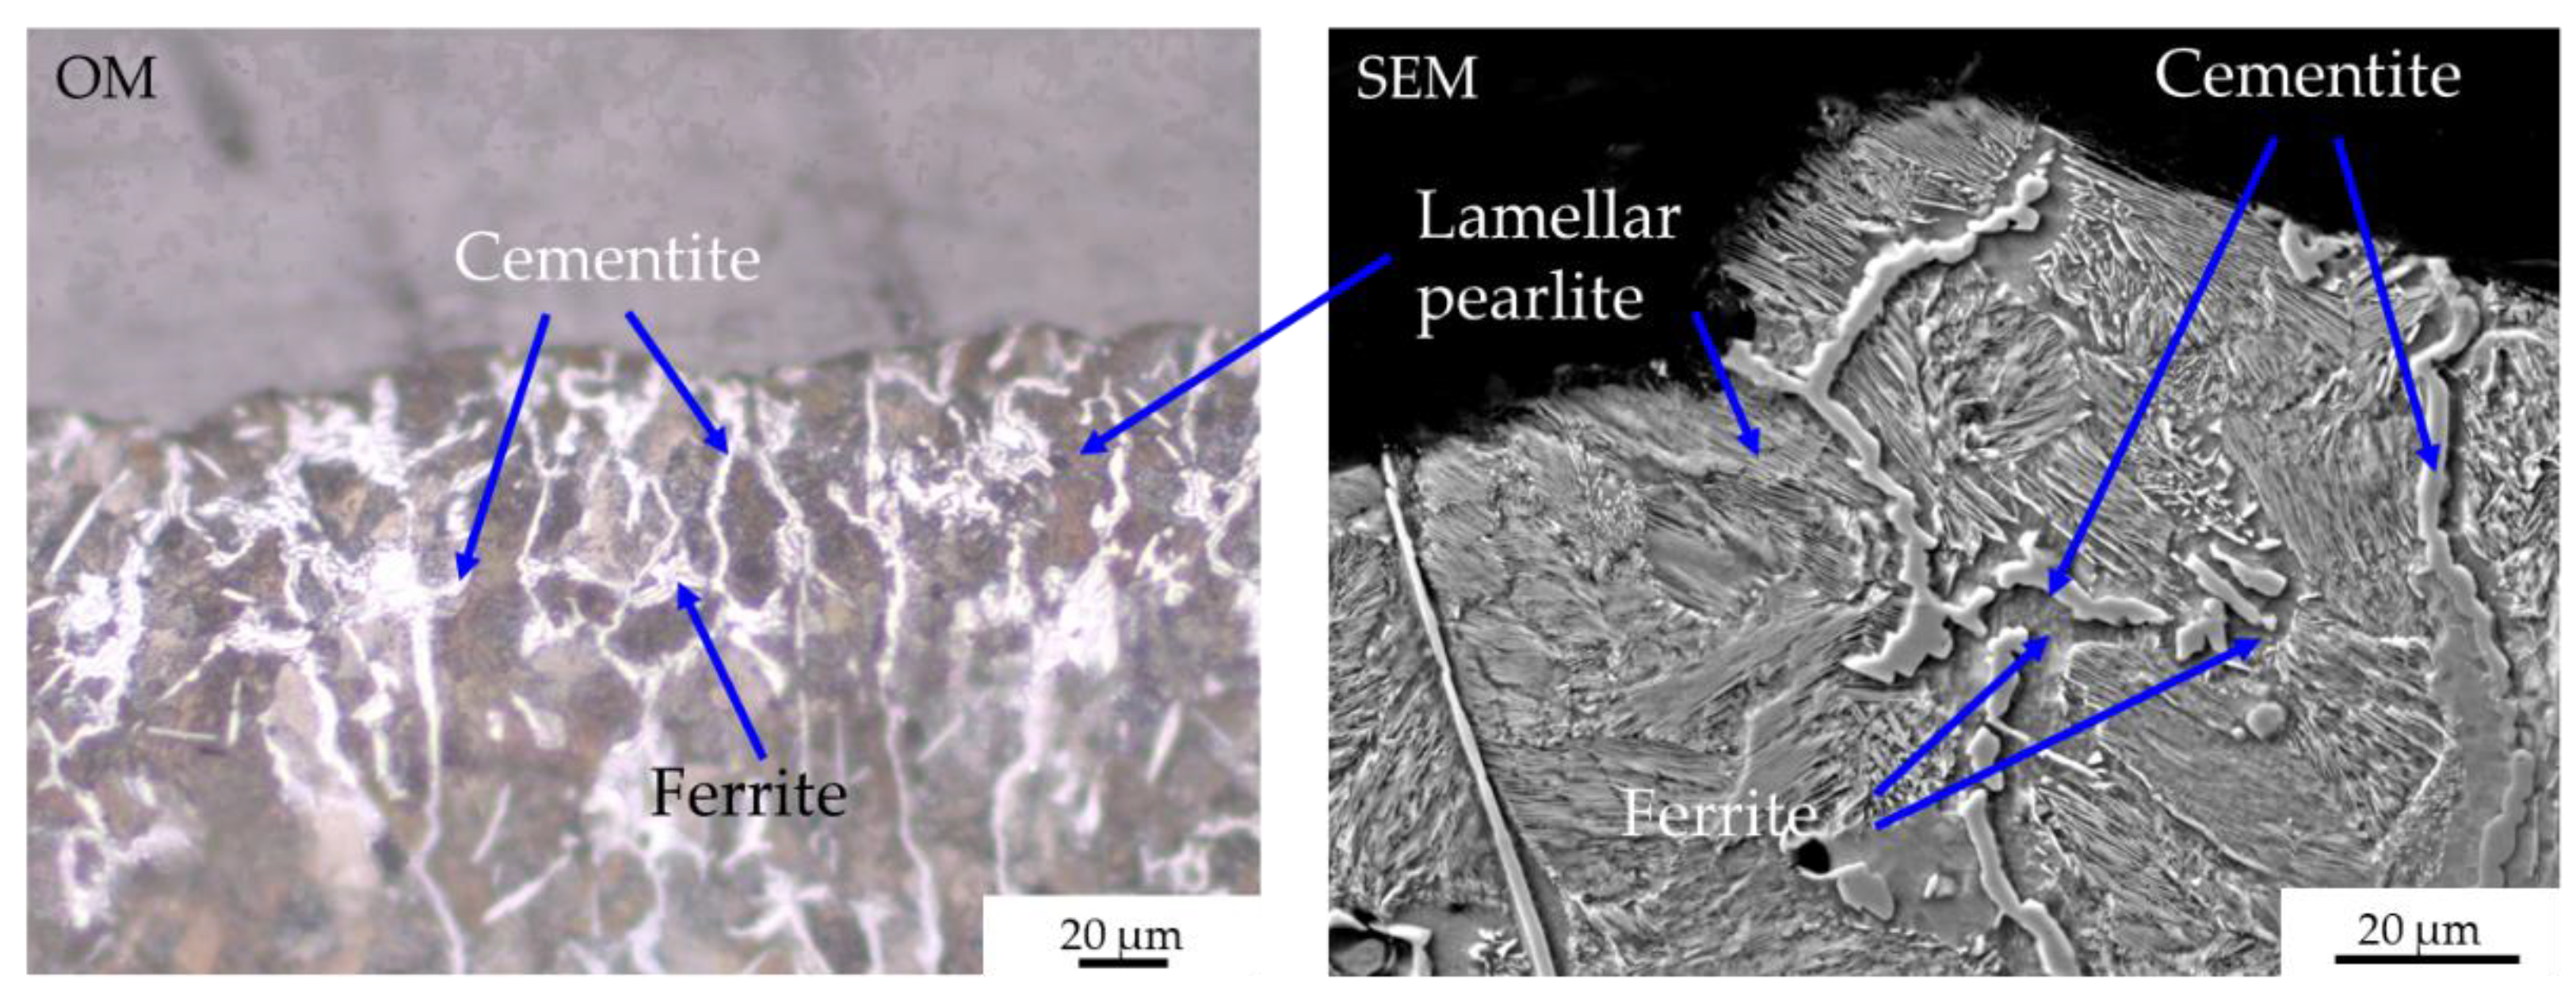
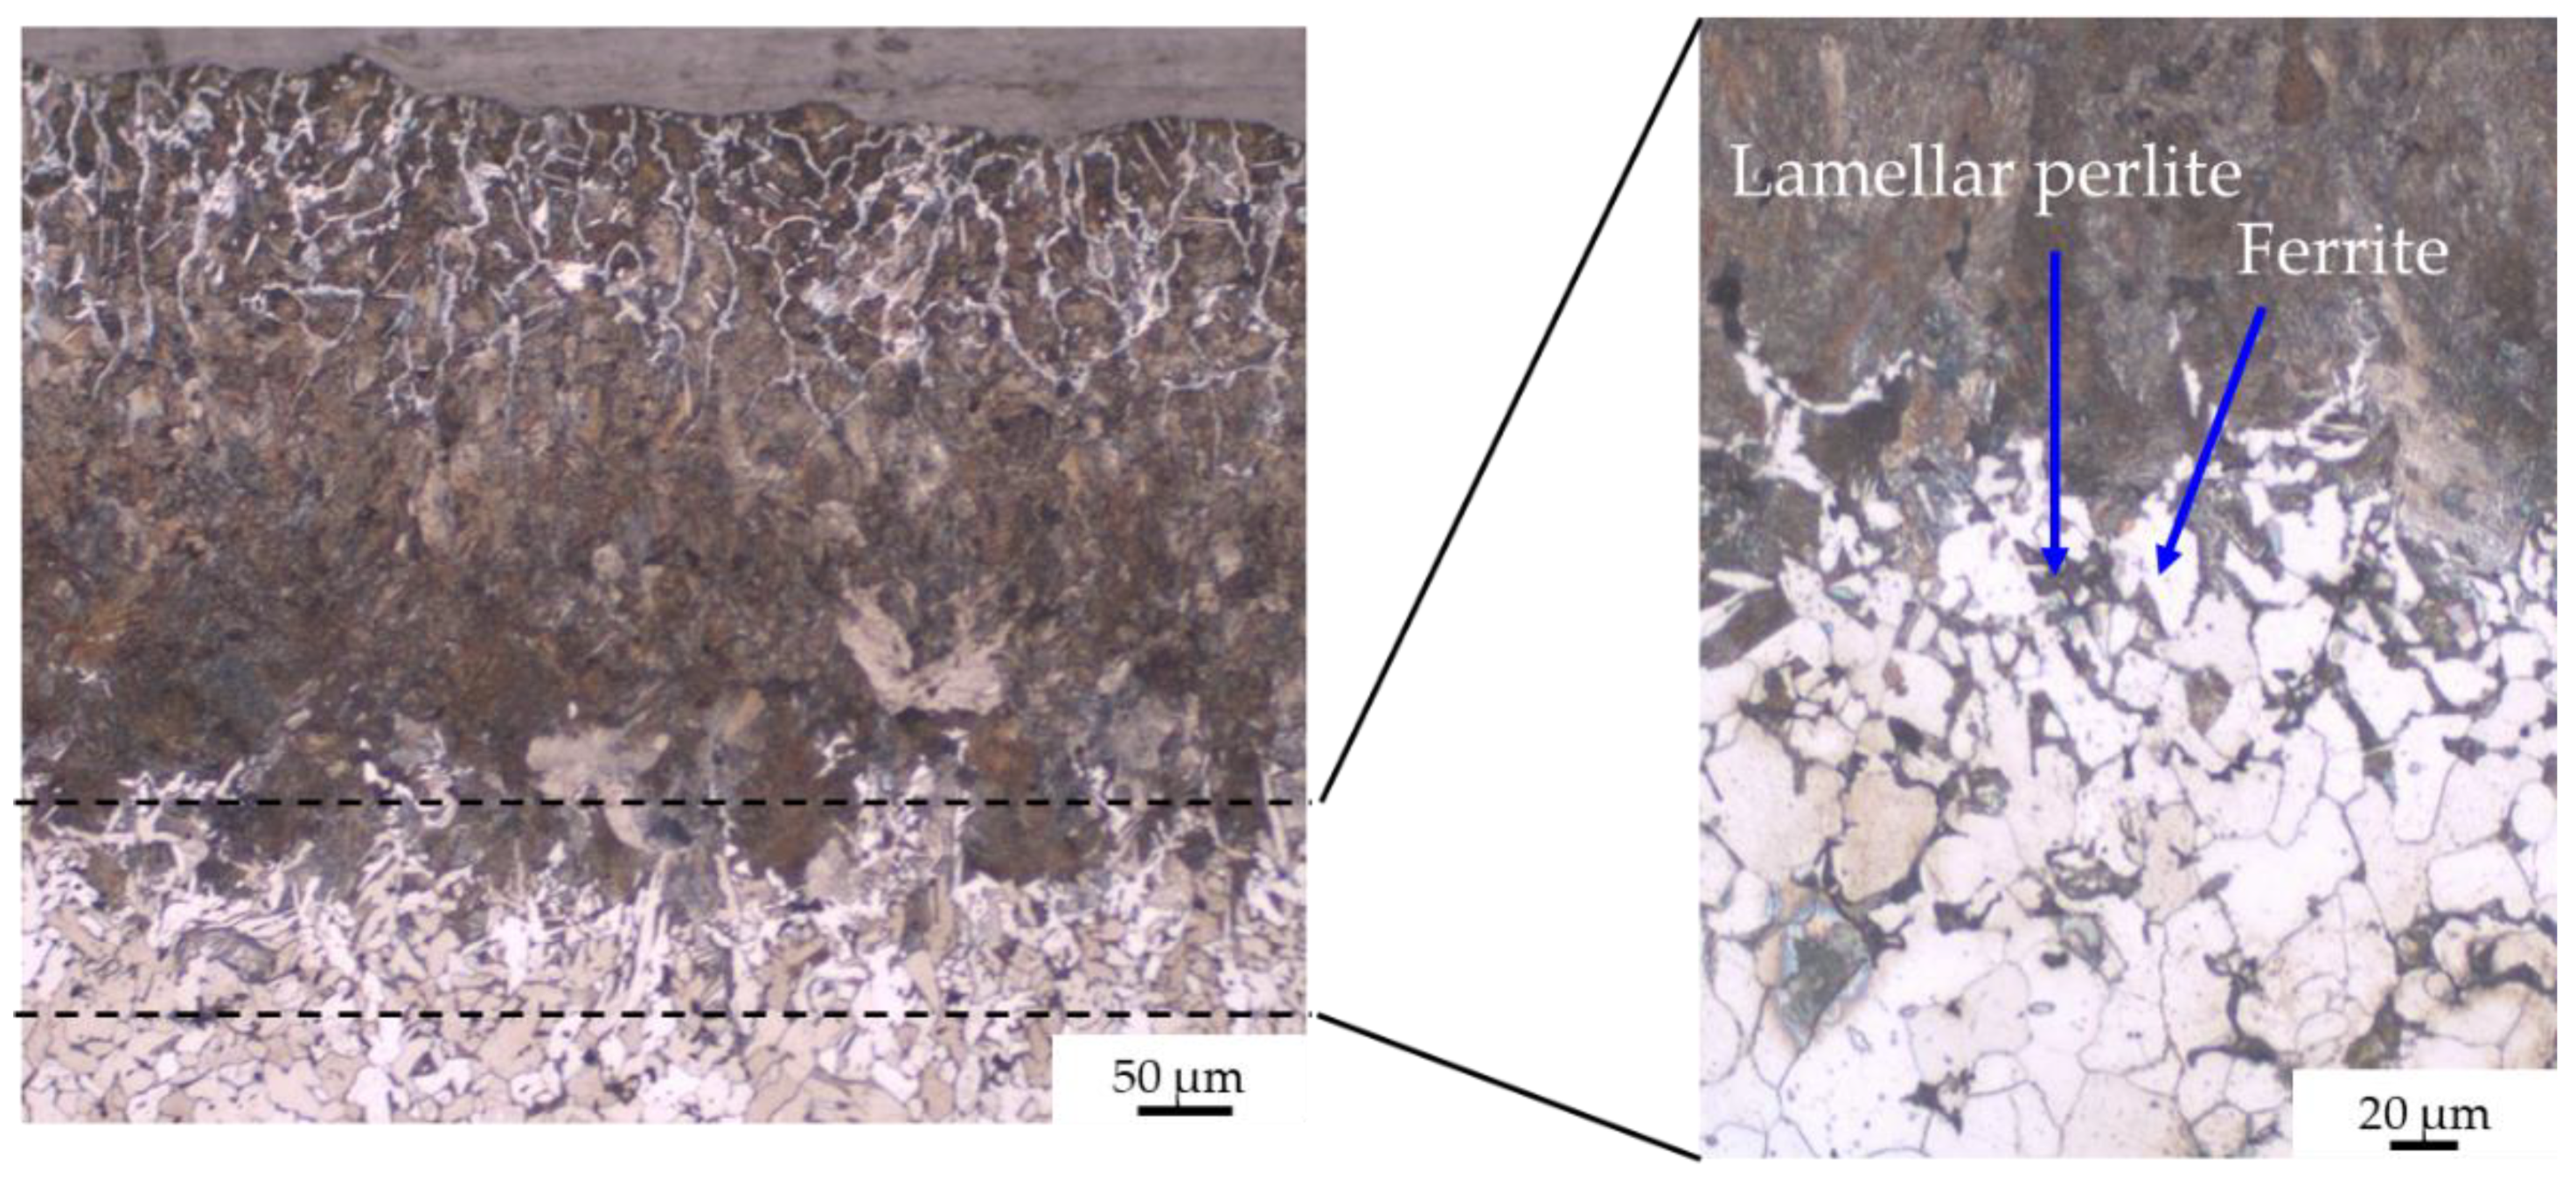
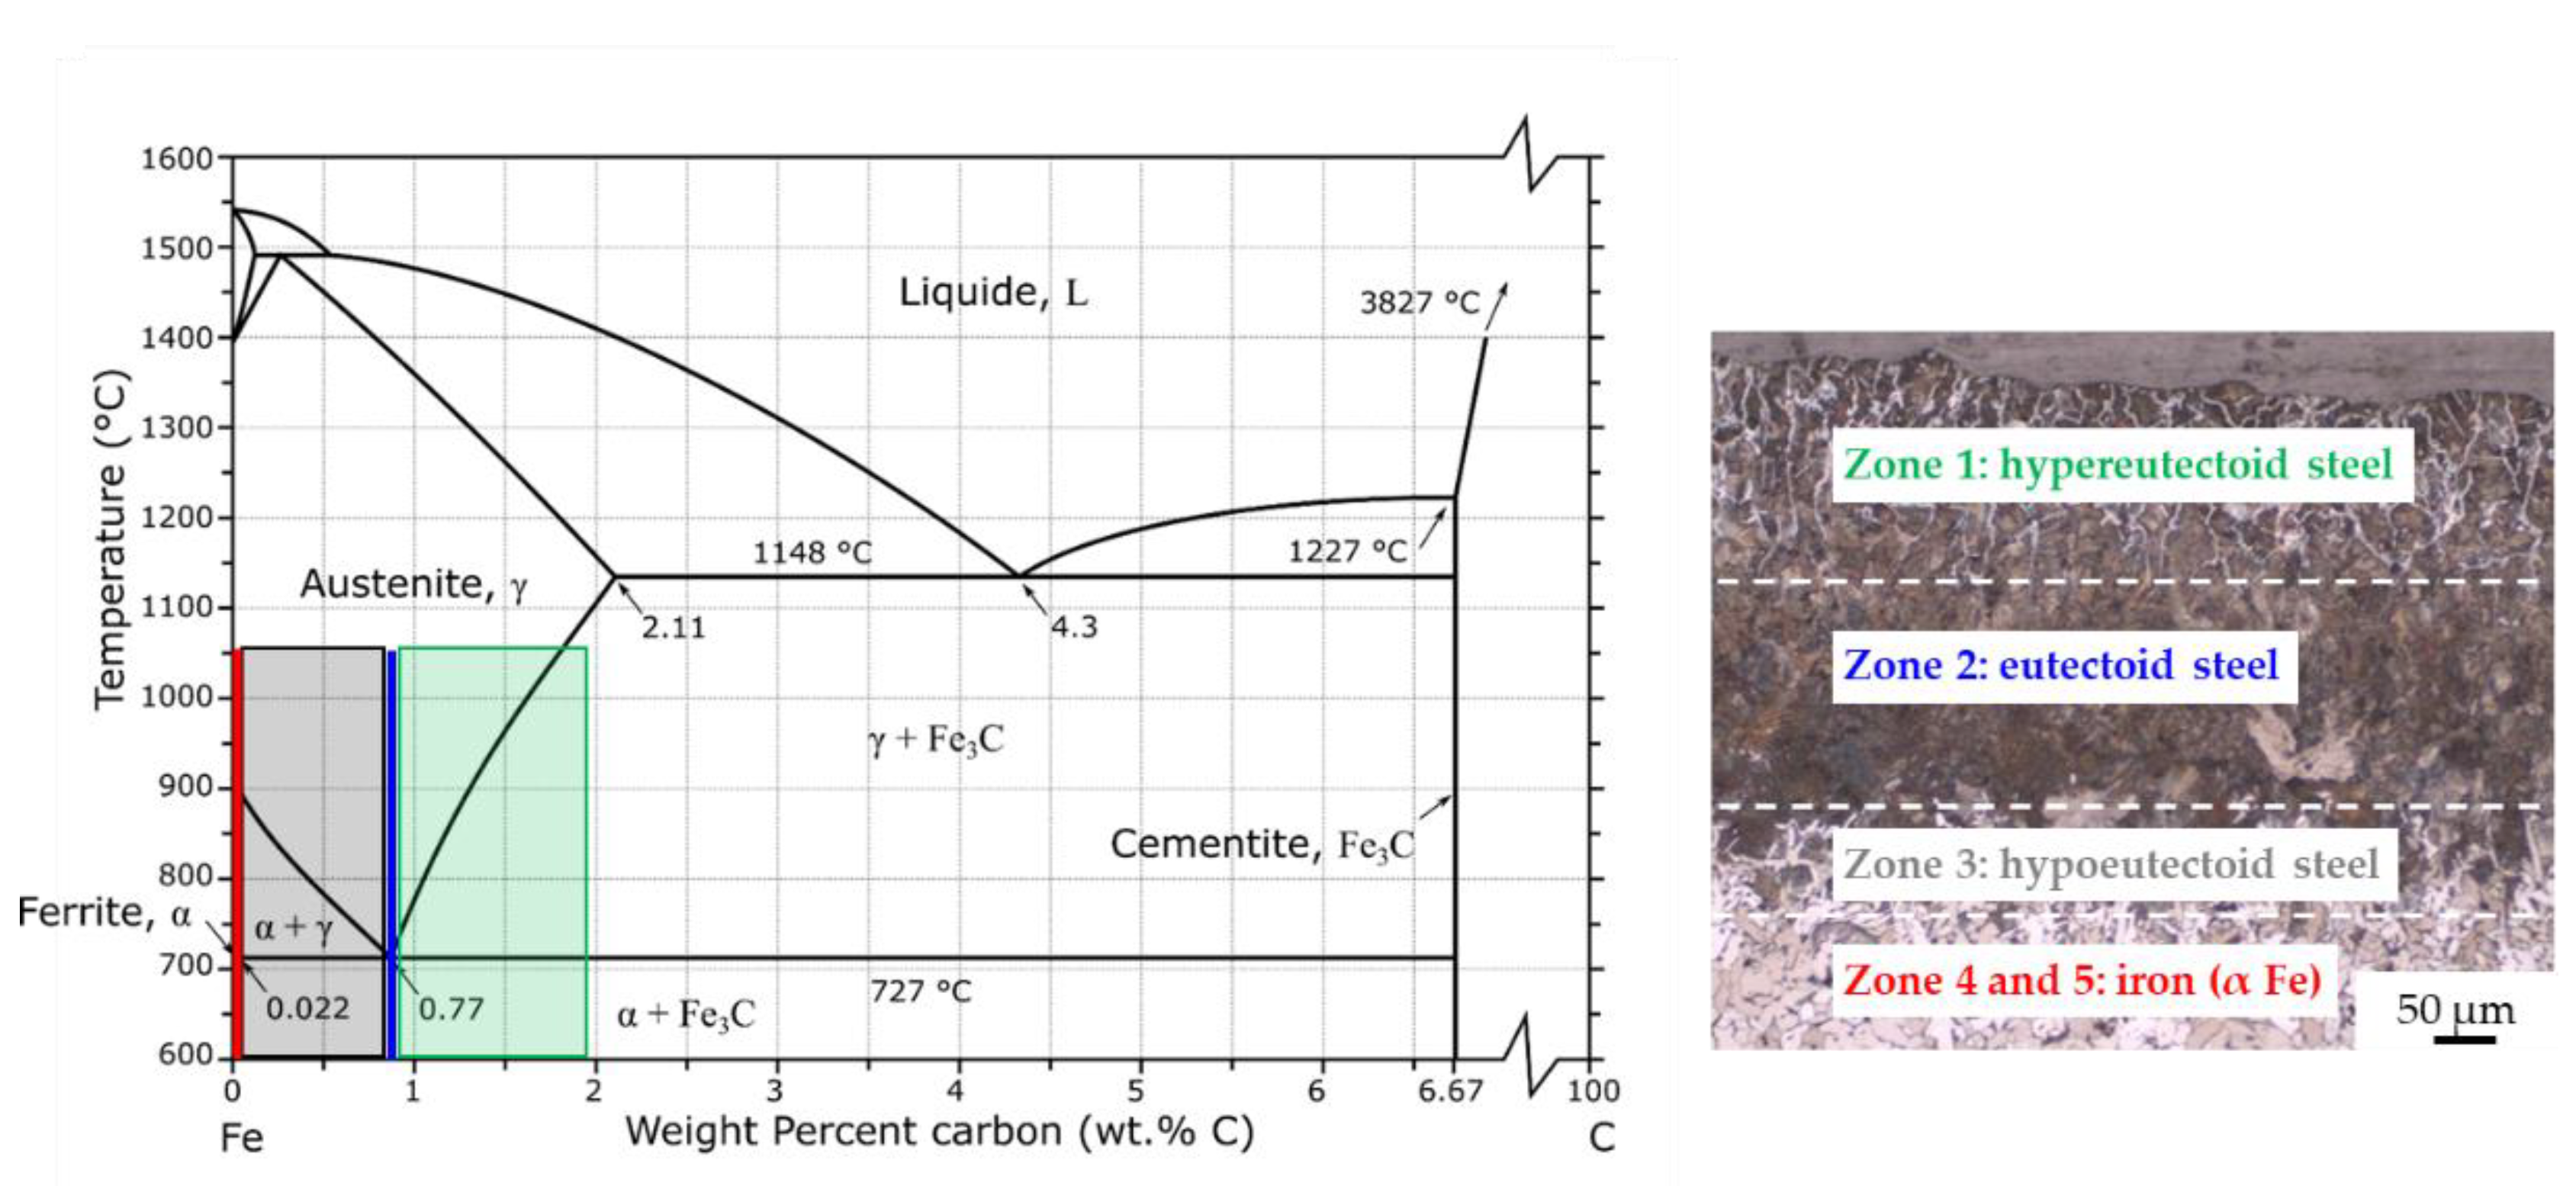
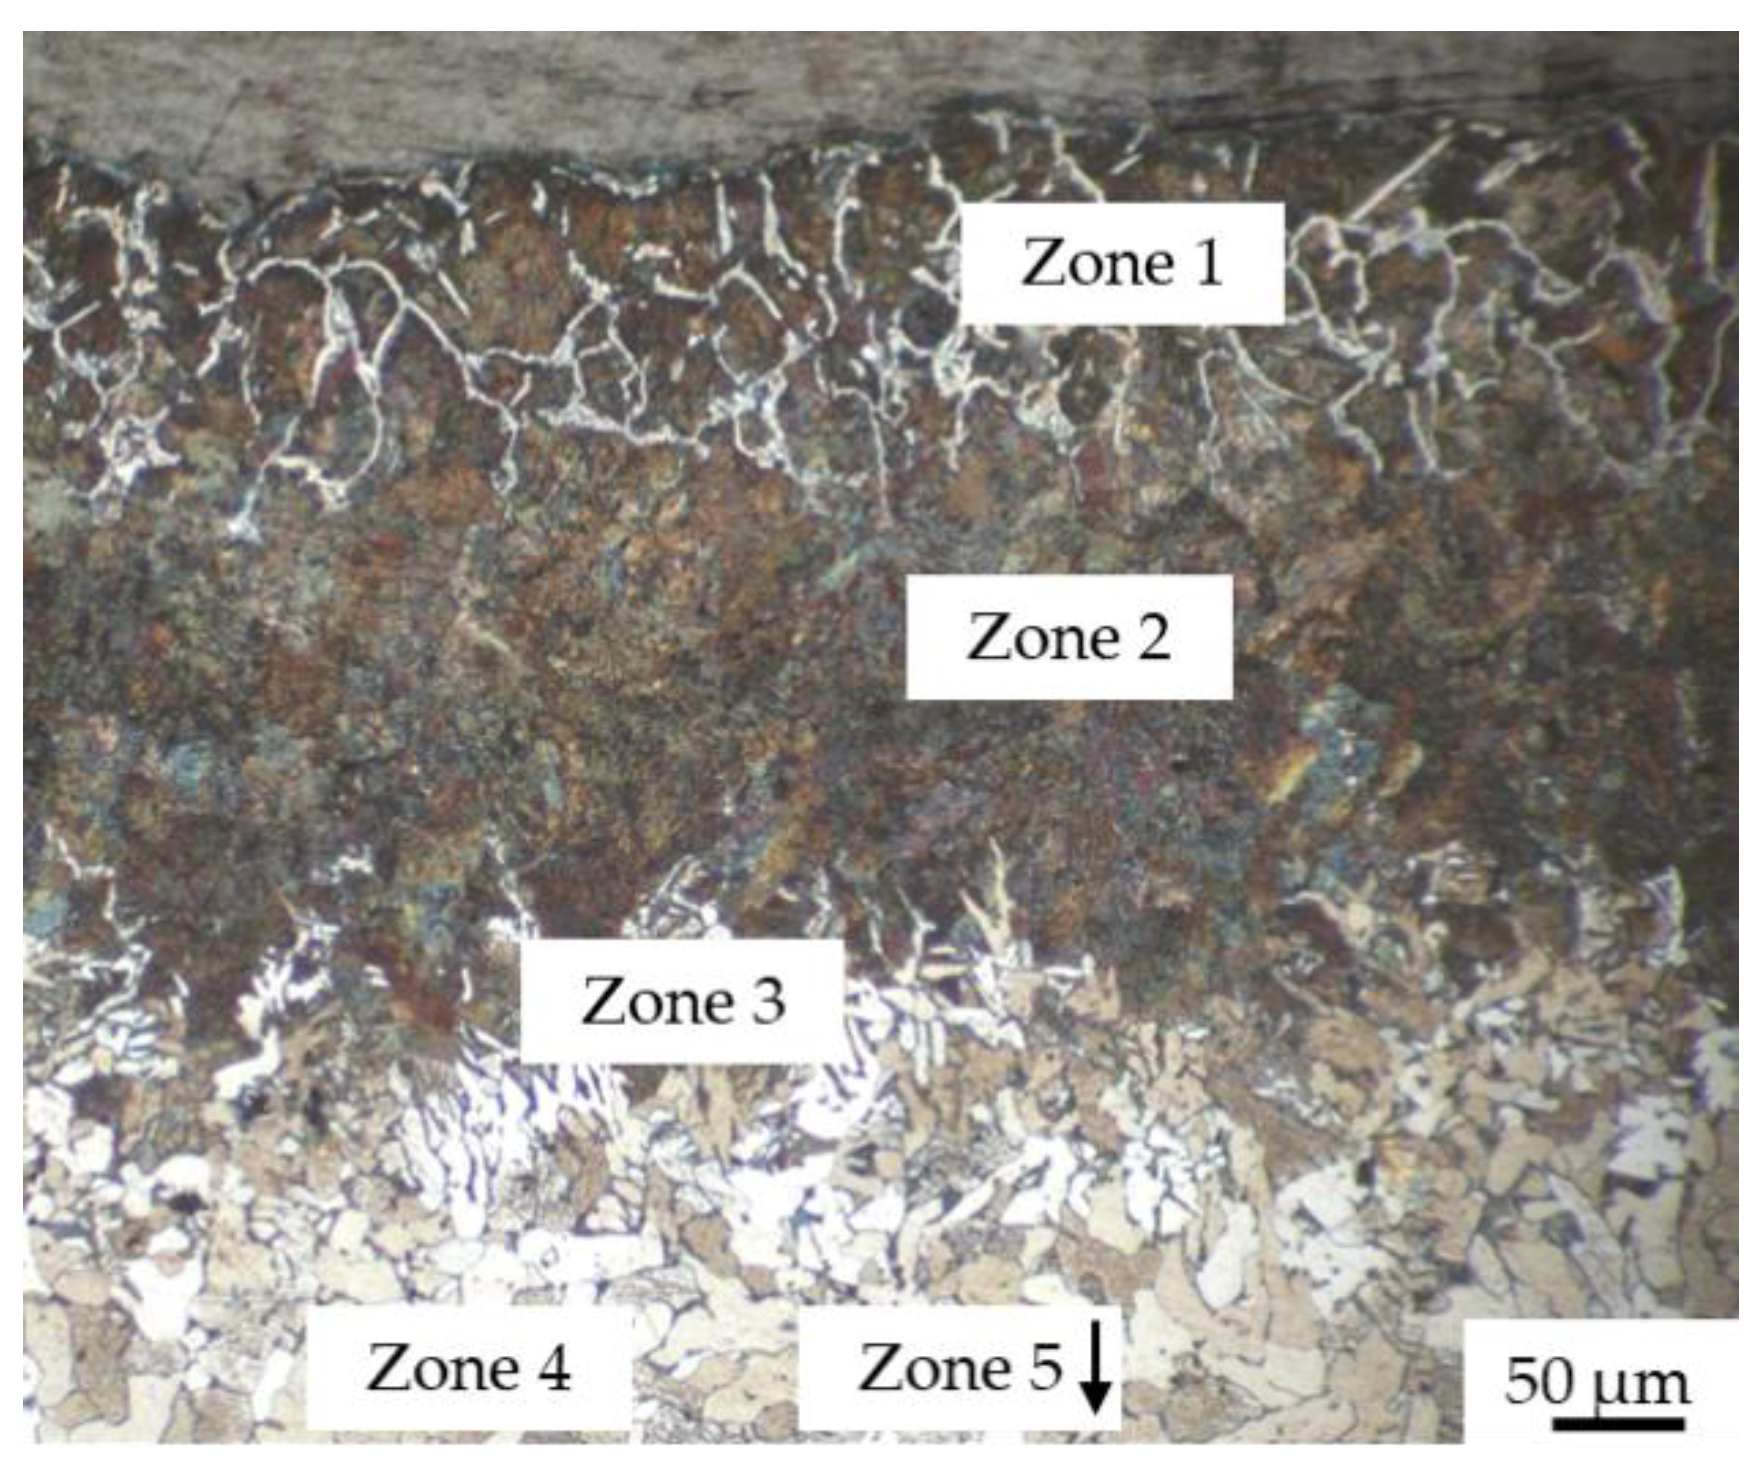
  • Without coating, the carburization of iron powder took place during sintering (up to 400 µm) and five zones were detected from the top surface to the bulk:
    -
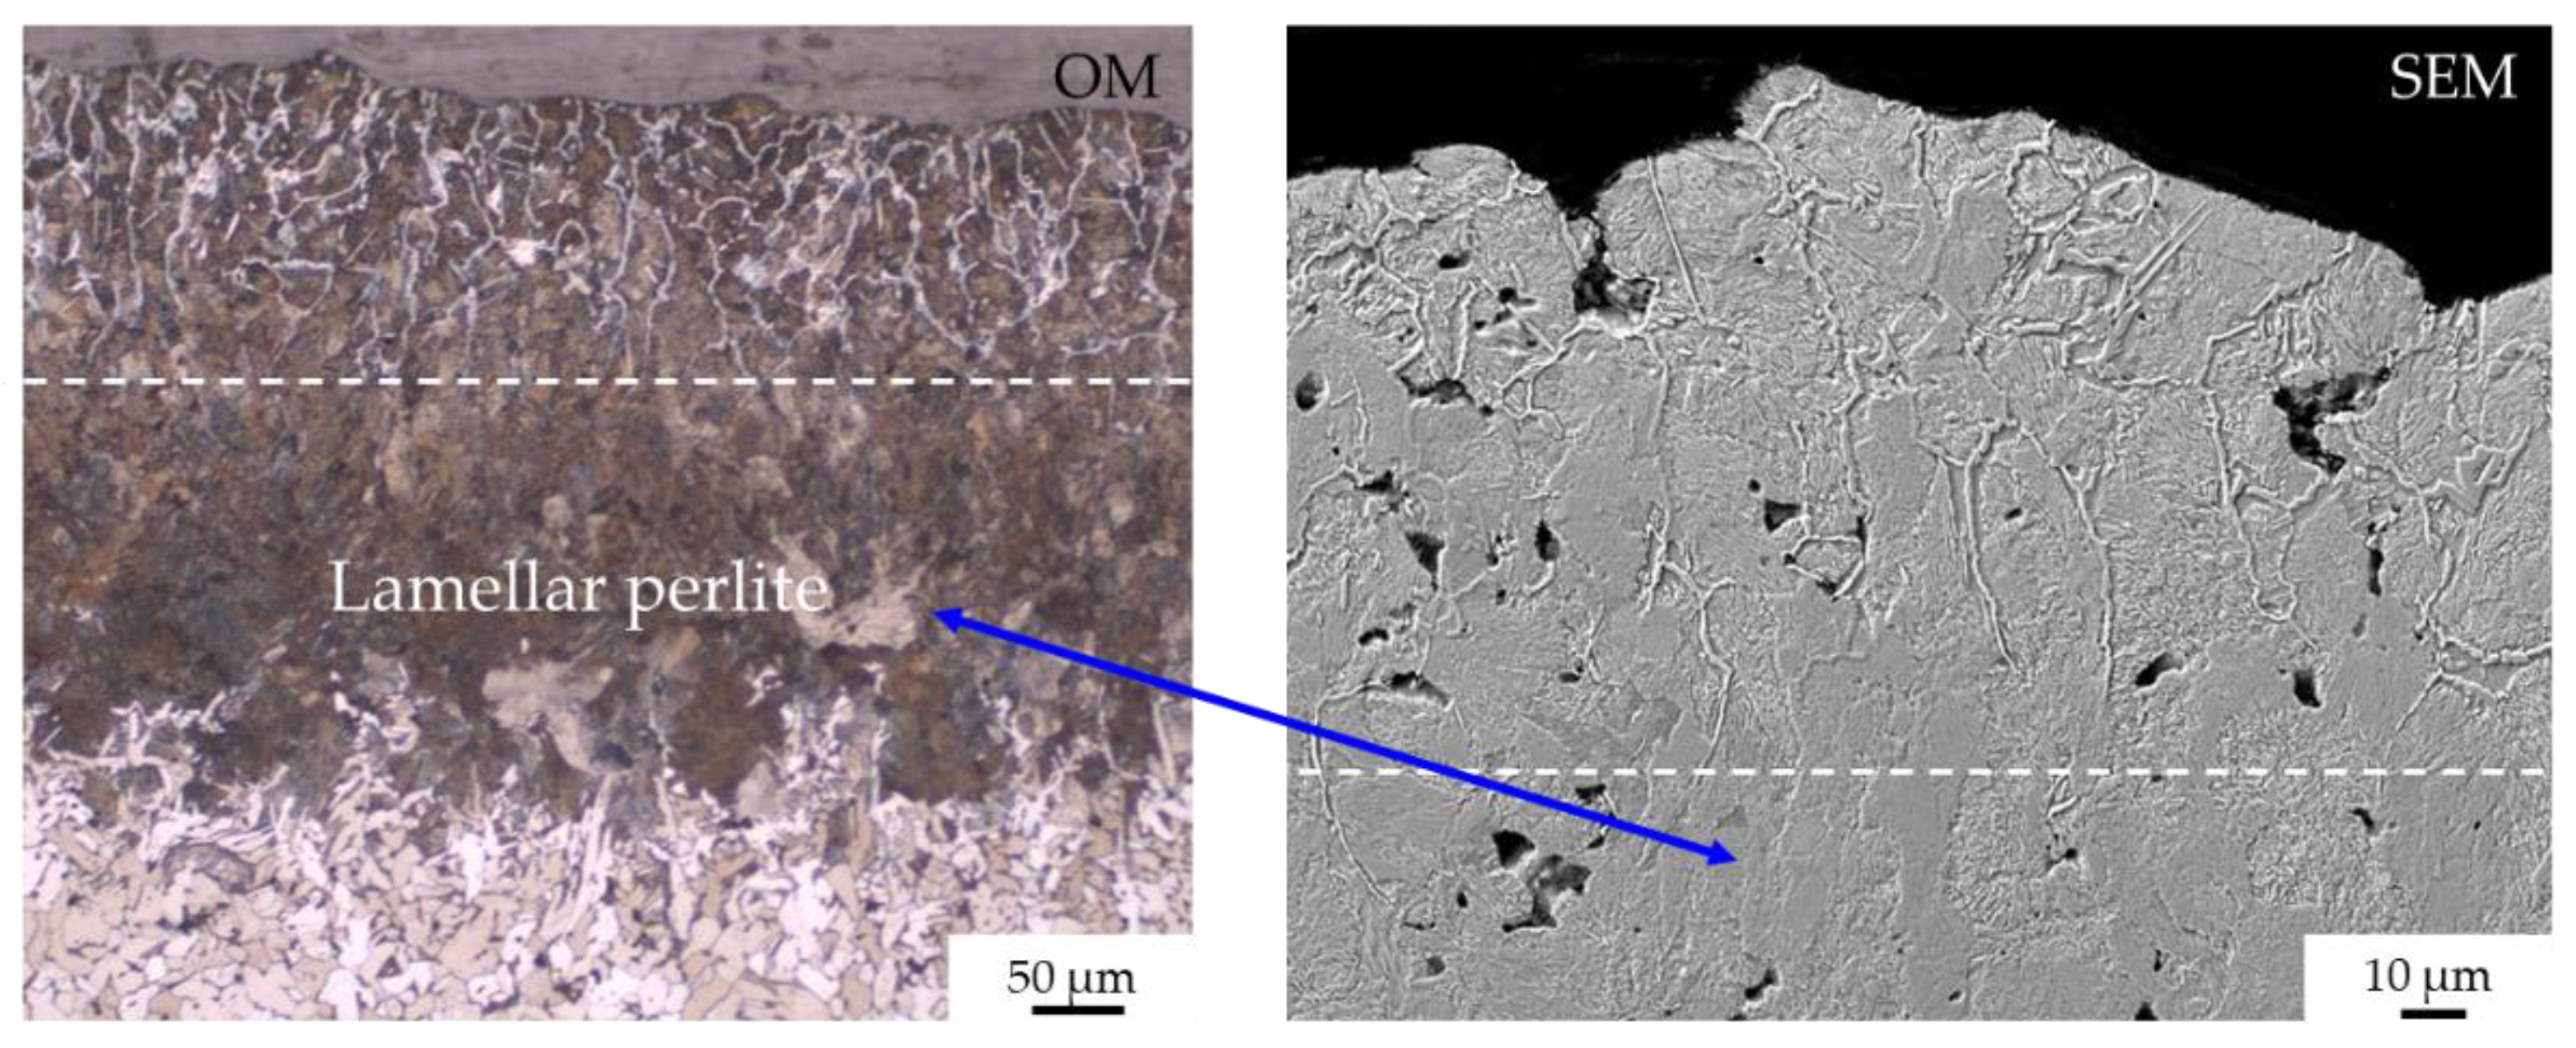
    zone 1: lamellar pearlite + cementite + abnormal ferrite (corresponding to hypereutectoid steel);
    -
    zone 2: lamellar pearlite (corresponding to eutectoid steel);
    -
    zone 3: pearlite + ferrite (corresponding to hypoeutectoid steel);
    -
    zone 4–5: recrystallized ferrite followed by grain growth (corresponding to iron).
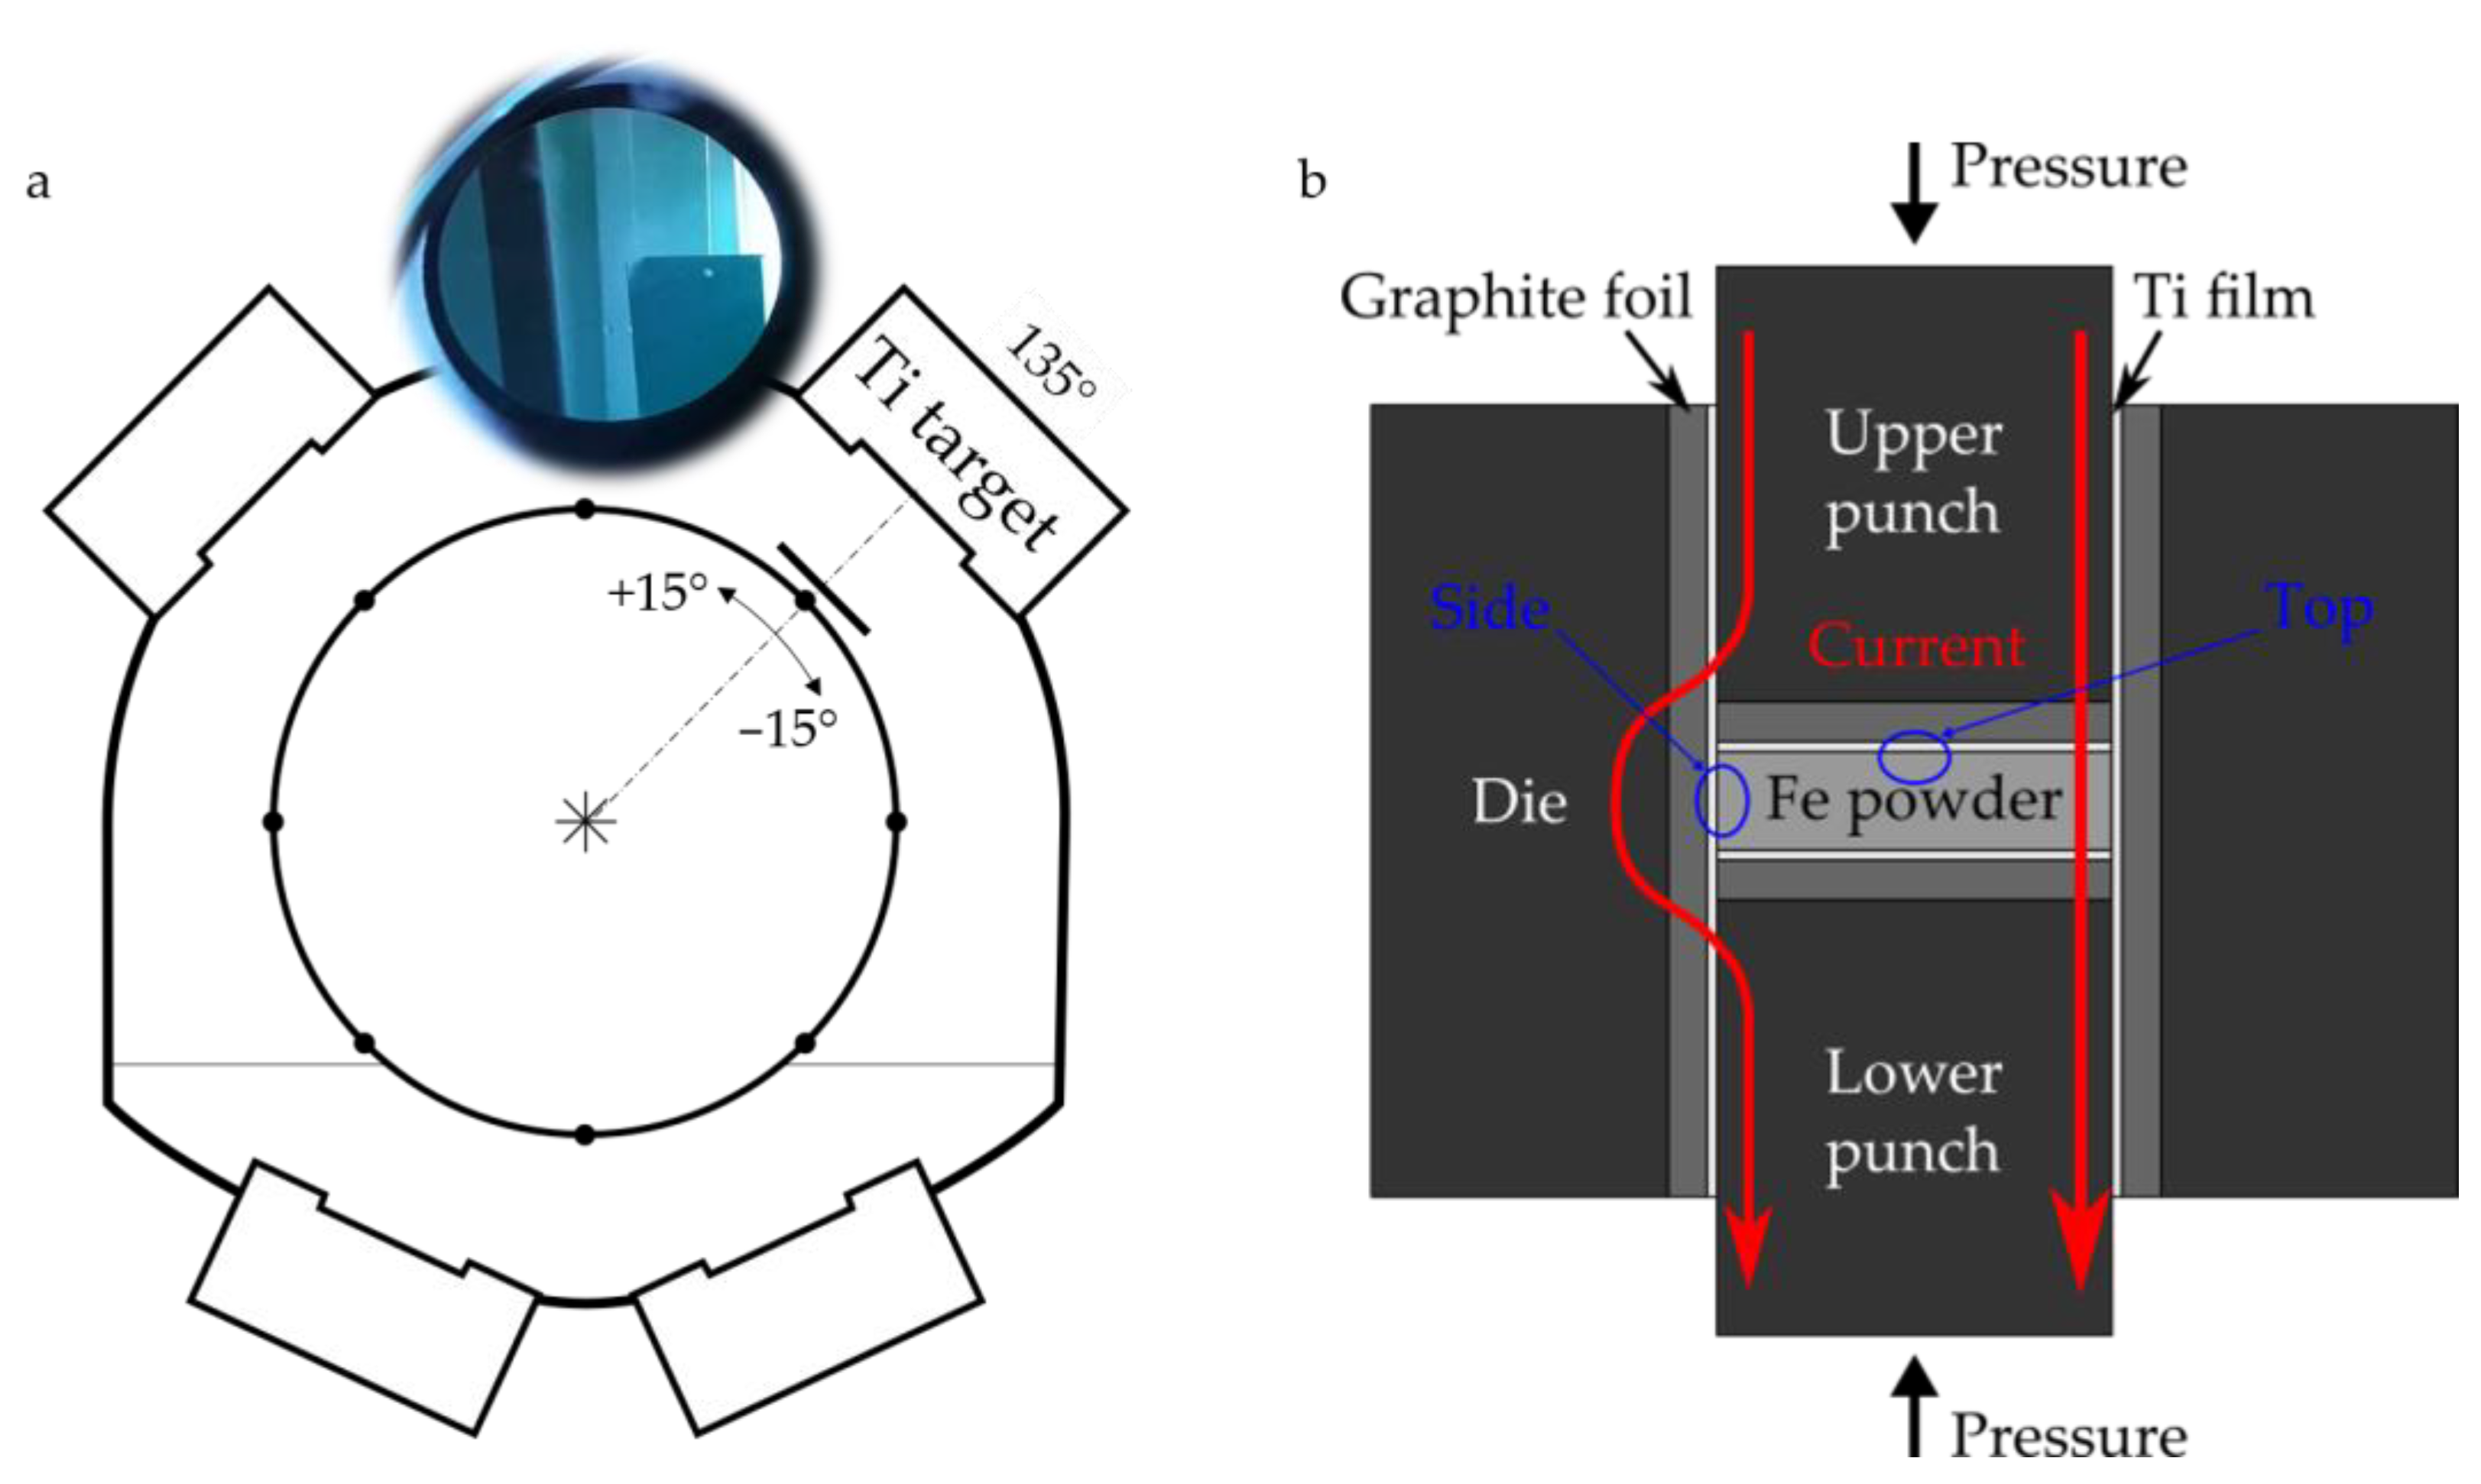
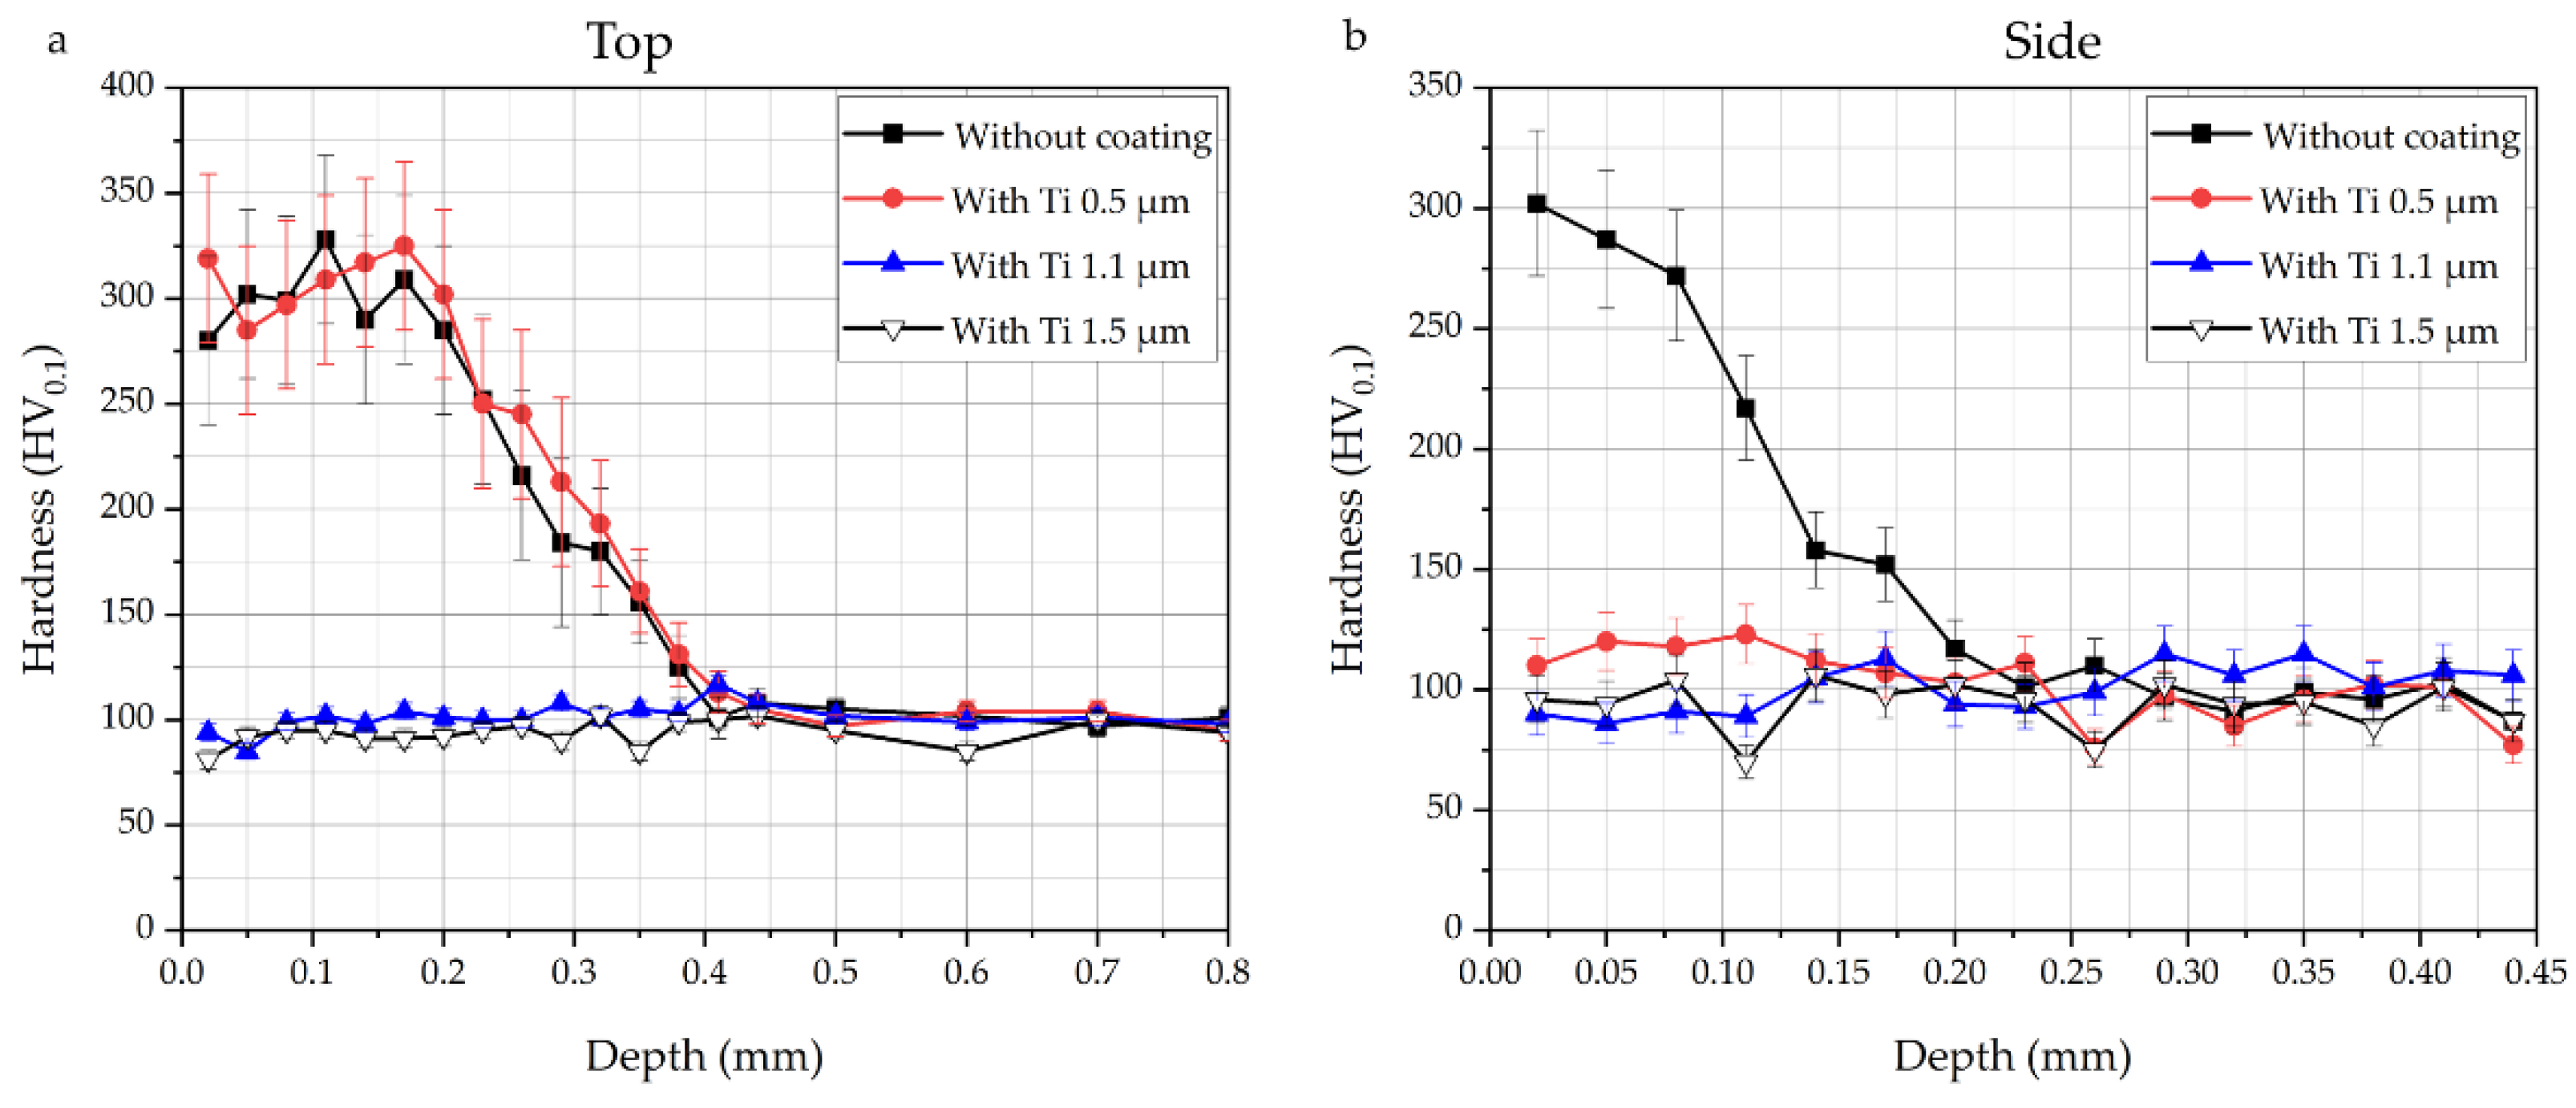
  • Carburization of iron powder is faster on top (and bottom) of the sample, compared to the side in contact with the graphite foil surrounding the mold, thanks to the pressure and the current flow.
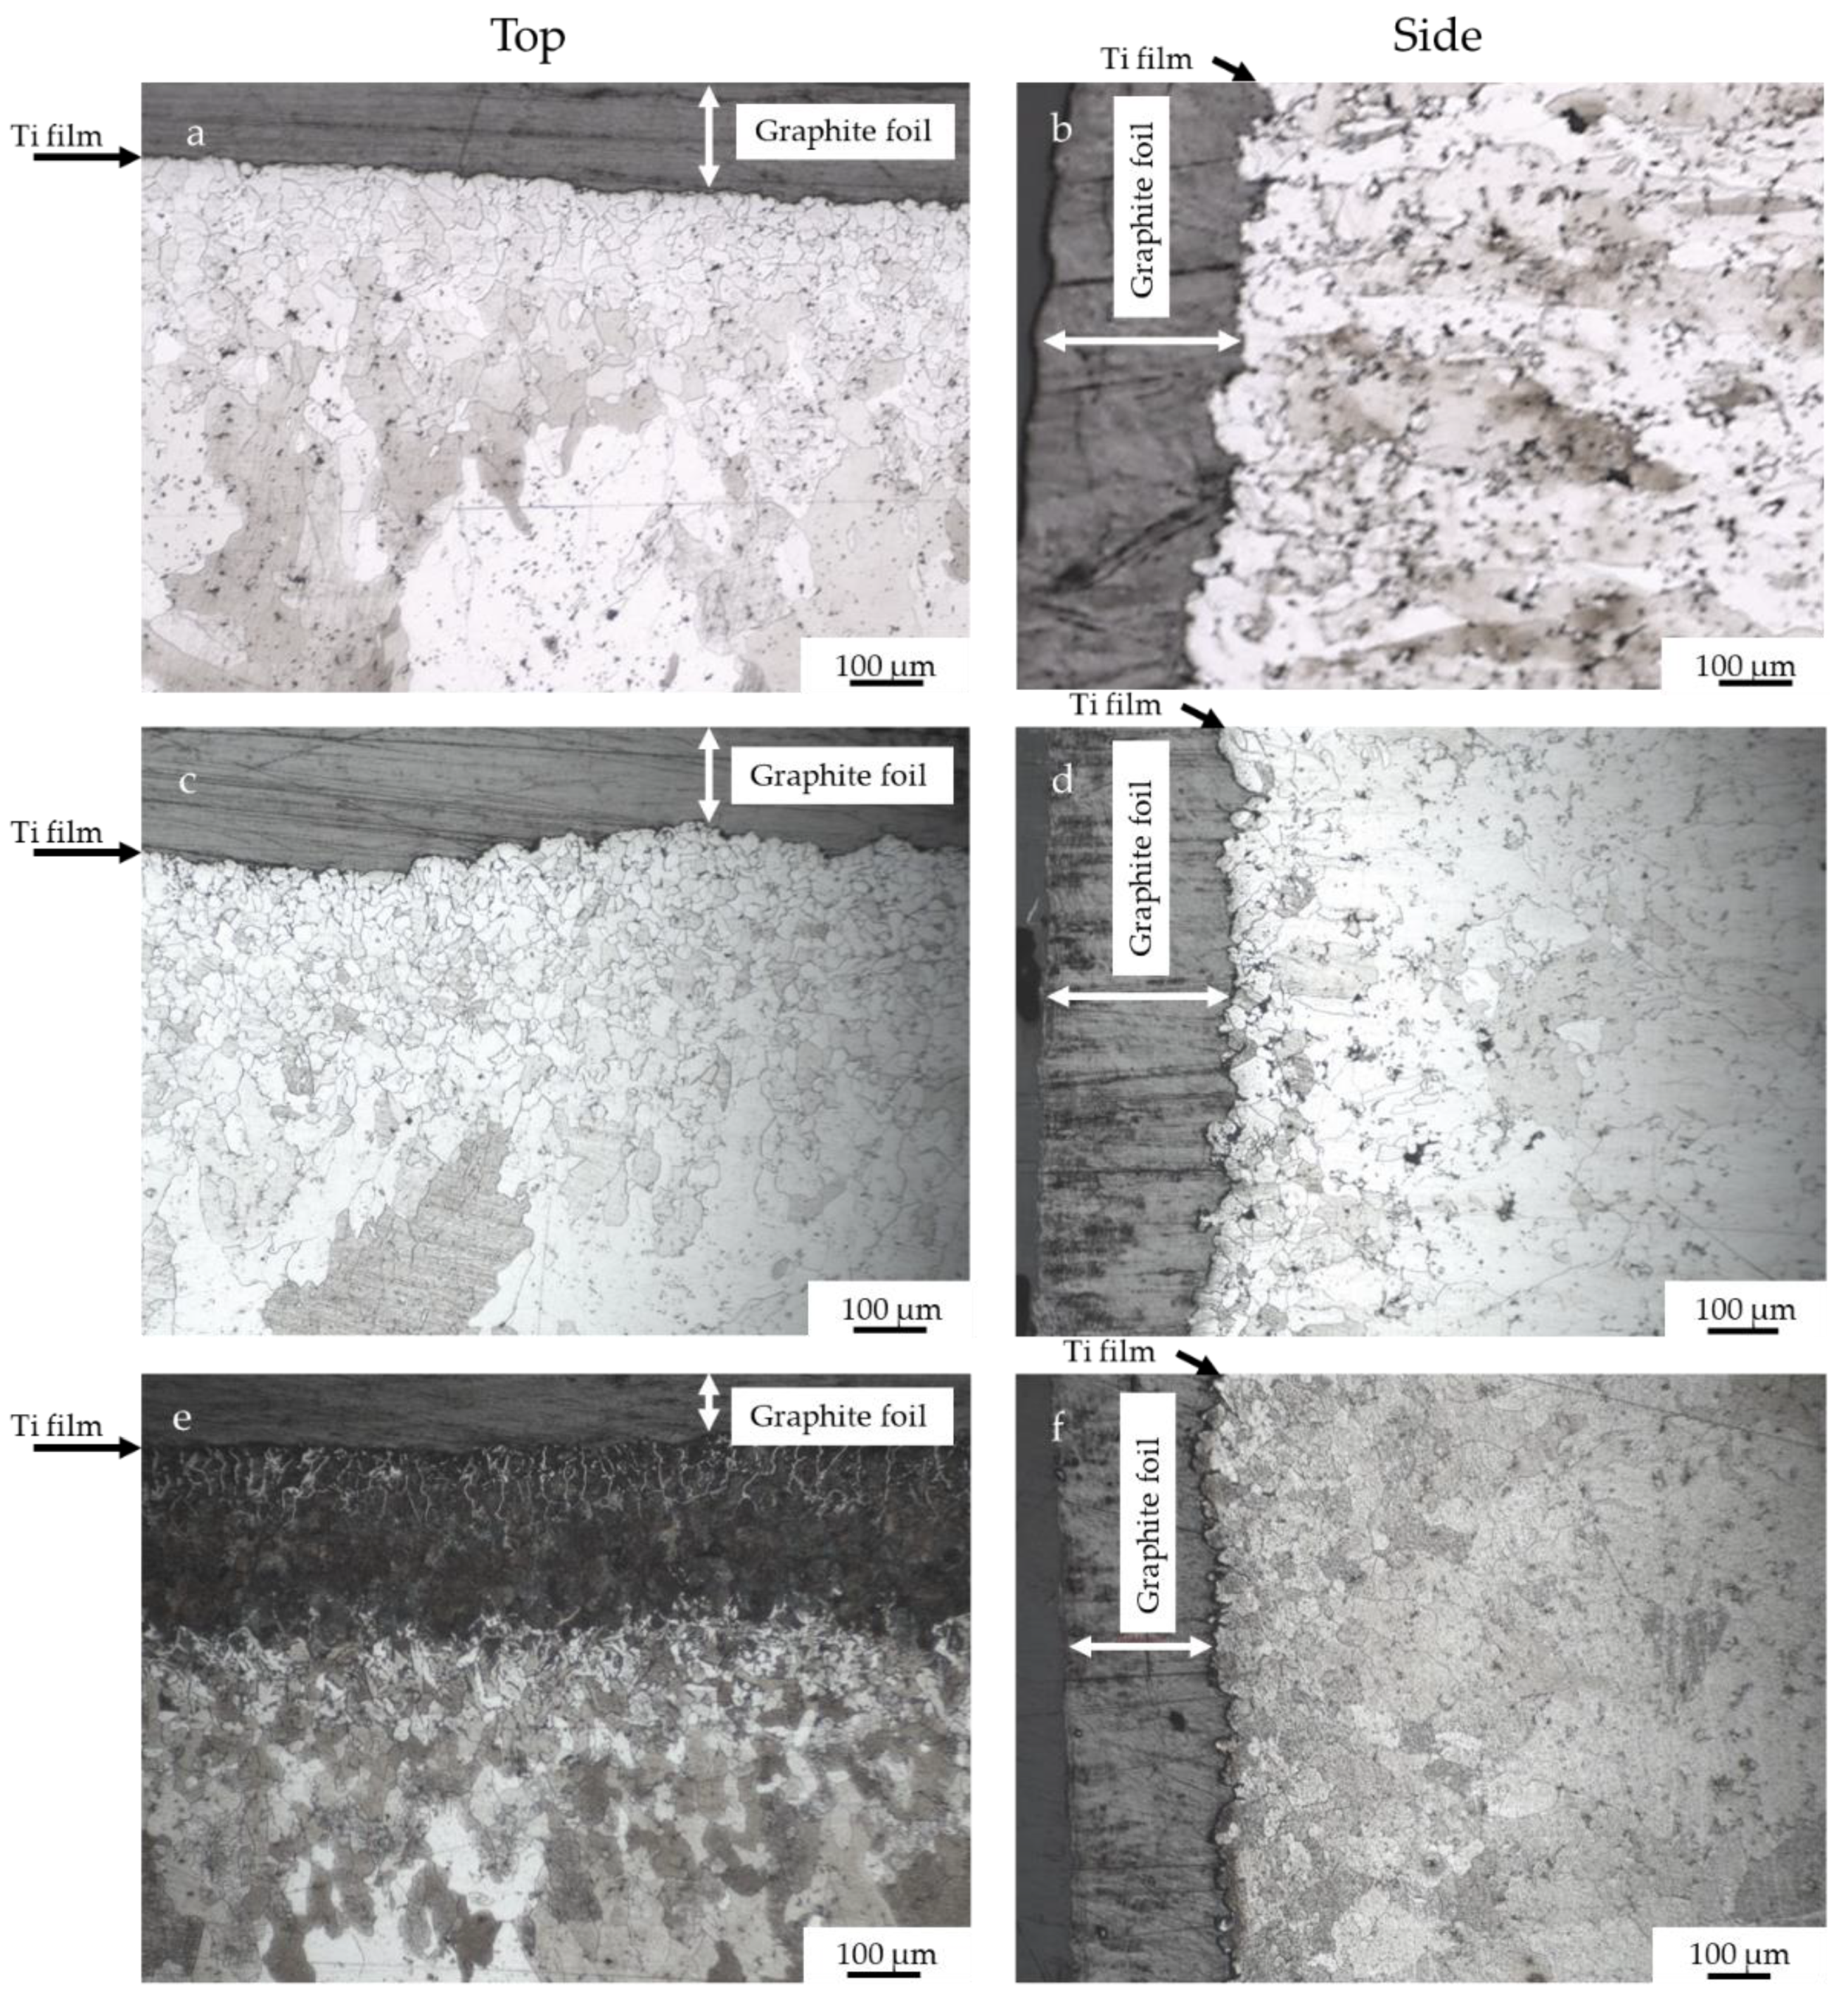
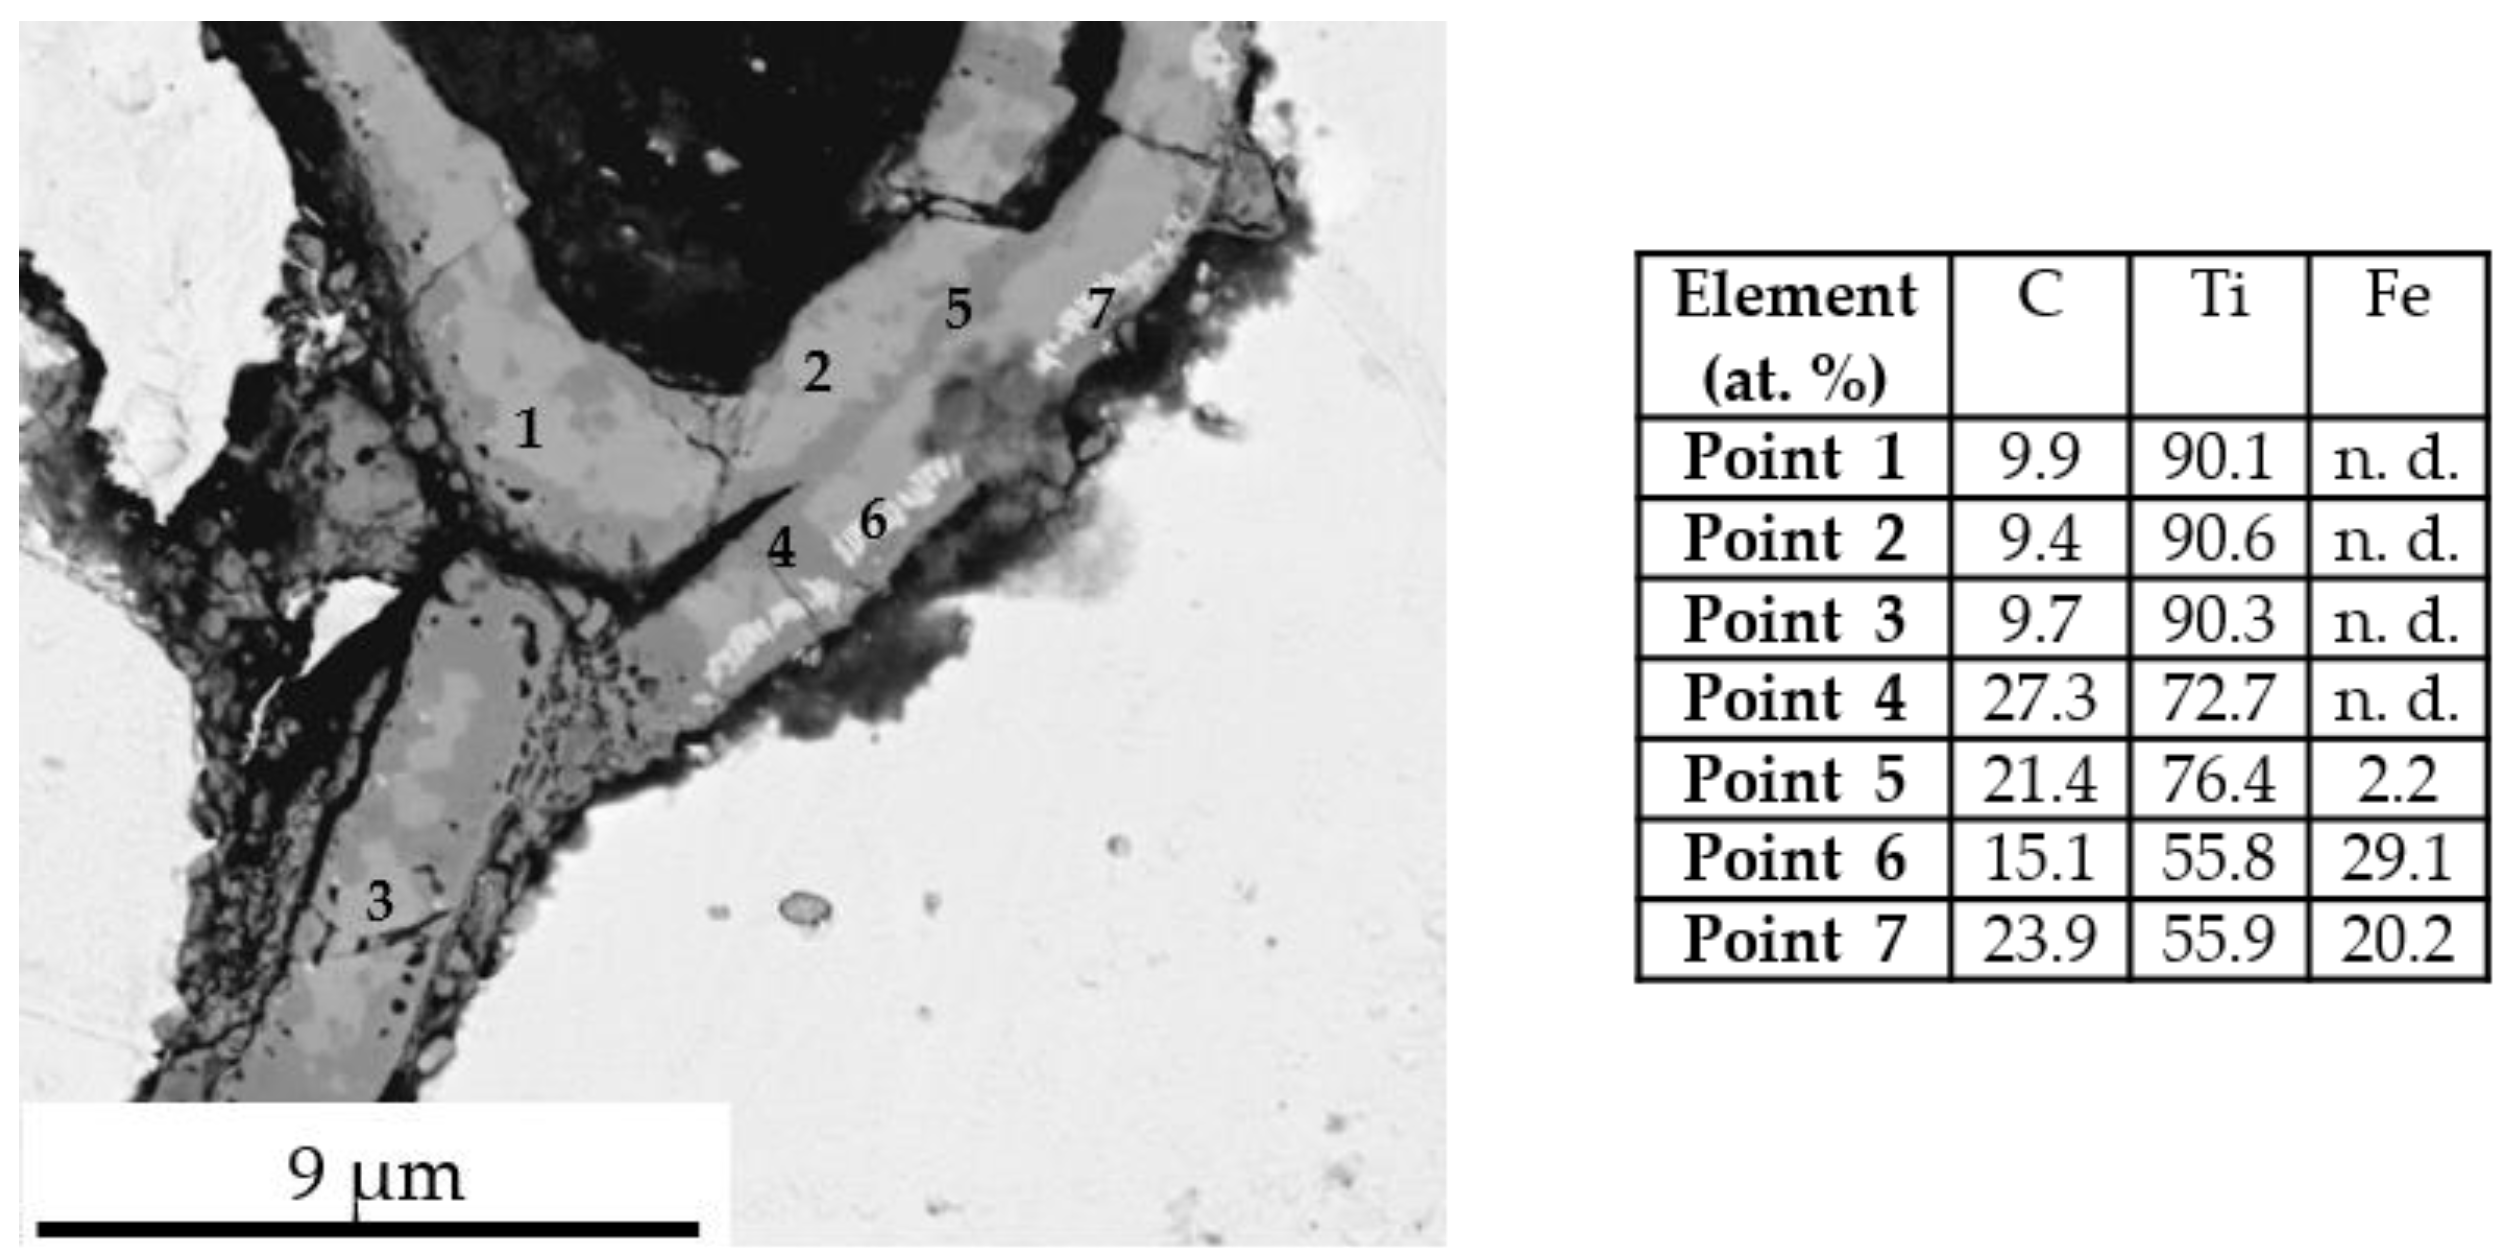
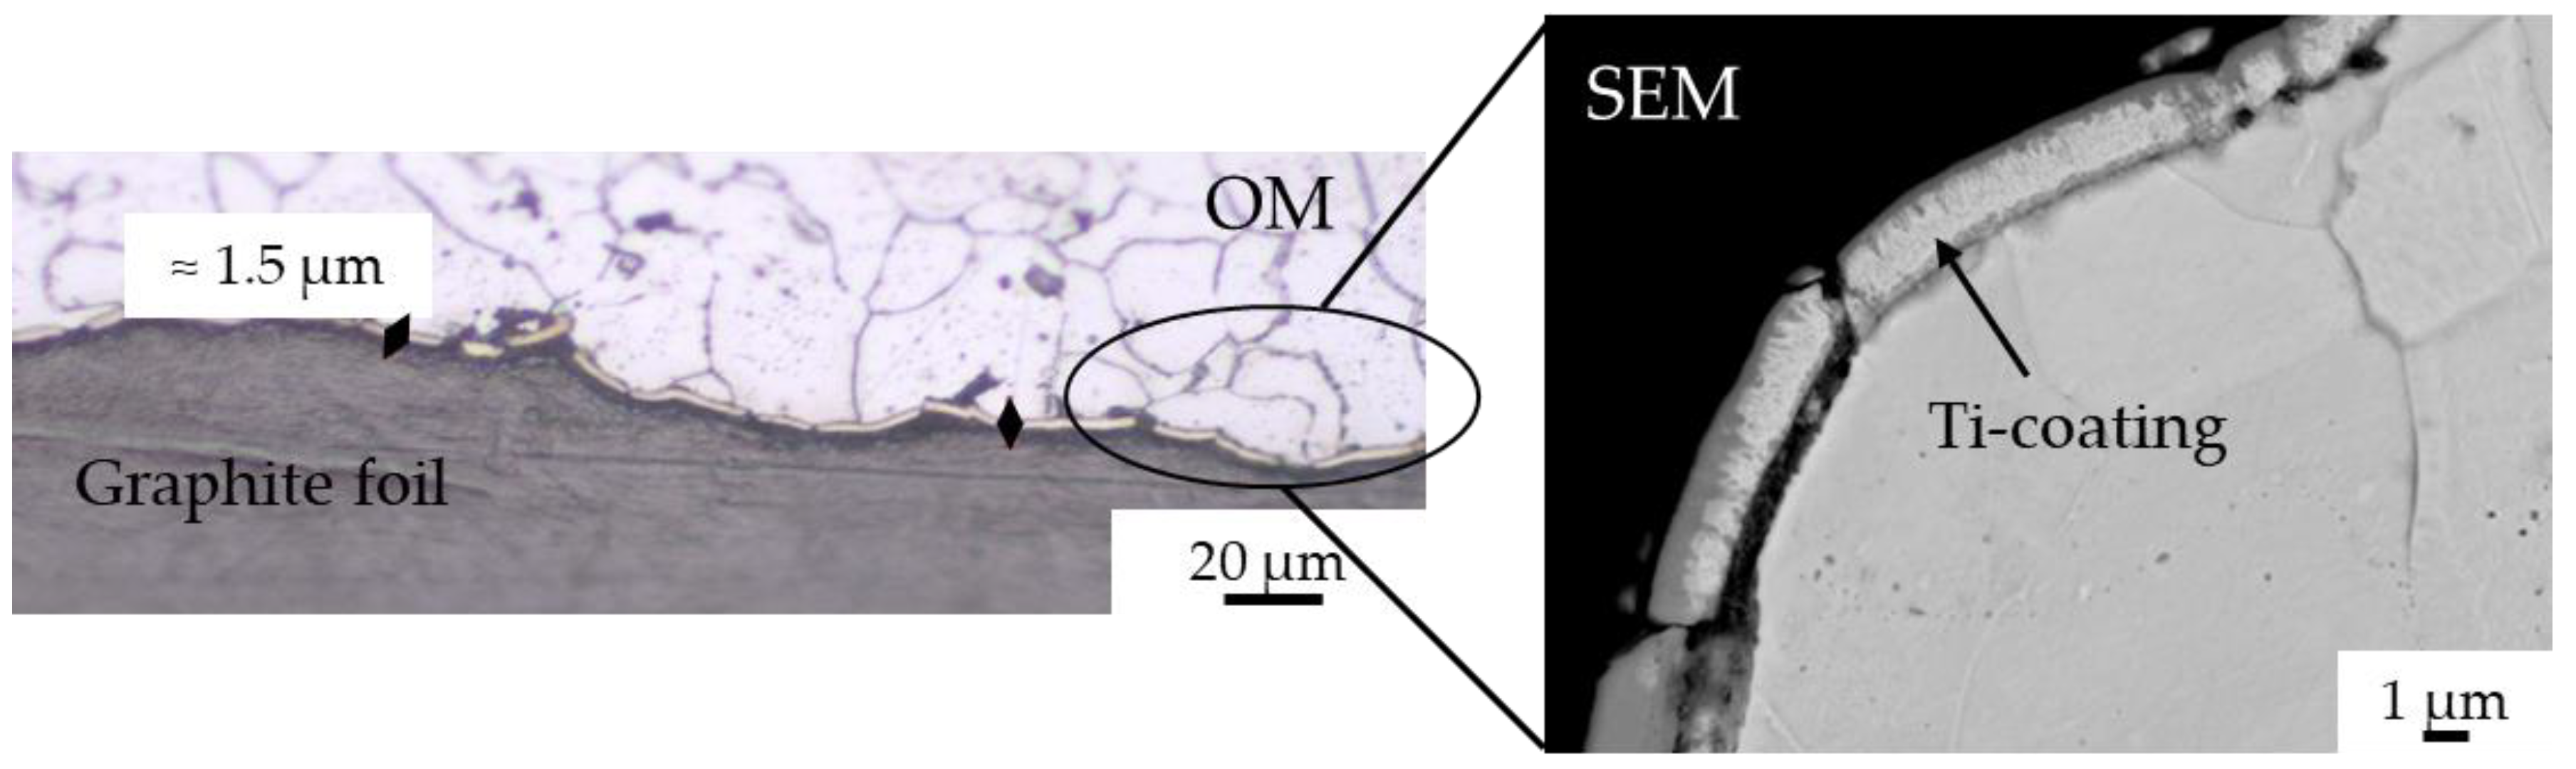
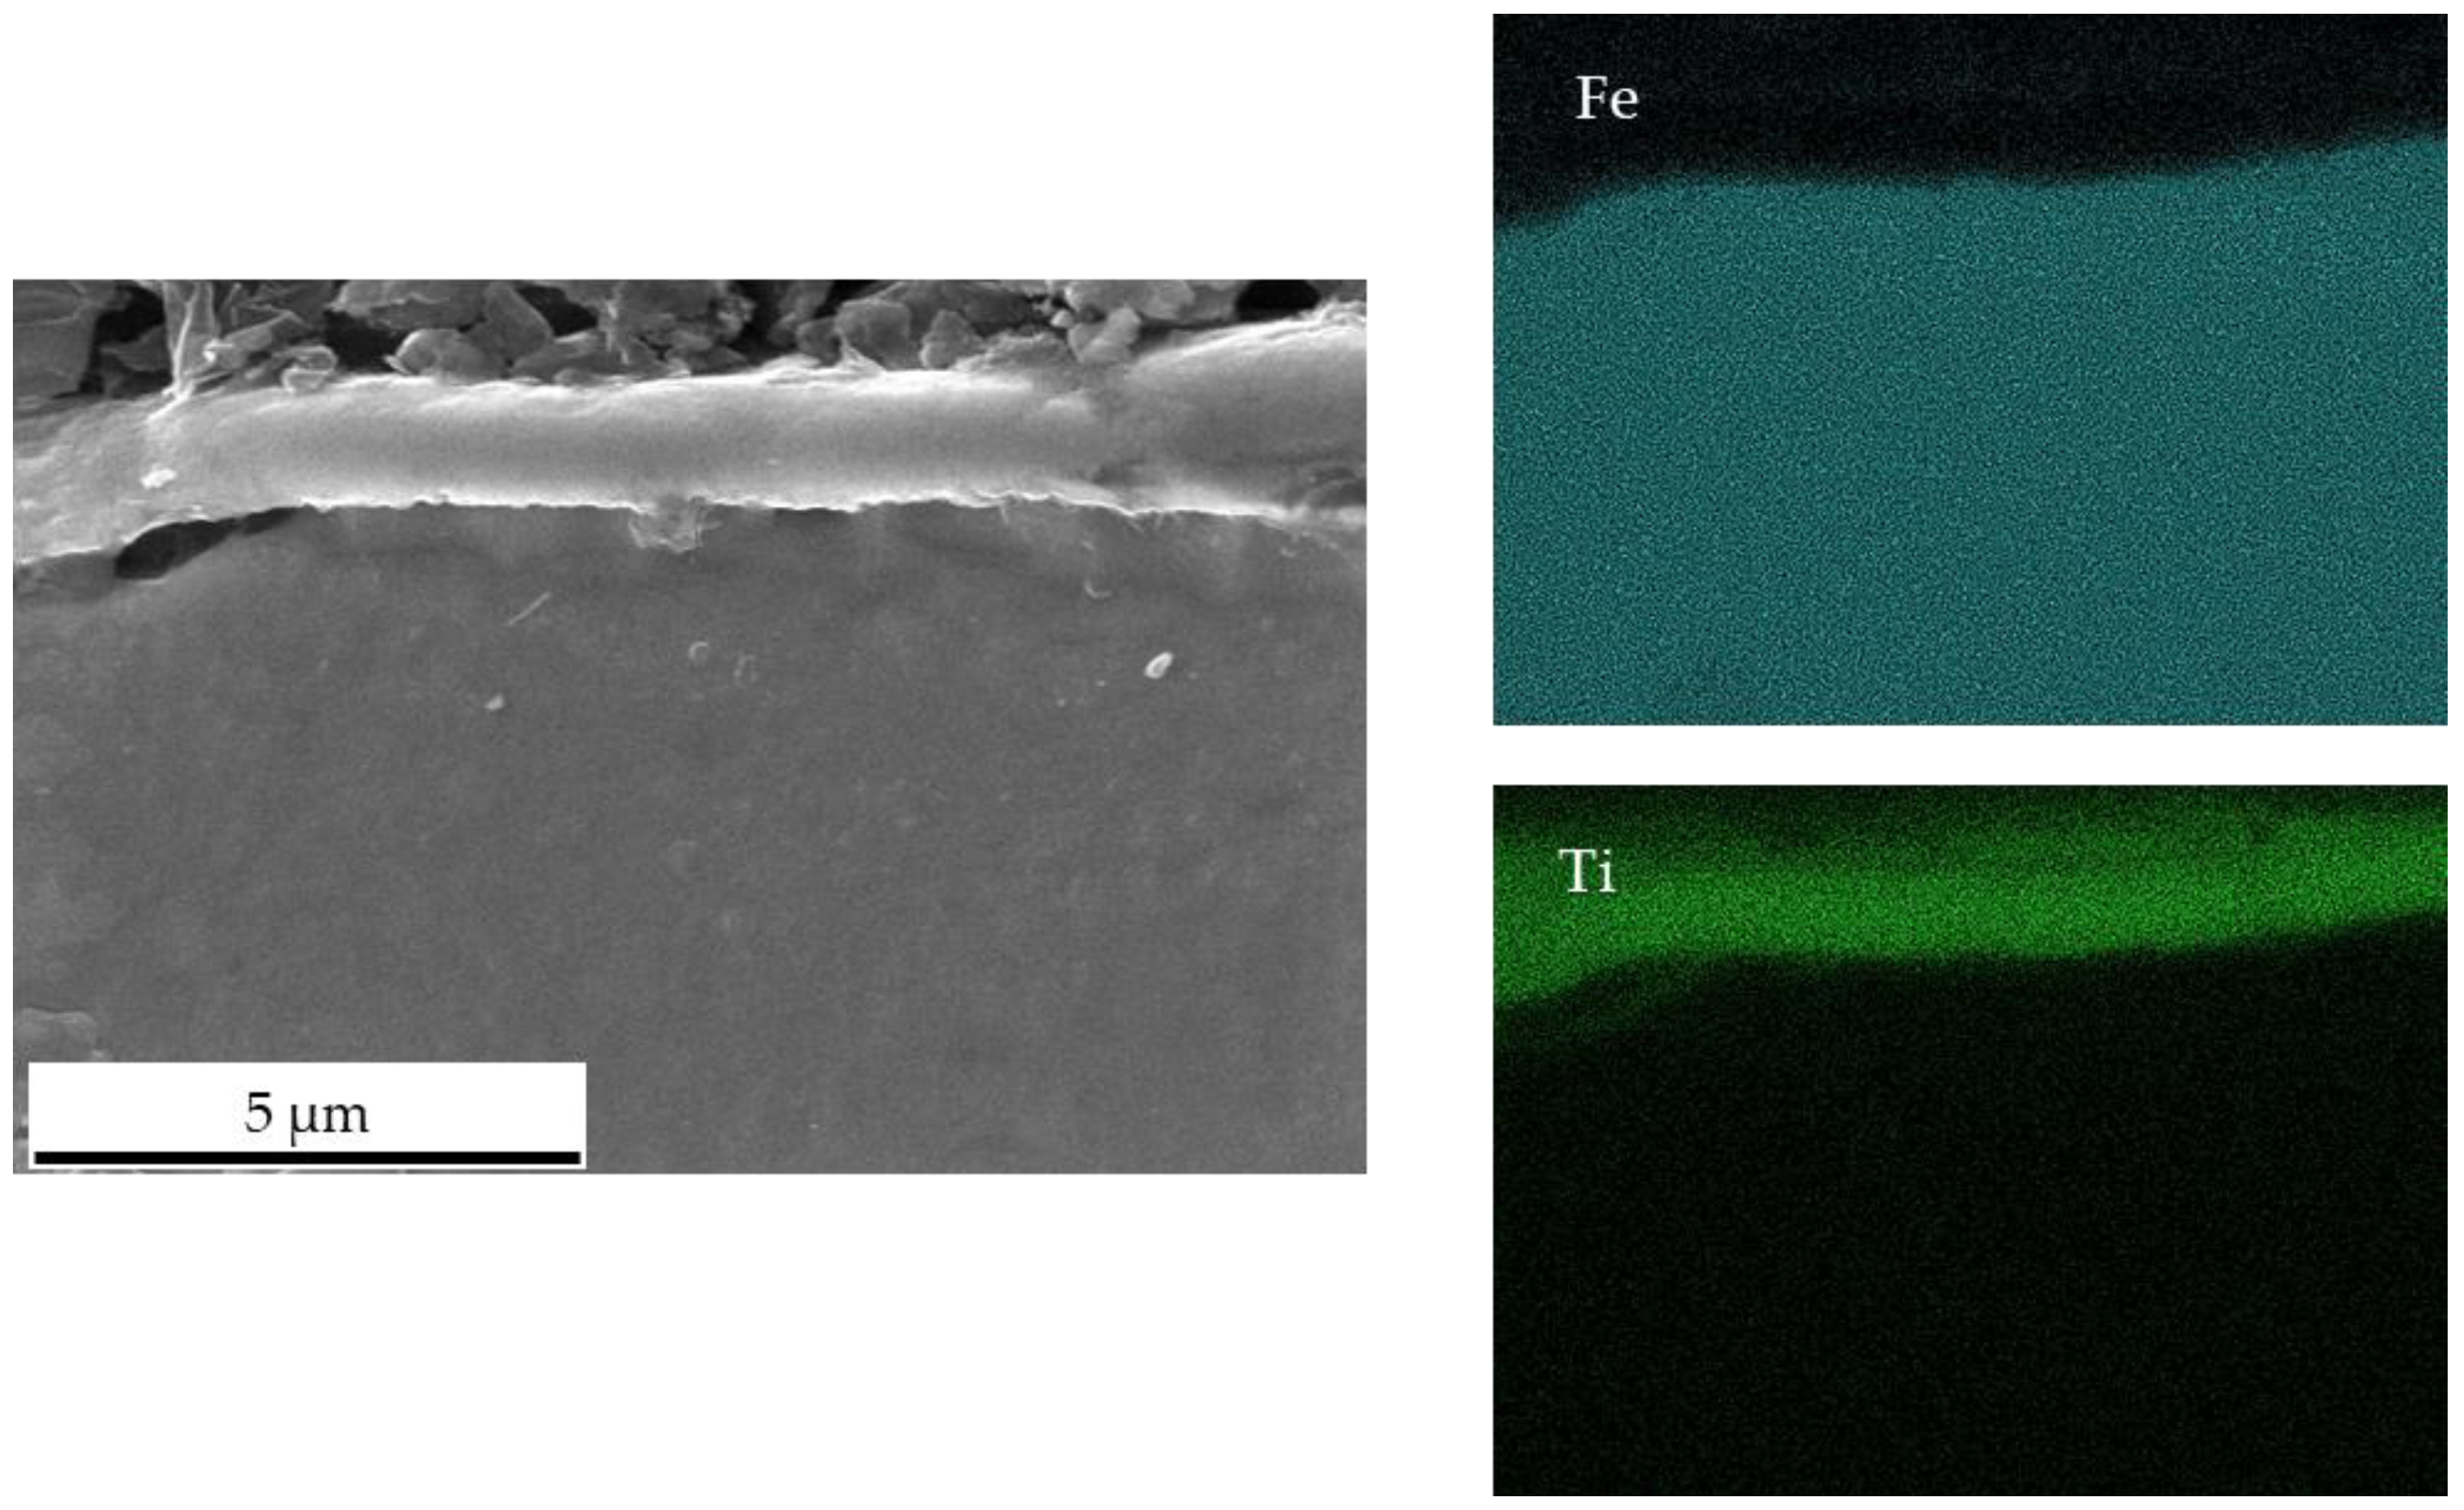
  • The application of a Ti PVD film of 1.5 and 1.1 µm on graphite foils is effective to completely avoid carburization of iron powder (top, bottom and sides). Iron diffusion was revealed inside the Ti film of 1.5 µm thickness.
  • With a Ti film of 0.5 µm thickness carburization of iron powder was not avoided on top and bottom of the sintered sample, but only on the side.
  • Microhardness profiles confirm the OM observations.
  • Ti coatings with thicknesses between 1.1 and 0.5 µm have to be tested to find the minimum coating thickness assuring protection against carbon diffusion. Anyway, the obtained results suggest that the use of graphite foils coated by a thin PVD film can represent a large-scale effective solution to avoid carbon diffusion during SPS process in the case of metal powders.

Supplementary Materials

The following are available online at https://www.mdpi.com/article/10.3390/solids2040025/s1, Figure S1: characterization of the carburized zone after 10 min SPS at 1200 °C under 50 MPa of (a) an austenitic and (b) a duplex stainless steel; Figure S2: surface morphologies of the Ti coatings deposited on graphite foils; Figure S3: EXD maps of the top surface of the sintered iron using graphite foil with a Ti coating of 1.5 µm.

Author Contributions

Conceptualization, M.-R.A.-B. and A.B.; methodology, M.-R.A.-B. and A.B.; validation, M.-R.A.-B. and A.B.; investigation, A.B., M.M. and F.B.; writing—original draft preparation, M.-R.A.-B.; writing—review and editing, M.-R.A.-B. and A.B.; visualization, M.-R.A.-B.; supervision, M.-R.A.-B.; project administration, M.-R.A.-B. and A.B. All authors have read and agreed to the published version of the manuscript.

Funding

This research received no external funding.

Institutional Review Board Statement

Not applicable.

Informed Consent Statement

Not applicable.

Data Availability Statement

Not applicable.

Conflicts of Interest

The authors declare no conflict of interest.

References

  1. Zhang, Y.; Wang, L.; Jiang, W.; Bai, G.; Chen, L. Effect of Fabrication Method on Microstructure and Properties of Al2O3–TiC Composites. Mater. Trans. 2005, 46, 2015–2019. [Google Scholar] [CrossRef] [Green Version]
  2. Munir, Z.A.; Anselmi-Tamburini, U.; Ohyanagi, M. The effect of electric field and pressure on the synthesis and consolidation of materials: A review of the spark plasma sintering method. J. Mater. Sci. 2006, 41, 763–777. [Google Scholar] [CrossRef]
  3. Mamedov, V. Spark plasma sintering as advanced PM sintering method. Powder Metall. 2002, 45, 322–328. [Google Scholar] [CrossRef]
  4. Hu, Z.-Y.; Zhang, Z.-H.; Cheng, X.-W.; Wang, F.-C.; Zhang, Y.-F.; Li, S.-L. A review of multi-physical fields induced phenomena and effects in spark plasma sintering: Fundamentals and applications. Mater. Des. 2020, 191, 108662. [Google Scholar] [CrossRef]
  5. Vanmeensel, K.; Laptev, A.; Hennicke, J.; Vleugels, J.; Van der Biest, O. Modelling of the temperature distribution during field assisted sintering. Acta Mater. 2005, 53, 4379–4388. [Google Scholar] [CrossRef]
  6. Nečina, V.; Pabst, W. Highly dense spinel ceramics with completely suppressed grain growth prepared via SPS with NaF as a sintering additive. J. Eur. Ceram. Soc. 2020, 40, 3354–3357. [Google Scholar] [CrossRef]
  7. Csáki, S.; Lukák, F.; Húlan, T.; Veverka, J.; Knapek, M. Preparation of anorthite ceramics using SPS. J. Eur. Ceram. Soc. 2021, 41, 4618–4624. [Google Scholar] [CrossRef]
  8. Bolsonella, A.; Naimi, F.; Heintz, O.; Tricone, T.; Couque, H.; Bernard, F. Influence of oxygen induced during high-energy ball milling process on the mechanical properties of sintered nickel by SPS. J. Alloys Compd. 2021, 856, 157869. [Google Scholar] [CrossRef]
  9. Hakeem, H.S.; Patel, F.; Minhas, N.; Malkawi, A.; Aleid, Z.; Ehsan, M.A.; Sharrofna, H.; Al Ghanim, A. Comparative evaluation of thermal and mechanical properties of nickel alloy 718 prepared using selective laser melting, spark plasma sintering, and casting methods. J. Mater. Res. Technol. 2021, 12, 870–881. [Google Scholar] [CrossRef]
  10. Nie, Q.; Chen, C.; Wang, B.; Yang, L.; Zhang, J.; Tang, W. Effect of Invar particle size on microstructures and properties of the Cu/Invar bi-metal matrix composites fabricated by SPS. J. Alloys Compd. 2022, 891, 162055. [Google Scholar] [CrossRef]
  11. Liu, L.; Morita, K. Fabrication of MgAl2O4/Al2O3 laminated transparent composite by spark-plasma-sintering (SPS) processing. Scr. Mater. 2021, 250, 114205. [Google Scholar] [CrossRef]
  12. Orru, R.; Licheri, R.; Locci, A.-M.; Cincotti, A.; Cao, G. Consolidation/synthesis of materials by electric current activated/assisted sintering. Mater. Sci. Eng. R Rep. 2009, 63, 127–287. [Google Scholar] [CrossRef]
  13. Koide, M.; Takei, S.; Sato, T.; Matusita, K. Preparation of silica glass by pulsed electric current method. J. Ceram. Soc. Jpn. 2002, 110, 867–869. [Google Scholar] [CrossRef] [Green Version]
  14. Moser, M.; Lorand, S.; Bussiere, F.; Demoisson, F.; Couque, H.; Bernard, F. Influence of carbon diffusion and the presence of oxygen on the microstructure of molybdenum powders densified by SPS. Metals 2020, 10, 948. [Google Scholar] [CrossRef]
  15. Macía, E.; García-Junceda, A.; Serrano, M.; Hong, S.J.; Campos, M. Effect of mechanical alloying on the microstructural evolution of a ferritic ODS steel with (Y-Ti-Al-Zr) addition processed by Spark Plasma Sintering (SPS). Nucl. Eng. Technol. 2021, 53, 2582–2590. [Google Scholar] [CrossRef]
  16. Ovtar, S.; Le Gallet, S.; Minier, L.; Millot, N.; Lisjak, D. Control of barium ferrite decomposition during spark plasma sintering: Towards nanostructured samples with anisotropic magnetic properties. J. Eur. Ceram. Soc. 2014, 34, 337–346. [Google Scholar] [CrossRef]
  17. Minier, L.; Le Gallet, S.; Grin, Y.; Bernard, F. Influence of the current flow on the SPS sintering of a Ni powder. J. Alloys Compd. 2010, 508, 412–418. [Google Scholar] [CrossRef]
  18. Okamoto, H. C-Ti (Carbon-Titanium). J. Phase Equilib. 1998, 19, 89. [Google Scholar] [CrossRef]
  19. Raghavan, V. C-Fe-Ti (Carbon-Iron-Titanium). J. Phase Equilib. 2003, 24, 62–66. [Google Scholar] [CrossRef]
  20. Klopotov, V.D.; Denisova, Y.A.; Teresov, A.D.; Petrikova, E.A.; Shugurov, V.V.; Seksenalina, M.A.; Ivanov, Y.F.; Klopotov, A.A. Combined treatment of steel, including electrospark doping and subsequent irradiation with a high-intensity electron beam. Mater. Sci. Eng. 2016, 124, 012125. [Google Scholar] [CrossRef]
  21. Evrard, M.; Besnard, A.; Lucas, S. Study of the influence of the pressure and rotational motion of 3D substrates processed by magnetron sputtering: A comparative study between Monte Carlo modelling and experiments. Surf. Coat. Technol. 2019, 378, 125070. [Google Scholar] [CrossRef]
  22. Nakajima, H.; Koiv, M. Diffusion in Titanium. ISIJ Int. 1991, 31, 757–766. [Google Scholar] [CrossRef] [Green Version]
  23. Shapovalov, V.P.; Kurasov, A.N. Diffusion of titaium in iron. Metalloved. Termich. Obrab. Metall. 1975, 9, 71–73. [Google Scholar]
  24. McQuaid, H.W.; Ehn, E.W. Effect of quality of steel on case-carburizing results. Trans. Am. Inst. Min. Metall. Eng. 1922, 67, 341. [Google Scholar]
  25. Nijhawan, B.R.; Chatterjea, A.B.; Bhatnagar, S. Micrometallurgy of abnormality in steels. J. Iron Steel Inst. 1966, 204, 821–830. [Google Scholar]
  26. Hillert, M. The formation of pearlite. In Decomposition of Austenite by Diffusional Processes; Zackey, V.F., Aaronson, H.I., Eds.; Interscience Publishers: New York, NY, USA, 1962; p. 197. [Google Scholar]
  27. Chairuangsri, T.; Edmond, D.V. Abnormal ferrite in hyper-eutectoid steel. Acta Mater. 2000, 48, 1581–1591. [Google Scholar] [CrossRef]
  28. Miyamoto, G.; Karube, Y.; Furuhara, T. Formation of grain boundary ferrite in eutectoid and hypereutectoid pearlitic steels. Acta Mater. 2016, 103, 370–381. [Google Scholar] [CrossRef]
  29. Trzaska, Z.; Couret, A.; Monchoux, J.P. Spark plasma sintering mechanisms at the necks between TiAl powder particles. Acta Mater. 2016, 118, 100–108. [Google Scholar] [CrossRef]
  30. Trzaska, Z.; Cours, R.; Monchoux, J.P. Densification of Ni and TiAl by SPS: Kinetics and microscopic mechanisms. Metall. Mater. Trans. A 2018, 49, 4849–4859. [Google Scholar] [CrossRef] [Green Version]
  31. Scotti, L.; Mottura, A. Interstitial diffusion of O, N, and C in α-Ti from first-principles: Analytical model and kinetic Monte Carlo simulations. J. Chem. Phys. 2016, 144, 084701. [Google Scholar] [CrossRef] [PubMed] [Green Version]
  32. Tisza, M. Physical Metallurgy for Engineers, 2nd ed.; ASM International: Materials Park, OH, USA; Freund Publishing House Ltd.: London, UK, 2001; p. 272. [Google Scholar]
Figure 1. Schematic representations of (a) PVD and (b) SPS devices.
Solids 02 00025 g001
Figure 2. OM view of the top of the iron sample sintered using graphite foils without coating.
Solids 02 00025 g002
Figure 3. Magnification of zone 1 (sintering with graphite foils without coating): OM (on the left) and SEM (on the right) images after chemical etching.
Solids 02 00025 g003
Figure 4. Magnification of zone 2 (sintering with graphite foils without coating): OM (on the left) and SEM (on the right) images after chemical etching.
Solids 02 00025 g004
Figure 5. Magnification of zone 3 (sintering with graphite foils without coating): OM images after chemical etching.
Solids 02 00025 g005
Figure 6. Correlation between Fe-C equilibrium diagram and the five zones observed in the sintered iron (sintering with graphite foils without coating).
Solids 02 00025 g006
Figure 7. OM views of the side of the iron sample sintered using graphite foils without coating.
Solids 02 00025 g007
Figure 8. OM observations of the iron samples sintered using graphite foils with Ti coatings of (a,b) 1.5 µm thickness, (c,d) 1.1 µm thickness and (e,f) 0.5 µm thickness.
Solids 02 00025 g008
Figure 9. Magnification of the interface between the sintered sample and the graphite foil coated with a Ti PVD layer of 1.5 µm thickness.
Solids 02 00025 g009
Figure 10. SEM image (backscattered electrons mode) and EDX analyses inside the 1.5 µm thick Ti coating after sintering.
Solids 02 00025 g010
Figure 11. SEM image (secondary electrons mode) and EDX elementary maps of the 1.1 µm thick Ti coating after sintering.
Solids 02 00025 g011
Figure 12. OM magnification of the top of the sample sintered using graphite foil with a 0.5 µm tick Ti coating: area where carburization thickness is more significant.
Solids 02 00025 g012
Figure 13. Microhardness profiles of (a) top of the samples and (b) side of the samples.
Solids 02 00025 g013
Publisher’s Note: MDPI stays neutral with regard to jurisdictional claims in published maps and institutional affiliations.

