Abstract
Partially substituted cerias are attractive materials for use as electrolytes in intermediate-temperature solid oxide fuel cells (SOFCs). Ceria doped with Sm or Gd has been found to have high ionic conductivities. However, there is interest in whether doping with multiple elements could lead to materials with higher ionic conductivities. The present study looks at the effects of co-doping Sr and Sm in ceria. A compositional series, Ce0.8+xSm0.2−2xSrxO2−δ (with x = 0–0.08), designed to have a constant oxygen vacancy concentration, was successfully prepared using the citrate–nitrate complexation method. A solubility limit of ~5 cation% Sr was found to impact material structure and conductivity. For phase-pure materials, with increasing Sr content, sinterability increased slightly and intrinsic conductivity decreased roughly linearly. The grain boundaries of phase-pure materials showed only a very small blocking effect, linked to the high-purity synthesis method employed, while at high %Sr, they became more blocking due to the presence of a SrCeO3 impurity. Grain capacitances were found to be 50–60 pF and grain boundary capacitances, 5–50 nF. The variation in the bulk capacitance with Sr content was small, and the variation in grain boundary capacitance could be explained by the variation in grain size. Slight deviations at high %Sr were attributed to the SrCeO3 impurity. In summary, in the absence of deleterious effects due to poor microstructure or impurities, such as Si, there is no improvement in conductivity on co-doping with Sr and Sm.
1. Introduction
Aliovalently doped ceria is an attractive material for use as electrolytes in intermediate-temperature solid oxide fuel cells (SOFCs). SOFCs offer the potential for higher efficiency energy production and, therefore, associated environmental and economic gains [1,2,3,4]. There is a desire to reduce the temperature at which SOFCs operate in order to reduce the difficulty, and therefore cost, of production and improve durability. A reduction in operating temperature to around 600 °C, or less, could achieve these benefits [5]. Common commercial SOFCs are based on yttria-stabilised zirconia (YSZ) electrolytes and typically operate at 800–1000 °C [6]. Ceria-based electrolytes have shown the necessary conductivity at lower temperatures and have been used to produce commercial SOFCs [7]. Oxygen vacancies are introduced into ceria electrolytes by doping with a lower valence species, typically trivalent lanthanide or divalent alkaline earth elements, and the conductivity of lanthanide-doped ceria is an order of magnitude higher than that of YSZ at 600 °C [8]. Ceria doped with Gd [9] or Sm [10] has been found to result in electrolytes with the highest ionic conductivities. However, there is interest in whether doping with multiple elements may be beneficial and whether it could lead to materials with higher ionic conductivities than the best singly doped materials. For example, recent studies on the multiple doping of multiple lanthanides gave promising results, especially for Sm and Gd [11,12]. The present study looks specifically at the effects of co-doping Sr and Sm in ceria.
The co-doping of ceria with Sr and other elements has been the subject of a number of studies [13,14,15,16,17,18,19,20,21,22,23,24,25,26]. Sr co-doping was initially studied by Lane et al. [13] and Kim et al. [14], who showed that it could mitigate the deleterious effects of Si impurities in Gd-doped ceria. Only a few cation% of Sr co-doping could nearly eliminate the effects of Si impurities. Lane et al. attributed the effect to the formation of a second, Si-rich, phase, which formed at grain boundary triple points leaving the rest of the grain boundary Si free [13]. Kim et al. suggested it was not certain that this was the mechanism, however [15]. These studies were also the first to find that Sr co-doping improved the sinterability of these materials. Sr co-doping was then studied with a specific focus on the effects on conductivity, and each of these studies found an increase in total conductivity for one or more Sr-co-doped samples compared to the singly doped samples [13,14,15,16,17,18,19,20,22,23,25]. However, only one Sr-co-doped material is reported that has a conductivity higher than that of the best singly doped materials [25]. The total conductivities of the most conductive samples in other studies at 600 °C include 0.008 S cm−1 (Ce0.8(Sm0.7Sr0.3)0.2)O2−δ) [22], 0.007 S cm−1 (Ce0.78Sm0.2Sr0.02O1.88) [14], 0.013 S cm−1 (Ce0.79Gd0.2Sr0.01O1.9−δ) [19] and 0.027 S cm−1 (Ce0.82Sm0.16Sr0.02O1.90) [25]. The conductivity of Ce0.82Sm0.16Sr0.02O1.90, reported by Jaiswal et al. [25], is significantly higher than that reported for any other aliovalently doped ceria materials, so further work should be performed to verify such a large effect. The main observation when comparing the conductivity of different Sr-co-doped materials is that there are large variations in the trends and absolute values of the conductivities between studies. This is thought to be mainly due to differences in Si impurities and microstructure between studies. In most cases, the increases in the total conductivity of Sr-doped samples was due to an increase in just the grain boundary conductivity. The intrinsic bulk conductivity was found to increase significantly with Sr co-doping in only one study [26], two showed very slight increases [20,23], and the rest showed either unchanged or decreased bulk conductivity [6,8,9,12,15] or did not report values [14,17]. There is a widely held view that the improvements in grain boundary conductivity with Sr co-doping are due to the scavenging of Si impurities and improved sinterability. In addition, explanations for the changes in total conductivity based on intrinsic properties have been proposed by Yeh et al., who state that Sr co-doping increases the radius of oxygen vacancies and so widens the oxygen-conducting channels [14], and Gao et al. [23], who cite increased oxygen vacancy concentration and a suppression of vacancy ordering due to changes in configurational entropy, suggested by Yamamura et al. [22]. This ordering effect is also suggested by Jaiswal et al. [25].
This present study complements the recent work by the authors on Sr doping in the compositional series, Ce0.8−xSm0.2SrxO2−δ (x = 0–0.04) [27], and aims to further clarify the role of Sr co-doping on conductivity by ascertaining its precise underlying effects, in particular, focusing on the effects of Sr co-doping on intrinsic (i.e., bulk or internal) conductivity. In order to study the effects of changing cation composition alone, the compositional series—Ce0.8+xSm0.2−2xSrxO2−δ (with x = 0–0.08)—was designed to allow Sr and Sm to be varied while maintaining a constant oxygen vacancy concentration. By performing a systematic study on a self-consistent compositional series and by removing the oxygen vacancy concentration as a variable, this study allows more definite interpretations to be drawn from the data than in pre-existing studies. All but three [16,19,20] previous studies used a compositional series where the oxygen vacancy concentration varied with Sr content. Conductivity is strongly determined by the oxygen vacancy concentration; therefore, it is difficult to quantify the underlying effects of Sr from such a series. In addition, in this work, the compositional series was based on 20% Sm-doped ceria, which is known to have among the highest conductivities of ceria electrolytes [28]. The extrinsic effects of microstructure were quantified by grain size analysis and minimised by the use of a citrate complexation synthesis method developed by the authors, which consistently produces fine, high-purity powders.
2. Experimental Section
Mixed oxide powders of Ce0.8+xSm0.2−2xSrxO2−δ with x = 0 (Sr0.00), 0.0025 (Sr0.25), 0.005 (Sr0.50), 0.0075 (Sr0.75), 0.01 (Sr1.00), 0.02 (Sr2.00), 0.04 (Sr4.00), 0.06 (Sr6.00) and 0.08 (Sr8.00) were synthesised by a citrate–nitrate complexation method described previously [11,12,27]. Sm(NO3)3•6H2O (Acros Organics, 99.9%), Ce(NO3)3•6H2O (Acros Organics, Geel, Belgium, 99.5%) and Sr(NO3)2 (Alfa Aesar, Heysham, United Kingdom, 99.97%) were dissolved separately in distilled water to form 0.1M solutions in the volumes required to obtain the correct stoichiometry in the final product and stirred for 3 h before being combined and stirred for a further 3 h. An aqueous 0.2 M solution of citric acid (Alfa Aesar, 99.5%) was added to the metal nitrate solution at a molar ratio of citric acid to total metal ions of 2:1. After stirring for 12 h, this mixture was heated to 80 °C in a metal bead bath on a hotplate. After around 24 h, a dry yellow foam formed, which was calcined at 250 °C for 2 h in a muffle furnace and then at 500 °C for 2 h with heating and cooling rates of 2.5 °C min−1 and 5 °C min−1, respectively, in both cases. The yellow powder obtained was milled at 400 rpm for 1 h in a planetary ball mill in a nylon grinding bowl with 10 mm zirconia grinding balls in a 1:10 powder-to-ball mass ratio.
X-ray Diffraction (XRD) patterns of the powder products and sintered pellets made from the powders were obtained using a PANalytical Empyrean diffractometer at 2Θ values from 10 to 100° in 0.017° steps over a 1 h period. A monochromated X-ray source emitting Kα1 radiation was used. Rietveld refinement of the patterns was performed using HighScore Plus software from PANalytical. The Scherrer equation was also used to estimate the average crystallite size from peak widths in the powder diffraction patterns [29].
Inductively coupled plasma mass spectrometry (ICP-MS) analysis was performed on samples of the powders using an Agilent 7500ce (Agilent Instruments, Santa Clara, CA, United States). In order to obtain the solutions for ICP-MS, 0.05 g of powder was added to 50 mL of 70% nitric acid solution and boiled under reflux for 12 h. The resulting solutions were diluted with 18 MΩ de-ionised water to achieve a final concentration of 500 µg dm−3. The concentrations of Ce, Sm, Sr and Gd were all assessed fully quantitatively with the use of calibrated standards. A full, less accurate scan was performed of all elements to check for other impurities.
Dilatometry was performed using a Netzsch 402 C dilatometer. Samples for dilatometry were prepared by pressing 1 g of powder in a cylindrical 10 mm diameter stainless steel die under a pressure of 200 MPa. Sample thickness was recorded as the samples were heated to 1350 °C at 2 °C min−1, maintained at that temperature for 4 h and cooled to room temperature at 4 °C min−1. An atmosphere of air flowing at 50 mL min−1 was used.
Dense ceramic pellets for SEM studies and electrical measurements were prepared by pressing and sintering the powders. For SEM, 0.3 g of powder was pressed in a 10 mm diameter cylindrical stainless steel die under 200 MPa, and for electrical measurements, 3.5 g of powder was pressed in a 25 mm stainless steel die under the same pressure. The resulting ‘green’ pellets were sintered in an open-tube furnace at 1350 °C with ramp rates of 2 °C min−1 up and 4 °C min−1 down. The samples were sintered on alumina tiles, with a small amount of loose powder between the sample and the tile to minimise inter-diffusion between the pellet and the tile during sintering. The samples were then polished using wet silicon carbide paper followed by cloth discs with diamond paste. The final polish was with 3 µm diamond paste, which resulted in a mirror-like finish.
To study the grain structure in SEM, the polished samples were thermally etched for 1 min at 1300 °C with ramp rates of 2 °C min−1 up and 4 °C min−1 down using an identical setup to the initial sintering. The samples were sputter coated with gold, and SEM images were obtained using a JEOL JSM-6700F SEM instrument with a field emission gun. ImageJ software was used to perform the grain size analyses.
For electrical measurements, circular platinum electrodes of 12 mm diameter were applied to both sides of the polished pellets by screen-printing platinum ink (Engelhardt) and then firing at 1000 °C for 1 h. Electrical measurements were performed by mounting the samples in an alumina rig, inside a vertical tube furnace, arranged such that two platinum wires contact the surface of each electrode allowing four-point sensing to be carried out, thus eliminating the resistances of the wires from the measured values. A thermocouple was located at both faces of the sample pellet to accurately determine temperature. The rig was made gas tight, and a 50 mL min−1 flow of dry synthetic air was maintained at all times. Impedance spectra were obtained at temperatures from 150 to 900 °C at 50 °C intervals using a Solartron 1260 frequency analyser. The amplitude of the applied AC voltage depended on the sample and the measurement temperature and was in the range 100–500 mV. The frequency was swept from 10 MHz to 0.1 Hz. The spectra were fitted using the ZView software from Scribner Associates, and values for the total, bulk and grain boundary conductivities were calculated from the spectra.
The densities of the sintered pellets were determined by measuring the dimensions and mass of the impedance samples after sintering but prior to grinding and polishing.
3. Results and Discussion
3.1. Composition
The powder synthesis resulted in fine, light yellow-coloured powders. The relative concentrations of Ce, Sm, Sr and Gd, taking account of the total concentration of minor lanthanide impurities, obtained by ICP-MS are shown in Table 1. These results show the concentrations of Sm and Sr to be within the nominal values. The Ce concentrations given, however, are lower than expected by around 0.5 cation% in every sample. Gd appears to be by far the largest impurity element, and the concentration is approximately equal to the reduction in Ce concentration below the target value in each sample. This indicates that Gd is introduced as an impurity in the cerium nitrate hexahydrate. A number of minor lanthanide elements were detected in the scan of all elements. The total concentration of the minor lanthanide elements is about one-fifth that of Gd, and the concentrations of the individual elements are lower still. These small excesses seen for Gd in particular have previously been attributed to the remaining 0.5% of the 99.5% pure cerium nitrate hexahydrate consisting primarily of a gadolinium compound [11]. However, in a later study [12], the lanthanide impurities indicated by ICP-MS were not found using a wavelength dispersive spectroscopy (WDS) microprobe, and the target sample compositions were confirmed. The WDS results indicate that the discrepancies seen in ICP-MS are largely due to small software errors in calculating peak areas because of some overlap of the peaks of the analytically similar lanthanides and not to the presence of significant impurities in the starting materials, and we believe this to be the case in the present study also.

Table 1.
Concentrations of selected elements in powders of Ce0.8+xSm0.2−2xSrxO1.9−δ as determined by ICP-MS analysis.
3.2. Microstructure and Phase Analysis
Figure 1 shows the powder diffraction patterns for all samples investigated. All the patterns were determined to be consistent with the cubic fluorite structure. The lattice parameters obtained from the Rietveld refinement of these patterns are plotted in Figure 2a. It is clear that there is not a linear variation in the lattice parameter across the full range of compositions. Single-phase, doped ceria electrolytes follow Vegard’s law, showing linear variations in the lattice parameter with variation in the average ionic radius of the constituent species. A non-linear variation in the lattice parameter usually indicates the formation of a second phase [30,31]. This therefore implies that more than one phase is present in at least some of the materials. This, however, contradicts the results of the Rietveld refinements, which showed that the powder XRD results could be fitted to a single phase.
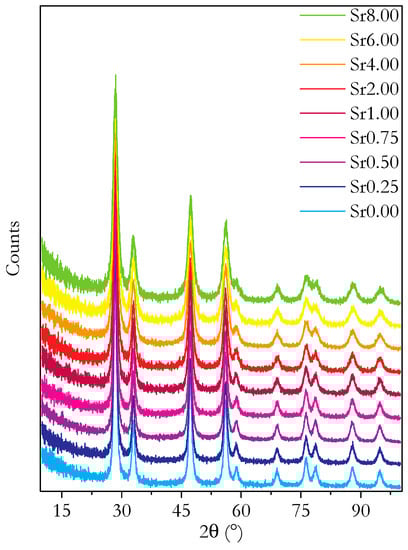
Figure 1.
Plots of powder XRD diffraction patterns for all synthesised compositions of Ce0.8+xSm0.2−2xSrxO1.9−δ. Plots are shifted on the y-axis for clarity.
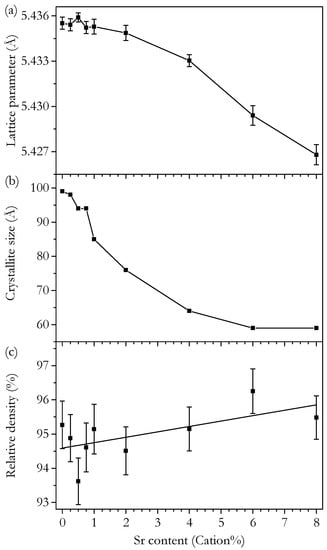
Figure 2.
Plots of variation with Sr content of (a) lattice parameter of Ce0.8+xSm0.2−2xSrxO1.9−δ calculated by Rietveld refinement of powder XRD results, (b) crystallite size calculated from peak broadening in powder XRD using the Scherrer equation and (c) density of impedance spectroscopy pellets sintered at 1350 °C relative to the theoretical density calculated from the lattice parameter.
Direct evidence for a second phase is found in the XRD results from the sintered impedance pellets. Figure 3 presents these. The inset plot shows some of the peaks that are only present in Sr6.00 and Sr8.00 and cannot be fitted to the structure. The reason why this phase is not observed in the powder XRD results, despite the non-linearity of the lattice parameter providing evidence for it, is thought to be that the broad powder peaks provide too little intensity. The extra peaks in the Sr6.00 and Sr8.00 samples can be fully indexed to the perovskite Pnma space group corresponding to SrCeO3. A Rietveld refinement containing both phases gives SrCeO3 concentrations of 1.0 and 3.6 mol% in Sr6.00 and Sr8.00, respectively. The formation of SrCeO3 results in a depletion of Ce and Sr in the main fluorite phase compared to the nominal composition. Assuming that the SrCeO3 phase is stoichiometric, the resultant composition of the main, fluorite phase can be simply calculated. This calculation gives a composition of Ce0.87Sm0.08Sr0.05O1.91−δ for Sr6.00 and Ce0.91Sm0.04Sr0.05O1.93−δ for Sr8.00. This implies a solubility limit for Sr of 5 cation% in the present materials.
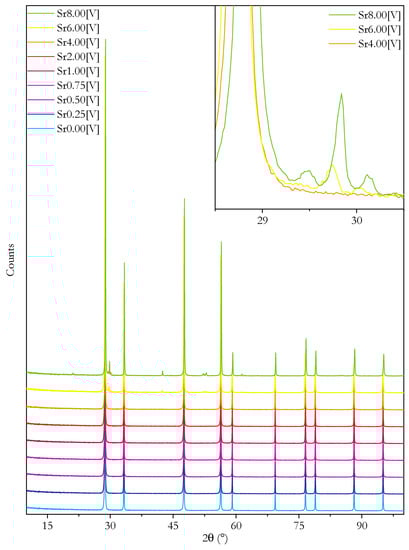
Figure 3.
Plots of XRD diffraction patterns from the surface of dense pellets of Ce0.8+xSm0.2−2xSrxO1.9−δ as prepared for impedance spectroscopy. Inset shows the region of the main peaks of SrCeO3 for selected samples. Plots in main plot are shifted on the y-axis for clarity.
Another factor to consider here is the effect of co-doping. In studies on Sr co-doped ceria electrolytes, single-phase materials with compositions of Ce0.7Sm0.2Sr0.1O1.8−δ [14], Ce0.7Gd0.2Sr0.1O1.8−δ [17] and Ce0.75Sm0.15Sr0.1O1.825−δ [18] have been successfully made, suggesting there may be a modest improvement in the solubility of Sr in ceria when co-doped with Gd or Sm. It is possible that this is due to the expansion of the lattice that doping with Sm or Gd causes. Kim [32] found that the main factor determining the solubility of a dopant in ceria is the difference between the ionic radius of the dopant and the critical dopant cation radius, rc. rc is the dopant cation radius for which the lattice parameter does not vary with doping. Gd- or Sm-doped ceria could be considered as having an rc closer than that of pure ceria to the ionic radius of Sr. In the results presented in this study, it does not appear that this effect occurs, as the solubility of Sr is at the lowest end of the values reported in the literature. This could be due to the low concentrations of Sm in samples approaching the solubility limit. Whilst the results in this work give a value for the expected Sr solubility in materials synthesised by this exact method, the range of values found in the literature suggests that they may not be comparable to those synthesised by other methods.
Considering only the single-phase samples for now, the variation in the lattice parameter with Sr content shows a linear decrease with increasing Sr content, as illustrated in Figure 3 This decreasing trend in the lattice parameter is the opposite of what might be expected based on a simple analysis of the ionic radii. The lattice parameter may be expected to vary depending on the radii of the cations since the concentrations of the anion species (oxygen ions and vacancies) are constant. The average cation radius, weighted for mole fractions, linearly increases from 0.992 Å for Ce0.8Sm0.2O1.9−δ to 0.999 Å for Ce0.9Sr0.1O1.9−δ. The discrepancy between the decreasing lattice parameter and the increasing average cation radius can be explained by a difference in the ionic radius of vacancies associated with divalent and trivalent dopants. ‘Divalent’ vacancies are predicted to have a smaller ionic radius than that of ‘trivalent’ vacancies, and in the present compositional series, the effect of the decrease in the average vacancy ionic radius is larger than that of the increased cation ionic radius. This can be confirmed using the theoretical model proposed by Hong and Virkar [33], which is very effective for the calculation of theoretical lattice parameters in rare-earth-doped ceria. The starting point is the definition of the lattice parameter, a, of an ideal fluorite structure in terms of cation and anion ionic radii, rcation and ranion, respectively,
The specific species present in our materials are CeCe, SmCe, SrCe, Oo and Vo. According to Equation (1), the lattice parameter is determined by the ionic radii of these species, denoted as rCe, rSm, rSr, rO and rVO, respectively. In order to use this information to calculate the theoretical lattice parameter, the following two assumptions must be made: Firstly, the vacancy radius is assumed to be constant with respect to the dopant concentration and cation radius. Secondly, the effective radius of the cation and anion is determined by the weighted average of the ionic radii of the relevant species according to their respective fraction. In the case of the present system, Ce0.8+xSm0.2−2xSrxO1.9−δ, the following two relationships for the average ionic radii can be defined:
Substituting Equations (2) and (3) in Equation (1), the theoretical lattice parameter in terms of Sr concentration can be defined,
According to Shannon [34], taking account of the charge and coordination of the species, rCe = 0.970 Å, rSm = 1.079 Å, rSr = 1.260 Å and rO = 1.38 Å. The treatment of rVO is addressed below. Using these known ionic radii, the calculated lattice parameter of pure, vacancy-free, CeO2 obtained from Equation (4) can be checked against the known lattice parameter. The theoretical lattice parameter of CeO2 is calculated to be 5.4271 Å. The high-quality diffraction data by Kümmerle and Heger give a value of 5.4112 Å [35]. Therefore, a correction factor equal to 5.4112/5.4271 = 0.9971 is added to Equation (4), resulting in Equation (5),
Finally, rVO must be calculated. As discussed, the resulting rVO is different for trivalent and divalent dopants, so we define rVO(trivalent) and rVO(divlaent). These can be treated in a similar way to the other species, splitting rVO into two components according to their respective fractions,
As the theory is based on a hard-sphere model, the vacancy radii are determined by the space left once the radii of the other species are all accounted for. Equation (6) can be applied to the Sr0.00 sample, which has a = 5.435 Å in order to calculate rVO(trivalent), and Ce0.9Sr0.1O1.9−δ, which has a = 5.429 Å [36] to calculate rVO(dvialent). rVO(trivalent) and rVO(dvialent) are calculated as 1.149 Å and 0.951 Å, respectively. The theoretical lattice parameter can now be calculated and is plotted in Figure 4. The calculated lattice parameter is coincident with the measured values for the single-phase region from 0 to 4 cation% but not with the two phase samples, Sr6.00 and Sr8.00. As previously discussed, this deviation of the lattice parameter of the two samples with the highest Sr content is due to the presence of a second phase, which depletes the main phase of Ce and Sr giving assumed values of Ce0.87Sm0.08Sr0.05 for Sr6.00 and Ce0.91Sm0.04Sr0.05 for Sr8.00. Using the theoretical model for the lattice parameter, the expected lattice parameter of these compositions can be calculated. This modified lattice parameter calculation is plotted in Figure 4. It shows a reasonably good match with the measured lattice parameter, confirming the predicted change in the composition, and that it is the cause of the deviation from linearity.
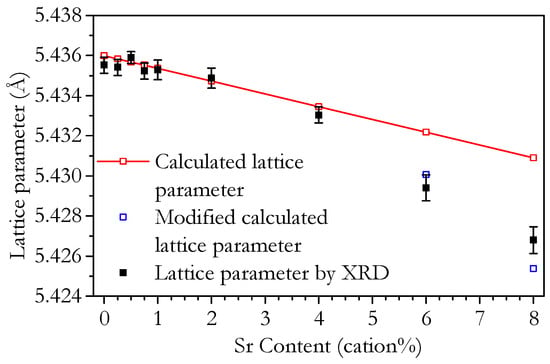
Figure 4.
Plot of the lattice parameter of Ce0.8+xSm0.2−2xSrxO1.9−δ powder as determined by XRD. Additionally shown are a plot of the theoretical variation of lattice parameter calculated here according to the method of Hong and Virkar [33] and a modified calculation accounting for the effect of the SrCeO3 impurity.
The XRD results clearly show that, in these materials, the solubility limit of Sr is probably 5 cation% and that of Sm is at least 20 cation%. The solubility limit of Sr is less clear, however, as a range of values are found in the literature. The results from a number of studies on purely Sr-doped ceria electrolytes report a limit on solubility in the range 8–10 mol% [37,38,39,40,41]. However, in the work by Cho et al. [39], it was observed that the solubility limit dropped from 9 to 3 mol% Sr when the samples initially sintered at 1600 °C for 4 h were subsequently heat treated at 1300 °C for 4 h. Looking at specific studies of SrO-CeO2 phase equilibria, which are more rigorous, Longo et al. [42] found that in quenched samples sintered for between 1700 °C for 8 h and 900 °C for 2500 h, the solubility limit of SrO in CeO2 decreased with the temperature to a stable value around 6 mol%, whilst Chavan and Tyagi [43] found a solubility limit of 9% for samples sintered at 1400 °C for 36 h with 1 °C min−1 ramp rates. The results of Cho et al. [32] and the differing results of Longo et al. [42] and Chavan and Tyagi [43] highlight the significant effect that processing has on the solubility levels attained in a given material. The Sr solubility limit found in the present materials is in best agreement with that recorded by Longo et al., who used a much more energetic heating regime than the other work. This implies that this value should be closest to the true equilibrium value for the solubility limit. Of course, the heat treatment of the present materials was comparatively mild. However, there is another reason to believe that the materials may have reached this equilibrium value. The synthesis method used in the present work produces very small crystallites, at some points in the process in the order of only tens of atoms across [9], which means the diffusion distances to the surface of the crystallites are also small. The resulting highly specific surface area also aids diffusion, and the nitrate–citrate method is expected to produce material with close-to-homogeneous elemental distributions. Therefore, it is likely that these materials reached their equilibrium states even under the relatively mild firing conditions employed.
The crystallite size was calculated from the powder XRD results using the Scherrer equation. The crystallite size is plotted against strontium content in Figure 2b. The crystallite size is of the order of magnitude that would be expected for doped ceria materials synthesised by the citrate–nitrate process [10,37]. There is a clear trend in crystallite size with increasing Sr content, initially decreasing almost linearly then levelling off at a diameter of around 6 nm. The linear region is coincident with the phase-pure samples (0–4 cation% Sr), whilst the flatter region coincides with the two bi-phasic samples (6 and 8 cation% Sr). It would be expected that the bi-phasic samples may deviate from any overall trend, as the bulk is not truly of the nominal composition and a second phase is present. A simple explanation for the observed crystallite size in Sr6.00 and Sr8.00 is that the crystallite size is roughly equal to that which would be expected for a sample with 5 cation% Sr, if the linear trend was continued, which is equal to the Sr content of the main phase in these samples, according to XRD analysis. It should also be considered that the presence of the second phase may have some effect on crystallite growth, as it will be located at the surface of the crystallites where the growth occurs. Looking at the underlying trend of decreasing crystallite size with increasing Sr content, work by Anjaneya et al. [44] found a trend in the crystallite size of doped ceria with the cation ionic radius in materials synthesised by a citrate method, which peaked for Sm and decreased as the ionic radius increased or decreased relative to that of Sm. This is in agreement with the results in the present work and so could explain the decrease in crystallite size. However, a mechanism for this effect is not proposed.
The relative densities plotted in Figure 2c are a good measure of sinterability. The relative densities show that the sinterability of the materials with higher strontium concentrations is better; however, the increase is modest considering the large change in composition. The linear nature of the relationship suggests that the sinterability is simply an average running between the purely Sm-doped and purely Sr-doped materials. It does not appear that there is any complex synergistic effect on sinterability as would be caused by a sintering aid. The dilatometry results are shown in Figure 5 and Figure 6, which give further insight into the sintering process. The total linear shrinkage increases with increasing Sr content, which is in agreement with the relative density results. The low rate of shrinkage at the start of sintering corresponds to the initial stage, where the growth of interparticle necks dominates. The region of the higher shrinkage rate corresponds to the intermediate sintering stage where densification occurs by the shrinkage of the network of interconnected pores. Finally, once the relative density reaches around 0.9, the porosity becomes closed, and the rate of densification greatly slows. The size change due to thermal contraction can be seen during the cooling step. The early-stage sintering and the initial onset of significant shrinkage, occurring at around 550 °C, are similar for all samples. All samples also tend to a similar negligible rate of shrinkage during the isothermal period, though the Sr0.00 sample takes slightly longer to reach this state than the Sr-doped samples. The main differences between the samples are the two peaks in the shrinkage rate at around 700 and 1000 °C, seen in Figure 6. The first peak is present in all samples; however, the second only appears for samples with 2 cation% Sr and above. The second peak exhibits a distinct change in shape for samples with 6 cation% Sr and above. A close inspection shows this change in shape is caused by a third, sharper peak, which is partly coincident with the second peak. This sharp peak is only present in Sr6.00 and Sr8.00, so it is likely linked to be the presence of SrCeO3 in these samples.
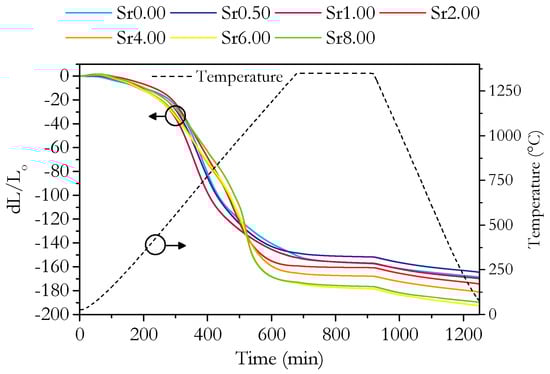
Figure 5.
Plot of change in length, d(L/Lo), during dilatometry against time for all measured samples. Temperature is indicated by the dashed line.
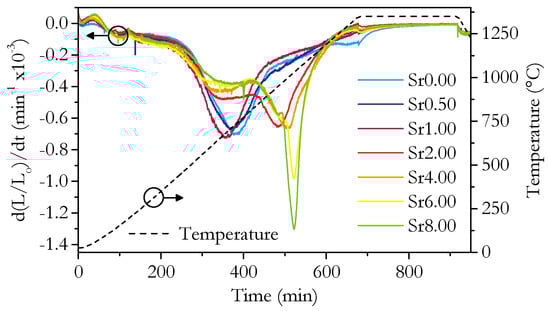
Figure 6.
Plot of shrinkage rates, d(L/Lo)/dt, during dilatometry against time for all measured samples. Temperature is indicated by the dashed line.
The materials studied consist of powders of similar morphology, so the difference in sinterability is determined mainly by the rate of diffusion of the constituent species. In aliovalently doped ceria, cation diffusion is considered to be the rate-limiting step due to the comparatively rapid diffusion of oxygen ions [45]. Given the linear variation of relative density with Sr content, it could be proposed that either all cation species have a certain diffusion rate, which combine to give the overall rate based on their relative concentrations, or that the cations somehow modify each other’s diffusion rates or a combination of both effects. It is reasonable to conclude that Sr has a higher diffusivity than that of Sm; however, it is difficult to confirm this with reference to the literature, as cation diffusion in ceria is still not fully studied or understood [46].
Figure 7 and Figure 8 show SEM images of polished and thermally etched samples and their corresponding histograms of grain size distributions, respectively, of samples made under the same conditions as the impedance samples. The histograms show a good fit to a log-normal distribution, which is indicative of ‘normal’ grain growth [47]. The trends in grain size can be visually confirmed by the SEM images; however, there is also a clear change in the morphology of the samples. As the Sr content increases to 4 cation% and higher, a change from grains with smooth, uniform surfaces to increasingly more rough grains is observed. The change in morphology is not due to the grain size, as Sr0.00 and Sr0.25 show similar grain areas but display smooth grains. The change coincides with the drop in measured grain area and is most likely due to the SrCeO3 phase. The variation of the average cross-sectional grain area with Sr content is shown in Figure 9. The grain area increases almost linearly with Sr content up to 2 cation% Sr, before decreasing rapidly as Sr content increases from 2 to 4 cation% and staying roughly level up to 8 cation%. The linear increase in grain size suggests the reason for the increase in grain size is likely to be the same as for the increased sinterability. It is likely that the lower grain area in the higher Sr samples is due to the presence of the SrCeO3 phase, though specific regions of SrCeO3 were not identified by SEM. This does contradict the XRD results, in which SrCeO3 was not detected in Sr4.00 and which implied a 5% solubility limit for Sr. However, as grain growth and morphology are largely determined by the grain boundary, which is only a few nm thick, it is possible that an undetectable fraction of SrCeO3 could be enough to cause the observed effects. The second phase would limit grain growth by pinning grain boundaries and so greatly reducing their mobility.
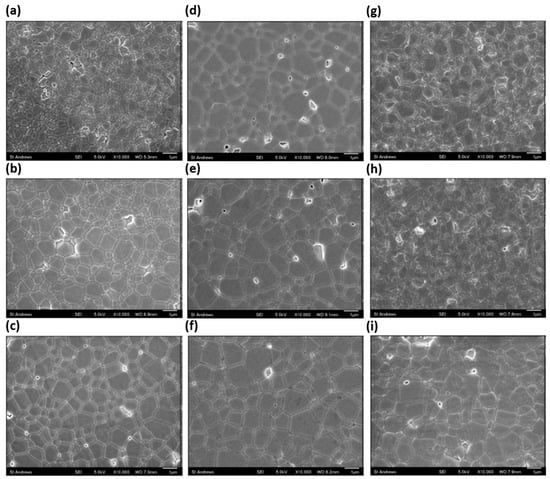
Figure 7.
SEM images of sintered and thermally etched samples of (a) Sr0.00, (b) Sr0.25, (c) Sr0.50, (d) Sr0.75, (e) Sr1.00, (f) Sr2.00, (g) Sr4.00, (h) Sr6.00 and (i) Sr8.00.
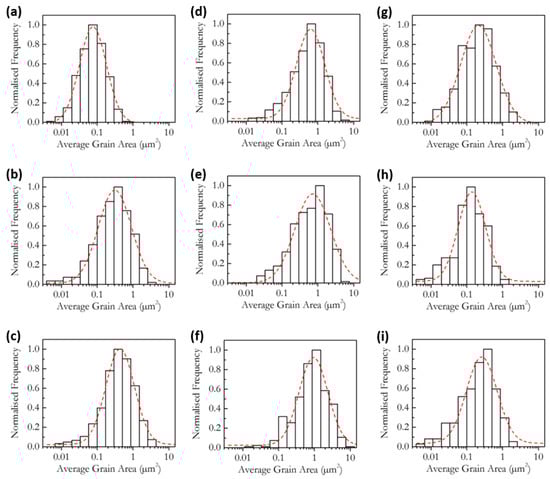
Figure 8.
Grain size distributions of sintered and thermally etched samples of (a) Sr0.00, (b) Sr0.25, (c) Sr0.50, (d) Sr0.75, (e) Sr1.00, (f) Sr2.00, (g) Sr4.00, (h) Sr6.00 and (i) Sr8.00.
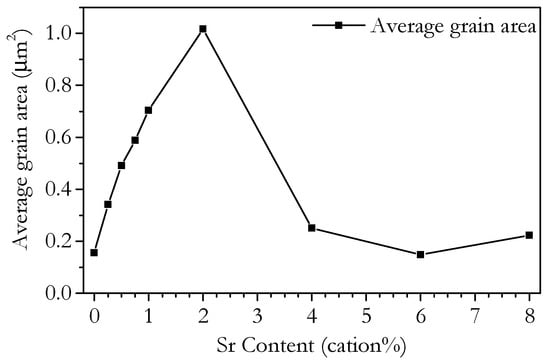
Figure 9.
Plot of average grain area of samples of Ce0.8+xSm0.2−2xSrxO1.9−δ sintered at 1350 °C for 4 h with ramp rates of 2 °C min−1 up and 4 °C min−1 down as determined by SEM imaging.
3.3. Conductivity
Figure 10 shows the impedance spectroscopy results at 250 °C in the form of Nyquist plots. The resistance values of the impedance at each frequency were normalised to remove the effect of variations in sample geometry and give resistivities, which allows meaningful visual comparisons to be made between samples. The markers indicate key frequencies for each sample, which allows the features of the spectra to be related to specific conduction processes. The shape of the spectra are typical for temperatures from 150 to 400 °C, and the regions of the spectra relating to the bulk and grain boundary processes can be resolved. The initial highest frequency arc is related to the bulk resistivity, whilst the subsequent region, which varies from a short flat section to a broad arc depending on the sample, is related to the grain boundary resistivity. As the temperature increases, the characteristic frequency of the different processes increases, such that the bulk and grain boundary features move to frequencies beyond the measured range, and the electrode processes move to frequencies within the measured range. For the temperature range 450–900 °C, the intercept with Z″ = 0 was used to determine the total sample resistivity.
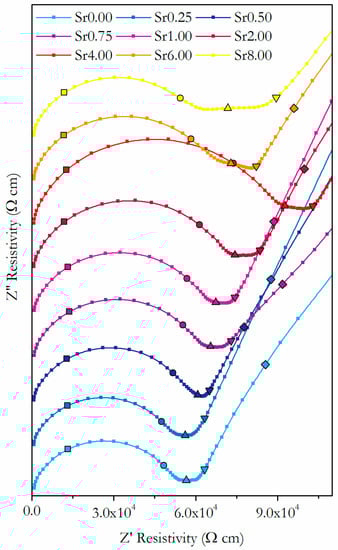
Figure 10.
Nyquist plots of resistivity results from impedance spectroscopy of Ce0.8+xSm0.2−2xSrxO1.9−δ at 250 °C. Frequencies are indicated by symbols, 1 MHz (■), 100 kHz (●), 10 kHz (▲), 1 kHz (▼), 100 Hz (♦), 10 Hz (◄) and 1 Hz (►).
The values for the total conductivity of the material, σt, and the bulk and grain boundary components, σb and σgb, respectively, are found by analysis of the impedance spectra. Doped ceria electrolytes are generally found to be purely oxygen ion conducting over the temperature range and atmosphere used in the present work [48]. It is therefore assumed that the observed conductivity is a measure of the oxygen ion conductivity of the sample. Figure 11 shows the isothermal plots of σt, σb and σgb at 250 °C and Figure 12 of σt at 500, 600 and 700 °C. These clearly show the trends in conductivity with Sr content. Similarly, it is useful to be able to compare the trends in conductivity with temperature between samples. As there is an exponential variation of conductivity with temperature, it is not possible to clearly see the difference in conductivity between samples at all temperatures on a simple plot of conductivity against temperature. To overcome this problem, values for the conductivity normalised against those of Sr0.00 at each temperature are plotted in Figure 13. This is simply the conductivity of the given sample divided by the conductivity of Sr0.00 at each temperature. The trends in conductivity with Sr content and temperature are discussed with reference to both the isothermal and normalised plots.
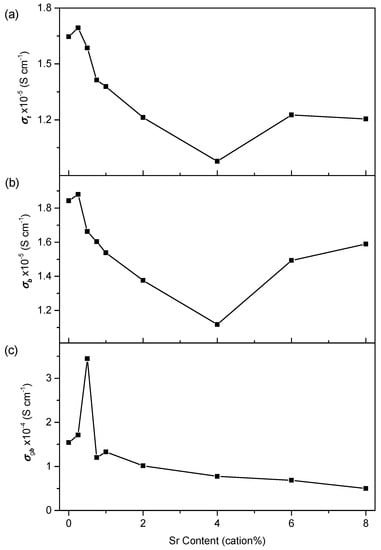
Figure 11.
Isothermal plots of the (a) total conductivity, (b) bulk conductivity and (c) grain boundary conductivity of Ce0.8+xSm0.2−2xSrxO1.9−δ against strontium content 250 °C.
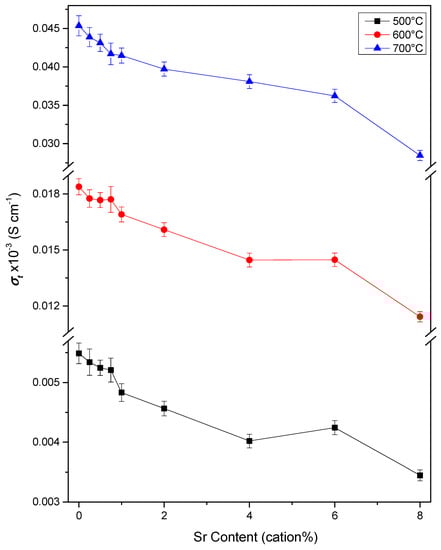
Figure 12.
Isothermal plots of the total conductivity of Ce0.8+xSm0.2−2xSrxO1.9−δ against strontium content at 500, 600 and 700 °C.
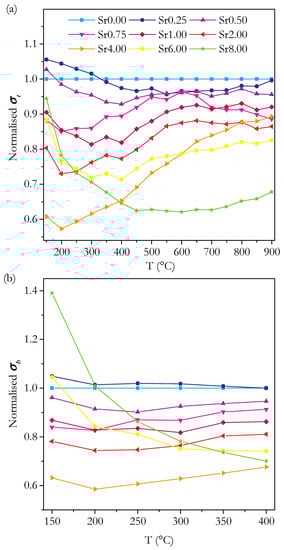
Figure 13.
Plots of the normalised total (a) and bulk (b) conductivity of Ce0.8+xSm0.2−2xSrxO1.9−δ against temperature.
The variation in conductivity with temperature can be described by an Arrhenius relationship,
where σ is the conductivity, T is the temperature, σo is a pre-exponential factor, Ea is the activation energy for conductivity, and kb is the Boltzmann constant. Rearranging the Arrhenius relationship shows ln(σT) should be linearly related to T−1,
Figure 14 shows plots of ln(σT) against T−1 for the total, bulk and grain boundary conductivities for selected samples. It is clear from Equation (9) that Ea can be calculated from the slope of an Arrhenius plot. For total conductivity, only the slope for values up to 500 °C was used. kb = 8.62 × 10⁻⁵ eV K−1 was used to calculate the values for Ea in electron volts. Figure 15 shows the variation of Ea with Sr content.
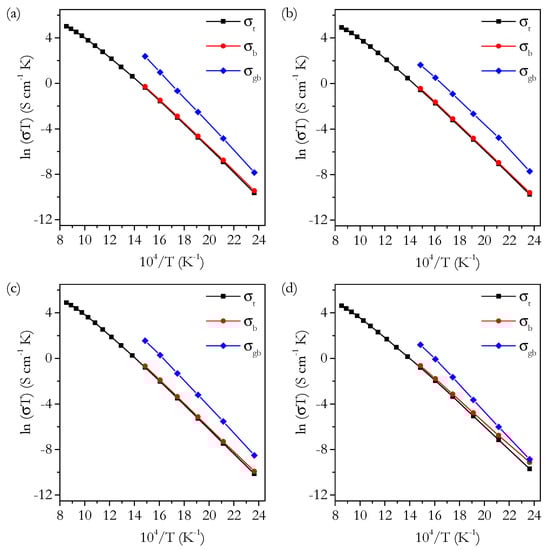
Figure 14.
Arrhenius plots of total, bulk and grain boundary conductivity for (a) Sr0.00, (b) Sr1.00, (c) Sr4.00 and (d) Sr8.00.
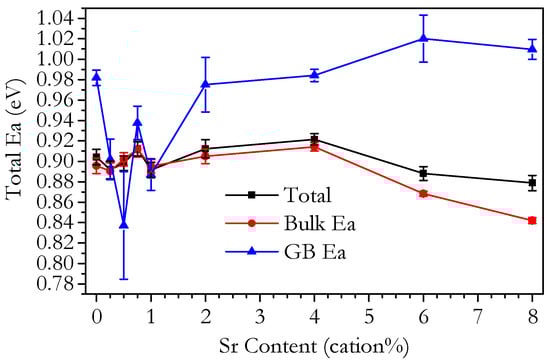
Figure 15.
Plot of total, bulk and grain boundary activation energy calculated for 200–350 °C of Ce0.8+xSm0.2−2xSrxO1.9−δ against strontium content.
As previously discussed, analysis showed the samples Sr6.00 and Sr8.00 to be bi-phasic and, as a result, not truly part of the nominal compositional series. Therefore, the conductivity of the samples in the single-phase range 0–4 cation% Sr is considered separately from that of Sr6.00 and Sr8.00. The conductivity of Sr6.00 and Sr8.00 is examined in the context of the trends in the phase-pure samples with regard to the additional effects of the presence of the SrCeO3 phase.
3.3.1. Conductivity of Phase-Pure Samples
As a widely produced and studied material, Ce0.8Sm0.2O1.9−δ is considered the standard sample against which the other materials in the study are compared. As can be seen in Figure 13a, the normalised conductivity of the different samples varies greatly with temperature. The temperature 600 °C is useful to compare samples, as it is a desirable temperature for the operation of intermediate-temperature solid oxide fuel cells [8]. At 600 °C, the total conductivity of the Ce0.8Sm0.2O2−δ sample in this study was found to be 0.0184 ± 0.0004 S cm−1. Ce0.8Sm0.2O1.9−δ synthesised by the same method, though sintered at 1400 °C, was found to have a conductivity of 0.0161 S cm−1 at 600 °C [10]. More generally, the conductivity is comparable to the highest conductivities reported for Ce0.8Sm0.2O1.9−δ of around 0.02 S cm−1 [49,50]. Therefore, the Ce0.8Sm0.2O1.9−δ sample in the present work can be considered to be a good standard against which the novel compositions can be compared.
Figure 12 shows the trends in total conductivity across the full range of compositions. At 600 °C, the conductivity decreases approximately linearly from 0 to 4 cation% Sr. This result clearly shows that in the case of this compositional series and synthesis method, doping with Sr does not lead to a higher conductivity in the temperature range necessary for use as SOFC electrolytes. In all other work on Sr co-doped ceria, at least one co-doped composition shows an increase in conductivity over the corresponding singly doped samples at temperatures around 600 °C [14,16,17,18,19,20,22,23,24,25]. The results of the present work show that despite the volume of evidence showing a positive effect on conductivity, it is not necessarily observed in all cases. A further analysis of the results in this work seeks to explain the various underlying effects that result in these seemingly contradictory effects on conductivity.
Considering first the general trends in total conductivity in the range 0–4 cation%, the isothermal plots in Figure 12 show that the total conductivity decreases with increasing Sr content at high temperatures. Figure 13 shows that this is the case for all temperatures above 300 °C. For 150–300 °C, there is a small increase in the total conductivity for Sr0.25 compared to Sr0.00, but over the full range to Sr4.00, the total conductivity still shows a general decrease. The relative size of this decrease in conductivity becomes smaller with increasing temperature, from a 39% decrease at 150 °C to an 11% decrease at 900 °C. This reduction in the size of the decrease is roughly linear, and this is reflected in the plot of normalised total conductivity in Figure 13a, which shows that the conductivity of Sr4.00 increases linearly relative to that of Sr0.00. All of the samples with the compositions intermediate between 0 and 4 cation% Sr show a broadly flat trend from 550 °C to 900 °C, preceded by a roughly linear increase for samples in the range 0.75–2 cation% Sr and a decrease for samples in the range 0.25–0.5 cation% Sr. These trends are different to those of the normalised total conductivity of Sr4.00, which increased across the whole temperature range. Having now described the main trends in the total conductivity, the constituent bulk and grain boundary components and the activation energy for conductivity are examined in order to explain them.
The relative contributions of the bulk and grain boundary to the total conductivity can be expressed in terms of the blocking factor, BF, which is the fraction of the total resistance due to the grain boundaries. We define it as the resistivity of the grain boundary divided by the resistivity of the bulk. The variation of BF with Sr content at 250 °C is plotted in Figure 16 and the variation with temperature in Figure 17. It should be noted that the error in the blocking factor increases greatly as its magnitude decreases due to the difficulty of accurately measuring the small grain boundary resistivities. Figure 17 shows that the blocking factor decreases with increasing temperature for all samples, as is normally observed, due to the higher activation energy of grain boundary conductivity compared to bulk conductivity. Figure 17 also shows that for 0–4 cation% Sr, the range of the blocking factor is small and decreases with increasing temperature. This convergence means that, as can be seen at 400 °C, the change in the blocking factor with Sr content is only slightly more than the margin of error, centred around a value of 0.1. The consistently low BF from 0 to 4 cation% Sr shows that doping with Sr is not an effective method for reducing the blocking effects of the grain boundaries in these materials and also that pure Ce0.8Sm0.2O1.9−δ can be made with very small blocking factors without the need for additional doping.
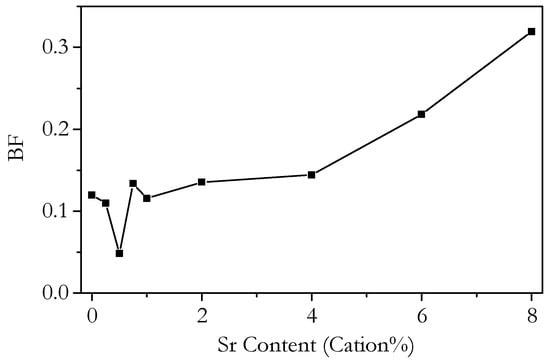
Figure 16.
Isothermal plot of the blocking factor (BF) of Ce0.8+xSm0.2−2xSrxO1.9−δ against strontium content at 250 °C.
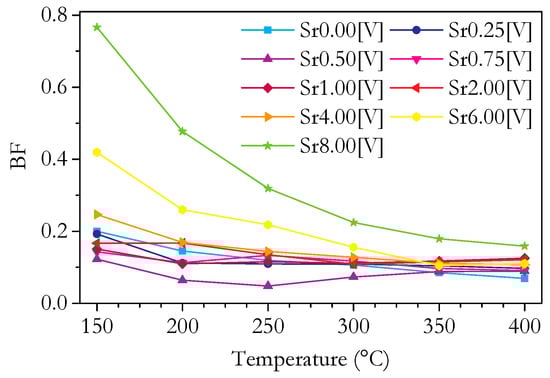
Figure 17.
Plot of blocking factor (BF) against temperature for Ce0.8+xSm0.2−2xSrxO1.9−δ.
In the isothermal plot of bulk conductivity, σb, at 250 °C, shown in Figure 11, the trends in σb are similar to those in the total conductivity due to the high grain boundary conductivities, with an overall decrease from 0 to 4 cation% Sr at all temperatures. The decrease is roughly linear at most temperatures. All samples except for Sr0.25 show a decrease in σb relative to Sr0.00 at temperatures from 150 to 400 °C (Figure 13). The prevalence of linear trends in the variation of σb suggests that the mechanism(s) responsible for the variation are the same across the whole range of 0–4 cation% Sr. The normalised bulk conductivity, plotted in Figure 13, shows the σb of all samples from 0.5 to 4 cation% Sr gradually increases with temperature relative to Sr0.00.
In the present work, σt can be considered to be a good approximation to σb at temperatures above 400 °C, where it cannot be measured directly, because of the generally high values of σgb. Therefore, the intrinsic conductivity above 400 °C can be examined by assuming approximate equivalence of σb with σt. Comparing the isothermal plot of σb for 250 °C in Figure 11 and σt for 500, 600 and 700 °C in Figure 12, it is clear that the trends, and the variation in the trends with temperature, are very similar as would be expected for the reasons stated. Therefore, it can be inferred that the variation in the intrinsic conductivity is approximately linear with Sr content across the whole temperature range for Sr content from 0 to 4 cation%.
As discussed in the Introduction, when considering the effect of co-doping on intrinsic conductivity, some studies cite a positive synergistic effect [51,52,53,54,55,56,57,58,59] as opposed to others that cite only an average effect [60]. The average effect means the resultant intrinsic conductivity of a co-doped material is treated as an average of the conductivity of the respective singly doped materials according to their respective molar fractions. The linear variation in bulk conductivity in the present work appears to be in agreement with an average effect. The theoretical argument for an average effect is that the local structure around each cation site is more important than the overall, longer range material properties.
At this point, it is useful to discuss the conductivity in terms of the activation energy, Ea. The bulk, intrinsic activation energy is plotted in Figure 15 and shows a roughly linear trend with a very small increase in Ea from 0 to 4 cation% Sr of around 0.01 eV. Whilst it may seem that this trend is not significant, it is supported by the plot of normalised bulk conductivity in Figure 13b, which shows that the bulk conductivity of Sr0.50 to Sr4.00 increases relative to Sr0.00 and, therefore, must have a higher Ea. The trend in the total Ea is similar to the bulk showing a similar-sized increase. These small variations in Ea actually have a significant effect on the variation of conductivity with temperature. The significant changes in normalised total conductivity with temperature, shown in Figure 13a, are caused by these small variations in Ea. Ea is proposed to be composed of two parts: a migration enthalpy, Em, and an association energy, Eass. The migration enthalpy is the energy barrier related to the process of oxygen ions moving through the lattice, and the association energy is the energy related to the association of vacancies with cation defects. Briefly, both Em and Eass are factors at low temperatures. However, at higher temperatures, the defect associations are fully dissociated, and only Em is a factor. This is apparent in the trends of the Arrhenius plots in Figure 14. The trends are linear, as expected, with a deviation above 500–600 °C. Considering Em and Eass is useful, as it clearly separates the two main factors determining the conductivity. It is possible to calculate Em and Eass by using the fact that, at high temperatures, Eass can be disregarded. In practice, the gradient is variable at high temperatures, so the calculation is not so simple. This means that the absolute value of Em depends on the chosen temperature range; however, the trends with composition have been found to be similar no matter what temperature is chosen. Bearing this in mind, Em and Eass were calculated for the range 750–900 °C. Em and Eass are plotted against Sr content in Figure 18. There is no clear trend in either Em or Eass for the phase-pure samples. Given the small size of the variation of total and bulk Ea, it may be that the constituent, smaller differences in Em and Eass are too small to accurately determine. Nevertheless, we can still conclude that there are no large changes in either Em or Eass from 0 to 4 cation%.
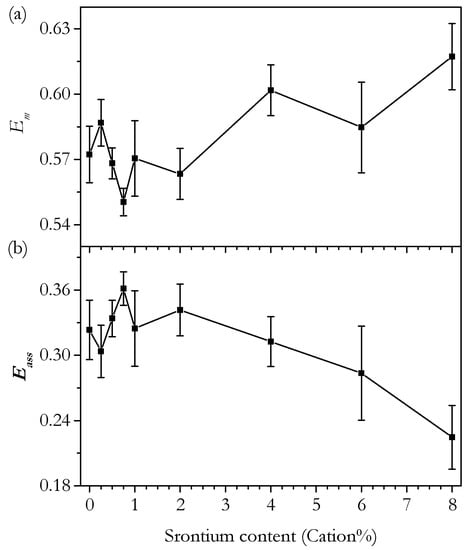
Figure 18.
Plot of the activation energy for (a) migration, Em, and (b) association, Eass, for oxygen ion conductivity in Ce0.8+xSm0.2−2xSrxO1.9−δ calculated from the 750–900 °C temperature range against strontium content.
Whilst the association energy and grain boundary blocking are important at low temperatures, for SOFC operating temperatures, the situation is simpler, with the conductivity of each composition determined mostly by the migration of oxygen ions through the lattice in these materials. Assuming that conductivity above 550–600 °C is mainly determined by the ease of lattice migration of oxygen ions, the reasons why Sm and Sr doping differ in this regard should be examined in order to explain the differences in higher temperature conductivity. For aliovalently doped ceria, the ionic radius of the dopant is widely found to be one of the most important factors in determining ionic conductivity, with ionic conductivity passing through a maximum value at the optimal value. This optimal value is linked to the theoretical value, rc, though in reality, it is not exactly equal to it [61]. As discussed earlier, in relation to the crystal structure, the value for rc is different for divalent and trivalent dopants. There is slight variation in the values calculated for rc in the literature [62]. Kim [32] is widely cited and gives values of 1.038 nm for trivalent doping and 0.1106 nm for divalent doping, and these values are used for the purpose of this discussion. The ionic radii of Sm and Sr are calculated by Shannon [34] as 1.079 Å for Sm and 1.260 Å for Sr. Clearly, Sr is far further from the ideal value than Sm. This is thought to be the main reason that the intrinsic conductivity of Sr-doped ceria is less than that of Sm-doped ceria. As the materials in this study seem to agree with the average rather than the synergistic co-doping effect, global conductivity is assumed to be determined by the local atomic structure. Therefore, overall conduction is determined by the oxygen ion migration through very localised areas of the atomic lattice with properties similar to either Sm- or Sr-doped ceria.
The grain boundary conductivity, σgb, is now considered. As for most of the previous discussion, we are concerned only with the phase-pure samples for now. The Nyquist plots in Figure 10 show that the grain boundary regions of the spectra are very small, relative to the bulk. This is not due to Sr doping, as the purely Sm-doped sample also shows this behaviour. Generally, the electrical properties of the grain boundary will be determined by its structure and composition. The synthesis method employed here is known to give rise to high-purity, low Si samples. The quality of the starting materials is an important factor here. The measurements of the samples of Gd-doped ceria with only 30 ppm of Si still do not show grain boundary conductivity as high as that observed in this work [60]. Due to the small physical size of the grain boundaries, the amount of an impurity that segregates to the grain boundary and that is needed to have a significant effect is very small. This means it is very difficult to detect such an impurity by bulk elemental analysis and ascertain the exact cause of the small grain boundary resistance. TEM analysis of sectioned sintered samples combined with high-resolution EDS may possibly be able to provide some answers. Nevertheless, it seems that reactant purity is important in determining the grain boundary resistance.
The trends in σgb with Sr content vary with temperature, and as the temperature increases, the errors become large. The absolute value of σgb is strongly related to the intrinsic bulk conductivity (since, for single-phase materials, composition at the grain boundary can be expected to change as bulk composition changes), so σgb relative to σb is an important value, which is described by the blocking factor. Figure 11c shows an isothermal plot of σgb at 250 °C. The errors are large due to the small size of Rgb; however, there are distinct trends. At lower temperatures, σgb increases with Sr content before decreasing. As the temperature increases to 400 °C, this changes to a decreasing trend from 0 to 1 cation% Sr and then σgb remains roughly constant as the Sr content increases up to 4 cation%. Figure 16 shows an isothermal plot of the blocking factor at 250 °C. Discounting the underlying bulk effects by examining the blocking factor, the trends observed for σgb become less pronounced. By 400 °C, the variation in the blocking factor is very small with a range of about 0.05 from 0 to 4 cation% Sr. Figure 17, showing the variation of BF with temperature, clearly shows the decrease in the range of the blocking factor with temperature. The small range of the blocking factor means the effect of Sr on the grain boundary conductivity is very small. This contradicts results in the literature showing improvements in grain boundary conductivity, which are discussed in detail in the Introduction. This is likely due to the low level of Si impurity and good microstructure leading to materials with a low grain boundary blocking effect, with few negative effects to be mitigated by the Sr doping.
Figure 15 shows that both the total and bulk activation energies are around 0.90 eV across the range from 0 to 4 cation% Sr, varying only slightly more than the margin of error. The total and bulk activation energies decrease for Sr6.00 and Sr8.00. The values for total and bulk activation energies are very similar, confirming that the total conductivity was determined mostly by the bulk. The grain boundary activation energy shows a decrease for samples in the range of 0.25–1 cation% Sr compared to all other compositions, from 0.98—for Sr0.00—to 0.84 eV, though the error in the activation energy is large for these samples. After the dip in activation energy, it increases back to 0.98 eV again and then increases with increasing Sr content. Interestingly, the values of the grain boundary activation energy for 0.25–1 cation% Sr are almost the same as those for the bulk activation energy.
As the Ea for total conductivity is related to the relative contributions of the bulk and grain boundaries to the total conductivity, the comparison of Ea with the literature is made in terms of the bulk and grain boundary activation energies. The overall range of the activation energy values found for all samples are all within the ranges observed for doped ceria electrolytes in the literature. Specifically, for Ce0.8Sm0.2O1.9−δ, the published bulk activation energies are in the range 0.89–0.94 eV [43,63,64,65,66]; the value of 0.90 eV found in this work is in good agreement with that range. The grain boundary activation energy is normally found to be higher than bulk, as in this work. The literature values for Ce0.8Sm0.2O1.9−δ are in the range 0.92–1.1 eV [43,64,66], which, as for the bulk activation energy, is in agreement with this work.
3.3.2. Conductivity of Bi-Phasic Sr6.00 and Sr8.00 Samples
As discussed previously, the two main differences in the bi-phasic samples compared to the single-phase samples are the presence of the SrCeO3 phase, assumed to be located at the grain boundaries, and the deviation of the composition of the main Ce-Sm-Sr oxide phase from the nominal values due to the depletion of Ce and Sr to the SrCeO3 phase. From the XRD results, the grain compositions of Sr6.00 and Sr8.00 were predicted to be Ce0.87Sm0.08Sr0.05O1.91−δ and Ce0.91Sm0.04Sr0.05O1.93−δ and the molar SrCeO3 contents 1.0 and 3.6 mol%, respectively.
It is not possible to know absolutely what the bulk conductivity of Sr6.00 and Sr8.00 would have been without the presence of the SrCeO3 phase. However, a reasonable assumption is that the linear trends in the phase-pure samples would have continued. These are taken as ‘expected’ values for the sake of comparison. It is considered whether the material differences in these samples caused by the SrCeO3 phase would be likely to cause the difference between the ‘expected’ and observed bulk conductivity values. At the low temperatures, the bulk conductivity of Sr6.00 and Sr8.00, shown in Figure 11b, deviates considerably from the approximately linear trend for the 0–4 cation% Sr samples. As the temperature increases, the conductivity of these samples decreases, relative to the phase-pure samples, becoming more in line with the overall trend. Above approximately 600 °C, the conductivity of Sr6.00 and Sr8.00, shown in Figure 12, becomes depressed compared to the other samples. The variation of the grain composition from the nominal values is expected to have an effect on the oxygen vacancy concentration, causing it to be lower than the constant value predicted for the phase-pure samples. Assuming fixed values for the valences of the cations, the fractional oxygen vacancy concentrations are predicted to be 0.09 and 0.07 for Sr6.00 and Sr8.00, respectively, compared to 0.10 for the phase-pure samples. At 150 °C, the values for the bulk conductivity of Sr6.00 and Sr8.00 are more than twice the expected values, and the trend is reversed, with the higher Sr content showing higher conductivity. This seems like a large difference, considering that the oxygen vacancy concentrations are only 10 and 30% lower than intended. However, the differences caused by variations in oxygen vacancy concentration have been found to be particularly large, especially at low temperatures. Kosinski and Baker [10] found that at 150 °C, the grain ionic conductivity of Ce0.9Sm0.1O1.95−δ was 10 times higher than that of Ce0.8Sm0.2O1.9−δ, and the grain ionic conductivity of Ce0.7Sm0.3O1.85−δ was 60 times lower than that of Ce0.8Sm0.2O1.9−δ. These samples correspond to molar oxygen vacancy concentrations of 0.05, 0.1 and 0.15, respectively. Whilst there are clearly differences other than oxygen vacancy concentration between the samples, the rough size of the differences is indicative of that which might be expected. Interpolating linearly between the bulk conductivity at 150 °C of Ce0.9Sm0.1O1.95−δ and Ce0.8Sm0.2O1.9−δ, from Kosinski and Baker [10], gives an increase in bulk conductivity of 1.7 and 5.0 times for an oxygen vacancy concentration of 0.09 and 0.07, respectively, compared to 0.10. This compares with the differences of 2.1 and 3.8 times for the bulk conductivity of Sr6.00 and Sr8.00 compared to the ‘expected’ values defined previously. Considering the approximations of the grain composition and the expected values and differences between the samples in the comparison work, this is a good fit. The results of Kosinski and Baker show that as temperature increases, the difference between the bulk conductivity of the samples decreases. This is because the negative effects of high vacancy concentrations are due to vacancy interactions, the effect of which decreases with increased temperature. The results of the present work reflect this, as the size of the relative increase in the bulk conductivity of Sr6.00 and Sr8.00 decreases as the temperature increases. At high temperatures, once the effect of vacancy interactions is negligible, the situation reverses, and the bulk conductivities of Sr6.00 and Sr8.00 are depressed due to the lower concentration of vacancies. The trend of bulk conductivity in Sr6.00 and Sr8.00 is also reversed, as Sr6.00 becomes more conductive than Sr8.00.
If the variation of the conductivity of bi-phasic samples is due to a lower degree of oxygen association, this implies that the measured association enthalpy should be lower for these samples. Figure 15 shows the bulk activation energy. Whilst the bulk activation energy of the phase-pure samples lies within a small range, the bi-phasic samples show significantly lower values, as would be expected. However, it should be noted that this value includes the migration enthalpy, so it cannot be ruled out that the change is due to a change in migration enthalpy and not in the association enthalpy. The trends in the grain boundary conductivity, shown in Figure 11b, do not show a clear difference for the bi-phasic samples, as is seen for the bulk conductivity. The blocking factor, shown in Figure 16, shows that the bi-phasic samples do have more blocking grain boundaries than the phase-pure samples. However, it is difficult to determine whether this is part of a more general overall trend that is not specifically due to the SrCeO3 phase. It does seem that if there is an enhanced blocking effect on grain boundaries for the bi-phasic samples, then it almost completely disappears as the temperature increases. Figure 17 shows that at 350 °C, the blocking factor of Sr6.00 is similar to that of the phase-pure Sr1.00, and the blocking factor of Sr8.00 is only slightly higher.
3.4. Capacitance
The values for the capacitance of the bulk and grain boundary were calculated from the fitting of the impedance spectra. Figure 19 shows the variation of the bulk and grain boundary capacitance with Sr content. The capacitance would be expected to be broadly invariant with temperature, which appears to be the case. The order of magnitude of the capacitance, pF for the bulk and nF for the grain boundary, is in agreement with the expected ranges [67]. Whilst the capacitance is not generally of direct importance to the properties of a ceria electrolyte, the capacitance values allow greater insight into the conduction process; in particular, deviations from expected behaviour can highlight differences between materials that are not otherwise apparent. The bulk capacitance shows little variation across the range of compositions. From 0 to 4 cation% Sr, the change for a given temperature is barely more than the size of the error. All values lie within the range of 50–60 pF. For 6 and 8 cation%, there is an increase in capacitance, which is possibly related to the presence of SrCeO3 in these samples. The fluorite and perovskite structures would be expected to have some difference in the capacitance related to bulk conduction and, therefore, slightly modify the overall measured capacitance. The grain boundary capacitance shows a much larger variation than the bulk with a range of around 20 nF. The grain boundary capacitance is known to be related to the number of grain boundaries in the material, which is inversely related to the grain size [68]. Assuming uniform grain boundaries, the grain boundary capacitance is linearly related to the average grain diameter. Figure 20 shows a plot of grain boundary capacitance at 250 °C against the average grain diameter with a linear line of best fit. The relationship is not perfectly linear; however, there is a positive correlation. This suggests that the variation in grain boundary capacitance is mostly due to variation in the grain size and, therefore, that the nature of the grain boundary is similar in different samples. The grain boundary capacitance of Sr6.00 and Sr8.00 (samples with low error in Figure 20) deviates significantly from the overall linear trend with grain size. This indicates that these boundaries are different to the other samples, likely reflecting the presence of SrCeO3 at the grain boundaries in these samples.
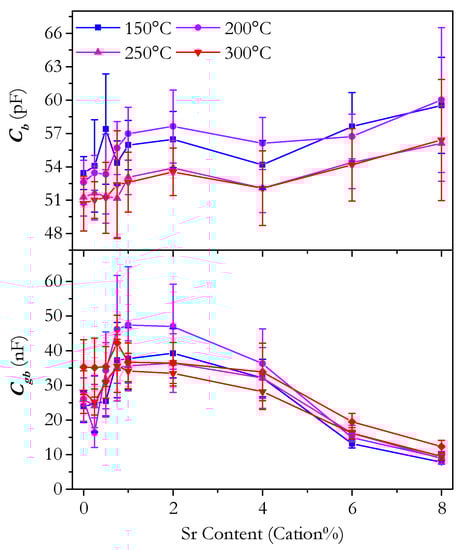
Figure 19.
Plot of the bulk capacitance, Cgb, and grain boundary capacitance, Cgb, against strontium content of Ce0.8+xSm0.2−2xSrxO1.9−δ.
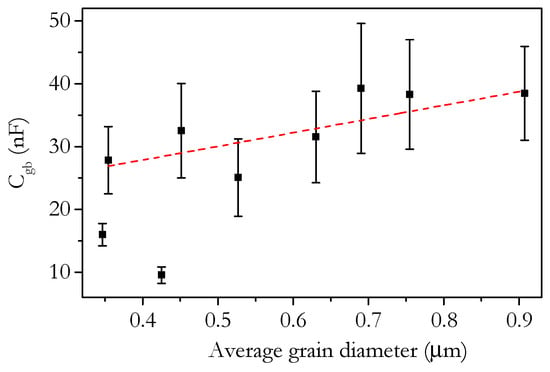
Figure 20.
Plot of the grain boundary capacitance at 250 °C against average grain diameter of Ce0.8+xSm0.2−2xSrxO1.9−δ. Red dashed line shows a linear fit of the samples from 0 to 4 cation% Sr.
The capacitance values are of further use, as they can be used to calculate the estimated grain boundary thickness. According to the brick layer model, the grain boundary thickness, δgb, is related to the capacitance as
where Cb is the bulk capacitance, Cgb is the grain boundary capacitance, and Dg is the average grain diameter [69]. The results of this calculation for capacitances measured at 250 °C are plotted in Figure 21 against Sr content. The grain boundary thickness fluctuates around 1 nm from 0 to 6 cation% Sr before increasing to 2.5 nm for 8 cation%. Pérez-Coll et al. found the grain boundary thickness of various Sm-doped ceria electrolyte materials to be around 1 nm, which is in agreement with this work. The apparent increase in δgb for Sr8.00 may not reflect the real grain boundary thickness, as this sample is likely to have SrCeO3 present at the grain boundaries, which could affect the grain boundary capacitance and, therefore, the estimated δgb without any actual increase in δgb.
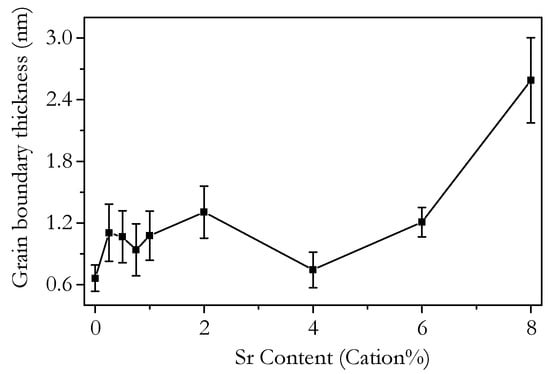
Figure 21.
Plot of the grain boundary thickness calculated from the bulk and grain boundary capacitances at 250 °C of Ce0.8+xSm0.2−2xSrxO1.9−δ against strontium content.
4. Conclusions
A compositional series of ceria-based powders co-doped with varying Sr and Sm concentrations but with a constant oxygen vacancy concentration was successfully prepared by the citrate–nitrate complexation method. A 0.5 cation% Gd impurity and various minor lanthanide impurities were identified by ICP-MS analysis. It was concluded that the impurities may have a small but constant effect on the samples. XRD analysis showed that compositions up to 4 cation% Sr were single phase with an Fm-3m crystal structure. The XRD results showed that samples Sr6.00 and Sr8.00 contained a second phase of SrCeO3. Rietveld refinement gave concentrations for SrCeO3 of 1.0 and 3.6 mol% in Sr6.00 and Sr8.00, respectively. This corresponded to a solubility limit of 5 cation% Sr. The crystallite size of the powders, as calculated using the Scherrer equation, was in the range 60–100 nm and was found to decrease with increasing Sr content.
Sintering at 1350 °C for 4 h produced dense ceramics. Relative density measurements and dilatometry showed that sinterability increased with increasing Sr content; however, the improvement was modest. This was thought to be due to the higher diffusivity of either Ce or Sr compared to Sm. A linear increase in the average cross-sectional grain area with Sr content up to 2 cation% is attributed to the same higher diffusivity that results in improved sinterability. A large drop in grain area for 4–8 cation% Sr was attributed to the pinning of grain boundaries by the SrCeO3 phase present in these samples.
For the phase-pure samples, the intrinsic conductivity decreased roughly linearly with increasing Sr content. This was thought to reflect the local structure being more important than global averages. The intrinsic conductivity of bi-phasic samples was found to follow a different trend to the phase-pure samples, and this was assigned as being mainly due to the different oxygen vacancy concentrations in these materials.
The grain boundaries showed only a very small blocking effect, which was attributed to the synthesis method employed and to the low levels of impurities in the starting nitrates. Variation in Sr content did not have much effect on the size of the grain boundary blocking effect in the phase-pure samples. This was thought to be due to the intrinsically low levels of Si impurities and good microstructure of the materials, which meant there were few negative effects to be mitigated. The grain boundaries of Sr6.00 and 8.00 were more blocking due to the presence of the SrCeO3.
Grain capacitances had values between 50 and 60 pF, and the grain boundary capacitances were between 5 and 50 nF. The variation in grain boundary capacitance could be explained by the variation in grain size. The slight deviations in the capacitances of Sr6.00 and Sr8.00 compared to the phase-pure samples were thought to be linked to the SrCeO3 impurity, particularly at the grain boundaries.
In summary, the results clearly show that in the absence of deleterious effects due to poor microstructure or impurities—such as Si—there is no improvement in conductivity found by co-doping Sr with Sm. The decrease in intrinsic conductivity reflects the view that co-doping does not usually lead to higher intrinsic conductivities.
Author Contributions
Conceptualization, R.T.B. and T.S.; methodology, R.T.B. and T.S.; formal analysis, T.S. and R.T.B.; investigation, T.S.; resources, R.T.B.; data curation, T.S.; writing—original draft preparation, T.S.; writing—review and editing, R.T.B. and T.S.; supervision, R.T.B.; project administration, R.T.B.; funding acquisition, R.T.B. All authors have read and agreed to the published version of the manuscript.
Funding
This research received no external funding.
Data Availability Statement
The dataset supporting this research is available at: http://www.st-andrews.ac.uk/profile/rtb5.
Acknowledgments
We thank the School of Chemistry, University of St Andrews, for a PhD studentship for TS. Electron microscopy was carried out at the Electron Microscopy Facility, University of St Andrews.
Conflicts of Interest
The authors declare no conflict of interest.
References
- Minh, N.M.; Takahashi, T. Science and Technology of Ceramic Fuel Cells, 1st ed.; Elsevier: New York, NY, USA, 1995; pp. 1–14. [Google Scholar]
- Sharifzadeh, M. (Ed.) Design and Operation of Solid Oxide Fuel Cells: The Systems Engineering Vision; Elsevier: New York, NY, USA, 2019. [Google Scholar]
- Fergus, J.W.; Hui, R.; Li, X.; Wilkinson, D.P.; Zhang, J. (Eds.) Solid Oxide Fuel Cells: Materials Properties and Performance; CRC Press: Boca Raton, FL, USA, 2019. [Google Scholar]
- Huang, K.; Goodenough, J.B. Solid Oxide Fuel Cell Technology: Principles, Performance and Operations; Elsevier: New York, NY, USA, 2009. [Google Scholar]
- Wachsman, E.D.; Lee, K.T. Lowering the Temperature of Solid Oxide Fuel Cells. Science 2011, 334, 935–939. [Google Scholar] [CrossRef]
- Jacobson, A.J. Materials for Solid Oxide Fuel Cells. Chem. Mater. 2010, 22, 660–674. [Google Scholar] [CrossRef]
- Leah, R.; Bone, A.; Lankin, M.; Selcuk, A.; Pierce, R.; Rees, L.; Corcoran, D.; Muhl, P.; Dehaney-Steven, Z.; Brackenbury, C.; et al. Low-Cost, Redox-Stable, Low-Temperature SOFC Developed by Ceres Power for Multiple Applications: Latest Development Update. ECS Trans. 2013, 57, 461–470. [Google Scholar] [CrossRef]
- Kilner, J.A.; Burriel, M. Materials for Intermediate-Temperature Solid-Oxide Fuel Cells. Annu. Rev. Mater. Res. 2014, 44, 365–393. [Google Scholar] [CrossRef]
- Fuentes, R.O.; Baker, R.T. Structural and Electrochemical Properties of Gd0.1Ce0.9O1.95 Solid Solution Prepared by a Citrate Complexation Method. J. Power Sources 2009, 184, 268. [Google Scholar] [CrossRef]
- Kosinski, M.R.; Baker, R.T. Preparation and Property-Performance Relationships in Samarium-Doped Ceria Nanopowders for SOFC Electrolytes. J. Power Sources 2011, 196, 2498. [Google Scholar] [CrossRef]
- Coles-Aldridge, A.V.; Baker, R.T. Ionic Conductivity in Multiply Substituted Ceria-based Electrolytes. Solid State Ion. 2018, 316, 9–19. [Google Scholar] [CrossRef]
- Coles-Aldridge, A.V.; Baker, R.T. Oxygen Ion conductivity in ceria-based electrolytes co-doped with samarium and gadolinium. Solid State Ion. 2020, 347, 115255. [Google Scholar] [CrossRef]
- Lane, J.; Neff, J.; Christie, G. Mitigation of the Deleterious Effect of Silicon Species on the Conductivity of Ceria Electrolytes. Solid State Ion. 2006, 177, 1911–1915. [Google Scholar] [CrossRef]
- Yeh, T.-H.; Chou, C.-C. Ionic Conductivity Investigation in Samarium and Strontium Co-doped Ceria System. Phys. Scr. 2007, T129, 303–307. [Google Scholar] [CrossRef]
- Kim, D.K.; Cho, P.S.; Lee, J.H.; Kim, D.Y. Mitigation of Highly Resistive Grain-boundary Phase in Gadolinia-doped Ceria by the Addition of SrO. Electrochem. Solid-State Lett. 2007, 10, 91–95. [Google Scholar] [CrossRef]
- Cioateră, N.; Pârvulescu, V.; Rolle, A.; Vannier, R.N. Effect of Strontium Addition on Europium-doped Ceria Properties. Solid State Ion. 2009, 180, 681–687. [Google Scholar] [CrossRef]
- Ramesh, S.; Reddy, C.V. Properties of Al2O3–Sm2O3–CeO2 Electrolyte. Acta Phys. Pol. A 2009, 115, 909–913. [Google Scholar] [CrossRef]
- Zheng, Y.; He, S.; Ge, L.; Zhou, M.; Chen, H.; Guo, L. Effect of Sr on Sm-doped Ceria Electrolyte. Int. J. Hydrogen Energy 2011, 36, 5128–5135. [Google Scholar] [CrossRef]
- Buchi Suresh, M.; Johnson, R. The Effect of Strontium Doping on Densification and Electrical Properties of Ce0.8Gd0.2O2−δ Electrolyte for IT-SOFC Application. Ionics (Kiel) 2011, 18, 291–297. [Google Scholar]
- Ramesh, S.; Raju, K.C.J.; Reddy, C.V. Synthesis and Characterization of Co-Doped Ceria Ceramics by Sol-Gel Method. Trans. Indian Ceram. Soc. 2011, 70, 143–147. [Google Scholar] [CrossRef]
- Siqueira, J.M., Jr.; Brum Malta, L.F.; Garrido, F.M.S.; Ogasawara, T.; Medeiros, M.E. Raman and Rietveld Structural Characterization of Sintered Alkaline Earth Doped Ceria. Mater. Chem. Phys. 2012, 135, 957–964. [Google Scholar] [CrossRef]
- Gao, Z.; Liu, X.; Bergman, B.; Zhao, Z. Enhanced Ionic Conductivity of Ce0.8Sm0.2O2-δ by Sr Addition. J. Power Sources 2012, 208, 225–231. [Google Scholar] [CrossRef]
- Horovistiz, A.L.; Muccillo, E.N.S. Microstructural and Electrical Characterizations of Chemically Prepared Ce0.8Gd0.2− x(Ag, Sr)xO1.9 (0 ≤ x ≤ 0.02). Solid State Ion. 2012, 225, 428–431. [Google Scholar] [CrossRef]
- Jaiswal, N.; Kumar, D.; Upadhyay, S.; Parkash, O. Effect of Mg and Sr Co-doping on the Electrical Properties of Ceria-based Electrolyte Materials for Intermediate Temperature Solid Oxide Fuel Cells. J. Alloys Compd. 2013, 577, 456–462. [Google Scholar] [CrossRef]
- Jaiswal, N.; Upadhyay, S.; Kumar, D.; Parkash, O. Sm3+ and Sr2+ Co-doped Ceria Prepared by Citrate–Nitrate Auto-combustion Method. Int. J. Hydrogen Energy 2014, 39, 543–551. [Google Scholar] [CrossRef]
- Kashyap, D.; Patro, P.K.; Lenka, R.K.; Mahata, T.; Sinha, P.K. Effects of Gd and Sr Co-doping in CeO2 for Electrolyte Application in Solid Oxide Fuel Cell (SOFC). Ceram. Int. 2014, 40, 11869–11875. [Google Scholar] [CrossRef]
- Sherwood, T.; Baker, R.T. Effects of Strontium Content on the Microstructure and Ionic Conductivity of Samarium-Doped Ceria. Solids 2021, 2, 293–313. [Google Scholar] [CrossRef]
- Fergus, J.W. Electrolyte for Solid Oxide Fuel Cells. J. Power Sources 2006, 162, 30–40. [Google Scholar] [CrossRef]
- Klug, H.; Alexander, L. X-ray Diffraction Procedures for Polycrystalline and Amorphous Materials; John Wiley: New York, NY, USA, 1974. [Google Scholar]
- Yahiro, H.; Eguchi, Y.; Eguchi, K.; Arai, H. Oxygen Ion Conductivity of the Ceria-Samarium Oxide System with Fluorite Structure. J. Appl. Electrochem. 1988, 18, 527–531. [Google Scholar] [CrossRef]
- Matovic, B.; Bucevac, D.; Jiraborvornpongsa, N.; Yoshida, K.; Yano, T. Synthesis and Characterization of Nanometric Strontium-doped Ceria Solid Solutions via Glycine-Nitrate Procedure. J. Ceram. Soc. Japan 2012, 120, 69–73. [Google Scholar] [CrossRef][Green Version]
- Kim, D. Effect of Y on the Properties of Sm-Doped Ceria for IT-SOFC Applications. J. Am. Ceram. Soc. 1989, 72, 1415–1421. [Google Scholar] [CrossRef]
- Hong, S.J.; Virkar, A.V. Lattice Parameters and Densities of Rare-Earth Oxide Doped Ceria Electrolytes. J. Am. Ceram. Soc. 1995, 78, 433–439. [Google Scholar] [CrossRef]
- Shannon, R.D. Revised Effective Ionic Radii and Systematic Studies of Interatomic Distances in Halides and Chalcogenides. Acta Crystallogr. Sect. A 1976, A32, 751–767. [Google Scholar] [CrossRef]
- Kümmerle, E.; Heger, G. The Structures of C–Ce2O3+δ, Ce7O12, and Ce11O20. J. Solid State Chem. 1999, 147, 485–500. [Google Scholar] [CrossRef]
- Jaiswal, N.; Singh, N.K.; Kumar, D.; Parkash, O. Effect of Strontium (Sr) Doping on the Conductivity of Ceria. J. Power Sources 2012, 202, 78–84. [Google Scholar] [CrossRef]
- Anjaneya, K.C.; Nayaka, G.P.; Manjanna, J.; Ashwin Kumar, V.M.; Govindaraj, G.; Ganesha, K.N. Investigation on the Sr-doped Ceria Ce1−xSrxO2−δ (x = 0.05–0.2) as an Electrolyte for Intermediate Temperature SOFC. J. Alloys Compd. 2014, 598, 33–40. [Google Scholar] [CrossRef]
- Blumenthal, R.; Garnier, J. The Electrical Conductivity and Thermodynamic Behavior of SrO-doped Nonstoichiometric Cerium Dioxide. J. Solid State Chem. 1976, 16, 21–34. [Google Scholar] [CrossRef]
- Cho, P.; Park, S.-Y.; Kim, J.; Do, H.; Park, H.; Lee, J.H. Diffusion Induced Grain-boundary Migration in SrO-doped CeO2 Electrolyte and its Effect on Electrical Properties. Solid State Ion. 2010, 181, 1420–1424. [Google Scholar] [CrossRef]
- Milliken, C.E.; Guruswamy, S.; Khandkar, A.C. Electrochemical Stability of Strontium-Doped Ceria Electrolyte in Solid-Oxide Fuel Cell Applications. J. Am. Ceram. Soc. 2004, 84, 1533–1538. [Google Scholar] [CrossRef]
- Yahiro, H.; Eguchi, K.; Arai, H. Ionic Conduction and Microstructure of the Ceria-Strontia System. Solid State Ion. 1986, 21, 37–47. [Google Scholar] [CrossRef]
- Longo, V.; Meriani, S.; Ricciardiello, F. Subsolidus Phase Relations Between 900° and 1700 °C in the Systems BeO-MgO-CeO2, SrO-MgO-CeO2, BaO-MgO-CeO2, and BaO-CaO-CeO2. J. Am. Ceram. Soc. 1981, 64, C-38–C-39. [Google Scholar] [CrossRef]
- Chavan, S.V.; Tyagi, A.K. Sub-solidus Phase Equilibria in CeO2–SrO System. Thermochim. Acta 2002, 390, 79–82. [Google Scholar] [CrossRef]
- Anjaneya, K.C.; Nayaka, G.P.; Manjanna, J.; Govindaraj, G.; Ganesha, K.N. Studies on Structural, Morphological and Electrical Properties of CeO.8Ln0.2O2−δ (Ln = Y3+, Gd3+, Sm3+, Nd3+ and La3+) Solid Solutions Prepared by Citrate Complexation Method. J. Alloys Compd. 2014, 585, 594–601. [Google Scholar] [CrossRef]
- Chen, P.-L.; Chen, I.-W. Grain Growth in CeO2: Dopant Effects, Defect Mechanism, and Solute Drag. J. Am. Ceram. Soc. 1996, 79, 1793–1800. [Google Scholar] [CrossRef]
- Beschnitt, S.; Zacherle, T.; De Souza, R.A. Computational Study of Cation Diffusion in Ceria. J. Phys. Chem. C 2015, 119, 27307–27315. [Google Scholar] [CrossRef]
- Rahaman, M.N. Sintering of Ceramics, 1st ed.; CRC Press: Boca Raton, FL, USA, 2008; pp. 105–172. [Google Scholar]
- Inaba, H.; Tagawa, H. Ceria-based Solid Electrolytes. Solid State Ion. 1996, 83, 1–16. [Google Scholar] [CrossRef]
- Ruifeng, G.; Zongqiang, M. Sintering of Ce0.8Sm0.2O1.9. J. Rare Earths 2007, 25, 364–367. [Google Scholar] [CrossRef]
- Ding, D.; Liu, B.; Zhu, Z.; Zhou, S.; Xia, C. High Reactive Ce0.8Sm0.2O1.9 Powders via a Carbonate Co-precipitation Method as Electrolytes for Low-temperature Solid Oxide Fuel Cells. Solid State Ion. 2008, 179, 896–899. [Google Scholar] [CrossRef]
- Van Herle, J.; Seneviratne, D.; McEvoy, A.J. Lanthanide Co-doping of Solid Electrolytes: AC Conductivity Behaviour. J. Eur. Ceram. Soc. 1999, 19, 837–841. [Google Scholar] [CrossRef]
- Kim, J.; Lee, D. The Effect of Multiple Doping on Electrical Conductivity of Gadolinia-doped Ceria Electrolyte. Korean J. Chem. Eng. 2002, 19, 421–424. [Google Scholar] [CrossRef]
- Wang, F.-Y.; Chen, S.; Cheng, S. Gd3+ and Sm3+ Co-doped Ceria Based Electrolytes for Intermediate Temperature Solid Oxide Fuel Cells. Electrochem. Commun. 2004, 6, 743–746. [Google Scholar] [CrossRef]
- Omar, S.; Wachsman, E.D.; Nino, J.C. Higher Ionic Conductive Ceria-based Electrolytes for Solid Oxide Fuel Cells. Appl. Phys. Lett. 2007, 91, 144106. [Google Scholar] [CrossRef]
- Liu, Y.; Li, B.; Wei, X.; Pan, W. Citric–Nitrate Combustion Synthesis and Electrical Conductivity of the Sm3+ and Nd3+ Co-Doped Ceria Electrolyte. J. Am. Ceram. Soc. 2008, 91, 3926–3930. [Google Scholar] [CrossRef]
- Guan, X.; Zhou, H.; Liu, Z.; Wang, Y.; Zhang, J. Preparation and Properties of Gd3+ and Y3+ Co-doped Ceria-based Electrolytes for Intermediate Temperature Solid Oxide Fuel Cells. J. Alloys Compd. 2008, 464, 310–316. [Google Scholar] [CrossRef]
- Li, B.; Wei, X.; Pan, W. Improved Electrical Conductivity of Ce0.9Gd0.1O1.95 and Ce0.9Sm0.1O1.95 by Co-doping. Int. J. Hydrogen Energy 2010, 35, 3018–3022. [Google Scholar] [CrossRef]
- Li, B.; Liu, Y.; Wei, X.; Pan, W. Electrical Properties of Ceria Co-doped with Sm3+ and Nd3+. J. Power Sources 2010, 195, 969–976. [Google Scholar] [CrossRef]
- Yao, H.-C.; Zhang, Y.-X.; Liu, J.-J.; Li, Y.-L.; Wang, J.-S.; Li, Z.-J. Synthesis and Characterization of Gd3+ and Nd3+ Co-doped Ceria by using Citric Acid–Nitrate Combustion Method. Mater. Res. Bull. 2011, 46, 75–80. [Google Scholar] [CrossRef]
- Kasse, R.M.; Nino, J.C. Ionic Conductivity of SmxNdyCe0.9O2−δ Co-doped Ceria Electrolytes. J. Alloys Compd. 2013, 575, 399–402. [Google Scholar] [CrossRef]
- Omar, S.; Wachsman, E.D.; Jones, J.L.; Nino, J.C. Crystal Structure–Ionic Conductivity Relationships in Doped Ceria Systems. J. Am. Ceram. Soc. 2009, 92, 2674–2681. [Google Scholar] [CrossRef]
- Mogensen, M.; Sammes, N.; Tompsett, G. Physical, Chemical and Electrochemical Properties of Pure and Doped Ceria. Solid State Ion. 2000, 129, 63–94. [Google Scholar] [CrossRef]
- Zhang, T.S.; Ma, J.; Chan, S.H.; Hing, P.; Kilner, J.A. Intermediate-temperature Ionic Conductivity of Ceria-based Solid Solutions as a Function of Gadolinia and Silica Contents. Solid State Sci. 2004, 6, 565–572. [Google Scholar] [CrossRef]
- Esposito, V.; Traversa, E. Design of Electroceramics for Solid Oxides Fuel Cell Applications: Playing with Ceria. J. Am. Ceram. Soc. 2008, 91, 1037–1051. [Google Scholar] [CrossRef]
- Ding, D.; Liu, B.; Gong, M.; Liu, X.; Xia, C. Electrical Properties of Samarium-doped Ceria Electrolytes of Highly Active Powders. Electrochim. Acta 2010, 55, 4529–4535. [Google Scholar] [CrossRef]
- Zhan, Z.; Wen, T.-L.; Tu, H.; Lu, Z.-Y. AC Impedance Investigation of Samarium-doped Ceria. J. Electrochem. Soc. 2001, 148, A427. [Google Scholar] [CrossRef]
- Irvine, J.T.S.; Sinclair, D.C.; West, A.R. Electroceramics: Characterization by Impedance Spectroscopy. Adv. Mater. 1990, 2, 132–138. [Google Scholar] [CrossRef]
- Christie, G.M.; van Berkel, F.P.F. Microstructure-Ionic Conductivity Relationships in Ceria-Gadolinia Electrolytes. Solid State Ion. 1996, 83, 17–27. [Google Scholar] [CrossRef]
- Verkerk, M.J.; Middelhuis, B.J.; Burggraaf, A.J. Effect of Grain Boundaries on the Conductivity of High-purity ZrO2/Y2O3 ceramics. Solid State Ion. 1982, 6, 159–170. [Google Scholar] [CrossRef]


Publisher’s Note: MDPI stays neutral with regard to jurisdictional claims in published maps and institutional affiliations. |
© 2021 by the authors. Licensee MDPI, Basel, Switzerland. This article is an open access article distributed under the terms and conditions of the Creative Commons Attribution (CC BY) license (https://creativecommons.org/licenses/by/4.0/).