1. Introduction
Uranium is a crucial strategic resource whose wide applications span multiple fields, such as military, energy, medical, and scientific research. During its exploitation, numerous low-grade uranium deposits, often associated with beryllium (Be), a rare light metal element, are generated. If these associated beryllium resources are not developed and utilized, it will lead to a waste of resources. However, the low grades of these deposits and the wide variety of rare earth elements they contain pose great challenges to the enrichment and separation of beryllium (Be). Therefore, extracting rare earth elements from low-grade uranium polymetallic ore cannot only enhance the utilization rate of uranium resources but also generate certain economic benefits, which is of great significance for the development and utilization of low-grade uranium resources in China [
1,
2,
3,
4,
5,
6,
7].
As a rare light metal element, beryllium (Be) has many excellent physical and chemical properties and is widely used in the aerospace and nuclear industries and other high-tech fields. Due to the special military attributes of beryllium resources, China’s access to beryllium resources overseas is not guaranteed, and the resource security situation is not optimistic. Thus, the extraction and utilization of associated beryllium resources in low-grade uranium-gold polymetallic ore is of important practical significance for promoting the efficient and rational development and utilization of low-grade uranium-gold polymetallic ore resources in China.
Aiming at the enrichment and separation of beryllium (Be) resources, researchers at home and abroad have developed methods such as the sulfuric acid method and the fluorination method. However, it has high energy consumption, a high production cost, a complex device, and high operation requirements. It is difficult to meet the needs of high-quality products; these factors limit their wide application.
In recent years, research on the enrichment and extraction technology of associated resources in low-grade uranium-gold polymetallic deposits has continued to heat up. Experimental studies have shown that the use of (NH
4)
2SO
4 solution for the enrichment and extraction of associated beryllium resources in low-grade uranium-gold polymetallic ore is more effective [
8,
9,
10,
11]. Researchers have also found that the leaching rate of rare earth elements increased with an increase in the concentration of the leaching agent, and the concentration of the leaching agent increased, but the excessive concentration of the leaching agent would increase the content of impurity ions in the leaching solution. It causes chemical blockage of the pores on the mineral surface and inhibits the leaching rate of rare earths. In addition, Huang L.M. et al. [
12] studied the recovery process of beryllium from tin-iron ore tailings and found that the liquid-solid ratio was 4:1 and the leaching rate of beryllium was higher when ammonia water was used as a precipitant. Deng, W et al. [
13] carried out beneficiation experiments on low-grade beryllium ore in western Sichuan and found that the grinding fineness had a significant influence on the improvement of BeO grade. Li, Y.Y [
14] Used calcium chloride and aluminum sulfate to optimize the process of leaching ion-adsorbed rare earth in stages and found that Al
2(SO
4)
3 had a better effect on leaching rare earth and optimized the process of leaching ion-adsorbed rare earths in stages by calcium chloride and aluminum sulfate and discovered that (NH
4)
2SO
4 and Al
2(SO
4)
3 had higher leaching efficiencies for rare earths. Feng et al. [
15] studied the wetting effects of different leaching agents on ionic rare earth minerals and discussed the effects of (NH
4)
2SO
4, CaCl
2, and MgSO
4 leaching agents on the microstructure of minerals. It was found that (NH
4)
2SO
4 had better wettability on minerals than CaCl
2 and MgSO
4, which was conducive to full contact between leaching agents and minerals and was more conducive to leaching reactions in an acidic environment. Ding, P.J et al. [
16] used different leaching agents to carry out re-adsorption behavior experiments on ionic rare earths. (NH)
2SO
4, Al
2(SO
4)
3, and MgSO
4 were selected as leaching agents. It was found that Al
2(SO
4)
3 had a better effect on inhibiting the re-adsorption of rare earth ions. After leaching, the number of pores on the surface of the ore sample was the largest, and the leaching rate was the fastest, which was beneficial to the efficient leaching of rare earth elements in the ore sample.
At the same time, a large number of studies [
17,
18,
19,
20,
21,
22,
23,
24,
25,
26,
27,
28,
29,
30,
31] have shown that (NH
4)
2SO
4 has a strong leaching ability and a short leaching cycle. It is an efficient leaching agent for ionic rare earth ore. It can exchange ions with rare earth ions adsorbed on the surface of minerals so that rare earth ions are replaced in the solution.
However, the above studies are mostly aimed at rare earth leaching of non-uranium ore and are rarely used in the leaching of beryllium in low-grade uranium-gold polymetallic ore with strong acidity, and there are few studies on the correlation between the leaching rate, particle size, leaching solution concentration, and leaching time. At the same time, although the above studies have proposed that (NH4)2SO4 and Al2(SO4)3 have a certain promoting effect on the leaching effect of rare earth, they have not been quantitatively analyzed. At present, there is no relevant report on the leaching effect of beryllium in low-grade uranium-gold polymetallic ore by (NH4)2SO4 and Al2(SO4)3 as a combined leaching agent.
In view of this, combined with the latest research progress of low-grade uranium-gold polymetallic ore, this paper intends to use the leaching method of circulating liquid injection to specifically study the effects of (NH4)2SO4 and Al2(SO4)3 on the leaching rate of beryllium in low-grade uranium-gold polymetallic ore with different particle sizes. Microscopic analyses of the products were carried out by means of electron microscope scanning and X-ray energy spectrum analysis, and the leaching mechanism was revealed so as to provide theoretical and technical support for the sustainable development of the uranium industry.
2. Materials and Methods
2.1. Site and Samples Description
A low-grade uranium-gold polymetallic ore sample was taken from the ‘Ma’anshan Mine Research Institute, Anhui Province, China. The measurements show that the low-grade uranium-gold polymetallic ore dry density is 2.236 g/cm
3, and the void ratio is 0.327. Their weight proportions are 1.05%, 25.11%, 23.74%, 15.24%, 3.01%, 10.80%, 12.64%, 6.07%, and 2.31%, respectively. The particle size distribution curve is shown in
Figure 1. The particle size distribution of the ore sample is wide, and the content of large particles is high. The particles with a particle size greater than 0.5 mm account for more than 50% of the total mass. It can be seen from
Figure 1 that d10 = 0.1 mm, d30 = 0.25 mm, and d60 = 0.88 mm. The curvature coefficient of the particle curve
Cc = 0.71 is calculated by Formula (1). According to China’s particle gradation standard GB/T14684-2022, it was determined that the coarse sand is poorly graded [
32].
In the formula,
d10 is the particle size of the sieve mass, accounting for 10%;
d30 is the particle size of 30% sieved mass; and d30 is the particle size of 60% sieved mass. 1 <
Cc < 3 is a continuous gradation; otherwise, it is a discontinuous gradation [
33].
The main components of the ore are potassium feldspar, albite, and sodium iron amphibole, which account for 40%. The distribution of the particle size, determined by screening, is shown in
Figure 1. The main useful elements in the chemical composition ore are REO, BeO, U, etc., by XRF analysis. The REO content is 0.92%, the BeO content is 0.072%, and the U content is 0.022%. The results are shown in
Table 1.
(NH4)2SO4 was purchased from Tianjin Kemiou Chemical Reagent Co., Ltd. (Tianjin, China), which was granular, with a net content of ≥99.5%. Al2(SO4)3 was purchased from Tianjin Komiou Chemical Reagent Co., Ltd., which was granular, with a net content of ≥99.0 % and pH of ≥2.5.
2.2. Sample Preparation
After being air-dried, the low-grade uranium-gold polymetallic ore samples were separated into different particle size fractions, i.e., 2.36 mm, 1.18 mm, 0.60 mm, 0.282 mm, 0.25 mm, 0.15 mm, 0.075 mm, 0.065 mm, and less than 0.065 mm, according to the particle size. After the screening was completed, the ore samples of each particle size group were ball-milled with an omnidirectional planetary ball mill (equipment model QXQM-2, Changsha Tianchuang Powder Technology Co., Ltd., (Changsha, China)). The speed was set to 250 r/min, and the ball-milling time was 30 min.
2.3. Batch Leaching Experiments
To ascertain how (NH
4)
2SO
4 and particle size affect the leaching rate of beryllium, 3 experimental groups were set up in this experiment, and no (NH
4)
2SO
4 was added to the control group (blank). The device for beryllium leaching is shown in
Figure 2. It can be seen from
Figure 2 that the reaction generator used in the test is a cylindrical container made of plexiglass with a 45.1 mm outer diameter, 39.1 mm inner diameter, and 100 mm height. In order to prevent the fine particles from sinking and blocking the grouting mouth during the grouting process, the lower part of the uranium tailing slag column is separated by gauze and then sealed with a double-hole rubber plug. According to
Table 2, the ore samples of each particle size were weighed and placed in the reaction generator, and according to
Table 3, 2 g/L, 4 g/L, 6 g/L, and 8 g/L (NH
4)
2SO
4 reagents and 8 g/L Al
2(SO
4)
3 solutions were prepared.
The specific grouting operation methods were as follows: (NH4)2SO4 liquid and Al2(SO4)3 liquid were injected through the lower grouting hole; during grouting, the injection speed was 2 mL/min through the peristaltic pump to ensure the infiltration of grout in the gap of the uranium slag. In the leaching cycle, every 24 h, leachate was extracted to test the beryllium concentration. Next, after leaching, ore samples were taken out for drying to constant weight, and then the corresponding surface porosity and other physical-chemical characteristics were analyzed.
2.4. Analytical Procedures
2.4.1. Dissolved Beryllium Concentration
Due to the interference of micro-soluble matter and fine particles, a dissolved beryllium concentration in the leachate samples from the batch leaching experiments cannot be measured accurately by conventional UV spectrophotometry, even if it passes through a 0.2 mm filter membrane. Therefore, the leachate was digested by the following methods: Add 1 mL of concentrated nitric acid to 20 mL of leachate, heat and nitrate to about a 10 mL volume, cool, and then add 5 mL of concentrated nitric acid and a small amount of 2 mL of perchloric acid. Continue heating and digestion, steam to nearly dry, and after cooling, dissolve the residue with 0.2% nitric acid through a 0.2 mm filter membrane with a 0.2% nitric acid constant volume. The concentration of beryllium in leachate after digestion was determined by ICP-OES.
The leaching rates of beryllium in the leached solution were calculated as follows:
where R is the leaching rate of beryllium (%); θ
0 is the content of beryllium in the mineral samples (mg/kg); V
i (i is the number of sampling) is the volume after leaching; and C
i is the concentration of beryllium in the leaching solution (mg/L).
2.4.2. Surface Porosity Detection Test
The surface porosity of the leached samples was determined using ImageJ2x software (Version 2.1.4.11). The mineral samples were treated by the following methods: After the leaching test, the ore sample was dried, and the mold was removed with a hot cutter. The ore samples, after demolding, were photographed, and the images were processed by ImageJ2x software to calculate the porosity of the ore sample surface.
2.4.3. Leaching Characterization
To assess the microstructure, the mineral samples after leaching were analyzed by scanning electron microscopy as well as energy dispersive spectrometry (SEM-EDS). The SEM-EDS analysis was executed with a field emission scanning electron microscope (Phenom Nano G2 (Thermo Fisher Scientific, Waltham, MA, USA). The ore samples, after leaching, were treated by the following methods: the leached minerals were placed in a drying oven and scanned by electron microscopy after drying for 24 h.
To discover the mineral composition and the functional group, X-ray diffraction (XRD, DX-2700BH, Haoyuan, China) and the detailed analytical and data reduction methods of XRD can be referred to in Yin et al. [
34]. To reveal solid-phase beryllium speciation, mineral samples after 3 days of cyclic leaching were determined by X-ray photoelectron spectroscopy (XPS) Thermo Fisher Scientific, Waltham, MA, USA) following the procedures of [
35].
3. Results and Discussions
3.1. Beryllium Leaching Rate Test Results and Analysis
Because the low-grade uranium-gold polymetallic ore selected in the test has more fine particles, the gap between the ore sample particles is small, and it has a certain density. The conventional leaching method makes it difficult to ensure full contact between the leaching agent and the ore sample particles. Therefore, in order to make the ore sample particles fully contact with the leaching agent so as to maximize the leaching rate of beryllium in low-grade uranium-gold polymetallic ore, in this paper, the beryllium leaching rate of uranium tailings will be studied by means of constant-flow-rate circulating-liquid injection.
The variation in the leaching concentration of beryllium in the ore samples under different particle sizes with a concentration of (NH
4)
2SO
4 solution is shown in
Figure 3. It can be seen from
Figure 3 that the leaching concentration of beryllium increases first and then decreases with the rise of the (NH
4)
2SO
4 solution. The concentration of beryllium leaching solution reaches an extreme value when the particle size is 0.065 mm, and the concentration of (NH
4)
2SO
4 solution is 4 g/L. In the process of increasing the concentration of the (NH
4)
2SO
4 solution from 2 g/L to 8 g/L in 96 groups of experimental data, the particle size of the ore sample was 0.065 mm. After 3 days of leaching, the leaching concentration of beryllium in the leaching solution increased from 0.007 mg/L to 0.526 mg/L, and the leaching concentration of beryllium increased by 75 times. The leaching concentration of the beryllium increased from 0.304 mg/L to 0.423 mg/L when the concentration of the (NH
4)
2SO
4 solution was 8 g/L. which indicates that the concentration of the (NH
4)
2SO
4 solution has a great influence on the leaching of beryllium in ore samples; an appropriate amount of (NH
4)
2SO
4 solution concentration can improve the beryllium leaching concentration of the ore sample but decrease it upon reaching a critical value. An excessive amount of ions in the leaching agent cannot effectively disperse due to an excessive concentration of (NH
4)
2SO
4 when grouting, which creates more ion accumulation in the ore body, resulting in the blockage of ion channels that drives down its beryllium leaching performance.
3.2. Leaching Bodies Phase and Functional Groups Analysis
In addition to the pore structure, the mineral phase and functional groups in the ore sample also have an important influence on the leaching of beryllium. When the particle size of the ore sample is 0.065 mm, and the concentrations of the (NH
4)
2SO
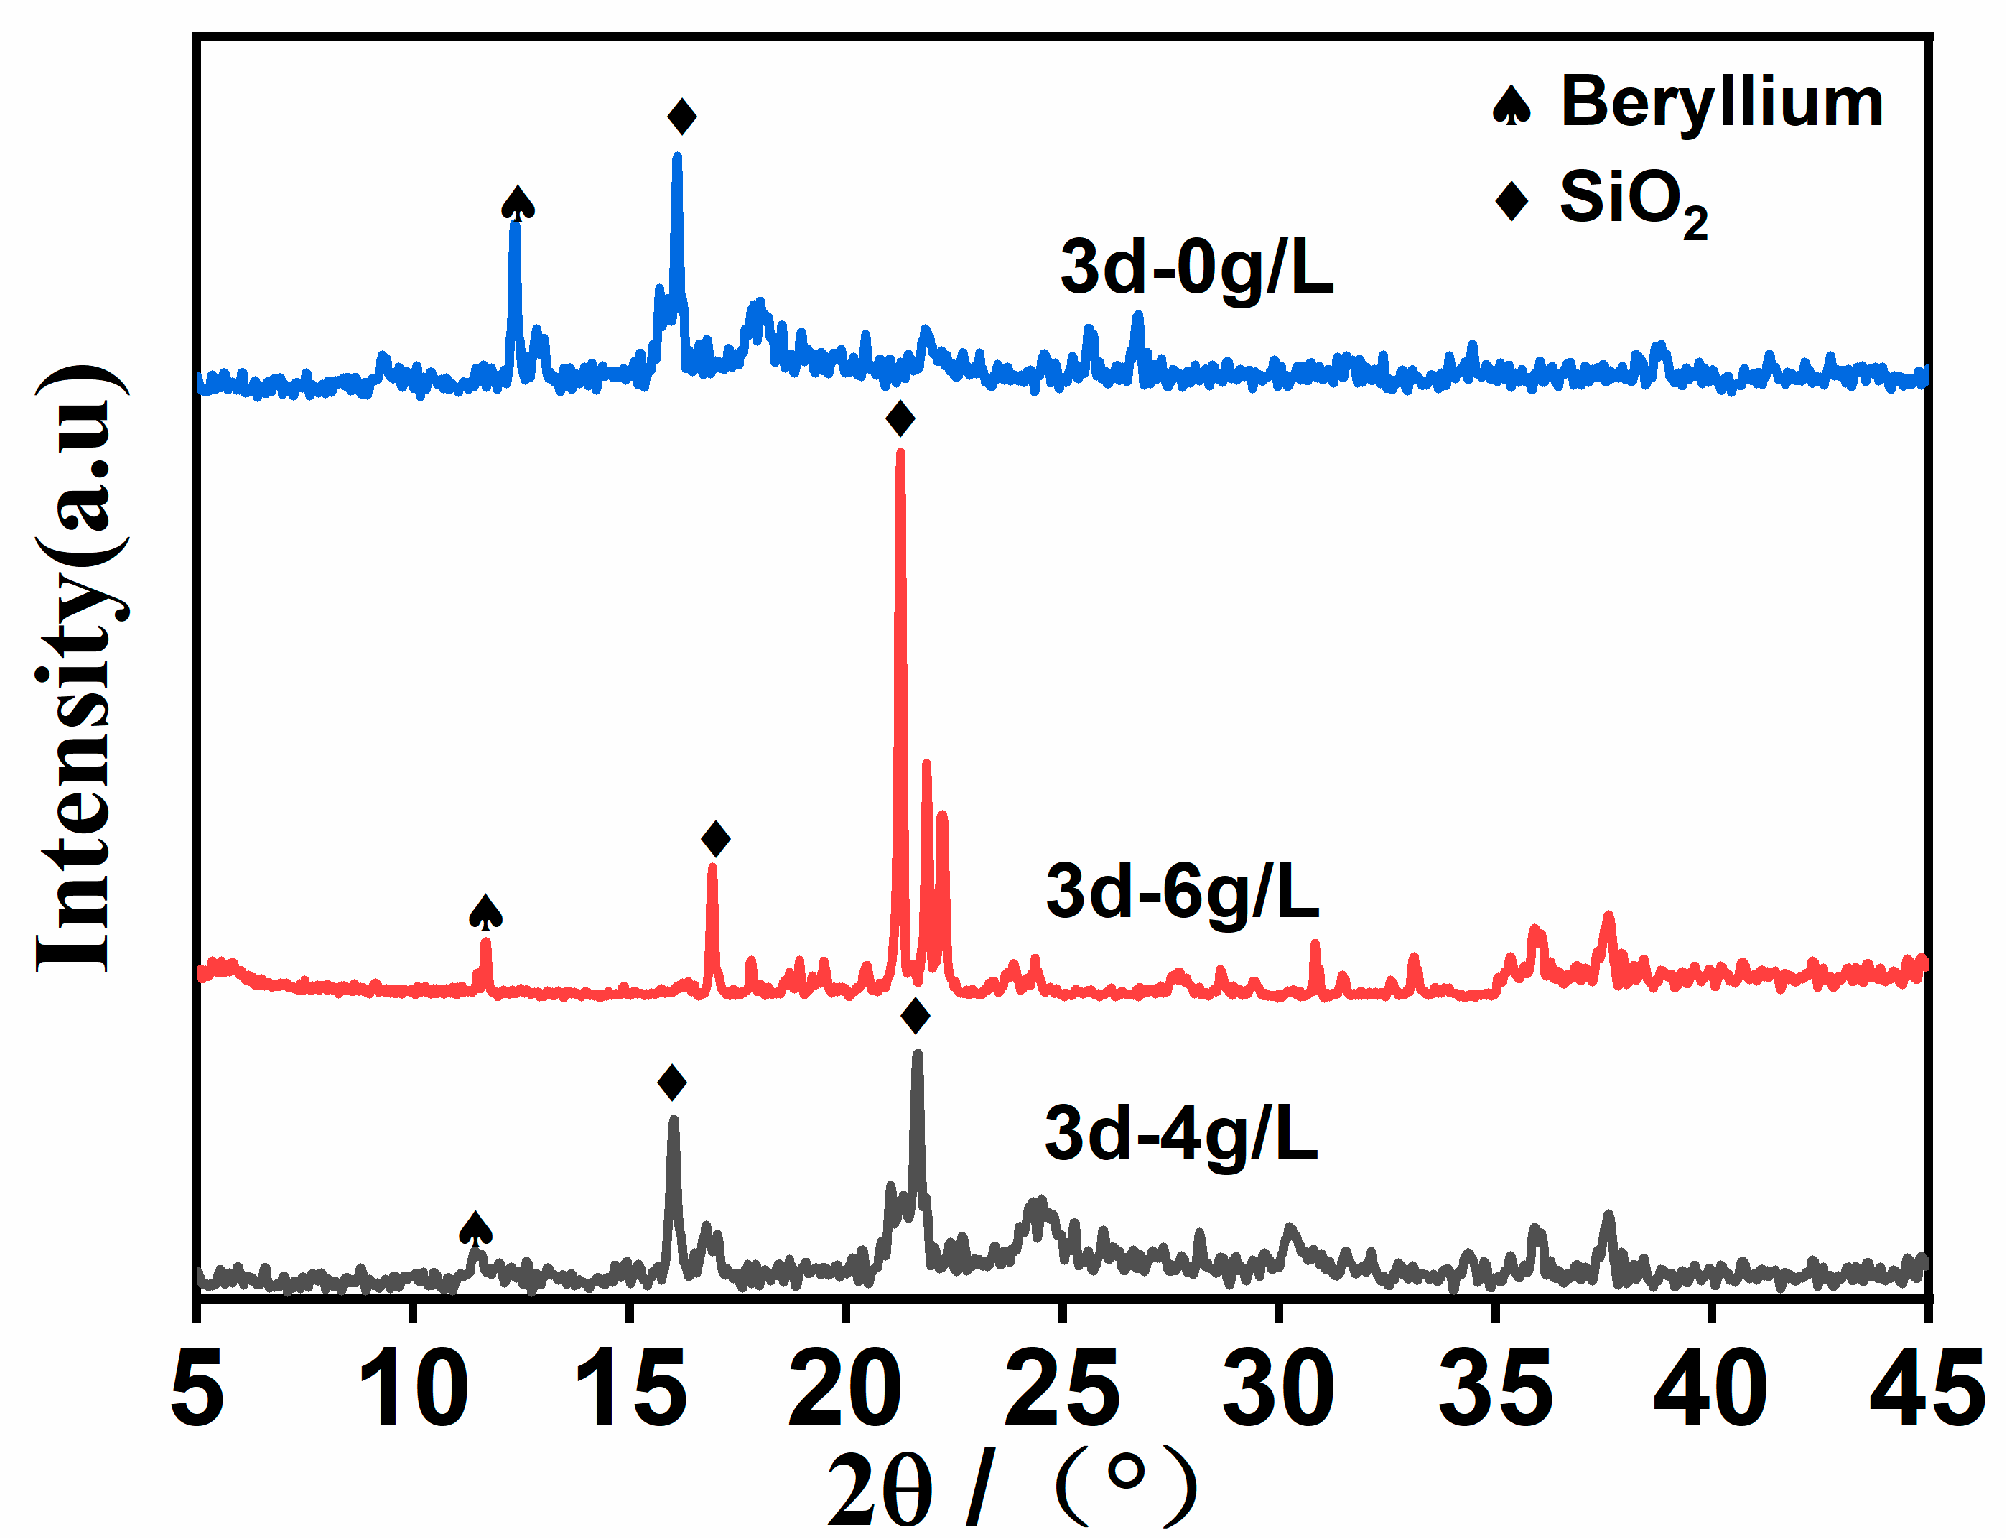
4 solution are 0 g/L, 4 g/L, and 6 g/L, the XRD pattern of low-grade uranium-gold polymetallic ore after leaching for 3 d is obtained, and the results are shown in
Figure 4. By comparing the relevant data of the PDF standard card, it can be seen that the specimens are a mixture mainly composed of quartz, gypsum, vaterite, and gismondine.
It can be seen from
Figure 4 that after 3 days of leaching, the XRD spectrum of the uranium tailings sample shows a wide, serrated dispersion peak package. There are two obvious peaks in the injected (NH
4)
2SO
4 solution, which are 0 g/L and 6 g/L, which are beryllium oxide and SiO
2, respectively. The concentration of the (NH
4)
2SO
4 solution is 0 g/L, and the diffraction peak of beryllium can be observed near 2θ = 15°, and the peak value is larger. The diffraction peak of beryllium was also observed near 2θ = 30°, and the peak value was significantly lower than that of the (NH
4)
2SO
4 solution at 0 g/L, indicating that the beryllium content in the ore sample was more leached when the (NH
4)
2SO
4 solution was 4 g/L. It promotes the reduction of beryllium content in the ore sample and also increases the voids inside the ore sample, providing more leaching channels for the leaching of beryllium. When the (NH
4)
2SO
4 solution is 4 g/L, the peak value of beryllium is quite different from when the (NH
4)
2SO
4 solution is 6 g/L. When the (NH
4)
2SO
4 solution is 4 g/L, the leaching degree of beryllium is more sufficient, which is consistent with the experimental results of the beryllium leaching rate and electron microscope scanning.
As shown in Formula (3)–(6), where M
a+ is the impurity ion in the ore sample, a is the charge number of impurity ions in the ore sample.
3.3. Micro and Pore Structures
The analysis involved scanning electron microscopy (SEM) of the mineral samples leached with various concentrations of (NH
4)
2SO
4 to study the morphological changes after leaching and to uncover the leaching mechanism of beryllium. Using the SEM results and SEM-EDS elemental analysis of the uranium tailings, the chemical composition and microscopic changes in the materials are confirmed.
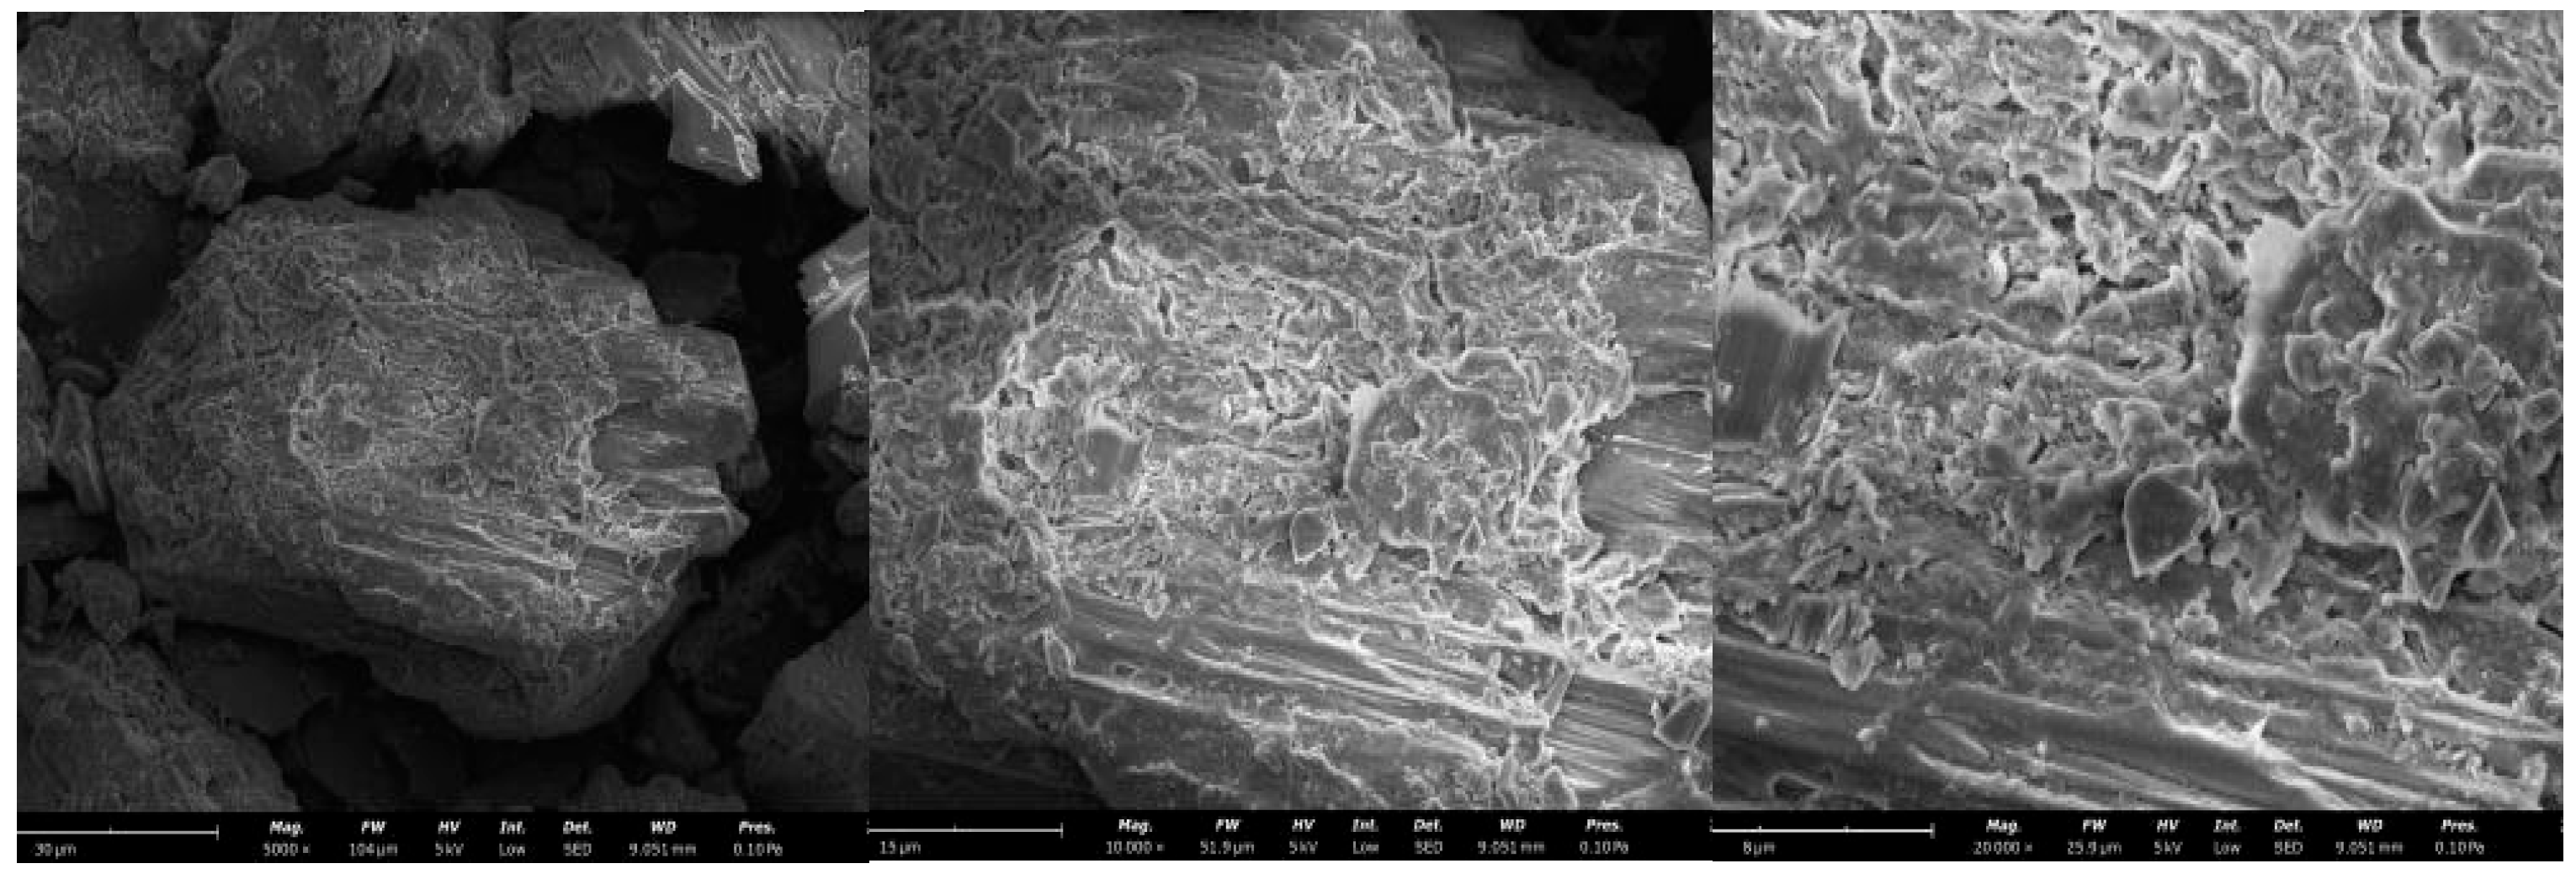
Figure 5,
Figure 6 and
Figure 7 show the SEM results for the (NH
4)
2SO
4 concentrations of 0 g/L, 4 g/L, and 6 g/L, with a mineral sample size of 0.065 mm after a 3-day leaching period. The images indicate that the particle surfaces contain numerous porous structures, which can be further analyzed with the EDS results in
Figure 8.
From
Figure 5, it can be seen that the concentration of the (NH
4)
2SO
4 solution is 0 g/L. The mineral sample has fewer surface voids, and its microstructure forms a loose, flaky structure compared to
Figure 6. The uranium tailings sample still has a relatively dense protective layer, preventing the leaching solution from entering the interior of the mineral sample. From
Figure 8a, it can be observed that when the concentration of the (NH
4)
2SO
4 solution is 0 g/L, the Ca content in the mineral sample is 0.084%. Compared to the concentration of the (NH
4)
2SO
4 solution at 4 g/L, this indicates that the structure of the mineral sample is relatively dense and cannot continue to react with the leaching solution. Therefore, the amount of leaching agent between the mineral particles is low, resulting in a low beryllium leaching amount.
From
Figure 6, it can be seen that when the concentration of the (NH
4)
2SO
4 solution is 4 g/L, the mineral sample particles react more fully with the leaching solution. The surface-void structure and layered structure of the mineral sample are more abundant, allowing the leaching solution to immerse the uranium tailings sample. The leaching solution fills the voids between the uranium mineral particles, improving the leaching rate of beryllium in the mineral sample. The NH
4+ ions undergo ion-exchange reactions with beryllium ions in the mineral sample, allowing beryllium ions to enter the leaching solution. Additionally, the H
+ from NH
4+ can form hydrogen bonds with O
2 on the surface of the mineral sample, enhancing the adsorption of NH
4+ by the uranium mineral particles and weakening the re-adsorption of beryllium ions by the mineral sample. This is the main reason for the increase in the leaching amount of beryllium from the mineral sample. From
Figure 8b, it can be seen that when the concentration of the (NH
4)
2SO
4 solution is 4 g/L, the Be content in the mineral sample is 0.015%, indicating that a 4 g/L concentration of the (NH
4)
2SO
4 solution is more favorable for the leaching of beryllium in the mineral sample.
From
Figure 7, it can be seen that when the concentration of the (NH
4)
2SO
4 solution is 6 g/L, there are fewer voids inside the mineral sample, and the flaky or layered structure is significantly reduced compared to
Figure 6. Furthermore, the layered or flaky distribution is uneven, and the density of the mineral sample has significantly increased compared to 4 g/L. The leaching rate of beryllium from the mineral sample is low. The experimental results indicate that a high concentration of (NH
4)
2SO
4 solution does not effectively improve the leaching rate of beryllium in the mineral sample.
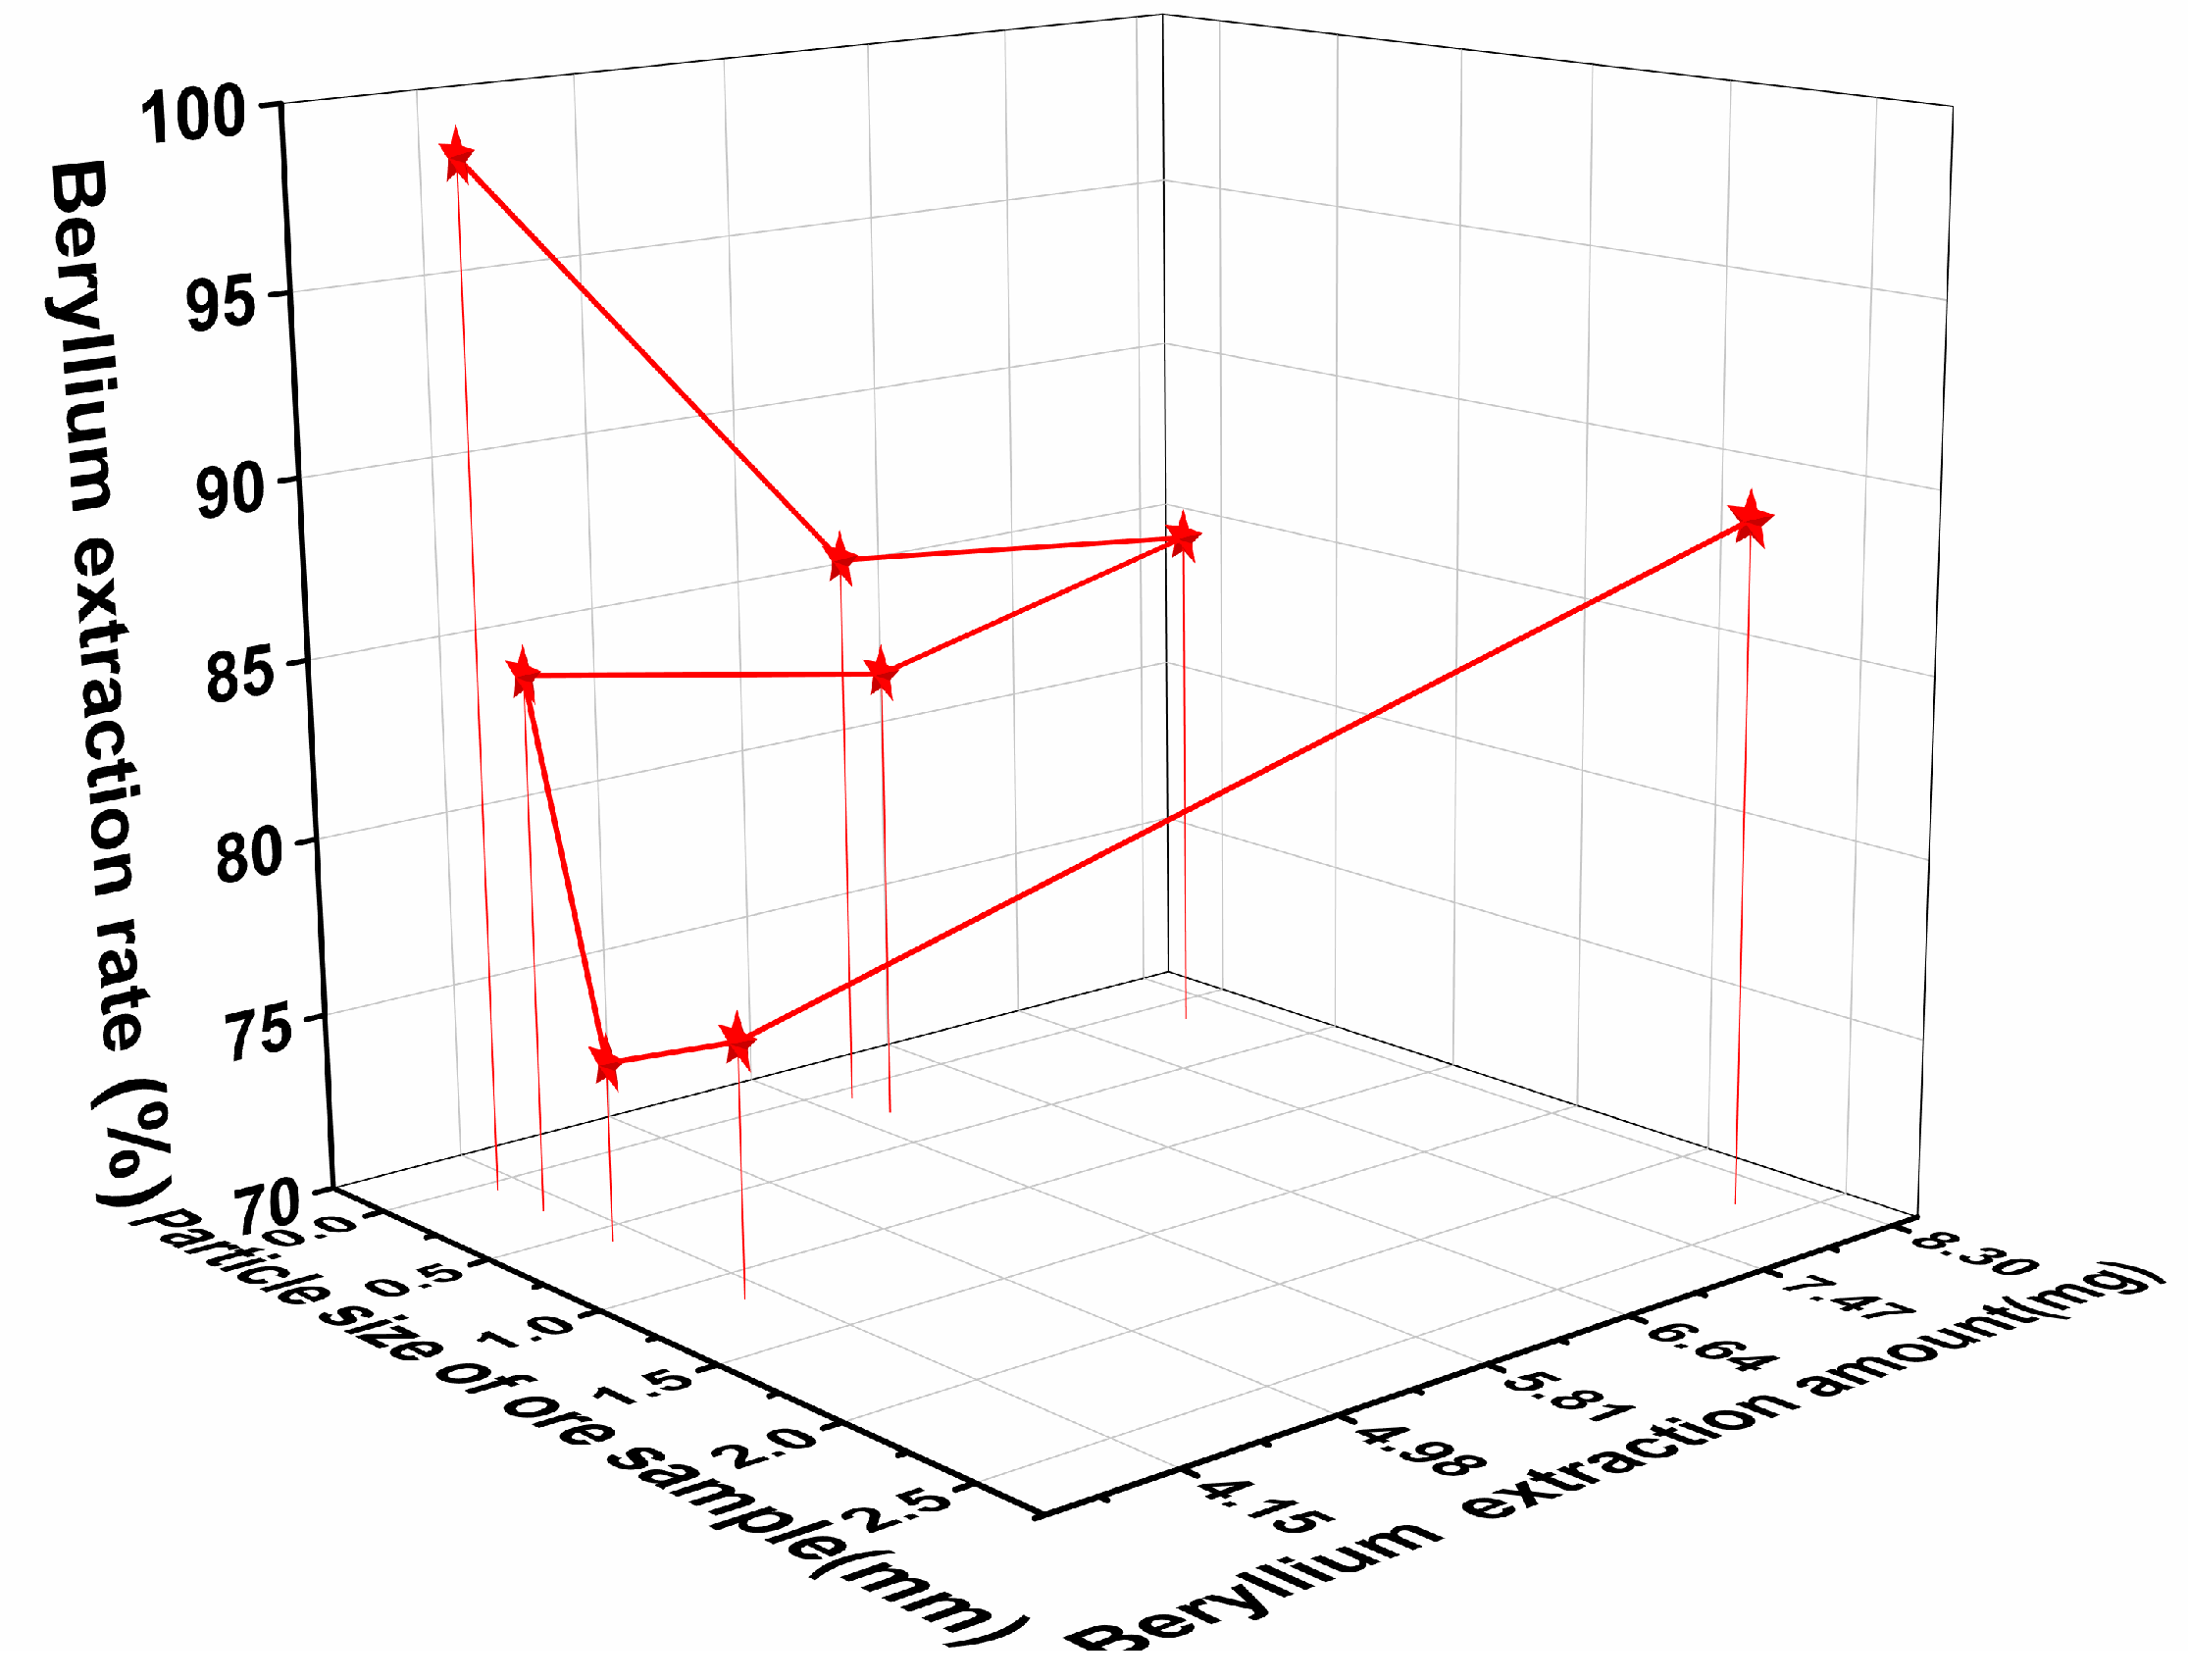
3.4. Analysis of the Relationship Between Beryllium Leaching Rate and Particle Size
Figure 9 shows the relationship between the optimal beryllium leaching rate after the mineral sample extraction and the particle size of the mineral sample, as well as the concentration of the (NH
4)
2SO
4 solution. From
Figure 9, it can be observed that when the concentration of the (NH
4)
2SO
4 solution is 6 g/L and the particle size is 0.0625 mm, the beryllium leaching rate reaches 98.6% after soaking the mineral sample for 3 days. The leaching rate of beryllium first decreases and then increases with the changes in the concentration of the (NH
4)
2SO
4 solution and particle size. When the concentration of the (NH
4)
2SO
4 solution is 4 g/L and the particle size is 0.600 mm, the beryllium leaching rate drops to its lowest point of 77%. After reducing the particle size of the mineral sample to 0.600 mm, the optimal leaching rate of beryllium begins to increase.
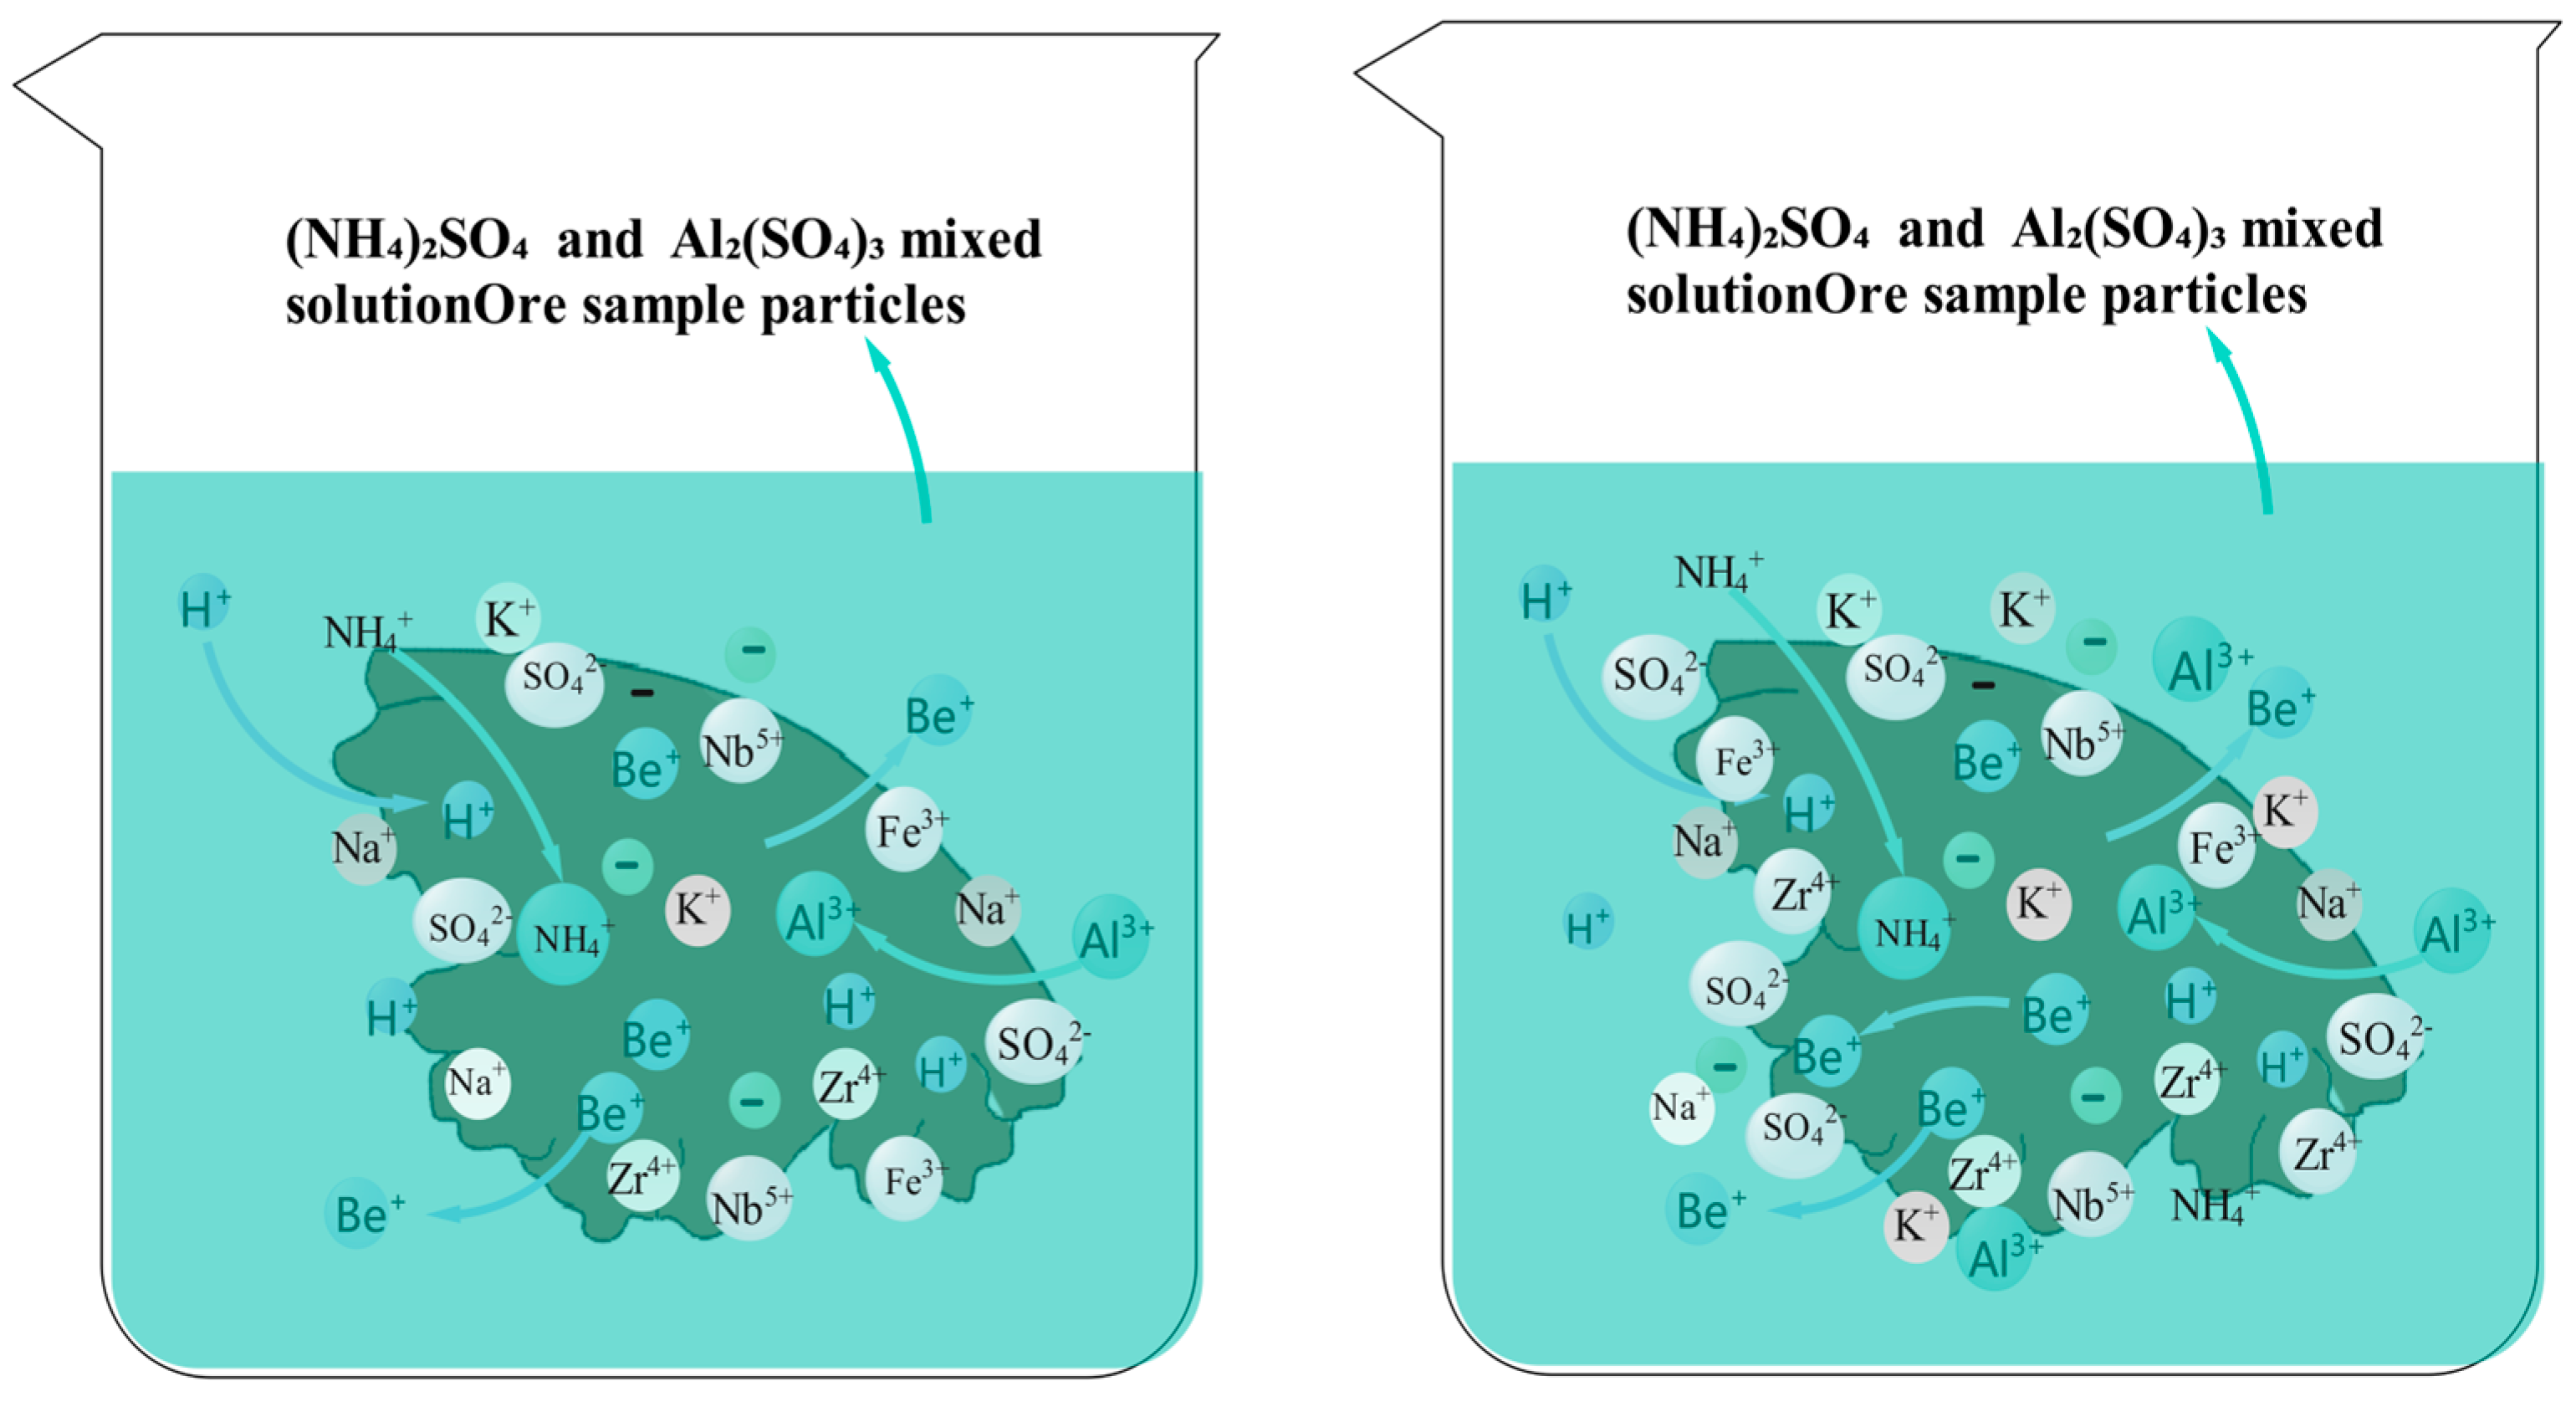
Due to the acidic nature of the (NH4)2SO4 solution and the uranium mineral sample, with a pH of 3.2, the combined action of the (NH4)2SO4 solution and the uranium mineral promotes the dissolution of Al2O3 and Fe2O3 in the mineral sample, leading to the formation of numerous voids within the sample, which provide pathways for the leaching of beryllium ions. The Fe3+ and Al3+ ions in the leaching solution have relatively large ionic radii and also possess a nuclear radius advantage, making it easy for them to undergo complexation reactions with SO42− in the leaching solution to form stable complexes. This complexation facilitates the leaching of beryllium ions from the mineral sample while inhibiting the re-adsorption of beryllium ions. Therefore, as the concentration of the (NH4)2SO4 solution increases to 4 g/L, the reaction products, such as NH4+, SO42−, Al3+, and Fe3+, fill the voids in the mineral sample, thereby increasing the leaching rate of beryllium.
When the concentration of the (NH4)2SO4 solution is 4 g/L and the particle size is 0.065 mm, the leaching rate of beryllium from the mineral sample reaches its optimal level. This is mainly due to the larger surface area of the mineral sample with a particle size of 0.065 mm, which effectively increases the contact area between the mineral sample and the leaching solution. Additionally, smaller particle sizes lead to a higher beryllium content in the mineral sample, optimizing the leaching rate. Furthermore, (NH4)2SO4 exhibits good wetting properties, facilitating sufficient contact between the leaching agent and the minerals. Under acidic conditions, the contact angle and adhesion work of the leaching agent on the mineral surface is smaller, enhancing wettability, which is more favorable for beryllium leaching.
It can be seen from
Figure 10 that when the concentration of the (NH
4)
2SO
4 solution is too high, the leaching effect of beryllium in the minerals decreases. This is mainly because an excess of NH
4+ and SO
42− can lead to ionic blockage, obstructing the pathways for the ingress and egress of beryllium ions, which is detrimental to the leaching of beryllium from the minerals.
On the one hand, the presence of impurity ions will change the charge distribution and local electric field environment on the ore surface. Since the migration of beryllium ions depends to a certain extent on the driving of surface charge and electric field, impurity ions will block the normal migration path of beryllium ions. Positively charged Fe ions and Al ions will change the positive charge density on the surface of the ore, which will change the electric field environment that is originally beneficial to beryllium ions, making it difficult for beryllium ions to move toward the leaching solution, blocking the entry and exit channels. On the other hand, impurity ions, like beryllium ions, have the ability to exchange or adsorb with the active sites on the ore surface. Since their concentration in the solution may be relatively high, it is easier to compete with beryllium ions for limited adsorption sites. These impurity ions occupy the adsorption sites near the channels, which will reduce the contact opportunities between beryllium ions and these sites, making it difficult for beryllium ions to attach to, enter, or exit through these channels.
3.5. Analysis of the Relationship Between Beryllium Leaching Amount and Leaching Time
Figure 11 shows the leaching concentration of mineral beryllium at different particle sizes and leaching times. It can be observed that the amount of beryllium leached is linearly related to the particle size, and as the leaching time increases, the leaching effect improves. The maximum beryllium leaching occurs at a (NH
4)
2SO
4 solution concentration of 4g/L, a particle size of 0.0625 mm, and a leaching time of 1 day. The leaching amount of beryllium shows a linear trend when the particle size ranges from 0.60 mm to 2.36 mm, with a lower slope indicating stability; however, a rapid increase in leaching is observed for particle sizes between 0.065 mm and 0.282 mm, which can be fitted with a logarithmic function. After 1 day, with a particle size of 0.0625 mm and a (NH
4)
2SO
4 concentration of 4 g/L, the beryllium leaching concentration of 0.532 mg/L is 76 times higher than the 0.008 mg/L observed at a 0 g/L concentration. Additionally, after 1 day, the optimal leaching concentration of beryllium is 0.334 mg/L at a (NH
4)
2SO
4 concentration of 4 g/L, indicating that an optimal (NH
4)
2SO
4 concentration and particle size can significantly enhance beryllium leaching. The relationship between the beryllium leaching concentration and leaching time can be used to calculate the leaching rate using Formula (7).
In the formula, Ji represents the leaching rate of the beryllium when the concentration of the (NH4)2SO4 solution is i; ΣCi is the leaching concentration of the beryllium at concentration i of the (NH4)2SO4 solution; V is the volume of the leaching liquid; r is the radius of the bottom surface of the feed container; and t is the leaching time.
Figure 12 shows the leaching rates of beryllium for different particle sizes under the optimal leaching speed. From
Figure 11, it can be seen that the hourly leaching rate of beryllium reaches its maximum value of 1.1 mg after 3 days of leaching, with a mineral particle size of 0.065 mm and an (NH
4)
2SO
4 solution concentration of 4 g/L. It is evident that the combined effect of (NH
4)
2SO
4 and Al
2(SO
4)
3 can leach beryllium from minerals and reach equilibrium in a relatively short time. However, as the particle size of the mineral increases, the leaching speed of beryllium decreases gradually. This is because, with an increasing particle size, the beryllium content per unit of mineral decreases. Additionally, as the leaching agents H
+, (NH
4)
2SO
4, and Al
2(SO
4)
3 are consumed, the wettability of the mineral surface decreases. This reduction in wettability hinders the ion exchange between beryllium ions and the hydrated or hydroxyl-hydrated ions adsorbed on the mineral particles’ surface, thus slowing down the beryllium leaching speed.
3.6. Image Analysis of Pore Structure on the Surface of Ore Sample
The leaching effect of beryllium from minerals based on the combined action of (NH
4)
2SO
4 and Al
2(SO
4)
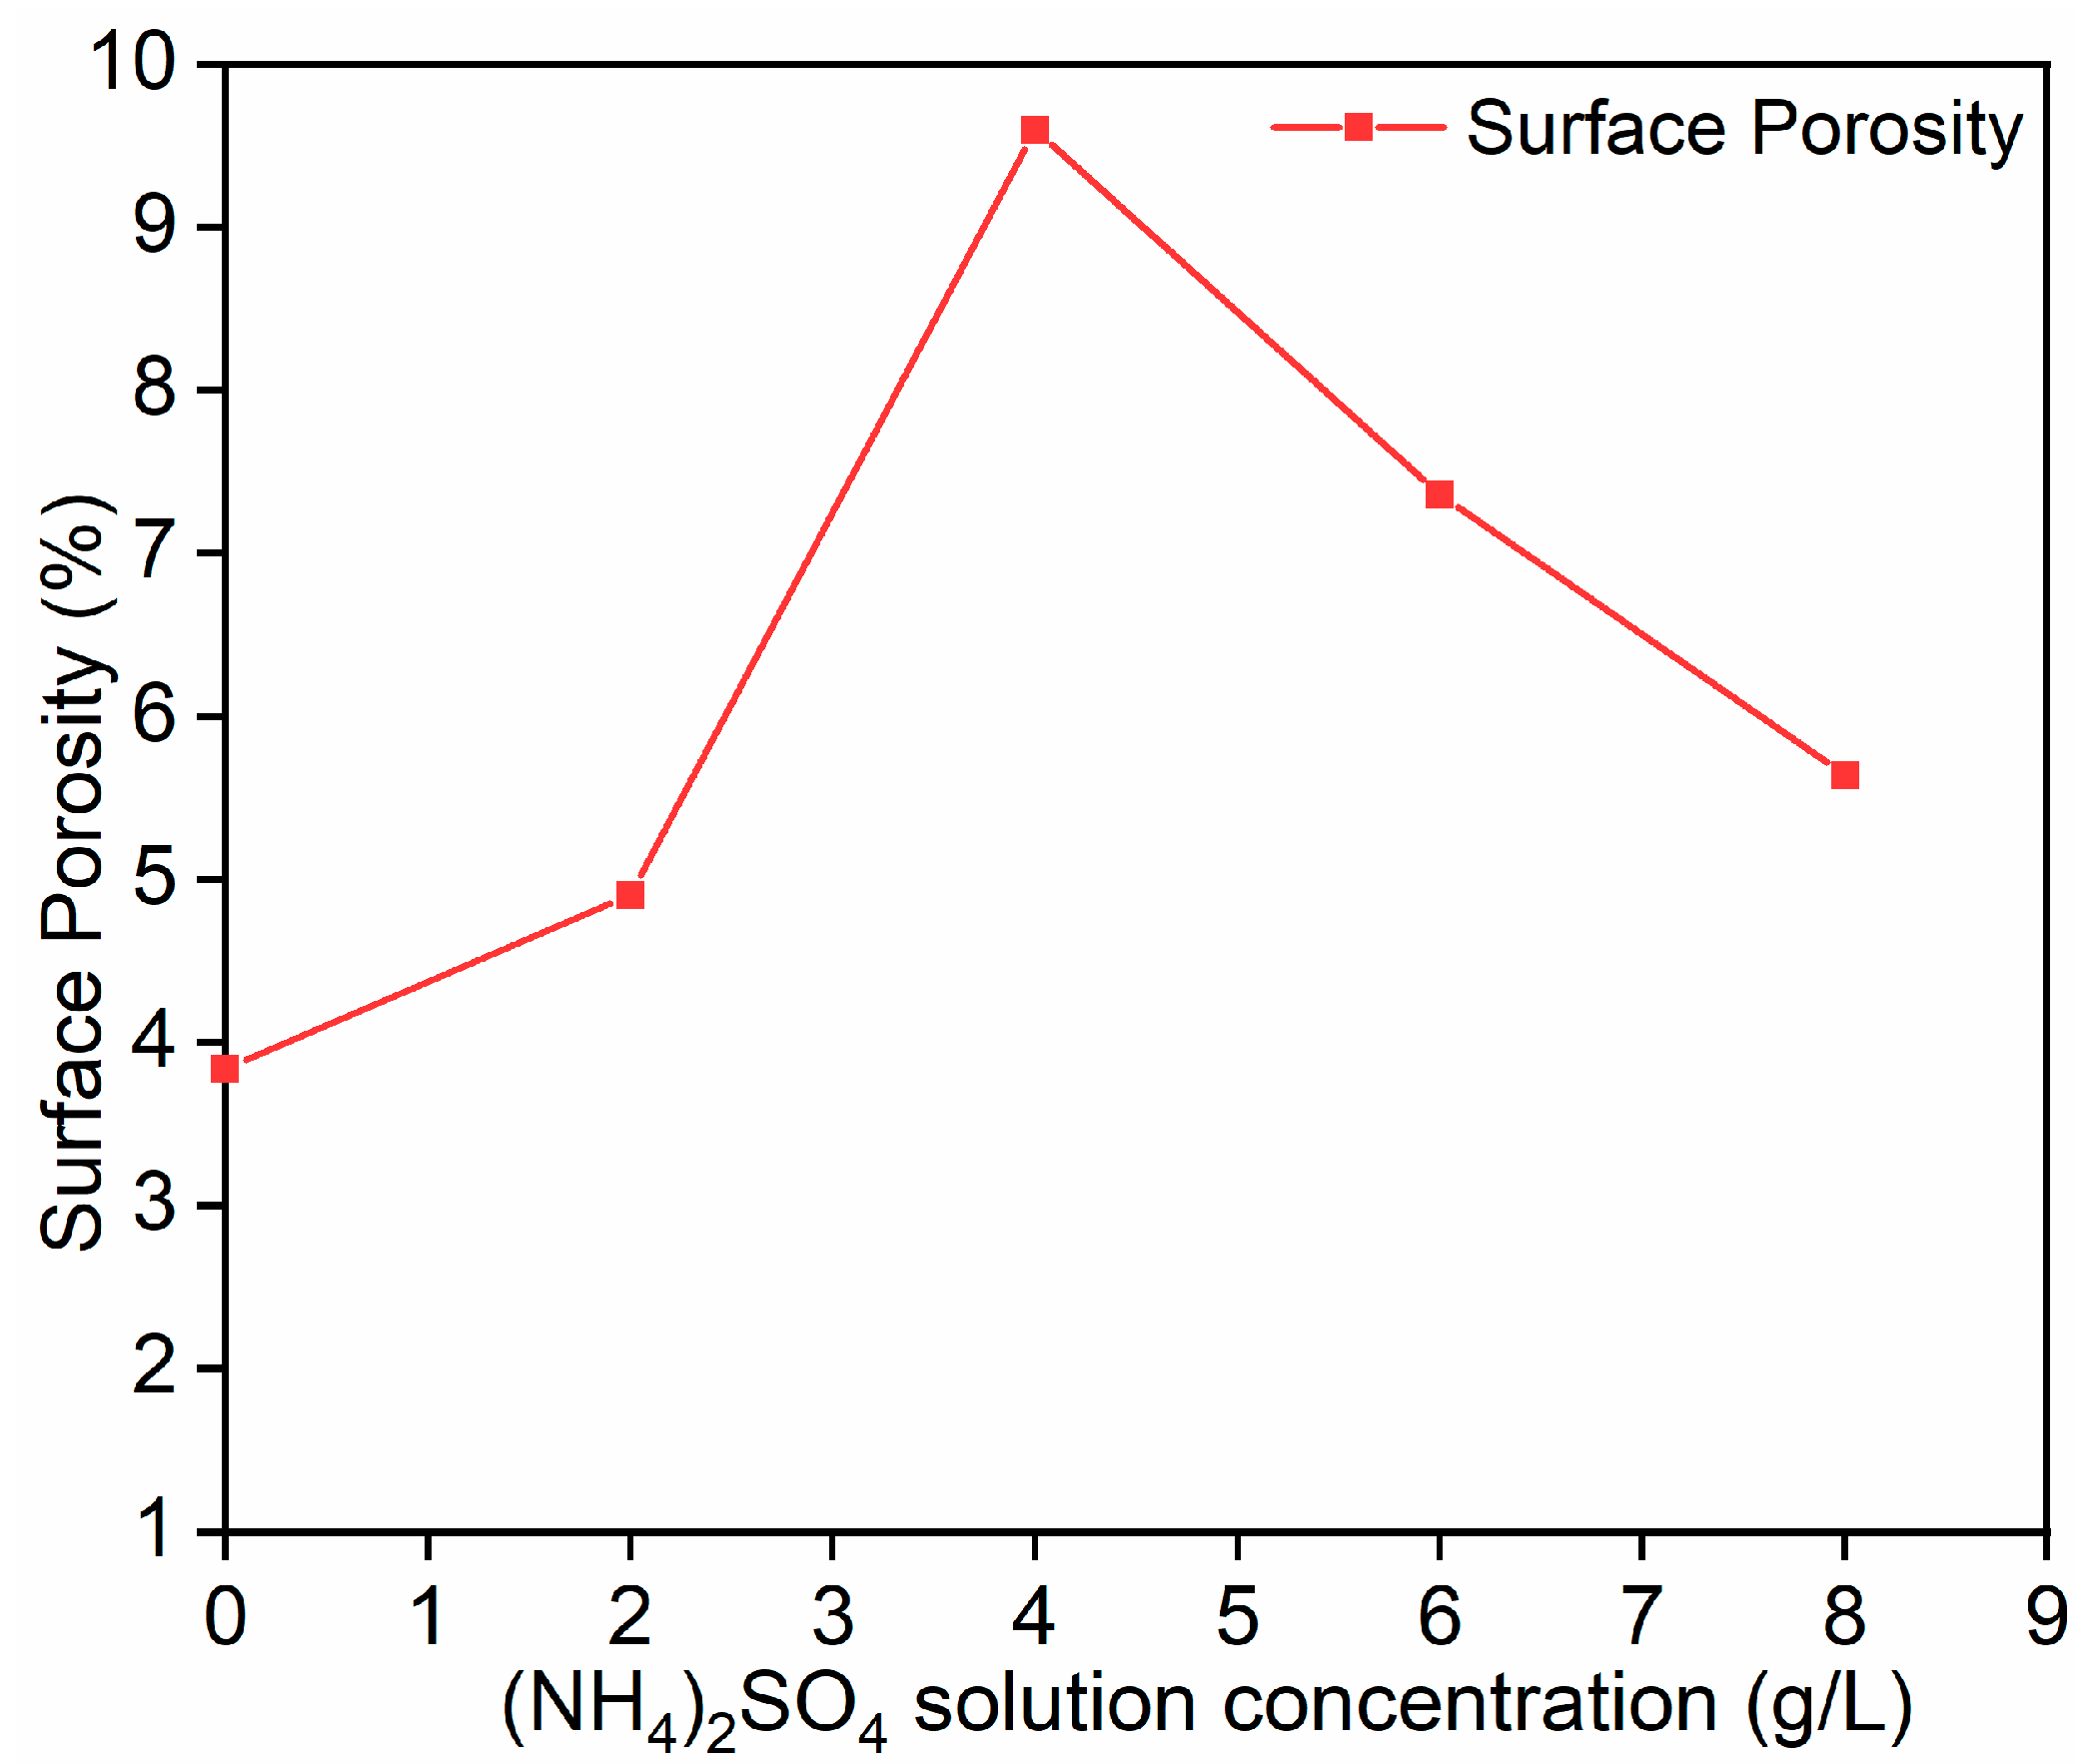
3 was assessed by processing images of the leaching samples with a particle size of 0.0650 mm using ImageJ2x software. The porosity of the surface was calculated, and based on the porosity values, the beryllium leaching effect was reevaluated. In
Figure 13, the images numbered (a) to (e) show leaching samples with (NH
4)
2SO
4 solution concentrations of 0 g/L, 2 g/L, 4 g/L, 6 g/L, and 8 g/L, respectively. The porosity calculated by ImageJ2x is presented in
Figure 14.
Based on
Figure 13 and
Figure 14, it can be observed that the porosity of the mineral reaches its maximum value when the concentration of (NH
4)
2SO
4 is 4 g/L. At this concentration, the leaching rate of beryllium also reaches its optimal value. Compared to when the concentration of (NH
4)
2SO
4 is 0 g/L, the porosity increases by 60%. Therefore, it can be concluded that when the (NH
4)
2SO
4 solution is at 4 g/L and the particle size is 0.065 mm, the mineral surface has more void structures, the structure is loose, the ion-exchange reactions are more sufficient, and the beryllium leaching rate is higher. As shown in
Figure 12c, there are clearly a large number of pores on the mineral surface, and the mineral particles are loose and porous.


