Abstract
This research investigates the engineering properties of sandstone through tests performed prior to and following heat treatment. This study concentrated on evaluating the physical and mechanical properties, such as density, compressive strength, and wave velocities, in conjunction with the mineralogical, Cerchar hardness, and basic geochemical characteristics of the rock. Heat treatment was conducted at different temperatures (35 °C, 200 °C, 400 °C, 600 °C, and 800 °C), followed by analyses utilizing X-ray fluorescence (XRF), thin section analysis, and scanning electron microscopy (SEM) techniques. The results were analyzed to assess the influence of heat treatment on rock properties, utilizing Design Expert software for data evaluation. Numerical analysis with FLAC3D was conducted to validate the observed values at various temperature levels, further investigating the impact of the treatment on the engineering properties of sandstone. A significant finding was the reduction in strength, particularly correlated with a decrease in primary wave velocity, which is associated with an uneven distribution of strength within the rock. Increased temperature results in stress concentrations that facilitate crack formation, while variations in grain size significantly influence crack propagation. This study highlights the substantial influence of temperature on the compressive strength and general material properties of sandstone.
1. Introduction
Rocks, composed of mineral aggregates, form most of the Earth’s crust and play a critical role in various geological and engineering processes. These rocks are classified into three primary types: sedimentary, metamorphic, and igneous, based on their genesis. In mining engineering, however, the focus shifts from their origin to their physical and mechanical properties, which are critical for engineering designs. Sandstone, a sedimentary rock with a coarse-to-fine-grained texture, is composed of sand-sized particles bound by minerals like silica, calcium carbonate, or iron oxides. It exhibits a wide range of variations in texture and physical properties. There is significant literature on the effect of high temperature on different types of rocks. Among these, the granites rank at the top of the list.
Su et al. [1] observed that elevated temperatures cause sudden rock fractures, with kinetic energy increasing up to 300 °C before sharply declining between 300 °C and 700 °C. Similarly, Sheng-Qi et al. [2] noted a decrease in strain up to 600 °C, followed by a rapid increase to 800 °C, resulting in ductile failure and tensile cracks under axial stress. In a study focusing on fine-grained granite [3], it was reported that the stress threshold decreases, leading to crack propagation detected by acoustic emission (AE) signals with the increase in temperature. The porosity of marble increases significantly with temperature, typically in the range of 0.5% to 1.98%, rising by about 202% at 600 °C [4]. Additionally, elevated temperatures lead to the evaporation of water molecules from the minerals [5]. Drawing from experimental data, Vagnon et al. [6] established a fundamental correlation between porosity and temperature while noting that porosity rises by up to 3% at 600 °C. An investigation was conducted on granite through a triaxial compression experiment [7], and a permeability model based on numerical simulations was developed to analyze how heat treatment, up to 800 °C, affects crack-induced permeability fluctuations in granite [8]. Moreover, Young’s modulus decreases as the temperature increases during instances of strain bursts in such samples. Alterations in Young’s modulus and the yield point impact the distribution of strain [9], and, at 800 °C, granite’s stress–strain distribution becomes nonlinear, reaching its yield point. Higher temperatures cause gradual deformation and thermally induced cracks, influencing fracture propagation [10]. The variance in elastic modulus could be attributed to the heightened density of fractures and the development of thermal cracks during the heating process [2]. Also, gradual cooling, for instance, decreases Poisson’s ratio by 25% towards 500 °C, while rapid cooling methods reduce it by 20% up to 300 °C [11]. Li and Liu [8] investigated sandstone for UCS and microscopic properties. Their experimental data, when compared with numerical simulations, reveal a strong correlation. Sun et al. [12] observed distinct phases in the tensile strength behavior of sandstone. The first phase spans from room temperature to 300 °C, during which the tensile strength decreases from 5.69 MPa to 4.62 MPa. The second stage, from 300 °C to 600 °C, witnesses a 53.14% decrease in tensile strength. The third phase, ranging from 600 °C to 800 °C, shows minimal reduction in tensile strength, considered an intermediate phase for sandstone. From 800 °C to 900 °C, the tensile strength rapidly declines by 73.32%, due to varying mineral expansions and water evaporation, which causes crack formation. While temperature increases strengthen the rock up to 500 °C, beyond that, weakening effects dominate tensile strength [13]. Fan et al. [14], through scanning electron microscopy, revealed density variations and fluctuations in p-wave velocity (vp) and dynamic energy up to 800 °C. The findings show, that as temperature rises, the rock’s internal structure becomes more complex, resulting in gradual damage, as supported by [3]. Numerous models, as outlined by Yagiz [15], correlate vp with other mechanical properties of rocks. Mohd-Nordin and Mohamed [16], categorized vp in granite as follows: below 2.5 km/s (extremely low), 2.51–3.5 km/s (low), 3.51–4 km/s (moderate), 4.1–5 km/s (high), and above 5 km/s (very high). Before thermal treatment, the standard deviation of vp is found to be minimal [5]. The decline in vp is mainly due to the expansion of pore volume and initial fractures from water evaporation as temperature rises. However, as the temperature continues to increase, crystalline growth in granite reduces fracture formation, leading to a slower decline in vp, as explained by Chen et al. [17]. In sandstone, Poisson’s ratio decreases linearly from 0.248 to 0.211 up to 400 °C, but increases to 0.292 at 800 °C due to the heterogeneity of the rock [18].
Sandstone shows distinct behavior, with peak strain increasing by 68% compared with marble and granite [1]. The density of rocks decreases gradually after heat treatment [4], as high temperatures weaken molecular bonds, causing the rock density to decrease. Significant weight loss occurs between 600 °C and 800 °C, leading to noticeable density changes [5]. At high temperatures, an acidic solution significantly impacts the physical, mechanical, and microstructural properties of red sandstone, notably affecting its mass, porosity, vp, thermal conductivity, and strength [19]. Below 1100 °C, the glossiness and porosity of yellow sandstone increases, while conductivity, hardness, and color brightness decrease due to the melting of the binder. Above 1100 °C, the melting of clay minerals, quartz, and feldspar particles causes a significant increase in brightness and hardness. [20]. In rock engineering, rock masses may experience thermal stress due to sudden temperature changes, a phenomenon known as thermal shock [21]. High temperatures significantly affect the porosity of red sandstone, and understanding this impact is essential for applications like coal mining with underground gasification, geothermal energy, and deep burial of nuclear waste [22,23].
Yang et al. [24] exposed sandstone blocks to temperatures of up to 800 °C and show a direct correlation between temperature increase and rock failure and crack formation along the sidewalls of the pre-drilled sections. Numerical simulations show a strong link between the rate of temperature increase and crack formation. At around 400 °C, sandstone exhibits brittle failure, marked by macroscopic fracture patterns. Jiang and Jiang [25] studied the behavior of sandstone up to 700 °C to find changes in permeability and crack propagation through microscopic and numerical analysis for fracture angles. Li et al. [26] subjected sandstone to heat treatment up to 800 °C and show that thermal expansion of rock particles increases density and alters deformation resistance. However, beyond 500 °C, the mechanical properties deteriorate, causing hot cracking in the sandstone specimens.
A review of previous research on effects of temperature on physico-mechanical properties of sandstone is summarized in Table 1.

Table 1.
Detailed review on the effects of temperature on different sandstone rock types.
Despite such cited research, there is a notable lack of studies focusing on sandstone from India, a region with unique and diverse geological settings. The mineral composition, texture, and mechanical properties of Indian sandstone differ from those studied in other parts of the world, making it essential to investigate its behavior under heat treatment in the Indian context. Moreover, there are no studies on the effect of temperature on the cutting characteristics of the sandstone. With its spectrum spanning from fine-grained to coarse-grained textures, the physico-mechanical properties of sandstone render it versatile for diverse applications, ranging from dimensional stone usage to construction and ornamentation. Notably, sandstone holds significance in coal mines, frequently constituting a substantial portion of the geological layers. In mining operations, understanding the behavior of sandstone becomes crucial, particularly when it comprises the roofs of coal mines accompanied by the spontaneous combustion of coal. Also, the recent efforts in underground coal gasification (UCG) have given a new dimension to excavation and cuttability in fiery seams and can be a challenging task during actual operations. Given its widespread use, understanding how heat treatment influences the physical, chemical, and dynamic properties of sandstone is crucial, especially its abrasive nature, which has significant implications for mining operations, particularly in the mechanical cutting domain.
The variability in mineral content and geological history across different regions of India means that sandstone from these areas could exhibit unique properties not captured in the previous research. Therefore, there is a need for studies that focus on the heat treatment effects on sandstone from India, particularly its physical, chemical, and dynamic properties, to fill this knowledge gap. Thus, a comprehensive study was undertaken to evaluate the impact of heat on the microscopic, sub-microscopic, chemical, and physical properties (both static and dynamic) of sandstone samples, with validation through numerical modeling results. The hardness characteristics identified through the Cerchar hardness test are unique to this paper.
2. Materials and Methods
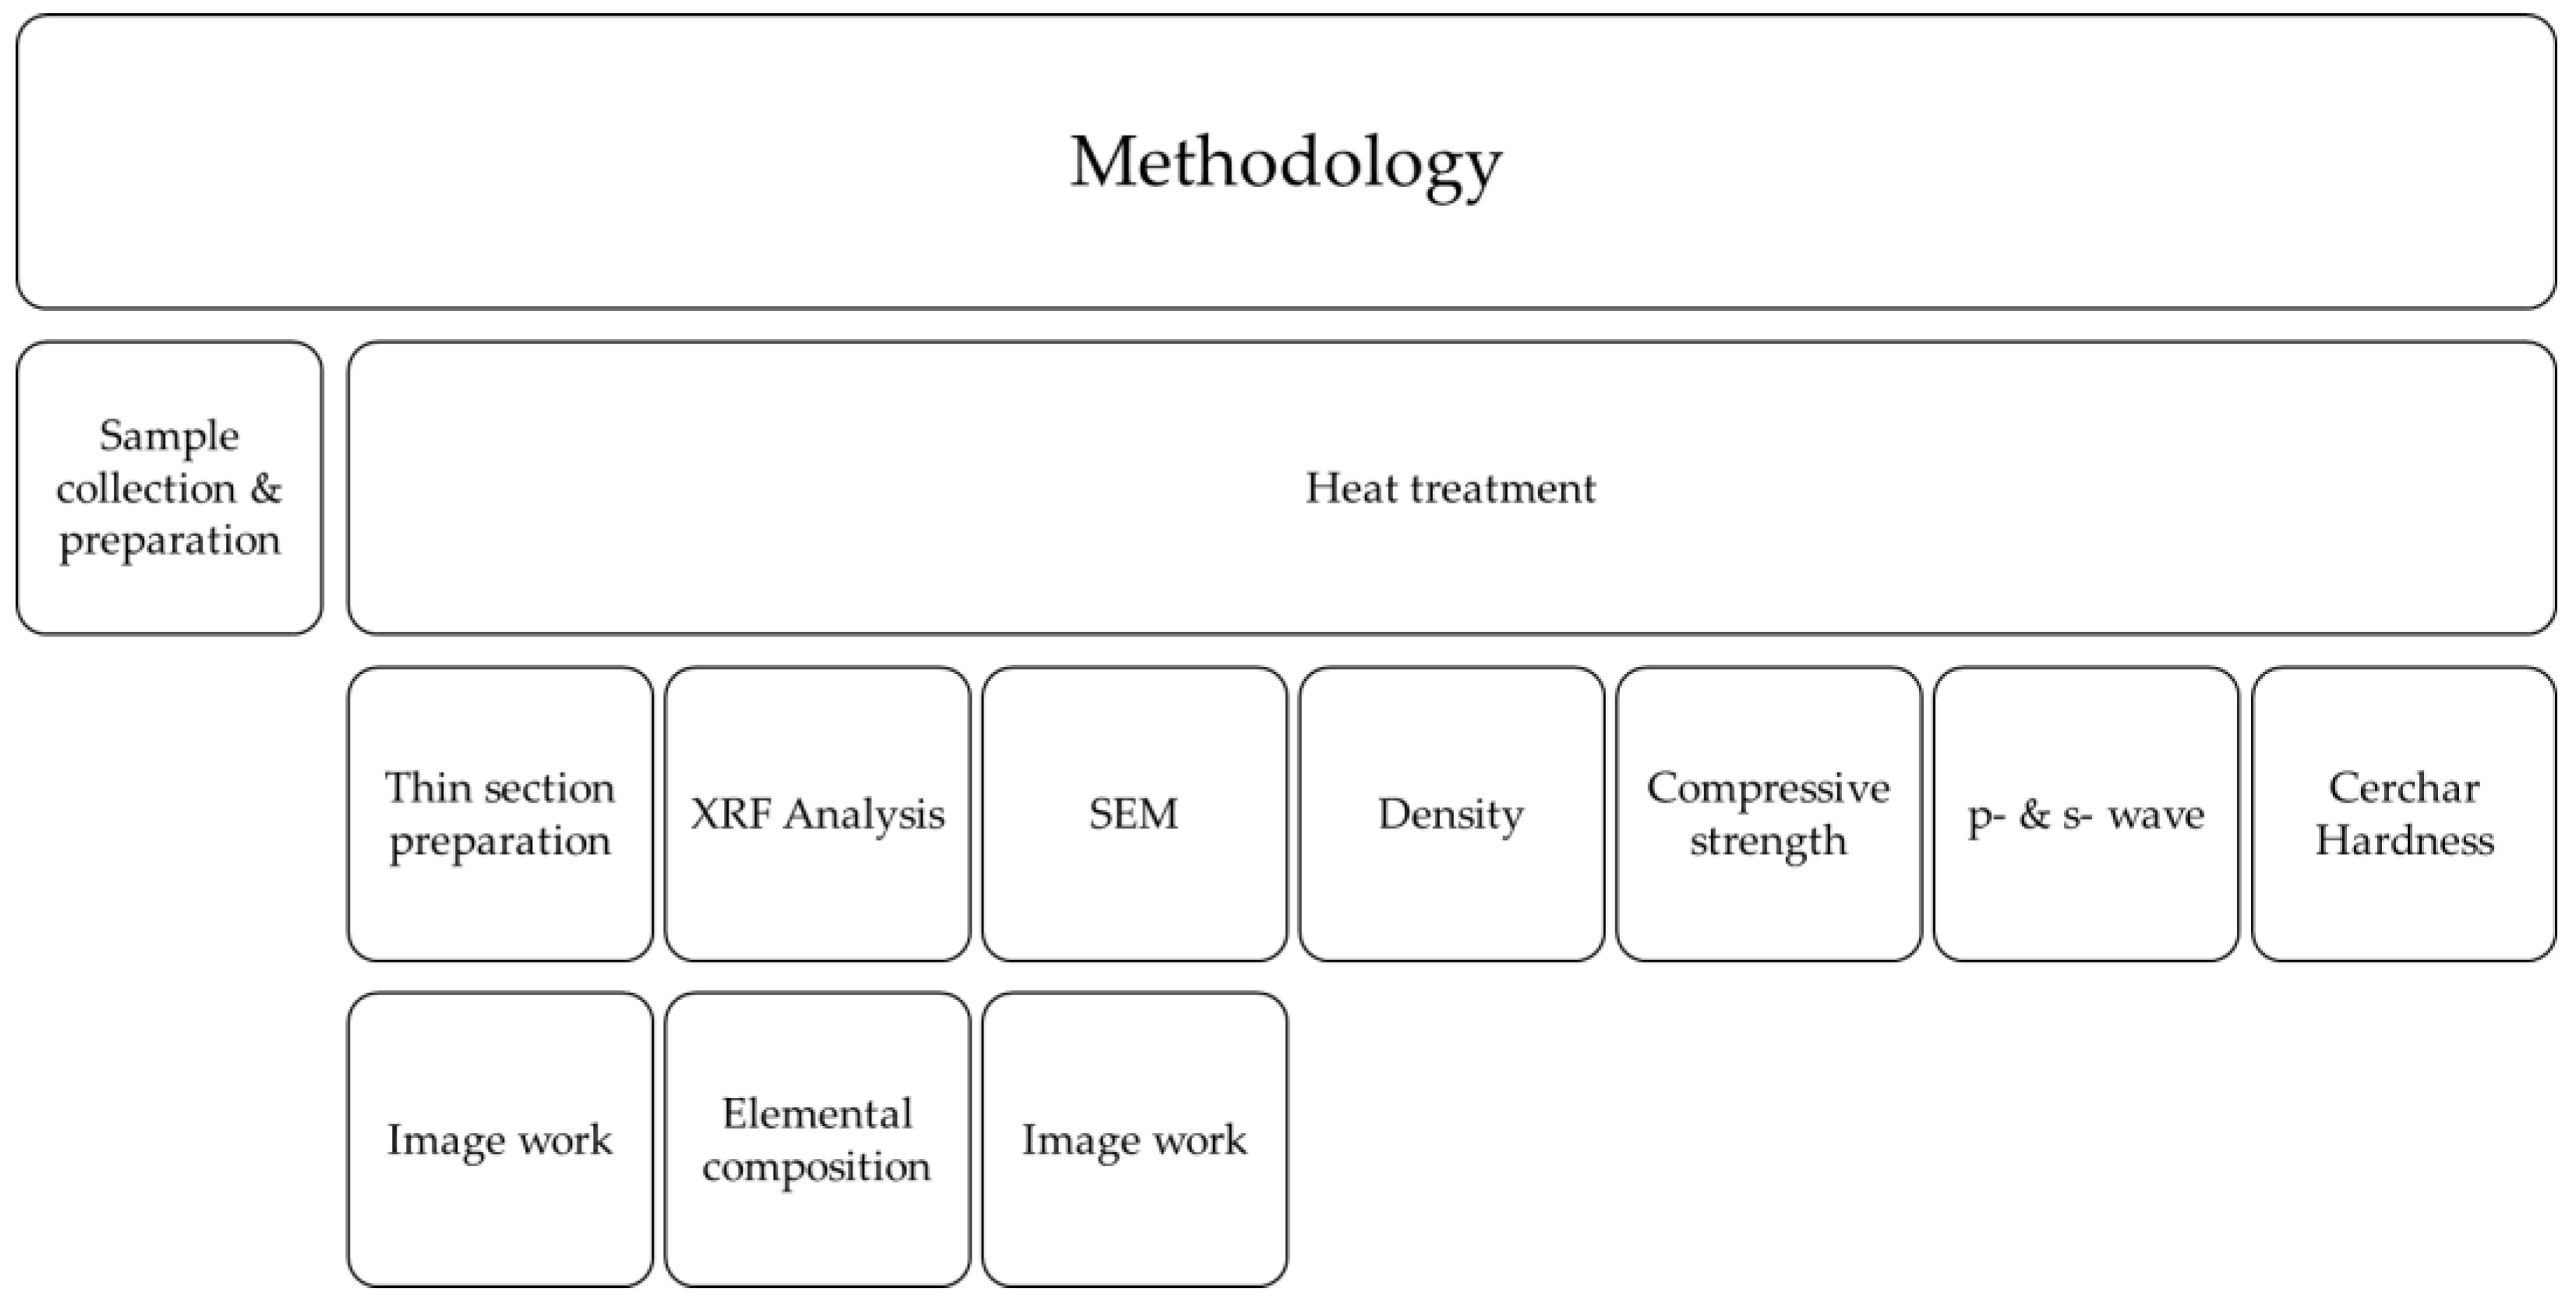
The methodology used in the analysis involved the collection and organization of samples, sample preparation, heat treatment, testing, and observations on various properties of rocks with heat treatment and analysis as explained further, as shown in Figure 1.
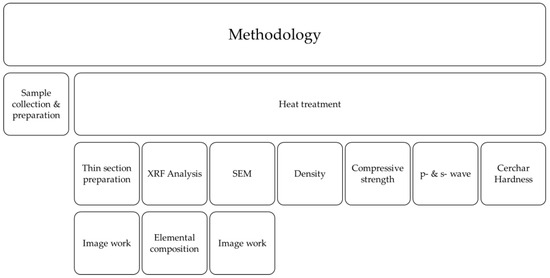
Figure 1.
The methodology used in this research study.
2.1. Collection of Sandstone Sample and Preparation
The sandstone core samples used in this study were obtained from the Birbhum Coal Mines located in West Bengal, India. These specimens were sourced from various depths ranging from cores between 174 m to 668 m, ensuring a diverse representation of geological conditions. A total of 85 sandstone samples were prepared for testing. The framework minerals of sandstone were composed of quartz, and feldspar minerals with silica and calcium carbonate as cement. Minor amounts of micaceous minerals could also be identified from the samples.
The preparation process adhered to the guidelines laid out by the International Society for Rock Mechanics and Rock Engineering (ISRM). The samples were carefully cut and polished to standardized dimensions, with a diameter of 54 mm and a length of 100 mm. This uniform size was essential for consistent testing across all samples. The samples were categorized into four distinct groups based on their grain structure and density: (i) coarse-grained sandstone with an average density of 2087 kg/m3, (ii) medium-grained sandstone with an average density of 2303 kg/m3, (iii) fine-grained sandstone with an average density of 2390 kg/m3, and (iv) intercalated sandstone consisting of intercalation shale and sandstone with a density of 2390 kg/m3.
2.2. Testing Procedure
The heat treatment of the samples was performed using a box-type muffle furnace, with a range of temperature between 50 °C and 1200 °C. The furnace provided precise temperature control, ensuring accurate heating conditions for the experiment. During the heating phase, the temperature was increased at a rate of 30 °C per minute, allowing for a controlled and rapid advancement to the target temperatures. The temperature range selected for this experiment extended from an ambient room temperature of 35 °C up to 800 °C to investigate the impact of temperature on the material properties. Additionally, microscopic analyses using X-ray fluorescence (XRF), scanning electron microscopy (SEM), and thin-section microscopy were also carried over to determine microstructural and chemical changes before and after heat treatment, providing insights into the effects of thermal exposure on the rocks exposed at various temperatures.
2.3. Testing Principles
The physical properties such as length, diameter, and mass of the samples were recorded before and after heating. Mass and density measurements, using digital weighing and water displacement, are key to assessing the impact of heat treatment on sandstone samples. These methods, along with rate calculations, reveal changes in physical properties due to thermal exposure. The compressive strength of samples was determined in the laboratory using standard testing procedures. The Sonic Viewer 170 (model 5228) was employed to measure wave properties, using p-wave and s-wave transducers for velocity analysis.
The Cerchar hardness index [27], commonly referred to as CHI, measures the resistance or surface hardness of the material to the penetration of a tipped tool and is useful for proper tool and machinery selection in mechanical excavations. Drilling rates can also be determined from the index. The test involves the determination of depth of penetration while using a tungsten carbide bit of 8.5 mm diameter on a rock specimen under a load of 400 N with a bit speed (rotation) of 200 rpm. The record of depth of penetration with time and its history allows the determination of the CHI from the slope of the standard penetration curve.
2.4. Analysis of Variance (ANOVA)
The results from various methods were evaluated using analysis of variance (ANOVA) [28], a statistical technique designed to identify significant differences among the means of three or more groups. By comparing the variability within groups to the variability between groups, ANOVA determines whether the observed differences in the group means are statistically significant or likely due to random chance. In this analysis, the temperature was treated as the numeric factor and the rock type as the categorical factor in the analysis. The analysis was used to derive various equations of multivariate nature for the property changes in the rock samples upon heating.
3. Experimental Results and Analysis
3.1. Analysis of Microscopic Changes
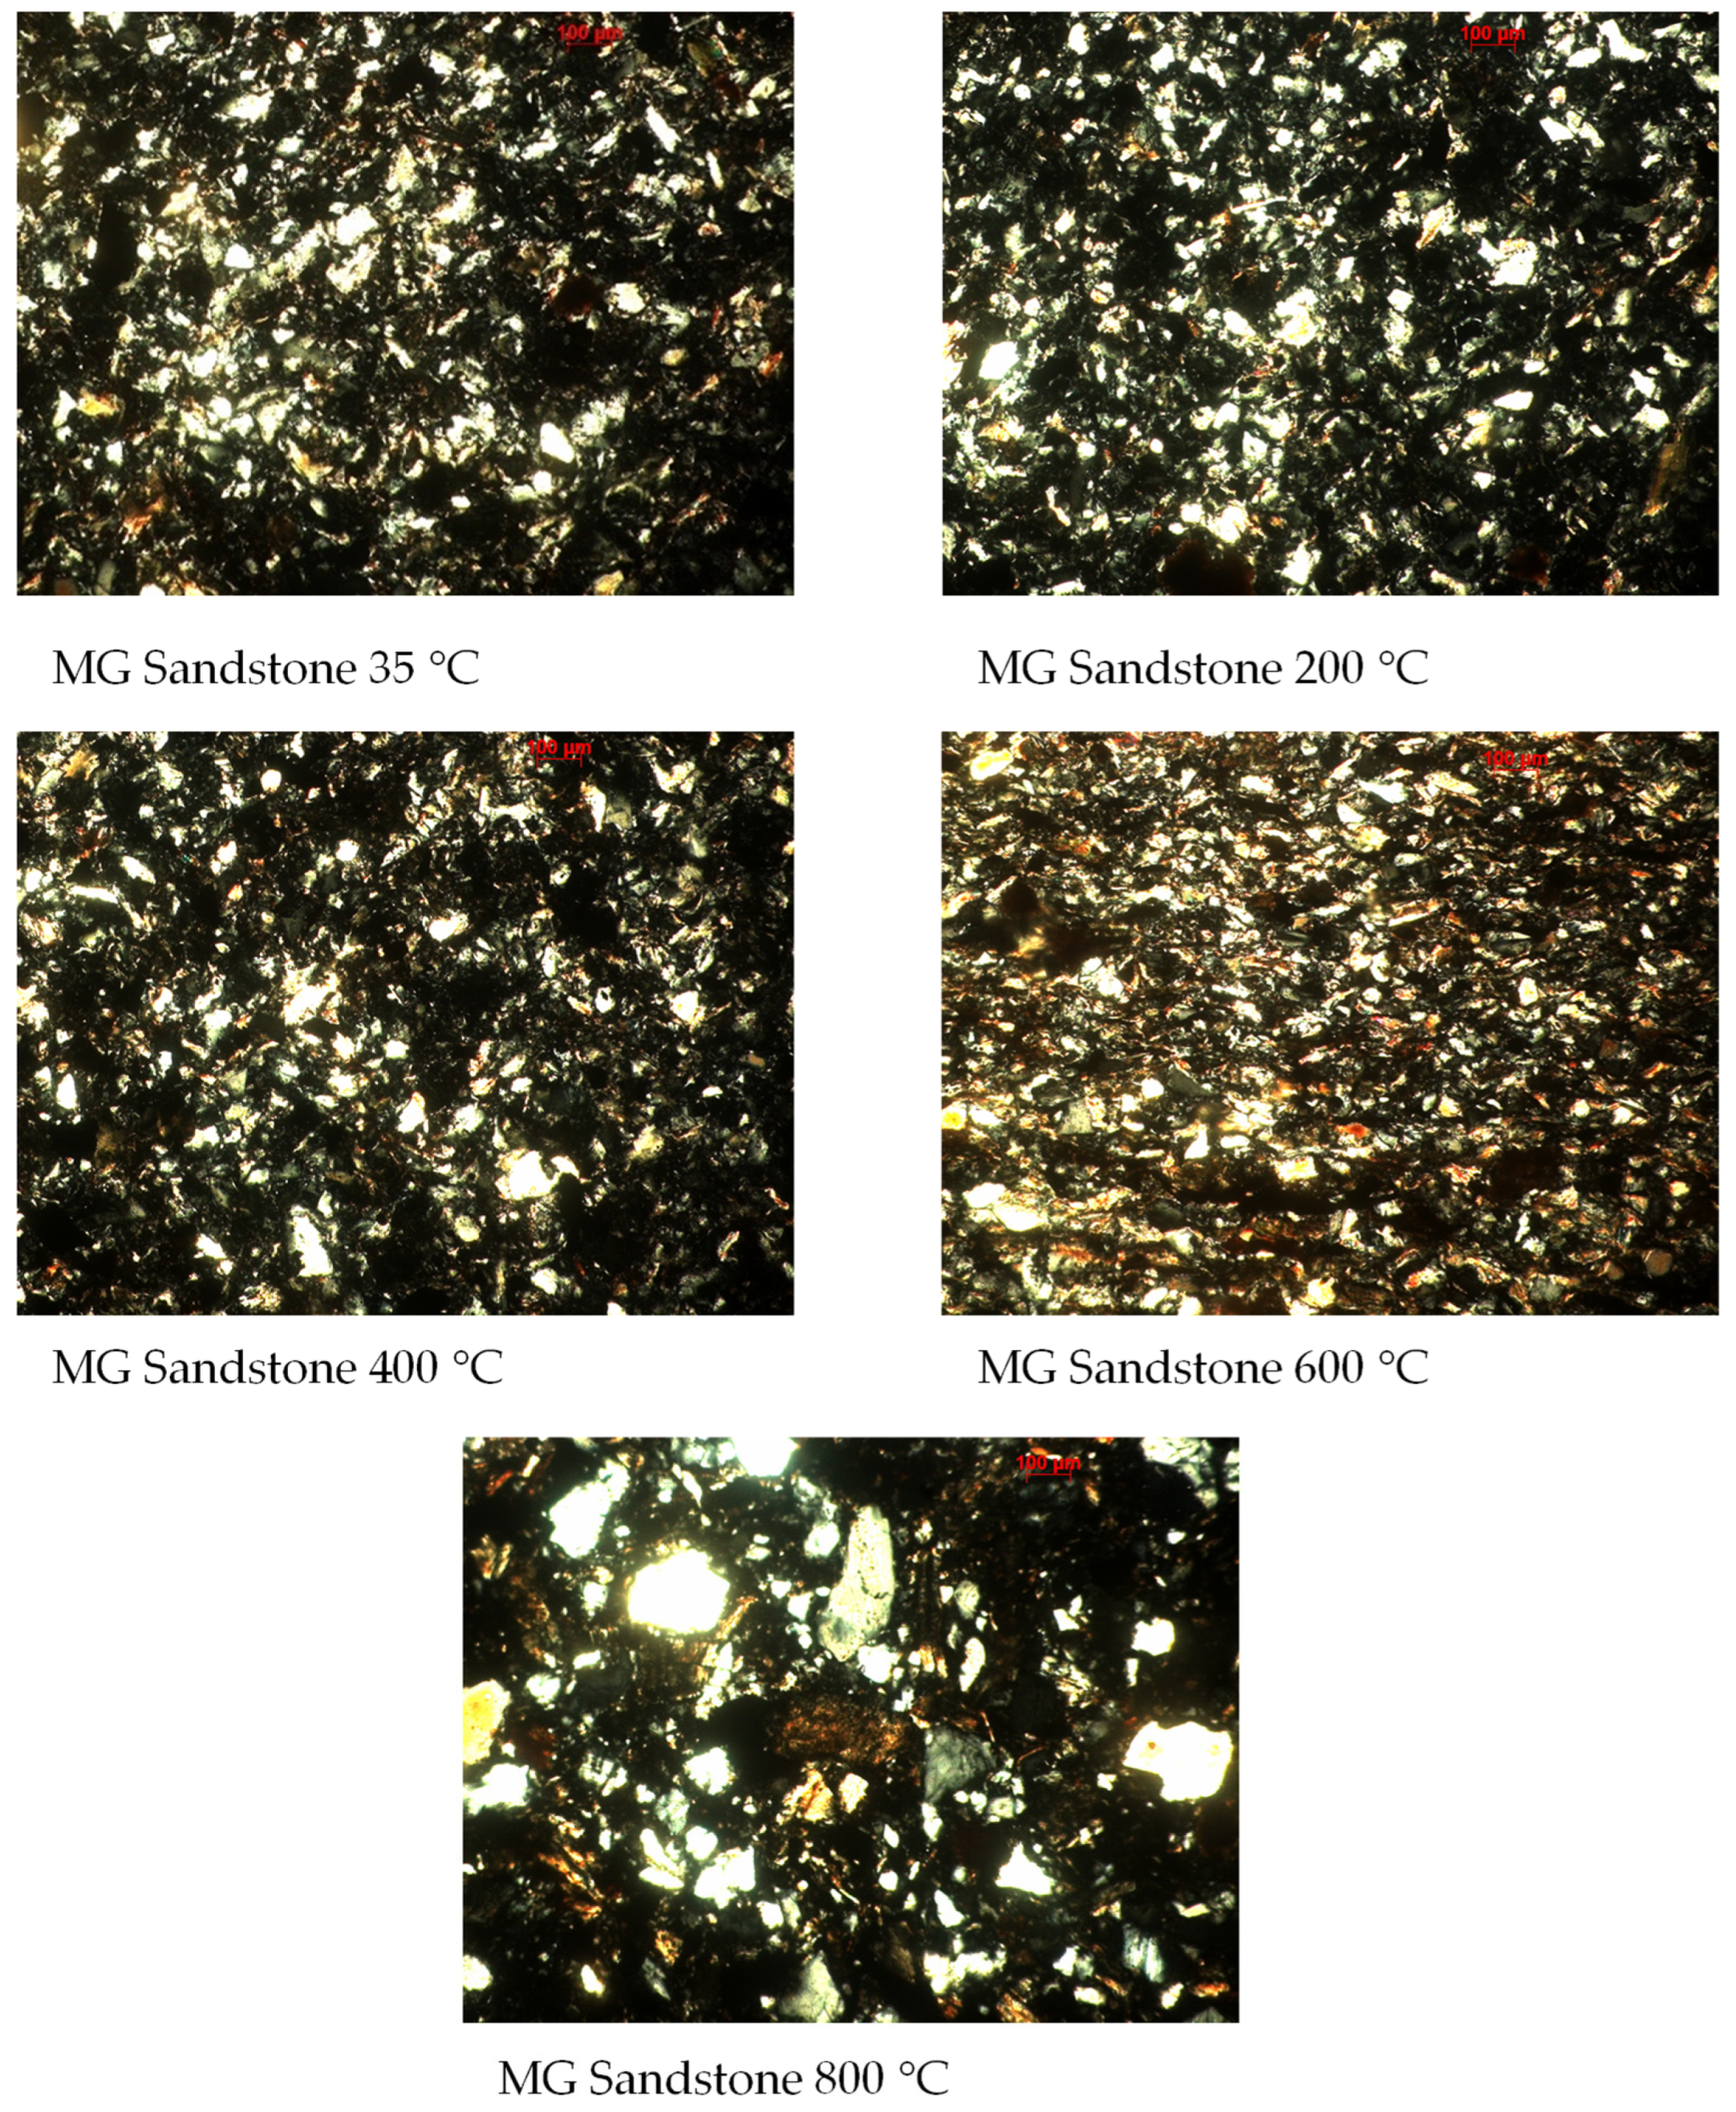
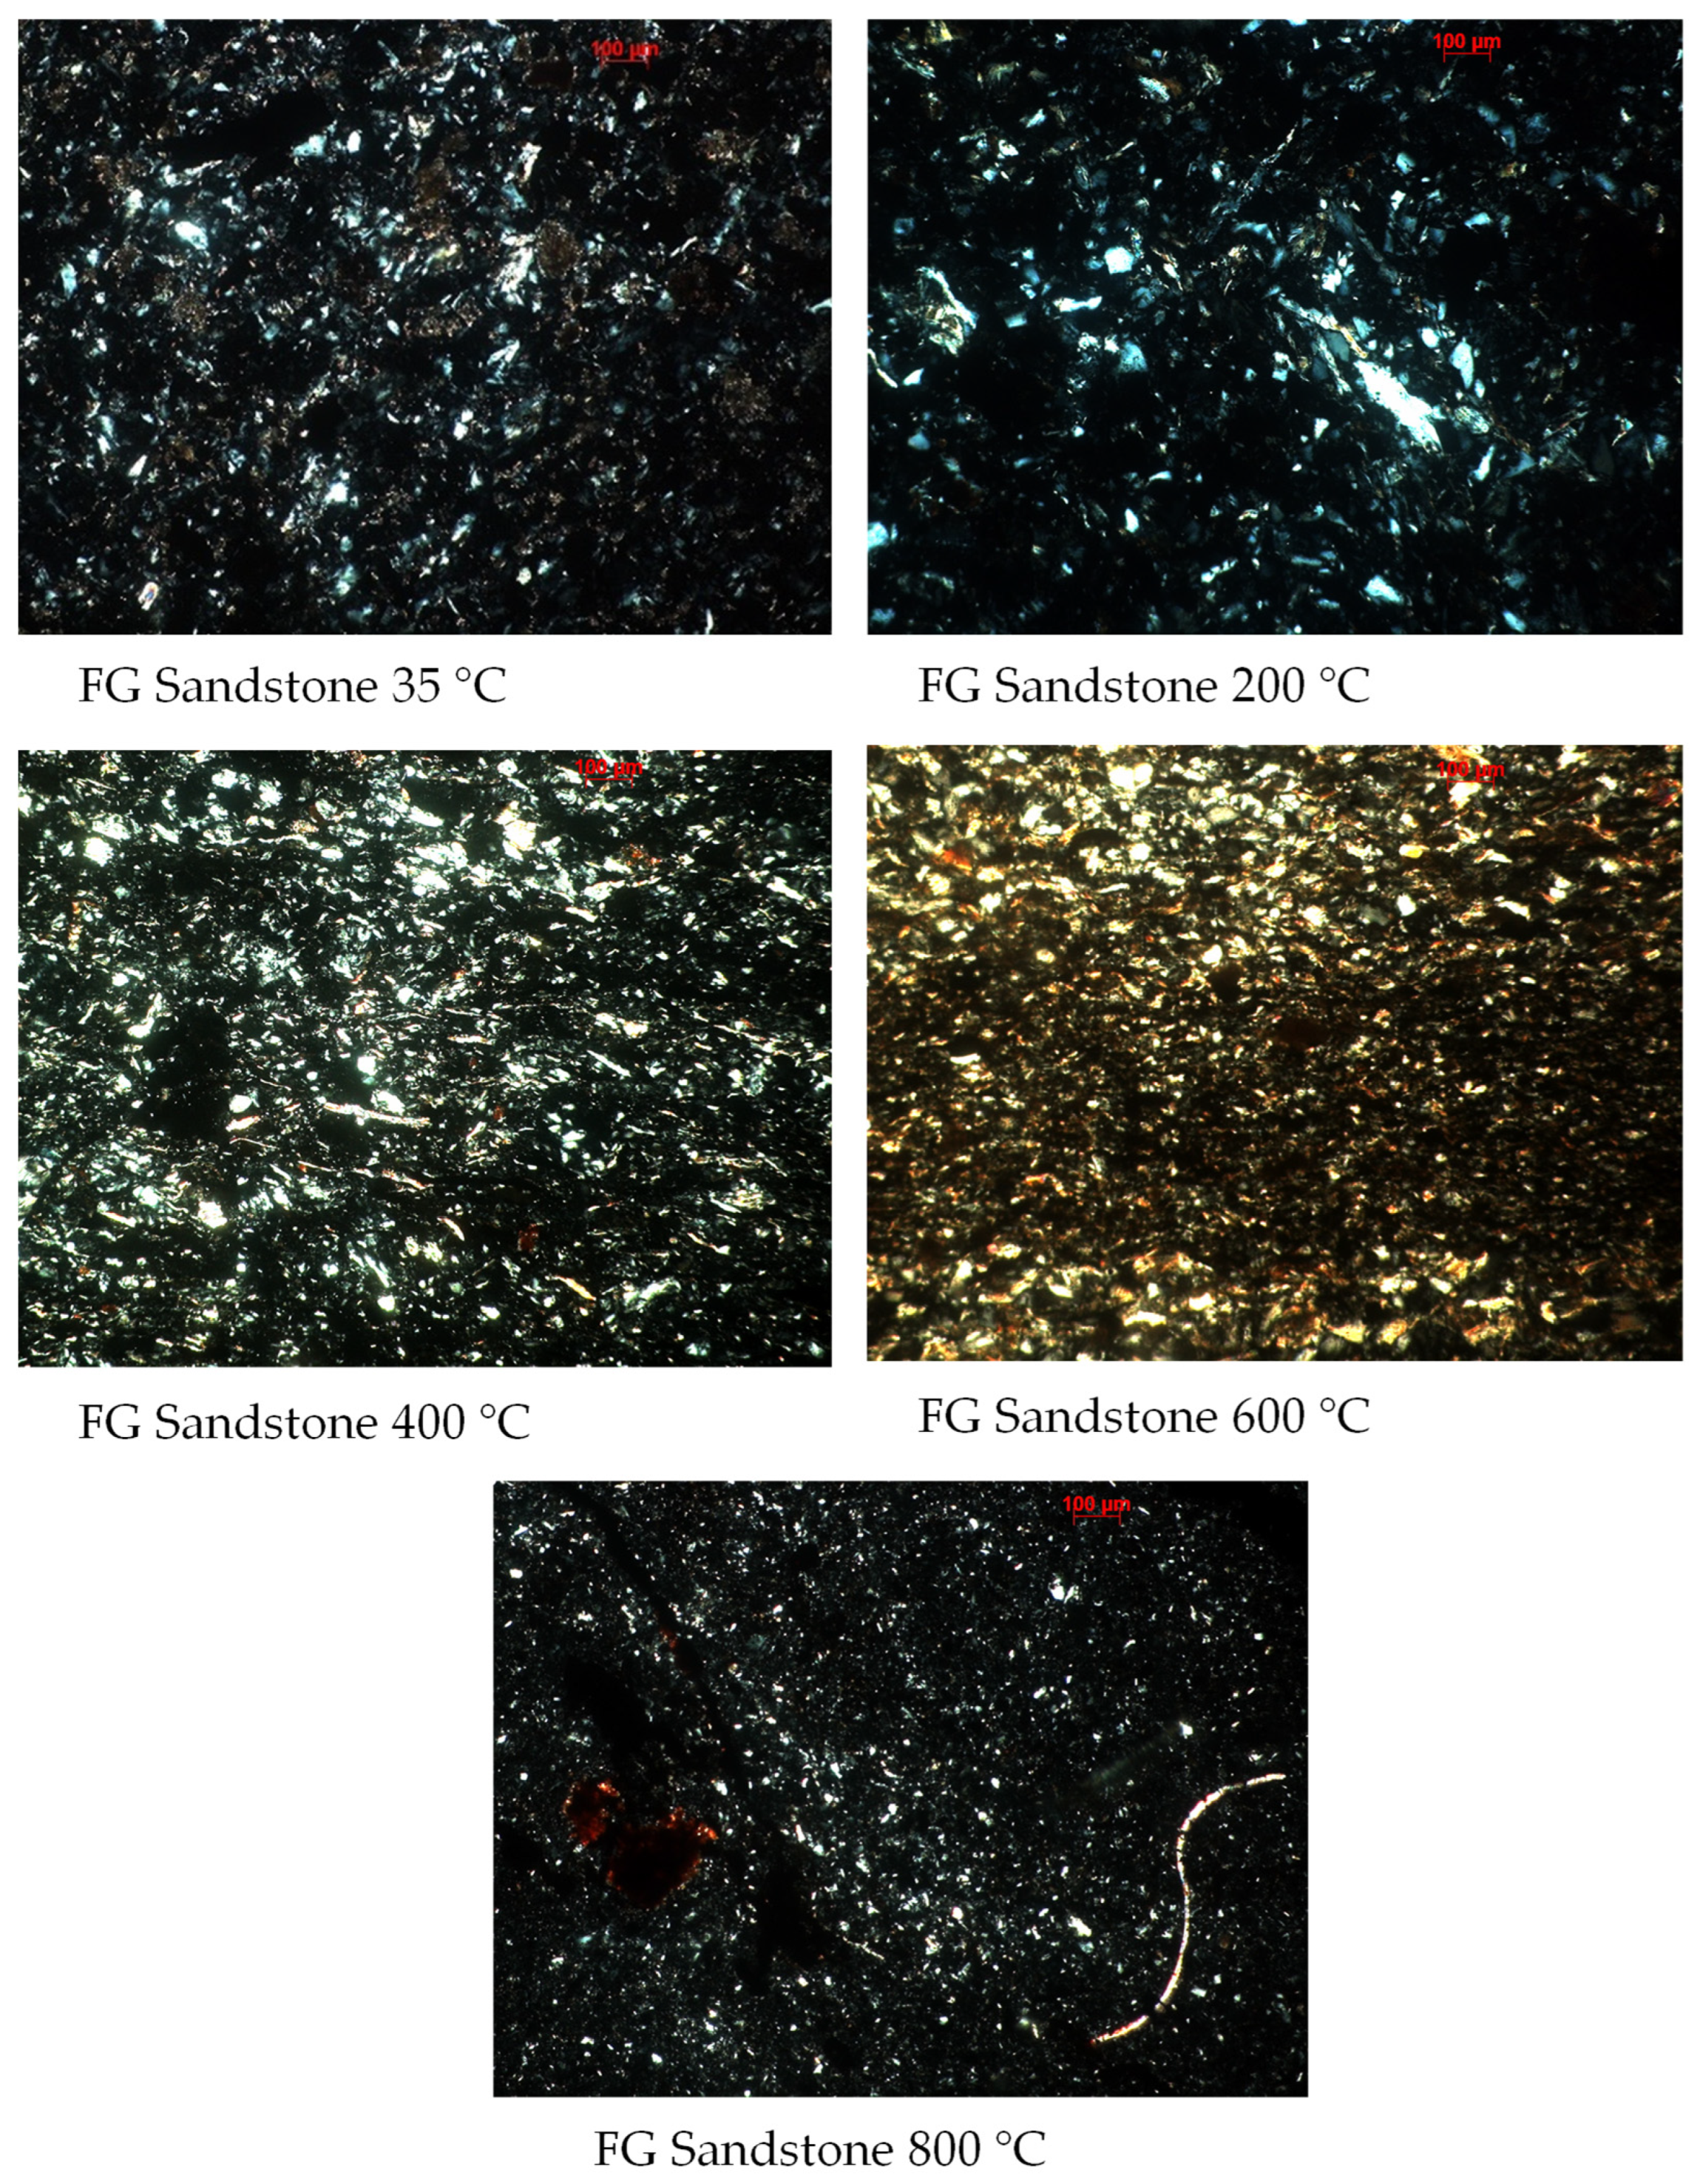
The microscopic analyses of coarse-grained sandstone and medium-grained sandstone are shown in Figure 2, Figure 3 and Figure 4, which detail the thin-section studies conducted at magnifications of 100 µm and 500 µm. Thin-section analysis examined the mineral composition, texture, sorting, pore type, and the quantity of pore-filling cements. The images reveal that the samples’ structures predominantly comprised uniformly sized grains, with a few larger interspersed ones. These also show a slightly stretched crystal and parallel arrangement of these larger grains. At 200 °C, a cluster of quartz grains with interference colors emerged, characterized by their transparency and a color spectrum ranging from white to medium gray. By 400 °C, the onset of cracks and damage was observed, initially appearing as small somewhat indistinct microcracks. As the heating continued, these microcracks became more pronounced, and a secondary crack began to develop. By 800 °C, distinct cracks were clearly visible, along with the emergence of additional microcracks. The analysis revealed that changes in microstructure and texture become prominent with the increase in temperature.
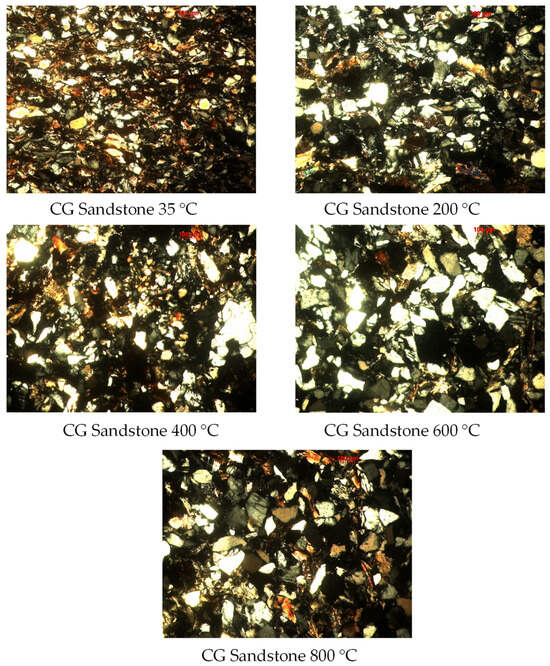
Figure 2.
Thin-section images of the coarse-grained sandstone (scale: 100 μm).
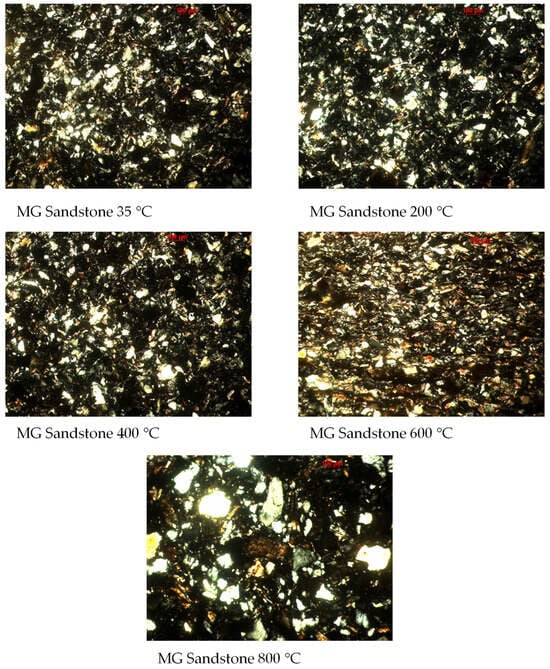
Figure 3.
Thin-section images of the medium-grained sandstone (scale: 100 μm).
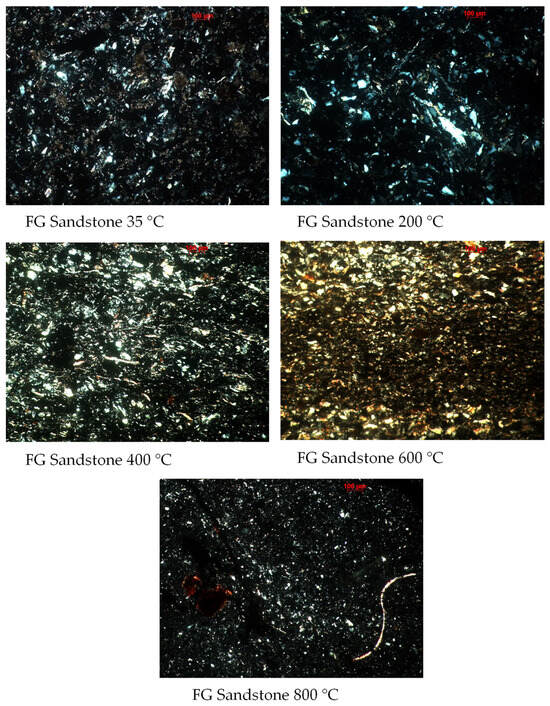
Figure 4.
Thin-section images of the fine-grained sandstone (scale: 100 μm).
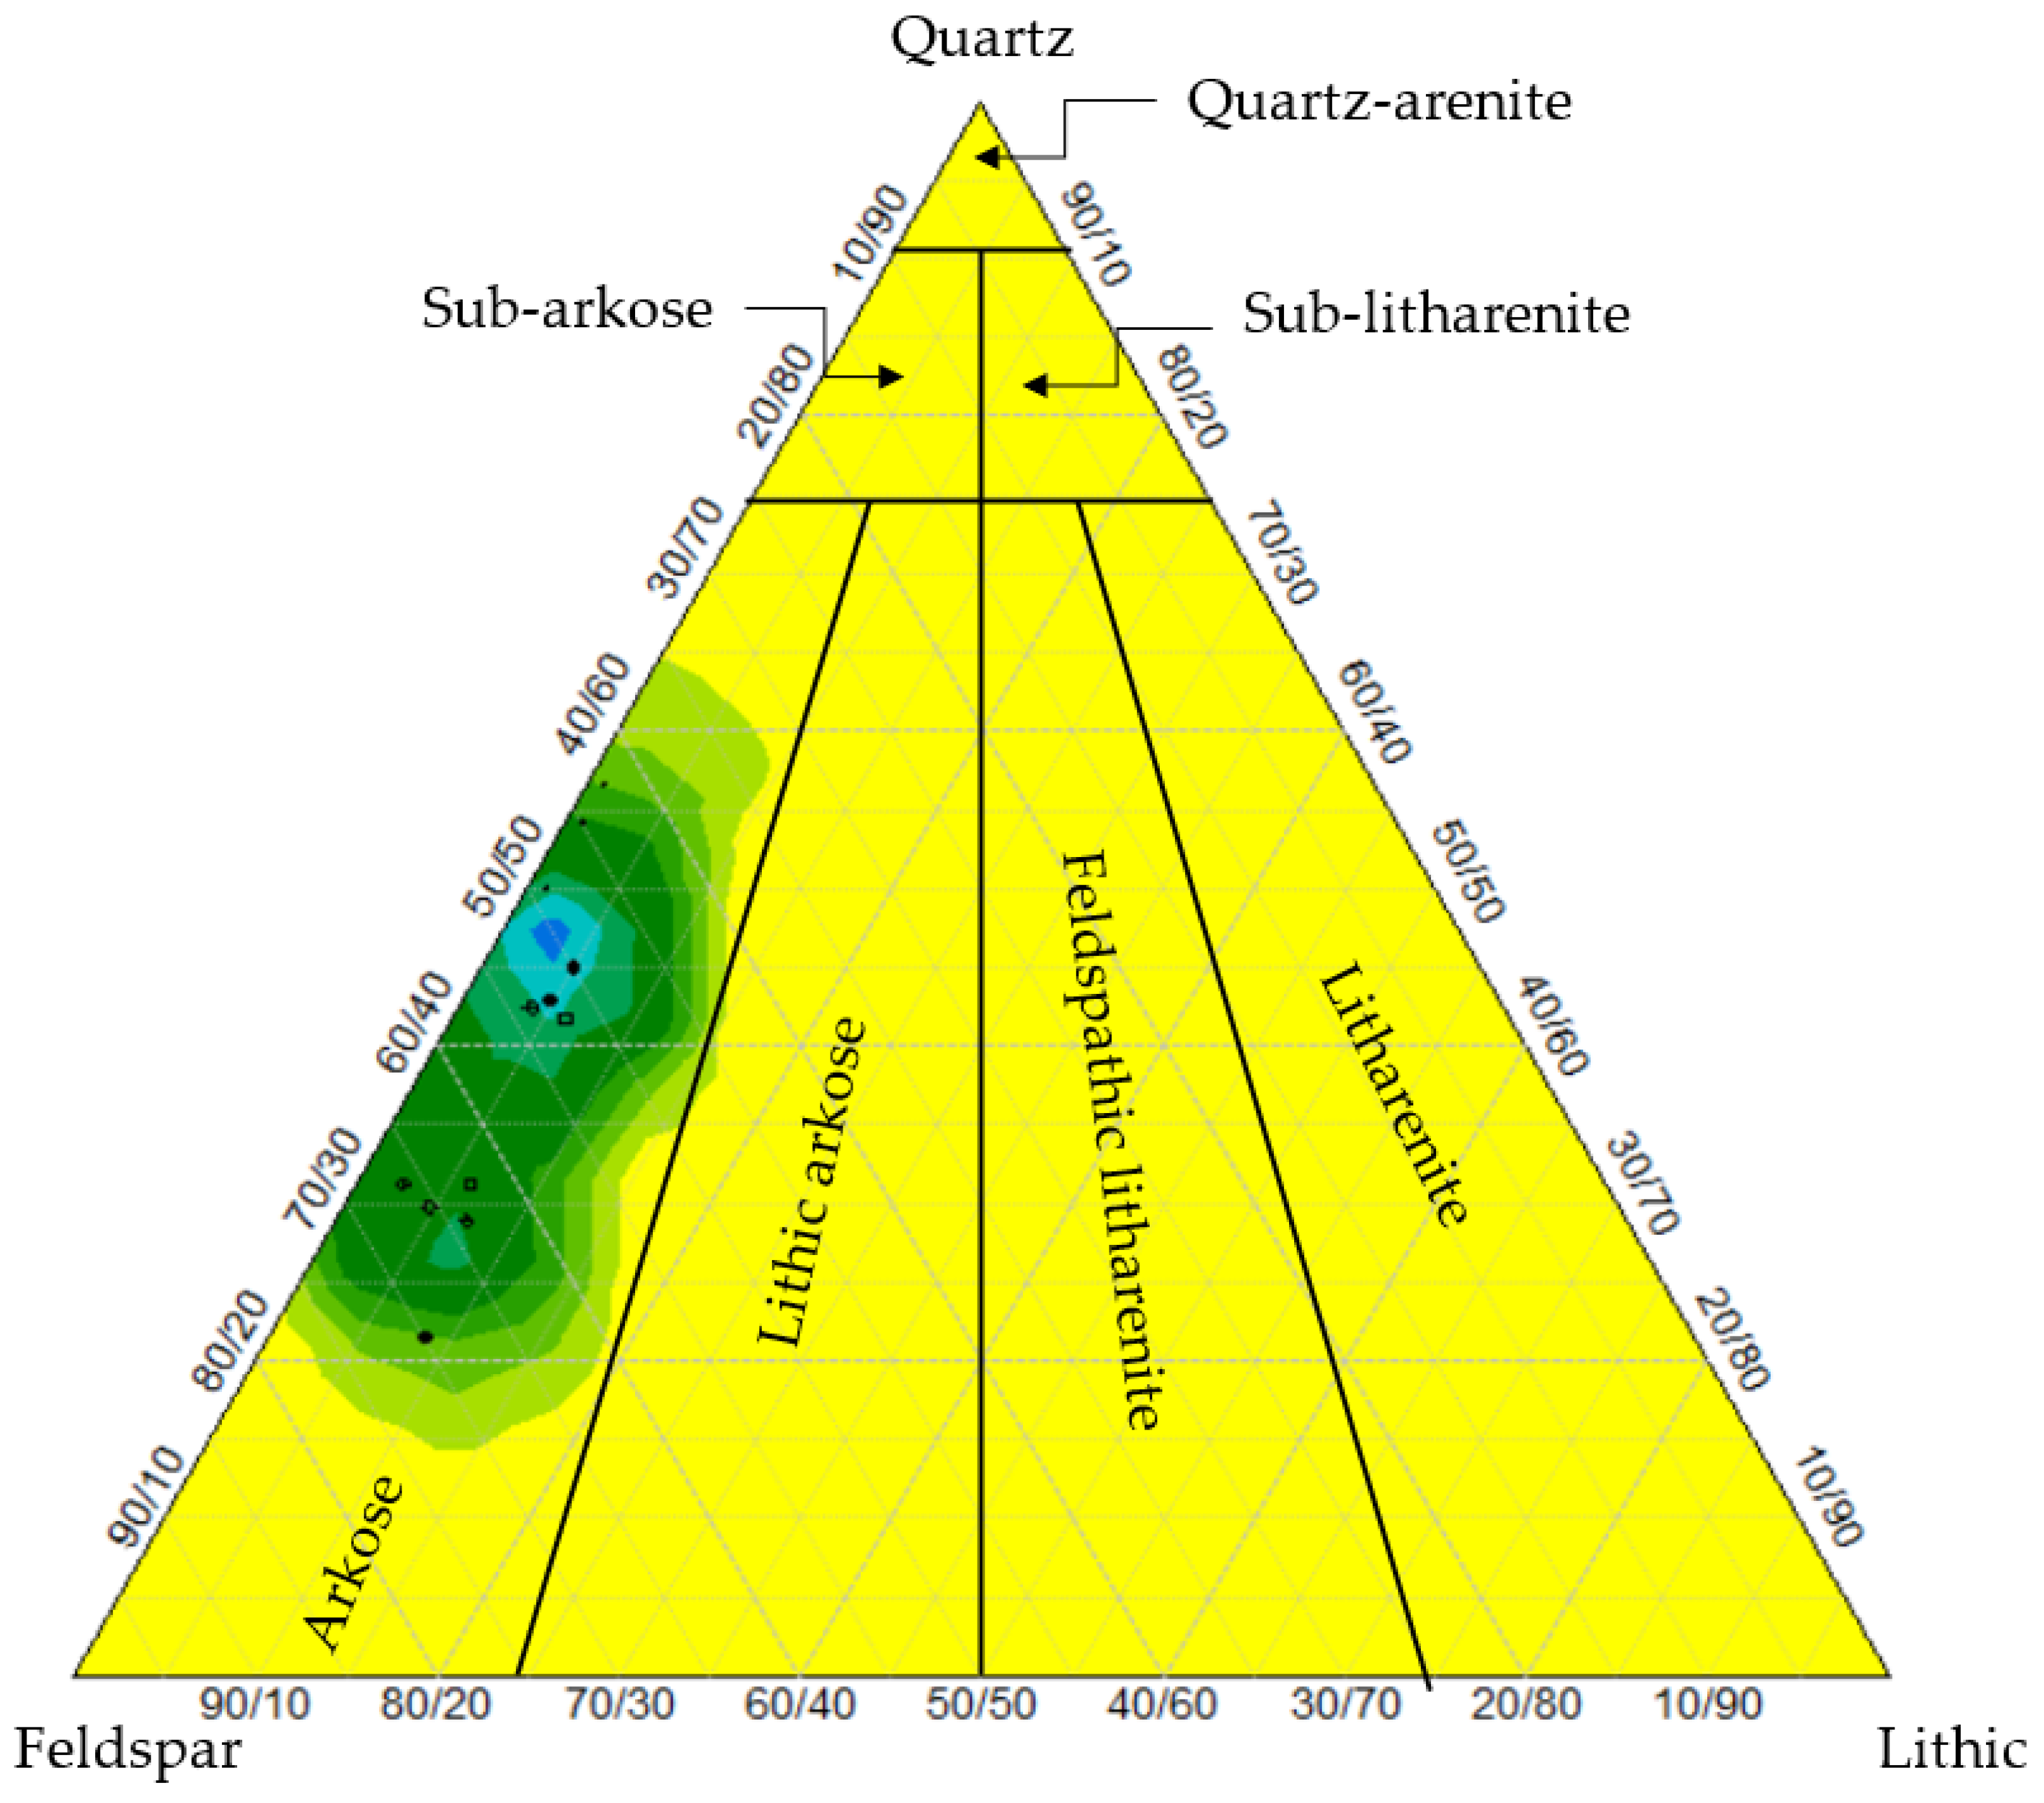
A classification based on the mineral composition obtained from the thin sections was attempted (Figure 5).

Figure 5.
Ternary classification diagram for the sandstone analyzed based on the mineral composition. Classes are after Folk [28].
As can be observed from Figure 5, triangular plot diagram, the rocks analyzed fell within the arkosic type of sandstone, as was also confirmed with the help of XRF analysis. It may be noted that, despite the heat treatment, the characteristics of the samples did not change. Quartz, the primary framework component of this sandstone, experienced an α- to β-phase transition between 400 °C and 600 °C. This transformation resulted in a sharp decline in the lattice constant, micro-strain, and dislocation density during this temperature range, ultimately causing the sandstone’s microstructure to deteriorate.
3.2. Scanning Electron Microscope (SEM) Analysis Results
SEM images provided visual evidence of the material’s response to this temperature. This insight is crucial for understanding the material’s behavior under such conditions and is particularly important in fields like materials science, engineering, and quality control, especially for materials exposed to high-temperature environments.
This section presents SEM images of different sandstone samples, as shown in Figure 6. Basic SEM (scanning electron microscopy) uses a high-energy electron beam (0.1–50 keV) to interact with a sample surface, producing secondary electrons, backscattered electrons, photons, X-rays, photon excitation, and sometimes diffraction. The results show that, at lower temperatures, the grains were larger in size. As the temperature increased, the grain sizes significantly reduced as they began to dissolve. At 400 °C, the grains continued to dissolve, coalesce, and form larger grains. By 600 °C, there was a further reduction in grain size, accompanied by the widening of pore spaces. At 800 °C, the pores between grains became even wider compared with the previous and subsequent temperature effects, as observed in Figure 6.
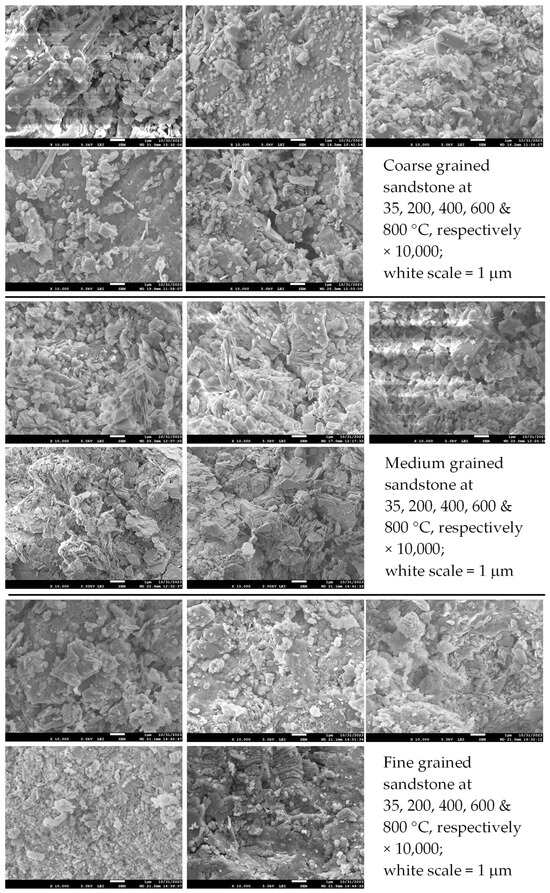
Figure 6.
SEM images of CG SST, MG SST, and FG SST.
Figure 6 shows that, at lower temperatures, individual grains were distinguishable, although there was inconsistency in their size distribution. At 400 °C and 600 °C, the grains appeared disintegrated, and pores began to close as tiny grains filled the spaces. However, at 800 °C, the pores became more pronounced and widened, owing to the thermal expansion of the individual grains and the loss of volatile matter occupying the pores.
When the material was heated to 800 °C, the visibility and expansion of microcracks increased. This expansion may have resulted from thermal stress, changes in material properties at elevated temperatures, or the release of internal stresses within the material.
SEM test results conducted at 35 °C showed that the granular structure of the particles became clearly visible at a magnification of ×10,000, revealing a distinct distributed pattern of grains. When the material was heated to 200 °C and examined through SEM, the primary void spacing became noticeable, possibly due to changes in the material’s physical properties or the expansion and modification of its structure at this temperature. As the temperature rose to 400 °C, significant changes in the material’s pore structure occurred, leading to larger and more variable pore sizes, which made precise measurement more difficult. When the temperature reached 600 °C, a specific mineral began to agglomerate, resulting in increased porosity and a reduction in material strength. These changes can have significant implications for applications such as geological material studies or understanding the behavior of materials under high-temperature conditions.
3.3. X-Ray Fluorescence (XRF) Analysis Results
XRF is a non-destructive analytical method used to identify the elemental composition of materials. XRF analysis is a valuable tool for mapping elemental distributions in geological samples, allowing geologists to pinpoint promising exploration targets with greater accuracy. By exposing a sample to a primary X-ray source, XRF analyzers measure the fluorescent (secondary) X-rays emitted, revealing the sample’s chemical makeup. This technique can precisely detect grain compositions within the range of 0.1% to 100%. The data of XRF analysis for important constants like SiO2, Al2O3, Fe2O3, CaO, K2O, and Na2O performed on different types of sandstones are provided in Table 2. The table presents the results of XRF (X-ray fluorescence) analysis conducted on three types of sandstone: CG (coarse-grained), MG (medium-grained), and FG (fine-grained). The table shows the elemental composition of these sandstones as a percentage of weight for various minerals. These data are intended to illustrate how the mineral composition of each sandstone type changed in response to temperature variations.
Table 2.
XRF analysis elemental values of sandstone (weight %).
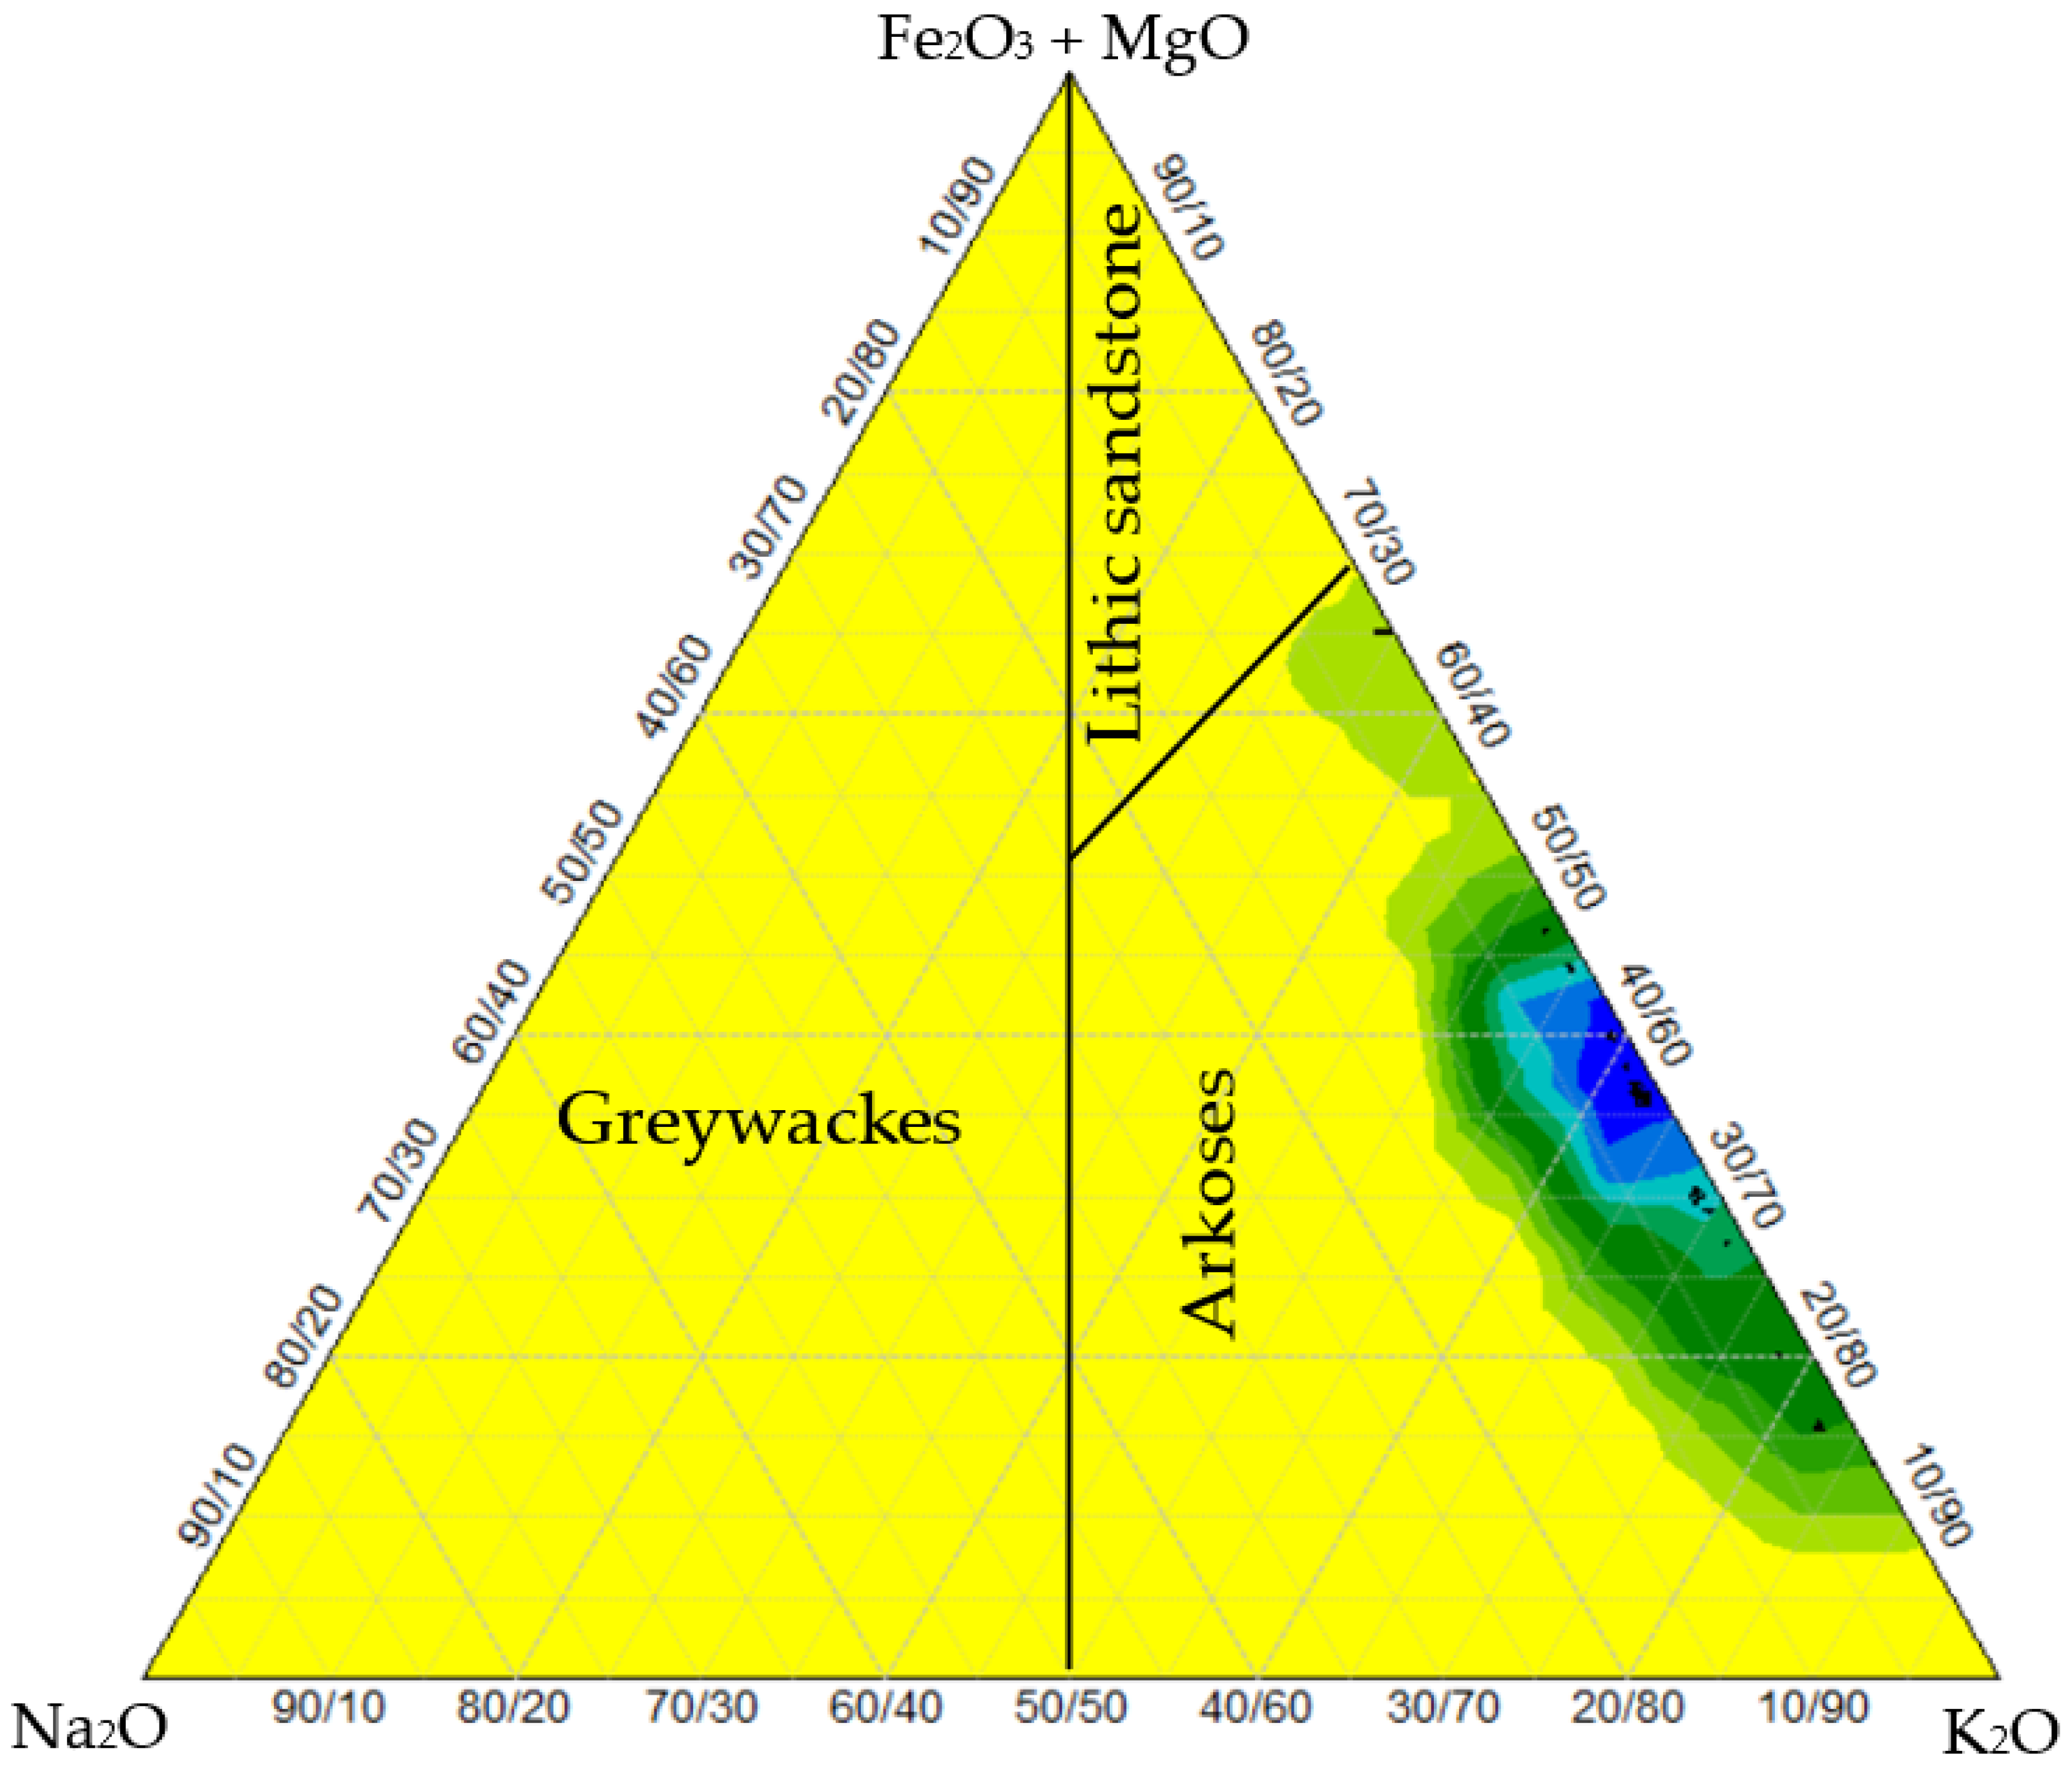
Based on the chemical analysis results, a classification of the rocks analyzed was attempted (Figure 7). The rocks thus fell within the category of arkosic sandstone and in conformity with the mineral-based classification, as presented in Figure 6.
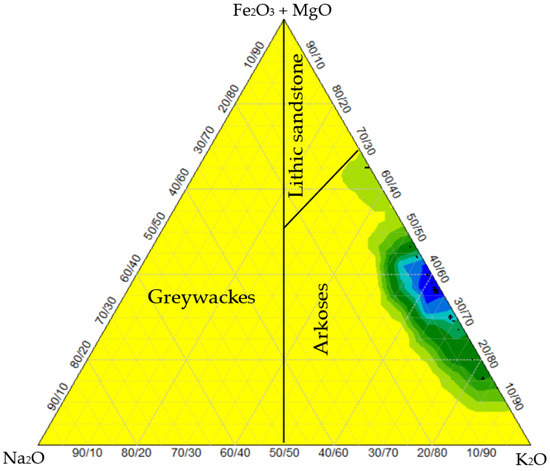
Figure 7.
Classification of the sandstone based on chemical composition obtained from XRF analysis. Classes are after Blatt et al. [29].
It can also be observed from Table 2 that there were no significant changes in the chemical composition at various stages of heating, implying that structural changes were dominant characteristics during the process.
3.4. Change of Density with Heat Treatment
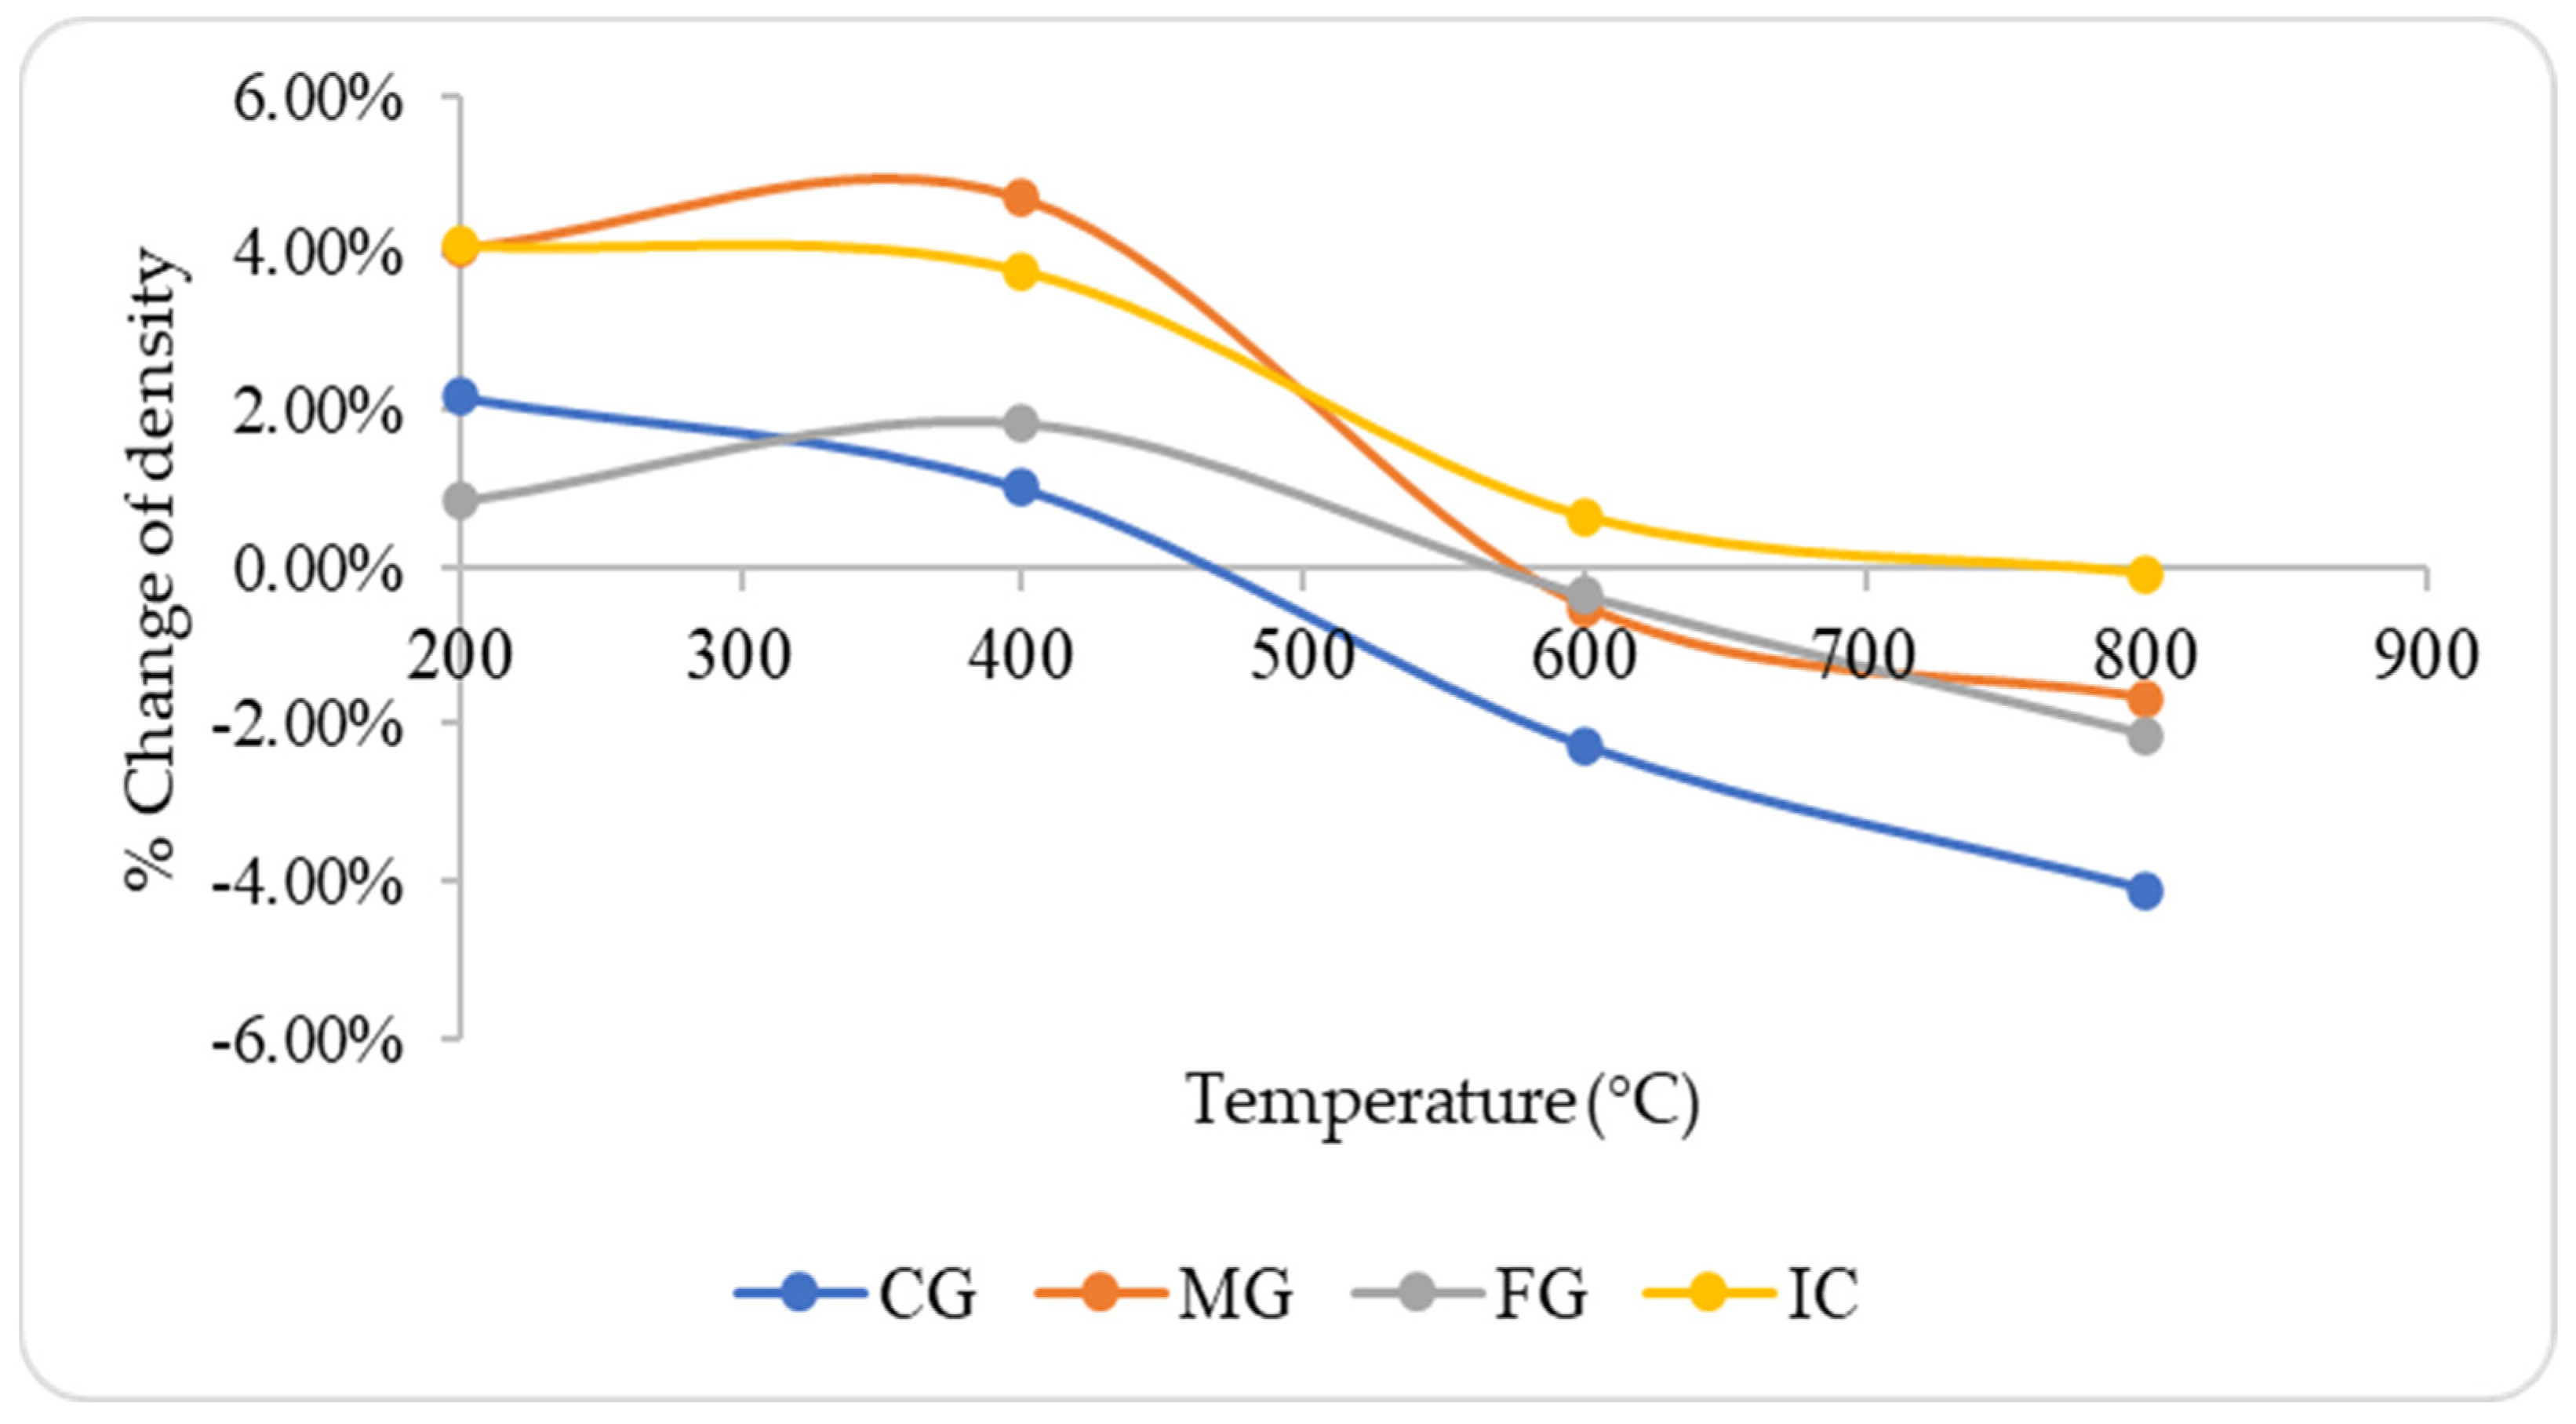
The density was measured with a standard method of mass-to-volume ratio using the water displacement method. The analysis revealed distinct patterns in density changes from 35 °C to 800 °C across different types of sandstone. Both fine-grained (FG) and medium-grained (MG) sandstone exhibited a subtle but consistent increase in density within the temperature range of 200 °C to 400 °C. Specifically, fine-grained (FG) sandstone showed an increase in density ranging from 0.83% to 1.83%, while medium-grained (MG) sandstone demonstrated a slightly higher increase in density, ranging from 4.06% to 4.7%. The percentage change in density at different temperature changes is illustrated in Figure 8. These observations suggest that the heat treatment induced a moderate densification effect, particularly between these temperature ranges, which could be attributed to the thermal expansion and restructuring of the mineral grains within the rock matrix. At a higher temperature, the rock underwent thermal expansion causing the decrease in density, leading to microcrack formation. This trend is important for understanding how temperature influences the compactness and structural integrity of different sandstone types. The summary of the statistical parameters of density change is provided in Table A1.

Figure 8.
Percentage change in density with heat treatment.
Two distinct phases in change in density can be observed from Figure 8, where initial changes were of increasing density due to the loss of volatile matter up to 400 °C and, for those after 800 °C, there was a systematic drop in density due to thermal expansion.
A statistical analysis with analysis of variance (ANOVA) was conducted to understand the interaction between the temperature variations and density changes in different rock types. The data in Table 3 show that p-values below 0.0001 were highly significant, supported by the large F-values of 92.91 and 112.64. Conversely, the residual lack of fit was not significant, with a p-value of 0.5855. Table 4 displays the fit statistics for the density analysis using ANOVA, showing an adjusted R2 of 0.9199 and a predicted R2 of 0.9052, indicating an agreement between the actual and predicted values.
Table 3.
ANOVA for density effect of heat treatment.
Table 4.
Fit statistics of the analysis of variance for density.
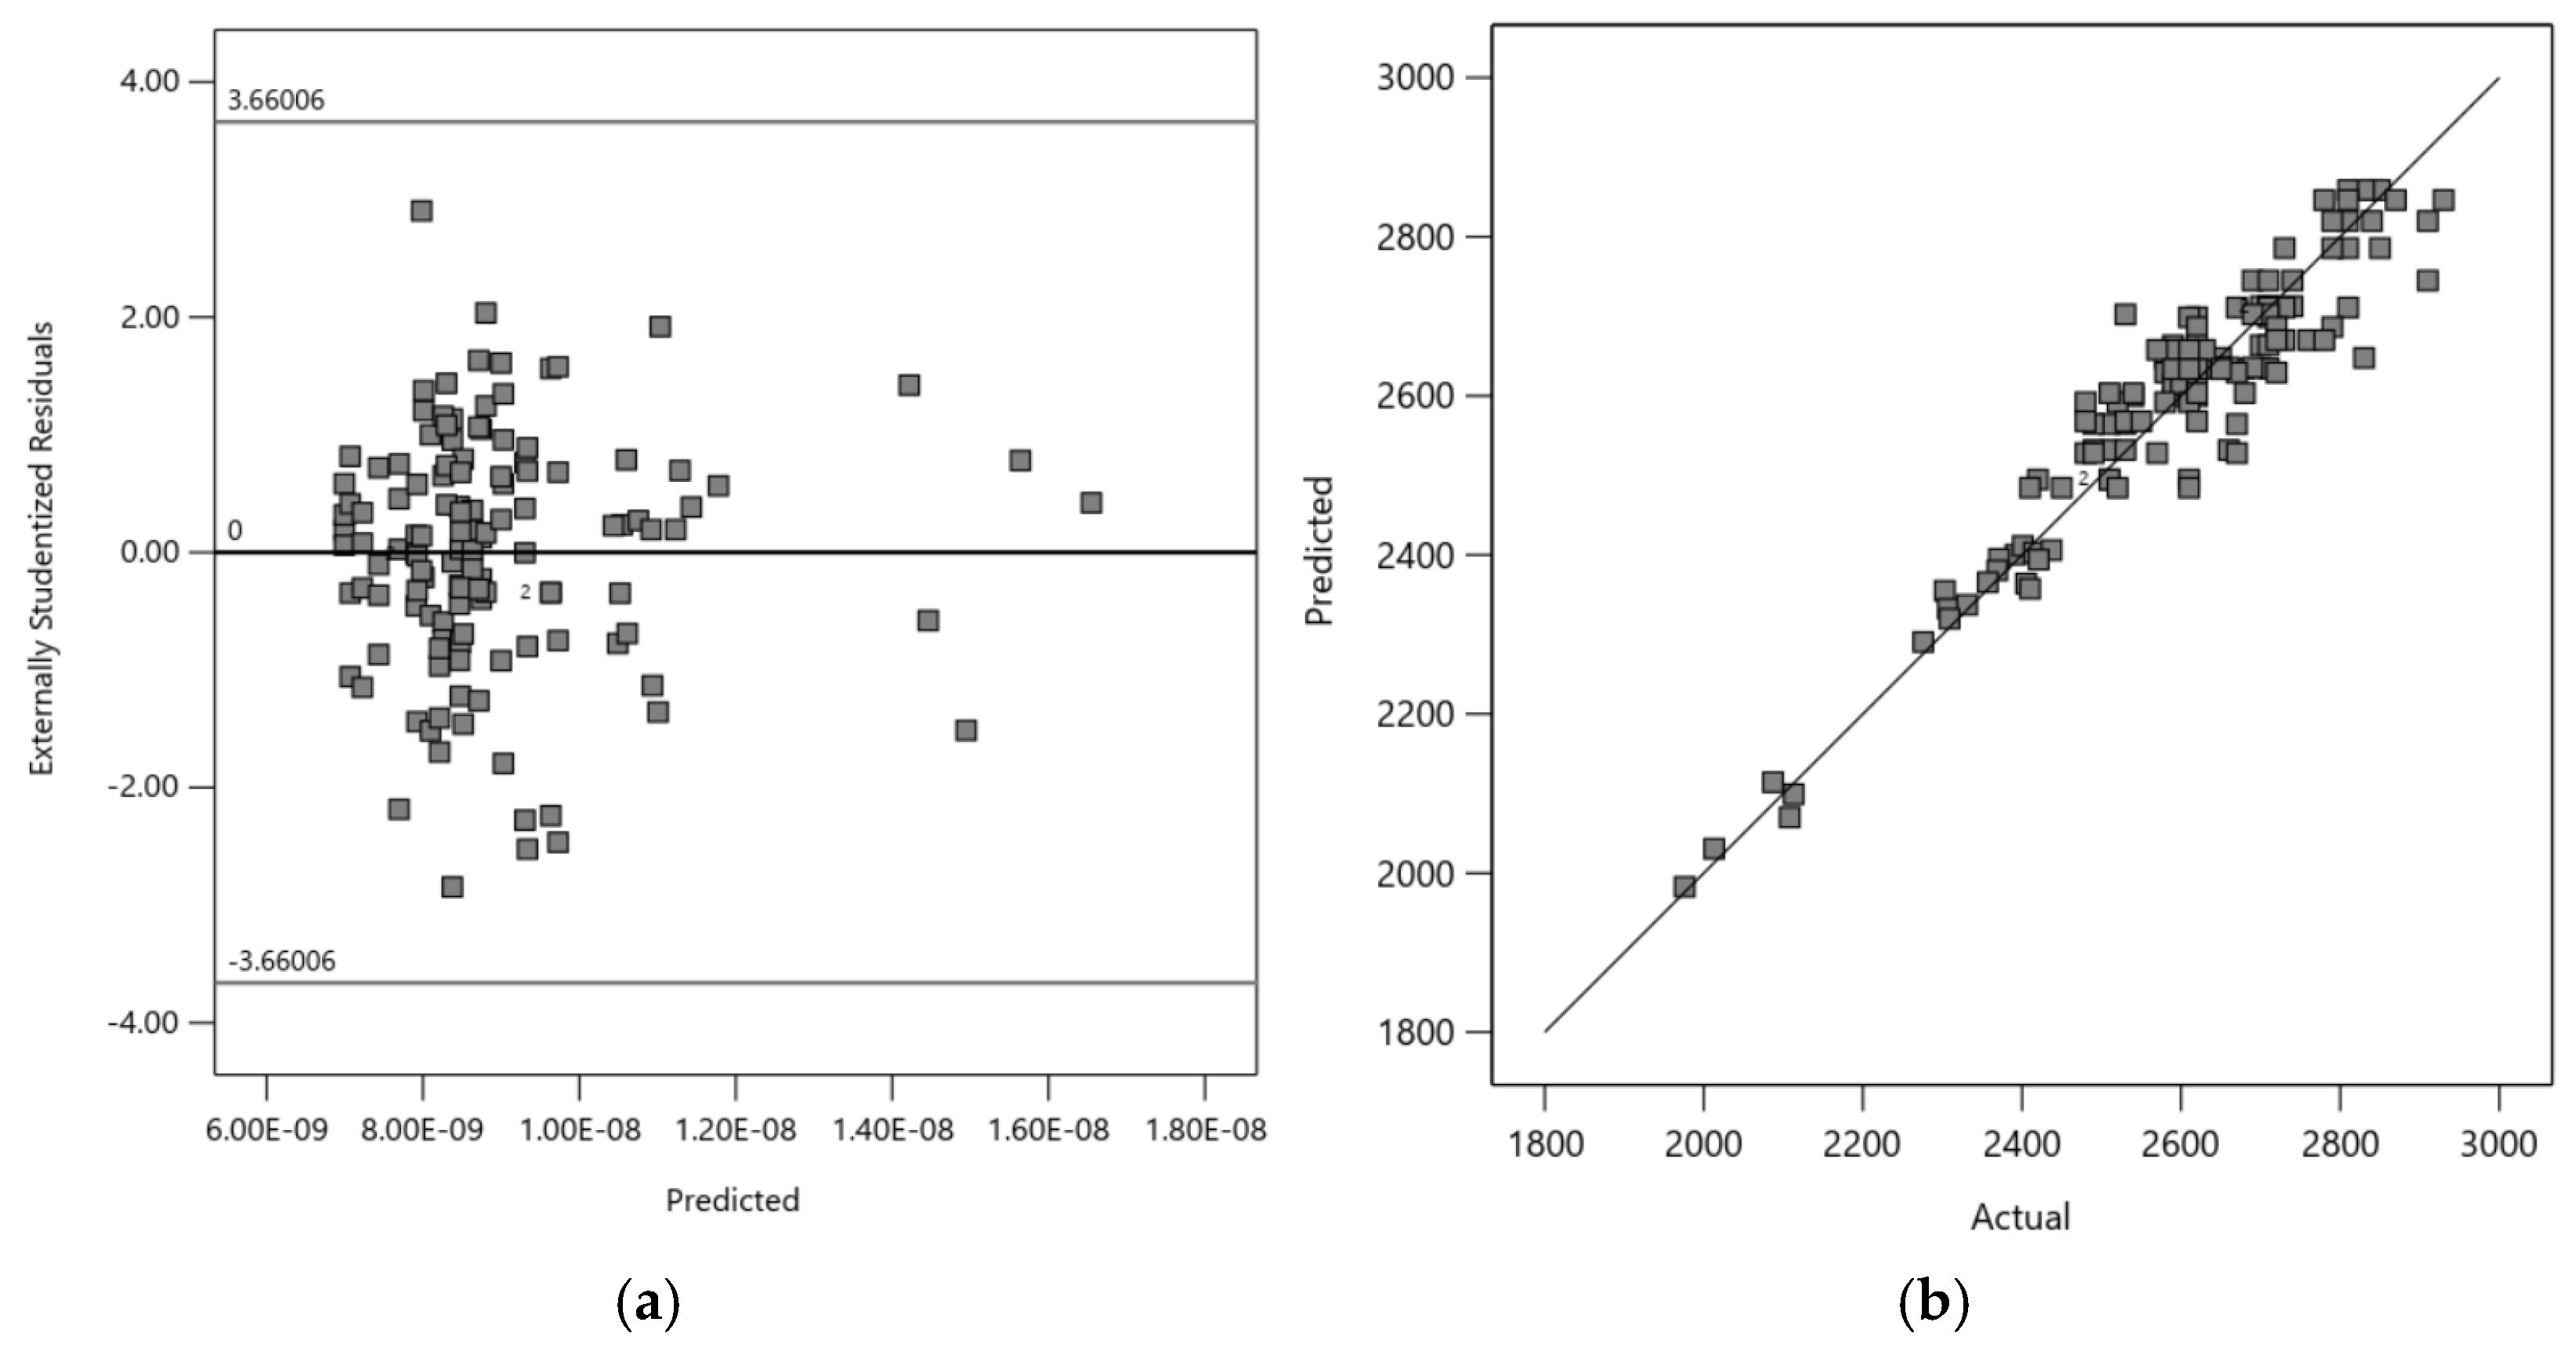
Figure 9a shows that the distribution of density values for all rock types fit within the residual limits, with most values ranging from 2.00 to −2.00. The results show that all predicted data points lie on the fitted line, indicating a strong correlation between density values across different rock types (Figure 9b). The ANOVA, fit statistics, residual plots, and strong correlation between predicted and observed values show that the models developed were statistically significant.
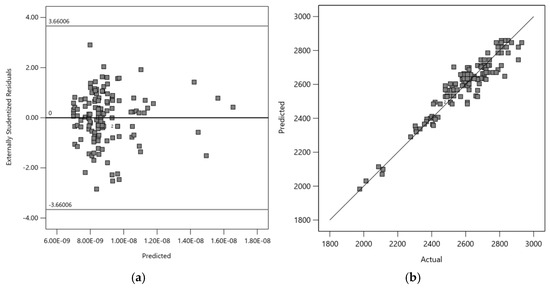
Figure 9.
(a) Distribution of predicted and actual values of density and (b) predicted vs. actual values.
Based on the analysis, equations were developed between density and temperature for all rock types. These equations closely aligned with the regression line, effectively illustrating how density varied with temperature. The models developed are given in Equations (1)–(4).
CG sandstone:
MG sandstone:
FG sandstone:
IC sandstone:
where ρr is the density of rock in kg/m3 and T is the temperature in °C.
3.5. Change in Compressive Strength (UCS) with Heating
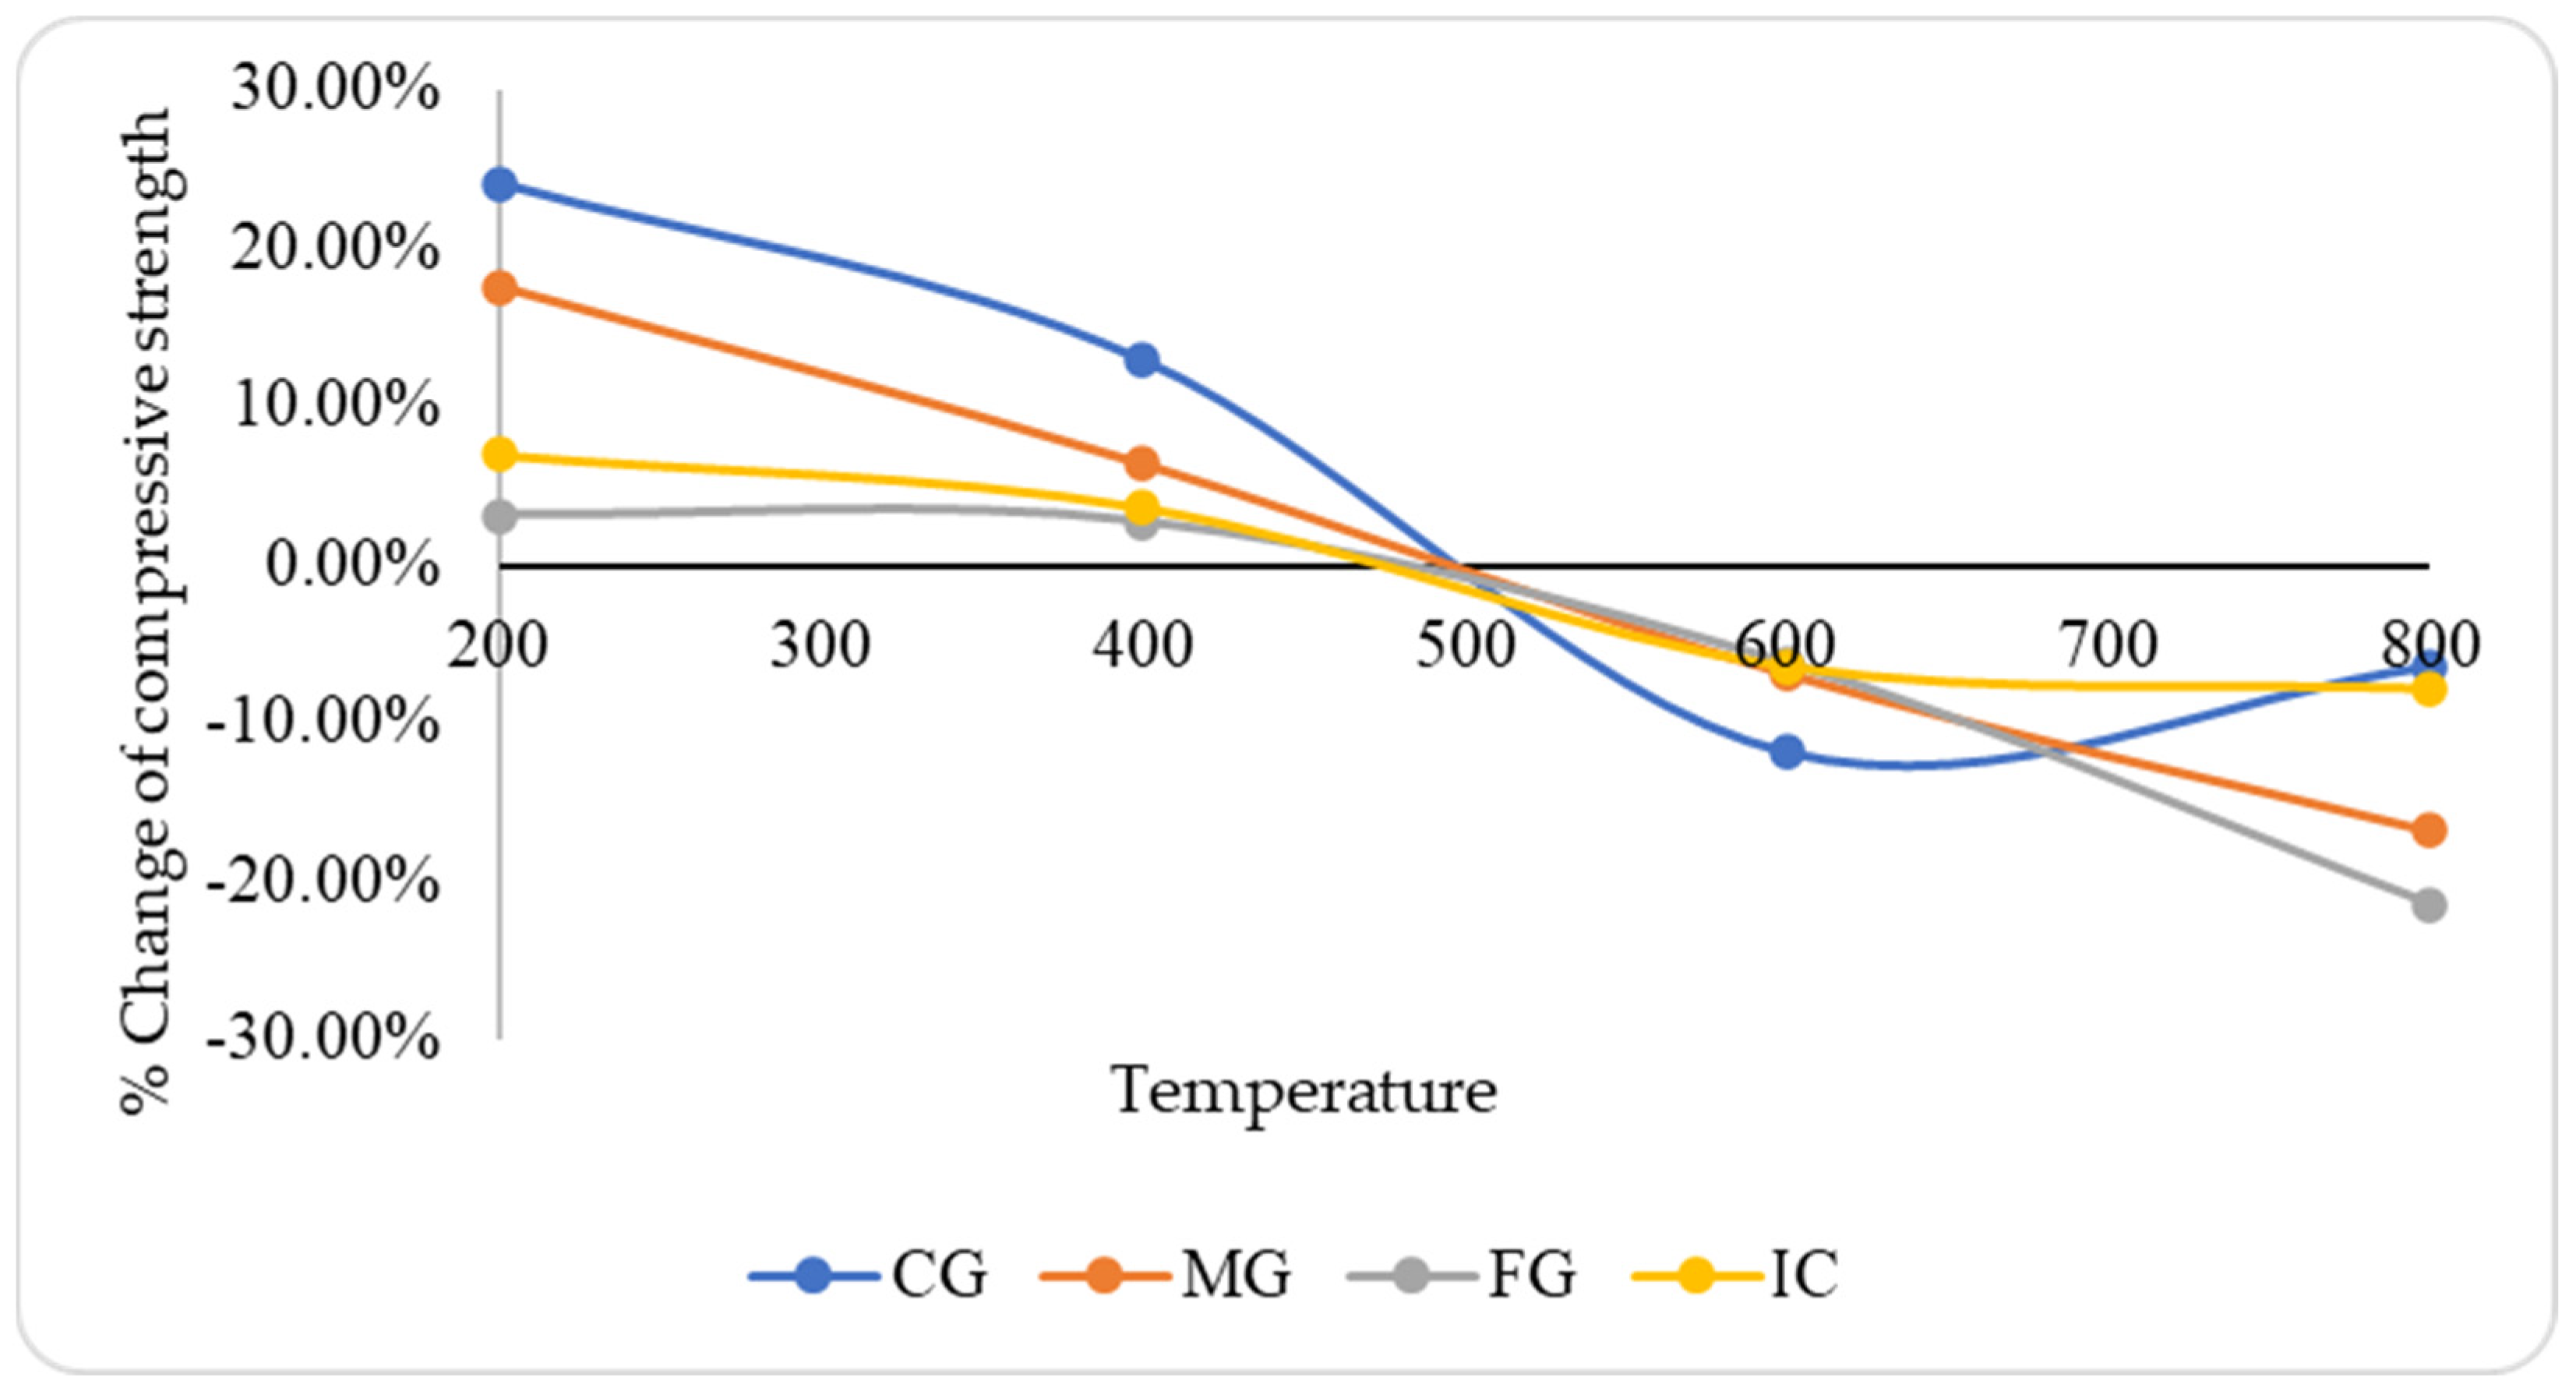
As temperature increases, the strength of most materials, including rocks and ice, generally decreases. This occurs due to factors such as thermal expansion, bond weakening, and potential phase transformations, all of which reduce the material’s ability to withstand compressive stress. IC sandstone had the lowest standard deviation of 1.65. FG sandstone samples showed the widest range, with a value of 3.55. FG sandstone had the highest kurtosis value at 3.96. IC sandstone exhibited the least response to heat, whereas FG sandstone showed the highest response among the studied rock types. The summary of the statistical parameters of change in compressive strength is provided in Table A2 (Appendix A).
The change in compressive strength of the sandstone (Figure 10) showed typical behavior with the increase in temperature. For coarse-grained sandstone, the compressive strength increased as the temperature rose to 200 °C, reaching an approximate increase of 24.09% (12.95 MPa to 16.07 MPa). Beyond this point, the rate of increase slowed, resulting in a 12.94% increase (18.15 MPa) at 400 °C. An inflection point occurred just before 600 °C, leading to a sudden decline of around −11.79% (16.01 MPa). Ultimately, at 800 °C, the compressive strength decreased by about −6.37% (14.99 MPa). The decrease in compressive strength with increasing temperature can be explained by an increase in microcrack formation leading to an increase in density of cracks, thereby decreasing the compressive strength. CG sandstone, however, showed an increasing trend of UCS from 600 °C to 800 °C, possibly due to fusion of the grains.

Figure 10.
Percentage change in compressive strength (UCS) with heat treatment.
To further substantiate these observations, a comprehensive statistical analysis was conducted on the UCS data post heat treatment, as shown in Table 5 and Table 6. The ANOVA results indicate that the effects of both rock type and temperature were highly significant (p < 0.0001), and, importantly, there was a statistically significant second-order interaction between them. The quadratic term of temperature (B2) was also highly significant, reflecting the nonlinear relationship between UCS and temperature. The interaction between rock type and temperature (AB) confirm that each rock behaved differently under thermal stress. The model fit statistics underscore the robustness of this analysis, with R2, adjusted R2, and predicted R2 all equaling 0.99, and a very low standard deviation (0.0327), suggesting excellent agreement between predicted and observed values. A coefficient of variation (C.V.) of just 0.8181% and an adequate precision of 174.09 further demonstrate the model’s high accuracy and reliability. The regression equations developed for each rock type (Equations (5)–(8)) accurately represent the UCS–temperature relationship, capturing the thermal behavior across various temperature ranges. Figure 11a and Figure 11b visually validate the model’s performance through residual vs. predicted and predicted vs. actual plots, respectively, confirming that the statistical approach effectively characterizes the compressive strength response of different sandstone types to heat treatment.
Table 5.
Variation of compressive strength (UCS) of different materials with heat treatment using ANOVA.
Table 6.
Fit statistics of the analysis of variance for compressive strength (UCS).
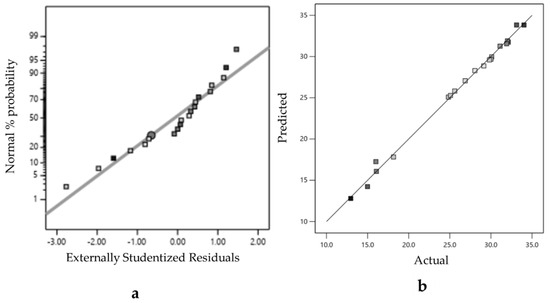
Figure 11.
(a) Distribution of residual and predicted values of UCS and (b) predicted vs. actual values.
CG sandstone:
MG sandstone:
FG sandstone:
IC sandstone:
where UCS is the uniaxial compressive strength of rock in MPa and T is the temperature in °C.
3.6. Change of p-Wave Velocity with Temparature
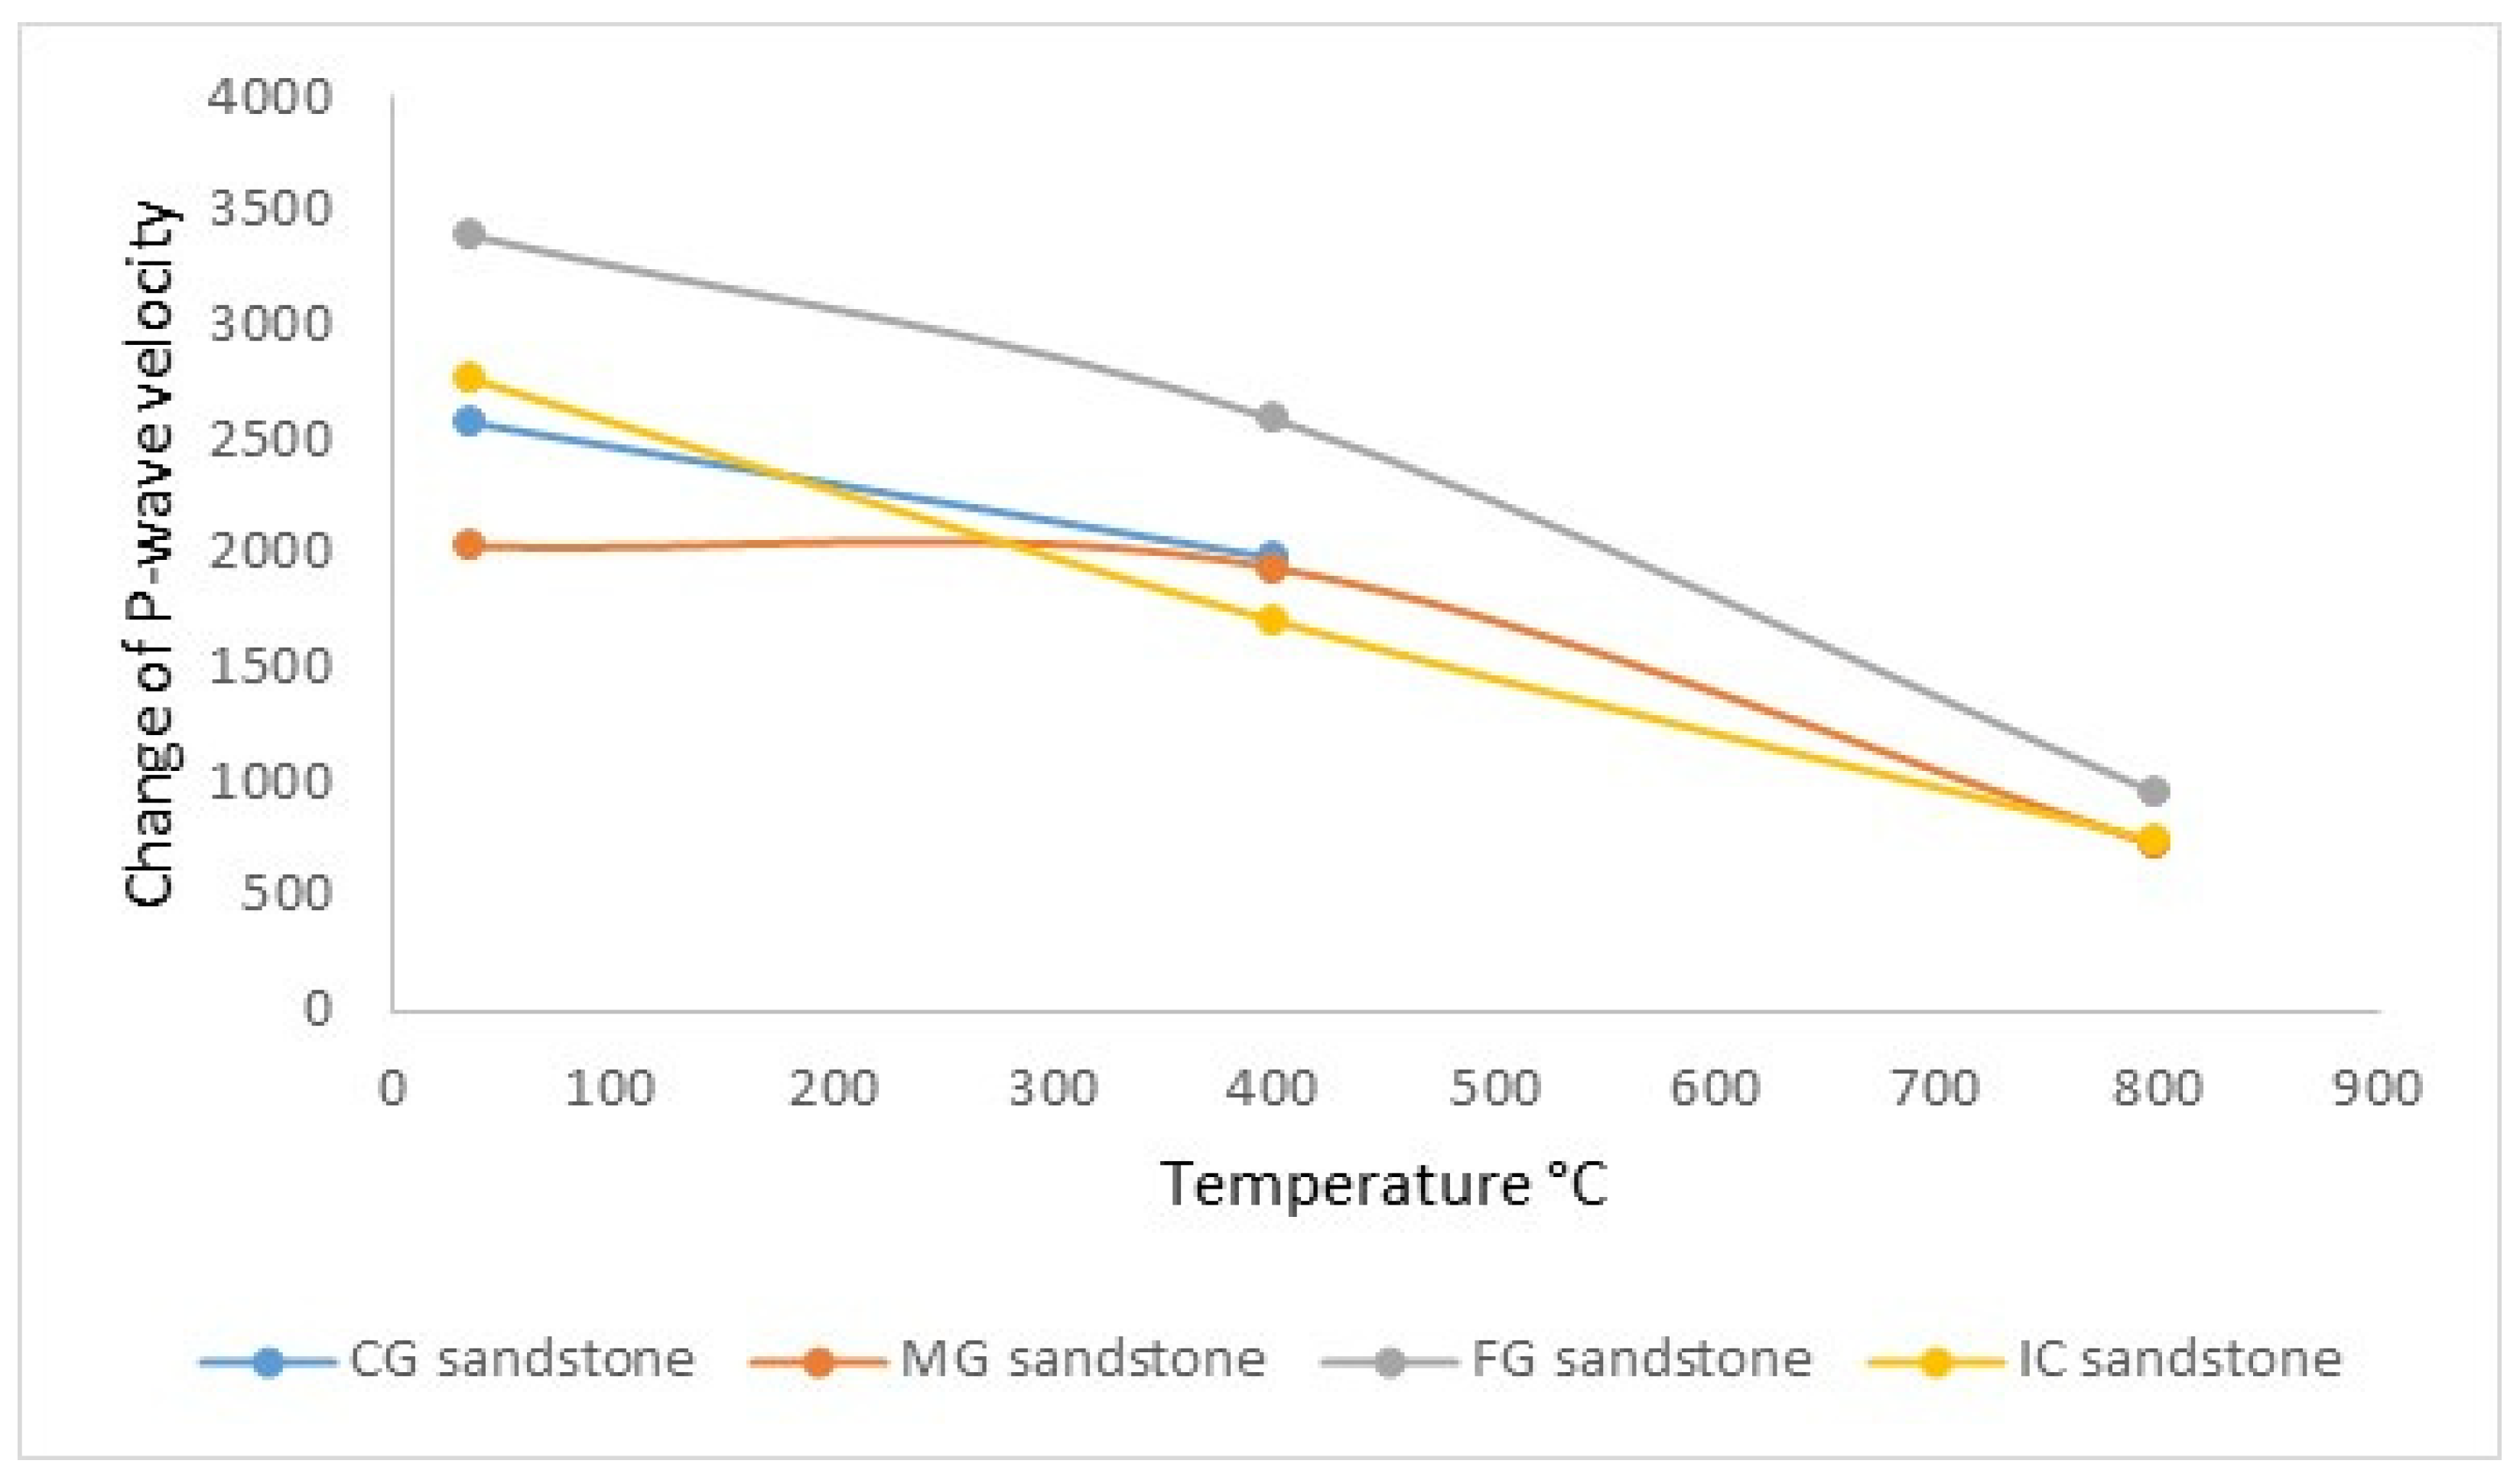
p-wave velocity (vp) refers to the speed at which primary waves travel through a material. p-waves are a type of elastic seismic wave that move in a compressional (longitudinal) manner, causing particles in the material to oscillate parallel to the wave’s direction of propagation. As shown in Figure 12, FG sandstone had the highest mean p-wave velocity at 2309.33, while MG sandstone had the lowest mean value at 1558. In contrast, CG sandstone had the smallest standard deviation of approximately 421.44. The p-wave velocity decreased consistently but the values of UCS fluctuated (see also Table A3 for the summary statistics of the results). However, the comparison of p-wave with the values of UCS under such a process cannot be compared directly, as also concluded by Zhang et al. [30].

Figure 12.
Change in p-wave velocity of rocks with heat treatment.
The vp decreased as the temperature increased, as shown in Figure 12, with the most significant reduction occurring in IC sandstone, at approximately 268.22% compared with the initial value. In coarse-grained sandstone, the signal did not pass through the sample at 800 °C, and there was a decrease rate of about −30.02% from 35 °C to 200 °C. The third value of p-wave velocity of CG could not be determined due to experimental error. Reductions in p-wave velocity at higher temperatures could be attributed to the formation of microcracks due to the thermal expansion of the minerals and the water vaporization and the compression of defects may have led to the increase in UCS. However, the loss of water resulted in a decline in p-wave velocity [30].
The data in Table 7 show a p-value of 0.0024 for the model, indicating strong statistical significance, as also evidenced by substantial F-values of 15.96 and 52.67. These low p-values suggest a high level of confidence in the observed results, pointing to a strong association between the variables under study.
Table 7.
ANOVA of p-wave velocity for effect of heat treatment.
Table 8 presents a summary of the fit statistics of the vp data using ANOVA. The predicted R2 was in good agreement with the adjusted R2, which showed statistically significant results. The equations derived based on statistical analysis are shown in Equations (9)–(12).
Table 8.
Fit statistics of the analysis of variance for p-wave velocity.
CG sandstone:
MG sandstone:
FG sandstone:
IC sandstone:
where vp is the p-wave velocity of the rock in m/s and T is the temperature in °C.
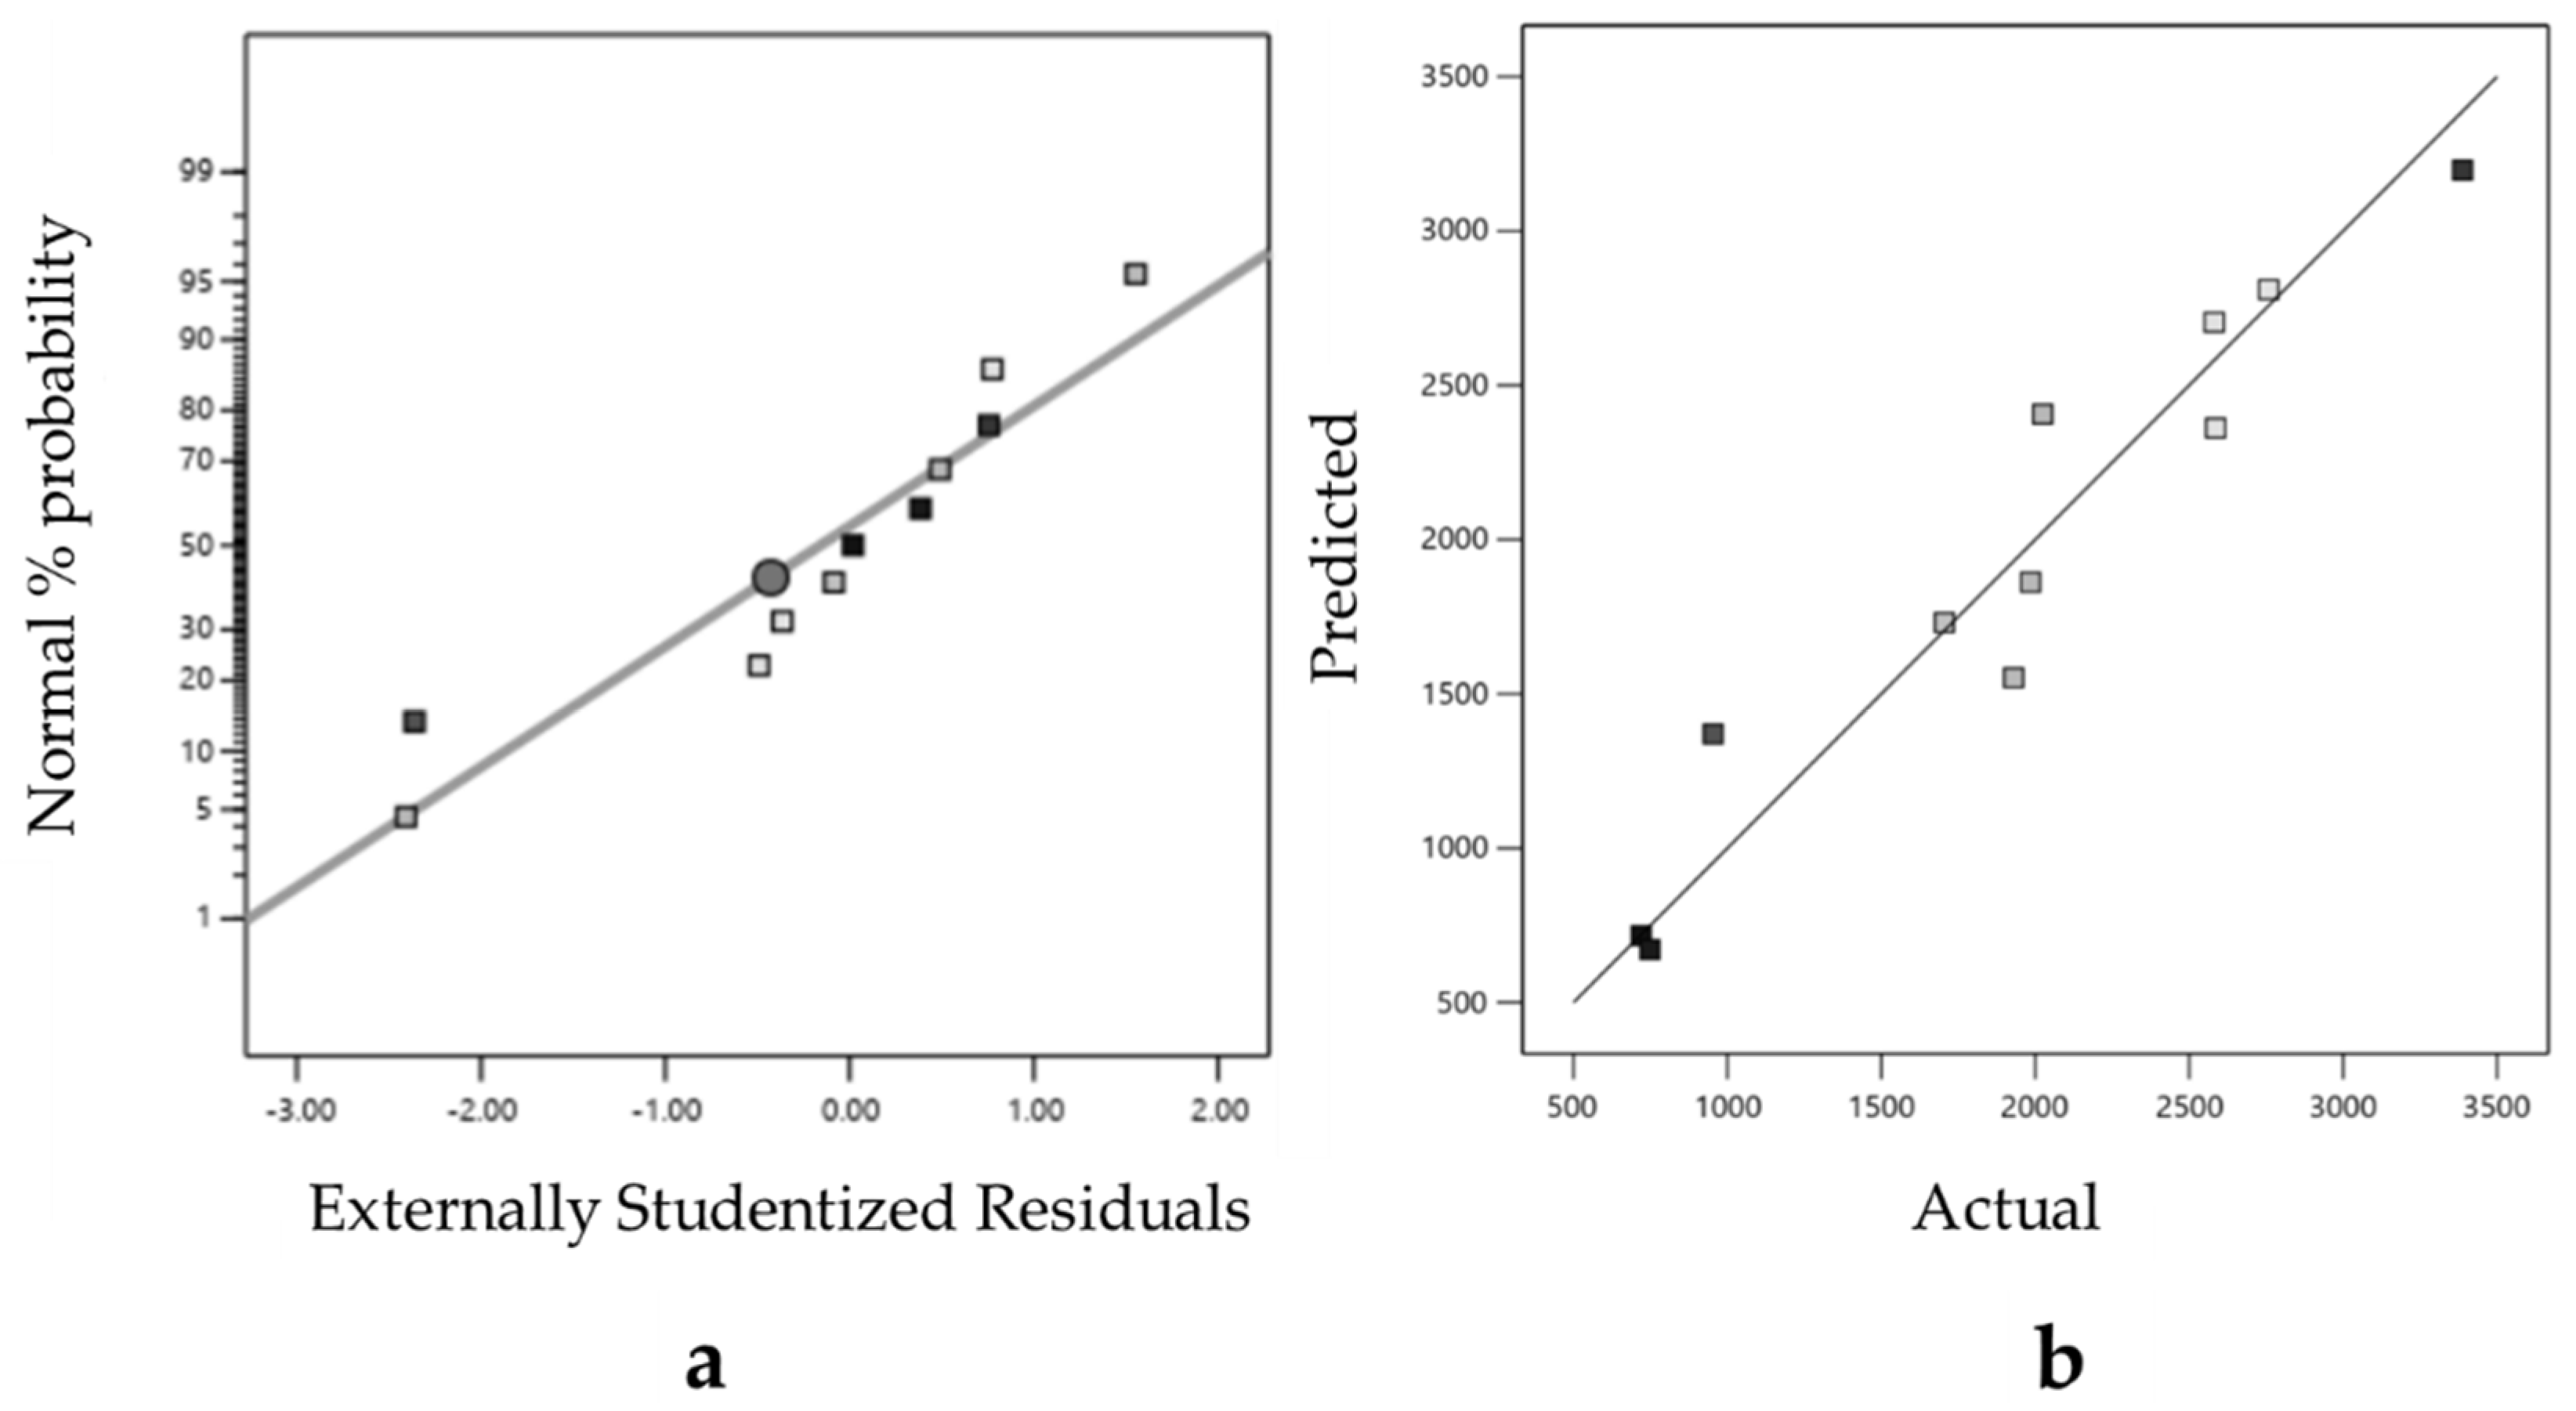
These equations revealing a nonlinear correlation between p-wave velocity and temperature for the four sandstone types examined demonstrate the effective capturing of the pattern of variation in response to temperature changes. Figure 13a and Figure 13b show the residual vs. predicted plot and predicted vs. actual plot values of UCS, respectively.
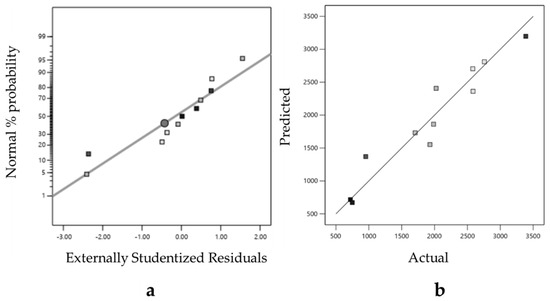
Figure 13.
(a) Distribution of residual and predicted values of p-wave velocity (circle is reference point and squares are actual data points) and (b) predicted vs. actual values pointing to the proper transformation and predictive capability of the equations, respectively.
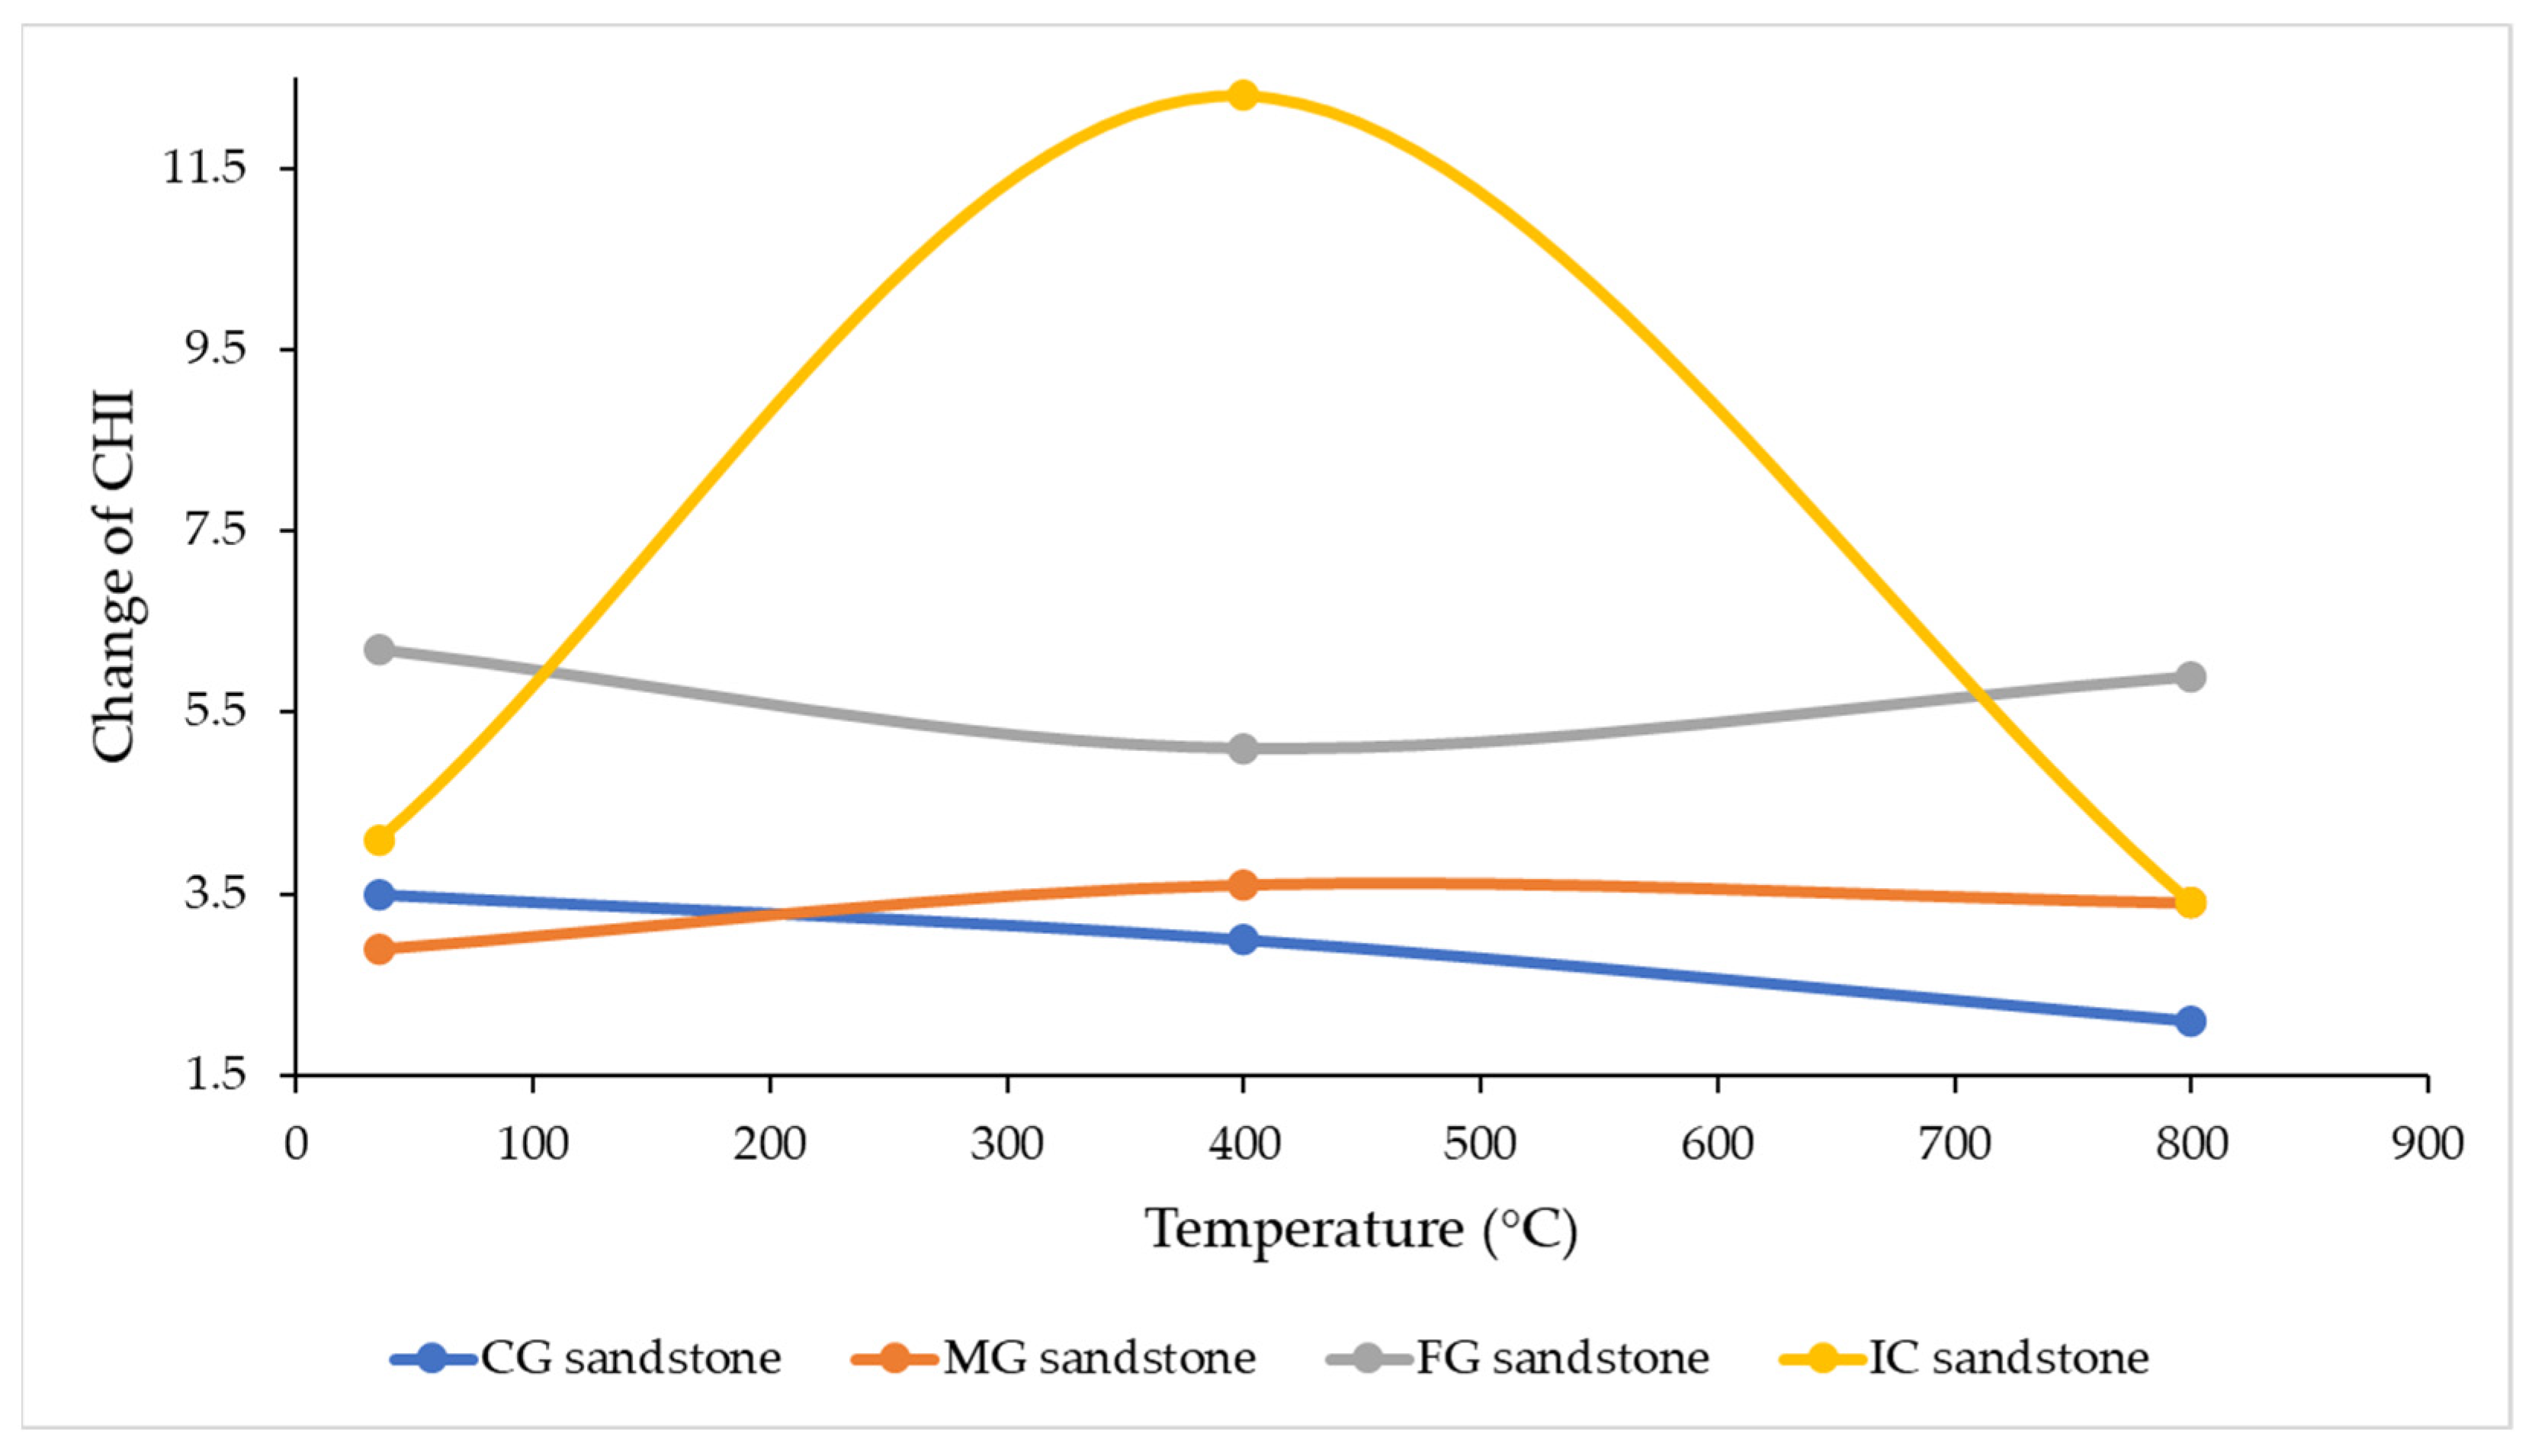
3.7. Change of Cerchar Hardness Index (CHI)
It was observed that IC sandstone had the highest mean value, while CG sandstone had the lowest. Additionally, IC sandstone exhibited the highest standard deviation, approximately 4.948.
The Cerchar hardness change rate was higher for CG sandstone, at approximately −66.66%, while the minimum variation was found in FG sandstone, at about −5.08%, as shown in Figure 14. Additionally, it was found that CHI values increased with temperature in MG sandstone by approximately 14.7%. (see Table A4, also). The reason behind this was that the atoms resisted the dislocation motion, the increase in plastic deformation, and the purging of energy applied to the sample. The behavior of IC sandstone was unexpected and was due to the flaking of the surfaces on heating and subsequent interactions with the tool tip used for the determination of CHI.
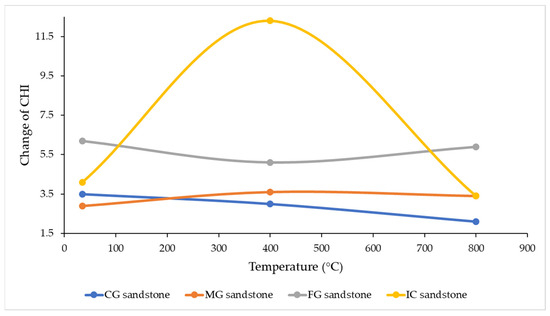
Figure 14.
Change in Cerchar hardness index of rocks with heat treatment.
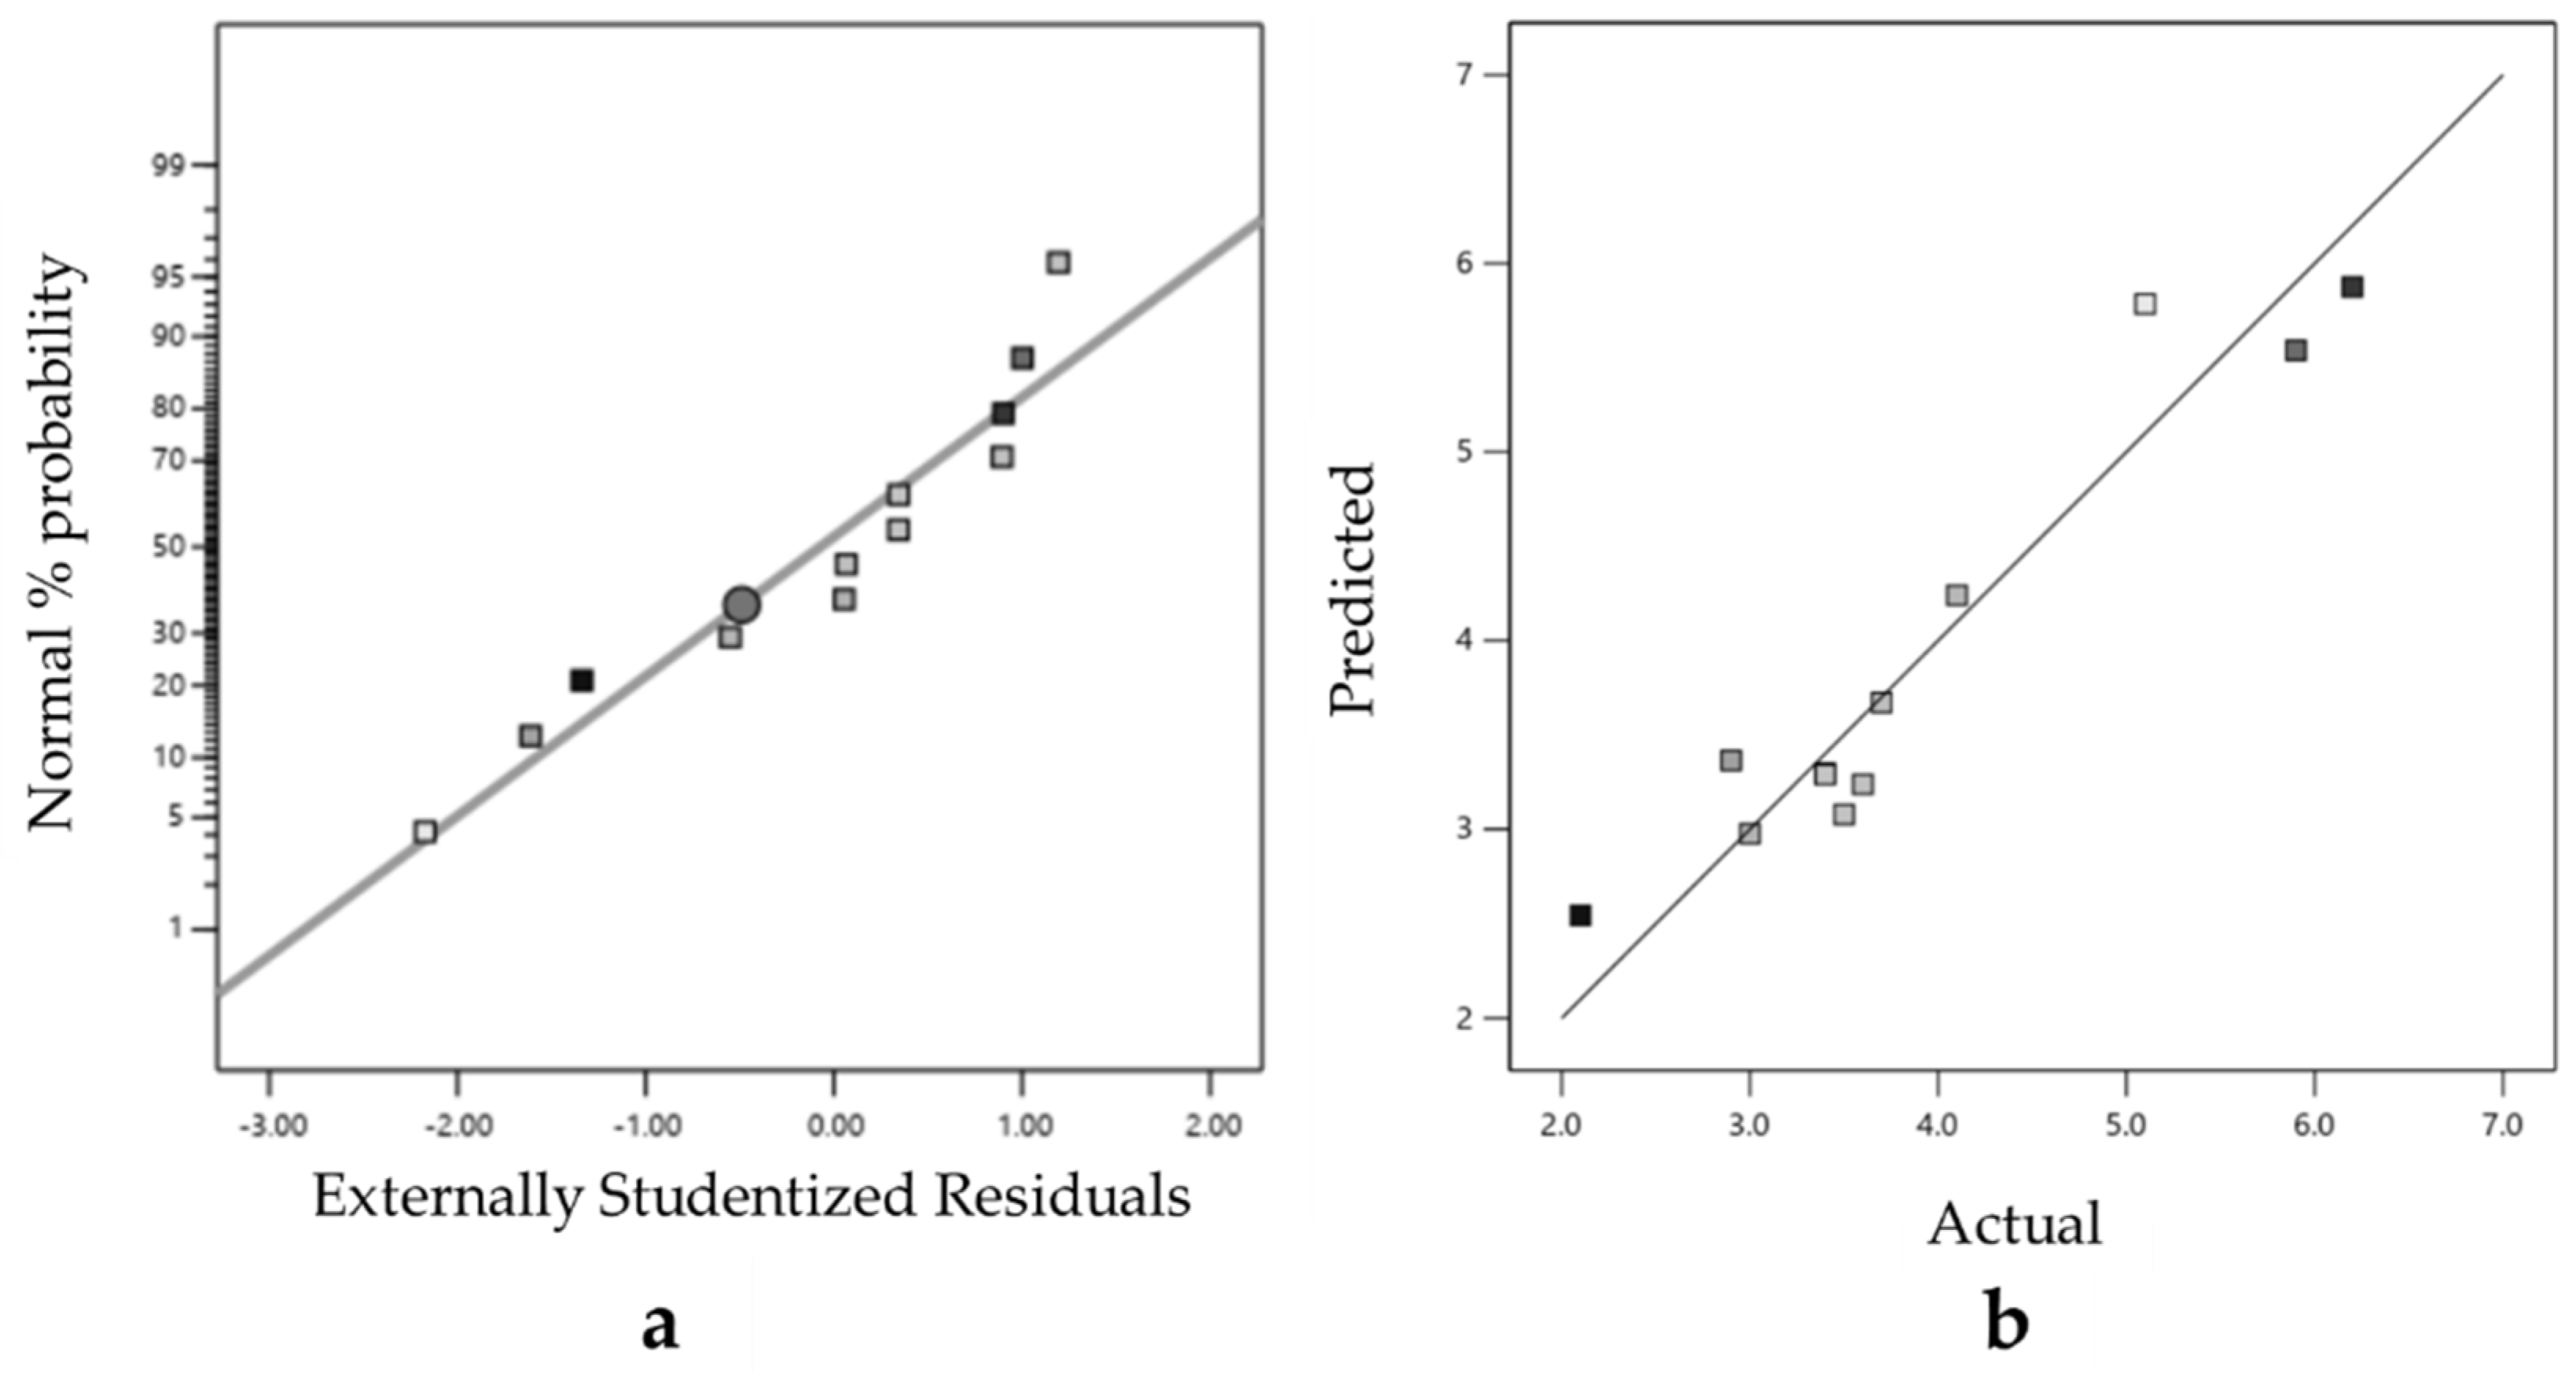
Table 9 presents the ANOVA results and Table 10 summarizes the fit statistics of CHI data analysis. The close alignment between the predicted R2 and the adjusted R2 highlighted the model’s robustness and its ability to predict values that closely matched the observed data. In summary, the high values of both adjusted R2 and predicted R2 reflected significant precision and reliability in the CHI analysis, emphasizing the model’s effectiveness in interpreting and forecasting CHI data. The developed equations based on statistical analysis are shown in Equations (13)–(16). Figure 15a and Figure 15b show the residual vs. predicted plot and predicted vs. actual plot values of UCS, respectively.
Table 9.
ANOVA of Cerchar hardness index for effect of heat treatment.
Table 10.
Fit statistics of the analysis of variance for CHI.

Figure 15.
(a) Distribution of residual and predicted values of CHI and (b) predicted vs. actual values, showing proper transformation and predictive capabilities of the equations developed.
CG sandstone:
MG sandstone:
FG sandstone:
IC sandstone:
where CHI is the Cerchar hardness index and T is the temperature in °C.
4. Numerical Modeling with FLAC3D
To achieve more realistic outcomes on stress distribution on sandstone samples, a three-dimensional simulation study was taken up to understand the effects of temperature variations on stress conditions. Numerical modeling was conducted using Finite Difference software, FLAC3D V.5.0. [27]. FLAC3D introduces significant improvements that enhance modeling solution run times. Performance gains are achieved through (1) expanded multi-threading capabilities and (2) major algorithm updates optimized for modern hardware. The thermal option in FLAC3D includes both conduction and advection models. The conduction models enable the simulation of transient heat conduction in materials, along with the resulting thermally induced displacements and stresses. Meanwhile, the advection model accounts for heat transport through convection, allowing for the simulation of temperature-dependent fluid density and thermal advection within the fluid.
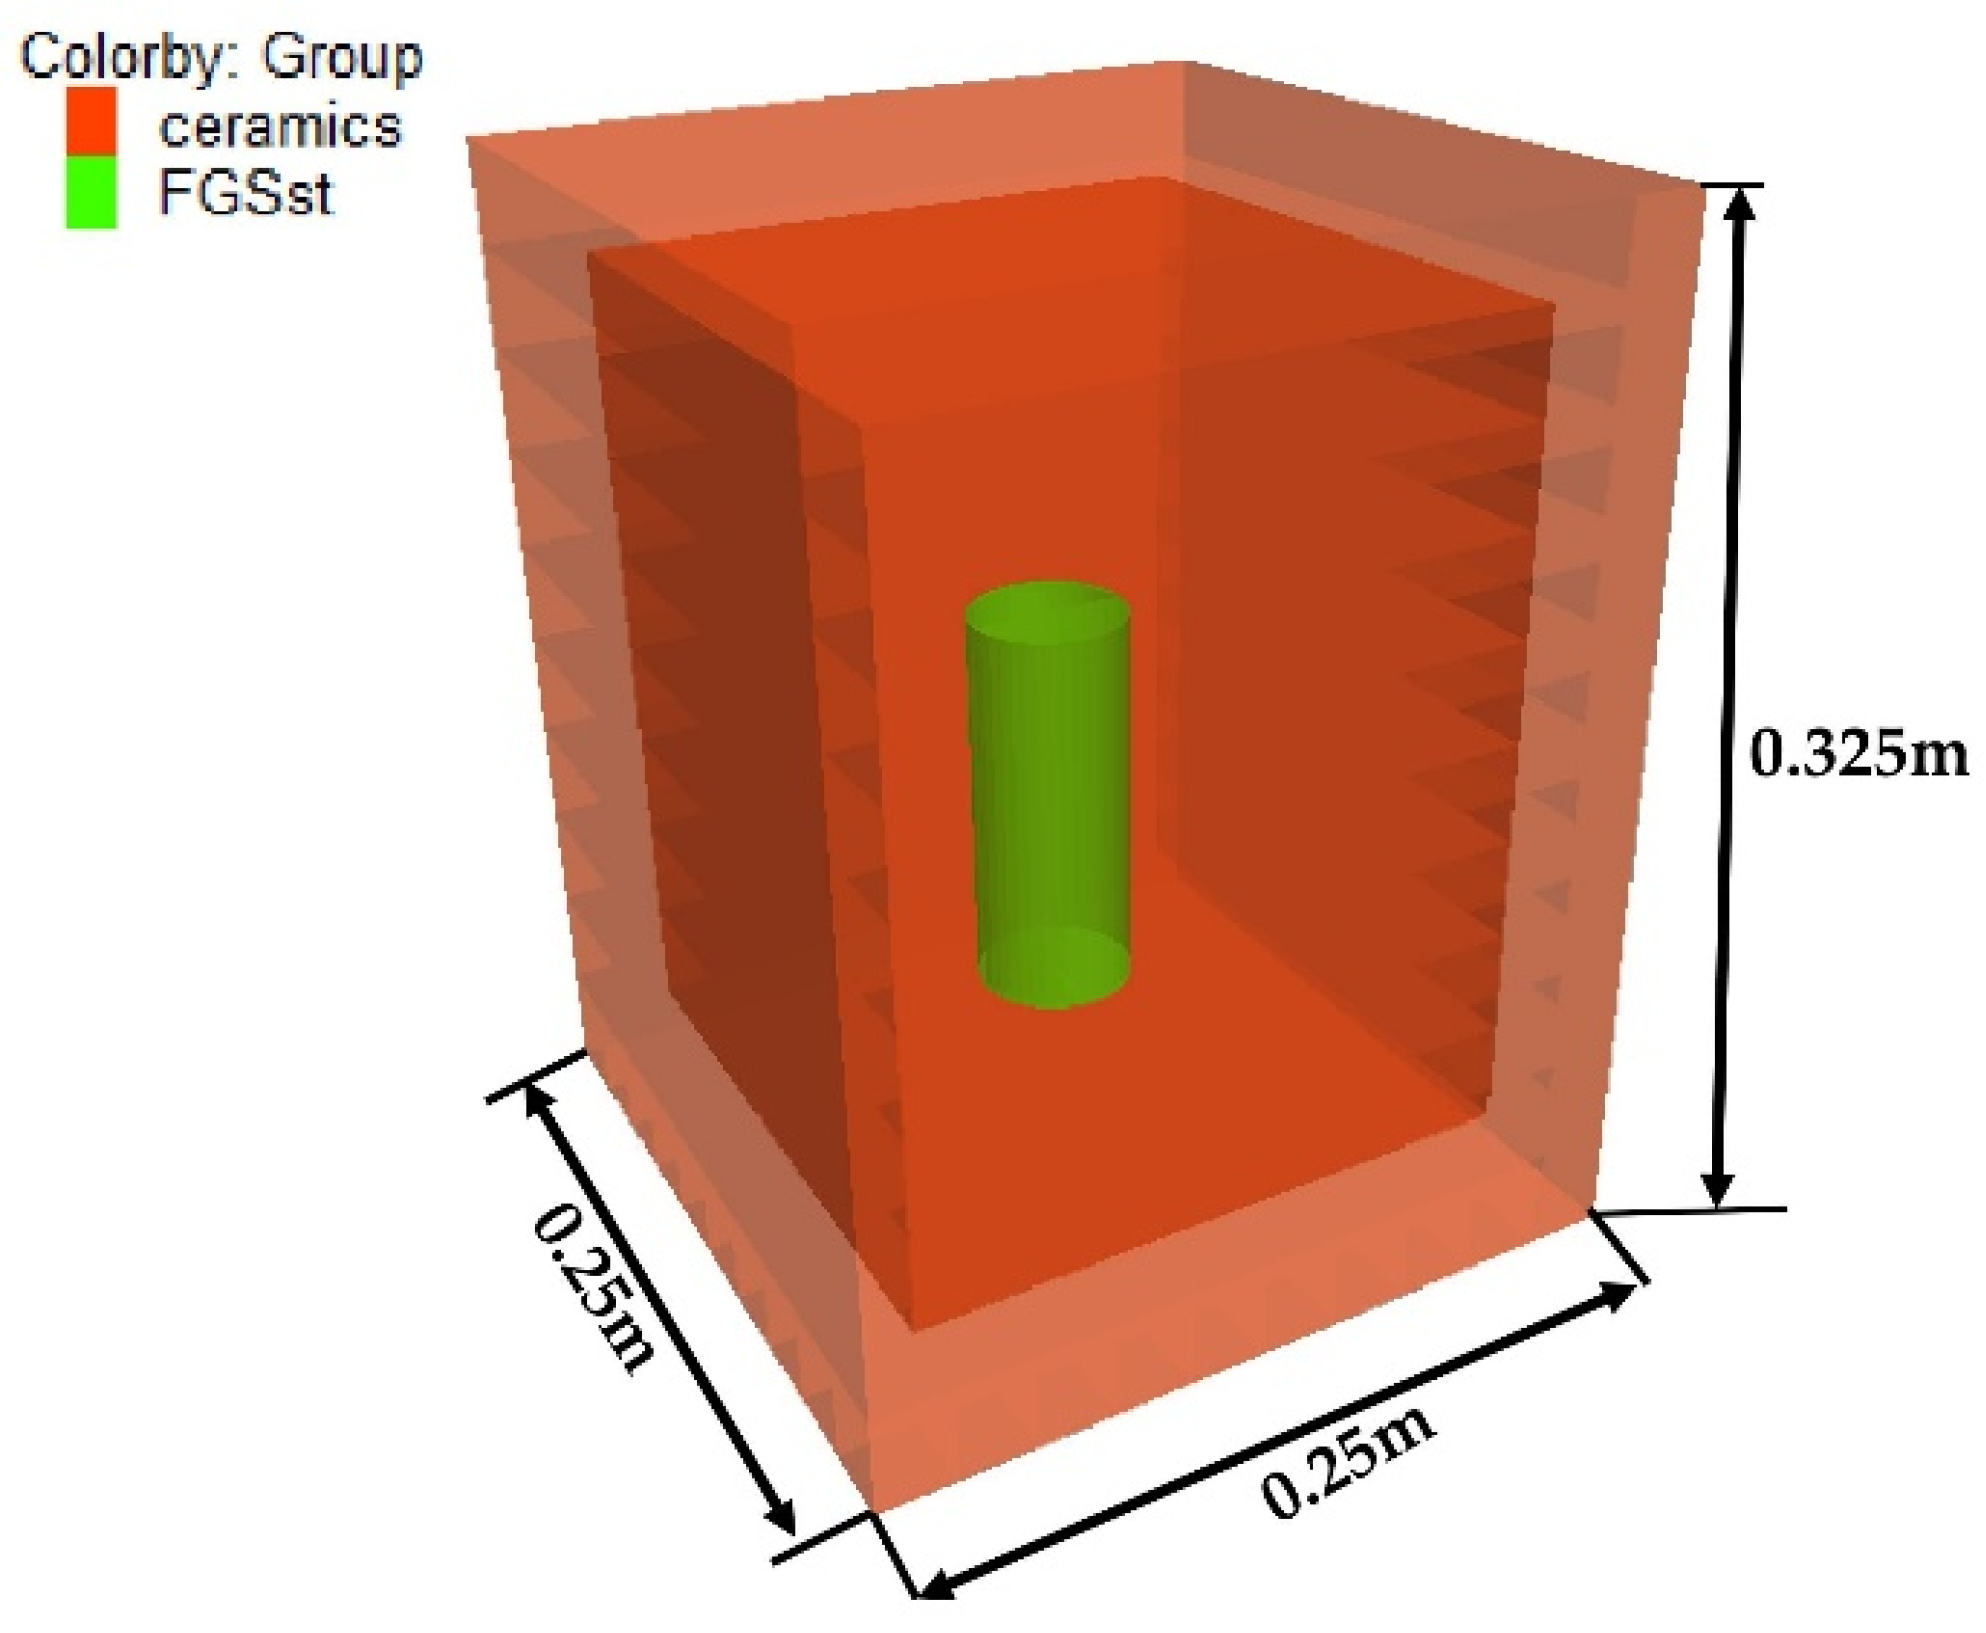
FLAC3D is a numerical modeling tool based on the finite difference method. It is one of the effective tools used to address the intricate challenges faced in mining, mechanical, geology, thermal, and geotechnical fields. FLAC3D incorporates both conduction and advection models. The conduction model allows the simulation of transient heat conduction in materials, and the development of thermally induced displacements and stresses. The advection model takes the transport of heat by convection into account; it can simulate temperature-dependent fluid density and thermal advection in the fluid. The modeling method involved creating a grid for simulating a cylindrical specimen with a size ratio of L/D = 2.5, surrounded by a ceramic brick measuring 0.25 m × 0.25 m × 0.325 m (length × width × height). To replicate actual laboratory conditions, the cylindrical specimen was assigned thermo-isotropic material behavior, while the ceramic brick was modeled as an elastic material. Material properties were applied accordingly, with density, bulk modulus, and shear modulus specified for the ceramic brick, and conductivity, specific heat, and thermal expansion coefficient for the cylindrical specimen. Boundary conditions included fixing the model’s bottom, applying roller conditions to the sides for free rotation, and leaving the top unconstrained. Figure 16 shows the developed numerical model consisting of ceramic brick and FGSST samples. Four types of sandstone samples were considered, i.e., CG sandstone, MG sandstone, FG sandstone, and IC sandstone. The samples were simulated at different temperature variations at 35 °C, 200 °C, 400 °C, 600 °C, and 800 °C. Table 11 outlines the properties used in the simulation for stress analysis: thermal conductivity (k) 4.2 W/m °C, specific heat (Cp) 880.0 J/kg °C, and linear thermal expansion coefficient (αt) 5.4 × 10⁻⁶/°C. A complete set of analysis showing contours is provided in Table A5.

Figure 16.
Numerical model design showing the ceramic and sandstone samples.
Table 11.
The properties used in the simulation process.
Stress Variation Due to Heat Treatment
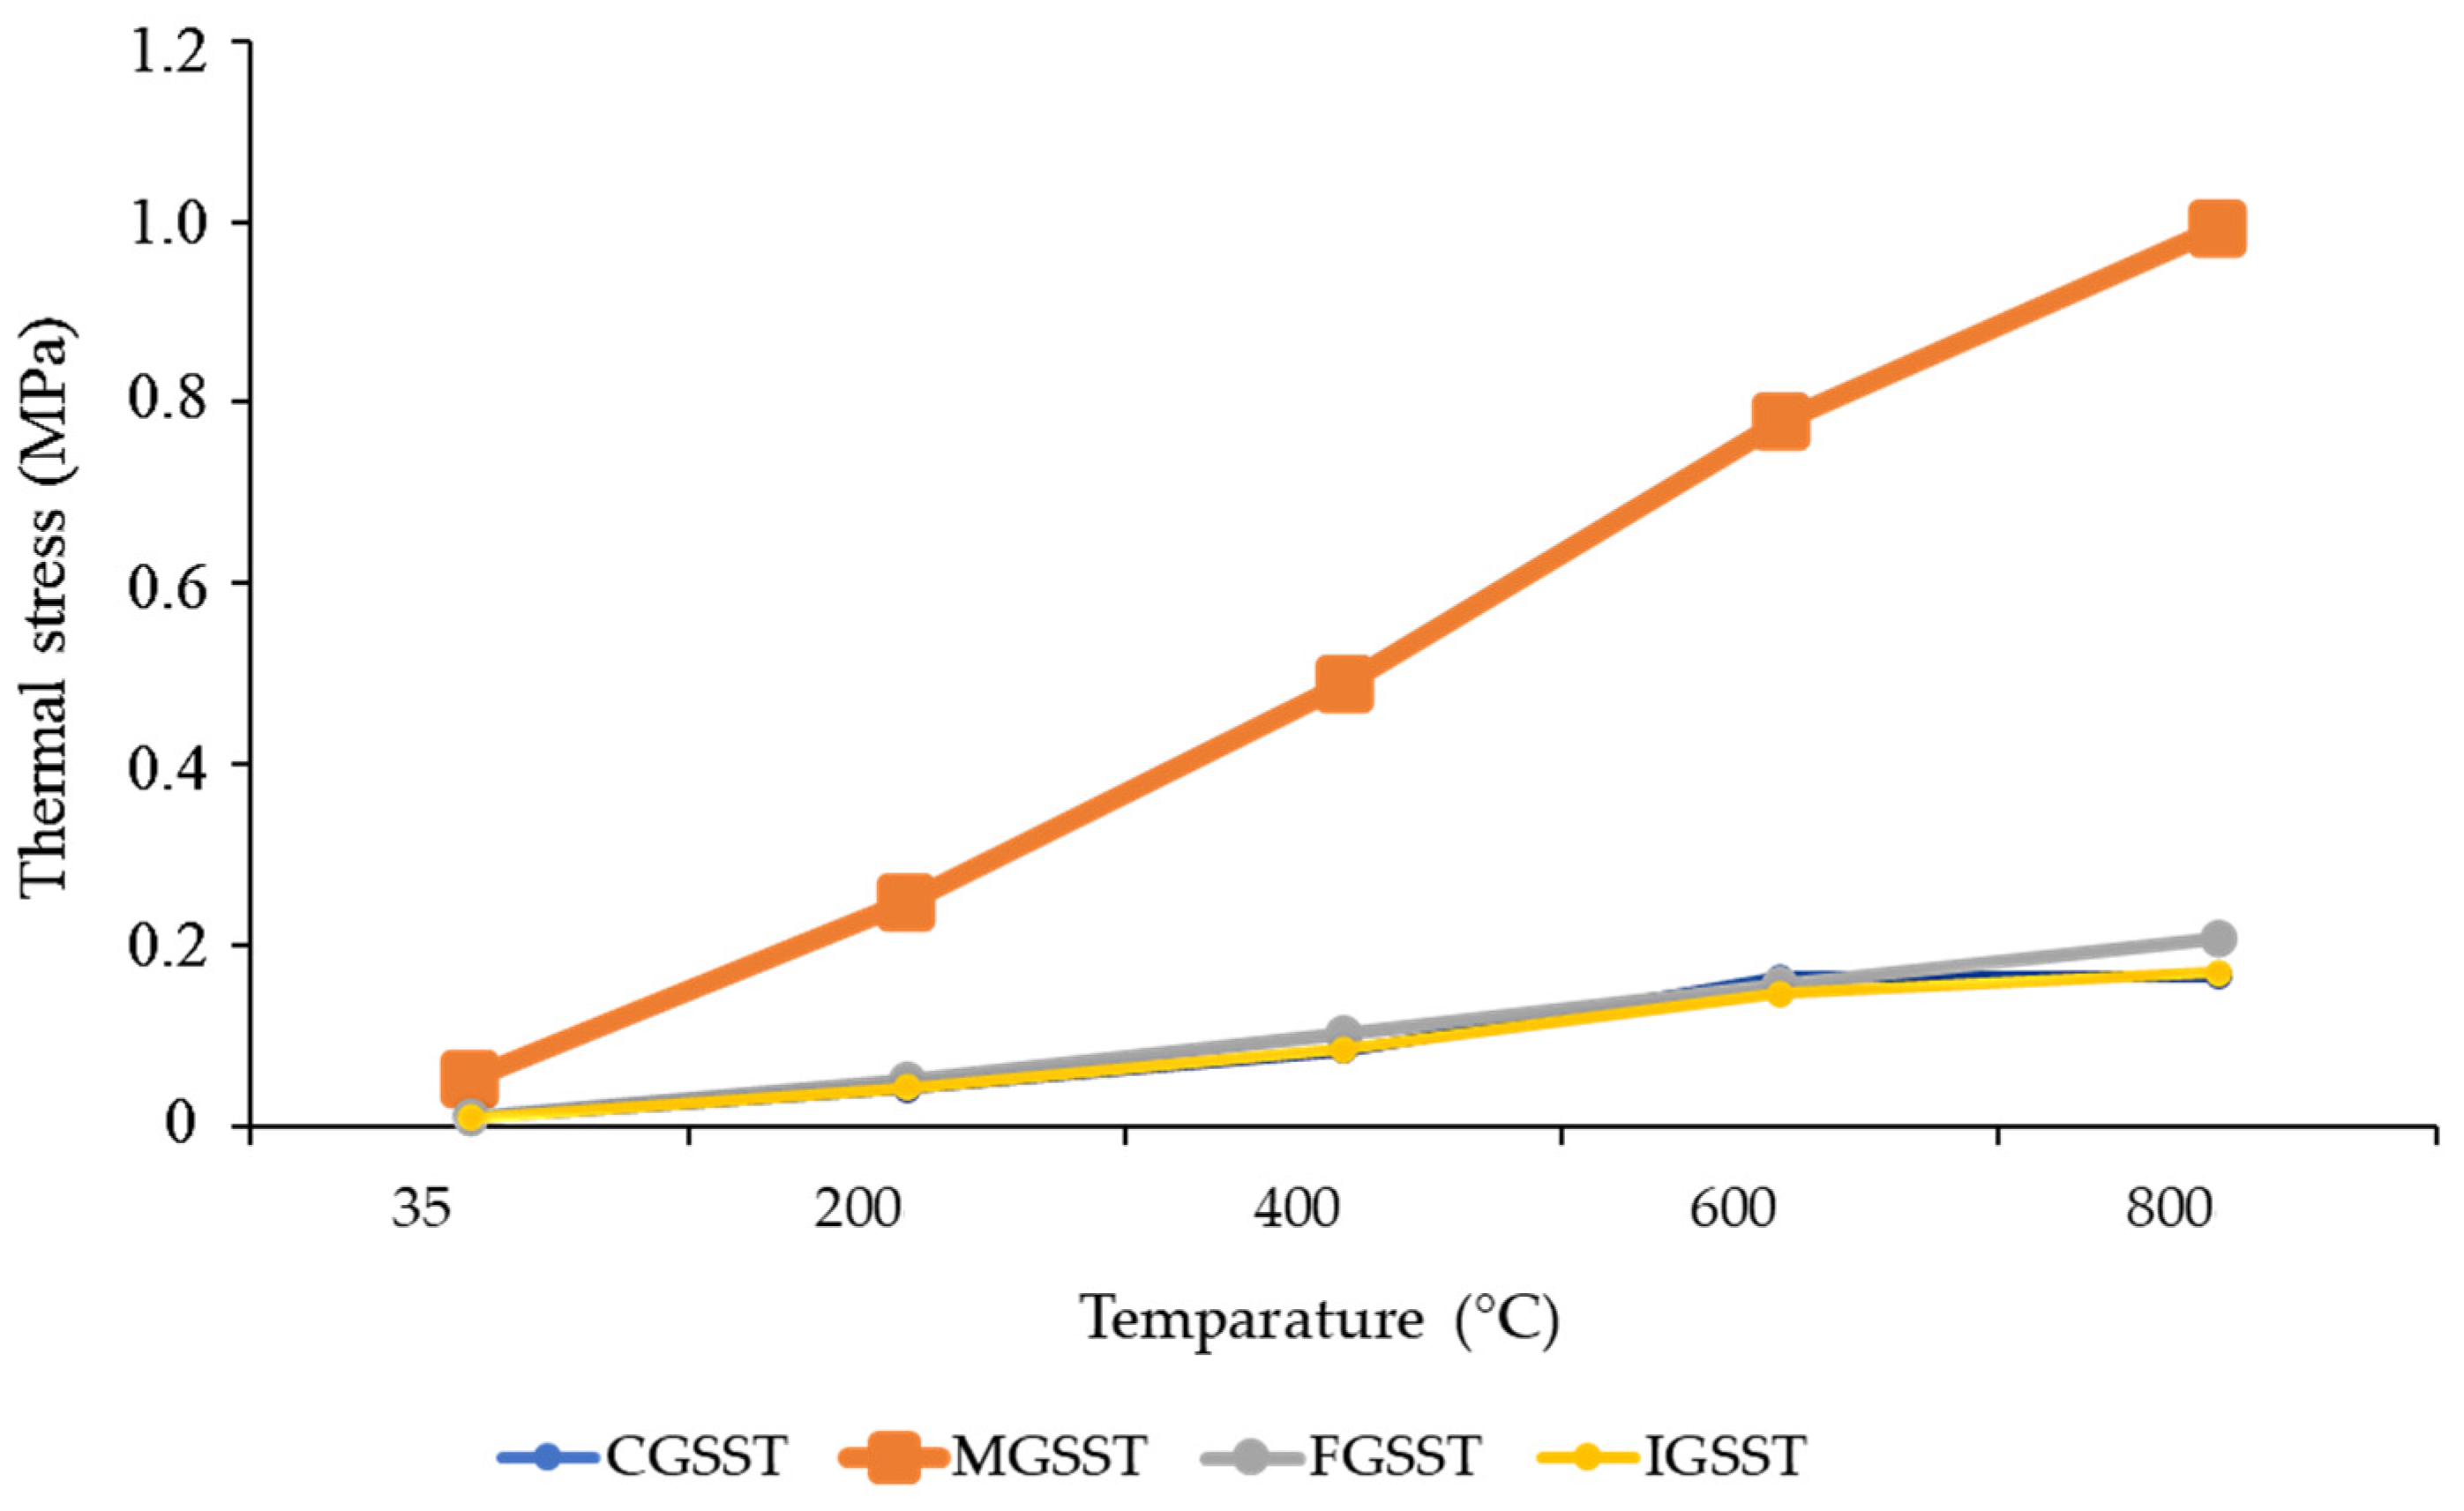
Figure 17 illustrates the variation in peak thermal stresses for different sandstone samples under varying temperature conditions. Modeling analysis revealed a linear increase in peak stress with rising temperature across all sandstone types. Among the samples, MG sandstone exhibited the highest peak stress distribution, reaching 0.99 MPa at a temperature of 800 °C. In comparison, other sandstone types exhibited significantly lower peak stress values: CG sandstone at 0.16 MPa, FG sandstone at 0.207 MPa, and IC sandstone at 0.169 MPa.
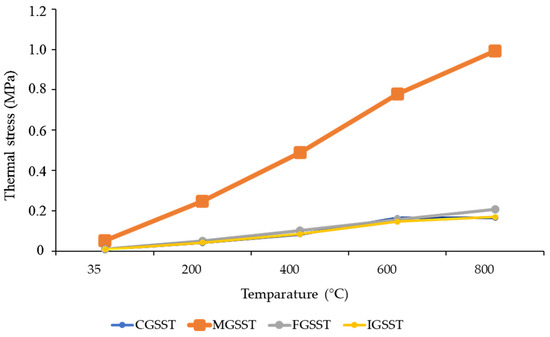
Figure 17.
The thermal stress variation on different sandstone samples at different temperature conditions.
The progressive increase in peak stress across all sandstone samples could be attributed to the thermal expansion of mineral particles. This phenomenon led to the formation of micropores and microcracks that caused irreversible deformation in the samples and confirmed the compressive strength analysis in Section 3.5.
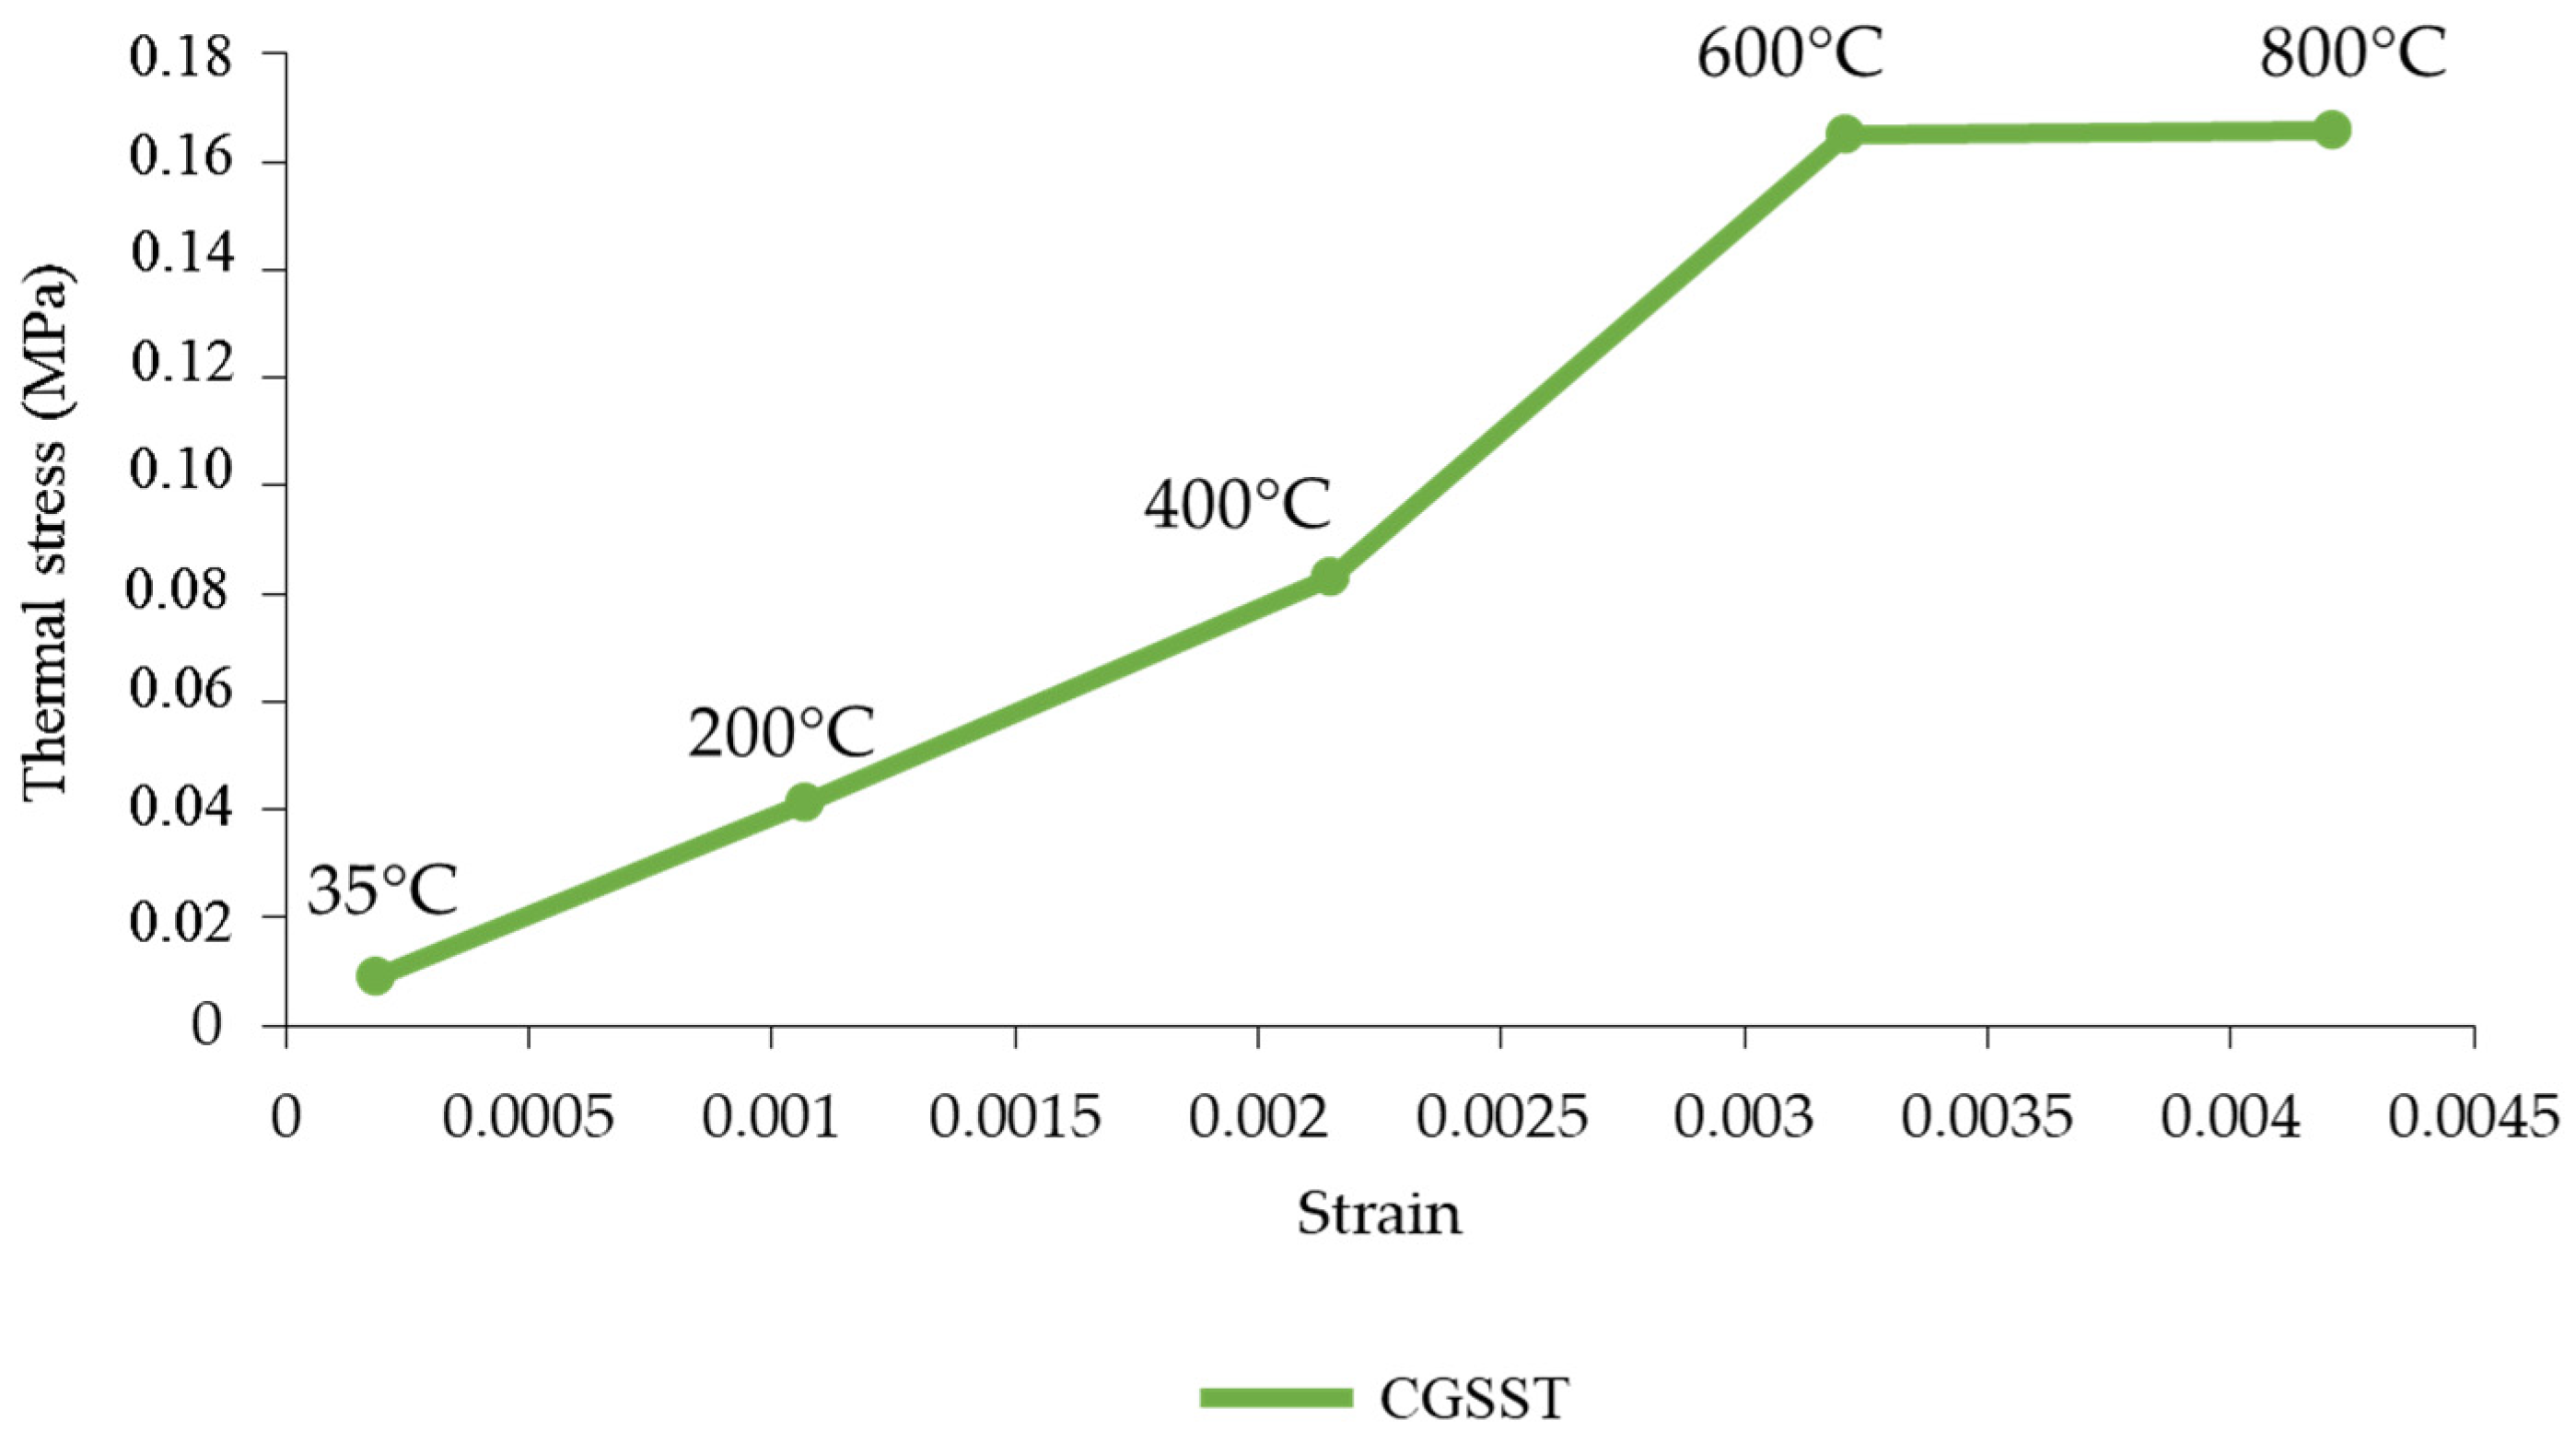
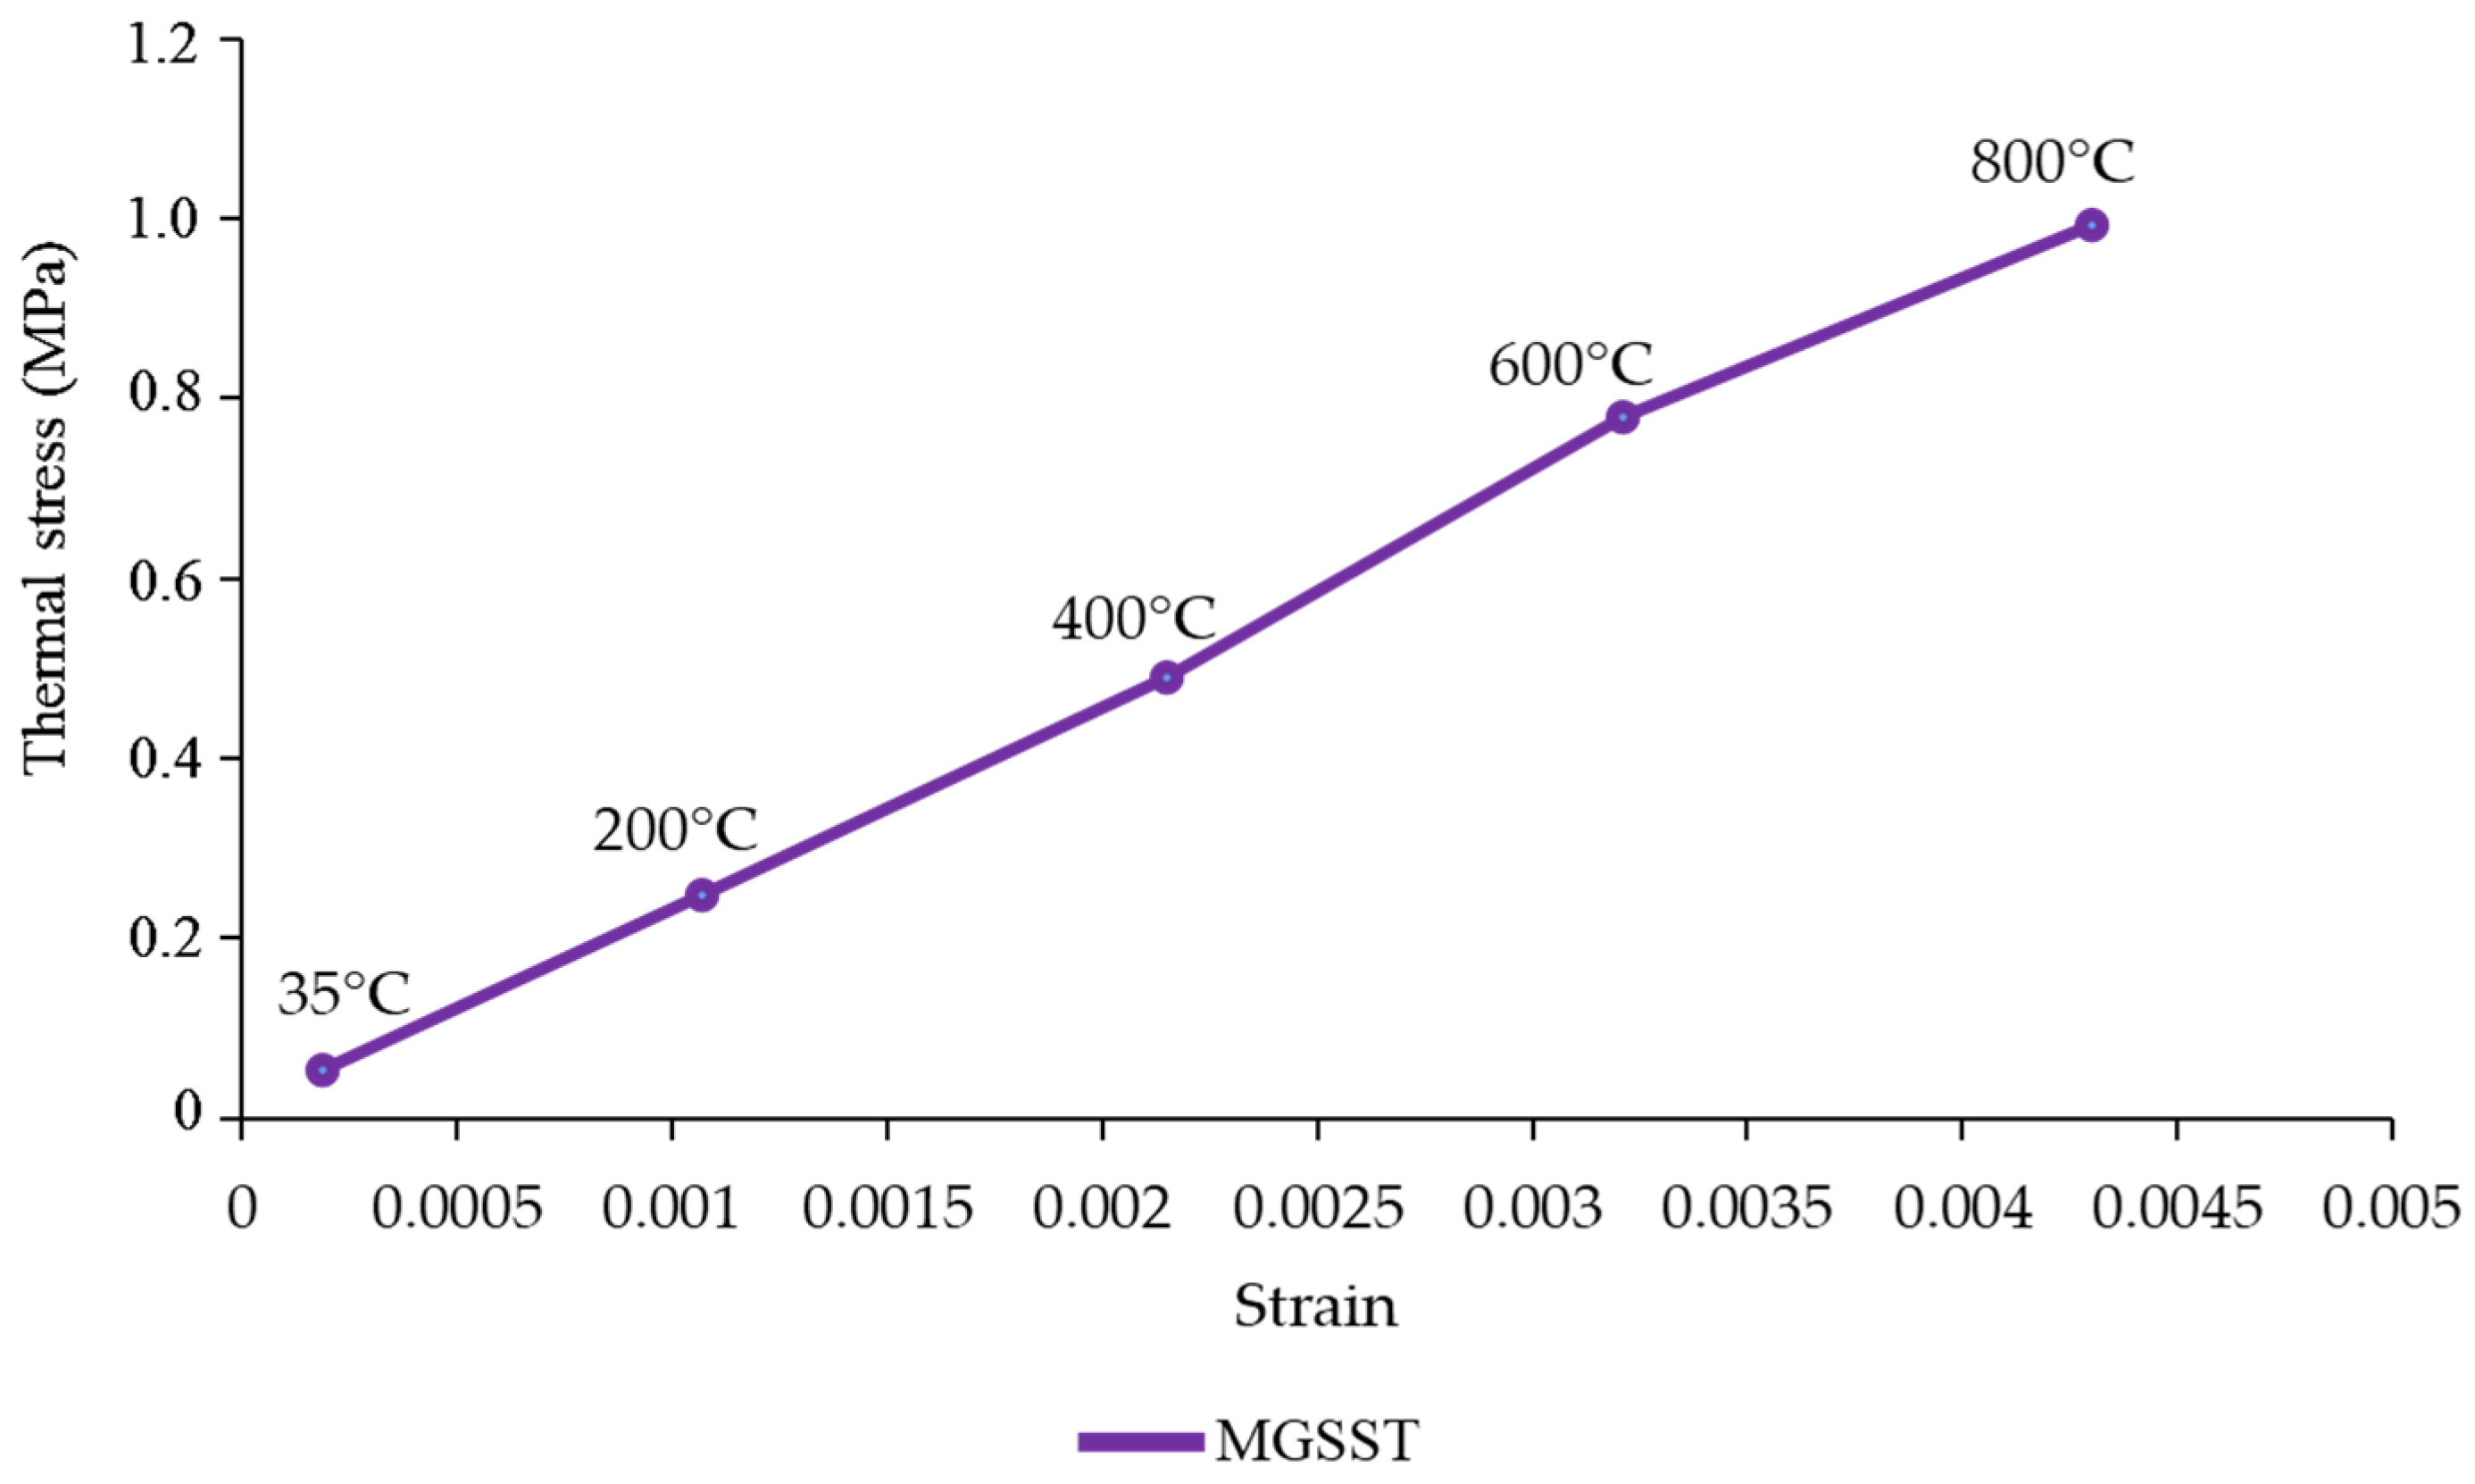
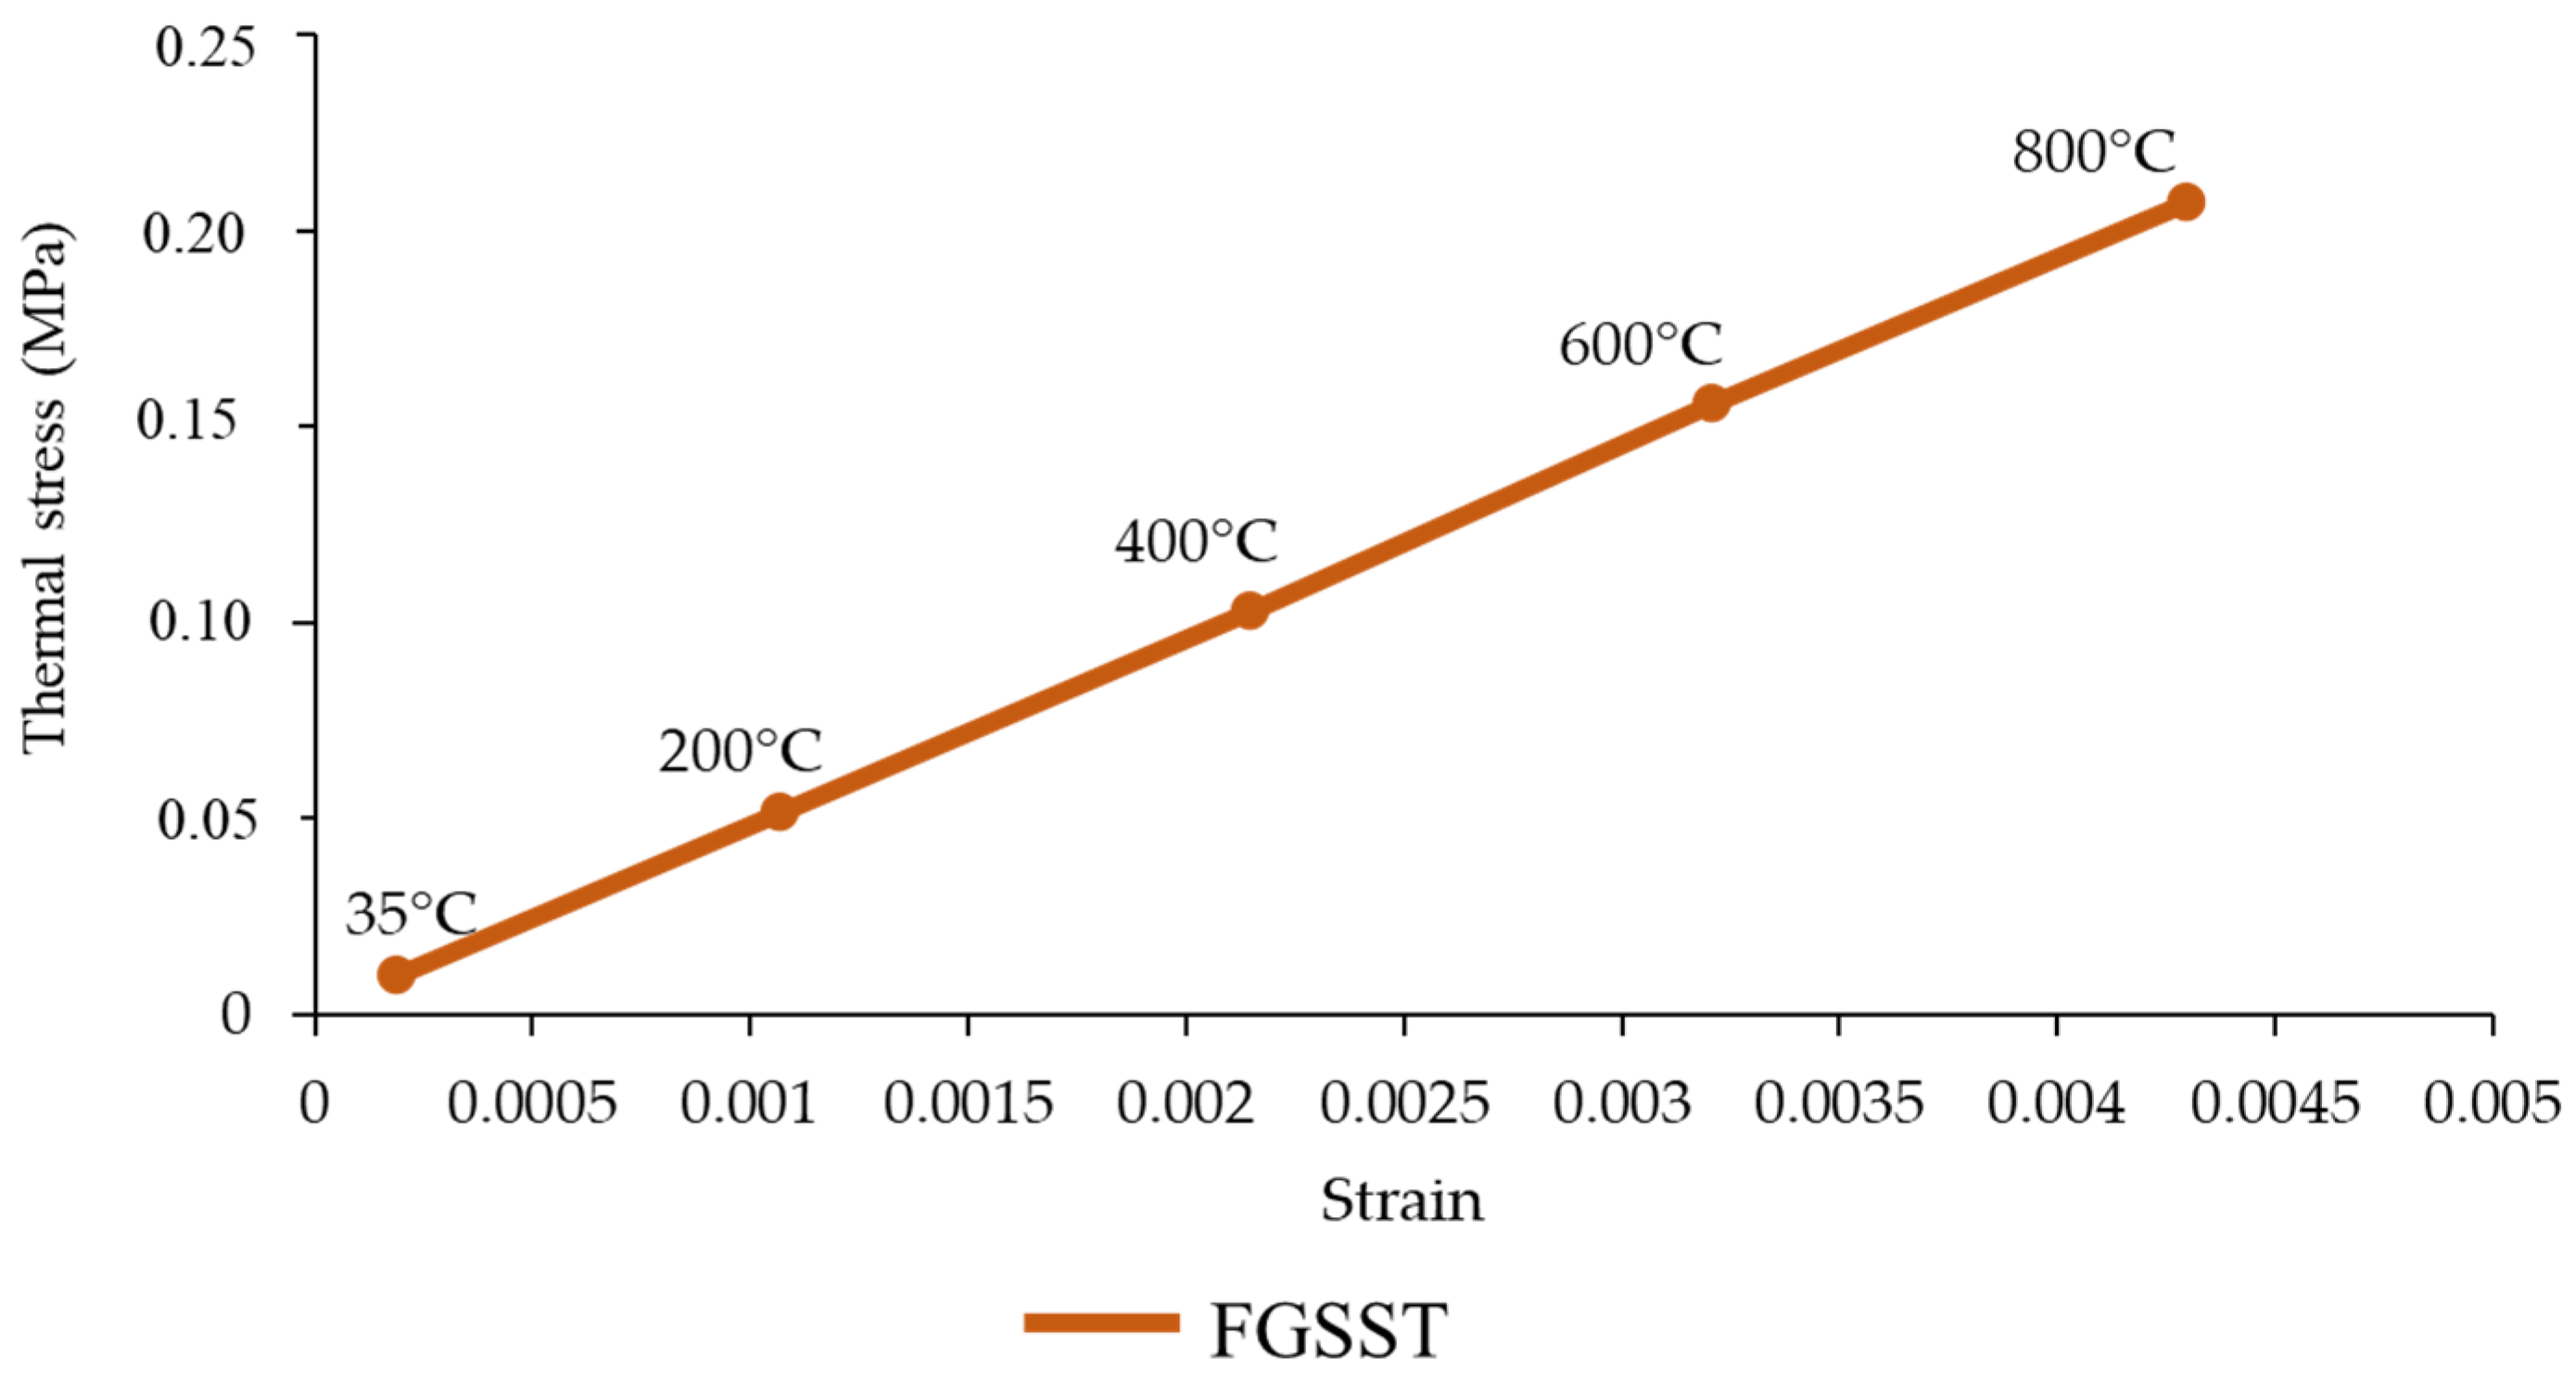
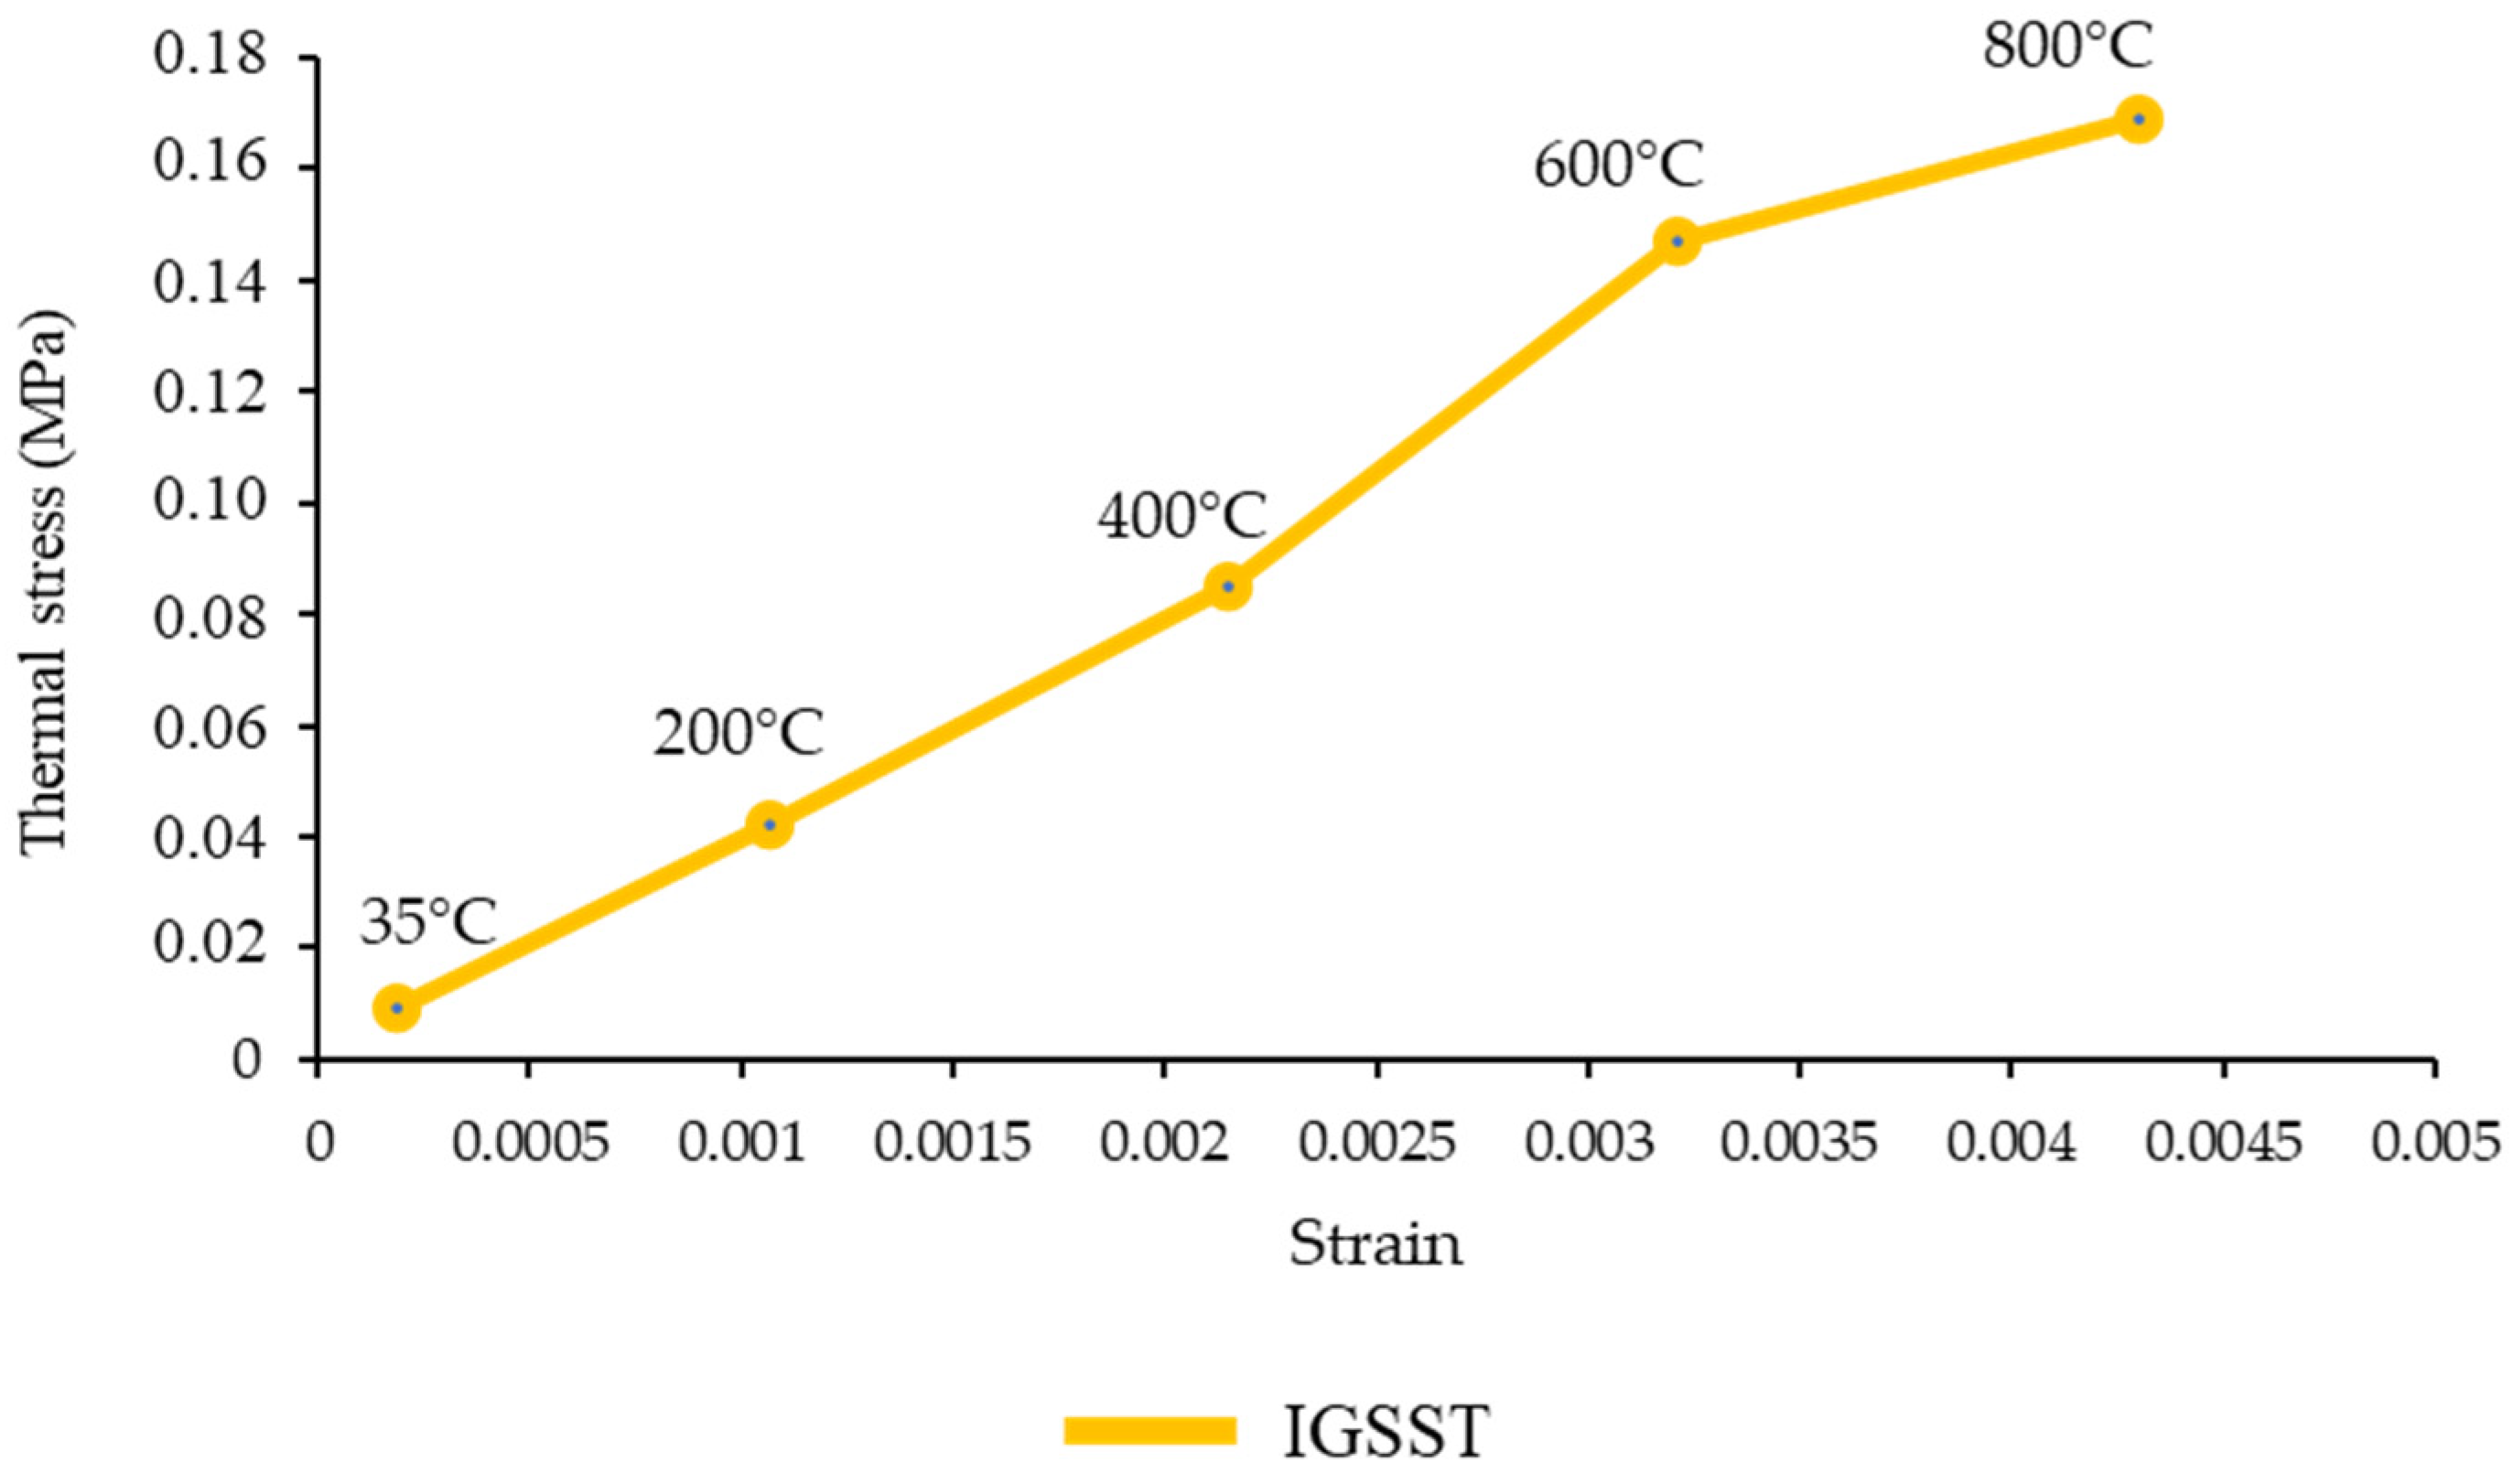
Additionally, the stress–strain graphs, as depicted in Figure 18, Figure 19, Figure 20 and Figure 21, provide visualization of the relationship between stress and strain for the various sandstone samples under different temperature conditions. The figures highlight the changes in mechanical behavior due to thermal effects, illustrating the direct correlation between increasing temperature and enhanced peak stress distribution.

Figure 18.
Thermal stress vs. strain of CG sandstone.
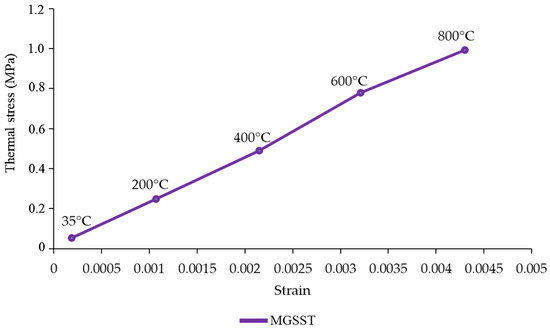
Figure 19.
Thermal Stress vs. strain of MG sandstone.

Figure 20.
Thermal stress vs. strain of FG sandstone.

Figure 21.
Thermal stress vs. strain in IC sandstone.
5. Conclusions
To understand the heat treatment effects on sandstone, particularly its physical, chemical, and dynamic properties, an extensive research study was conducted utilizing physical tests like density, UCS, p-wave velocity, XRF, and SEM and corroborated with numerical modeling.
Based on the mineral composition, the sandstones classified as arkosic types were further confirmed by the basic elemental classification adopted from the XRF analysis data. No major changes were observed in the elemental composition. The microscopic sections showed minor changes in the mineral domain, but SEM images revealed that the changes were more of a sub-microscopic nature. The analysis also showed the formation of microcracks due to exposure to high temperatures. The IC sandstone, however, could not be analyzed properly as it flaked on heating and provided unusual values.
The analysis also revealed that the CG sandstone’s diameter increased from 0.04% to 1.76% between 200 °C and 600 °C, then decreased to 0.79% at 800 °C. FG and IC sandstone followed a similar pattern, with consistent growth up to 600 °C and a decrease of about 1.42% at 800 °C. MG sandstone showed a different behavior, decreasing in diameter after 400 °C, then increasing to 1.38% at 800 °C.
The compressive strength initially increased with the higher temperatures, reaching approximately 24.09% at 200 °C. Beyond this point, the rate slowed, resulting in an increase of about 12.94% at 400 °C. Near 600 °C, an inflection point occurred, followed by a sharp decline of around −11.79%. Finally, at 800 °C, the compressive strength decreased further by approximately −6.37%, pointing to the initial release of volatiles, and changes in microstructures influenced the behavior at later stages of heating.
Also, as the temperature increased, the p-wave velocity decreased because of the expansion in the material’s pore volume and was related to the density of the material at such temperatures. This decrease was consistent and showed minimal variation over a narrow temperature range, making p-wave velocity a reliable indicator for assessing the impact of temperature on rock properties. CHI showed minor changes during heating but, in the case of IC sandstone, it increased rapidly from 4.1 to 12.3 up to 400 °C, then sharply decreased to about 3.4 at 800 °C, indicating a nonlinear hardness pattern and possible erratic sample behavior due to flaking.
The thermal stress strain relation of different sandstone samples during the heating process was further numerically modeled with FLAC3D (software, V.5.0). A linear increase in peak stress with rising temperature across all sandstone types was observed in the analysis. Moreover, MG sandstone exhibited the highest peak stress distribution, reaching 0.99 MPa at a temperature of 800 °C, compared with the other samples.
Multivariate predictive models were also developed for density, UCS, p-wave velocity, and CHI using ANOVA, which demonstrated significant correlations and a high degree of correlation. These models could provide valuable insights for decision making in fiery conditions, in situ coal-to-gas conversions, and mechanical excavations of coal measure rocks. In future, the experiments could be conducted with more variation in commercial rocks and experimental condition.
Author Contributions
S.P.: sample collection, data compilation, initial Ms. preparation and basic analysis; N.R.K.: numerical analysis, editorial corrections, formatting; H.I.: comprehensive analysis check, MS. uplifting; A.K.R.: data verification, advance statistical analysis, MS. concept and MS. finalization; S.C.: data interpretation, supervision of the MS. preparation; V.A.M.: data generation of sub-microscopic, microscopic, and XRF, interpretation; V.M.S.R.M.: data generation of physical and cutting characteristics, interpretation, and analysis. All authors have read and agreed to the published version of the manuscript.
Funding
This research received no external funding.
Data Availability Statement
Summaries of the data (tables) have been provided in the text. A complete data set can be provided on request.
Acknowledgments
The authors are thankful to the director of CSIR-Central Institute of Mining and Fuel Research (CSIR-CIMFR), Dhanbad, for permitting to publish this paper. Thanks are due to Sri Vivek Iyer for his help with the finalization of the corrections. The views expressed in this paper are those of the authors and not necessarily of their organization.
Conflicts of Interest
The authors declare no conflicts of interest.
Appendix A
The stress contour plots obtained from numerical modeling on different sandstone samples are shown in the tables.
Table A1.
Summary statistics of the data of density from testing of different varieties of rocks.
Table A1.
Summary statistics of the data of density from testing of different varieties of rocks.
| Statistical Parameter | CG Sandstone | MG Sandstone | FG Sandstone | IC Sandstone |
|---|---|---|---|---|
| Mean | 2059.4 | 2340.2 | 2386 | 2374.6 |
| Standard Error | 27.5 | 28.0 | 17.6 | 20.5 |
| Median | 2087 | 2307 | 2392 | 2371 |
| Standard Deviation | 61.45 | 62.61 | 39.29 | 45.86 |
| Sample Variance | 3776.3 | 3919.7 | 1544.0 | 2102.8 |
| Kurtosis | −2.09 | −3.00 | 0.42 | −0.67 |
| Skewness | −0.70 | 0.44 | −0.24 | −0.53 |
| Range | 137 | 134 | 106 | 112 |
| Minimum | 1976 | 2276 | 2331 | 2309 |
| Maximum | 2113 | 2410 | 2437 | 2421 |
| Sum | 10,297 | 11,701 | 11,930 | 11,873 |
| Count | 5 | 5 | 5 | 5 |
Legend: CG—coarse-grained, MG—medium-grained, FG—fine-grained, IC—intercalated sandstone.
Table A2.
Summary statistics of the data of compressive strength (UCS) from testing of different varieties of rocks.
Table A2.
Summary statistics of the data of compressive strength (UCS) from testing of different varieties of rocks.
| Statistics | CG Sandstone | MG Sandstone | FG Sandstone | IC Sandstone |
|---|---|---|---|---|
| Mean | 15.83 | 28.47 | 31.25 | 29.03 |
| Standard Error | 0.92 | 1.39 | 1.59 | 0.74 |
| Median | 16.01 | 29.82 | 32.11 | 29.13 |
| Standard Deviation | 2.06 | 3.10 | 3.55 | 1.65 |
| Sample Variance | 4.23 | 9.62 | 12.60 | 2.73 |
| Kurtosis | 0.43 | −2.45 | 3.96 | −0.90 |
| Skewness | −0.23 | −0.29 | −1.92 | −0.11 |
| Range | 5.55 | 7.18 | 8.94 | 4.24 |
| Minimum | 12.95 | 24.83 | 25.08 | 26.87 |
| Maximum | 18.5 | 32.01 | 34.02 | 31.11 |
| Sum | 79.15 | 142.35 | 156.24 | 145.17 |
| Count | 5 | 5 | 5 | 5 |
Legend: CG—coarse-grained, MG—medium-grained, FG—fine-grained, IC—intercalated sandstone.
Table A3.
Summary statistics of the data of p-wave velocity from testing of sandstone.
Table A3.
Summary statistics of the data of p-wave velocity from testing of sandstone.
| Statistical Parameter | CG Sandstone | MG Sandstone | FG Sandstone | IC Sandstone |
|---|---|---|---|---|
| Mean | 2283.00 | 1558.00 | 2309.33 | 1737.33 |
| Standard Error | 298.00 | 419.88 | 716.12 | 580.17 |
| Median | 2283.00 | 1930.00 | 2586.00 | 1705.00 |
| Standard Deviation | 421.44 | 727.25 | 1240.36 | 1004.89 |
| Sample Variance | 177,608.00 | 528,892.00 | 1,538,497.33 | 1,009,804.33 |
| Skewness | −0.92 | −1.70 | −0.95 | 0.14 |
| Range | 596.00 | 1304.00 | 2434.00 | 2009.00 |
| Minimum | 1985.00 | 720.00 | 954.00 | 749.00 |
| Maximum | 2581.00 | 2024.00 | 3388.00 | 2758.00 |
| Sum | 4566.00 | 4674.00 | 6928.00 | 5212.00 |
| Count | 2.00 | 3.00 | 3.00 | 3.00 |
Legend: CG—coarse-grained, MG—medium-grained, FG—fine-grained, IC—intercalated sandstone.
Table A4.
Summary statistics of the data of CHI from testing of sandstone.
Table A4.
Summary statistics of the data of CHI from testing of sandstone.
| Statistical Parameter | CG Sandstone | MG Sandstone | FG Sandstone | IC Sandstone |
|---|---|---|---|---|
| Mean | 2.86 | 3.3 | 5.73 | 6.6 |
| Standard Error | 0.41 | 0.21 | 0.32 | 2.85 |
| Median | 3 | 3.4 | 5.9 | 4.1 |
| Standard Deviation | 0.70 | 0.36 | 0.56 | 4.94 |
| Sample Variance | 0.50 | 0.13 | 0.32 | 24.49 |
| Skewness | −0.81 | −1.15 | −1.20 | 1.69 |
| Range | 1.4 | 0.7 | 1.1 | 8.9 |
| Minimum | 2.1 | 2.9 | 5.1 | 3.4 |
| Maximum | 3.5 | 3.6 | 6.2 | 12.3 |
| Sum | 8.6 | 9.9 | 17.2 | 19.8 |
| Count | 3 | 3 | 3 | 3 |
Legend: CG—coarse-grained, MG—medium-grained, FG—fine-grained, IC—intercalated sandstone.
Table A5.
Stress contours of the samples at various temperatures using numerical modeling method.
Table A5.
Stress contours of the samples at various temperatures using numerical modeling method.
| Temperature (°C) | 35 °C | 200 °C | 400 °C | 600 °C | 800 °C |
|---|---|---|---|---|---|
| Rock Type | |||||
| CG sandstone |  |  |  |  |  |
| MG sandstone |  |  |  |  |  |
| FG sandstone |  |  |  |  |  |
| IC sandstone |  |  |  |  |  |
References
- Lü, C.; Sun, Q.; Zhang, W.; Geng, J.; Qi, Y.; Lu, L. The Effect of High Temperature on Tensile Strength of Sandstone. Appl. Therm. Eng. 2017, 111, 573–579. [Google Scholar] [CrossRef]
- Yang, S.Q.; Ranjith, P.G.; Jing, H.W.; Tian, W.L.; Ju, Y. An Experimental Investigation on Thermal Damage and Failure Mechanical Behavior of Granite after Exposure to Different High Temperature Treatments. Geothermics 2017, 65, 180–197. [Google Scholar] [CrossRef]
- Liu, S.; Xu, J. Mechanical Properties of Qinling Biotite Granite after High Temperature Treatment. Int. J. Rock Mech. Min. Sci. 2014, 71, 188–193. [Google Scholar] [CrossRef]
- Tang, Z.C.; Sun, M.; Peng, J. Influence of High Temperature Duration on Physical, Thermal and Mechanical Properties of a Fine-Grained Marble. Appl. Therm. Eng. 2019, 156, 34–50. [Google Scholar] [CrossRef]
- Guo, Q.; Su, H.; Liu, J.; Yin, Q.; Jing, H.; Yu, L. An Experimental Study on the Fracture Behaviors of Marble Specimens Subjected to High Temperature Treatment. Eng. Fract. Mech. 2020, 225, 106862. [Google Scholar] [CrossRef]
- Vagnon, F.; Colombero, C.; Colombo, F.; Comina, C.; Ferrero, A.M.; Mandrone, G.; Vinciguerra, S.C. Effects of Thermal Treatment on Physical and Mechanical Properties of Valdieri Marble—NW Italy. Int. J. Rock Mech. Min. Sci. 2019, 116, 75–86. [Google Scholar] [CrossRef]
- Zhao, Z.; Dou, Z.; Xu, H.; Liu, Z. Shear Behavior of Beishan Granite Fractures after Thermal Treatment. Eng. Fract. Mech. 2019, 213, 223–240. [Google Scholar] [CrossRef]
- Yang, S.; Li, Y.; Tang, X.; Liu, J. Experimental Simulation and Numerical Modeling of Deformation and Damage Evolution of Pre-Holed Sandstones After Heat Treatment. Comput. Model. Eng. Sci. 2020, 122, 633–659. [Google Scholar] [CrossRef]
- Wu, Q.; Weng, L.; Zhao, Y.; Guo, B.; Luo, T. On the Tensile Mechanical Characteristics of Fine-Grained Granite after Heating/Cooling Treatments with Different Cooling Rates. Eng. Geol. 2019, 253, 94–110. [Google Scholar] [CrossRef]
- Yin, T.B.; Shu, R.H.; Li, X.B.; Wang, P.; Liu, X.L. Comparison of Mechanical Properties in High Temperature and Thermal Treatment Granite. Trans. Nonferrous Met. Soc. China (Engl. Ed.) 2016, 26, 1926–1937. [Google Scholar] [CrossRef]
- Talukdar, M.; Guha, D.; Singh, T.N. Journal of Rock Mechanics and Geotechnical Engineering Correlating Mode-I Fracture Toughness and Mechanical Properties of Heat-Treated Crystalline Rocks. J. Rock Mech. Geotech. Eng. 2018, 10, 91–101. [Google Scholar] [CrossRef]
- Sun, Q.; Lü, C.; Cao, L.; Li, W.; Geng, J.; Zhang, W. International Journal of Rock Mechanics & Mining Sciences Thermal Properties of Sandstone after Treatment at High Temperature. Int. J. Rock Mech. Min. Sci. 2016, 85, 60–66. [Google Scholar] [CrossRef]
- Yang, Y.; Wei, S.; Zhang, J.; Wu, J.; Zhang, C. Effect Study of Heat Treatment on Tensile Properties of Coarse Sandstone. Sci. Rep. 2022, 12, 17525. [Google Scholar] [CrossRef]
- Fan, L.F.; Wu, Z.J.; Wan, Z.; Gao, J.W. Experimental Investigation of Thermal Effects on Dynamic Behavior of Granite. Appl. Therm. Eng. 2017, 125, 94–103. [Google Scholar] [CrossRef]
- Yagiz, S. P-Wave Velocity Test for Assessment of Geotechnical Properties of Some Rock Materials. Bull. Mater. Sci. 2011, 34, 947–953. [Google Scholar] [CrossRef]
- Mohd-Nordin, M.M.; Mohamed, Z. Empirical Correlation of P-Wave Velocity to the Density of Weathered Granite. In InCIEC 2013: Proceedings of the International Civil and Infrastructure Engineering Conference 2013; Springer: Singapore, 2014; pp. 489–499. [Google Scholar] [CrossRef]
- Chen, Y.L.; Ni, J.; Shao, W.; Azzam, R. Experimental Study on the Influence of Temperature on the Mechanical Properties of Granite under Uni-Axial Compression and Fatigue Loading. Int. J. Rock Mech. Min. Sci. 2012, 56, 62–66. [Google Scholar] [CrossRef]
- Li, M.; Liu, X. Effect of Thermal Treatment on the Physical and Mechanical Properties of Sandstone: Insights from Experiments and Simulations Effect of Thermal Treatment on the Physical and Mechanical Properties of Sandstone: Insights from Experiments and Simulations. Rock Mech. Rock Eng. 2022, 55, 3171–3194. [Google Scholar] [CrossRef]
- Huang, Z.; Zeng, W.; Wu, Y.; Li, S.; Gu, Q.; Zhao, K. Effects of Temperature and Acid Solution on the Physical and Tensile Mechanical Properties of Red Sandstones. Environ. Sci. Pollut. Res. 2021, 28, 20608–20623. [Google Scholar] [CrossRef] [PubMed]
- Zhang, H.; Sun, Q.; Geng, J.; Jia, H. Effect of High Temperature on Physical Properties of Yellow Sandstone. Heat Mass Transf. Stoffuebertragung 2021, 57, 1981–1995. [Google Scholar] [CrossRef]
- Li, X.; Huang, S.; Yin, T.; Li, X.; Peng, K.; Fan, X. Experimental Investigation on the Energy Properties and Failure Process of Thermal Shock Treated Sandstone Subjected to Coupled Dynamic and Static Loads. Minerals 2022, 12, 25. [Google Scholar] [CrossRef]
- Zhang, H.; Sun, Q.; Jia, H.; Dong, Z.; Luo, T. Effects of High-Temperature Thermal Treatment on the Porosity of Red Sandstone: An NMR Analysis. Acta Geophys. 2021, 69, 113–124. [Google Scholar] [CrossRef]
- Guo, J.; Lei, Y.; Yang, Y.; Cheng, P.; Wang, Z.; Wu, S. Effects of High Temperature Treatments on Strength and Failure Behavior of Sandstone under Dynamic Impact Loads. Sustainability 2023, 15, 794. [Google Scholar] [CrossRef]
- Xu, C. Test Study on Uniaxial Compressive Strength of Fine Sandstone after High Temperature. In Proceedings of the 2015 3rd International Conference on Advances in Energy and Environmental Science, Zhuhai, China, 25–26 July 2015; pp. 121–126. [Google Scholar]
- Jiang, H.; Jiang, A. Cut-Through Fractured Seepage Properties and Numerical Simulation of Sandstone after Different Temperature Treatments. Geofluids 2021, 2021, 5534121. [Google Scholar] [CrossRef]
- Li, M.; Mao, X.; Cao, L.; Pu, H.; Mao, R.; Lu, A. Effects of Thermal Treatment on the Dynamic Mechanical Properties of Coal Measures Sandstone. Rock Mech. Rock Eng. 2016, 49, 3525–3539. [Google Scholar] [CrossRef]
- Alber, M.; Yarali, O.; Dahl, F.; Bruland, A.; Kasling, H.; Michalakopoulos, T.N.; Cardu, M.; Hagan, P.; Aydin, H.; Ozarslan, A. ISRM Suggested Method for Determining the Abrasivity of Rock by the Cerchar Abrasivity Test. Rock Mech. Rock Eng. 2013, 47, 261–266. [Google Scholar] [CrossRef]
- Folk, R.L. Petrology of Sedimentary Rocks; Hemphill Publishing Company: Cedar Hill, TX, USA, 1980. [Google Scholar]
- Blatt, H.; Middleton, G.; Murray, R. Origin of Sedimentary Rocks; Prentice Hall: Englewood Cliffs, NJ, USA, 1980; ISBN 0-13-642710-3. [Google Scholar]
- Zhang, J.; Shen, Y.; Yang, G.; Zhang, H.; Wang, Y.; Hou, X.; Sun, Q.; Li, G. Inconsistency of Changes in Uniaxial Compressive Strength and P-Wave Velocity of Sandstone after Temperature Treatments. J. Rock Mech. Geotech. Eng. 2021, 13, 143–153. [Google Scholar] [CrossRef]


Disclaimer/Publisher’s Note: The statements, opinions and data contained in all publications are solely those of the individual author(s) and contributor(s) and not of MDPI and/or the editor(s). MDPI and/or the editor(s) disclaim responsibility for any injury to people or property resulting from any ideas, methods, instructions or products referred to in the content. |
© 2025 by the authors. Licensee MDPI, Basel, Switzerland. This article is an open access article distributed under the terms and conditions of the Creative Commons Attribution (CC BY) license (https://creativecommons.org/licenses/by/4.0/).