Abstract
Vipingo quarry in Kilifi county, Kenya, is one of the quarries supplying coral limestone for limestone manufacturing in the coastal region. Due to its close proximity to the Indian ocean, the semidiurnal ocean tides tend to have an influence on the stability of the quarry slopes adjacent to the shoreline. Finite element numerical analysis using the generalized Hoek–Brown criterion is conducted to assess the stability condition of the slopes followed by slope-angle optimization to determine the safest overall slope angle as well as analyzing the stability of the slopes due to action of varying ocean tides. The optimum overall slope angles for various excavation depths are found to be 52° for 20 m, 46° for 30 m, 42° for 40 m, and 39° for 50 m, which are the same even with varying distance of the slope face from the shoreline. A parametric analysis shows that there is no significant effect of the tides on slope stability for excavations above the water table, but as the quarry gets deeper, the slope stability is affected. A sensitivity factor (ζ) is introduced, being a measure of how much the slope safety factor is reduced as a result of the semidiurnal tidal action.
1. Introduction
Slope engineering practices has over time experienced instability in natural and artificial slopes, such as landslides after heavy or prolonged rain. Failure of reservoir embankments as a result of sudden decline in water levels (also known as rapid drawdown) and due to prolonged immersion are also common phenomena. Instability caused by action of water seepage forces is mostly associated with soil slopes and weak rock slopes. Seepage is directly responsible for instability in slopes, because in wet conditions, the shear strength of the geomaterials is greatly reduced. This is corroborated by laboratory experiments by various researchers that show a reduction in rock mechanical strength properties in a wet/saturated state [1,2,3]. In the design of slopes in weak rock masses, groundwater seepage is one of the most important parameters that have to be considered [4]. This is because in weak rocks, the weakly cemented rock fabric is already at a higher potential for collapse and is aggravated by water seepage. In weak carbonate rock masses, for instance, the high porosity and high permeability of the rock permits easier seepage through the rock, resulting in significant impact on the rock mass strength. Preexisting joint apertures in the rock mass may open or close under the action of water, thus inducing a rapid change in the hydraulic transmissivity [5]. With the alteration of joint apertures also comes a change in joint hydraulic pressure, thus alteration of rock structure [6].
Analysis methods for evaluating seepage effects on slope stability have evolved over the years, from the use of flow nets developed by Philipp Forchheimer in the early 1900s [7], to limit-equilibrium analysis methods [8]. The computer age has made it easier to use more robust numerical analysis methods that can accommodate even more complex seepage boundary conditions. Numerous researchers have employed a wide range of numerical analysis methods to evaluate seepage effects on slope stability of open pits, considering such water sources as rainfall, dams, and lakes. Drawdown analysis is always used for the case of ponded water that considers only the case of decrease in water levels i.e., lowering the water table. The term “rapid drawdown” has been traditionally used with earth dam reservoir levels, meaning the duration of decrease in water level is short relative to the life span of the dam. Fan et al. [9], for instance, using FLAC3D, evaluated the impact of an adjacent lake on the stability of an open pit mine by studying the effect of decreasing water levels after rainy seasons. Moosavi et al. [10] used the discrete element numerical modeling software UDEC to evaluate the drawdown effects of groundwater aquifers on the stability of open pit slopes as the excavation advanced to greater depths. There are two classic procedures for analyzing drawdown effects and the resulting stability conditions, grouped as the stress-based undrained approach recommended for impervious materials and the pure flow (drained) approach recommended for rigid pervious materials, typically granular soils [11]. Wong, Szeto, and Zhang [12], in studying the failure modes of porous rocks, reiterated that in some ways the phenomenology of porous rock deformation parallels that in soil mechanics. A slope generally fails in saturated conditions as a result of development of positive pore-water pressure occasioned by high porosity of the slope material [13].
Flow analysis considers modeling three types of drainage conditions: drained, undrained, and fully drained [14]. The drained condition is where fluid can move into and out of the model and the total volume can change. It is a transient pore-pressure state where drainage is a function of time and excess pore pressure can exist. In the undrained condition, fluid cannot move into or out of the model, there is no volume change, and excess pore pressure is a function of applied loads. The fully drained condition is a steady state characterized by zero excess pore pressure and drainage analysis is at infinite time.
Analysis methods for water seepage effects can be either coupled or uncoupled. Uncoupled analysis is the case of total stress analysis where deformation is a result of changes in total stress, i.e., changes in pore pressure do not affect deformation and changes in loading or deformation do not affect pore pressure. Coupled analysis, which is based on Biot theory, is used for cases where changes in pore pressure can affect deformation and changes in loading or deformation can affect pore pressure. Two types of coupling, namely, direct and indirect coupling, were discussed by Rutqvist and Stephansson [6]. Direct coupling occurs through deformation and pore-fluid interactions where changes in the pore volume result in a change to the mechanical properties. Direct coupling is in two forms: solid to fluid coupling, where a change in the stress causes a change in the pore-fluid pressure, and fluid to solid coupling where a change in the pore-fluid pressure causes a change in the rock mass volume.
Indirect coupling, on the other hand, is where changes in the mechanical or hydraulic processes affect each other through changes in mechanical and hydraulic properties. Two forms of indirect coupling are solid-to-fluid coupling, where a change in the stress causes a change in the hydraulic properties of the rock mass, and fluid-to-solid coupling, where a change in the pore-fluid pressure causes a change in the mechanical properties of the rock mass. According to C. Huimei, Z. Zhiye and S. Jianping, [5], flow can be considered to be through the porous media if there are significant variably oriented and connected fractures in the rock mass. This is the assumption that is considered by continuum methods of coupled numerical hydromechanical modeling, such as the finite difference Method (FDM) and finite element method (FEM) [15,16].
In the analysis of seepage effects on slope stability, engineers are always confronted with the tough choice of when to consider a steady-state seepage condition or transient seepage. The difference between the two conditions is that in a steady state, seepage parameters, such as hydraulic head, flow rate, or rock/soil hydraulic property, are constant, whereas in a transient state, the properties change with time [17]. Transient seepage has been applied mostly to soil slopes, because in soil, the pore pressure response to changes in seepage parameters is controlled by the hydraulic conductivity and compressibility of soil. Pauls et al. [18] conducted a transient analysis to analyze the impact of drawdown after flooding on highly plastic clay. They found that transient analysis gave a more realistic estimate of safety factors compared with filed observations of piezometric data, while the steady-state analysis result was more exaggerated. Seepage effects on rock slopes are often analyzed for slopes in heavily jointed rock and those that possess a small finite number of well-developed jointing pattern with relatively good spacing [19]. Steady-state seepage analysis is more common in rock slopes due to low permeability of rocks as a result of fines. Martin and Stacey recommend drained transient analysis for rock formations whose permeability is greater than ~10−8 m/s. According to the US Army Corps of Engineers report by Tracy et al. [17], transient analysis is best used as a verification of piezometer readings and when it is necessary to determine the time it takes to achieve a steady state. Transient analysis depends on the computer program’s capacity to run a transient analysis.
Analyses of seepage effects on slope stability have not addressed conditions unique to oceanic tidal variations. In this paper, a situation where the water level rises and falls with two high levels and two low levels every lunar day is presented. An oceanside coral limestone quarry is assessed for stability under the influence of semidiurnal ocean tides as the excavation progresses to greater depths. The changes in tidal levels subject the adjacent quarry slopes to a phenomenon that can be described as a cycle of daily lifts and drawdowns where the slopes experience the impacts of rising and falling external water levels. Alonso and Pinyol [11] and Cen et al. [20] describe two consequences of reduction in water level that is an unloading effect of removing water. When the water level is high, hydrostatic pressure helps in stabilizing the slope, and so a reduction in the water level results in the reduction of the stabilizing external hydrostatic pressure, as well as causing a modification of the internal pore-water pressure due to phreatic fluctuations that produce effective stress changes within the ground. The stability of slopes can therefore be affected by the drawdown phenomenon [21] created by the rising and falling of ocean semidiurnal tides.
The objective of this work is to assess how the daily rising and falling of water table levels occasioned by tidal variations impact on the stability of slopes of a quarry adjacent to the ocean. Finite element numerical analysis using Phase 2 Version 7 software developed by RocScience (Toronto, ON, Canada) is used in the study. The analysis steps include first determining the optimum slope angles for various excavation depths followed by assessing the impact of tidal changes on the slope stability. The groundwater analysis and stress analysis modules of the software make it a suitable tool to enable the goals of this study. Parametric analysis on interaction of slope at different excavation depths and the adjacent ocean waters is done to evaluate and give a reasonable guide for determining the suitable distance of the slope face from the shoreline.
2. Engineering Geological Background of Area under Study
2.1. Physical Location
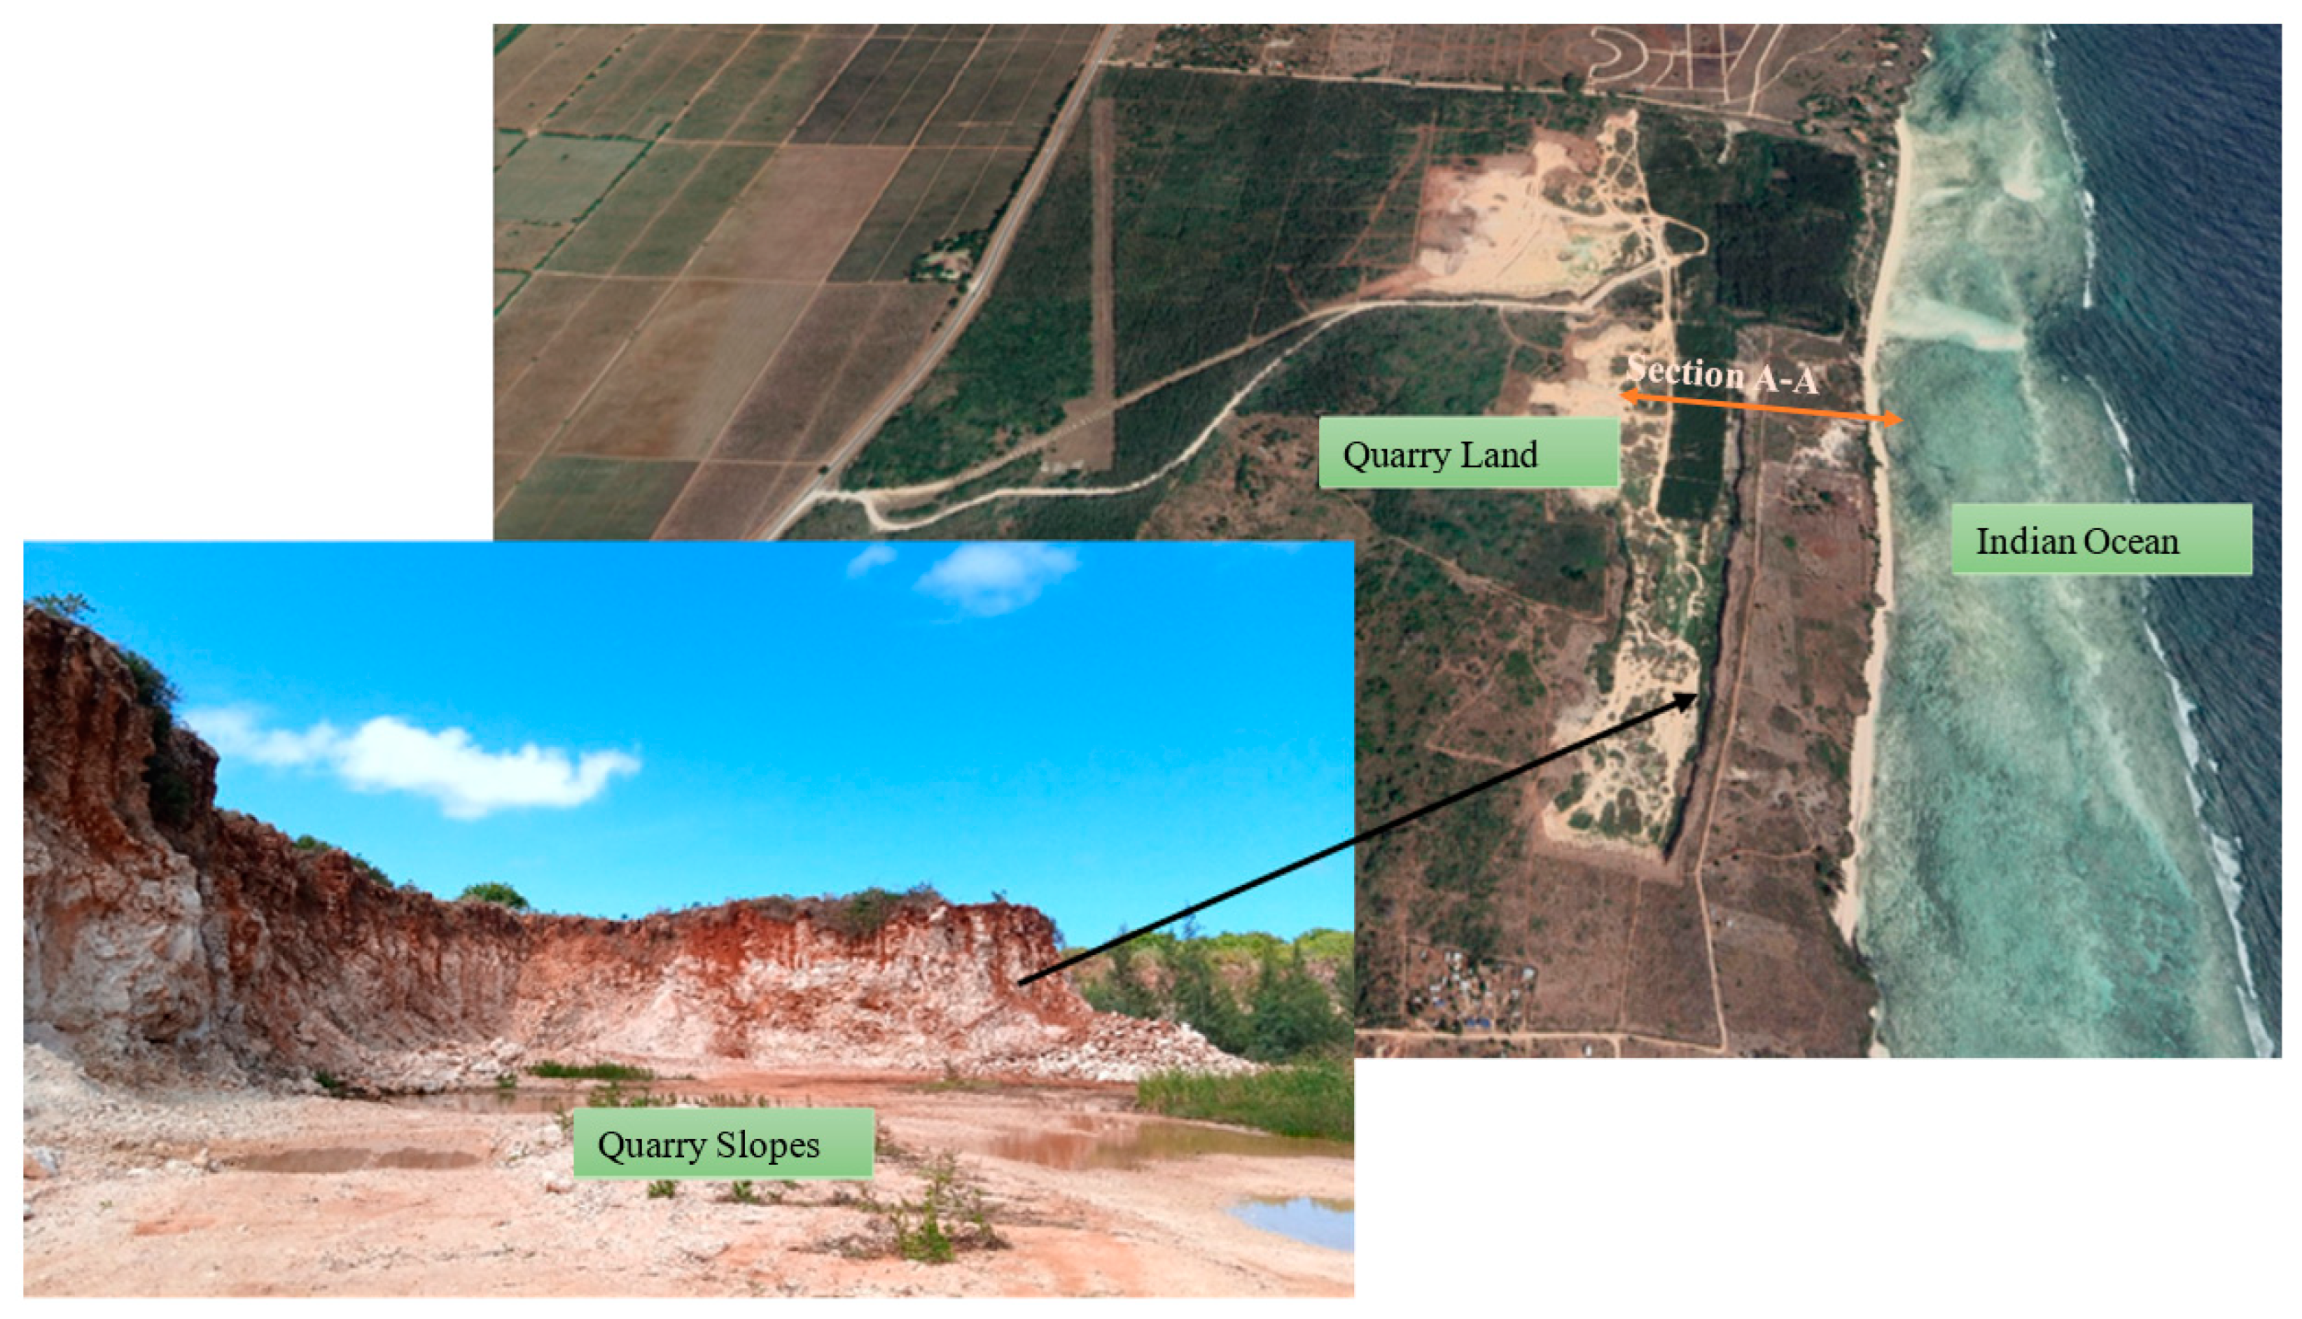
Vipingo coral limestone quarry is situated in Kilifi county along Kenya’s coastal plain (Figure 1a), which lies along the Indian Ocean seashore and reaches 3–8 km inland, with a relatively flat topography and elevation mostly less than 33 m above sea level. The plain comprises mainly Pleistocene deposits, with Pleistocene coral reef being the most important for Vipingo quarry. Previous geological exploration estimated the Pleistocene coral reef deposit to be approximately 1–4 km wide and up to 100 m thick, extending along the whole length of the Kenyan coast. The quarry is adjacent to the Indian Ocean at about 50 m from the shoreline, extending in a strip of almost 4 km long and about 2 km wide, as shown in Figure 1b.
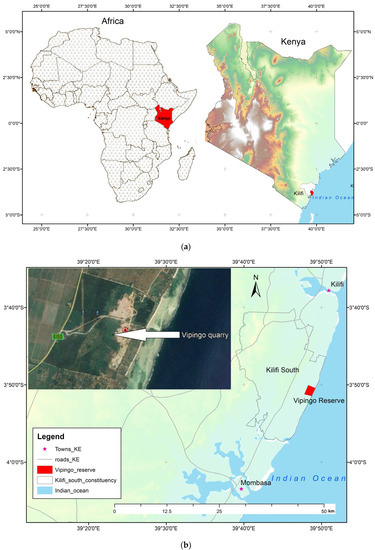
Figure 1.
Location of study area. (a) Location of Kilifi county. (b) Location of Vipingo quarry (maps created using QGIS version 3.16.5 LTR available on https://www.qgis.org, accessed on 29 March 2021).
2.2. Geology and Hydrogeology
Most of the area lies on coral limestone of the Pleistocene age, a fossil coral reef, acquired as limestone reserve, and is covered with shallow but fertile soil. The Pleistocene period was characterized by fluctuating sea levels resulting in various types of sediments. The reef would grow upwards during rising sea levels and expand laterally during stagnation, causing a heterogeneous mix of weathered limestone, clays, and sand. Low water levels during glacial periods would expose the reef surface to erosion, weathering, and karstification (formation of sinkholes and caves through dissolution of limestone by carbonic acid present in fresh rainwater with high CO2 and O2 content). The sediments underlying the coastal plains are mainly sands and fossil coral limestone, both highly porous and permeable, which allows for higher aquifer transmissivity and favorable recharge conditions. The groundwater table gently slopes towards the coast, and groundwater flows from the foot plateau through the sandy back-reef deposits into the limestone reef, before ultimately discharging into the sea. All rainwater is drained naturally through the highly porous coral limestone to sea level.
The Indian Ocean experiences semidiurnal tides, that is, two high and two low tides of approximately equal size every lunar day. The tidal level is measured with the coastline as the datum. The state of Oregon [22] defines the coastline as the line of mean low water along that portion of the coast that is in direct contact with the open sea and the line marking the seaward limit of inland waters. Based on this definition, the tidal parameters for Vipingo area as documented by the Kilifi county government are as follows: mean high (MH) water = 2.96 m, mean low water = 0.71 m, mean higher high water = 3.15 m, mean lower high water = 2.78 m, mean higher low water = 0.8 m, mean lower low water = 0.65 m [23]. This places the low tide at 0.71 m and high tide at 2.96 m above sea level.
2.3. Engineering Background
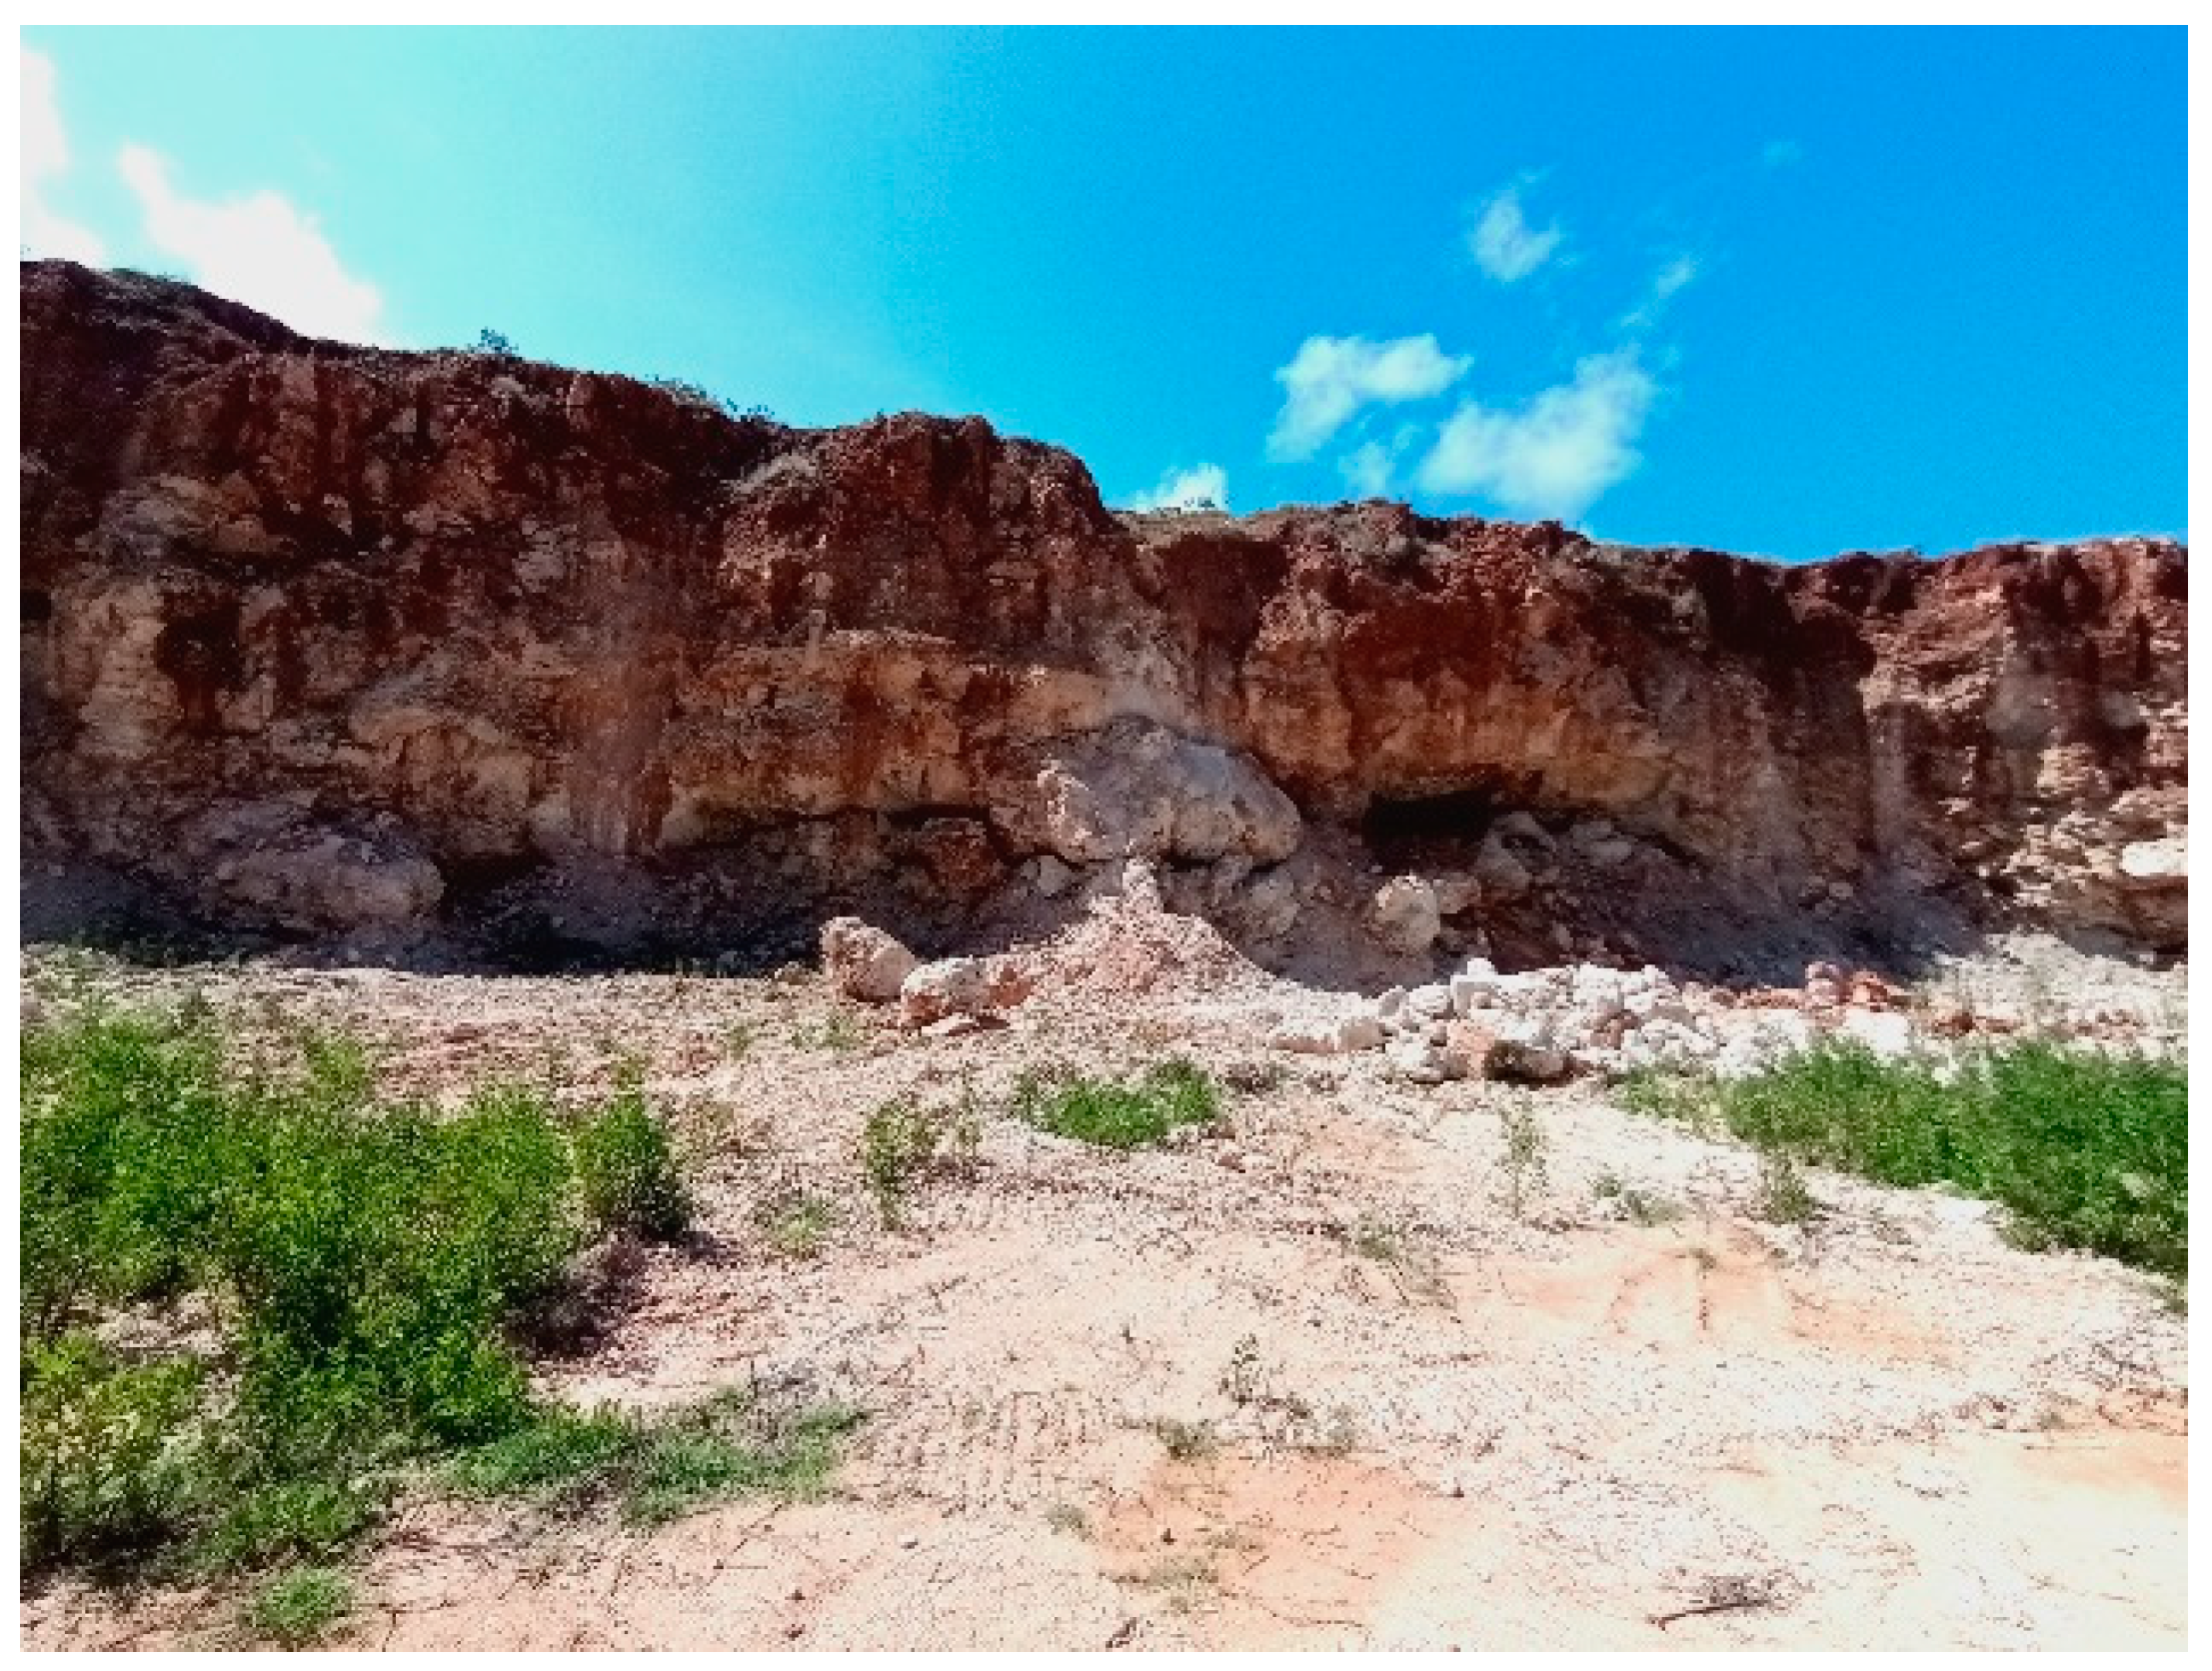
Vipingo quarry is one of the major quarries supplying coral limestone for cement production in the coastal region of Kenya. The elevation of the quarry pit is currently maintained above sea level, the maximum pit depth so far being 20 m. The pit, however, gets deeper as excavation progresses inland. The rock mass has no distinct beddings or foliations. The top soil is thin, and together with weathered rock in some sections makes a band of weak top layer averaging 3 m, forming low-grade limestone. Some sections have coral sand of average thickness of 4 m. The eastern edge of the pit is situated just 50 m from the shoreline of the Indian Ocean.
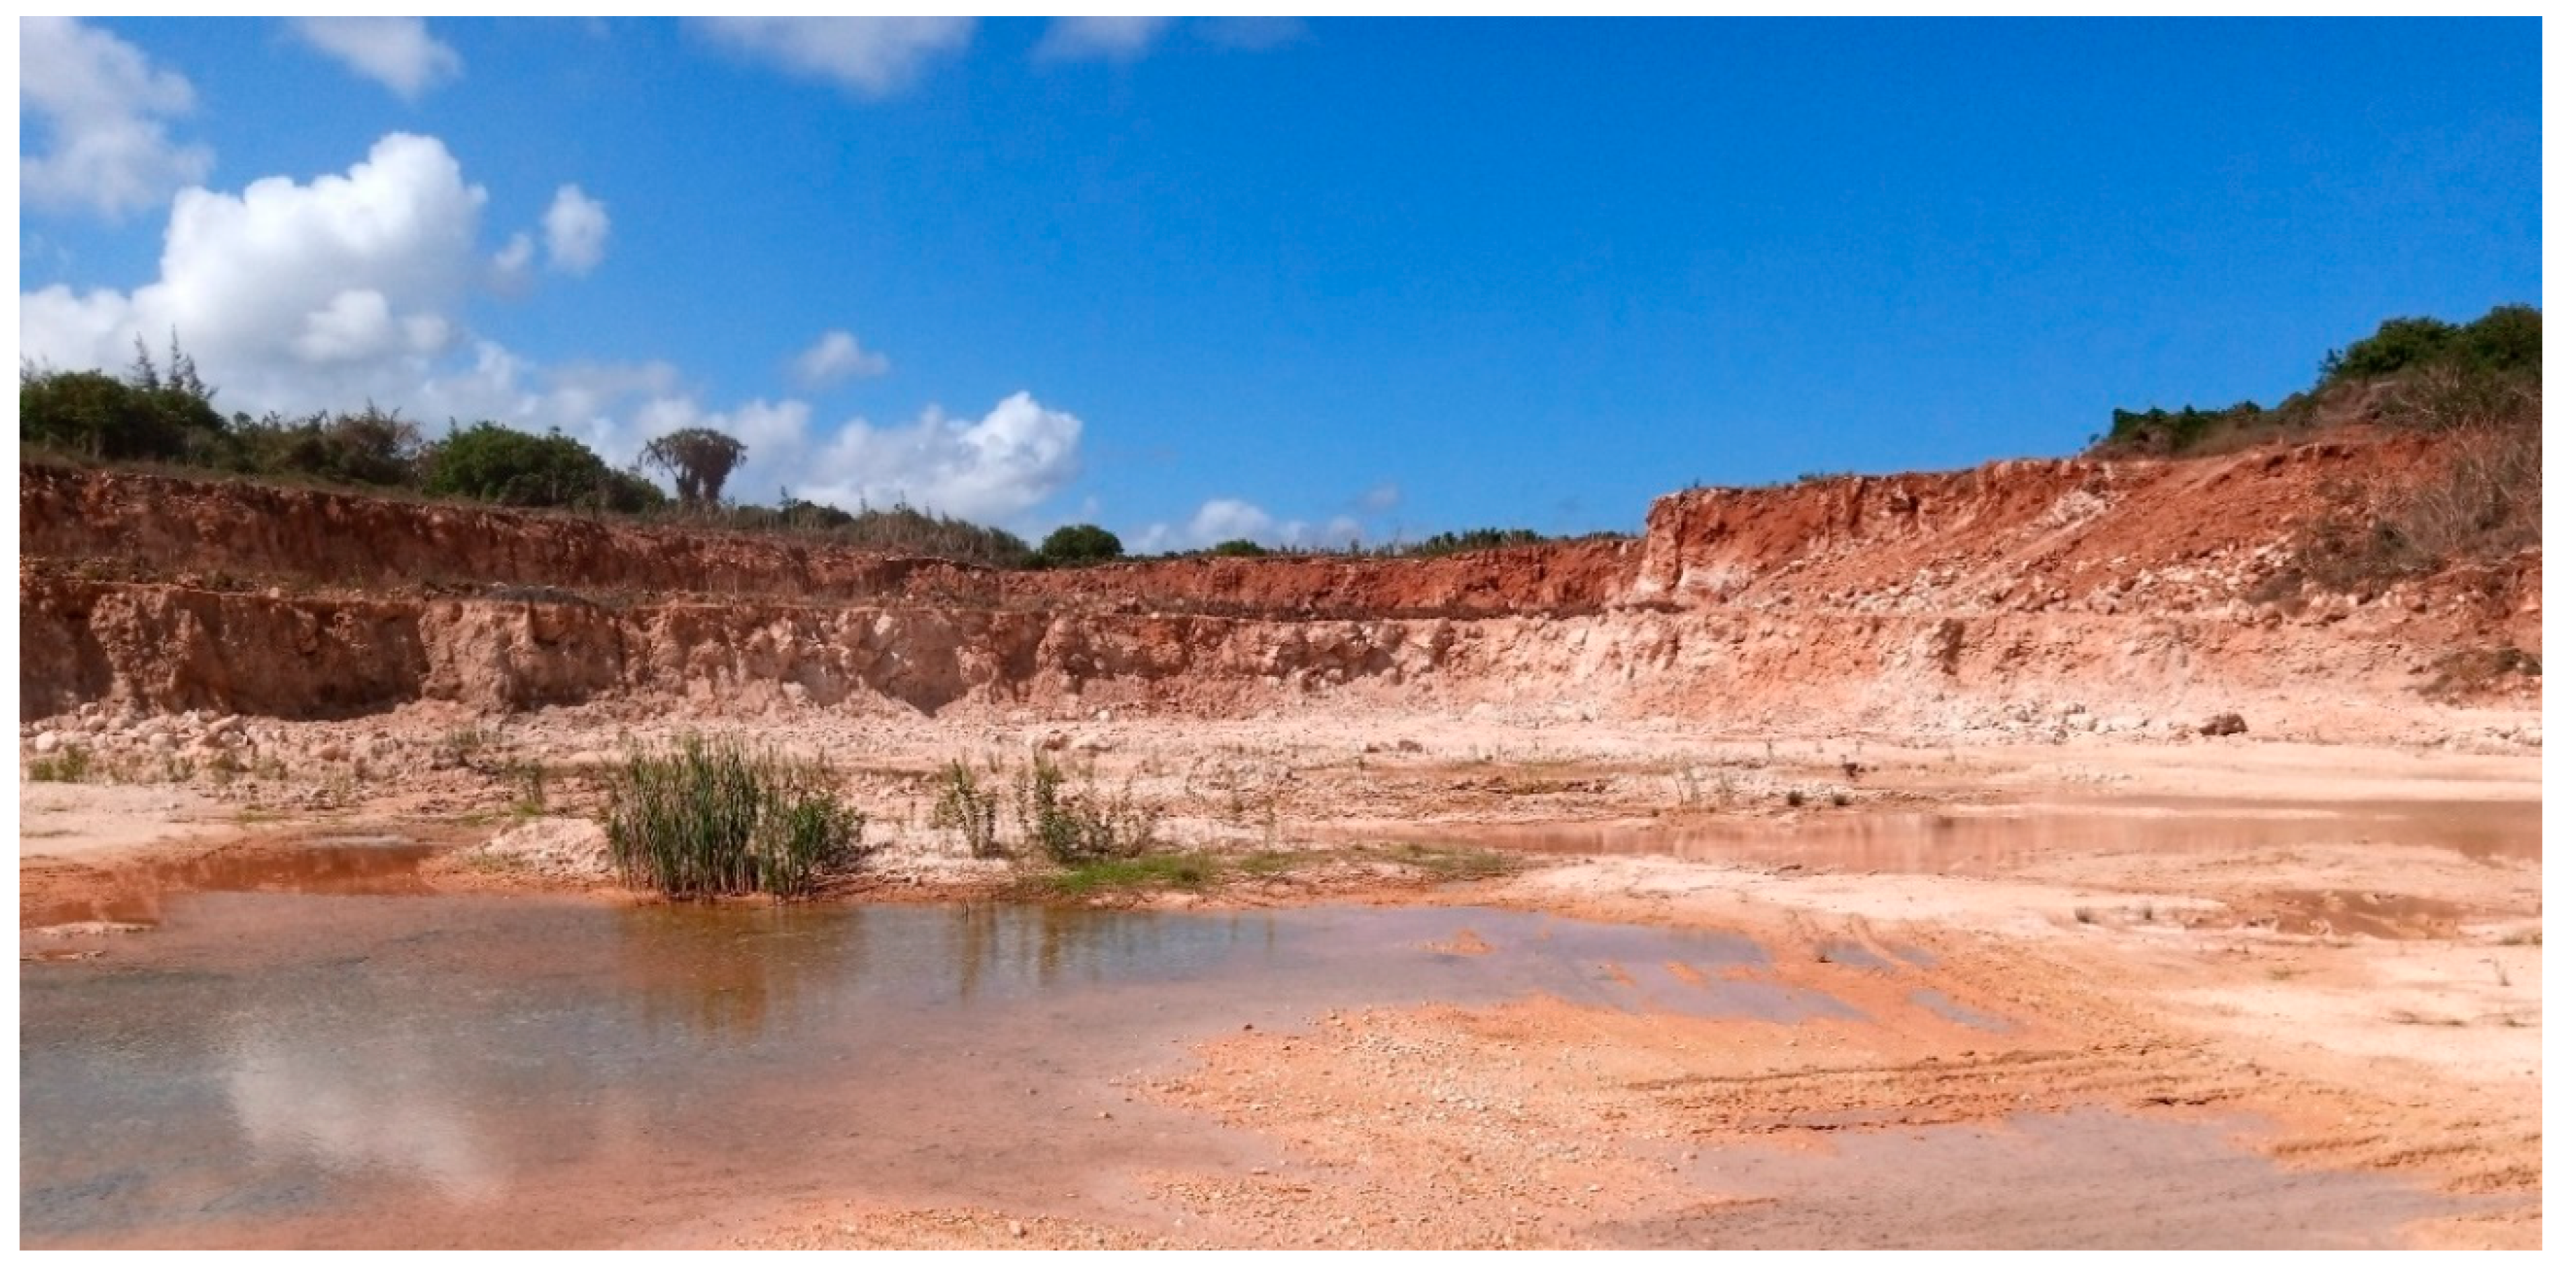
Despite excavation being done above the water table, during high tide, water level rises and can be seen on the pit floor, as in Figure 2. Instabilities on the slopes have previously been reported, especially during rainy season, but no study has been done to relate slope stability to ocean-water seepage. As the excavation advances, it is important to evaluate the impact of the ocean waters on the stability of the pit slopes and make foolproof slope design judgments. This will also be crucial at the end of the quarrying life, because there is a rehabilitation plan in place and so it is important to consider all factors affecting slope stability in the final pit design.

Figure 2.
Ocean water visible in the quarry floor during high tide.
3. Methodology
3.1. The Workflow Process
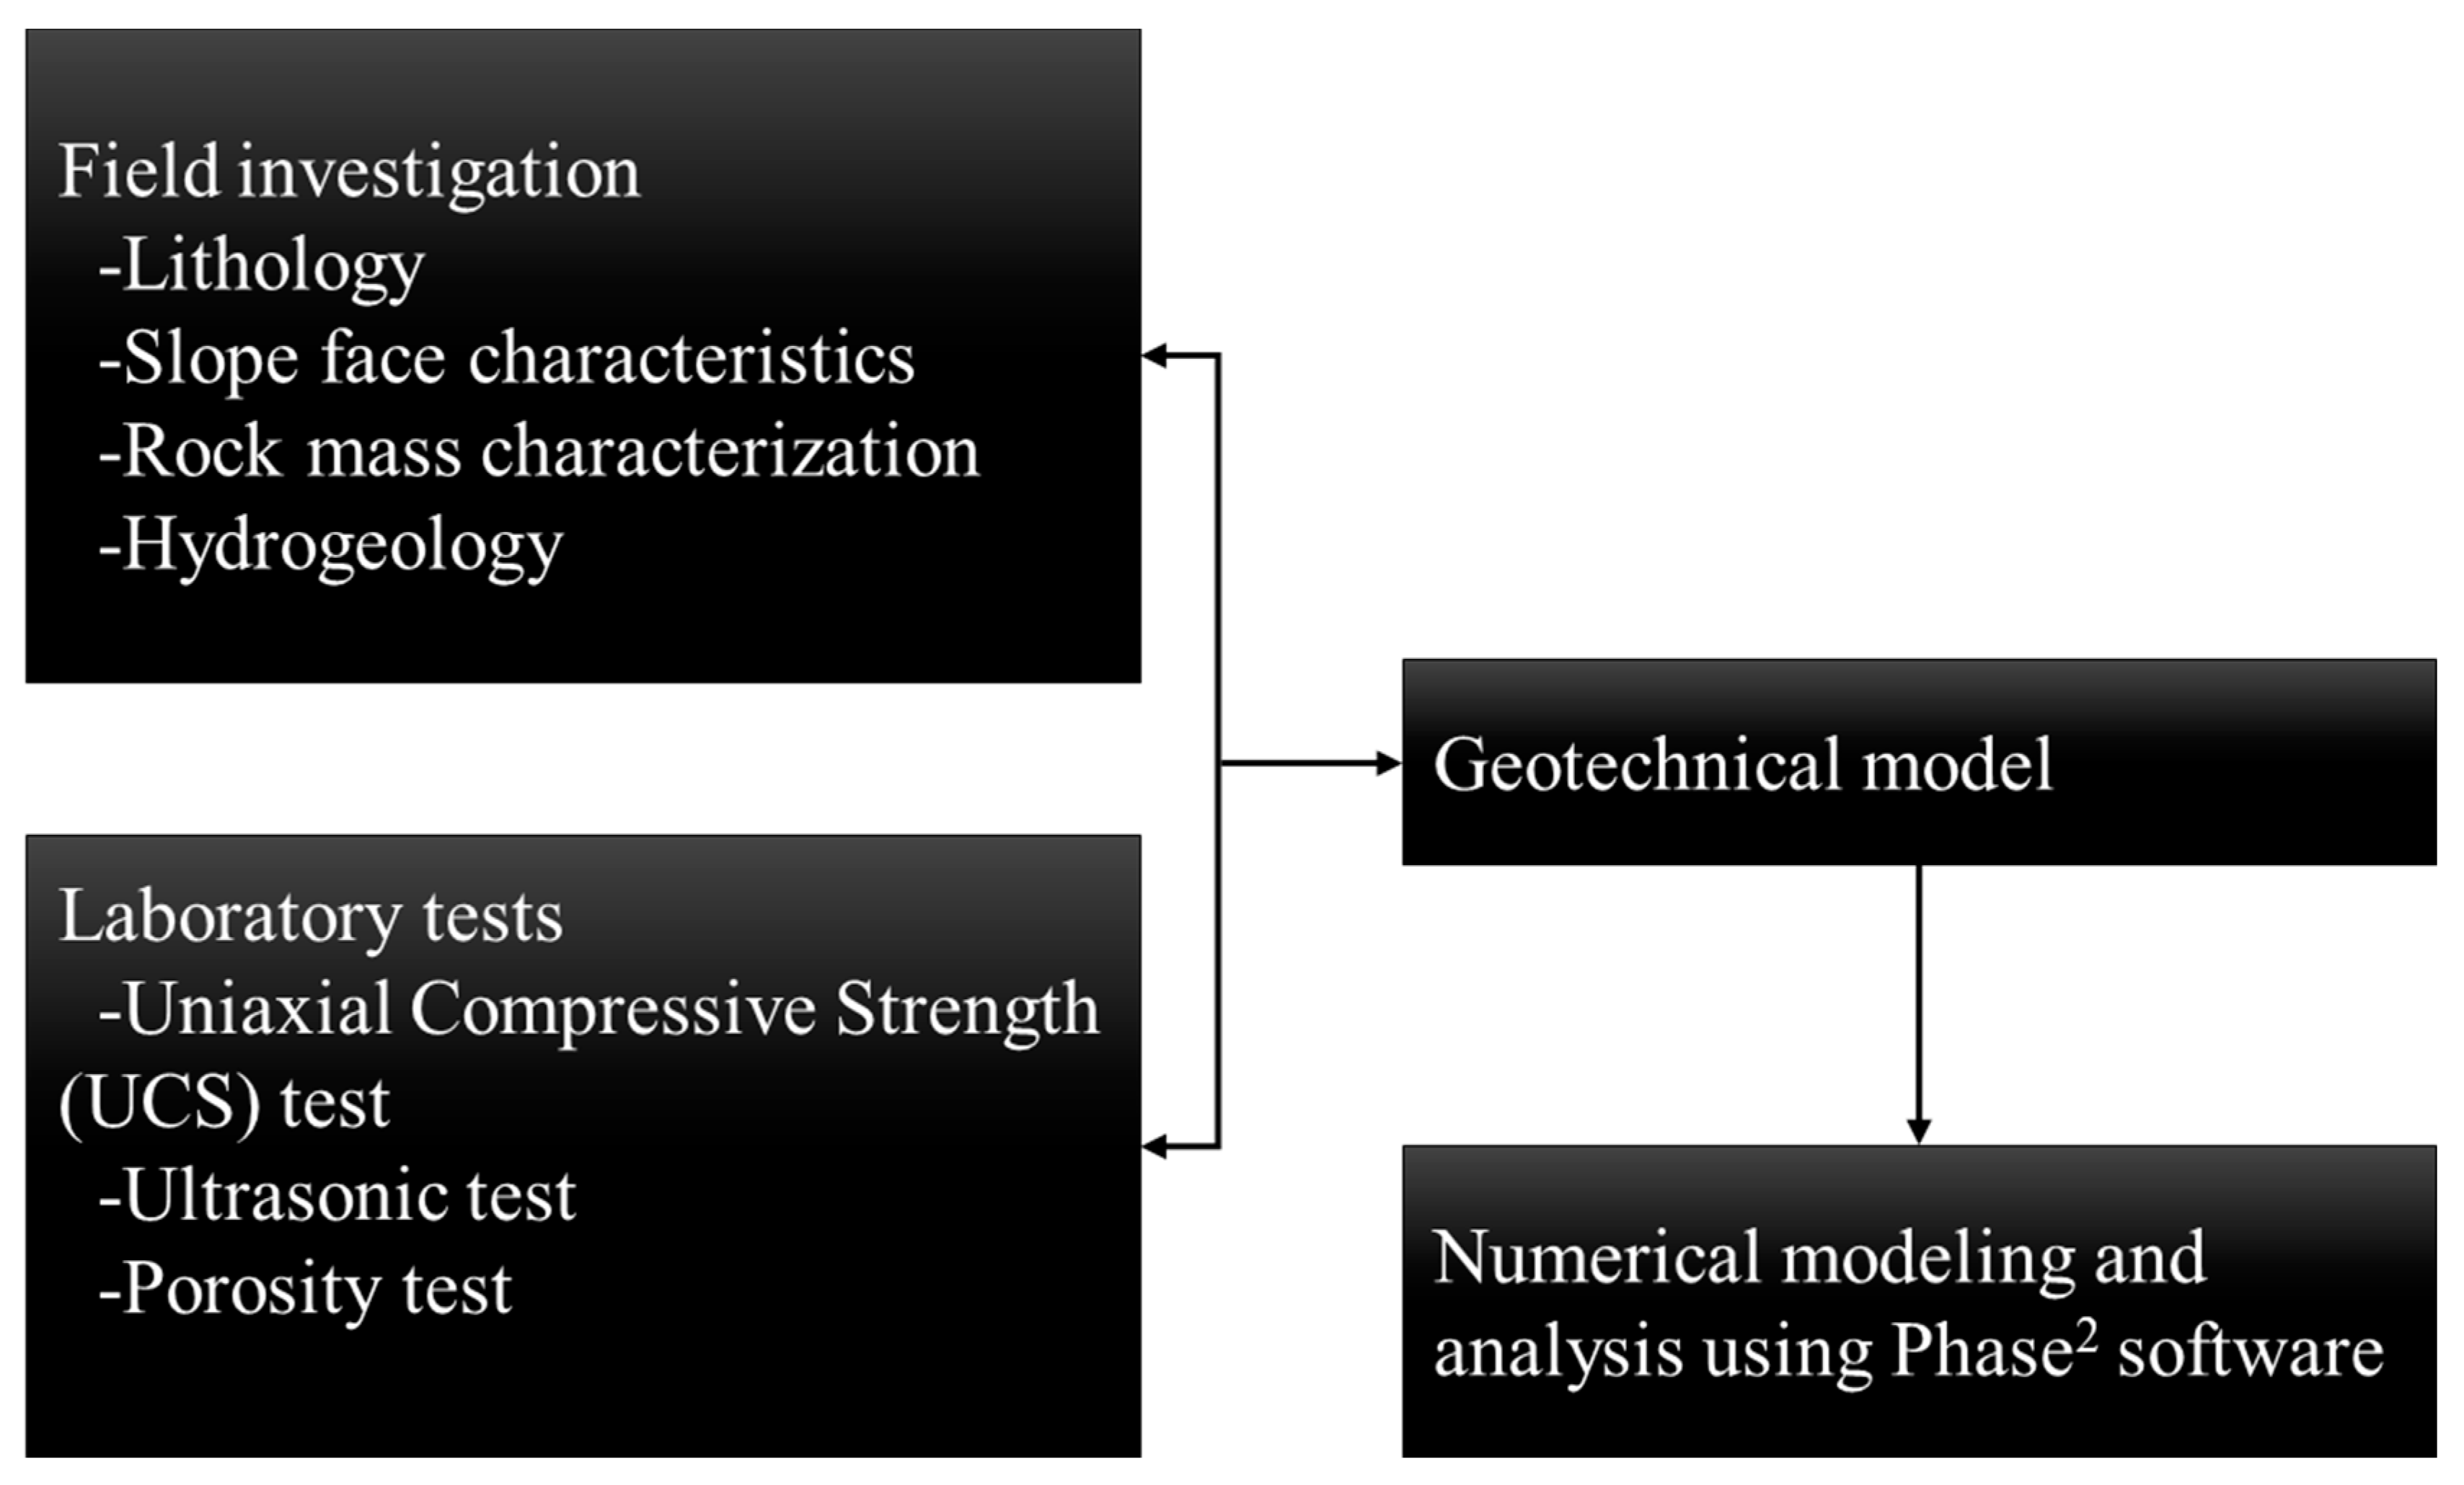
This work is part of an ongoing slope design analysis. The field investigation and laboratory tests have previously been done. The scope of this work involves numerical modeling and analysis of stability condition of the quarry slopes under the effects of seepage of ocean waters. The workflow process is as shown in Figure 3.
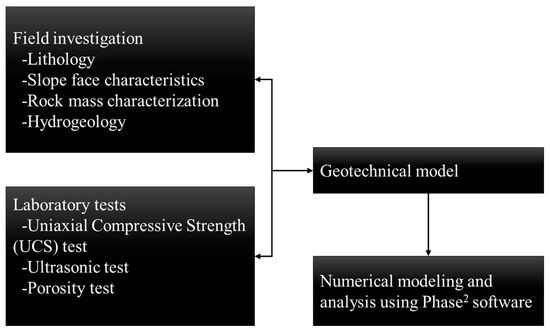
Figure 3.
The workflow process.
3.2. Slope Model Construction
Figure 4 shows the environment around the quarry, showing the position of the quarry relative to the Indian Ocean waters.

Figure 4.
The quarry environment.
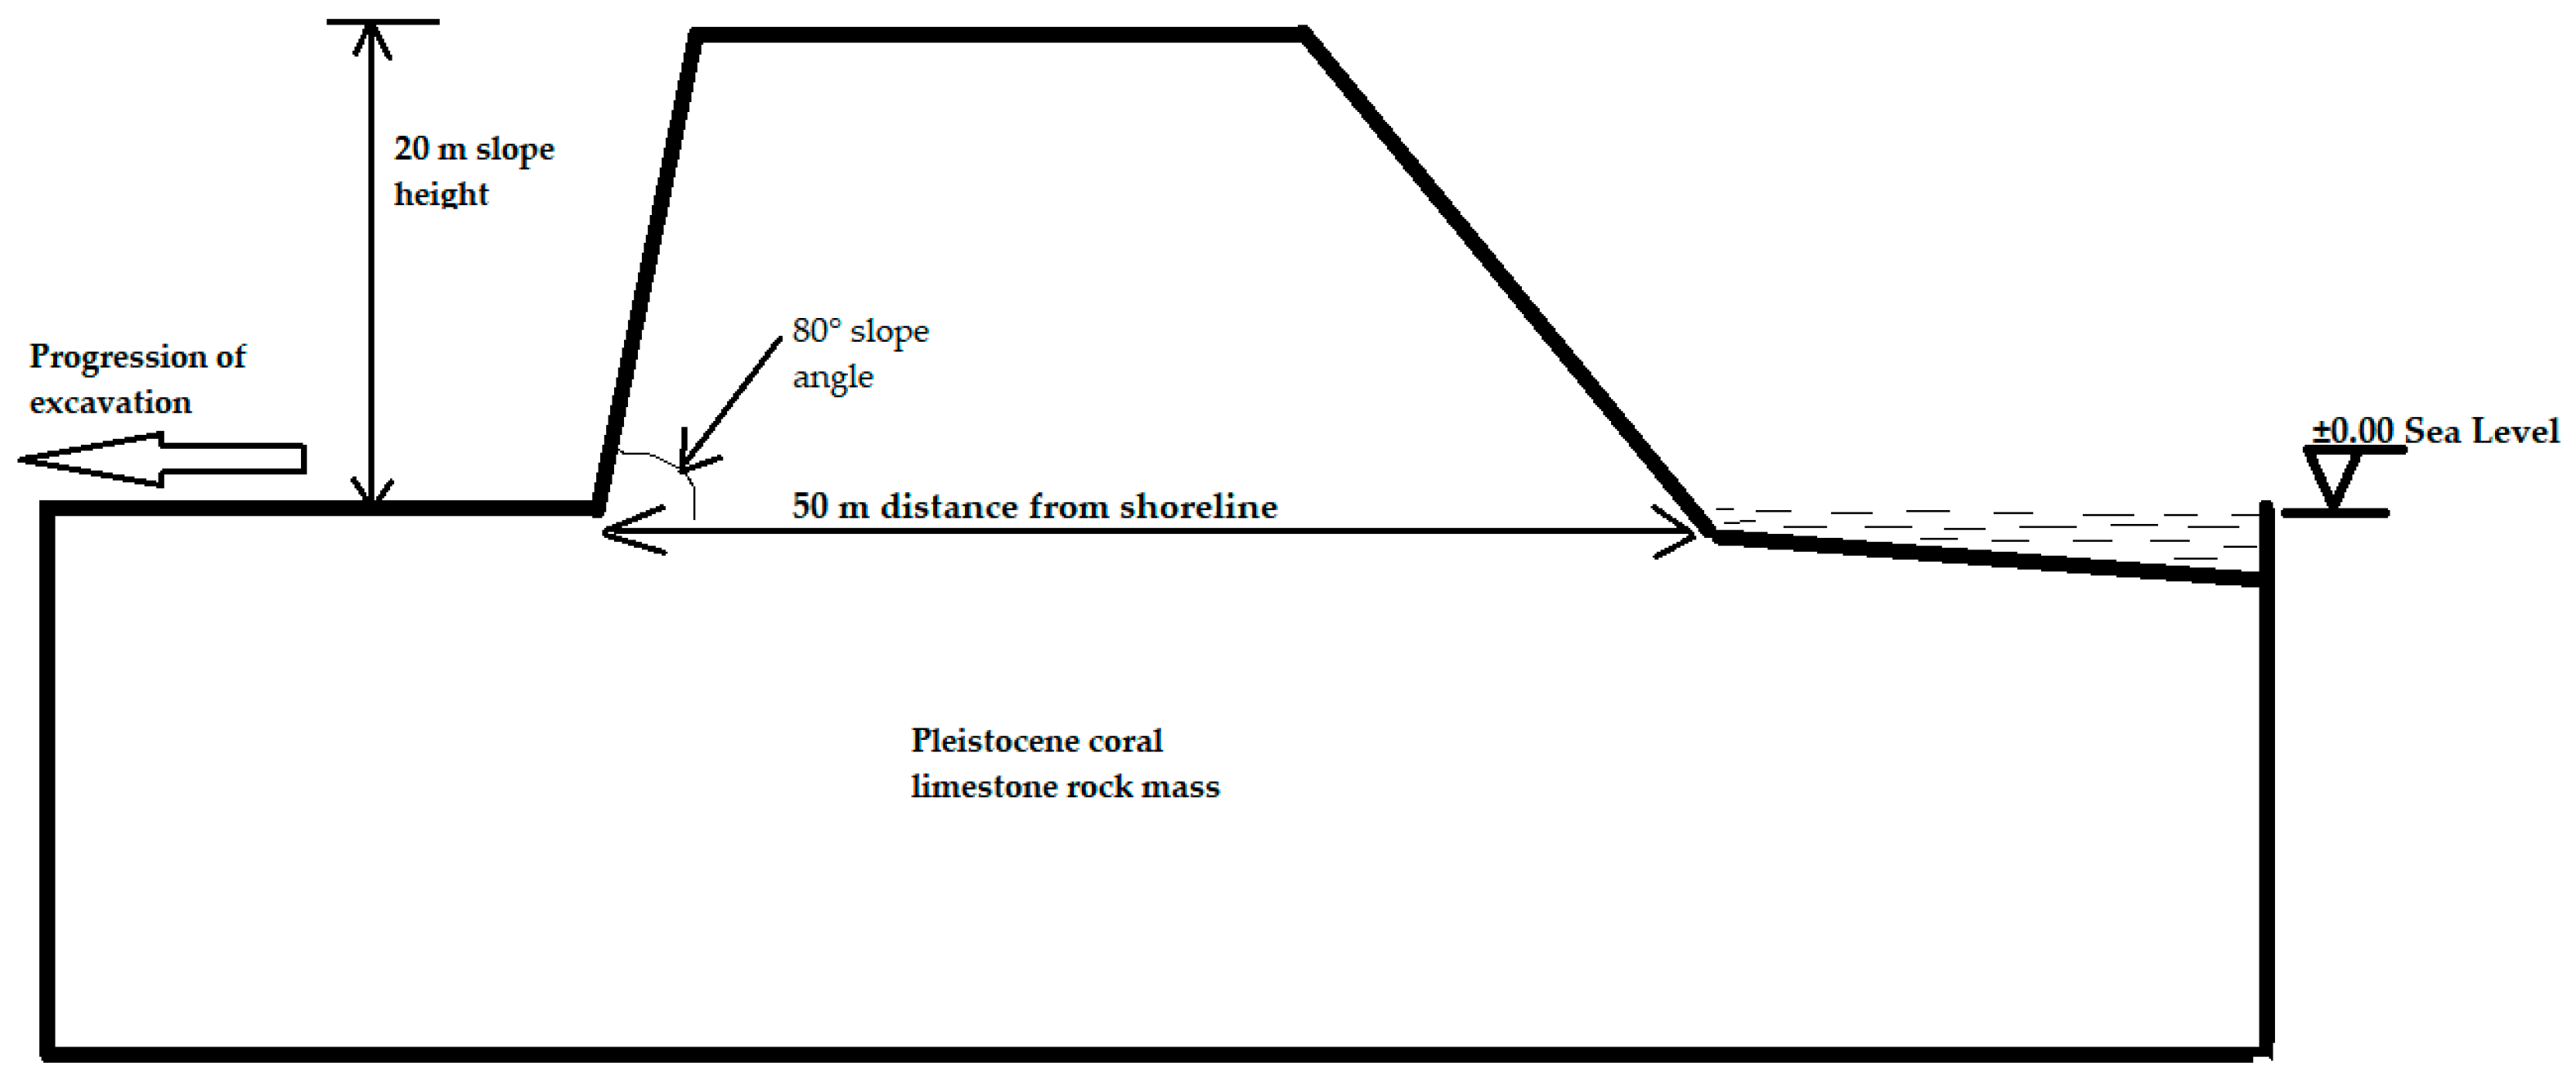
In this work, a model of the high-grade limestone region suffices for simulation based on the objective of the study. The regions with weathered rock and coral sand are not considered in this study, since they happen to form the topmost layers of the rock mass and are not in contact with ocean water. The model boundary in Figure 5 guides the development of the geometry of the geomechanical prototype for this analysis. The model geometries are quite simple, so they were generated by entering coordinates directly into the user interface. The analysis considers slopes at excavation depths of 20 m, 30 m, 40 m, and 50 m, with varying distances of 50 m, 75 m, and 100 m from the shoreline.
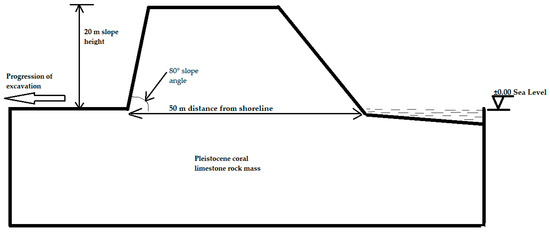
Figure 5.
Model and boundary of slope section A-A under consideration.
3.3. Numerical Modeling
Due to the homogeneous nature of the rock mass under study, finite element analysis by shear strength reduction (SSR) using RocScience’s Phase 2 Version 7 software was found to be sufficient for carrying out the numerical modeling and analysis for the area under study. The SSR concept entails systematically using finite element solutions to reduce the shear strength envelope of material by a strength reduction factor (SRF) or factor of safety until solutions do not converge. That is, the deformations become unacceptably large, thus bringing the slope to the verge of failure (within a specified tolerance). The generalized Hoek–Brown criterion is the strength model applied in this analysis. Based on the shear-normal stress envelopes developed by Balmer [24] for the Mohr-Coulomb criterion, Hammah et al. [25] formulated the generalized Hoek–Brown criterion by relating σn and τ to σ1 and σ2 in the following equations:
where and are the major and minor effective principal stresses at failure, is the uniaxial compressive strength of the intact rock material, and a, mb and s are material constants.
In conducting analysis by shear strength reduction, the Equation (1) is simply divided by the reduction factor F. In Phase 2 software, the strength reduction occurs automatically until the critical SRF is obtained, which gives the safety factor of the slope.
Analyzing the slope stability under the influence of seepage forces in Phase 2 makes use of the finite element solid–fluid coupling which refers to the interaction between fluid pore pressure and solid stresses and deformation [26]. The two analysis options are coupled and uncoupled. In uncoupled analysis, an undrained simulation is first conducted to compute the excess pore pressure, after which a solid analysis is carried out to calculate the change in the stress caused by the changes in pore pressure. Coupled analysis is based on Biot’s theory and is applicable to time-dependent analysis problems where changes in pore pressure can affect deformation and changes in loading or deformation can affect pore pressure. Phase 2 makes use of Biot’s equation in coupled analysis and is formulated as [14]:
where is the bulk modulus of the material, is the unit weight of water, , , and are the permeabilities in different directions, is the pore-water pressure, is the mean total stress, and denotes time.
When 2D equilibrium is considered, the gradient of effective stress is augmented by the gradients of fluid pressure , leading to the equilibrium and continuity equations below:
where and are the elastic solid and fluid matrices, is the external loading vector, and is a rectangular coupling matrix.
3.4. Boundary Conditions
In numerical modeling, the displacement boundary conditions are set to ensure zero velocity in the model. The bottom boundary of the model is pinned/fixed in the X–Y direction. The left and right sides of the model have a rolling boundary i.e., fixed in X direction and free to move in Y direction. The slope bottom face (quarry floor), the slope face, the slope top, and the area facing the ocean have a free boundary. Discretization and meshing of the model are achieved by employing graded three-node triangular elements with 200 nodes on external boundary. The slope-face mesh is refined by single refinement i.e., one round of mesh densification.
Seepage analysis is done in a fully drained, uncoupled, steady-state condition. The rate of change of tidal levels is not quite clearly defined, but the high and low tidal levels are definite, so analysis in the steady state suffices to fulfill the objective of the study. The semidiurnal tides mean the pit slopes experience two high and two low head levels daily. At high tide, ocean water is usually visible in the pit floor. The slope therefore experiences alternating rapid drawdowns and “drawups”, and subsequent rapid hydrostatic and pore pressure changes. The analysis is implemented by running a finite element groundwater analysis with changing boundary conditions, in this case being the changes in the total head. The analysis has three stages, the first stage being the low-tide condition, the second the rise to high-tide condition, and the third the falling back to low tide again.
The infiltration faces of the model are the ocean floor up to the tidal level, and the left and right boundaries. The tidal level is defined by the total head as the hydraulic boundary condition and the weight of the ocean water is defined by adding a ponded water distributed load to the model. The outflow faces are the slope face and the slope bottom face. The bottom boundary is impermeable. Unknown boundary condition is set for the excavation face, the bottom of the model, the top part, and the rest of the sloping section of the model facing the ocean.
3.5. Input Parameters
The rock mass properties required for analysis by the generalized Hoek-Brown criterion are given in Table 1, being adapted from data previously published by Joan et al. [27]. The hydraulic conductivity value was obtained from literature on Pleistocene coral limestone on the tropical island aquifers of Barbados by Jones and Jay [28].

Table 1.
Input parameters.
4. Numerical Modeling Results
4.1. Slope Angle Optimization
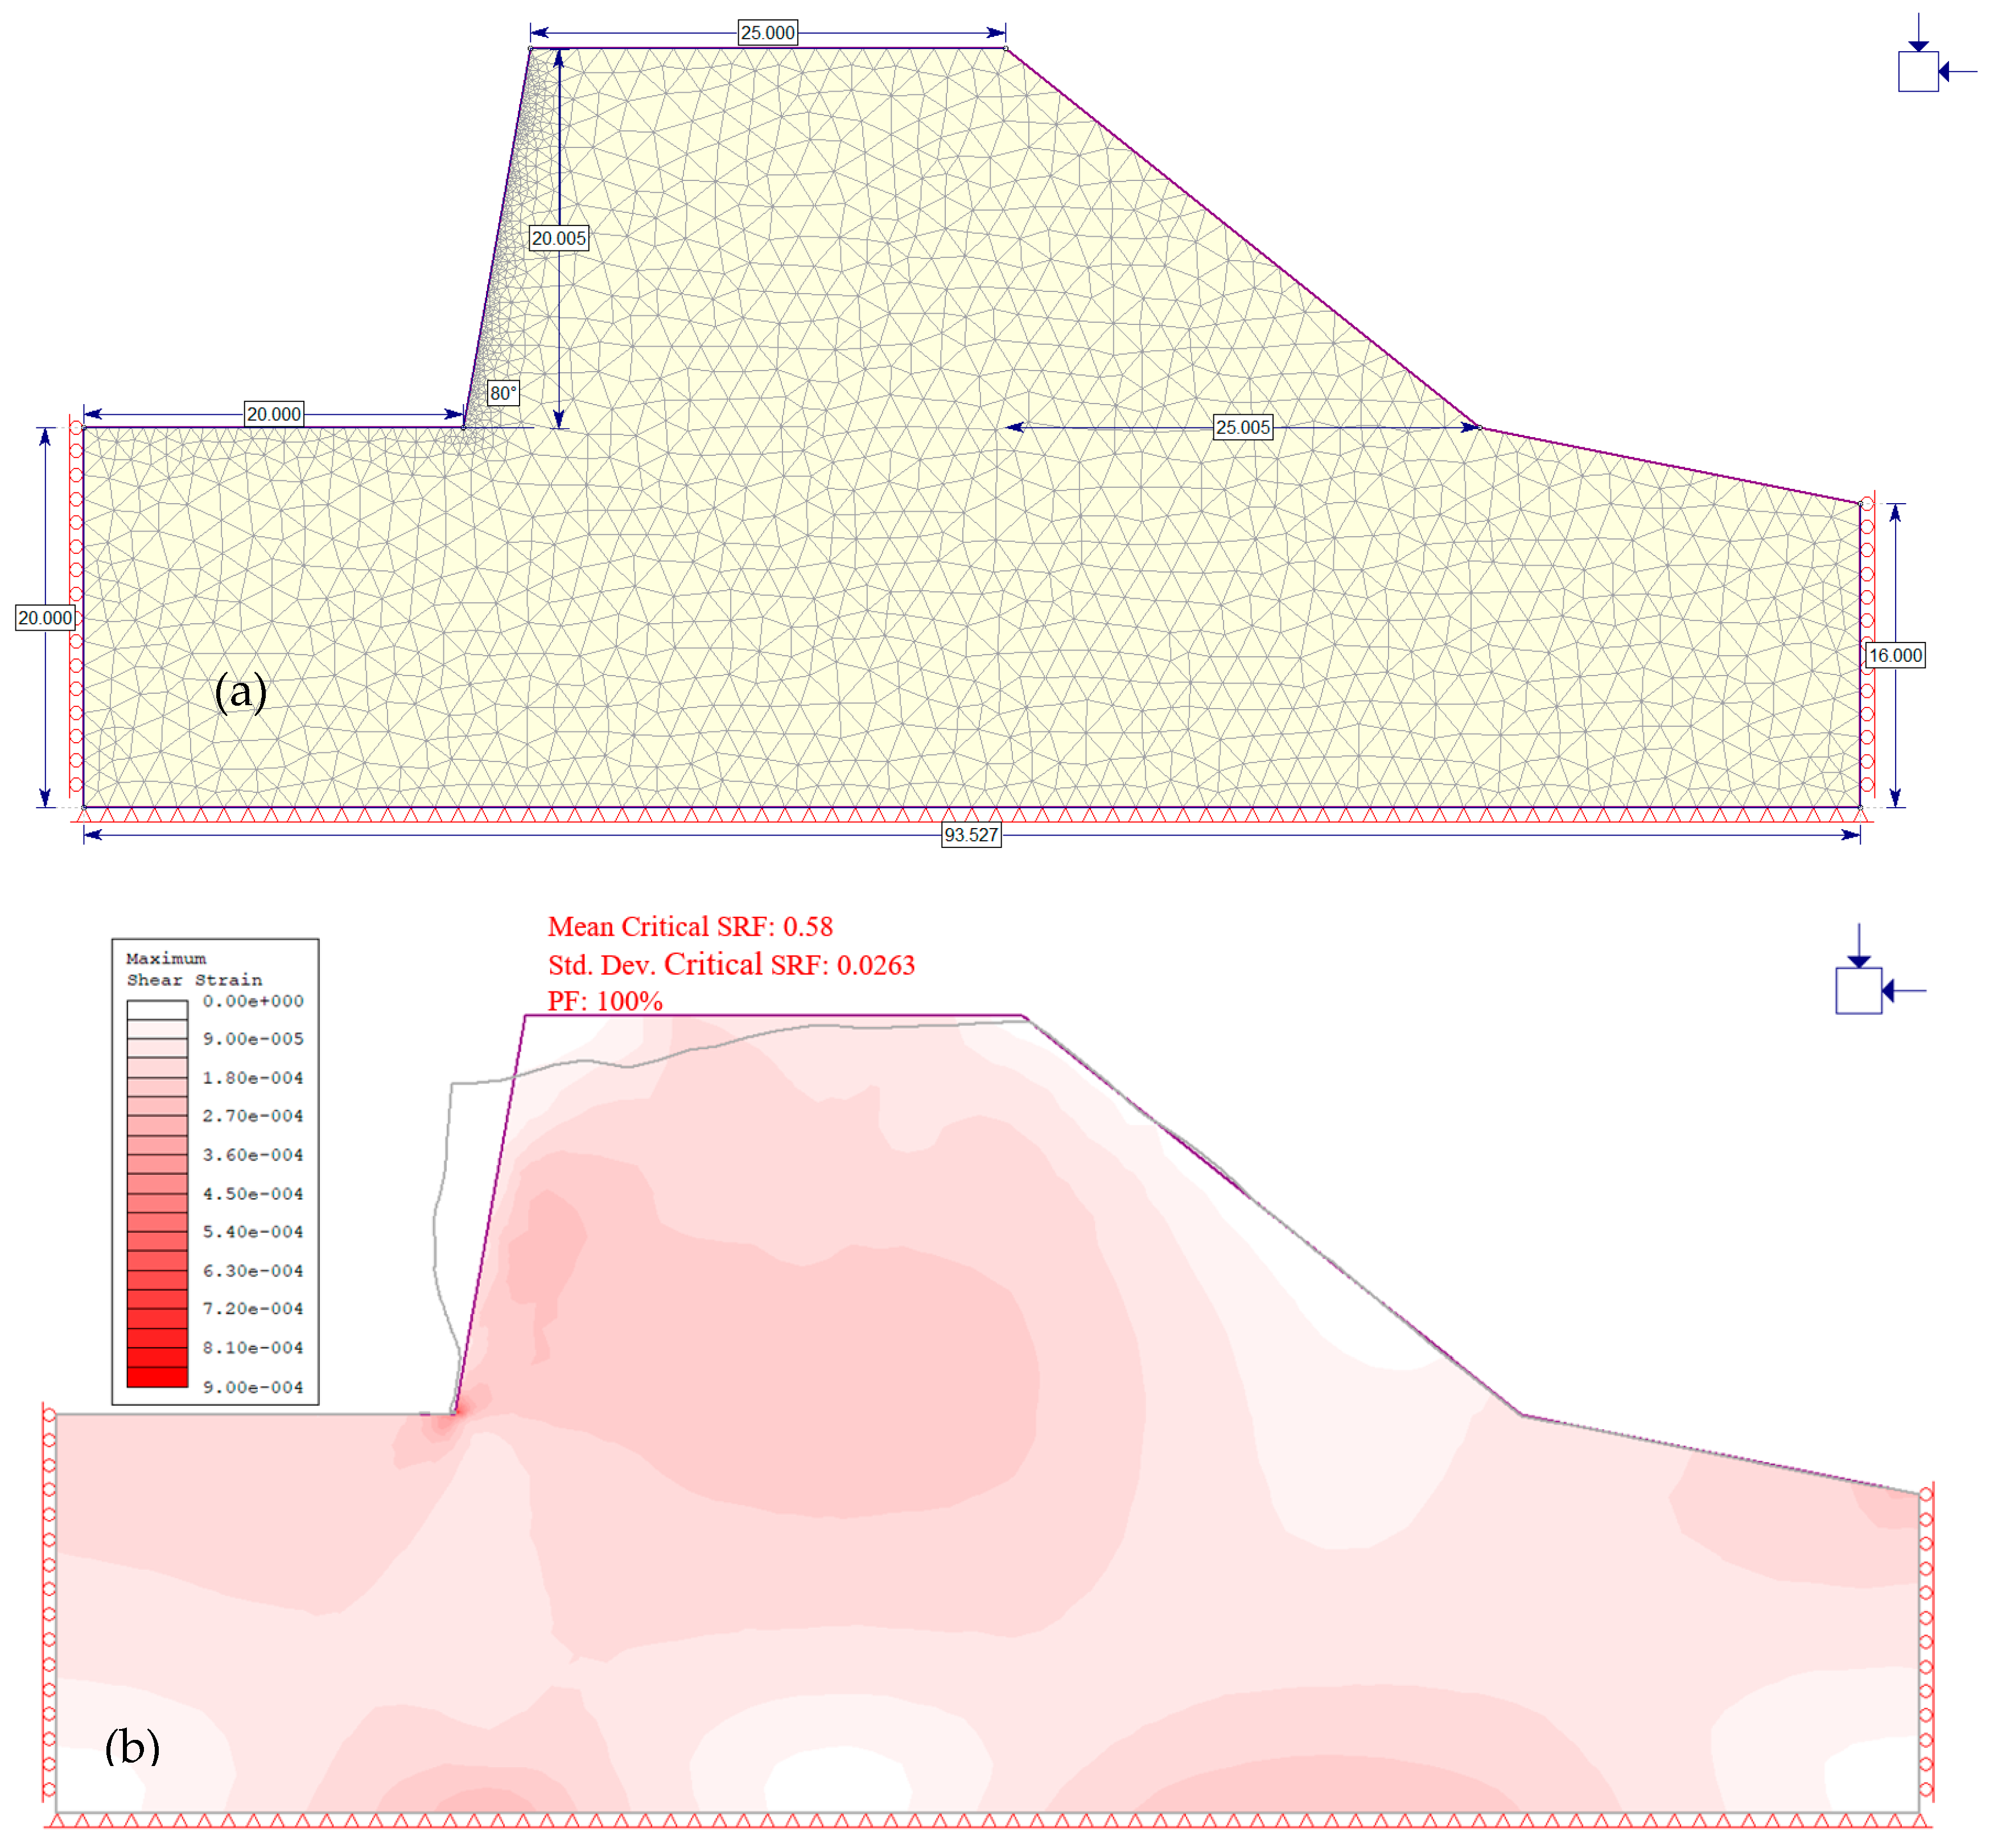
The quarrying activity is done with near-vertical benches, which results in precarious slopes, as seen in Figure 6. The slope stability assessment therefore commenced with determining the safest overall slope angle. Overall slope angle optimization was done by reducing the slope angle systematically from 90° to 30° and noting the associated factor of safety. Figure 7 shows the resulting probable deformation profile (represented by the gray boundary line) for a steep slope of 80°. It can be seen that the upper part of the slope is at a high risk of falling over the slope toe. Shear strain is also highest at the slope toe. It is therefore necessary to unload the slope by removing the material to leave a gentler and stable slope, which is the basis for slope angle optimization. Slope angle optimization was done based on the design concept of an allowable safety factor. An allowable design safety factor value of 1.2 was considered reasonable for the case under study. It is worthy to note that at every excavation depth, the distance from the shoreline to the slope face was maintained at 50 m, 75 m, and 100 m, and only the slope face angle was altered, leading to the differences in model shapes.
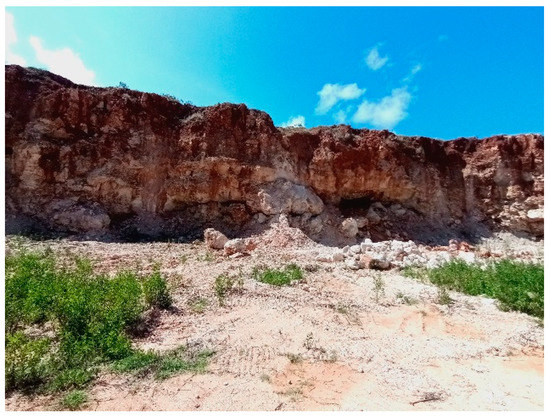
Figure 6.
Near-vertical slopes from excavation.
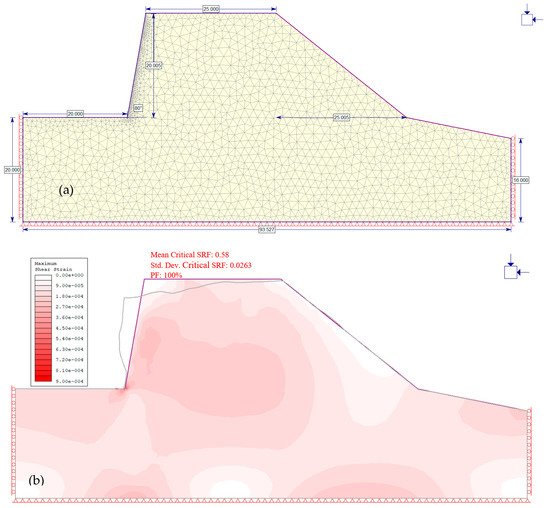
Figure 7.
(a) Dimension and mesh of slope at 80° angle; (b) probable resultant deformation of steep quarry slope.
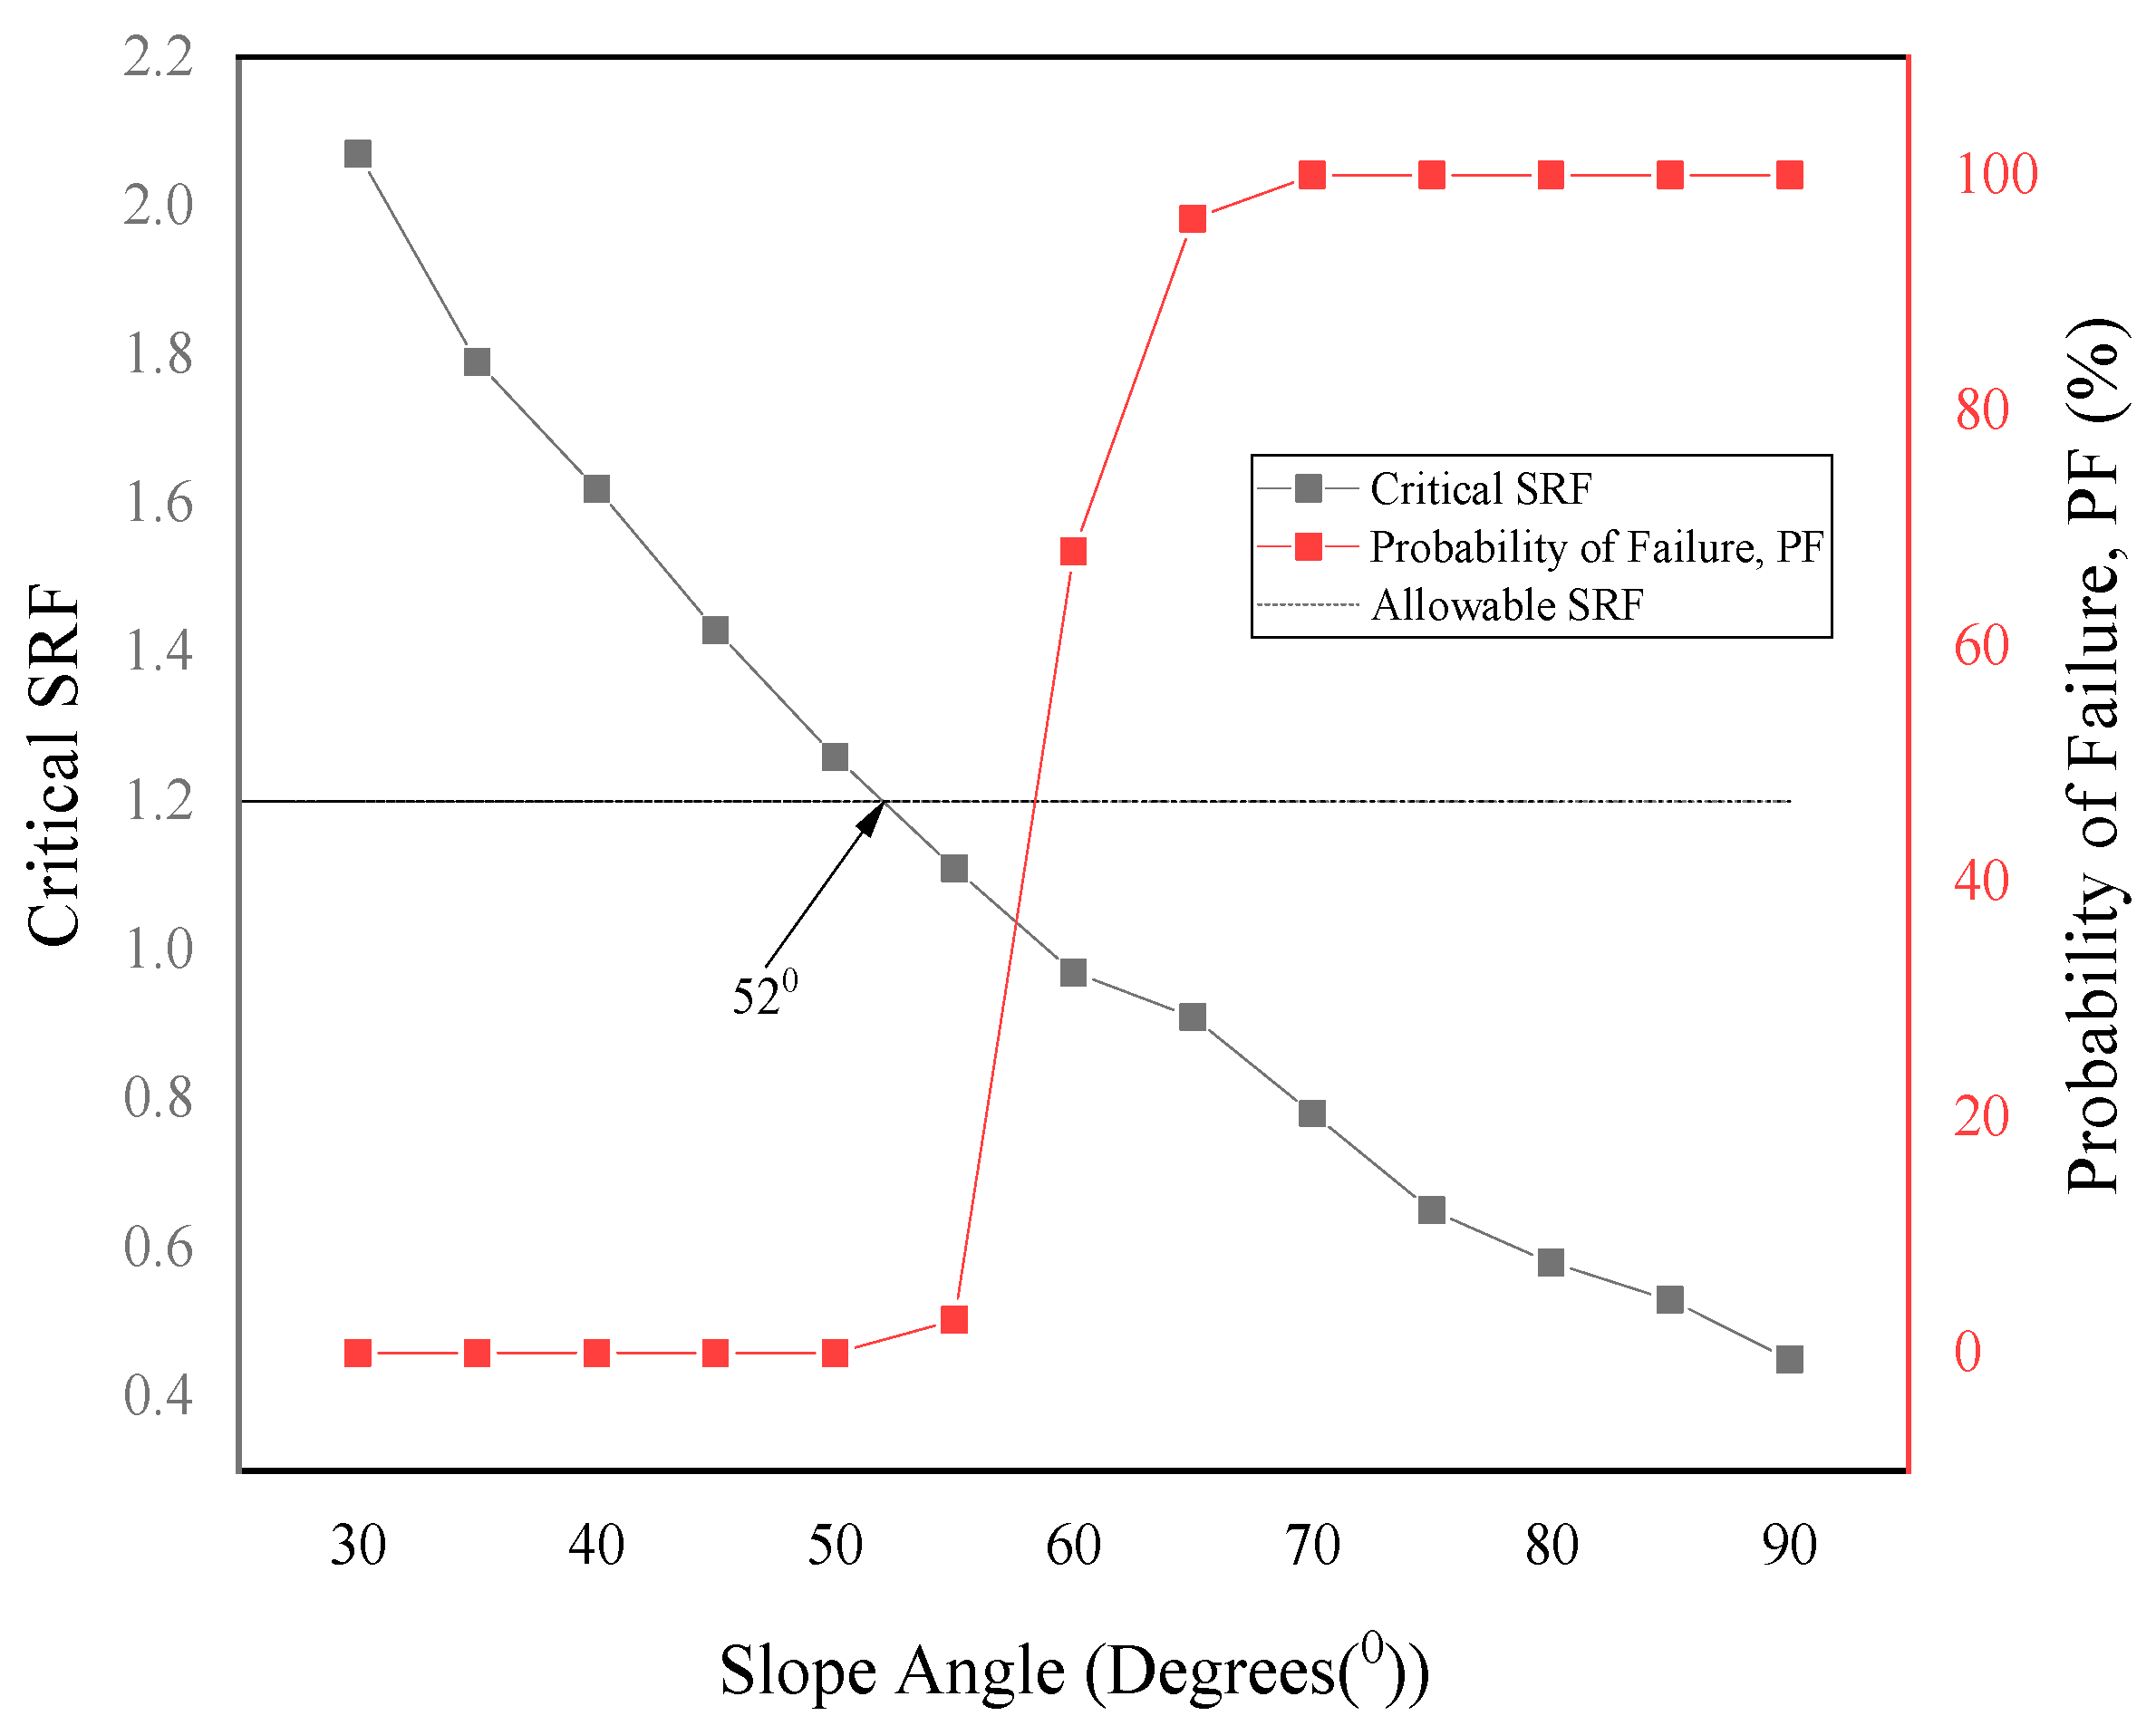
The optimum slope angle of 52° corresponding to a safety factor of 1.2 was obtained for an excavation depth of 20 m at 50 m from the shoreline. Following the optimization of the slope angle at 20 m excavation depth, the other slopes at deeper excavations were determined from a smaller range of trials. Optimum slope angle for each excavation depth was determined by starting from the slope angle of the prior excavation depth, then reducing the slope angle till the angle corresponding to a safety factor of 1.2 was attained. The overall slope angles for various excavation depths were as follows: 46° for 30 m depth, 42° for 40 m depth, and 39° for 50 m depth, all at 50 m distance from the shoreline, as shown in Figure 8.
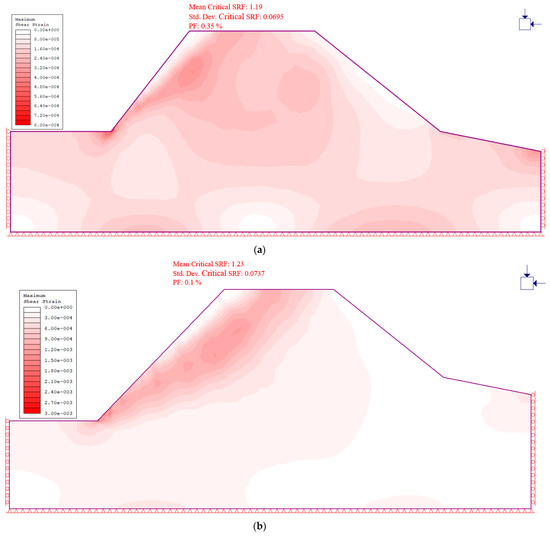
Figure 8.
Optimized slope angles for various excavation depths at 50 m distance from the shoreline. (a) 20 m depth, 52° slope angle; (b) 30 m depth, 46° slope angle; (c) 40 m depth, 42° slope angle; (d) 50 m depth, 39° slope angle.
The stability analysis also incorporated the statistical analysis function of Phase 2 to evaluate the slope probability of failure (PF). The PF is generated by the analysis software when the statistical option is selected in project settings. A standard deviation is set for material properties to allow the statistical calculation. From Figure 8, the probability of failure is high for steep slope angles between 90° and 60°, after which it significantly reduces when the safety factor is ≥1. The graph gives a good visual impression of the stability of the slope, in that even when the safety factor is high, the steep slope angles present high probabilities of failure. In the dry condition, there is no significant difference in slope angle relative to distance from the shoreline. The data in Table 2 were used to plot the graph of variation of safety factor with slope angles, as shown in Figure 9.
Table 2.
Slope angle optimization.
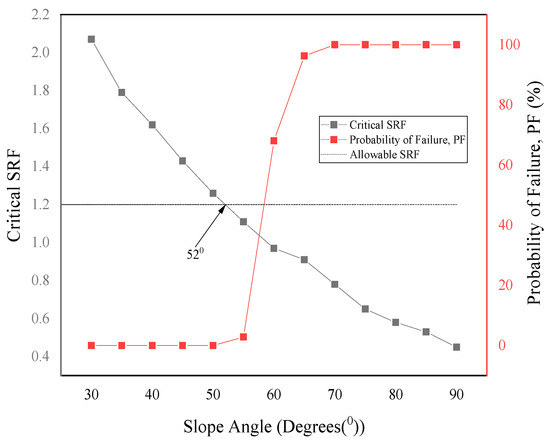
Figure 9.
Graph of slope angle vs. strength reduction factor (FSRF) and probability of failure (PF).
4.2. Pore Pressure Computations
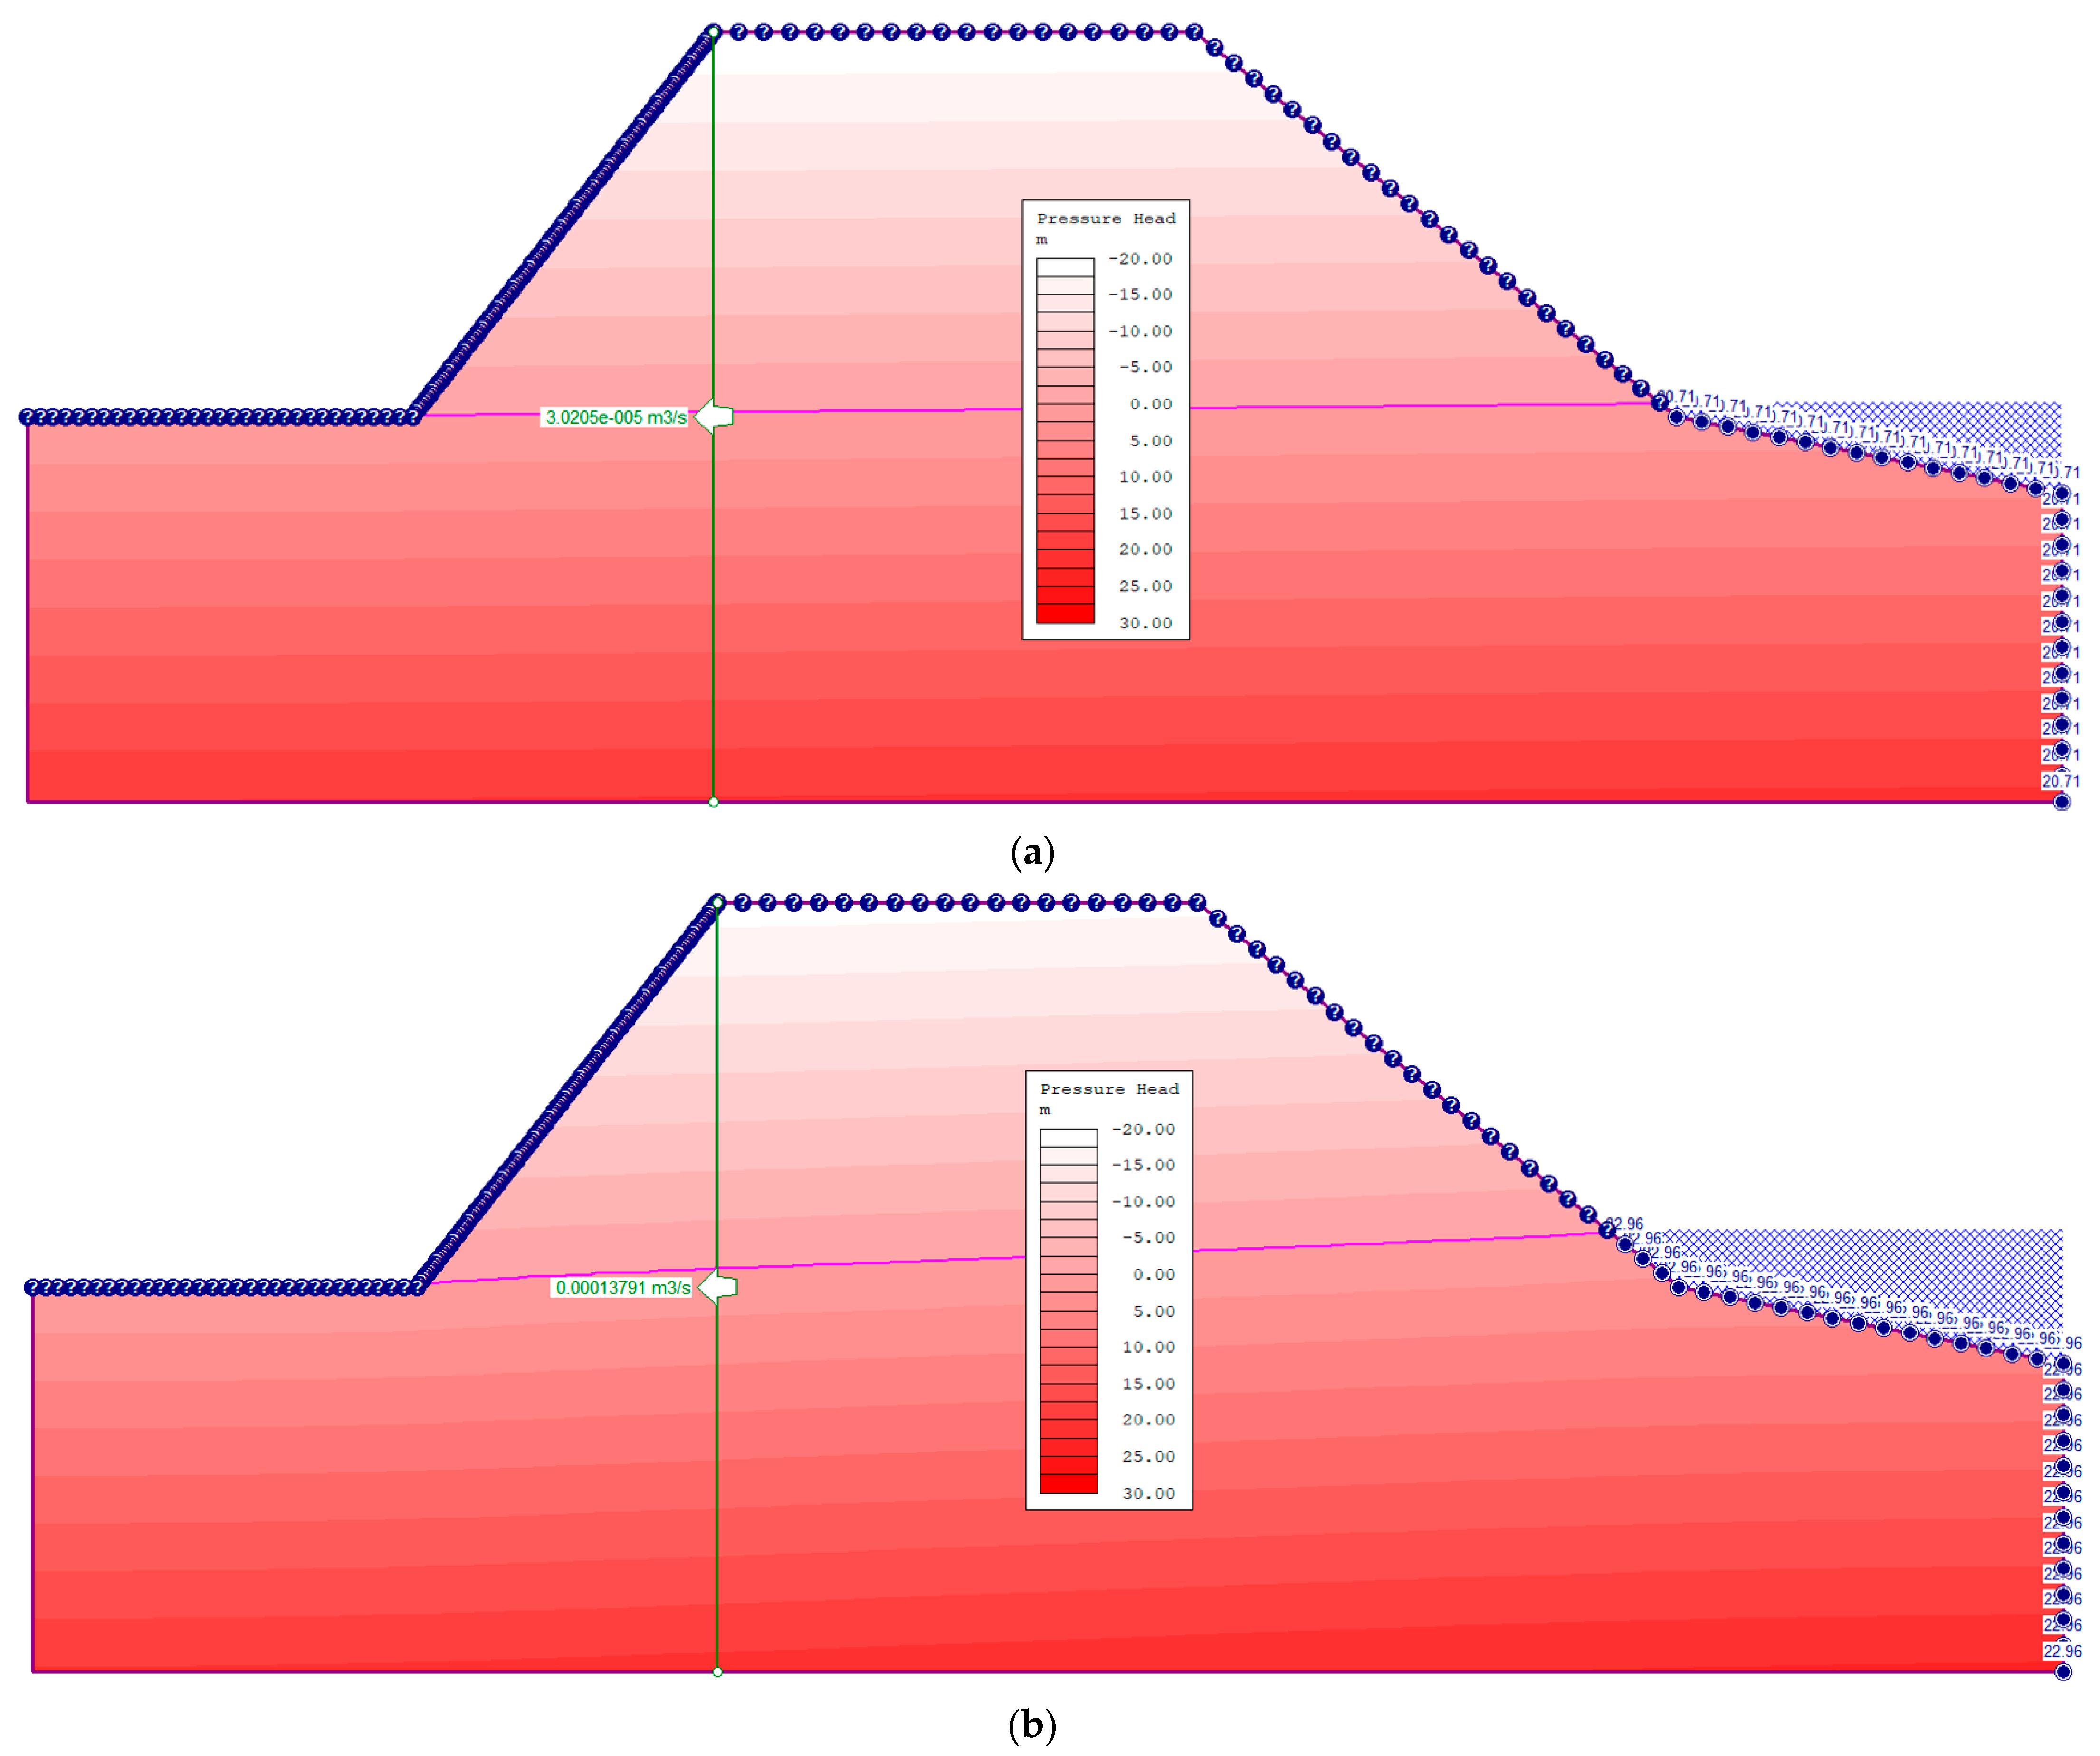
In Phase 2 finite element analysis, groundwater seepage analysis is integrated with stress analysis. This means that the groundwater seepage analysis is first computed and then the pore pressure results are automatically used in stress analysis. In this section, the ocean water seepage is first separately computed so as to have an idea of how the pore pressures in the slope vary with variation in tidal levels. Analysis of seepage of ocean waters through the slope was done as a drawdown analysis in three stages. The first stage was low tide, the second high tide, and the third low tide to simulate the daily rising and falling of ocean tides. The total head levels used were 0.71 m for low tide and 2.96 m for high tide, giving a head difference of 2.25 m. Plots of variation of pore pressures in the slope due to changing tides are shown in Figure 10 for the slope at 20 m excavation depth. The flow lines mark the phreatic surface (line of zero pore pressure) in the slope due to ocean-water seepage. Above the line, the pore pressure is negative and below the line, the pore pressure is positive. At low tide, the discharge velocity to the seepage face is low, while at high tide, the discharge velocity increases with positive pore pressure developing in the lower sections of the slope. At high tide, the water table in the slope also rises, and this explains why seawater is seen on the quarry floor during high tide.
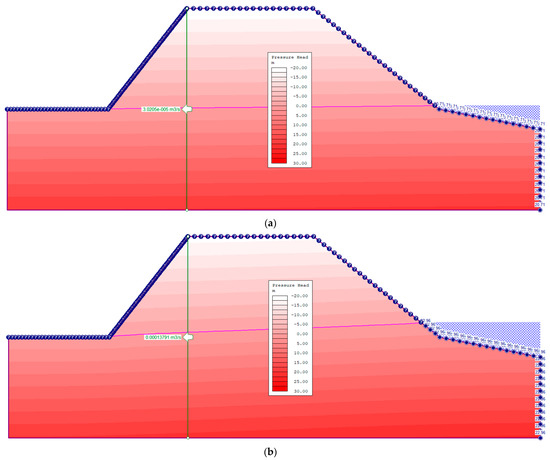
Figure 10.
Pore pressure within the slopes at low and high tides (20 m excavation depth 50 m from shoreline). (a) Low tide level 0.71 m; (b) high tide level 2.96 m.
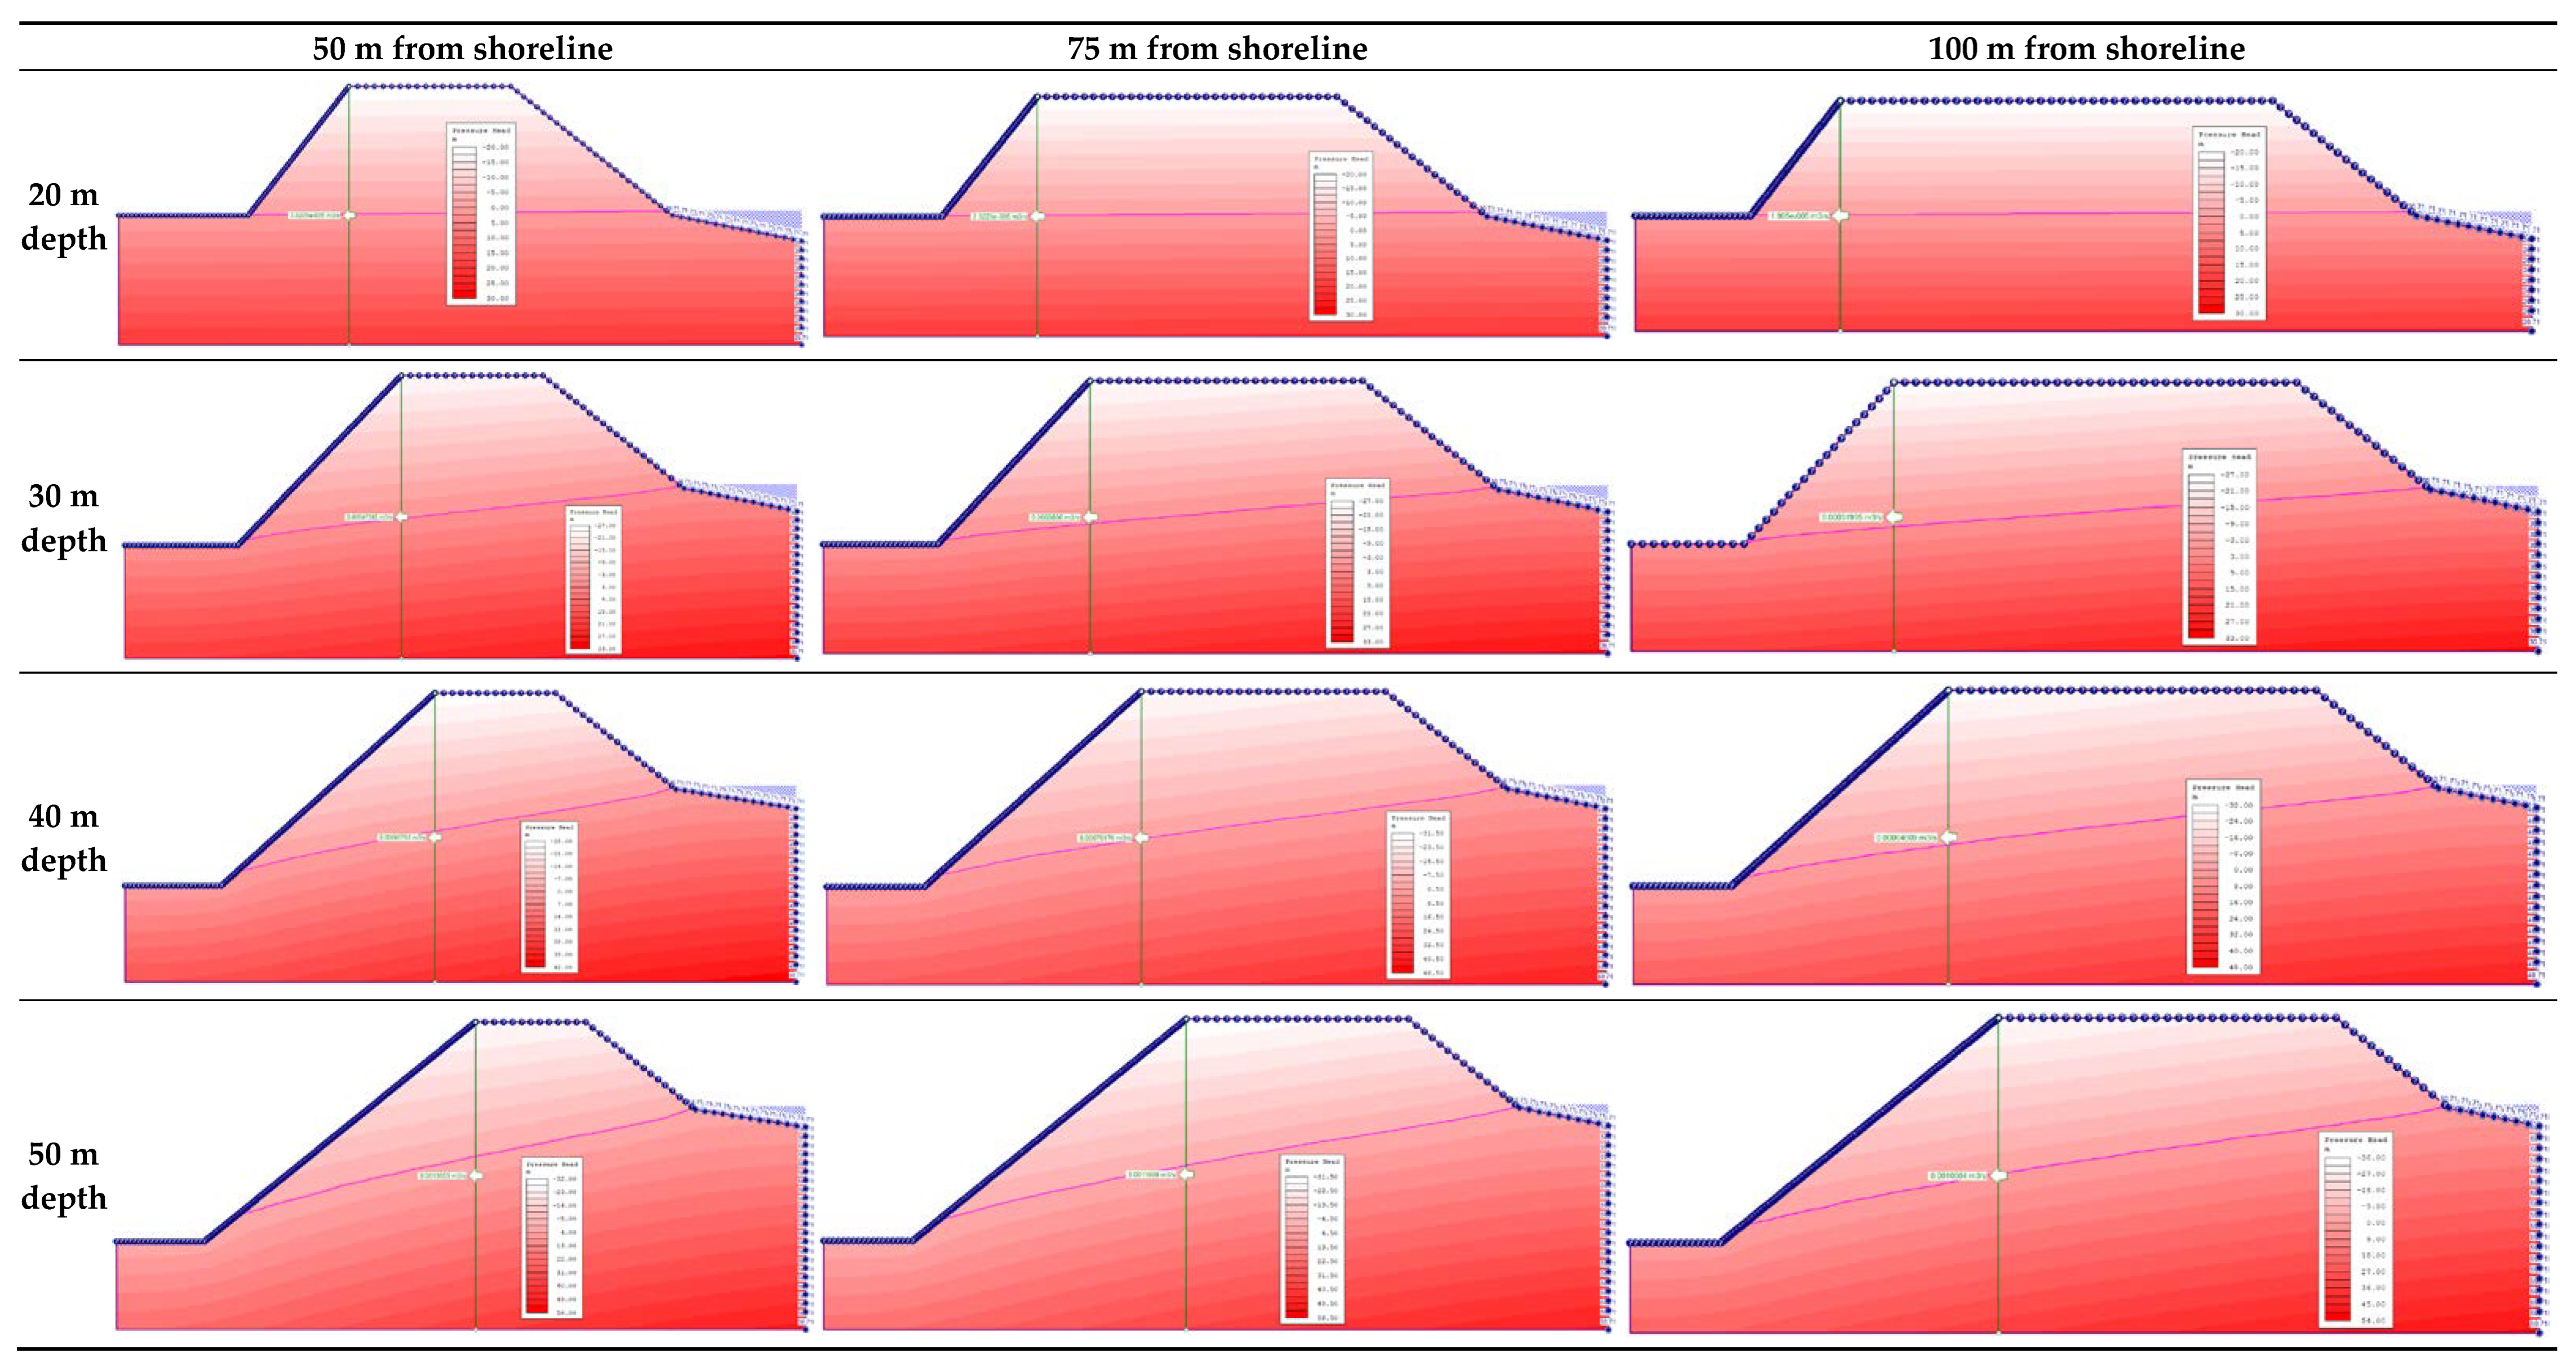
A parametric analysis was conducted on the variation in ocean-water seepage with excavation depth and distance from the shoreline. The nephograms in Figure 11 show the various pore pressure plots. At the same distance from the shoreline, the pore pressure in the slope and discharge velocity increase with increasing excavation depth. On the other hand, when the excavation depth is held constant, the discharge velocity decreases with increasing distance from shoreline and the pore pressure intensity also reduces. An observation of the trend of the phreatic surface shows that the farther the slope face is from the shoreline, the smaller the slope section exposed to ocean-water intrusion.
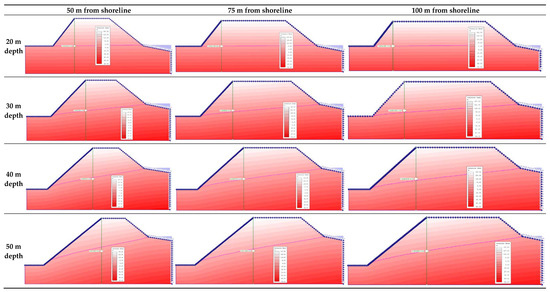
Figure 11.
Variation of pressure heads with excavation depth and distance from shoreline.
4.3. Slope Stability Due to Seepage of Ocean Water
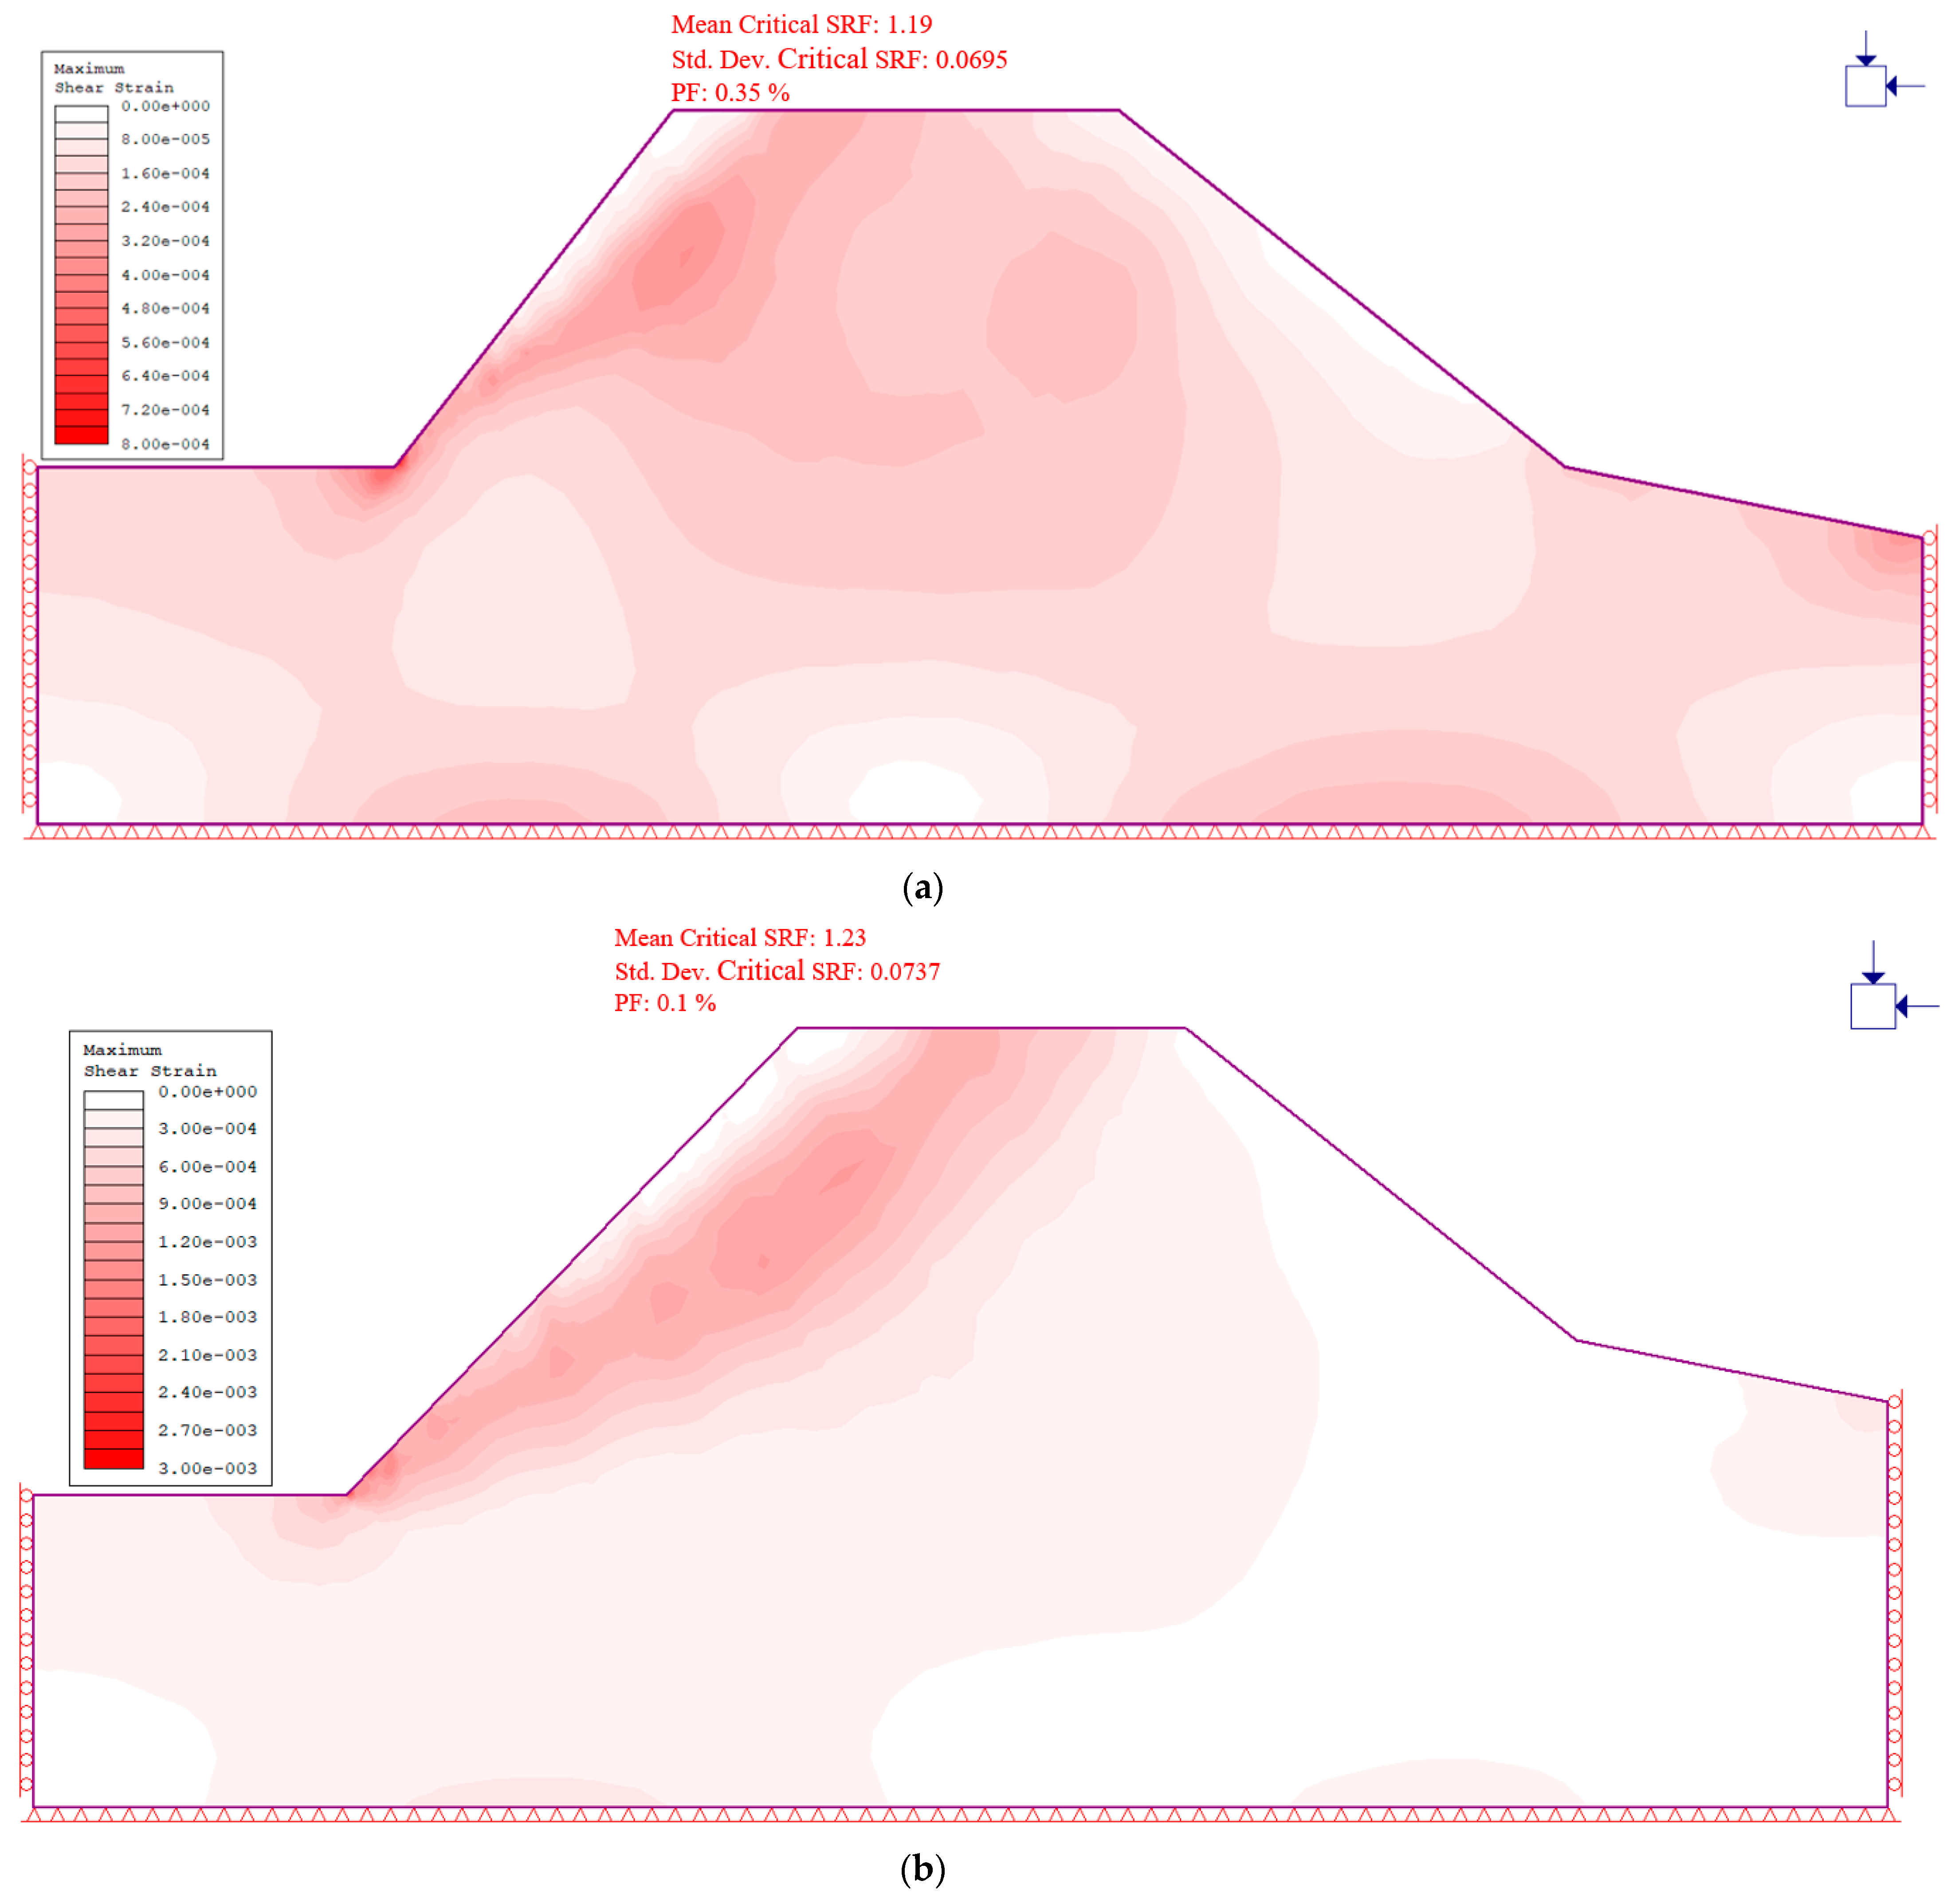
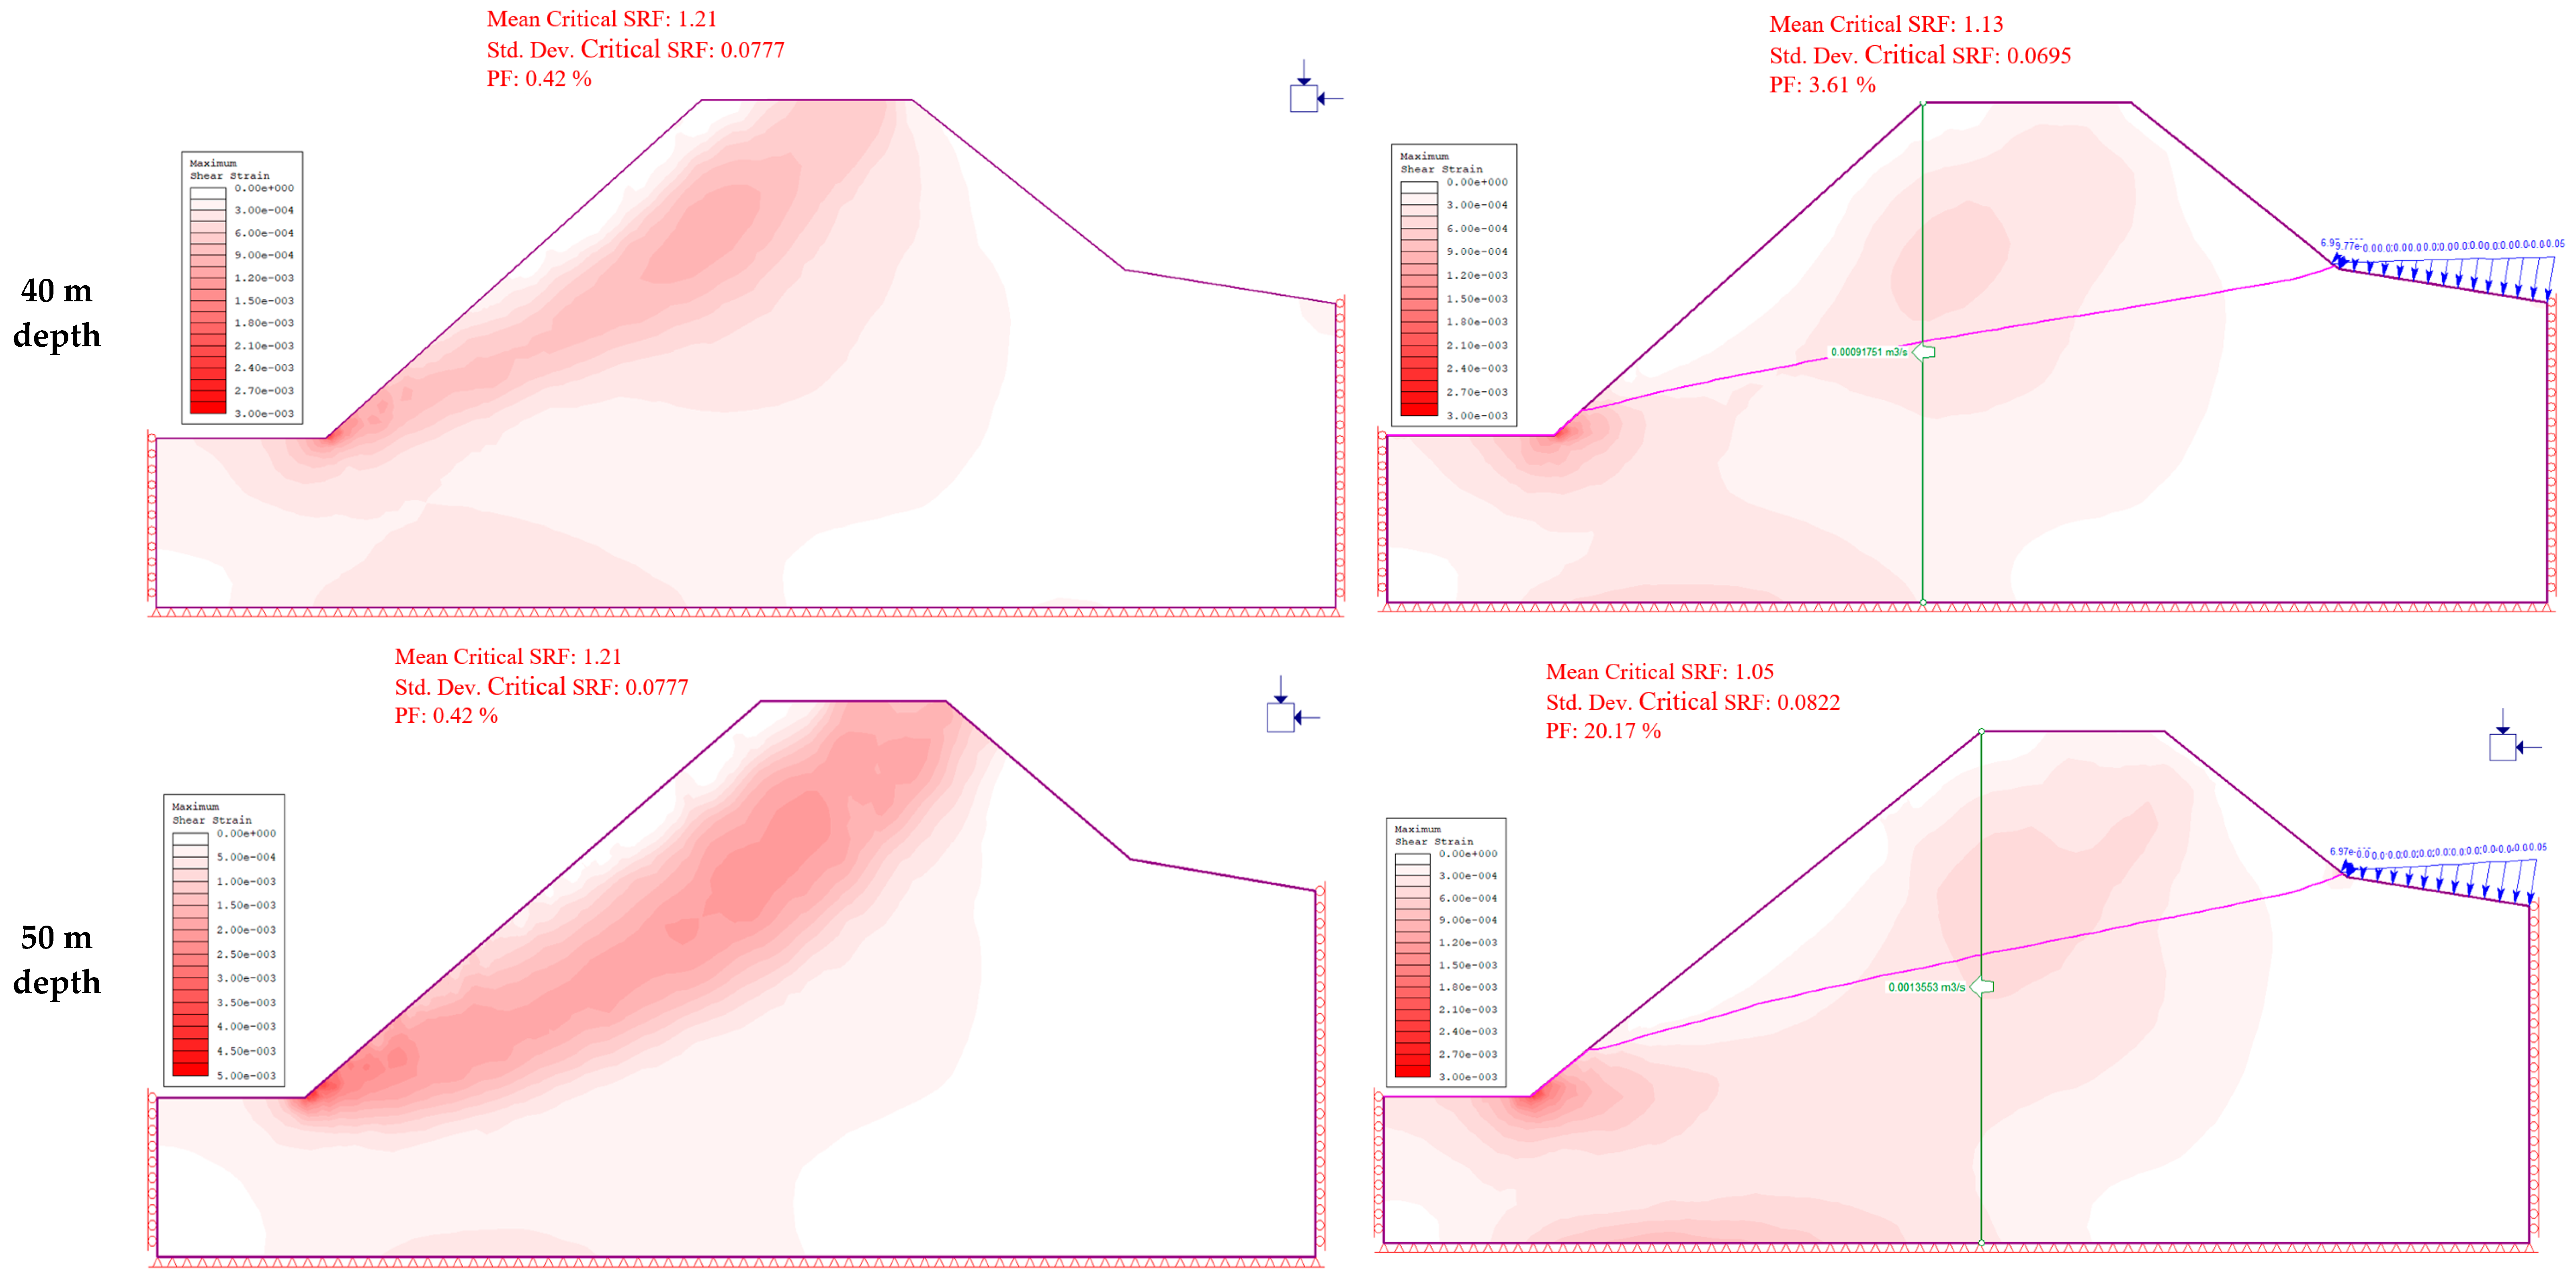
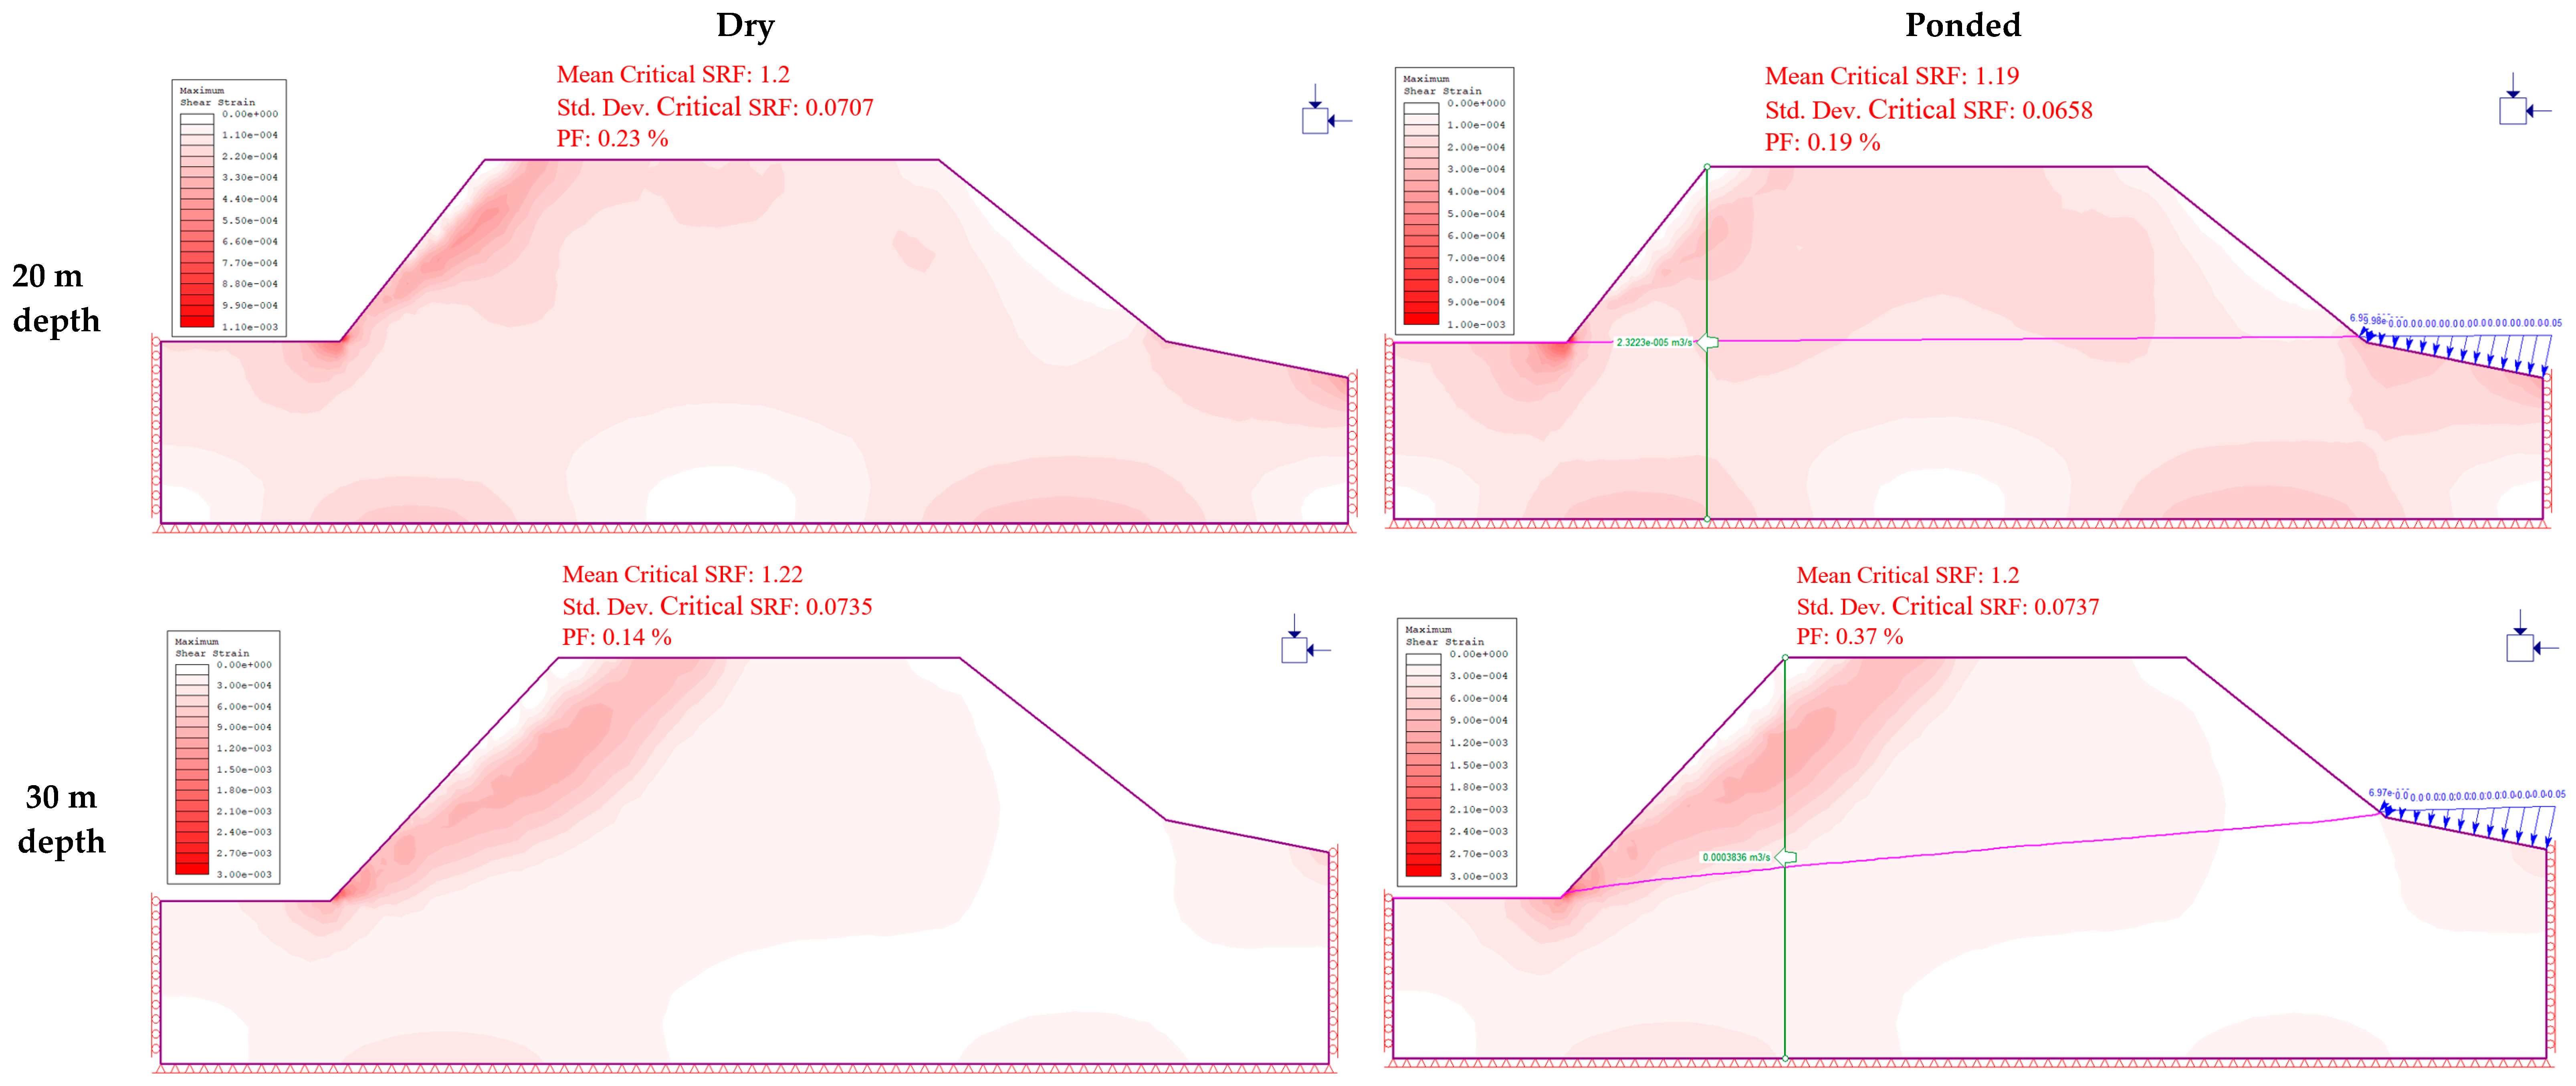
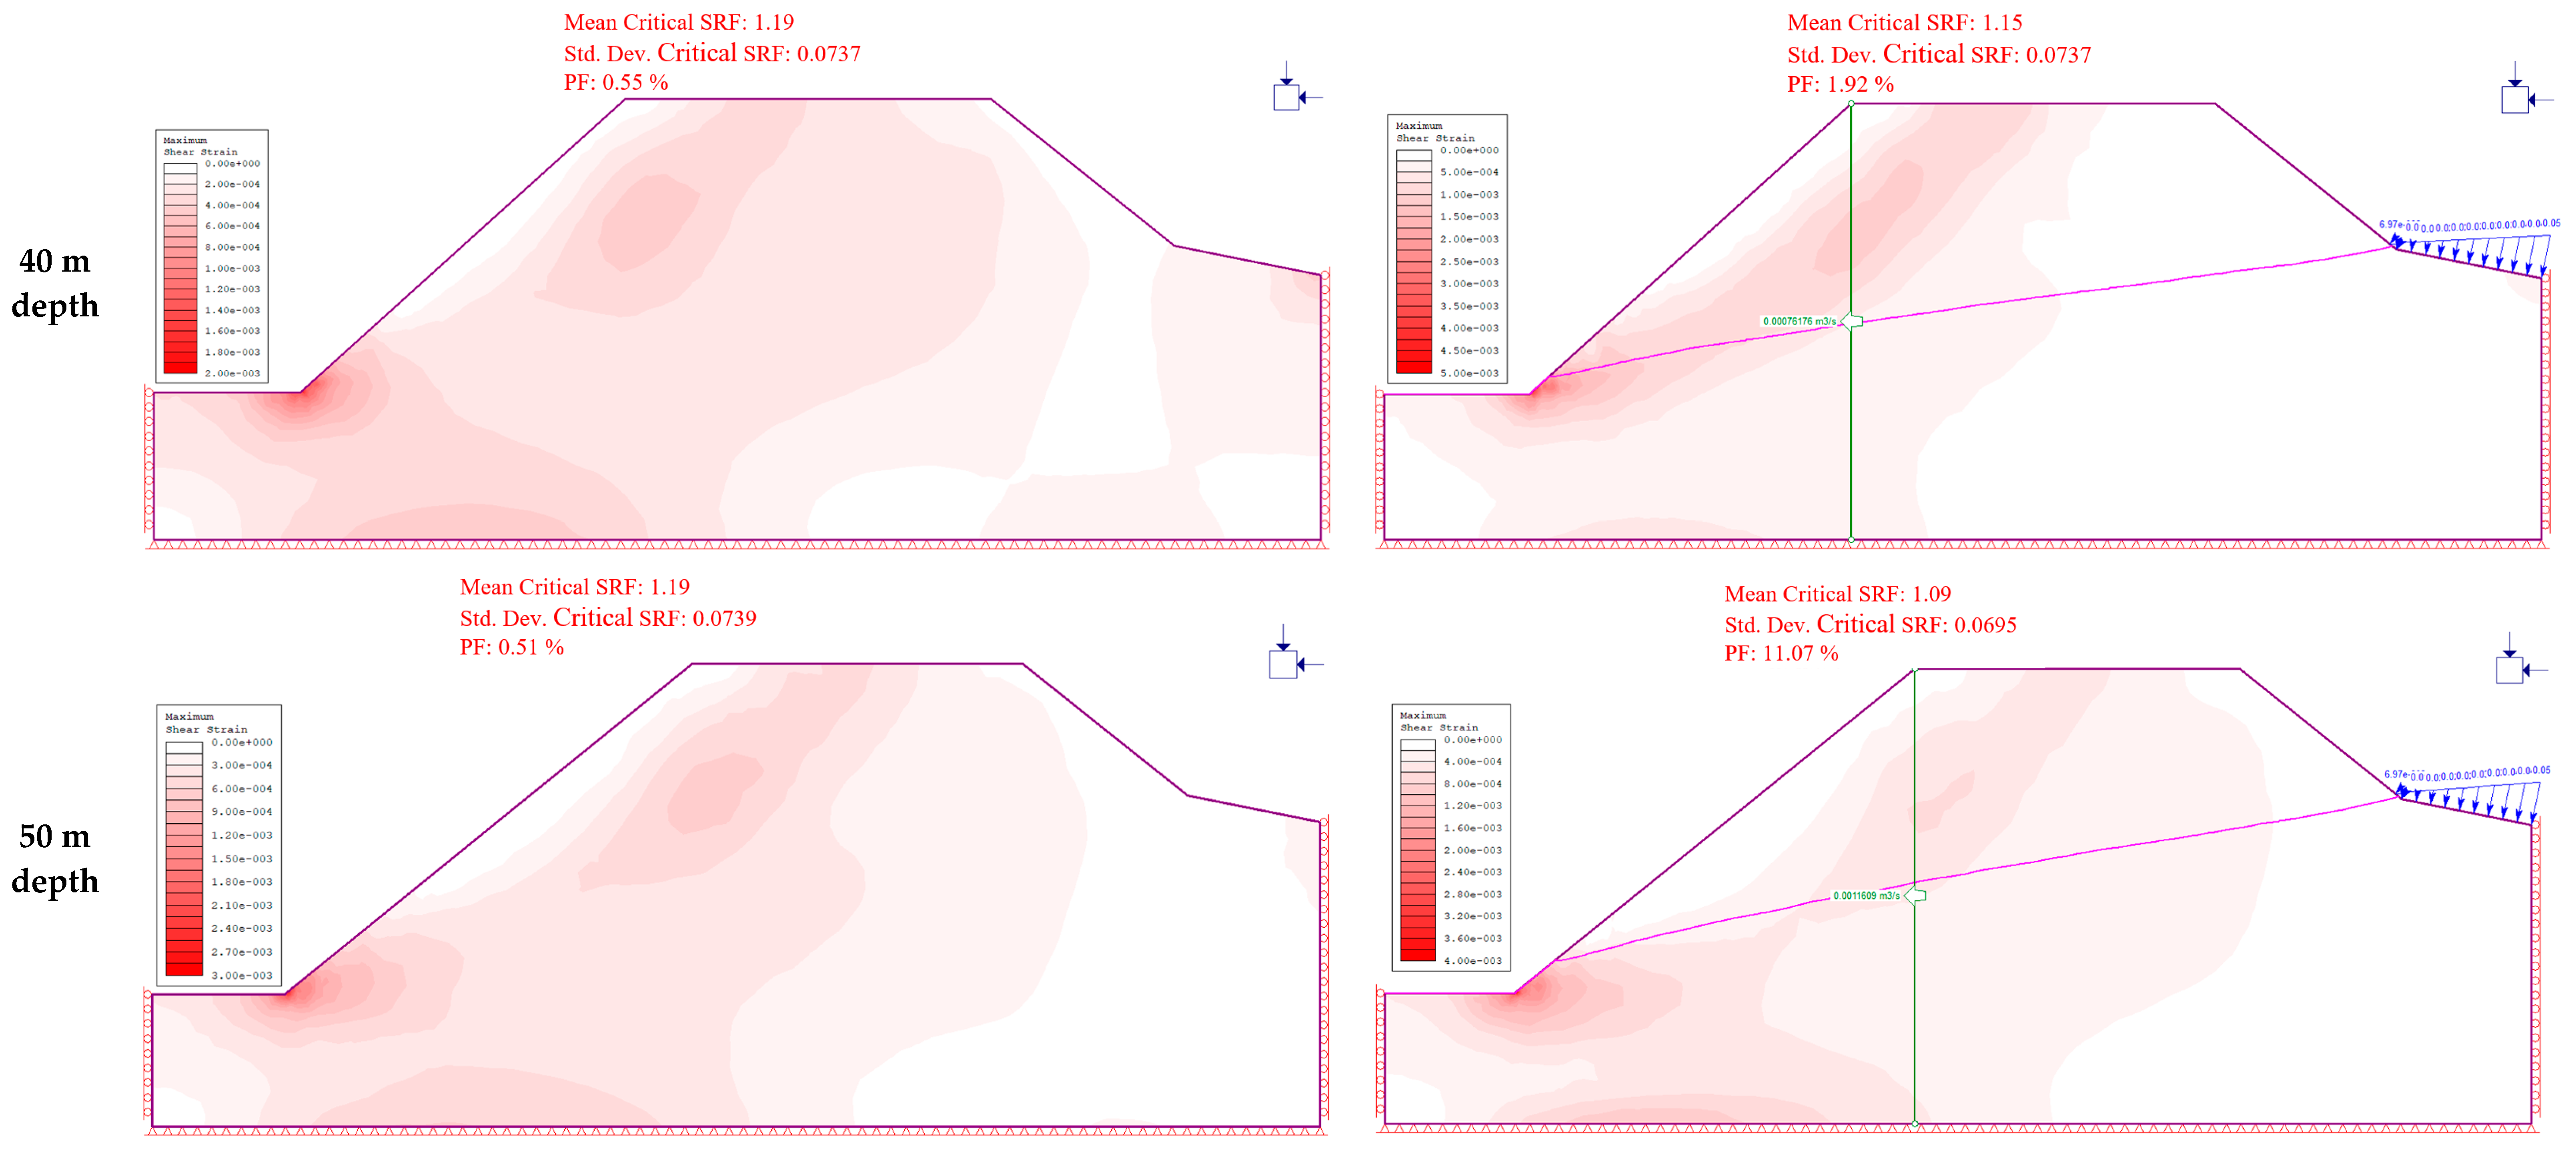
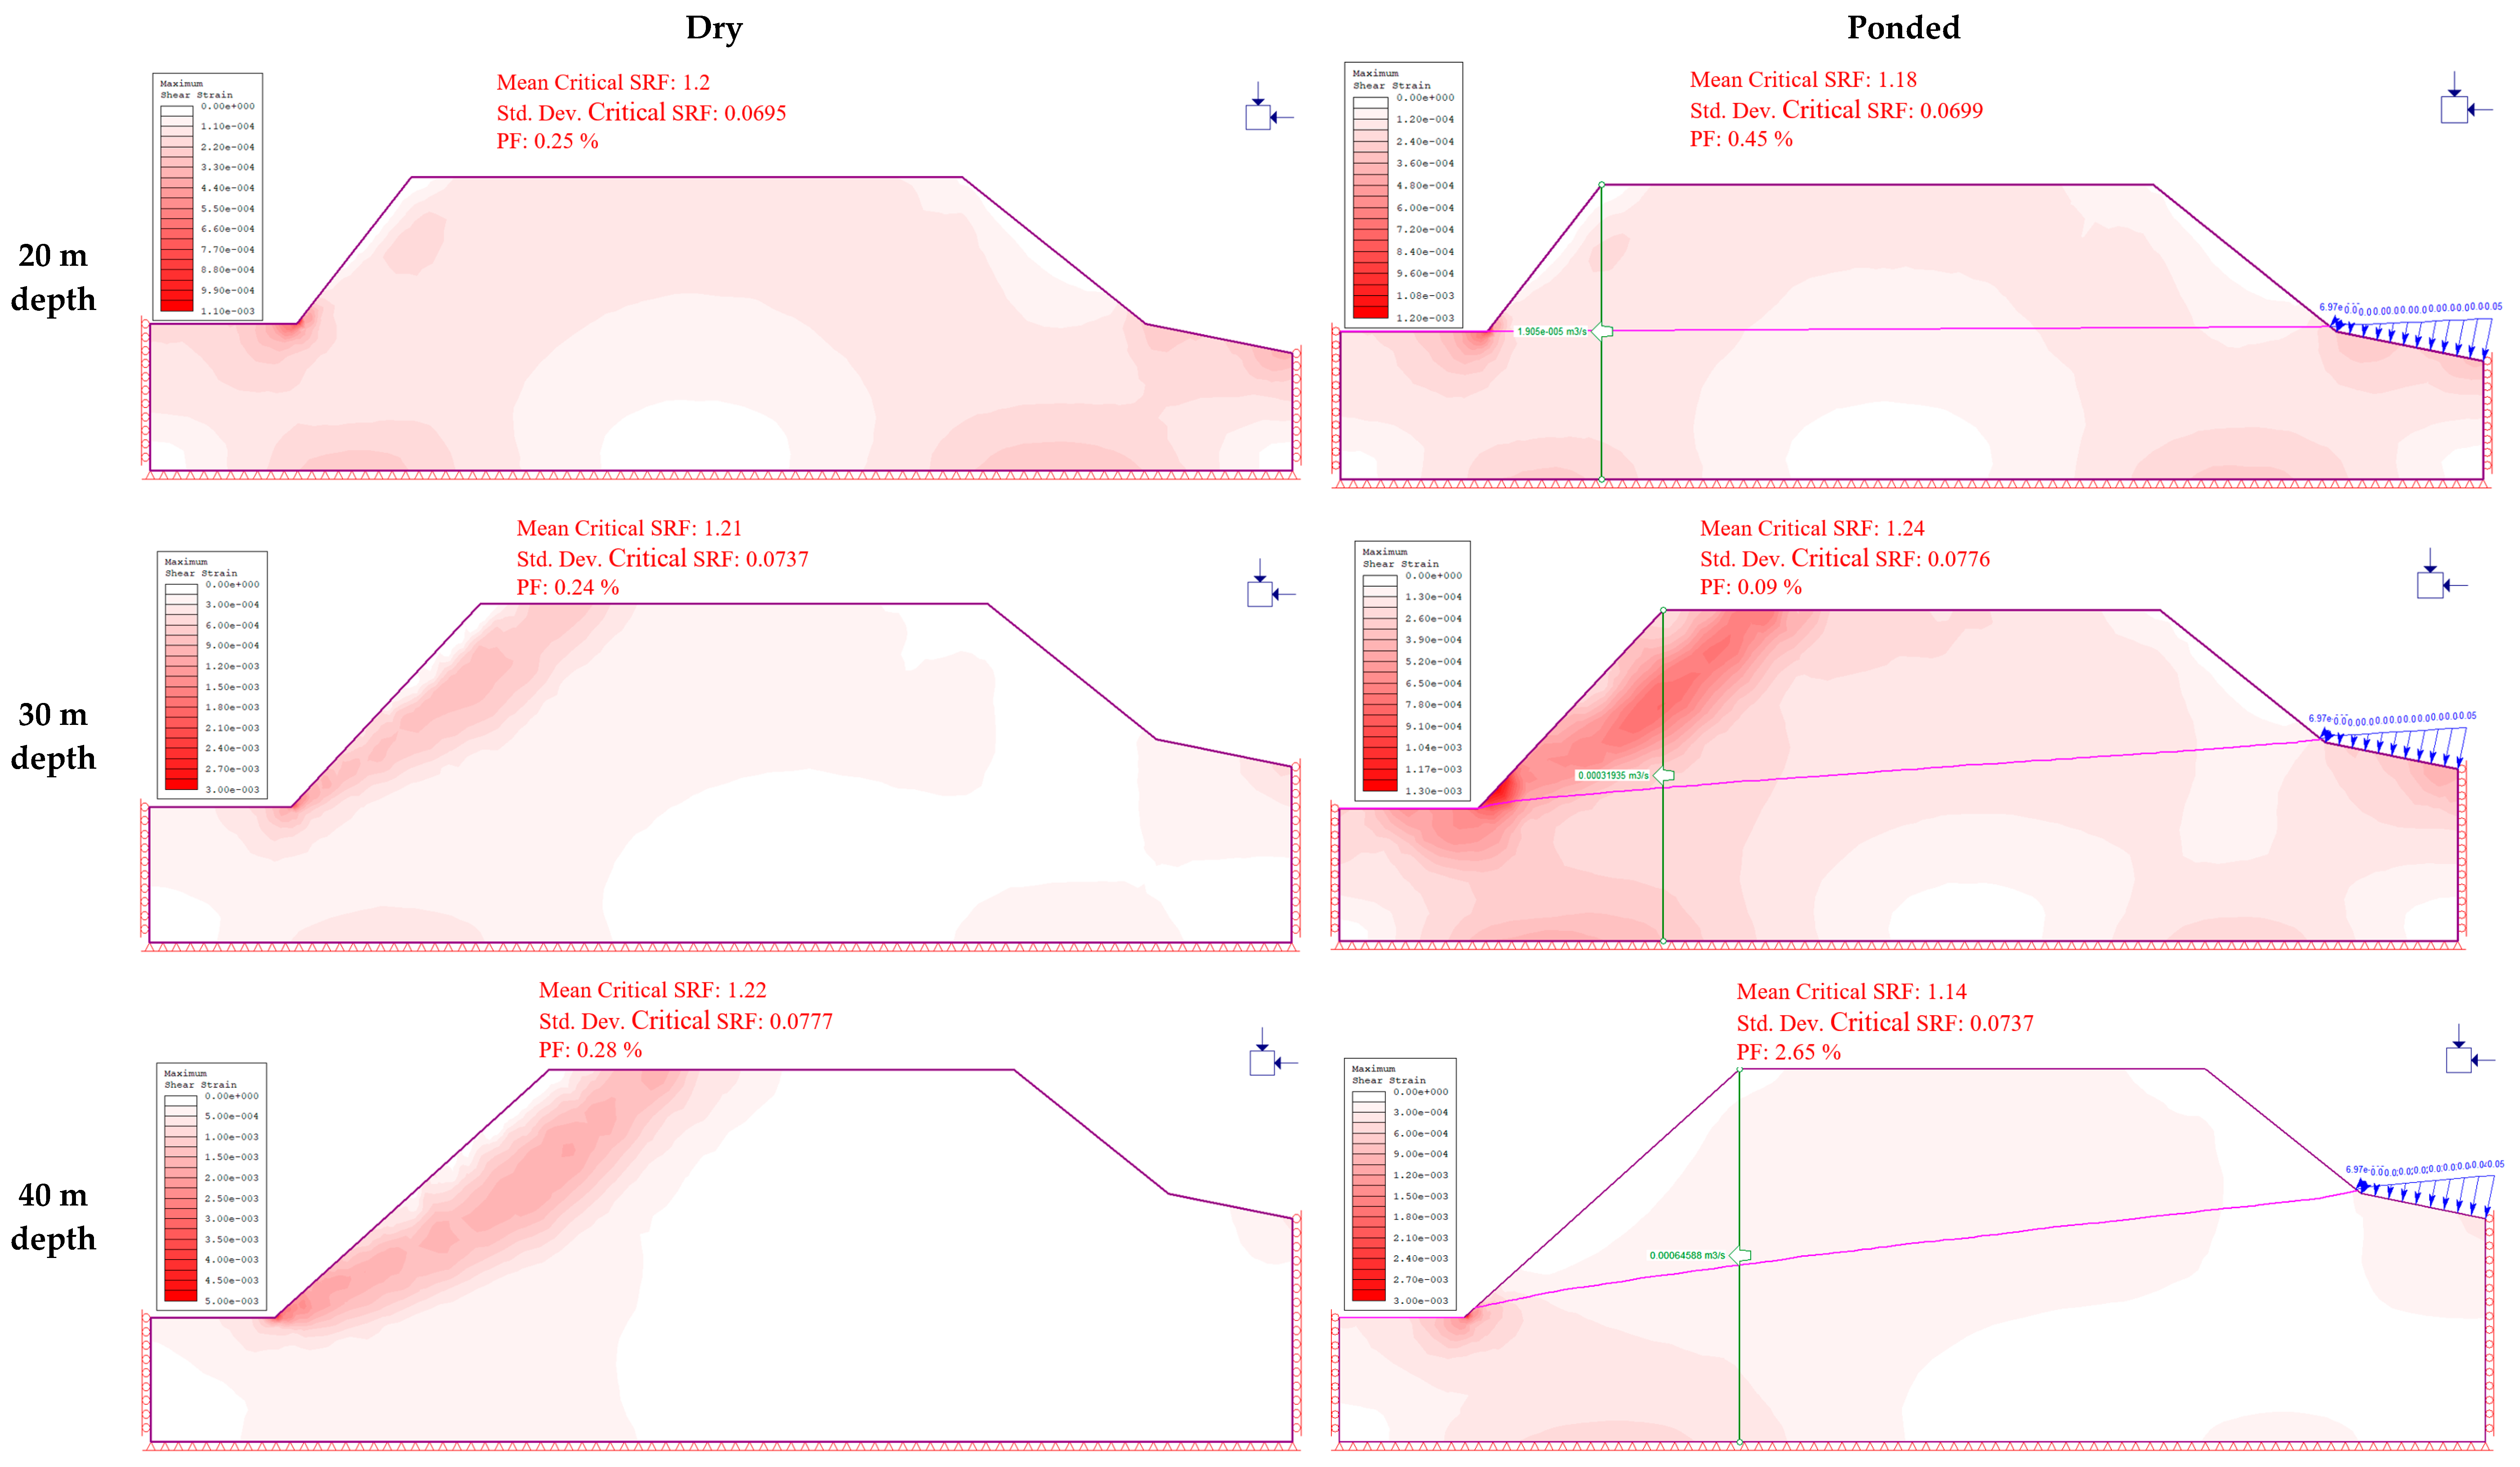
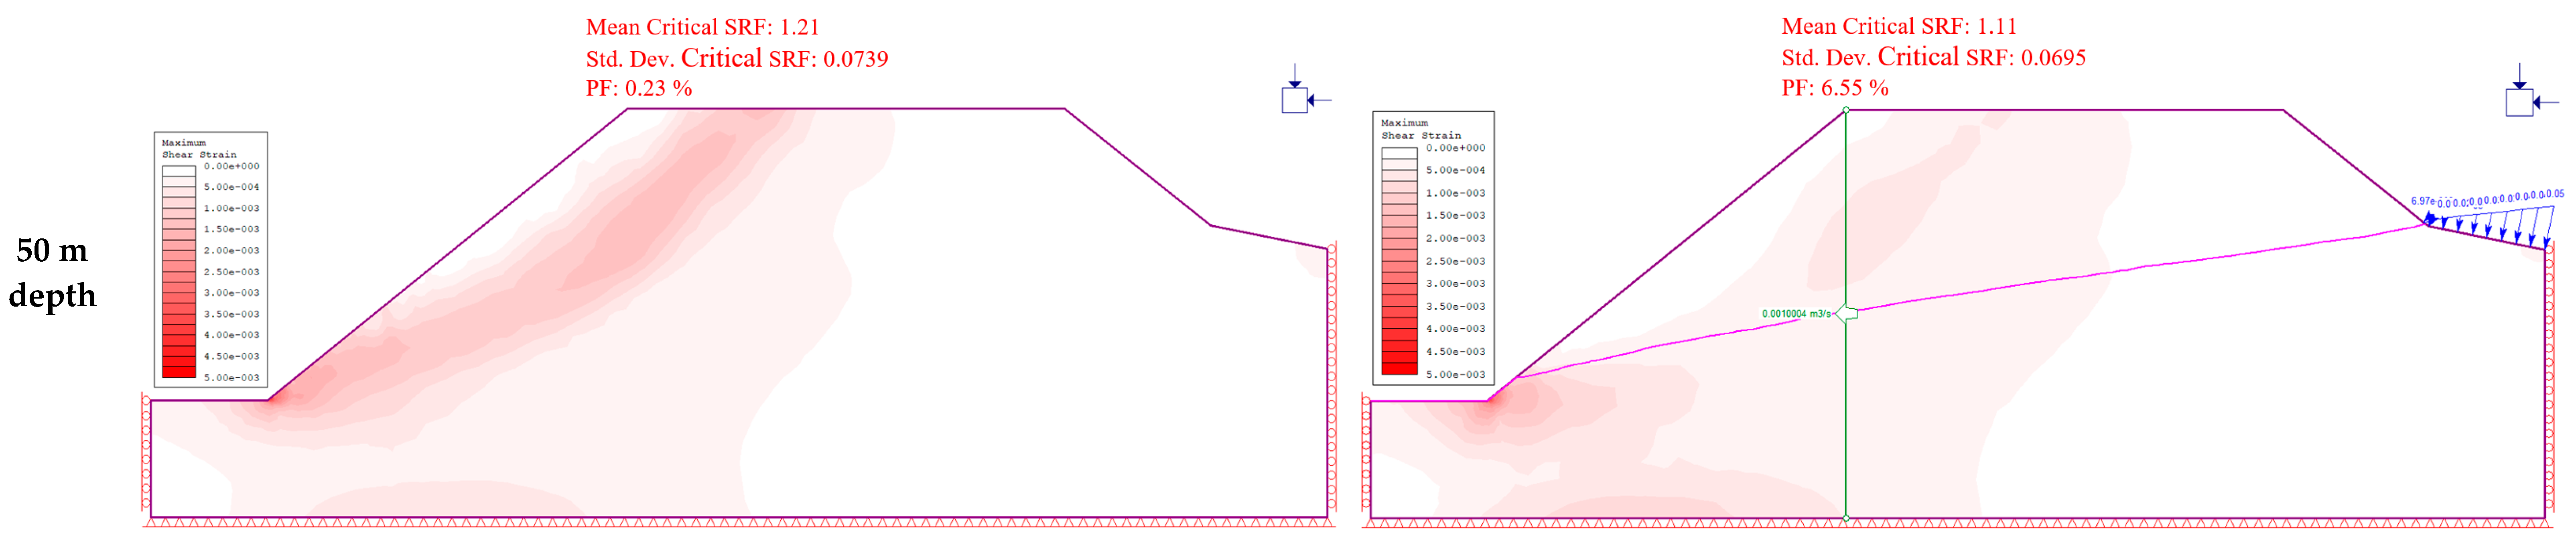
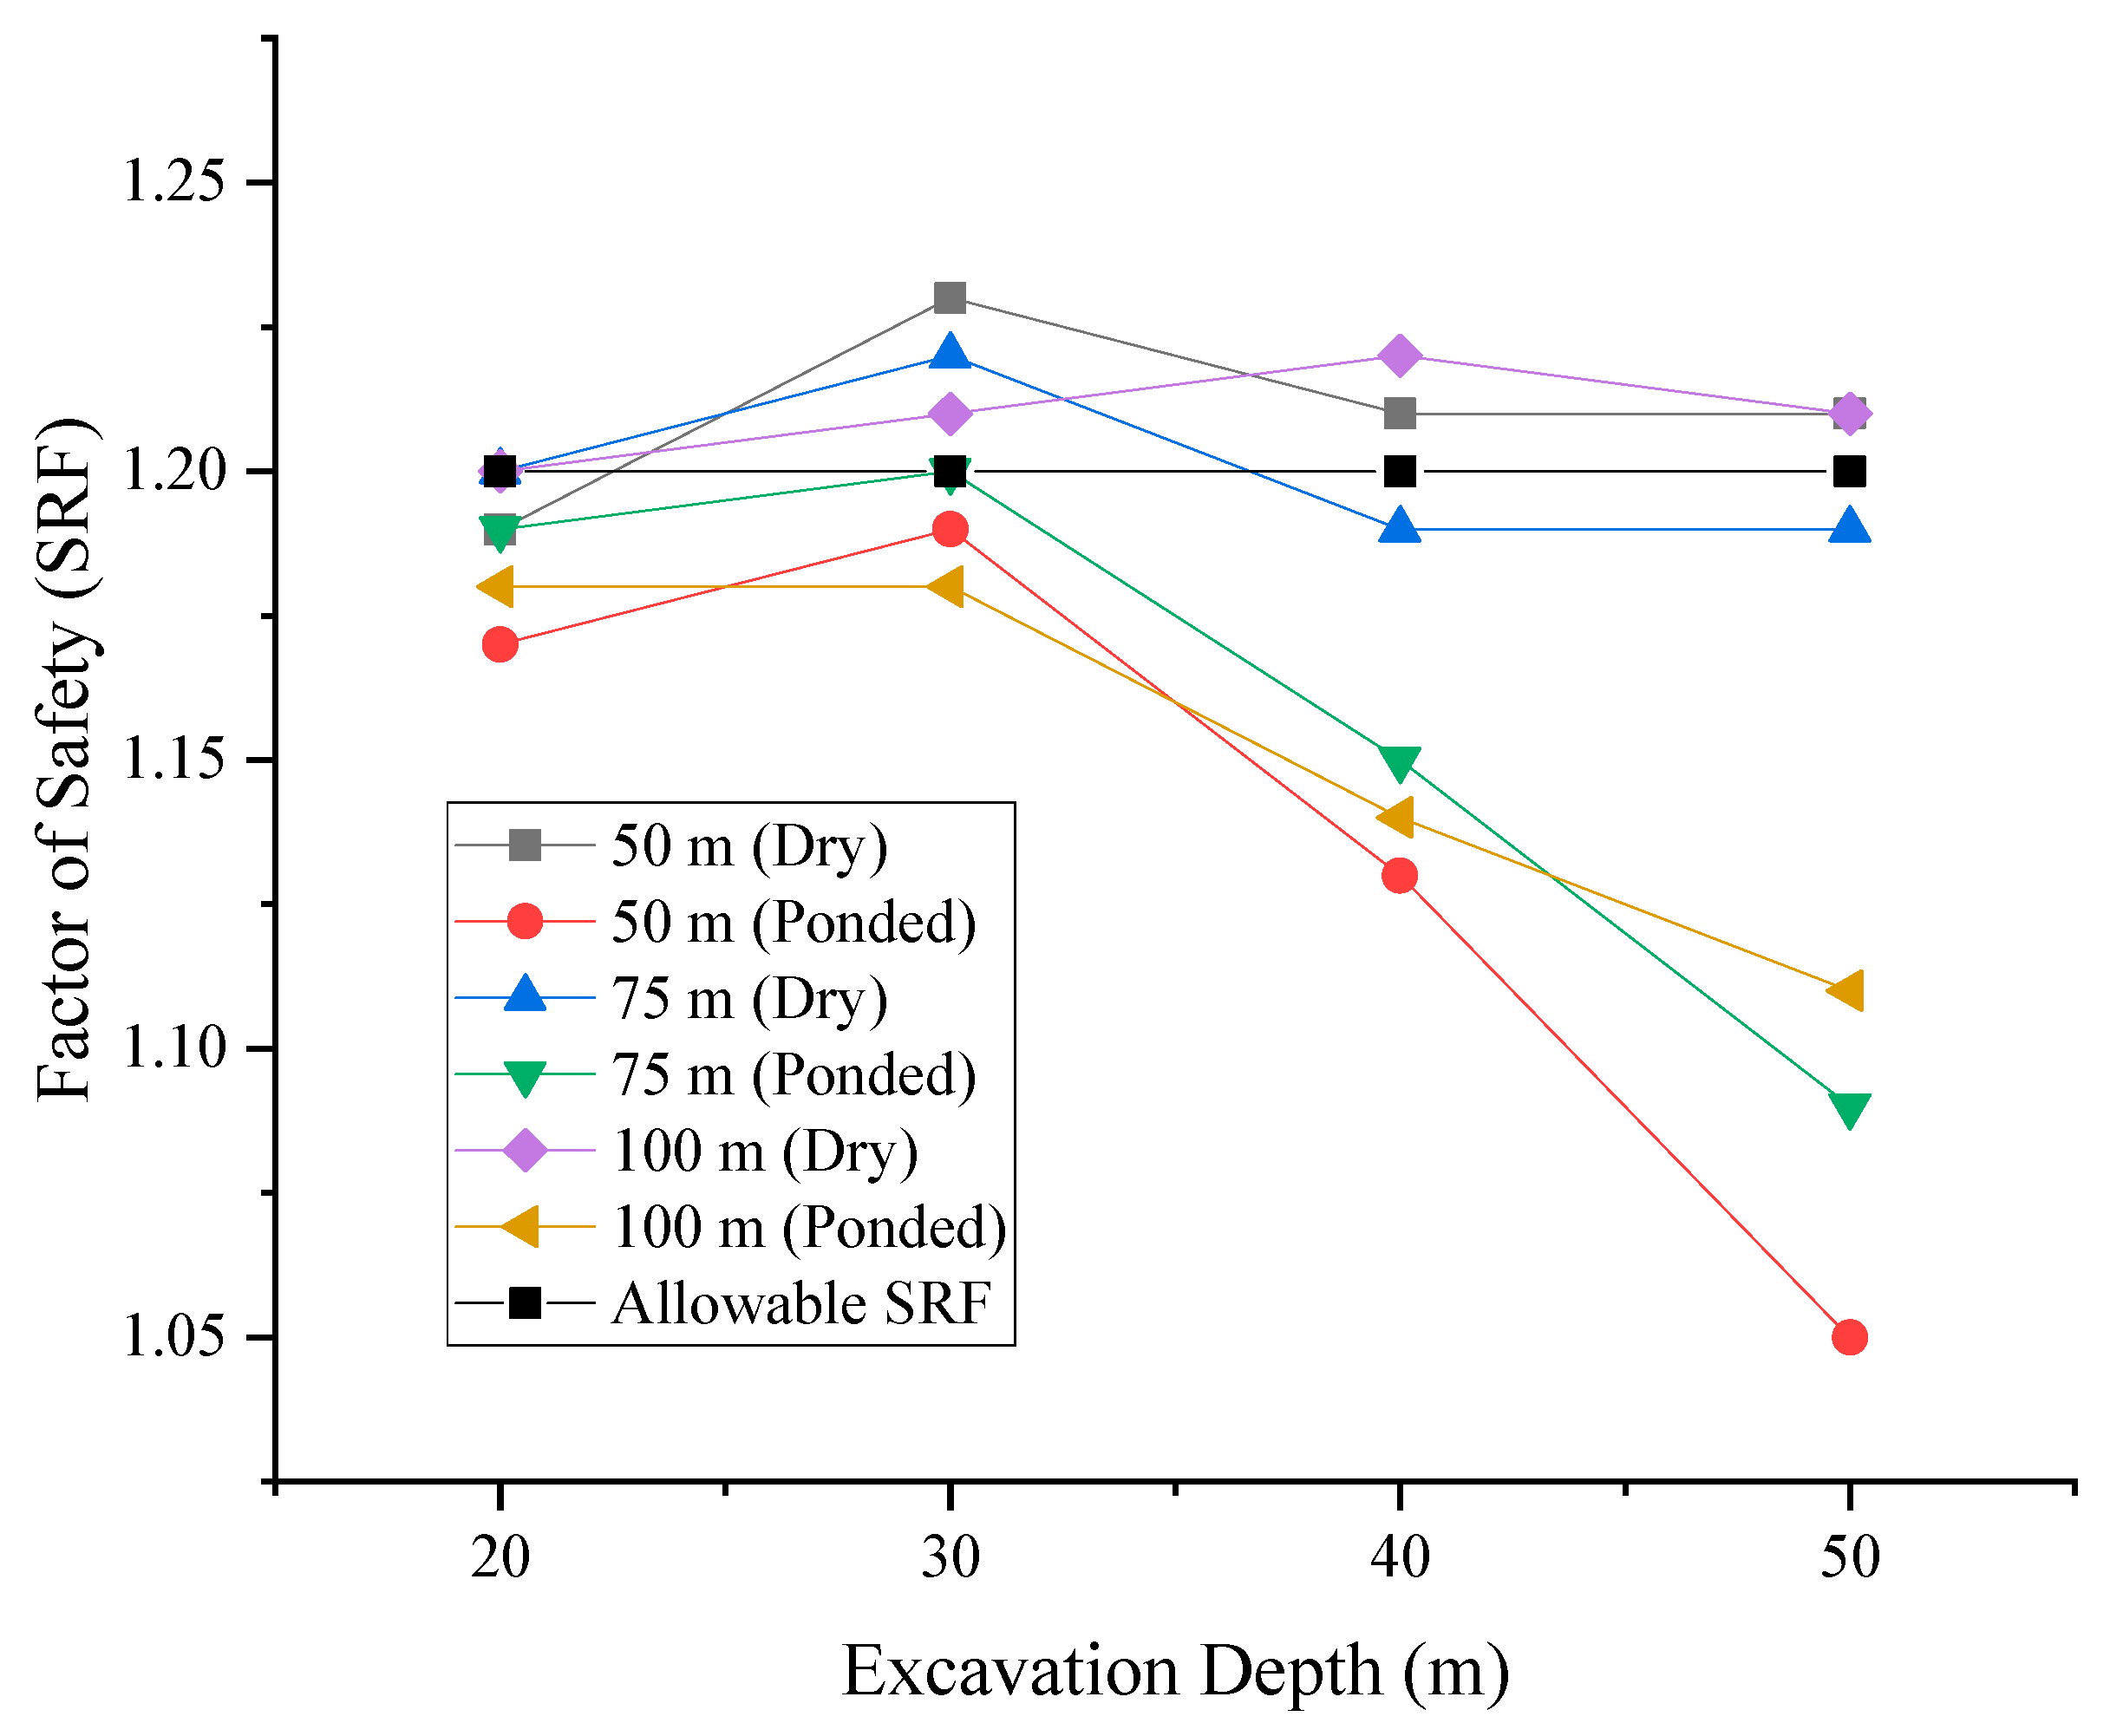
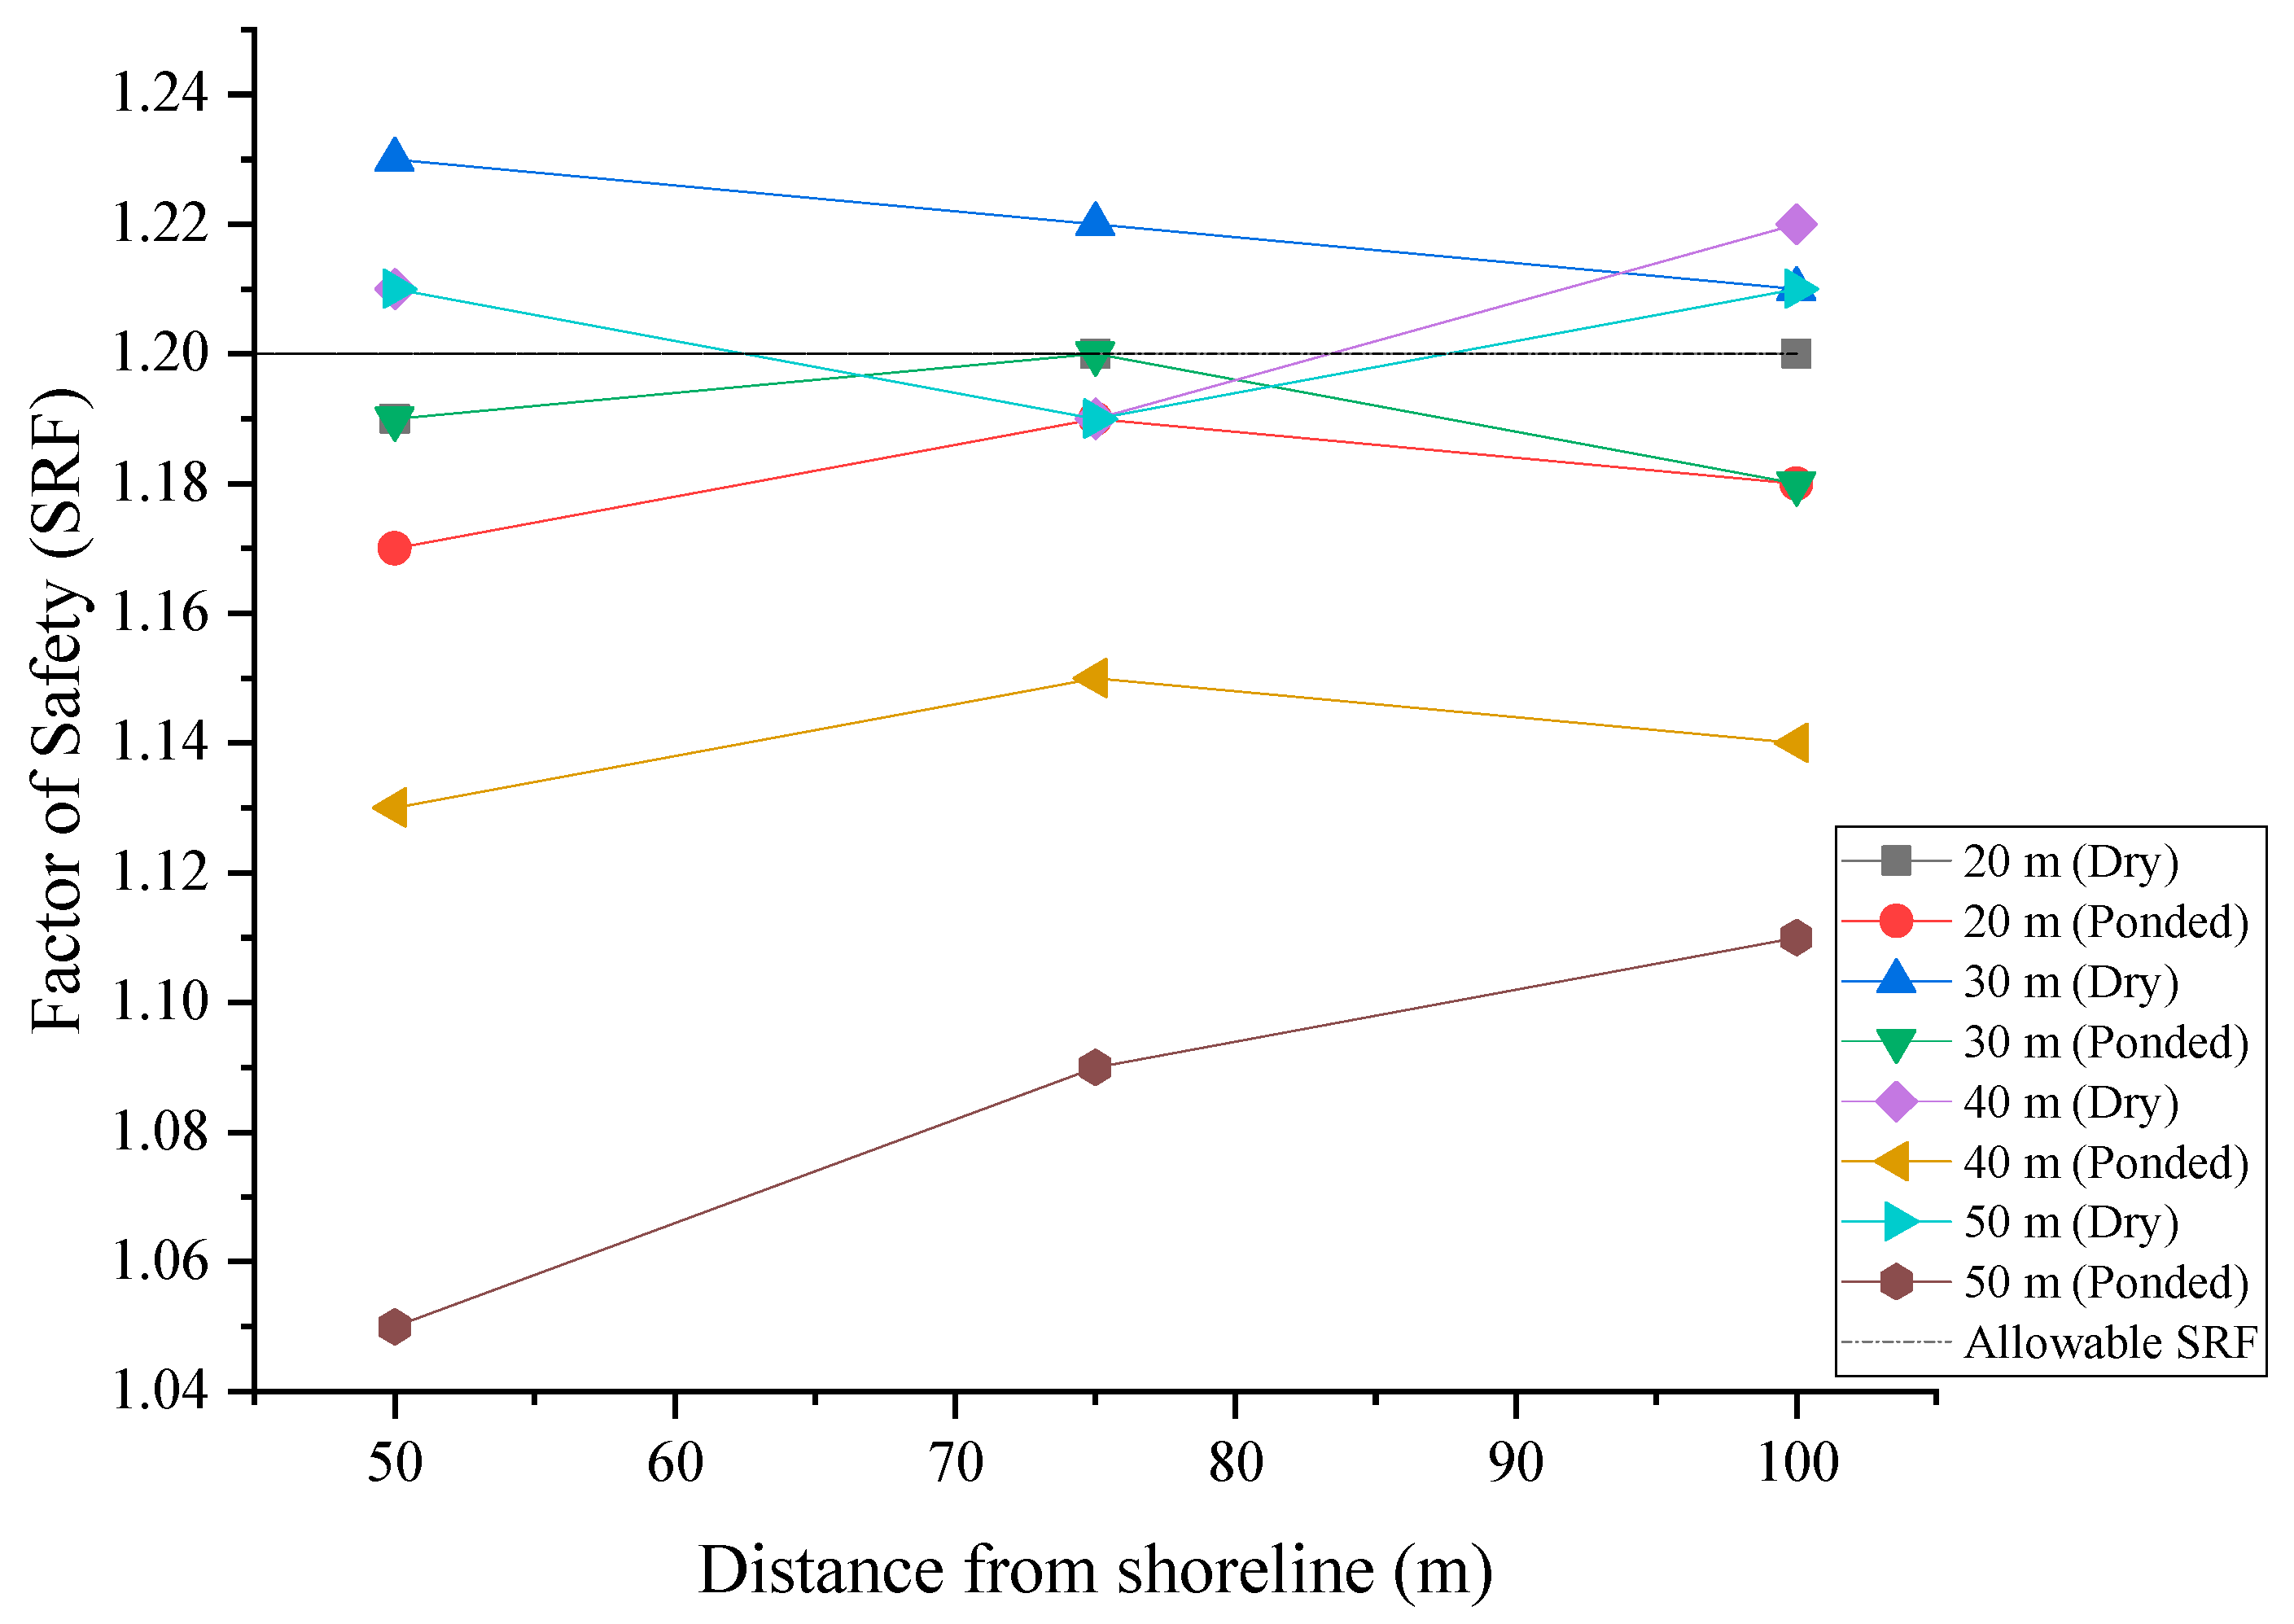
Laboratory experiments on this rock mass previously done by Joan et al. [3] indicated a general reduction in strength when the rock is saturated. Water seepage leads to strength reduction in weak rocks because an increase in pore pressure leads to subsequent decrease in the shear strength. On this basis, it is imperative to analyze the behavior of the rock slopes under the influence of ocean-water seepage occasioned by the rising and falling tidal levels, which subject the slopes to changes in pore pressures. In Phase 2 software, the groundwater analysis module computes pore pressures, then the results are automatically used for stress analysis. Due to the high porosity and high permeability of the rock mass, a fully drained uncoupled analysis was done. A parametric analysis was conducted to analyze the stability for varied excavation depths and distances from the shoreline. The results are summarized in Table 3, showing the difference in safety factor between a dry slope and the case where the slope is subjected to total head variations due to changes in tidal levels. It is clear that the presence of ocean water in close proximity to the quarry affects the stability of the slopes as a result of the tendency for water seepage to reduce the strength of rocks, hence subsequent reduction in the safety factor. The images in Figure 12, Figure 13 and Figure 14 show the nephograms of variations in slope safety factor and shear strain due to changes in pore pressure occasioned by changes in ocean tides. The data in Table 3 were used to plot the graphs in Figure 15 and Figure 16 in order to analyze the variation in slope safety factor with distance from shoreline and excavation depths, respectively.
Table 3.
Variation of slope safety factor due to seepage.
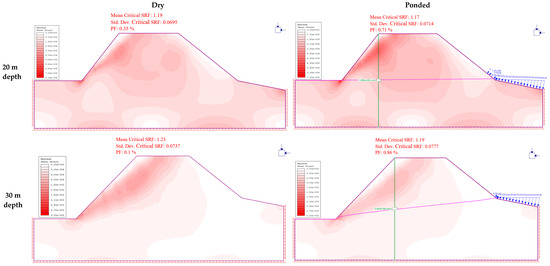
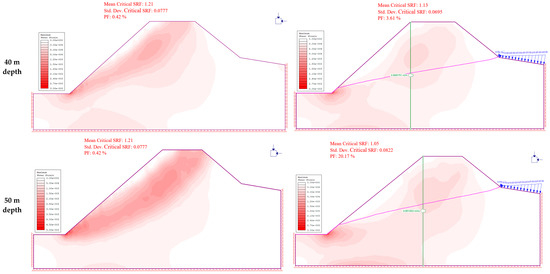
Figure 12.
Changes in slope safety factor at 50 m from the shoreline.

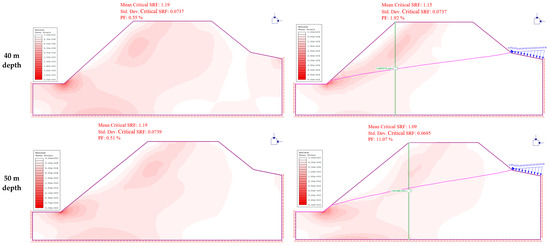
Figure 13.
Changes in slope safety factor at 75 m from the shoreline.

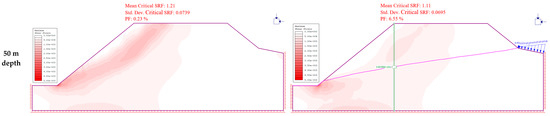
Figure 14.
Changes in slope safety factor at 100 m from the shoreline.
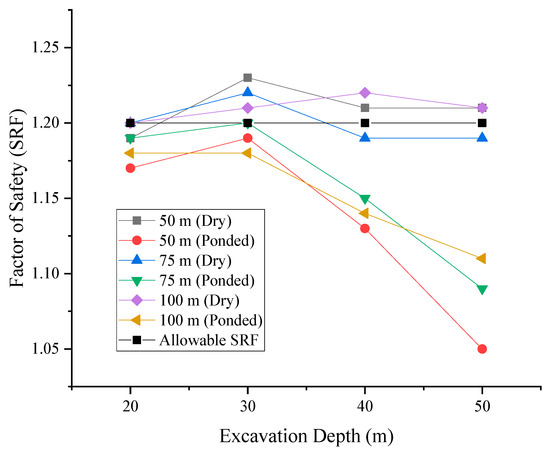
Figure 15.
Variation in safety factor with excavation depth.
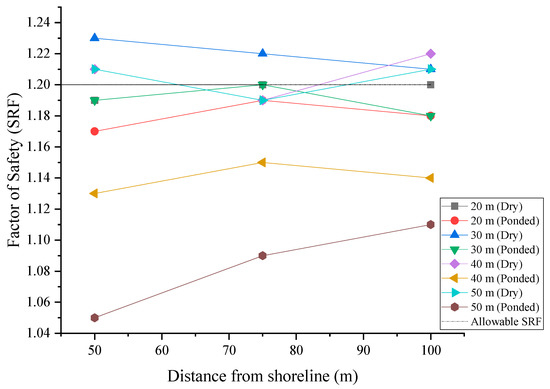
Figure 16.
Variation in safety factor with distance from shoreline.
The graph in Figure 15 shows the trend of variation of the safety factor with excavation depth. Under the influence of the adjacent ocean water, with the distance from the shoreline held constant, there is a trend of the safety factor increasing with increasing excavation depth from 20 m to 30 m, probably due to the stabilizing effects of the hydrostatic pressure. Beyond 30 m, however, the safety factor decreases sharply as the excavation depth increases. This can be attributed to the reduction in effective stress due to a larger portion of the slope being under positive pore pressures. In Figure 16, the trend is clearly that of the safety factor increasing with increasing distance of the excavation face from the shoreline, due to a decrease in the intensity of the pore pressure away from the shoreline. The simulated seepage also shows the trend of seepage velocity increasing with increasing excavation depth and decreasing with increasing distance of slope face from the shoreline, further explaining the declining safety factor with excavation depth.
5. Discussion
The rock mass under study is classified as weak based on ISRM standards. The stability of slopes in this rock mass is therefore largely dependent on the rock mass strength. Slopes engineered on weak rock need to have the overall safe slope angle determined first, followed by the other slope design parameters [4]. In Vipingo quarry, mining is done with steep near-vertical slopes, where instabilities have been recorded in the past, even with shallow excavation. It is therefore imperative to determine the optimum overall slope angle to ensure safe operations, even as the excavation advances to greater depth. Based on rock strength of 20 on GSI scale, it was determined that the safe overall slope angle (allowable safety factor of 1.2) at 50 m from the shoreline is 52° for 20 m excavation depth, 46° for 30 m depth, 42° for 40 m depth, and 39° for 50 m depth for dry slopes. The slope angles were the same even for slope face at 75 m and 100 m from the shoreline.
The analysis also incorporated the probability of failure analysis. The graph of safety factor and probability of failure against slope angle in Figure 8 shows that the probability of failure is high for steep slope angles above 60°, after which it significantly reduces when the safety factor is ≥1. In the discussion on slope stability-acceptance criteria for open cast mine design, Adams [29] and Tapia et al. [30] outline the various acceptable failure probabilities as dependent on the slope scale (either bench, inter-ramp, or overall slope) and level of severity of the consequences of failure (low, medium, or high). The allowable probability of failure (PF) in this study is ≤10%. All optimized slope angles meet the criteria for allowable probability of failure, being less than 10%. With the optimum slope angles achieved for various depths, the nephograms of shear strain show a significant reduction in strains at the slope toe. The stable slopes have shear planes lying deep within the slope along non-circular failure surfaces through the slope toe. As the excavation depth increases, the strains on the slope toe generally increase, and this can be attributed to the overlying weight of the slope. A combination of the two parameters, i.e., safety factor and probability of failure, thus, gives a robust design judgment.
The daily rising and falling of semidiurnal tides of the Indian Ocean with a head difference of 2.25 m creates a drawdown effect on the adjacent quarry slopes. At 20 m and 30 m excavation depths, there is no significant variation in pore pressure with distance from shoreline. As the excavation depth increases beyond 30 m, there is substantial decrease in pore pressure with increasing distance from the shoreline. At any given distance from the shoreline, the discharge velocity towards the slope face increases with increasing depth of excavation and decreases with increasing distance from the shoreline. In consequence, the pore pressures in the slope increase with increasing excavation depth and decrease with the excavation face getting further from the shoreline. Positive pore pressures develop in the slope at high tide for shallow excavations and as the excavation gets deeper, positive pore pressures continue to build up in the slope as the phreatic surface rises in the slope. Positive pore pressures contribute to compromising the stability condition of slopes due to the consequent decrease in effective stress, which leads to changes in rock mass strength [31,32].
Generally, the slope safety factor is reduced as a result of the shear strength reduction effects of increasing pore pressure in the slope. A computation of the percentage change in slope safety factor due to ocean water seepage is given in Table 3. The percentage decrease in safety factor due to seepage increases with increasing excavation depth. The distribution of shear strains in the slope due to seepage is also noteworthy in that a potential circular slip surface is observed in all the analyses. A notable difference, however, exists in the depth of the slip surface from the slope face. In dry conditions, the slip surfaces are shallower and close to the slope face. However, with the pore pressure added to the analysis, the shear planes are deeper in the slope with shear strains concentrated on the toe of the slope. This isan indication of significant reduction in shear strength of the rock mass due to seepage, and the increased shear strain at the slope toe is because of the slope toe being a seepage face experiencing the highest pore pressures. This is observed irrespective of the distance of the excavation face from the shoreline. Similar observations of reduction in slope safety factor due to pore pressure changes have been observed in the analysis of Chengmenshan copper mine by Fan et al. [9]. Other researchers investigating pore pressure variations in rock slopes, such as Saada et al. [33] and Preisig et al. [34], also made similar observations. The variations in shear strain patterns depicting the critical slip surfaces are also corroborated by results reported in the analysis by Wu et al. [35].
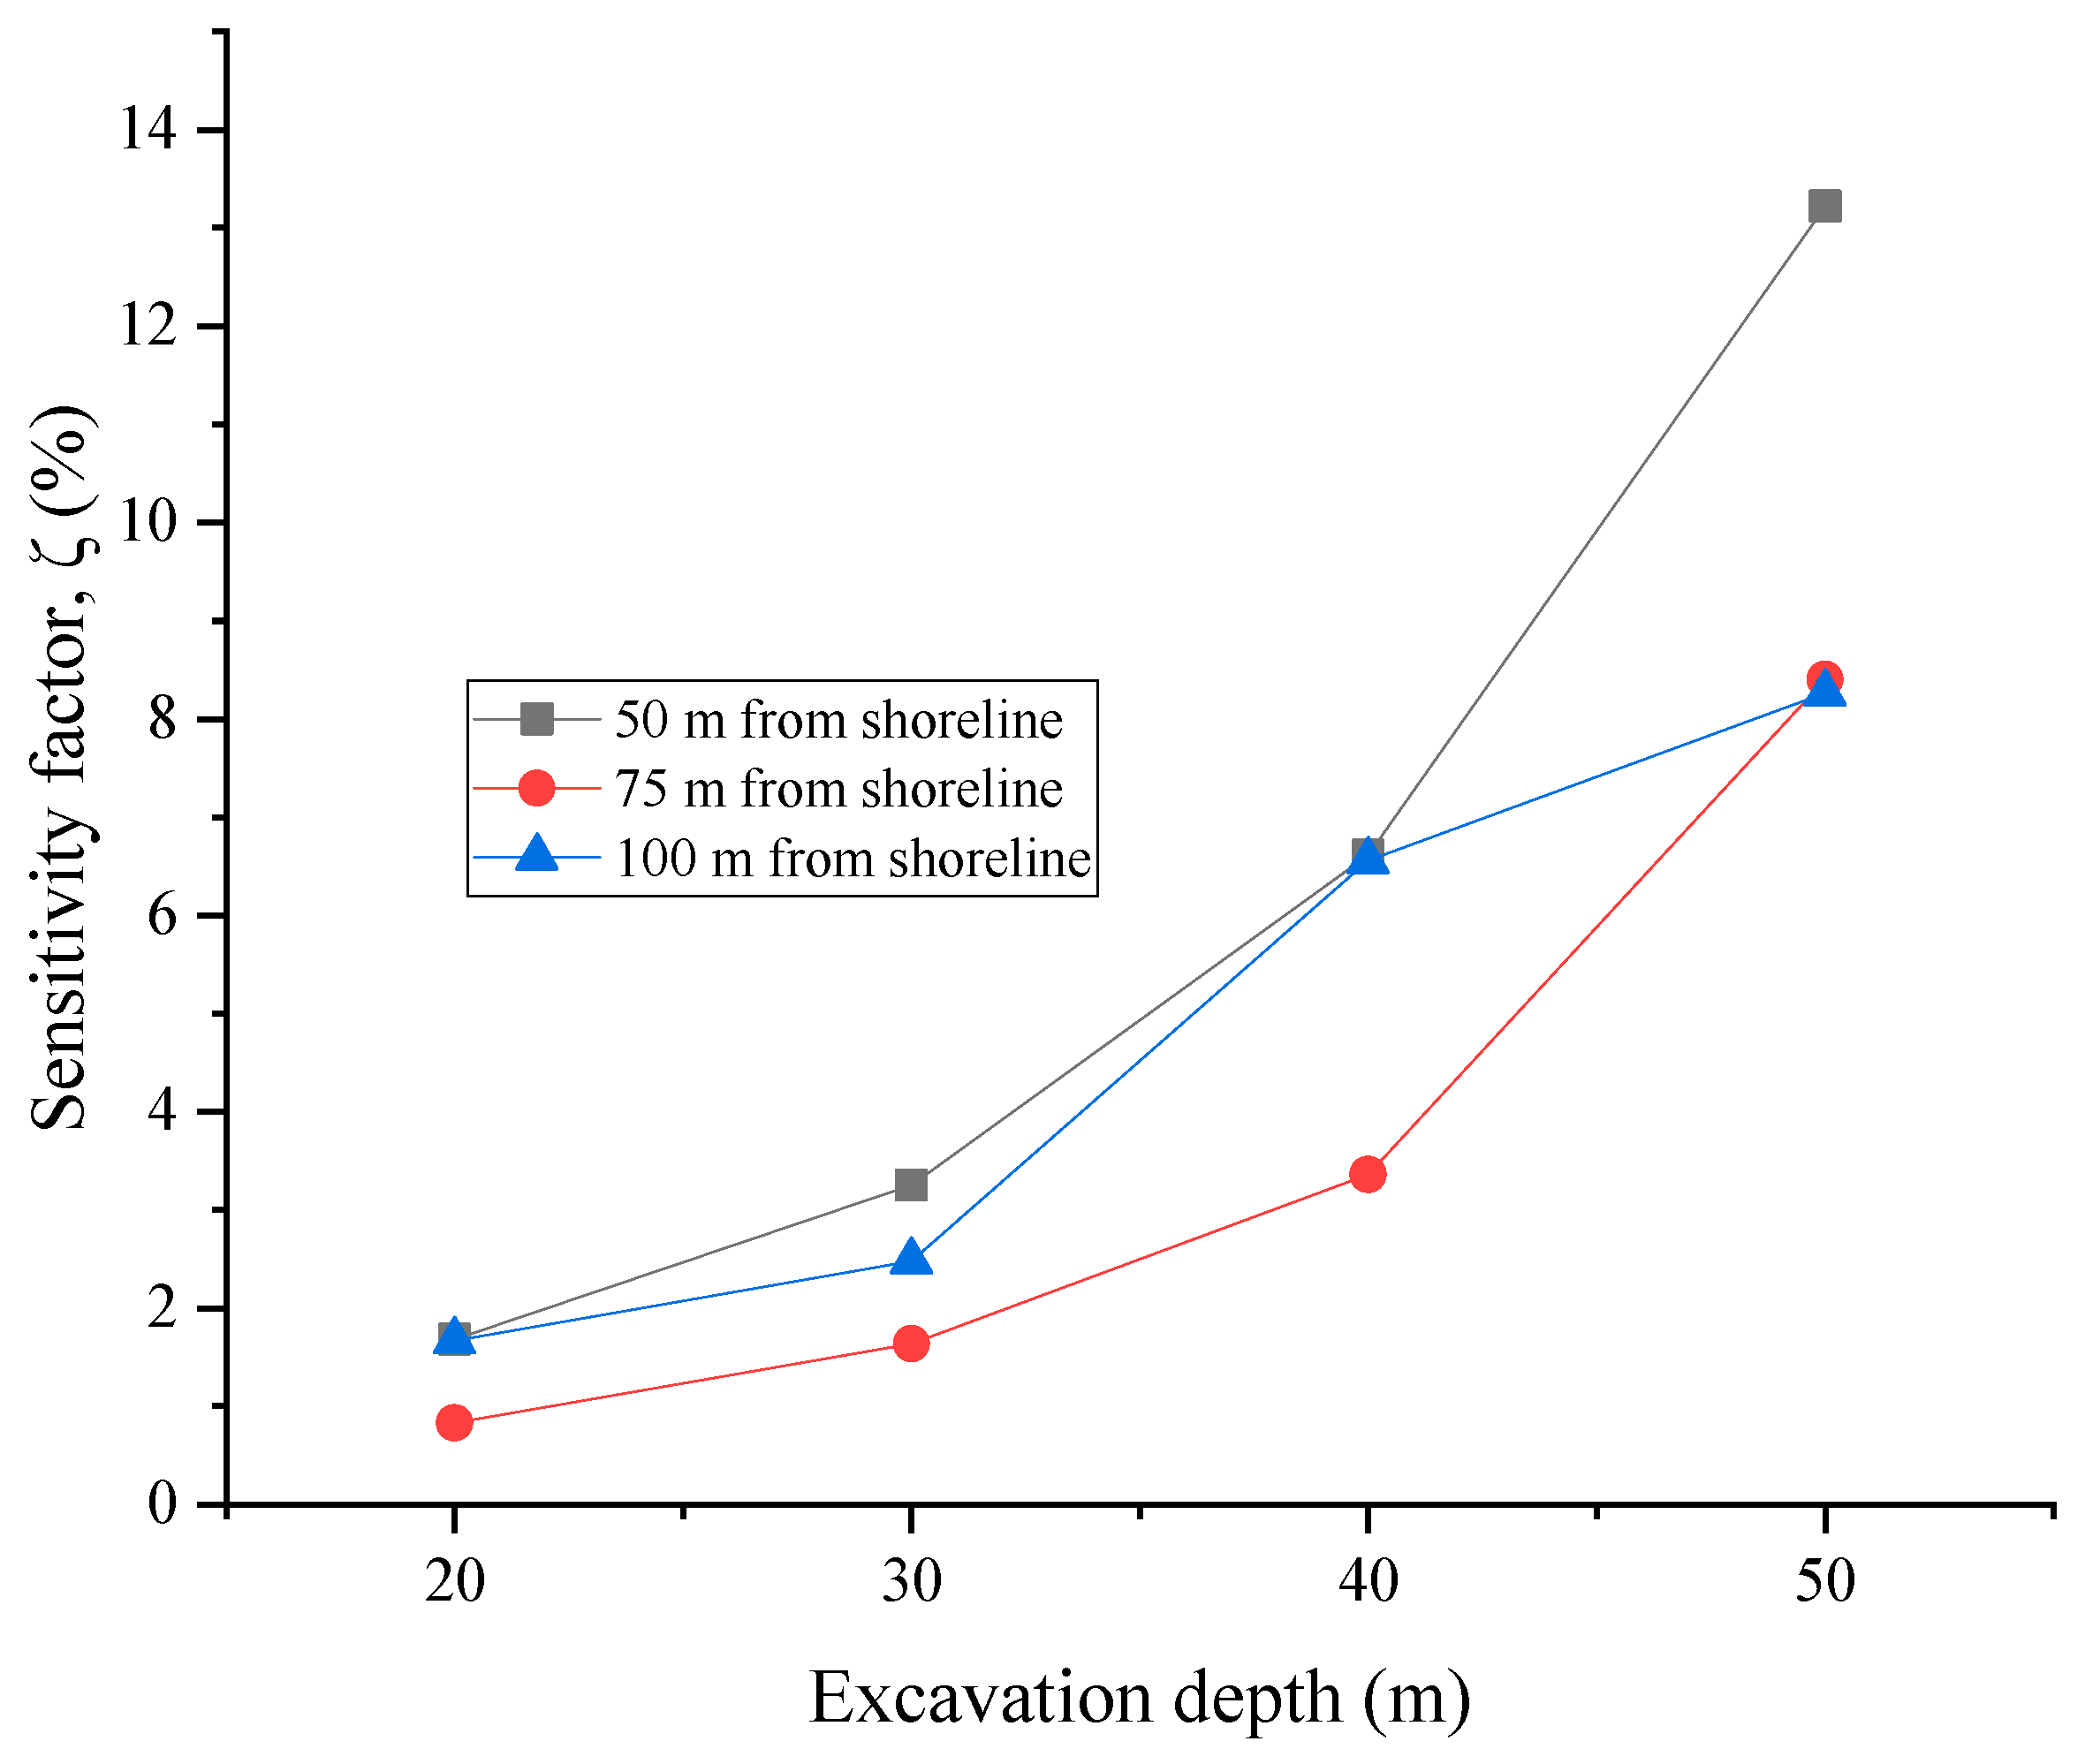
The reduction in slope safety factor due to pore pressure in the slopes leads to the introduction of a measure of slope sensitivity to ocean-water seepage, the sensitivity factor (ζ), which represents the percentage change in slope safety factor due to seepage. The slope sensitivity is expressed as:
where is the safety factor of the dry slope and is the reduced safety factor of the slope due to ponding effect of ocean water. is the slope sensitivity factor.
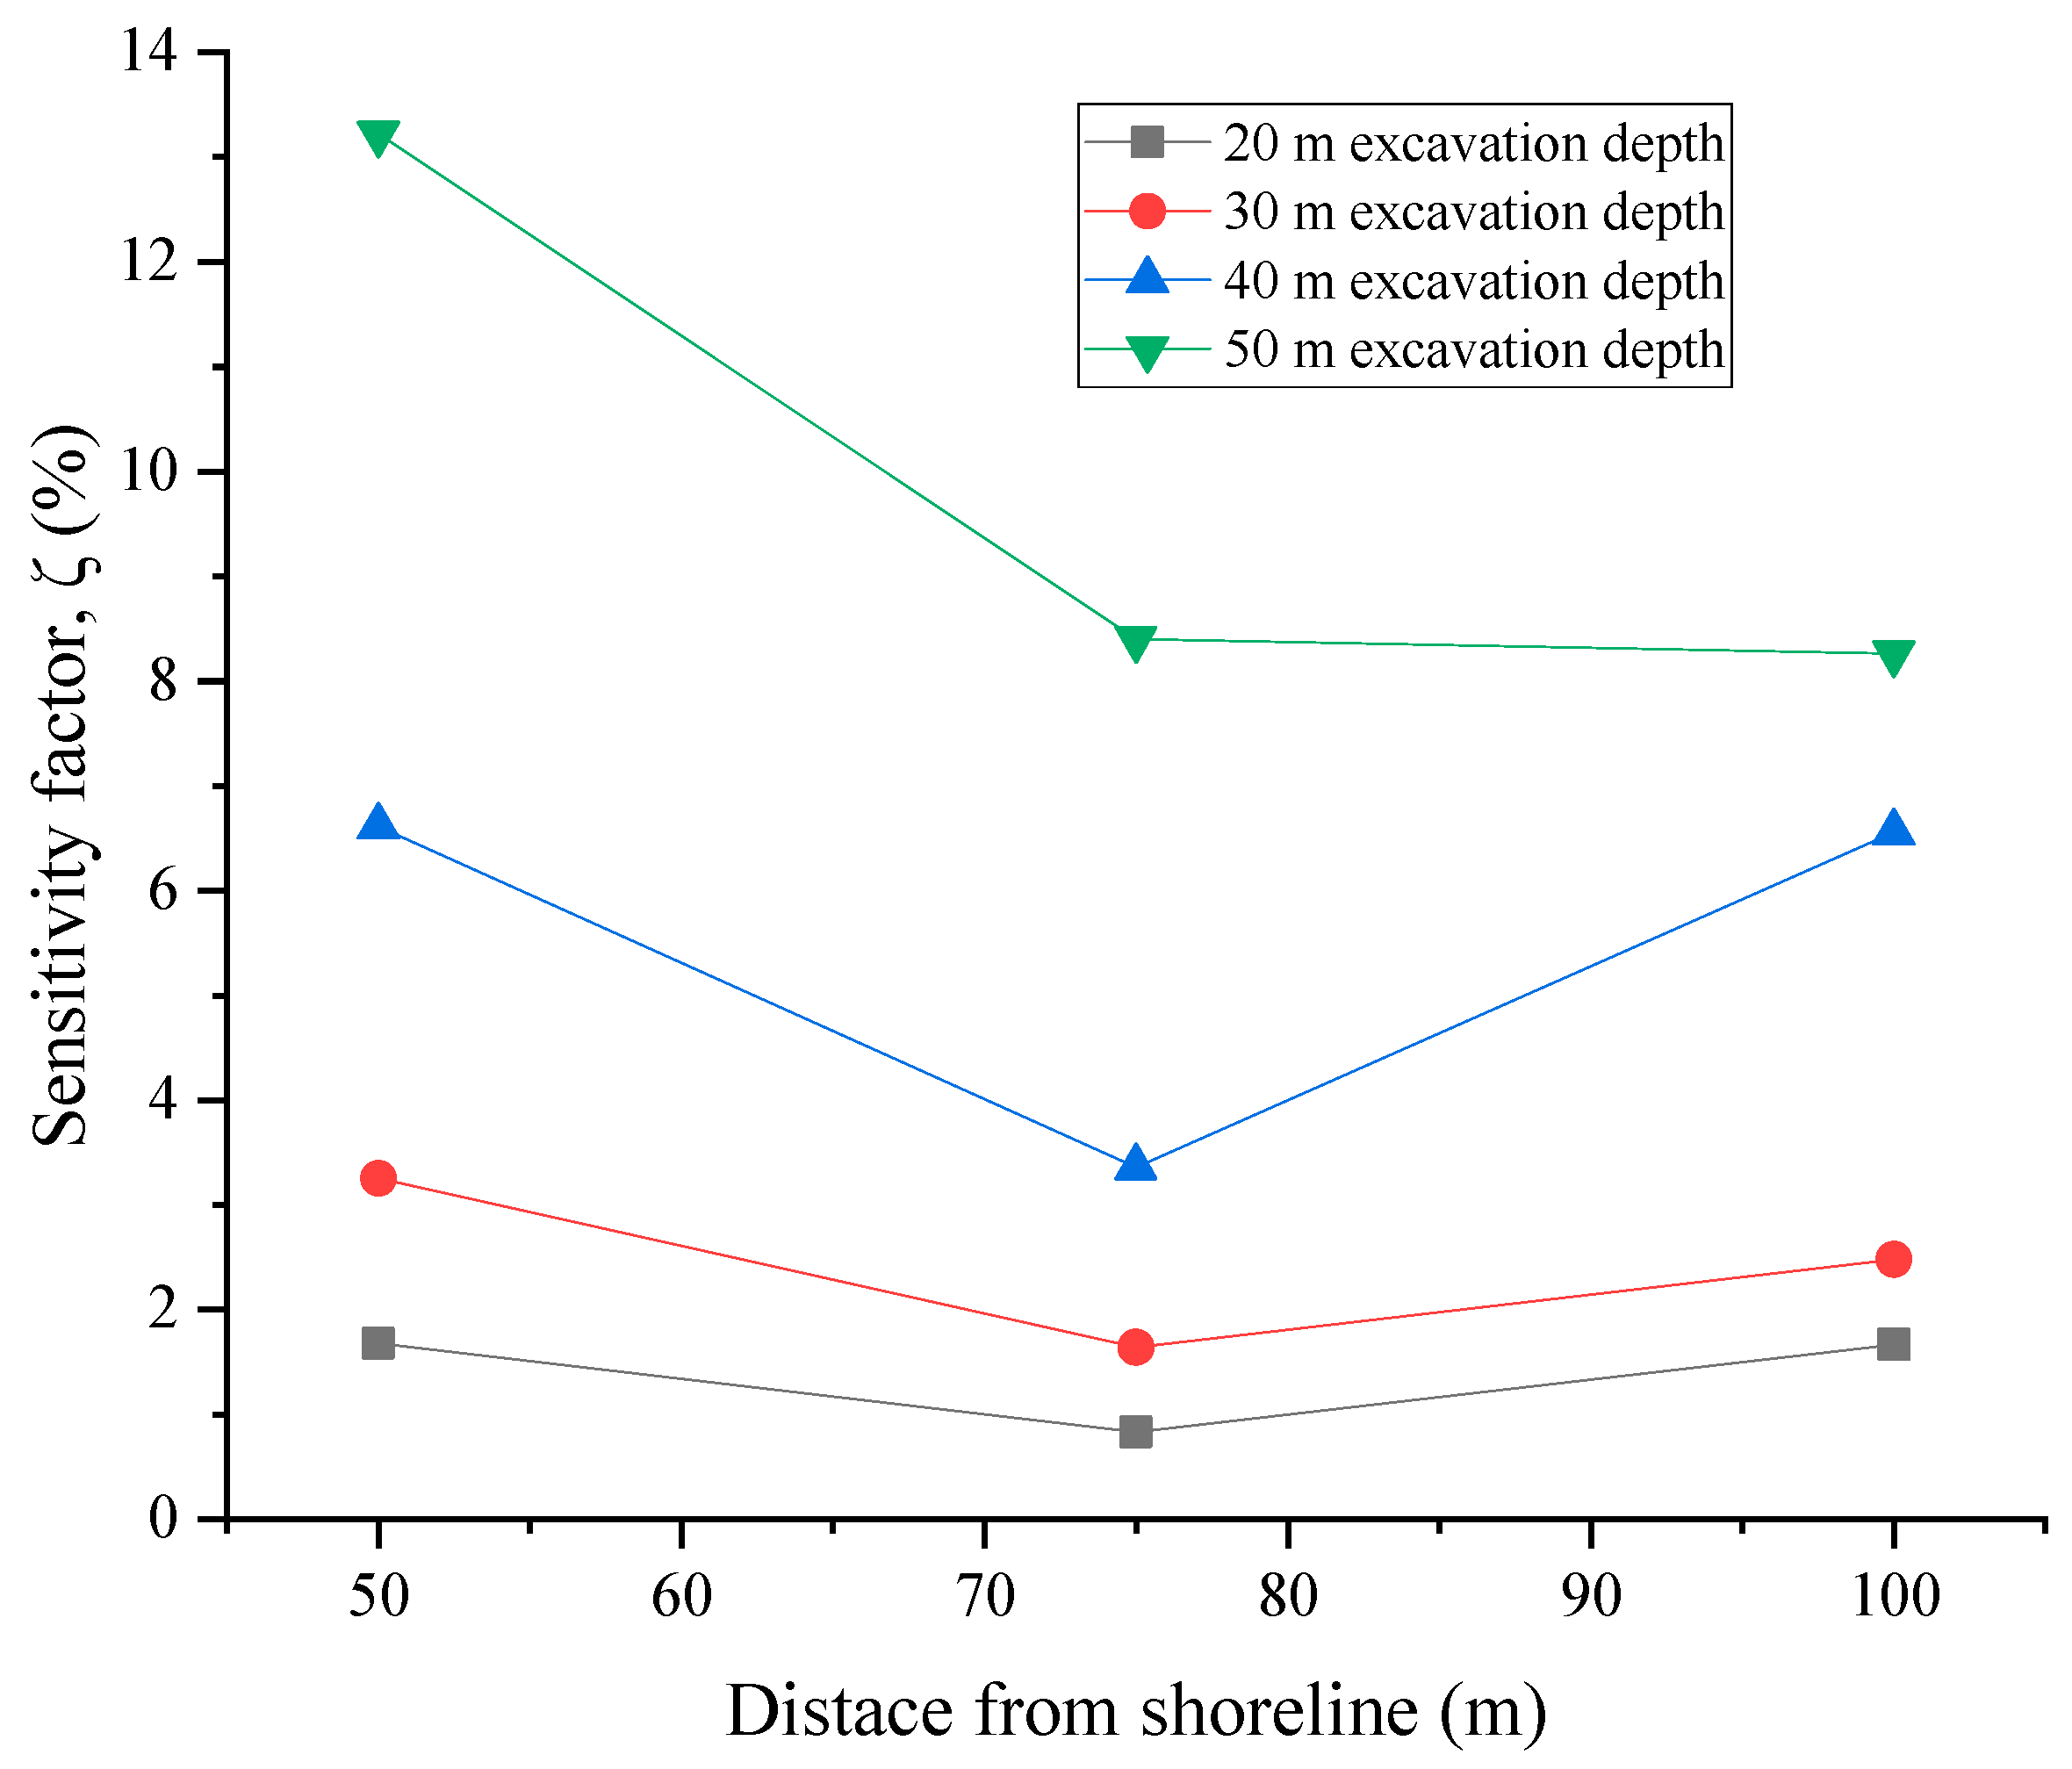
Graphical representations of sensitivity of the slope to seepage forces are given in Figure 17 and Figure 18 based on the data on Table 3. The sensitivity of the slope safety factor to ocean water seepage increases with excavation depth. On the other hand, the slope sensitivity to seepage decreases with increasing distance of excavation face from the shoreline. Clearly, the sensitivity of the slope to seepage of the adjacent ocean waters depends on both the excavation depth and distance of the slope face from the shoreline. From the analysis of the effects of ocean tides, it is evident that slope design in this condition has to take into consideration the slope sensitivity to seepage effects. The design safety factor should therefore be above the allowable safety factor of 1.2 by an amount equal to the sensitivity factor. Equation (6) can therefore be rewritten to give the design safety factor for dry slope that will give a factor of 1.2 under seepage condition:
where is the design safety factor and is slope sensitivity factor.
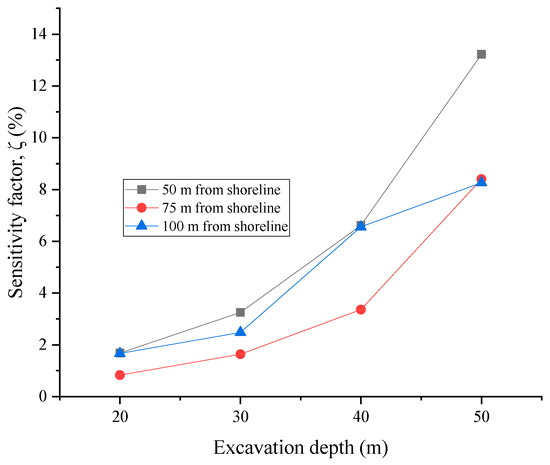
Figure 17.
Sensitivity factor vs. excavation depth.
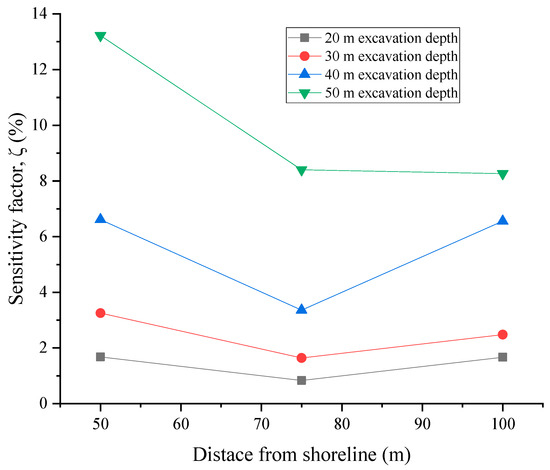
Figure 18.
Sensitivity factor vs. distance from shoreline.
The analysis in this study considered the rock slope strength condition at a GSI value of 20. The slope sensitivity factors from Figure 17 and Figure 18 can therefore be used in Equation (7) to determine the appropriate overall slope design parameters for the rock mass.
Progression of the excavation below sea level makes the quarry a sink for ocean-water intrusion, as seen by the orientation of the phreatic surface in pore pressure computations, which agrees with field observations of water seeping into the quarry floor during high tides. The carbonate rock mass is also prone to karstification, and so water seepage is an enemy to the stability of slopes in this rock mass. It is therefore crucial to protect the slope toe from erosion. The hydrogeology of the area is such that the natural drainage of surface waters is into the ocean. The slope toe can be protected by constructing drainage ditches to collect the water at the slope toe and enhancing drainage into the ocean by creating water systems to minimize erosion of the slope toe. The mined-out slopes and slope toe should then be protected from subsequent erosion by water in the drainage ditches. Drainage ditches constructed in such a porous rock mass with high hydraulic conductivity need further controls in place to handle the flow of water. Vegetation such as vetiver grass also has the ability to hold water by its thick foliage, thereby reducing the flow velocity and enhancing downward seepage flow velocity and minimizing surface runoff that erodes slopes. In consequence, drainage of water from the slope towards the ocean is improved, leaving the slope face free of eroding effects of water. The thick plant roots would also improve cohesion on the surface layers, thus minimizing further erosion.
6. Conclusions
Stability of the quarry slopes has been assessed in both dry conditions and under the action of ocean tides by finite element analysis. The slope sensitivity to the changing tidal levels has also been evaluated for both varying excavation depths and distance from the shoreline. Shallow slopes up to 20 m depth do not seem to be much affected by the tides when the excavation is above the water table. A slope sensitivity factor (ζ) is introduced to represent the percentage change in slope safety factor due to seepage. The slope sensitivity to seepage increases with increasing excavation depth and closer proximity to the shoreline. The slope design in this condition therefore considers both the excavation depth and distance of slope face from the shoreline as crucial parameters. The appropriate distance of the slope face from the shoreline depends on the target excavation depth: shallower pits can be closer to the shoreline. Hence, the deeper the final pit, the further the slope face should be from the ocean. An equation is given that uses the parameter of sensitivity factor to guide the decision on the design safety factor that will give the allowable safety factor of 1.2 under the strength degradation of seepage condition. The probabilistic analysis combined with the safety factor also give a robust design judgment. The graphs of the slope sensitivity factor are a good guide for determining the slope sensitivity factor to use in a design for the rock mass condition under study.
Author Contributions
Conceptualization and methodology were done by J.A.O., D.M. and J.A.O. wrote the manuscript text. T.S. and H.S. were responsible for supervision and funding for the research work. A.H. was in charge of study materials and computing resources. All authors have read and agreed to the published version of the manuscript.
Funding
The research work is part of a doctoral program supported by JICA.
Institutional Review Board Statement
Not applicable.
Informed Consent Statement
Not applicable.
Data Availability Statement
All data generated or analyzed during this study are included in this published article.
Acknowledgments
Sincere gratitude to JICA for scholarship funding that has facilitated this research work. The contribution of Vipingo quarry in availing the information and data that enabled the conceptualization of this research work is sincerely appreciated.
Conflicts of Interest
The authors declare that there are no conflict of interests regarding the publication of this paper.
References
- Hashiba, K.; Fukui, K.; Kataoka, M. Effects of water saturation on the strength and loading-rate dependence of andesite. Int. J. Rock Mech. Min. Sci. 2019, 117, 142–149. [Google Scholar] [CrossRef]
- Hamzaban, M.T.; Büyüksağiş, I.S.; Manafi, M.; Touranchehzadeh, A. The effect of saturation on the physical and mechanical behavior of some rock samples. Civ. Eng. Beyond Limits 2021, 3, 23–31. [Google Scholar] [CrossRef]
- Onyango, J.A.; Mwanzia, D.K.; Moses, D.; Oo, C.T.; Batsaikhan, U.; Phaisopha, S.; Krop, I.T. Laboratory Investigation of the Physico-Mechanical Properties of Coral Limestone of Vipingo Area in Kenya’s Coastal Region. Int. Res. J. Innov. Eng. Technol. 2022, 6, 42–53. [Google Scholar] [CrossRef]
- Martin, D.; Stacey, P. Guidelines for Open Pit Slope Design in Weak Rocks; CRC Press Taylor & Francis Group: New York, NY, USA, 2018. [Google Scholar]
- Chen, H.; Zhiye, Z.; Jianping, S. Coupled hydro-mechanical model for fractured rock masses using the discontinuous deformation analysis. Tunn. Undergr. Space Technol. 2013, 38, 506–516. [Google Scholar] [CrossRef]
- Rutqvist, J.; Ove, S. The role of hydromechanical coupling in fractured rock engineering. Hydrogeol. J. 2003, 11, 7–40. [Google Scholar] [CrossRef]
- Reddi, L.N. Seepage in Soils: Principles and Applications; John Wiley & Sons: Hoboken, NJ, USA, 2003. [Google Scholar]
- Iverson, R.M.; Reid, M.E. Gravity-driven groundwater flow and slope failure potential: 1. Elastic Effective-Stress Model. Water Resour. Res. 1992, 28, 925–938. [Google Scholar] [CrossRef]
- Fan, W.; Cao, P.; Zhang, K.; Li, K.; Chen, C. Stability Assessment and Optimization Design of Lakeside Open-Pit Slope considering Fluid-Solid Coupling Effect. Math. Probl. Eng. 2015, 2015, 691826. [Google Scholar] [CrossRef]
- Moosavi, E.; Shirinabadi, R.; Gholinejad, M. Prediction of seepage water pressure for slope stability at the Gol-E-Gohar open pit mine. J. Min. Sci. 2016, 52, 1069–1079. [Google Scholar] [CrossRef]
- de Agreda, E.A.P.; Puigmartí, N.M.P. Slope Stability under Rapid Drawdown Conditions. In Proceedings of the First Italian Workshop on Landslides, Naples, Italy, 8 June 2009; pp. 11–27. [Google Scholar]
- Wong, T.F.; Szeto, H.; Zhang, J. Effect of Loading Path and Porosity on the Failure Mode of Porous Rocks. Appl. Mech. Rev. 1992, 45, 281–293. [Google Scholar] [CrossRef]
- Acharya, K.P.; Netra, P.B.; Ranjan, K.D.; Ryuichi, Y. Seepage and slope stability modelling of rainfall-induced slope failures in topographic hollows. Geomat. Nat. Hazards Risk 2016, 7, 721–746. [Google Scholar] [CrossRef]
- Rocscience. Groundwater Seepage. 2021. Available online: https://www.rocscience.com/help/rs2/tutorials/groundwater-seepage/coupled-drawdown-analysis (accessed on 7 March 2022).
- Narasimhan, T.; Witherspoon, P. An integrated finite difference method for analyzing fluid flow in porous media. Water Resour. Res. 1976, 12, 57–64. [Google Scholar] [CrossRef]
- Koyama, T.; Nishiyama, S.; Yang, M.; Ohnishi, Y. Modeling the interaction between fluid flow and particle movement with discontinuous deformation analysis (DDA) method. Int. J. Numer. Anal. Methods Geomech. 2011, 35, 1–20. [Google Scholar] [CrossRef]
- Tracy, F.T.; Brandon, T.L.; Corcoran, M.K. Transient Seepage Analyses in Levee Engineering Practice; U.S. Army Corps of Engineers: Washington, DC, USA, 2016. [Google Scholar]
- Pauls, G.J.; Sauer, E.K.; Christiansen, E.A.; Widger, R.A. A transient analysis of slope stability following drawdown after flooding of a highly plastic clay. Can. Geotech. J. 1999, 36, 1151–1171. [Google Scholar] [CrossRef]
- Freeze, A.R.; Cherry, J.A. Groundwater; Prentice Hall: Hoboken, NJ, USA, 1979. [Google Scholar]
- Cen, W.; Li, D.; Wang, H. Impact of transient seepage on slope stability of earth-rock dams with geomembrane barrier defects. Environ. Geotech. 2019, 7, 581–590. [Google Scholar] [CrossRef]
- Song, D.; Ailan, C.; Zhu, C.; Xiurun, G. Seismic stability of a rock slope with discontinuities under rapid water drawdown and earthquakes in large-scale shaking table tests. Eng. Geol. 2018, 245, 153–168. [Google Scholar] [CrossRef]
- State of Oregon. Oregon Territorial Sea Plan; Department of Land Conservation and Development: Salem, OR, USA, 1994. [Google Scholar]
- Tides4Fishing. Tides and Lunar Charts-Kilifi. 17 12 2021. Available online: https://tides4fishing.com/af/kenya/kilifi (accessed on 16 March 2022).
- Balmer, G. A general analytical solution for. Am. Soc. Test. Mater. 1952, 52, 1260–1271. [Google Scholar]
- Hammah, R.E.; Yacoub, T.E.; Corkum, B.C.; Curran, J.H. The Shear Strength Reduction Method for the Generalized Hoek-Brown Criterion. In Proceedings of the 40th US Symposium on Rock Mechanics (USRMS), Anchorage, AK, USA, 25–29 June 2005. [Google Scholar]
- Rocscience. RocScience. 2021. Available online: https://www.rocscience.com/help/rs2/documentation/rs2-model/project-settings/general/general-settings (accessed on 5 March 2022).
- Onyango, J.A.; Sasaoka, T.; Shimada, H.; Hamanaka, A.; Moses, D.; Tumelo, D. Evaluating Rock Mass Properties of Vipingo Coral Limestone Quarry Based on a Modified Geological Strength Index (GSI) and State of Karstification. Open J. Geol. 2022, 12, 57–79. [Google Scholar] [CrossRef]
- Jones, I.C.; Jay, L.B. Hydrogeologic and climatic influences on spatial and interannual variation of recharge to a tropical karst island aquifer. Water Resour. Res. 2003, 39, 1253. [Google Scholar] [CrossRef]
- Adams, B.M. Slope Stability Acceptance Criteria for Opencast Mine Design. In Proceedings of the 12th Australia New Zealand Conference on Geomechanics, Wellington, New Zealand, 22–25 February 2015. [Google Scholar]
- Tapia, A.; Contreras, L.F.; Jefferies, M.; Steffen, O. Risk Evaluation of Slope Failure at the Chuquicamata Mine. In Proceedings of the 2007 International Symposium on Rock Slope Stability, Perth, Australia, 12–14 September 2007. [Google Scholar]
- Rinaldi, M.; Casagli, N.; Dapporto, S.; Gargini, A. Monitoring and modelling of pore water pressure changes and riverbank stability during flow events. Earth Surf. Processes Landf. 2004, 29, 237–254. [Google Scholar] [CrossRef]
- Abramson, L.W.; Thomas, L.S.; Sunil, S.; Boyce, M.G. Slope Stability and Stabilization Methods; John Wiley & Sons: Hoboken, NJ, USA, 2001. [Google Scholar]
- Saada, Z.; Maghous, S.; Garnier, D. Stability analysis of rock slopes subjected to seepage forces using the modified Hoek–Brown criterion. Int. J. Rock Mech. Min. Sci. 2012, 55, 45–54. [Google Scholar] [CrossRef]
- Preisig, G.; Eberhardt, E.; Smithyman, M. Hydromechanical Rock Mass Fatigue in Deep-Seated Landslides Accompanying Seasonal Variations in Pore Pressures. Rock Mech. Rock Eng. 2016, 49, 2333–2351. [Google Scholar] [CrossRef]
- Wu, D.; Wang, Y.; Zhang, F.; Qiu, Y. Influences of Pore-Water Pressure on Slope Stability considering Strength Nonlinearity. Adv. Civ. Eng. 2021, 2021, 8823899. [Google Scholar] [CrossRef]


Publisher’s Note: MDPI stays neutral with regard to jurisdictional claims in published maps and institutional affiliations. |
© 2022 by the authors. Licensee MDPI, Basel, Switzerland. This article is an open access article distributed under the terms and conditions of the Creative Commons Attribution (CC BY) license (https://creativecommons.org/licenses/by/4.0/).