1. Introduction
In opencast mine operations, the comminution process comprises the majority of the total energy consumption. This process also impacts mine productivity, considering the size of the muckpile fragments resulting from the blast. For this reason, the subject of rock fragmentation, namely particle size distribution (PSD), during blasting operations has been considered to improve the comminution efficiency [
1], especially at hard rock mines [
2,
3,
4].
Rock fragmentation is controlled by several factors related to the rock mass properties and drilling and blasting design parameters [
5]. A rock mass is described by the physical and mechanical properties of both the intact rock and discontinuities, which can be used to characterize the fragmentation strength of the rock mass during blasting operations. The drilling and blasting design parameters include burden distance, drillhole spacing, stemming height, and borehole properties. The explosive properties also impact the rock fragmentation quality, such as the explosive type, heat and specific charge and other controllable parameters that affect the energy efficiency in rock blasting [
6].
The optimization of drilling and blasting parameters in terms of rock fragmentation can contribute to improving the productivity of mine-to-mill operations (loading, transport and milling) and minimizing the total operation costs [
1,
7]. For instance, the data originating during the drilling of drillholes are an important data source for estimating intact rock properties and impact of the comminution process [
3]. Blasting operations have been optimized through several methods. Leng et al. [
8] applied different diameters of blastholes to minimize oversized boulders and toes using a nonideal detonation model and a statistical damage constitutive model. Amoako et al. [
9] studied the prediction of blasting fragmentation distribution based on the blast design parameters using machine learning techniques. A multilayered artificial neural network and support vector regression models were used to predict mean rock fragment size, which could be used to improve loading and excavation productivity.
The rock fragmentation is represented by modelling or simulation (i) by the muckpile shape as the position and the shape of the fragment; (ii) by blasting design parameters; and (iii) rock mass properties [
5,
10]. The particle size distribution is defined by sieving to obtain mass weights of the remaining material on each sieve deck, and it is then plotted in a histogram through weights vs. mesh size. Further, a cumulative distribution function or a relative mass passing function (P) might be plotted, in which the particle size (X) is against the cumulative undersize, and P represents the probability that a fragment is smaller than X [
10,
11]. Alternatively, the PSD can be obtained through the processing of a digital image or using lasers and sensors based on artificial intelligence algorithms [
9,
12,
13,
14].
1.1. Particle Size Distribution Models
Some empirical methods for predicting PSD of rock fragmentation by explosives are described in the literature, mostly using two-parameters: the size coefficient and the distribution coefficient [
11]. The Rosin–Rammler model [
15] has been widely accepted by the scientific community and industry. In this model, the PSD of rock fragmentation from blasting is expressed in terms of a factor, the median fragment size (X
50), when the breakage model is known. Although, different model distributions have been used to determine the PSD curve using the 80% passing size (X
80) [
10,
16].
The Rosin–Rammler model is written as:
with X
c as the characteristic size, and X
80 the 80% passing size. According to Ouchterlony and Sanchidrián [
10], through a series expansion of Equation (1), when
, then
, and that in a log-log diagram, this reduces to a straight line of slope n. In this way, X
c might be written as:
The PSD might be represented by three parameters, as well as the Swebrec function [
10,
11] given by:
where P(x), is the cumulative undersize (%); X
max is the maximum size of particles (mm); X is the particle size (mm); X
50 is the sieve size that retains 50% of the material (mm); and b is the shape parameter, called the undulation exponent or sometimes the natural breakage characteristics (NBC) exponent [
17]. This parameter might be between 1 and 2, where the inflection point tends towards X = X
max and X = X
50, respectively [
11].
The aim of this study was to optimize the blasting parameters through a numerical analysis of a copper open pit mine in hard rock. Oversized fragments formed and impacted the overall mine production, mostly crushing operations. The design blasting parameters were evaluated and calibrated to achieve the best rock fragmentation size for the mining system. For this purpose, the specific objectives were (i) the data collection and 3D model construction in Blo-Up software; (ii) the calibration of historical data; and (iii) predictive analysis.
1.2. Blo-Up Software
Blo-Up is a numerical model that combines 3D continuum and discontinuum numerical methods (
Figure 1) to reproduce general trends in nonideal detonation, rock fracturing and muckpile formation. The first model component, “Programmed Burn”, is used to model the detonation process and axial blasthole flow. For the second component, a continuum method is used to represent the near-blasthole volume and the detonation process. The third component adopts a discrete element method (DEM) to represent the rock mass and model the wave propagation and initial fragmentation through muckpile formation [
9].
1.2.1. Explosive Model
According to Castro and Valencia [
18], the numerical modelling process involves modelling using the data blasting parameters (density, energy, reaction extent, equations of state of the products and velocity of detonation-VOD). The model used is a nonideal detonation model [
19]. These data are represented in the central zone of a continuum FLAC model with axial symmetry, developed by Itasca [
20]. Then, the detonation process, expansion and axial flow of the detonation products are simulated through a programmed detonation algorithm [
21]. The energy is released to the zones representing the explosive based on a predetermined VOD.
1.2.2. Main Rock Body Representation
The FLAC zones are united in a simulation based on the “lattice” DEM. The rock mass is represented as a set of nodes connected by elastic springs with tensile strength and a viscous damping mechanism [
18] (
Figure 2).
The energy dissipation that occurs in real rock masses is allowable by this viscous damping mechanism and is dependent on a factor “α”, with 0 ≤ α ≤ 1. Although Blo-Up explicitly incorporates the presence of node sets in the rock mass, these are planes in which the tensile strength of the springs that cut through the plane is decreased by a factor “F”, with 0 ≤ F ≤ 1 [
18].
1.2.3. Fracture Mechanics in Blo-Up
The fracture mechanics and wave propagation in the rock mass are represented in the Blo-Up model. During the energy transmission through the rock mass, motion equations are generated for each point in the mass as a function of the sum of unbalanced forces [
18], as shown in Equation (1).
where
is the force from lattice springs,
is the viscous damping force and
is the gravitational force.
1.2.4. Fragment Size Calculation
As stated by Castro and Valencia [
18], in the size distribution calculation, the lattice is divided into fragments to define the fragment sizes; when fracturing occurs, the springs connecting the nodes are broken. Blo-Up defines these fragments and their total volume to maintain different sizes. The size of the fragments is the cube root of the volume of a fragment. The volume of a fragment is the number of nodes that make up the fragment times the nodal volume. The nodal volume is the lattice resolution cubed. The minimum fragment size found always corresponds to the actual lattice resolution. For fragment sizes below the lattice size, the PSD can be reflected by the adjusted probability distribution equations of Rosin–Rammler (Equation (1)) or Swebrec (Equation (3)) [
13].
2. Background Review
The study area consists predominantly of the biotite-garnet schist (BDX) in an open pit mine located in southwestern Pará state in Brazil (
Figure 3).
The intact rock properties for this lithology are generalized to the mean values among rock classes I, II and III (
Table 1), as they represent the most common rock classes in the mine [
22]. The Young’s modulus of the BDX rock mass was estimated through the empirical approach proposed by Hoek and Diederichs [
23]. The shear zone of the mine area and the intact rock properties for the BDX are shown in
Figure 4 and
Table 1.
Discontinuities in the form of shear zones, fractures and foliations can be recognized all along the mine, reflecting only one structural domain in the entire mine [
22]. The orientations of the discontinuities that were included at the model stage are shown in
Table 2.
All the available background information about the intact rock and rock mass characterization was used as inputs for the calibration process.
3. Materials and Methods
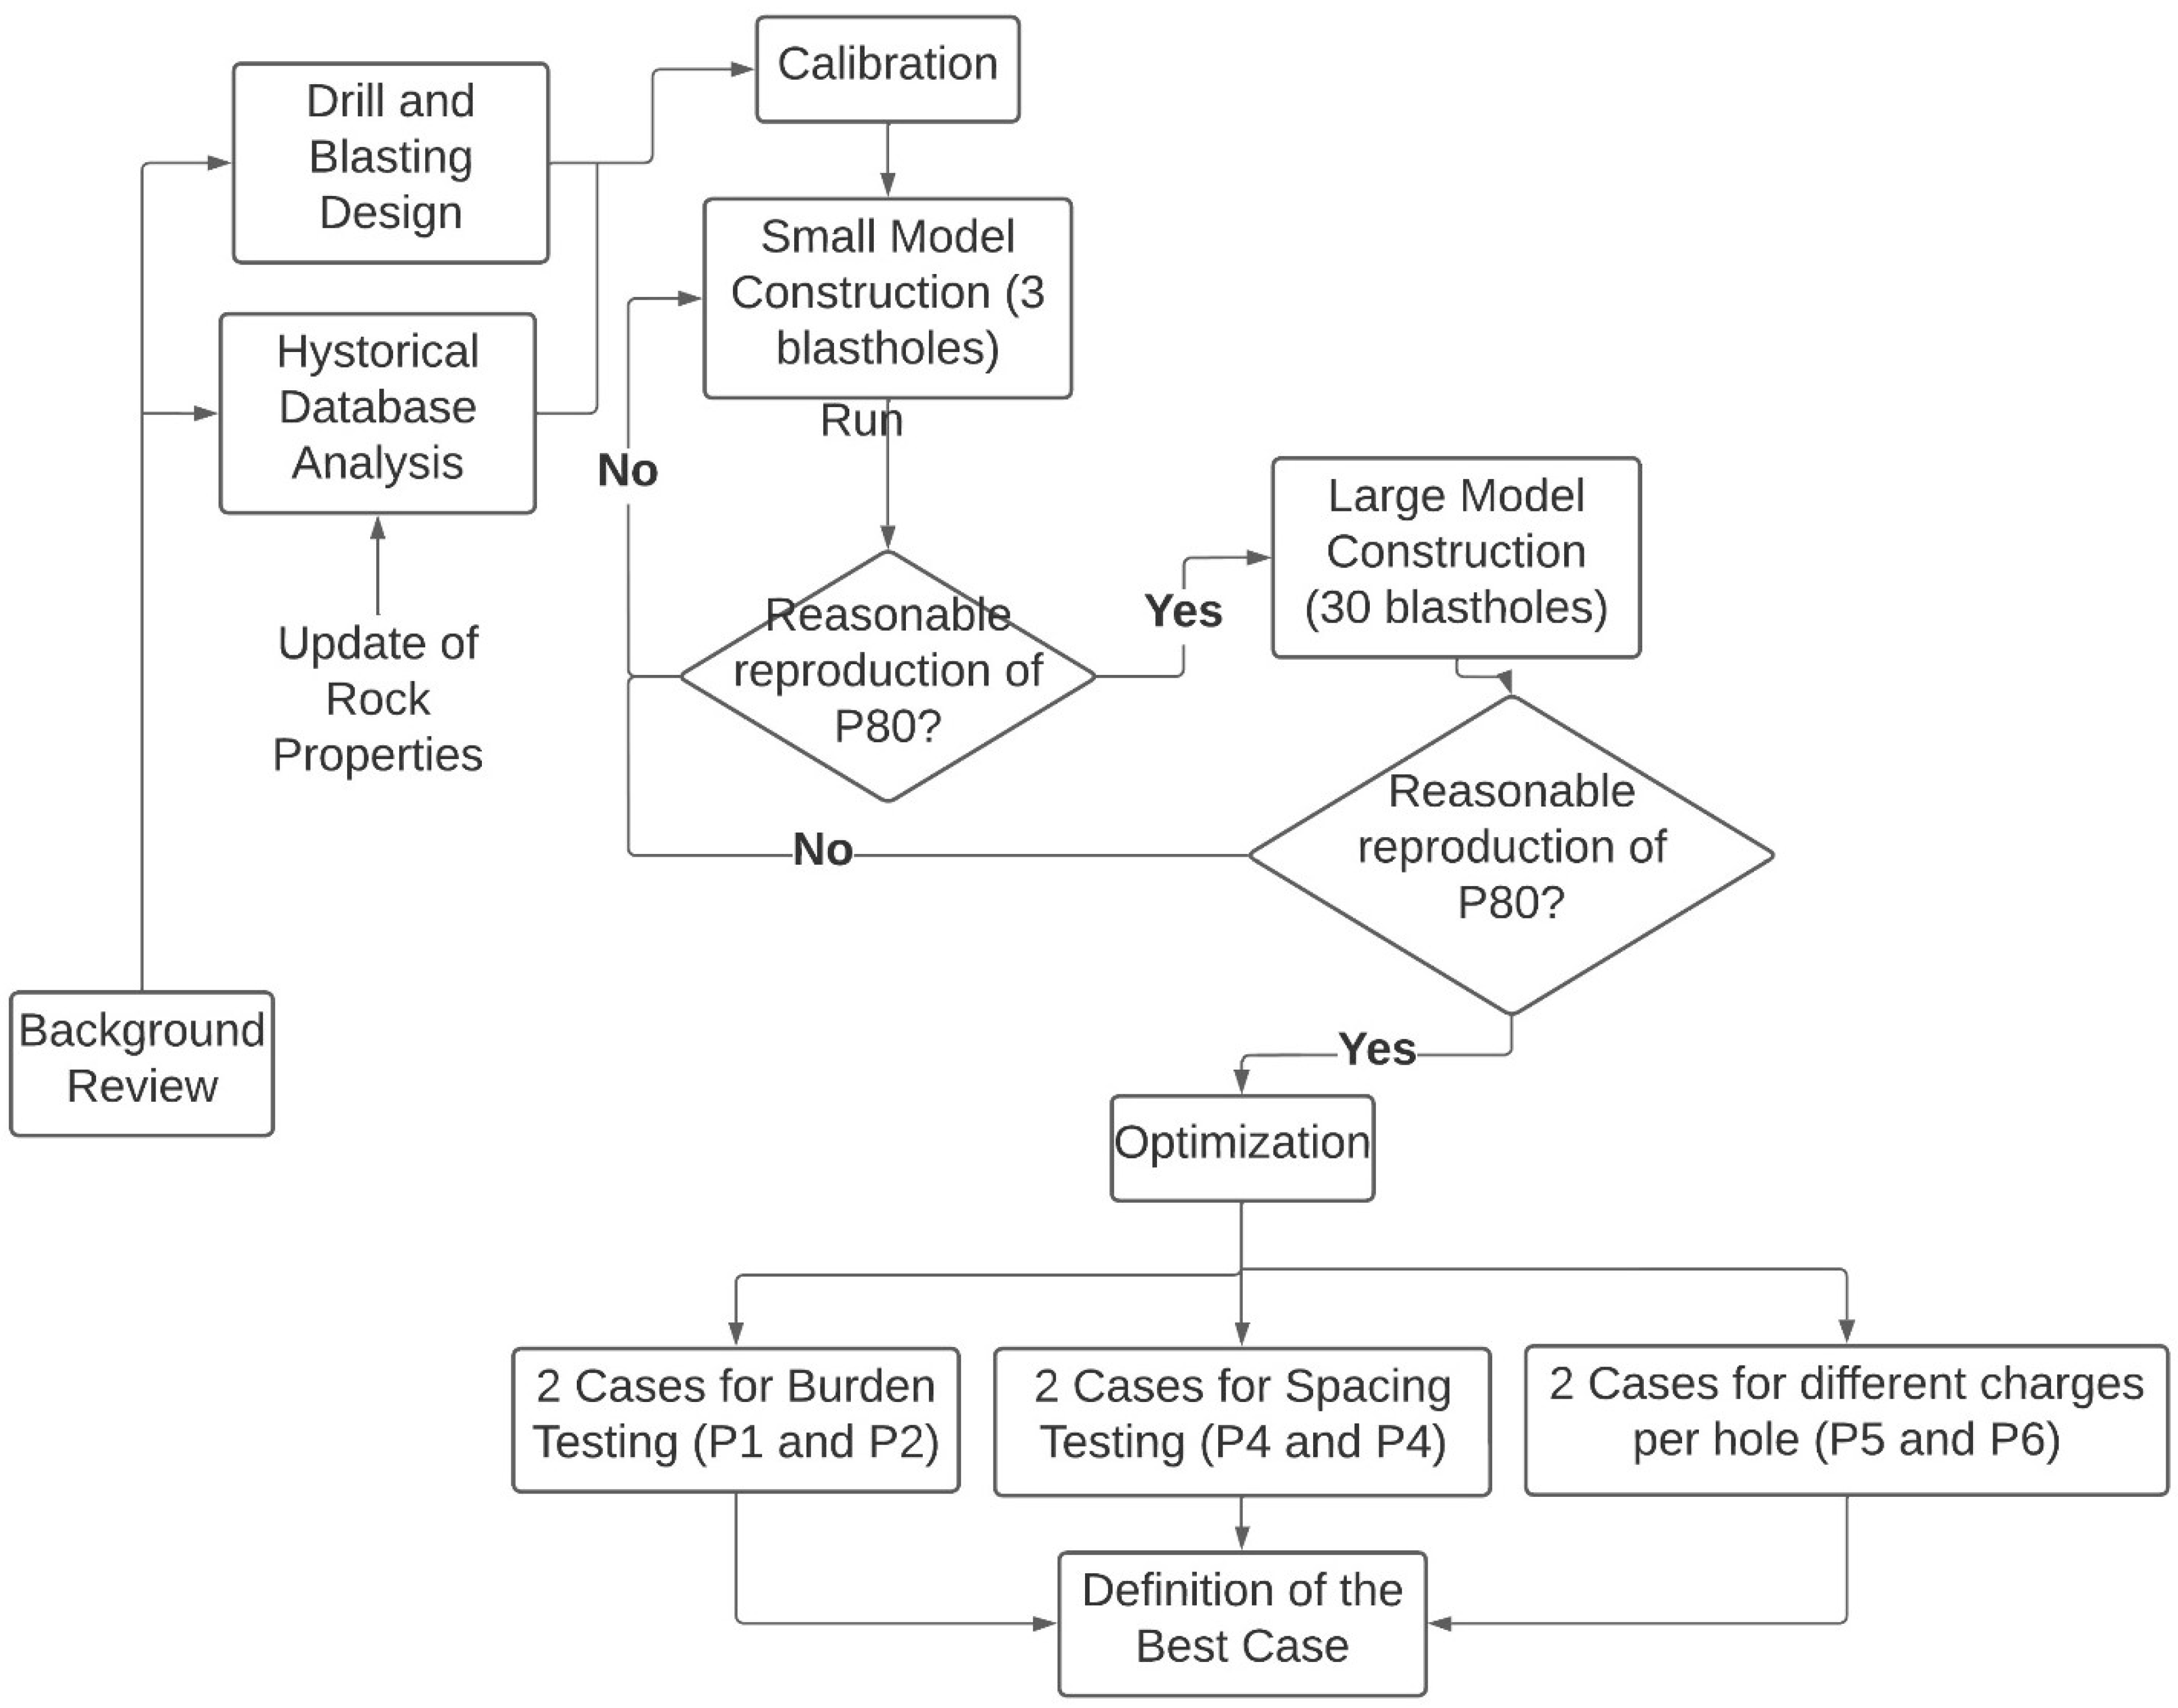
The optimization process developed in this study is summarized in the flowsheet of
Figure 5.
3.1. Drilling and Blasting Design
The drilling and blasting design considered the standard parameters for the drilling pattern, explosives characterization, blasthole, charge information and detonation sequence in the BDX. These parameters were addressed in terms of mean values. A blasting polygon (L3_127_005_R00) performed in the mine [
24] was taken into account in the calibration process. The drilling pattern was characterized by a burden of 5.0 m, spacing of 5.6 m, area per blasthole of 28.0 m
2, blasthole diameter of 12 ¼, drill length of 16.1 m, subdrill length of 1.0 m and dip angle of 90°.
The explosives used in the mine were provided by Orica [
25]. For these drilling patterns, the blasthole charge included two types of emulsions: Fortis Advantage System 70 (FDS 70) and Fortis Advantage System 100 (FDS 100), which main performance parameters are reported in
Table 3.
The drilling pattern considered the use of gravel as the stemming of 5.5 m, and the blasthole charge information, in terms of mean magnitudes, was as follows: charge length of 10.2 m, charge weight of 966.2 kg, and specific charge of 655.6 g/t.
For the calibration of the Blo-Up model, the stemming was considered ideal, providing full confinement. The booster was located 1.0 m above the level of the drillhole bottom. For the blasting sequence, the delay between blastholes in a single row was 5.0 ms, and the delay between rows was 85.0 ms.
3.2. Historical Database Analysis
A database with 1596 historical blasting designs and 80.0% passing size (P80) was filtered to select the data of the predominant lithology as a case study. Finally, the historical database analysis included 284 blasting designs with fragmentation sizes between 2015 and 2019. The P80 data were considered in a descriptive statistics analysis.
A drilling and blasting design (L3_127_005), performed in the BDX, was also used in the calibration process; the data included the drilling patterns, blasthole charge information, detonation sequence and PSD.
3.3. Calibration
As shown in
Figure 5, the calibration stage involved the definition of the model resolution, construction and calibration of the small model and large model, and finally the optimization of the designs studied.
The model resolution was 0.16 m, considering the Blo-Up software runtime limitations and the PSD. The PSD indicates that the passing percentage for a size of 0.16 m is 64.5% [
24]. This means that Blo-Up was modelled with the upper 35.5% of the size distribution. Afterwards, two models were constructed and calibrated: a small model with three blastholes and a large model with 30 blastholes.
The small model was aimed to produce a fast response in the exploratory stage of the calibration and was run up to 50.0 ms, considering up to 40.0 ms after the last blasthole detonation. The large model was developed to validate the results of the small model for a more realistic blasting scenario and was run up to 600.0 ms. In these models, the detonation time effectively represents the fragmentation due to detonation and blasting.
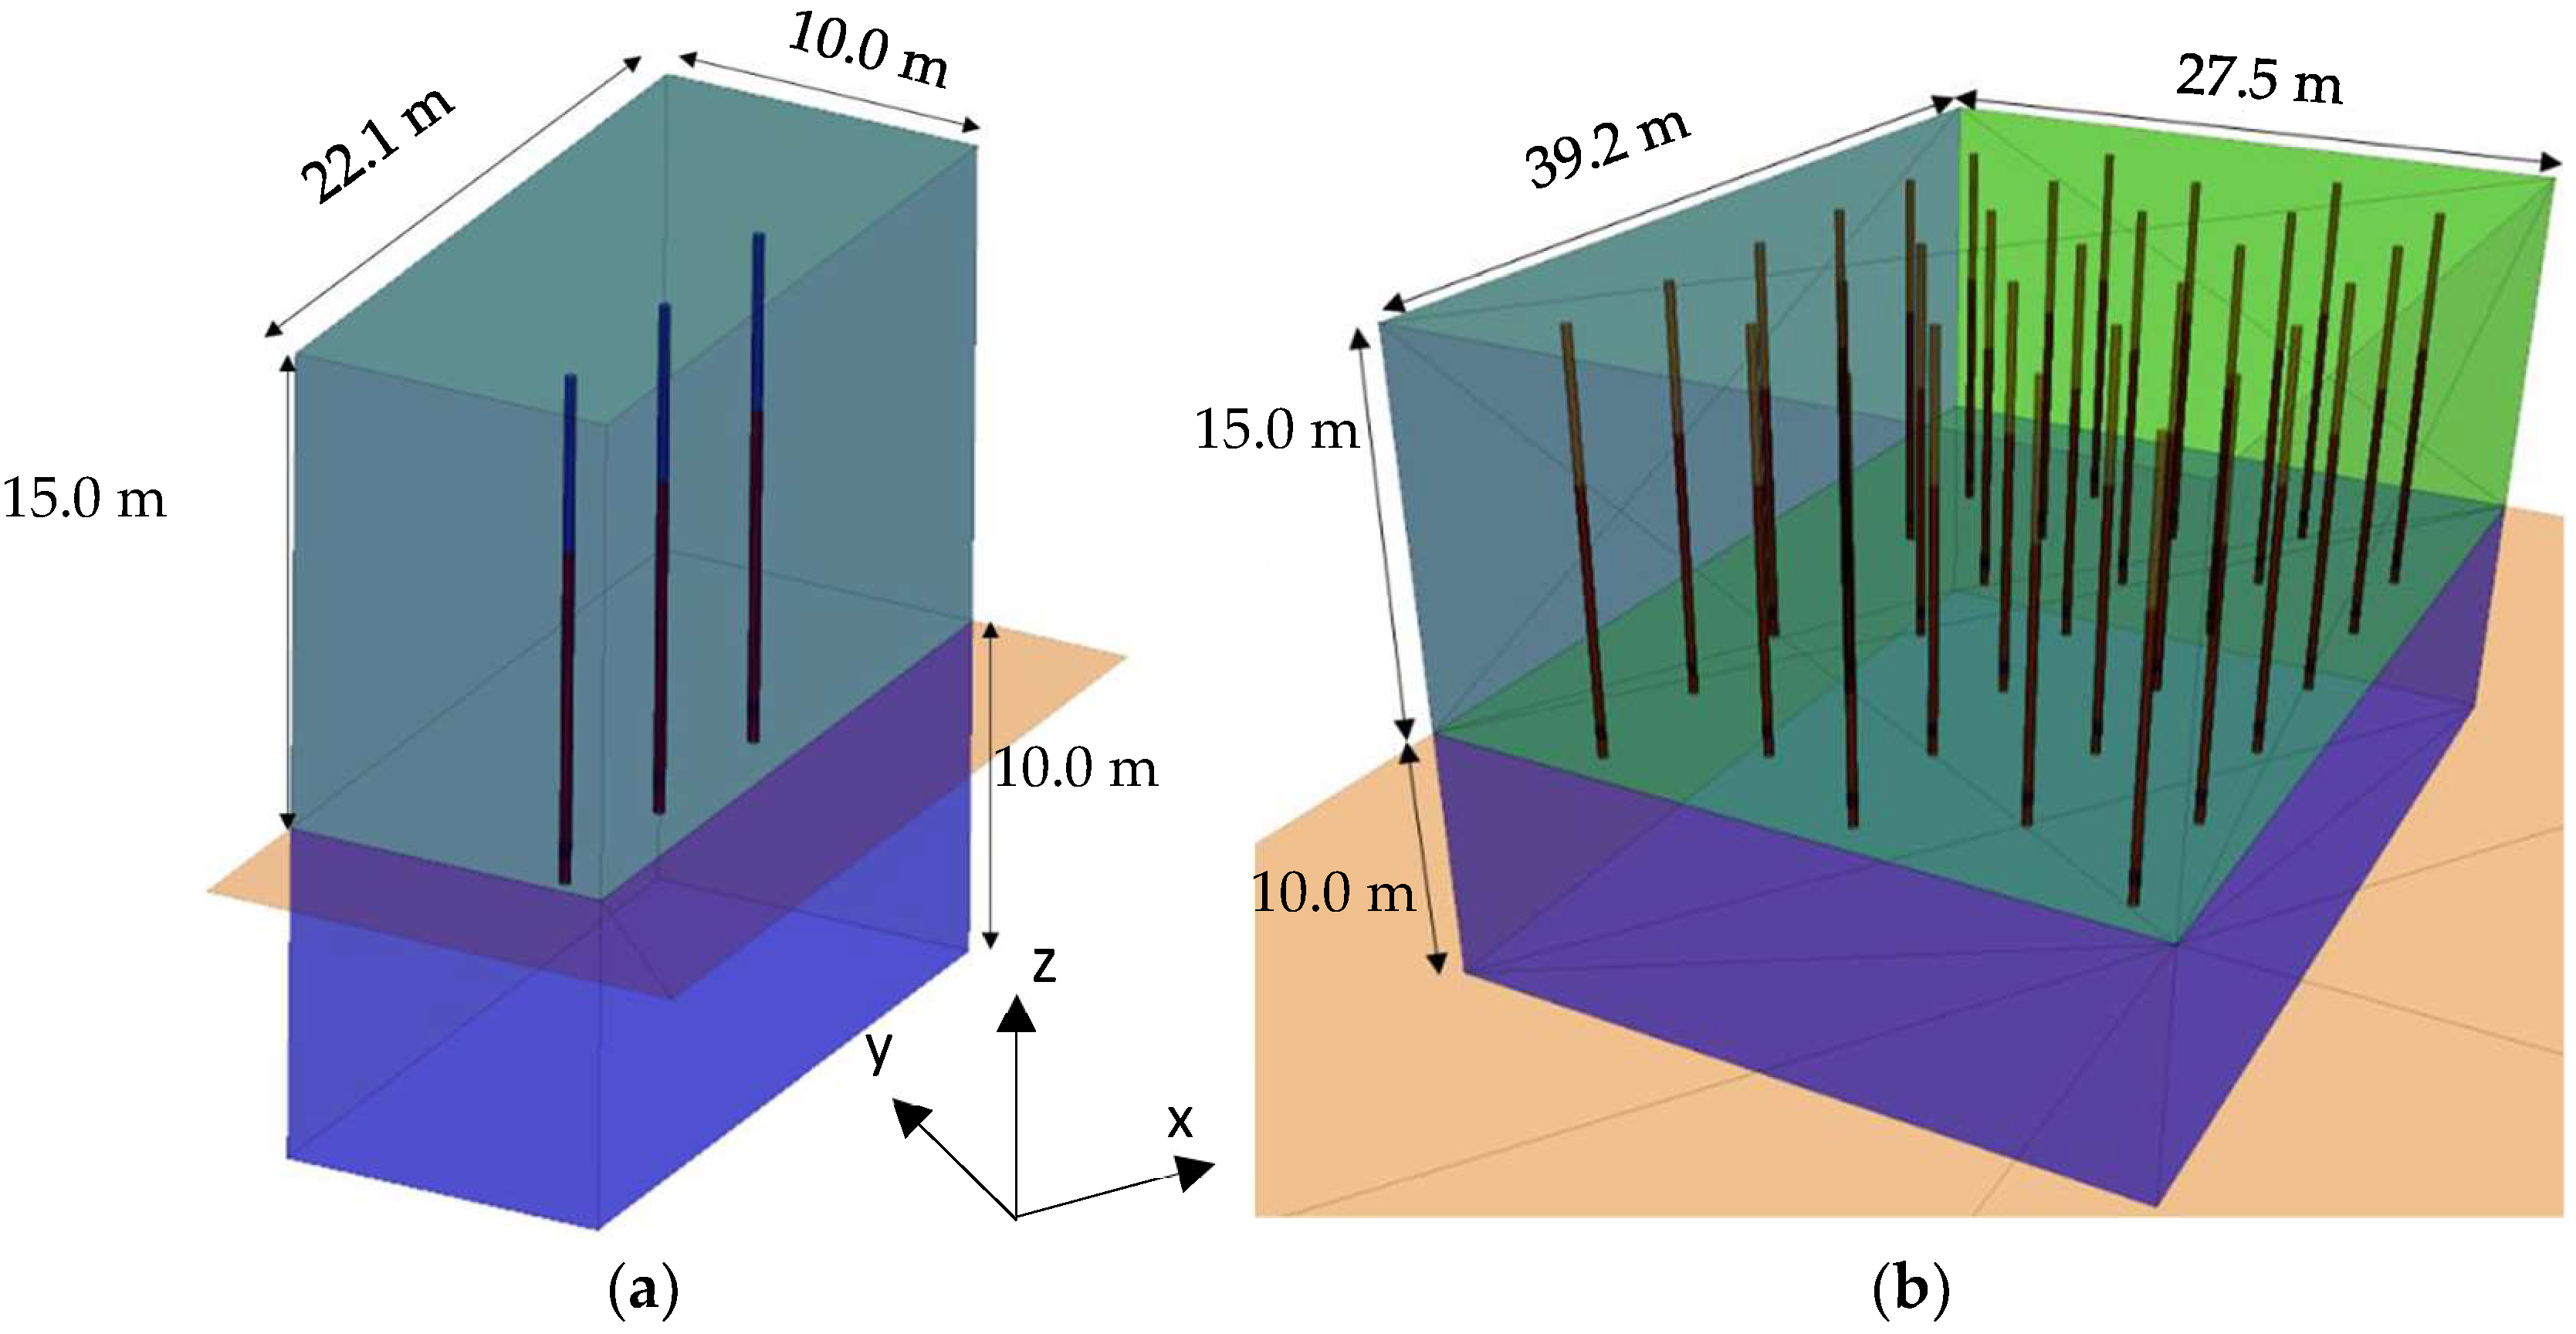
In the construction of the models, the boundary conditions were established to represent a bench of 15.0 m in height. The blastholes were located half a spacing distance and half a burden distance from the edges in the model area that represents the free face. The parameters of the blasting designs are shown in
Table 4, and the model geometries are shown in
Figure 6.
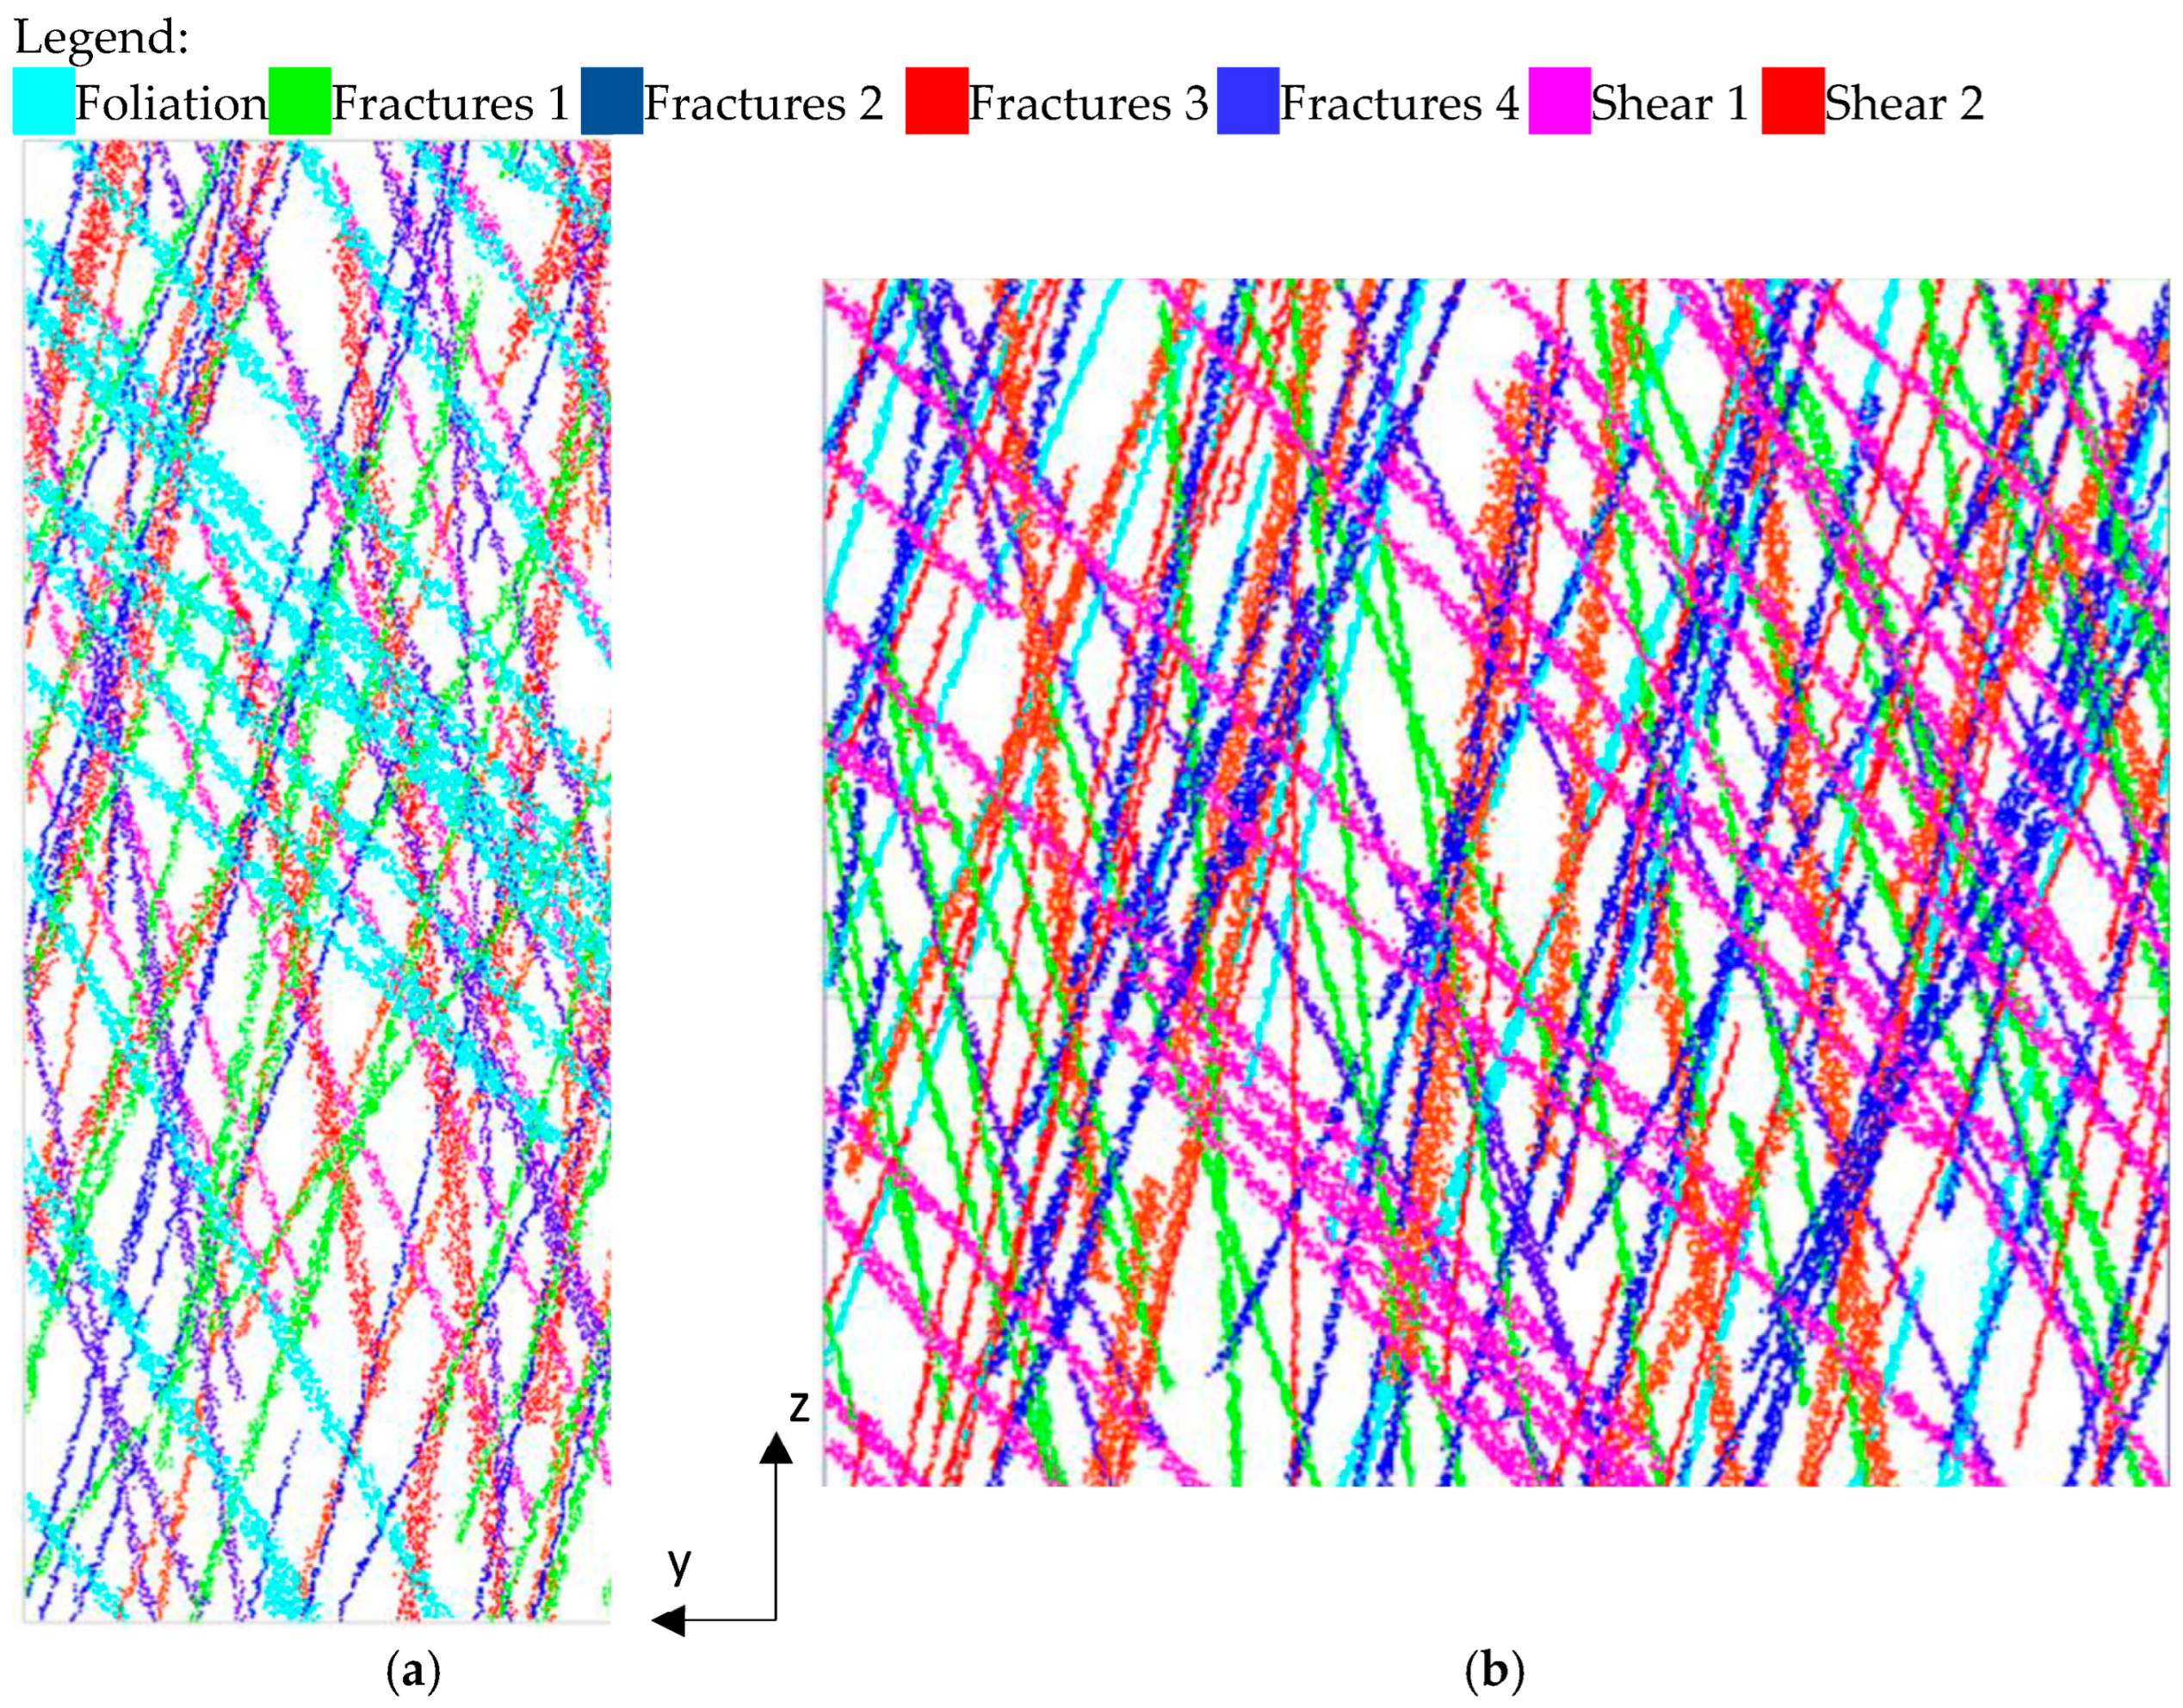
In both models, the discontinuities observed for the BDX were included.
Figure 7 shows the foliation, fractures (4 sets), shear zones (2 sets) and joints (7 sets).
3.4. Optimization
After the calibration, the optimal blasting design was chosen for the optimization process in terms of the desired fragmentation, which is a P
80 of 0.55 m. To determine the optimal blasting, a total of 6 cases were tested (
Table 5).
The P1, P2, P3 and P4 cases had the same charge per blasthole and explosive, according to the L3_127_005 blasting design. For all of these cases, the blasthole diameter was 12¼”.
4. Results and Discussions
4.1. Historical Database Analysis
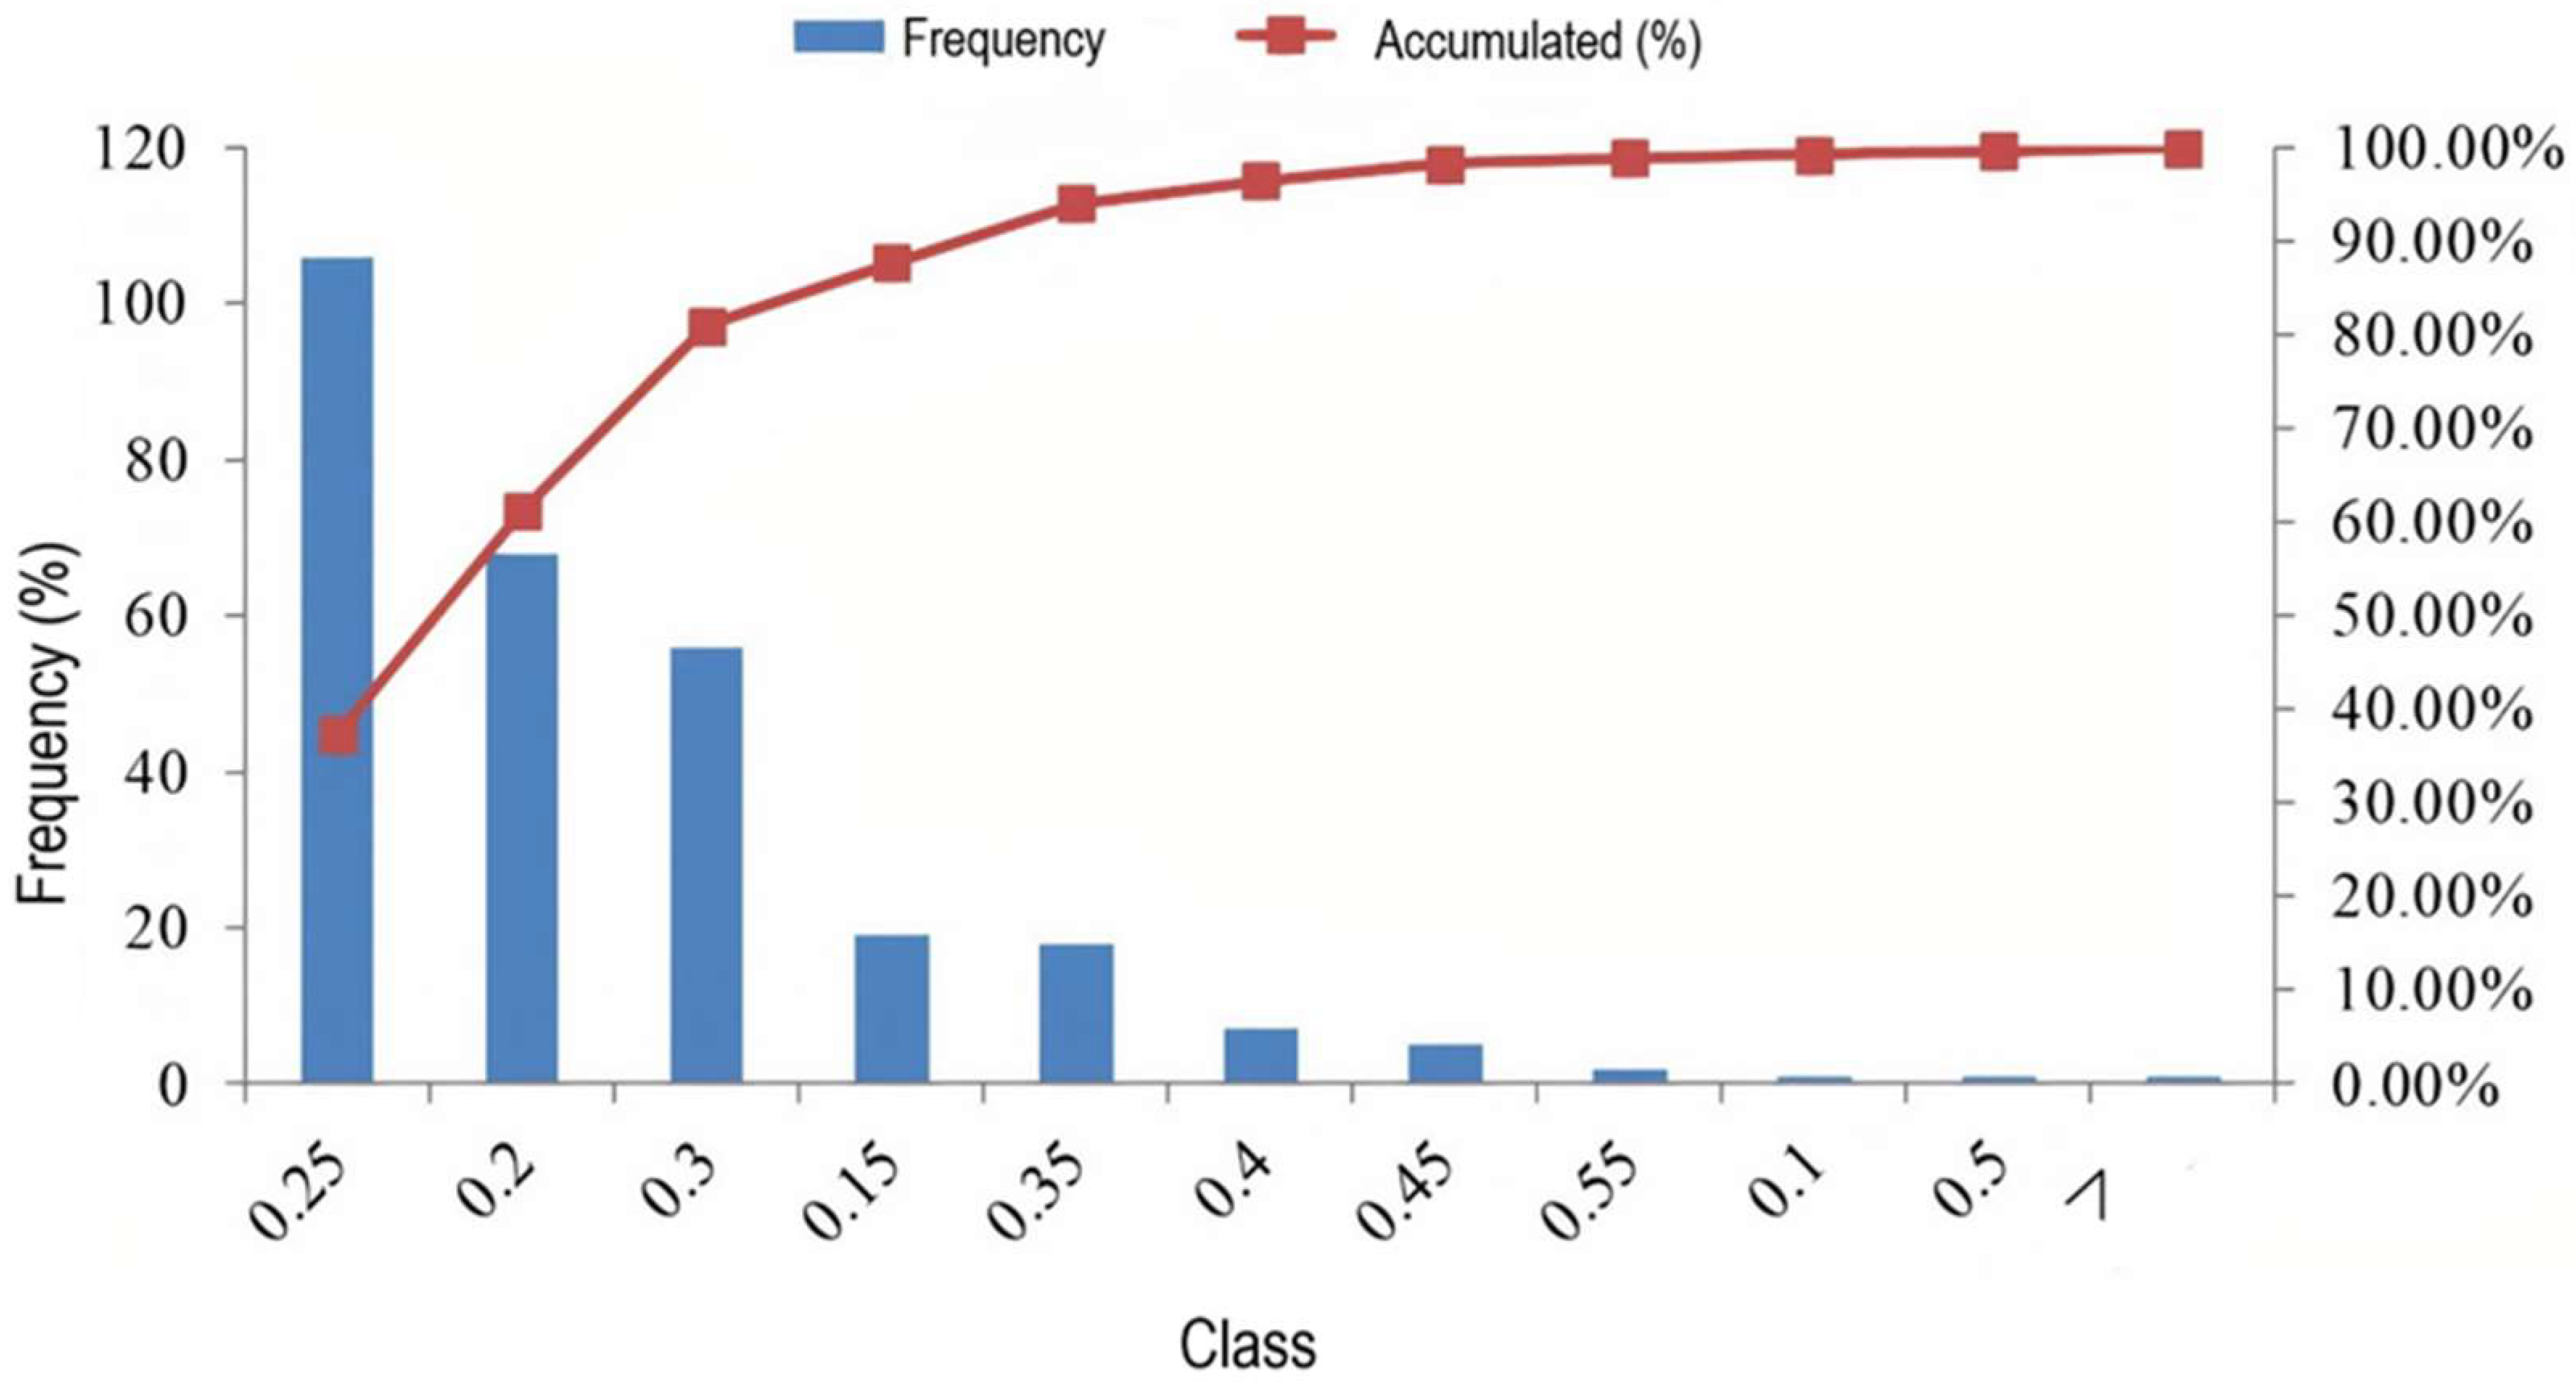
The analysis of the 284 blasting designs with a P
80 size are consolidated in the histogram of P
80 frequency in
Figure 8.
Over the five years analysed, the average P
80 was equal to 0.25 m with a standard variation of 0.07 m and a median of 0.22 m in the BDX. These rock fragmentation results are due to different magnitudes of different drilling patterns, blasthole charges, and other parameters. The analysis of
Figure 8 allows us to infer that the historical database has 95% designs with a P
80 ≤ 0.32 m, even though there were cases with P
80 ≥ 0.55 m, but those were a minority in the data analysed.
4.2. Model for Fragmentation Analysis
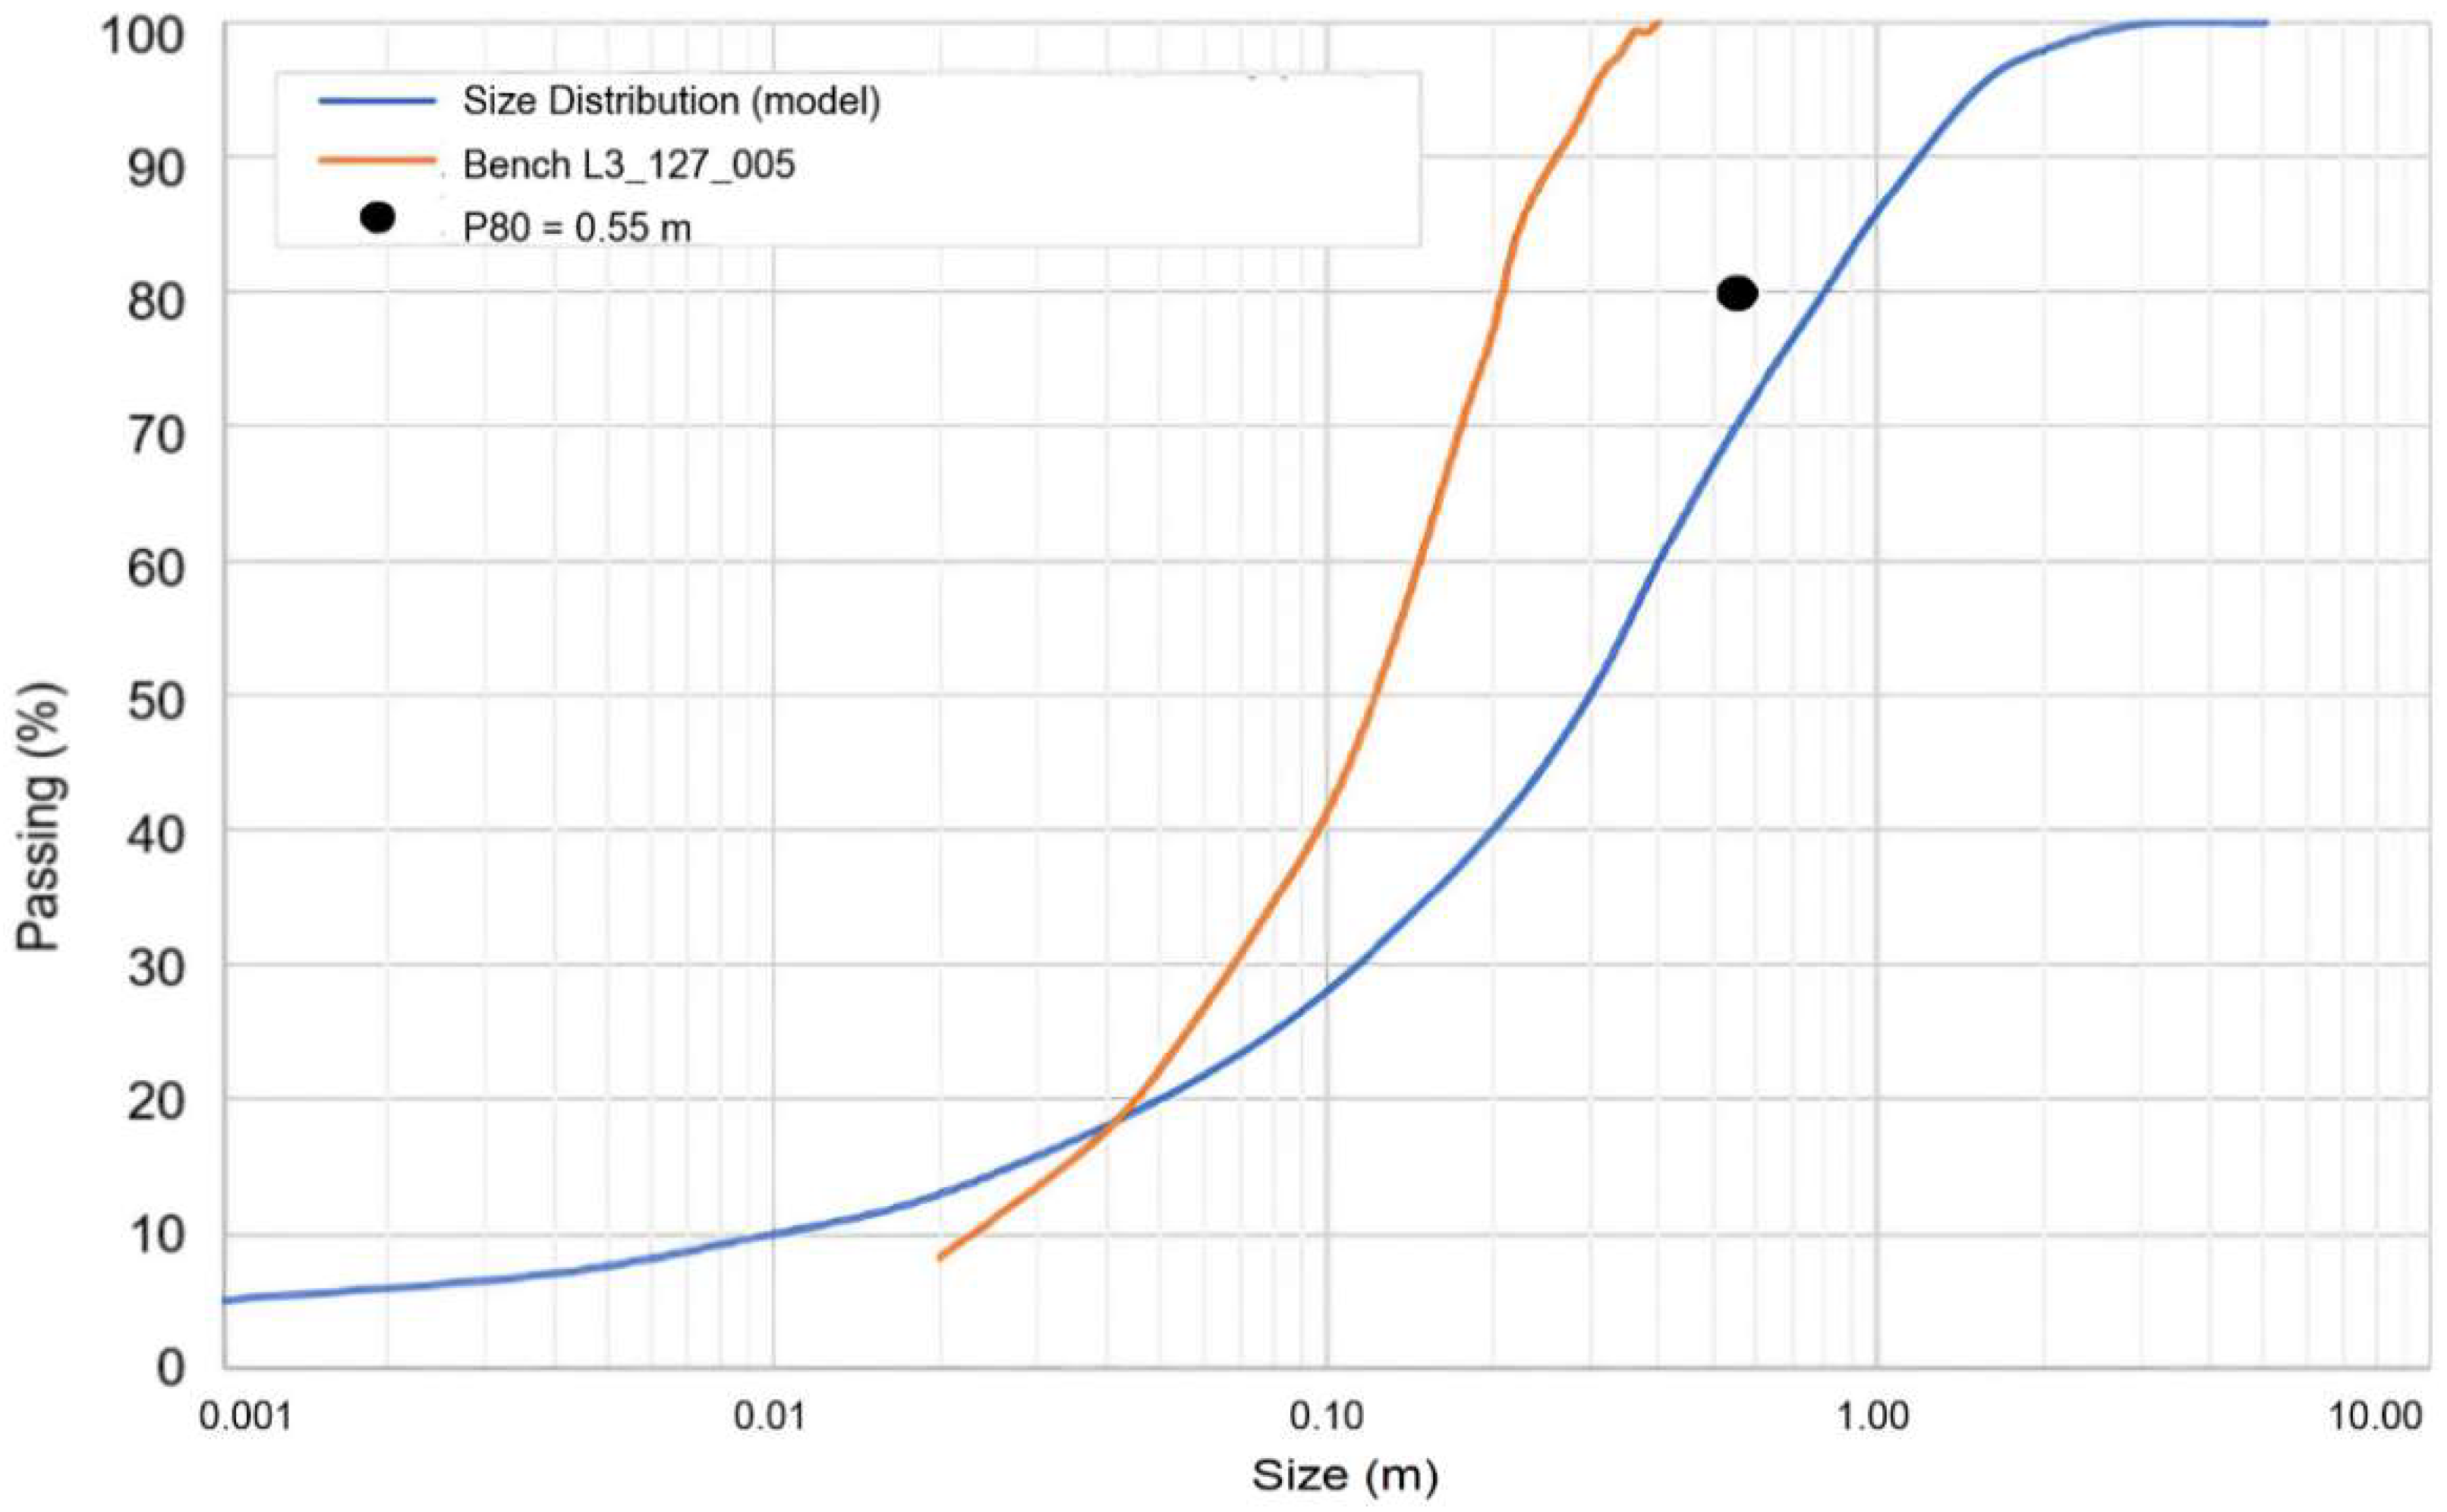
Considering the old model for fragmentation, which had a P
80 close to 0.80 m, and the reports from mine operations related to boulders from the run of mine (ROM) with oversize > 1.0 m were investigated. As mentioned before, this work aimed to optimize mine blast design with an optimum size of P
80 equal to 0.55 m using Blo-Up software.
Figure 9 shows the PSD of the L3_127_005 blast and the old model for fragmentation provided by the mine company.
Through the analysis of
Figure 9 and taking into account the desired P
80 size of 0.55 m, it can be observed that the L3_127_005 blasting had a smaller P
80 and P
100 smaller than 0.40 m. Analyzing these two PSD, the L3_127_005 presents a finer size, considering the size results of the muckpile. The blasting pattern used in this blast was equal to 5.0 m × 5.6 m and was considered regular blasting because it has similar results in terms of P
80 and the same pattern.
The calibration stage aimed to reproduce the L3_127_005 blasting to obtain the fragmentation results of the BDX as observed at the site. For the optimization stage, two different burdens, two spacings and two specific charges were assessed. With these parameters, the target was increasing the P
80 from ~0.21 m of the L3_127_005 blasting to achieve the desired P
80 of 0.55 m [
9].
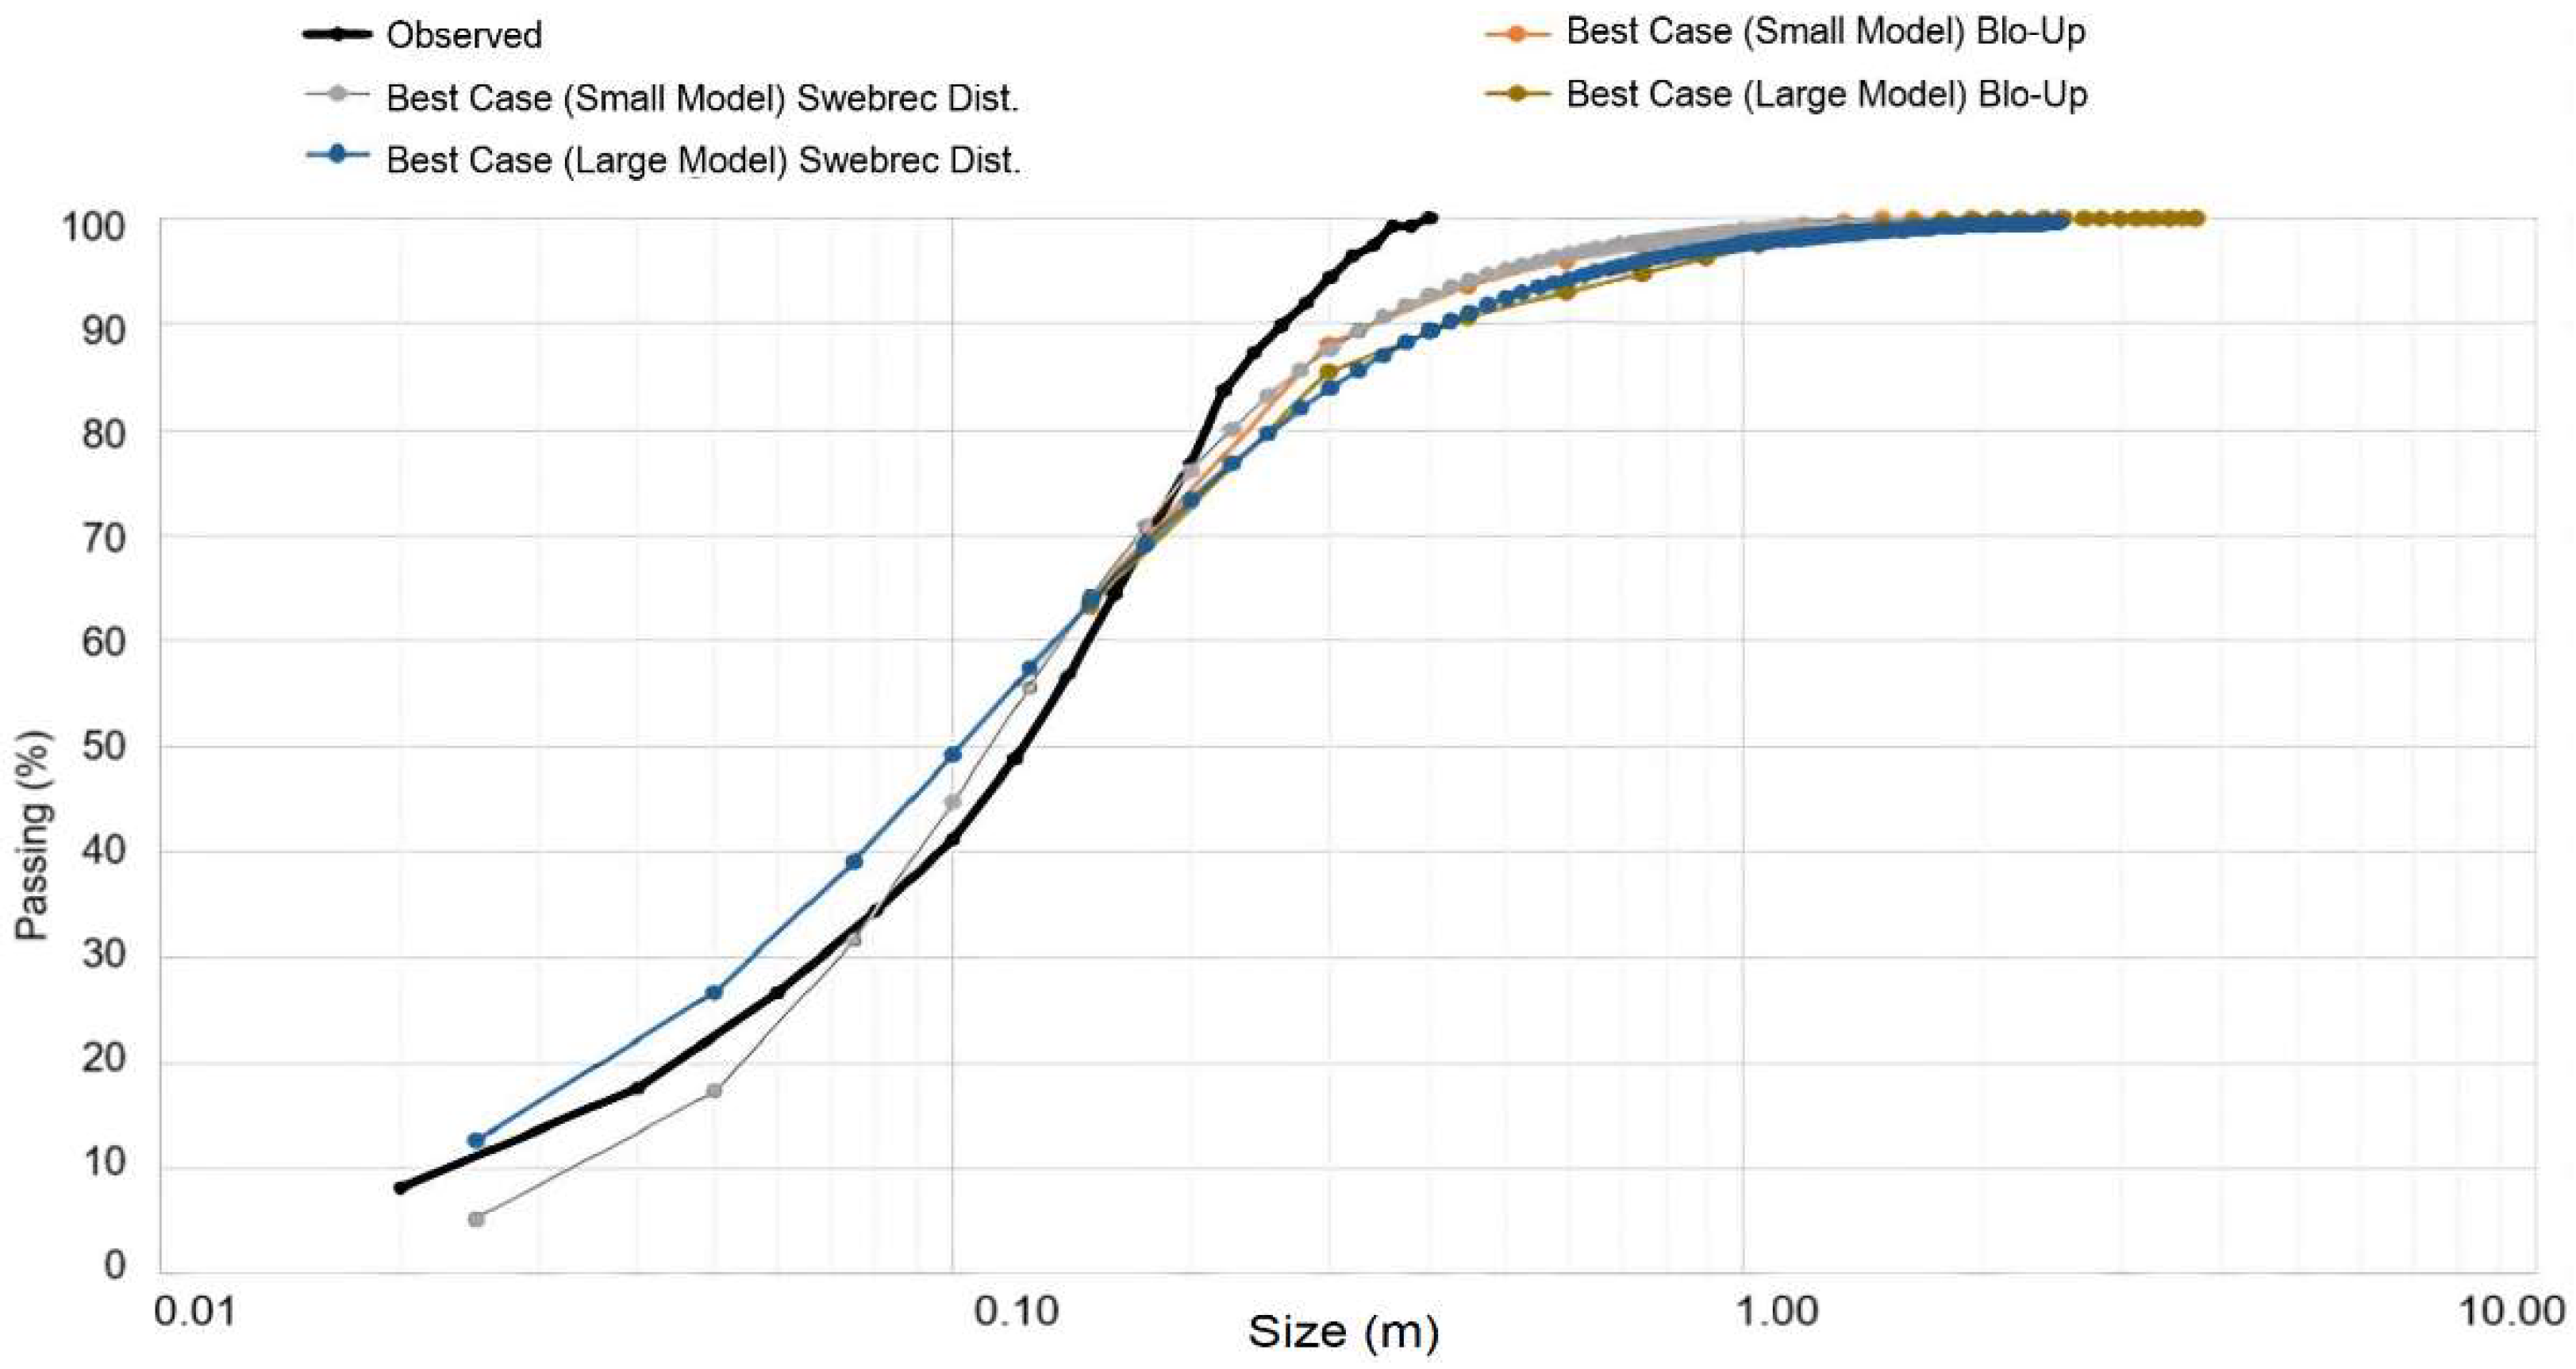
4.3. Calibration Results
At the calibration stage, four models were considered. These models included (1) the best case of the small model from Blo-Up and (2) the best case of the large model from Blo-Up. The minimum size of these models was limited by the model resolution. Two models based on a best-fit exercise through the Swebrec-type PSD better fit the data from the Blo-Up model. These models included (1) the best case of the corresponding small model and (2) the best case of the corresponding large model. The PSD obtained in these models are shown in
Figure 10.
The PSD showed that the models had some P80 variability related to their scale and compared to the observed PSD, which could be explained by data unavailability from particle sizes larger than 0.2 m. The large models had coarser fragment sizes than the small models, and we noticed more conservative values in the range of sizes between 0.2 and 0.4 m, but a reasonable representation for the rest of the fine curves. The Swebrec distribution models the whole range of sizes, with an error of 4.0% compared to the observed P80 of L3_127_005_R00 blasting. As was found by Coello-Velázquez et al. (2019), the Swebrec distribution provides the best fit compared to the observed values.
To achieve the best cases above, vertical blast-induced damage was introduced, and in the first run, it was exported. The result of this run was assumed to represent microcracks, which occur within the rock mass due to vibrations and blasting. In the second run, the vertical component of the damage was applied to the same model. Furthermore, it was considered that the extension of the induced fractures and induced damage from blasting occurred down to a depth of 3.0 m below the toe of the bench. This region was modelled assuming that the tensile strength of the rock mass was 1.0 MPa weaker.
To better describe these different zones of the rock mass, the tensile strength was divided into fresh rock, damaged rock and joints. The calibrated geomechanical properties for the Blo-Up model are shown in
Table 6.
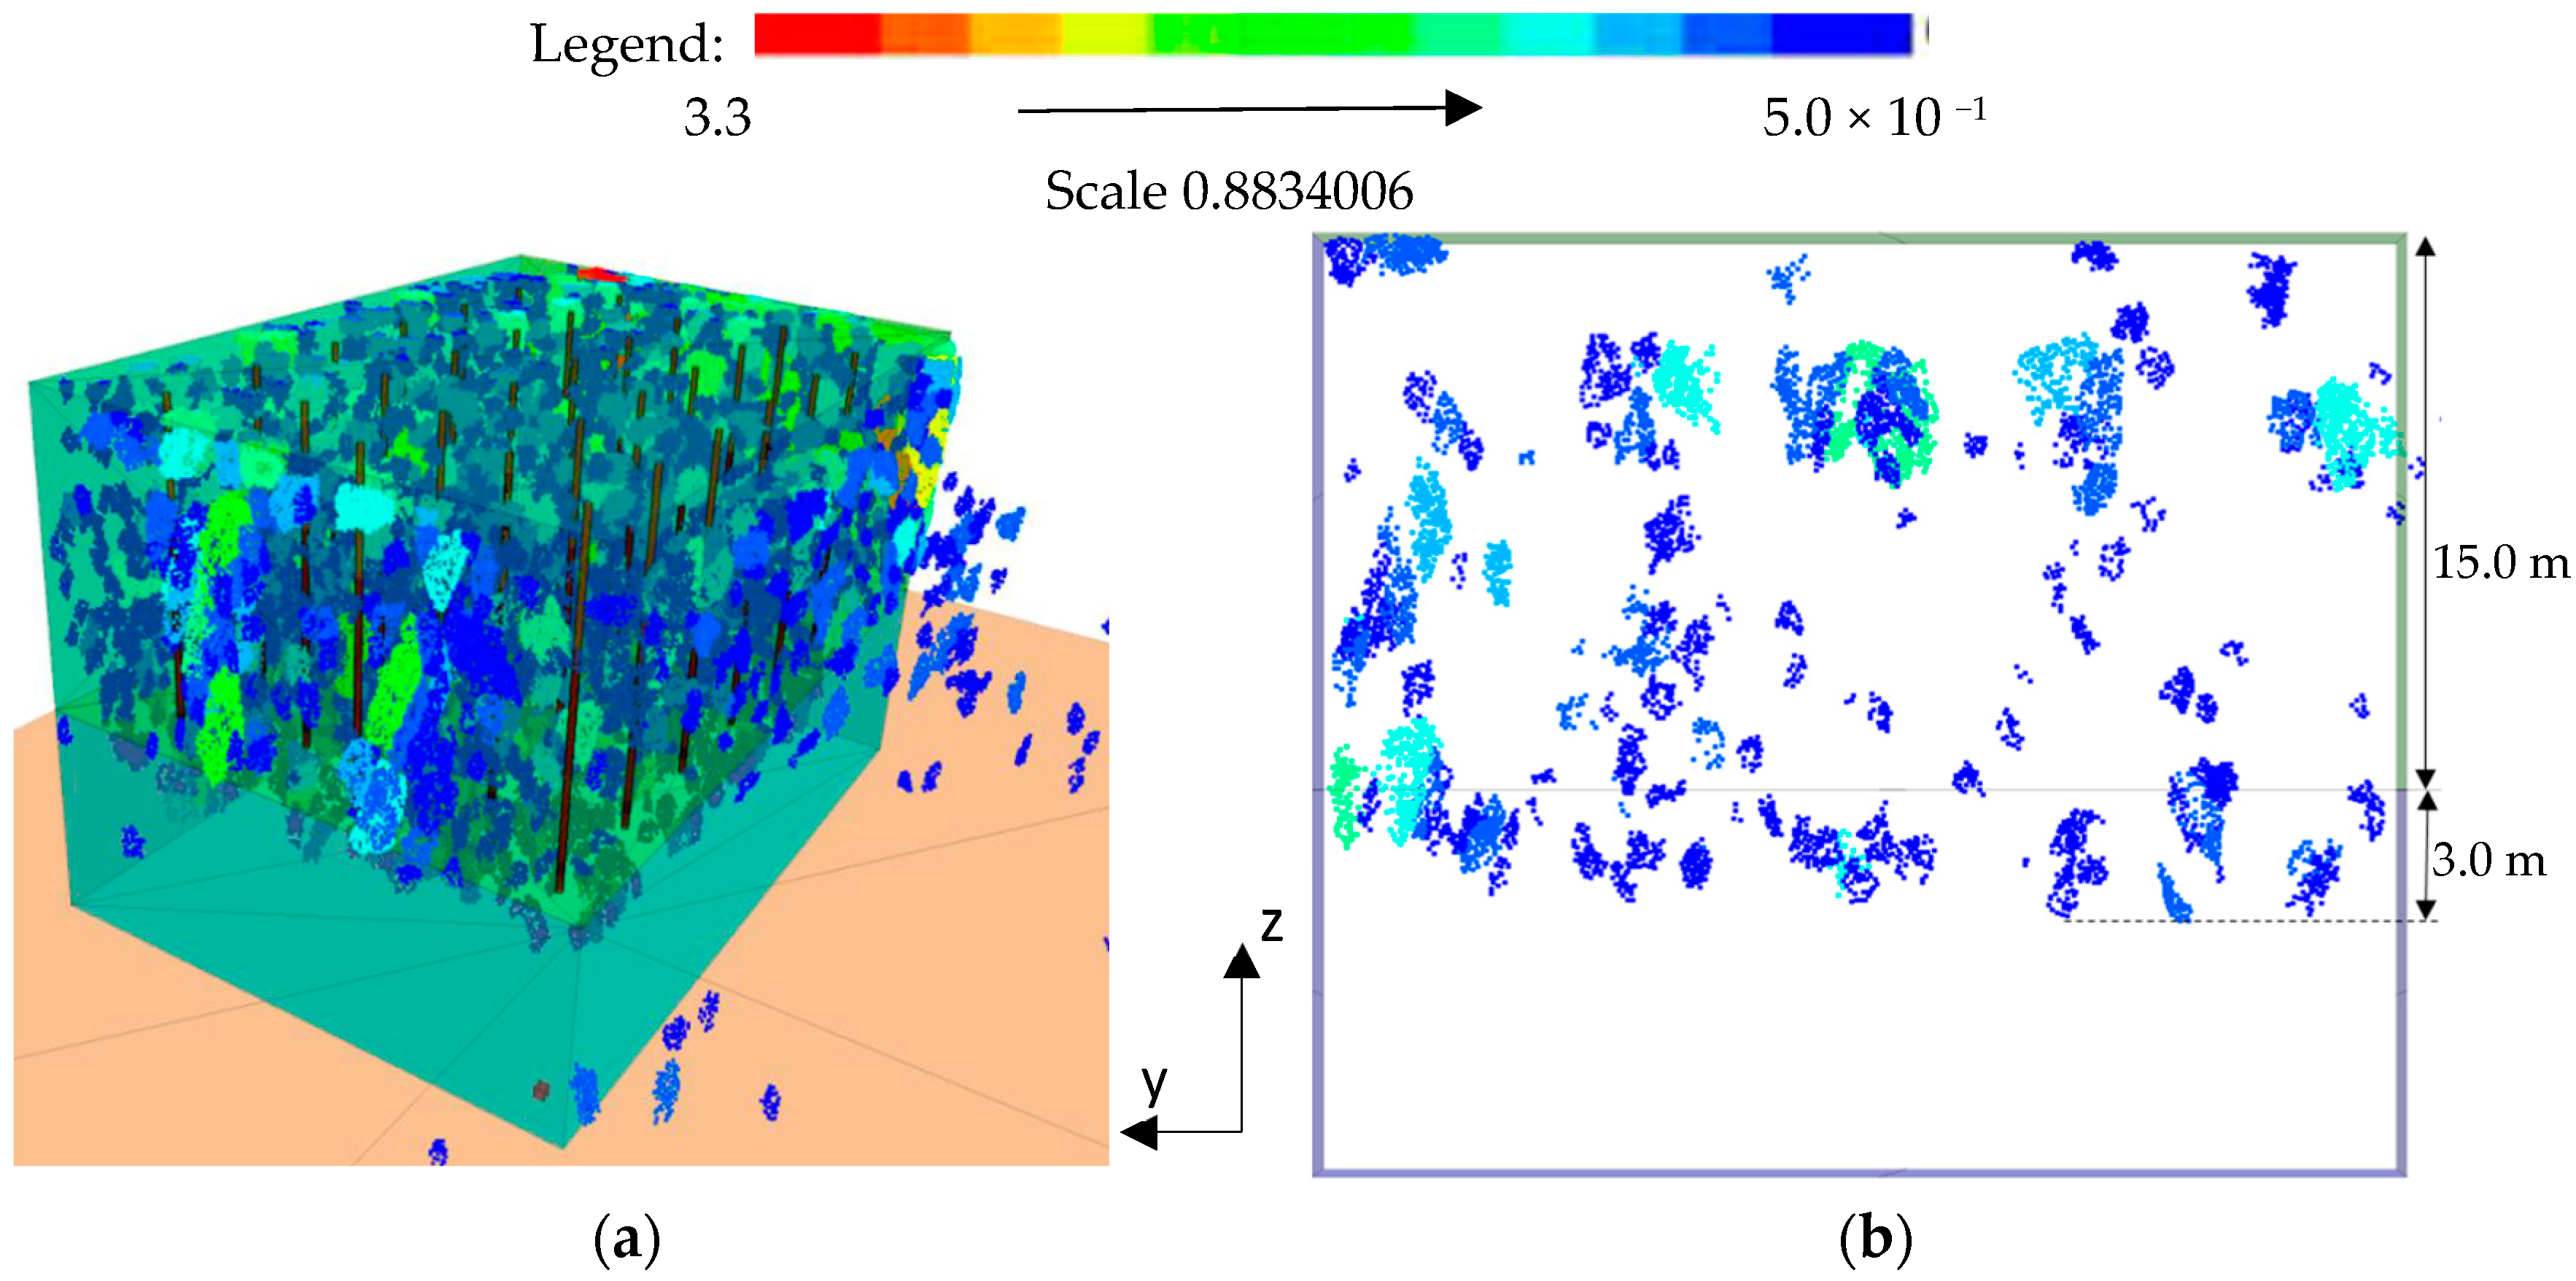
The distribution of fragments was represented in the contour of the blasted rock fragments over 0.5 m.
Figure 11a shows the fragment contour for the BC Large Model resulting from calibration in Blo-Up.
Figure 7b shows the vertical cross-section along the height of the bench. The analysis of these contours provides evidence that larger fragments were concentrated in the upper part of the bench, including the damaged area and the area below, and were located at the boundary conditions.
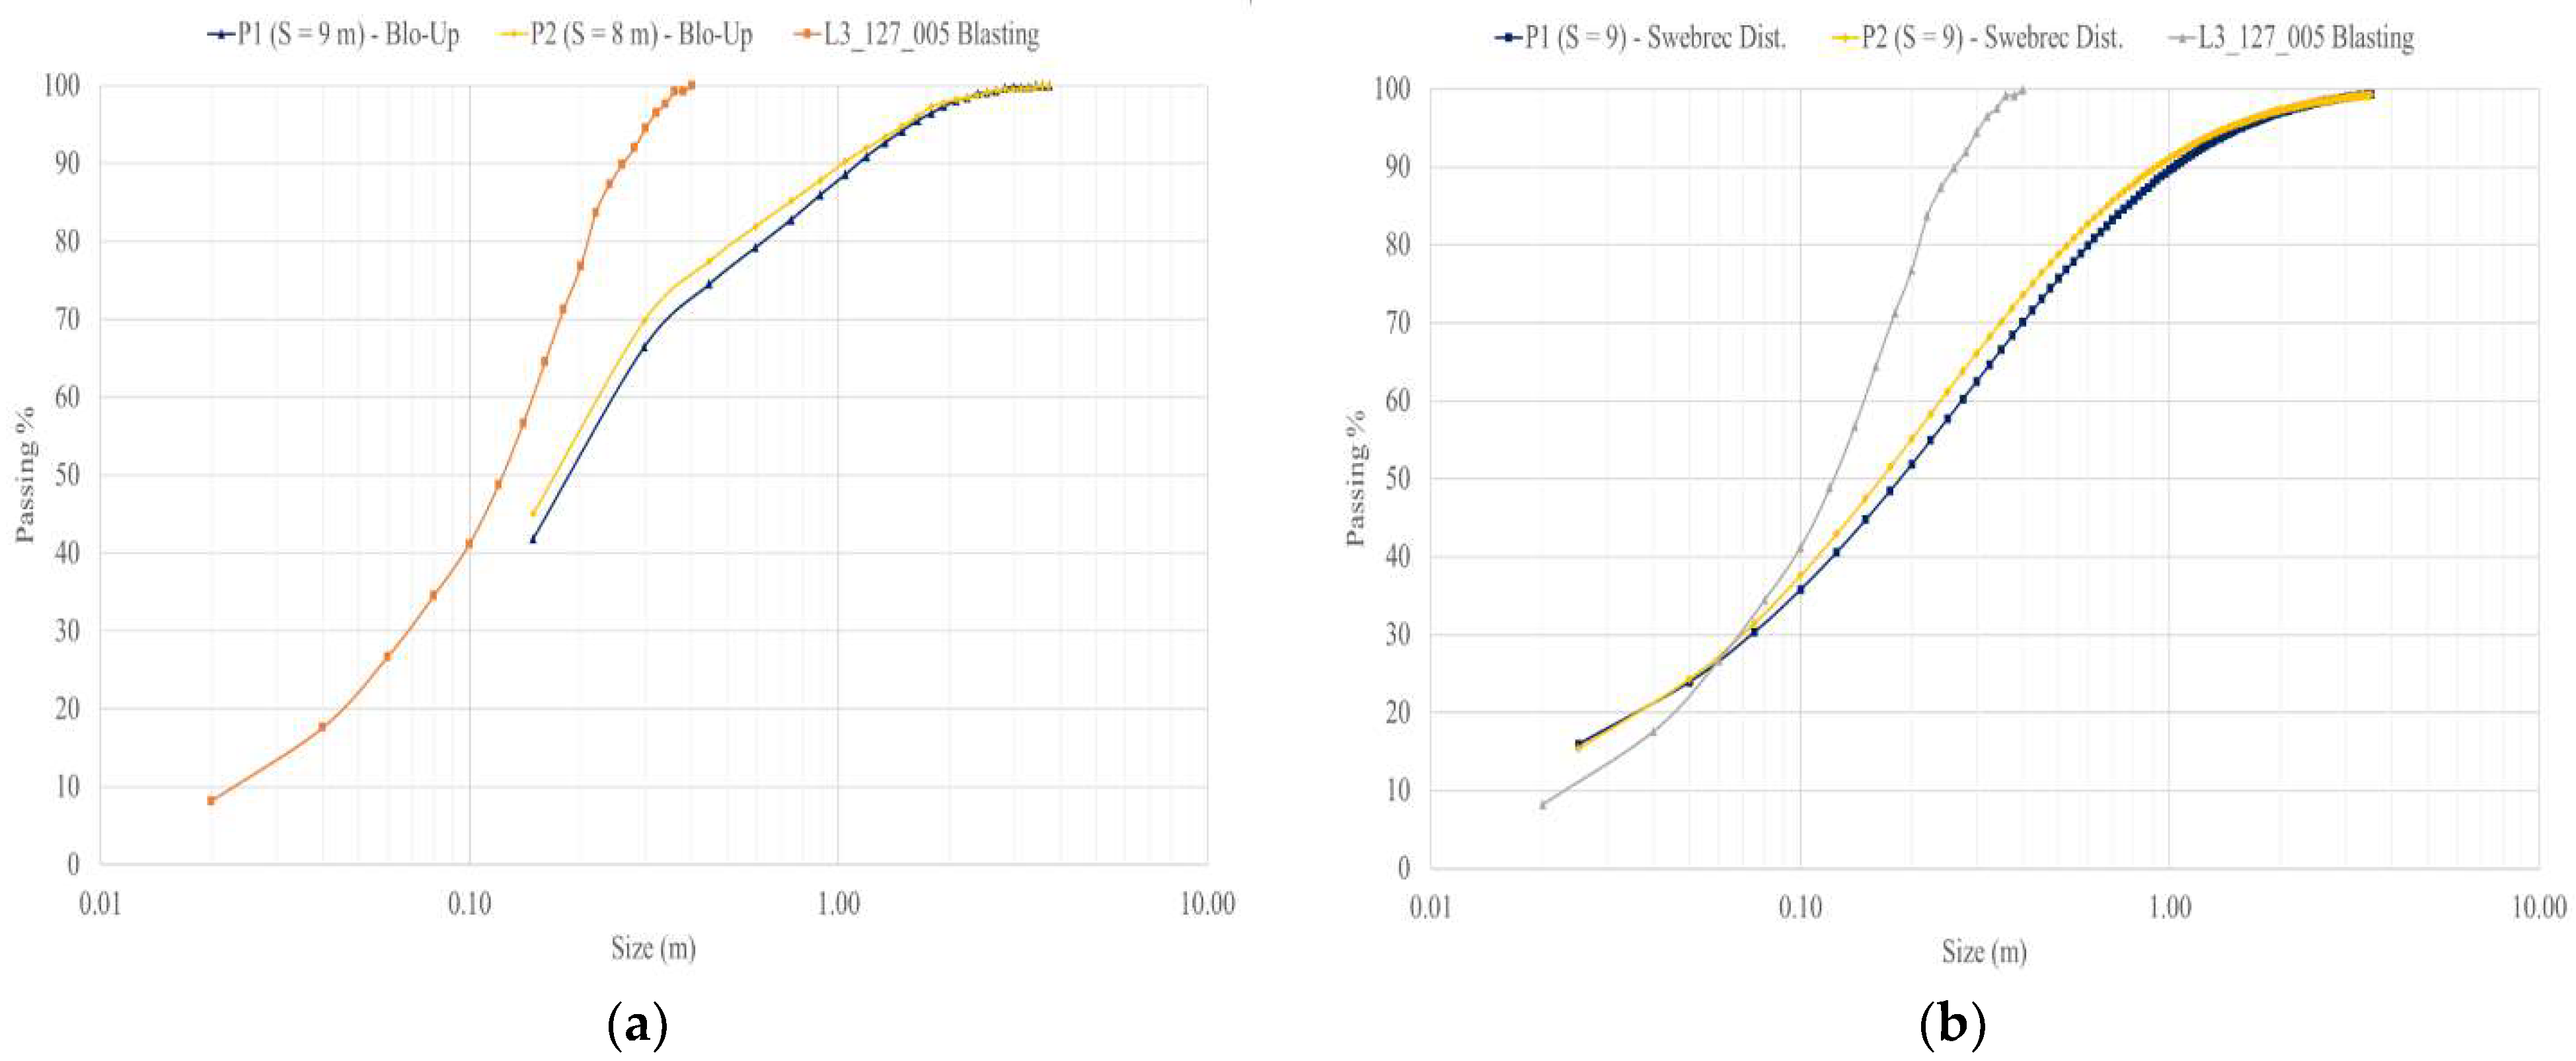
4.4. Optimization Results
Considering the spacing optimization with cases of varying spacing, a constant burden of 6 m, and a charge length of 10.5 m for each blasthole, large models P1 and P2, with spacings of 9.0 m and 8.0 m, respectively, had a runtime of 550.0 ms (30 blastholes).
Figure 12 shows the PSD results for each model.
From the PSD, model P2 achieved the best P80 of ~0.53 m, which was close to the desired P80. This result was obtained with a drilling pattern of 6.0 m of burden and 8.0 m of spacing and with the same charges per blasthole as blasting design L3_127_005.
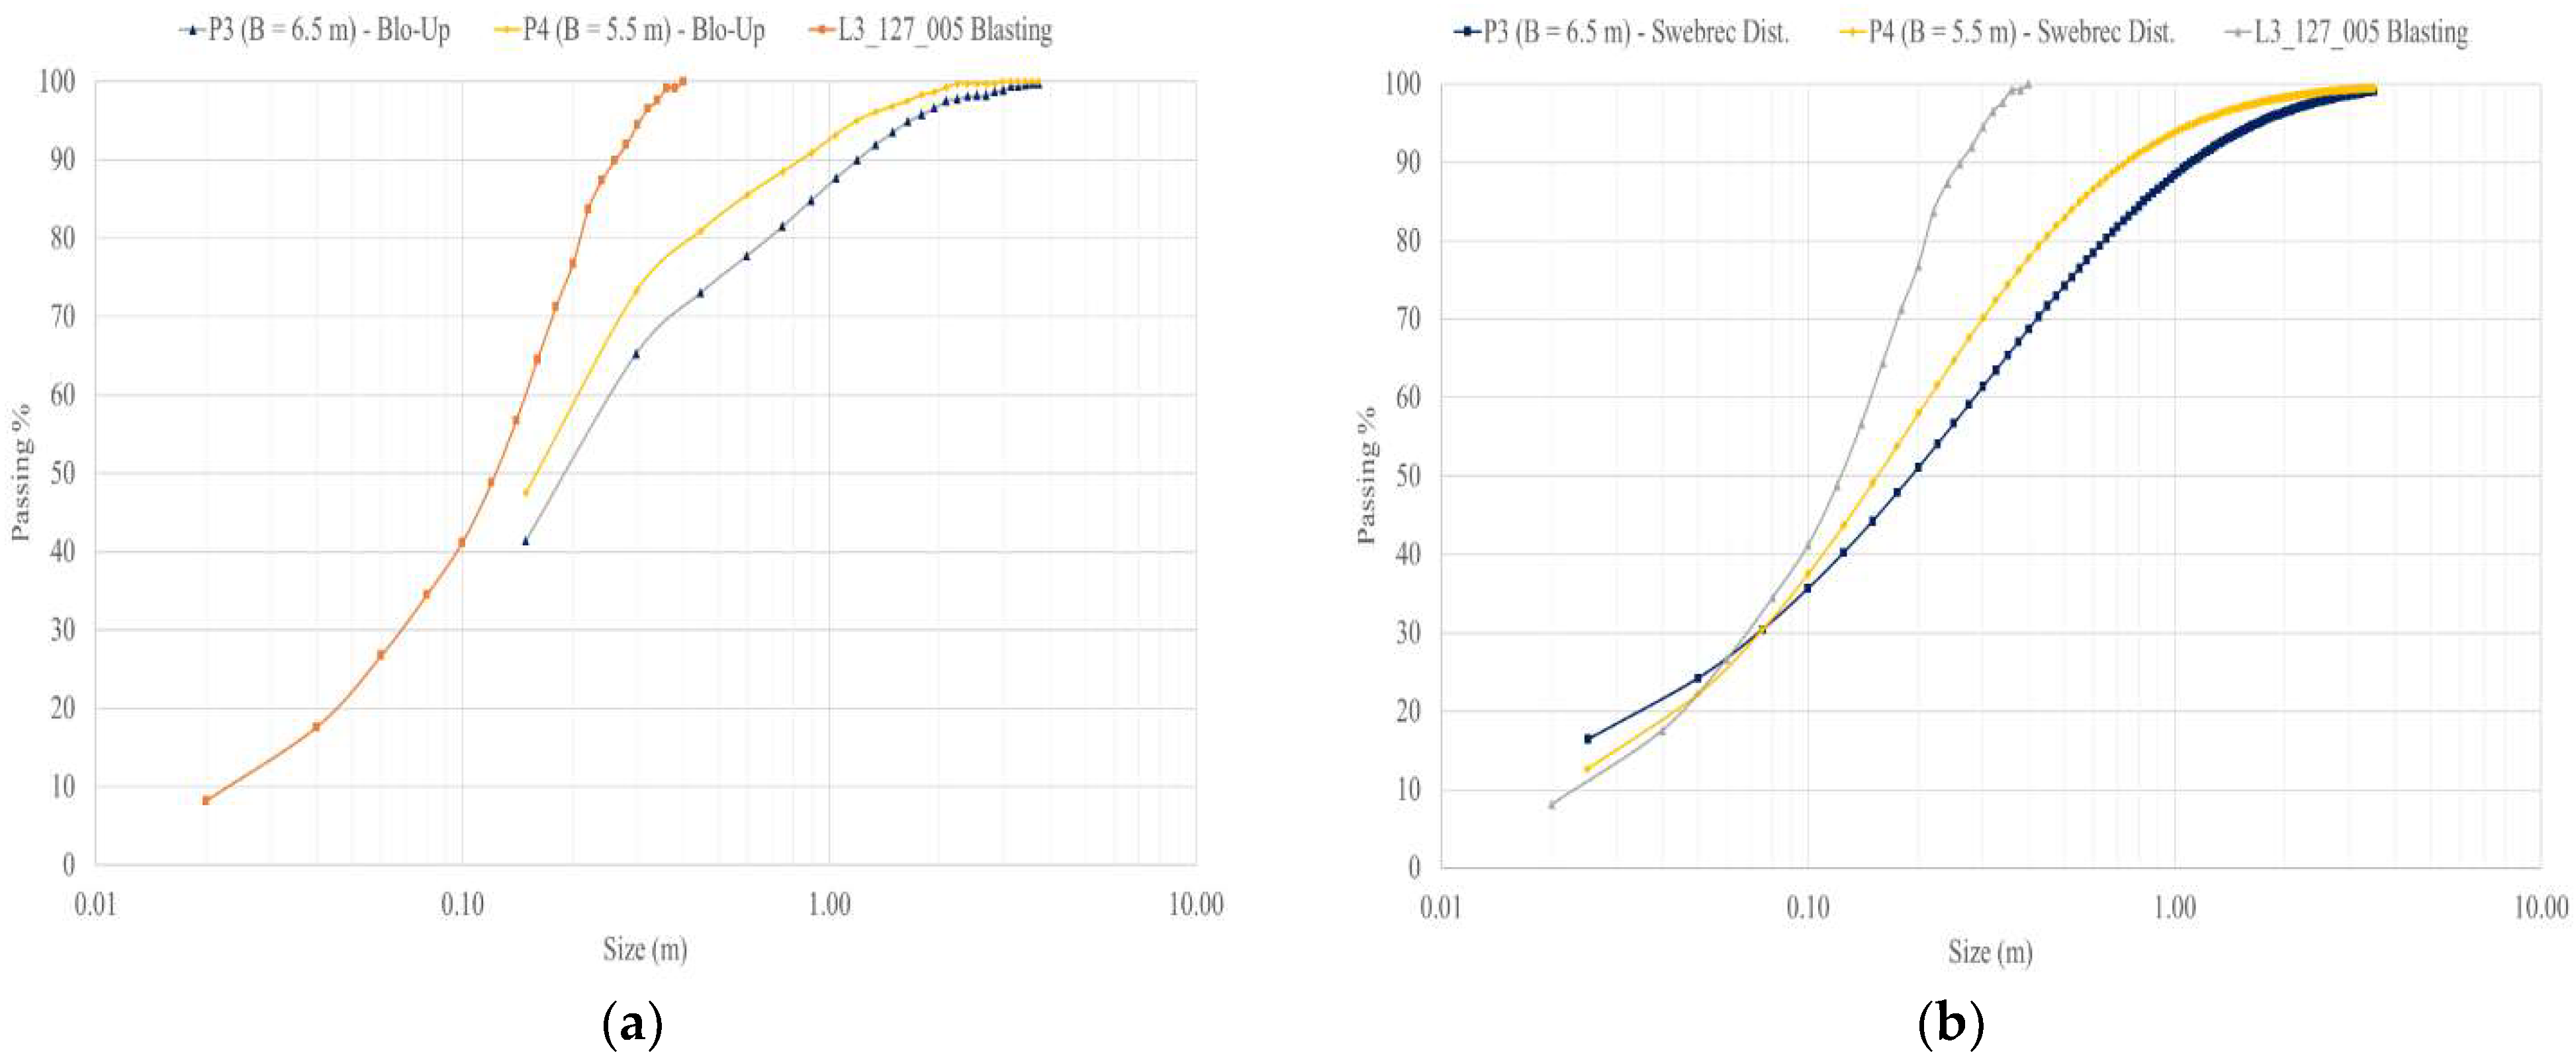
For the burden optimization, cases P3 and P4 had different burdens, a spacing of 8.0 m and a charge length of 10.5 m. Models P3 and P4 had burdens of 6.5 m and 5.5 m, respectively, and the results are shown in
Figure 13.
The results of burden optimization failed to achieve P80~0.55 m, and model P3 had a coarse size distribution; on the other hand, the P4 model shows finer results than expected. This finding indicates that a burden of 6 m is enough to achieve the desired P80 of 0.55 m.
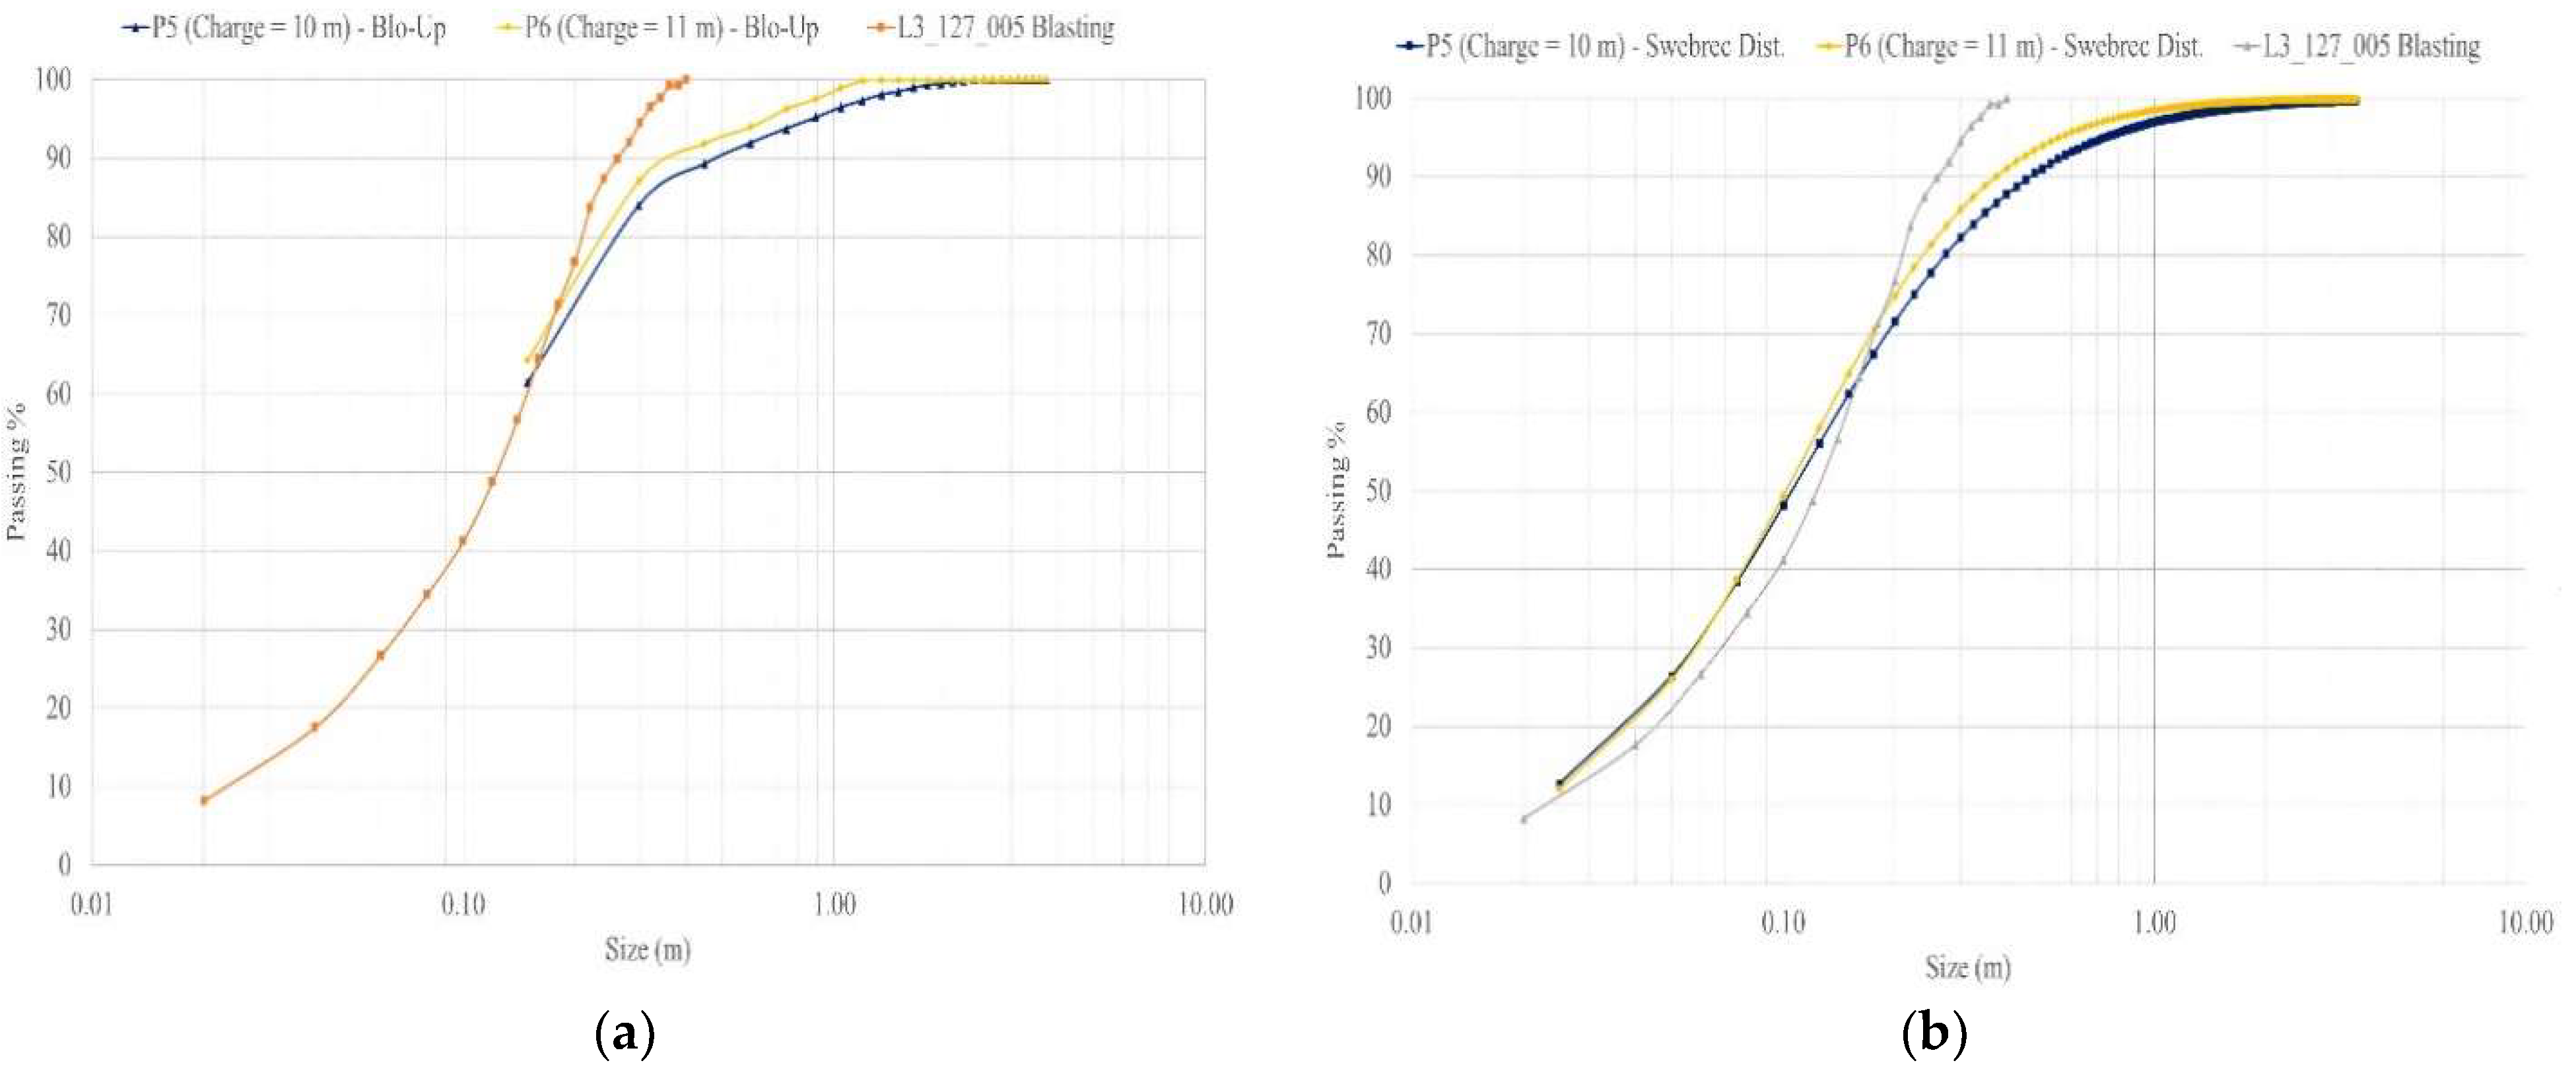
Finally, the charge length optimization considered the P5 models with burden and spacing maintained at 5.0 m and 5.6 m and charge lengths of 10.0 m and 11.0 m, respectively. The results of the charge length optimization are shown in
Figure 14.
The charge length optimization results show that a finer PSD can be obtained that does not approach the desired target of P80~0.55 m. Compared with the other optimized models, P5 and P6 were not better in terms of performance.
The P80 of the optimized model indicates that the best case is model P2, with a P80 of ~0.53 m, the closest value to the desired P80. This was optimized with a blasting design with a burden of 6.0 m and spacing of 8.0 m.
5. Conclusions
In this study, a Blo-Up model was constructed to optimize fragmentation from blasting in the BDX lithology of the study area to achieve a desired P80 of 0.55 m. Through historical data, observations of a blasting example (L3_127_005), and a predictive analysis, the parameters were calibrated.
Regarding the calibration, the best case had a P80 of 0.25 m, and a total error of 4% was obtained when comparing the best fitted Swebrec distribution and the Blo-Up data with the data from the L3_127_005 blasting. For the optimization process, some assumptions were made to better represent the rock mass conditions under vibration and blasting.
Based on the results of the blasting optimization applied for the copper mine in hard rock, the recommended blasting design for BDX must follow the P2 model, with a burden of 6.0 m, spacing of 8.0 m, borehole diameter of 12¼”, hole length of 16.0 m, gravel stemming of 5.5 m, charge length of 10.5 m, and subdrill length of 1.0 m, considering the explosive Fortis Advantage 70/100 [
25] with a blast sequence of 5.0 ms between holes and 75.0 ms between rows. It is suggested that future works execute this optimal bast design on an industrial scale to validate the PSD of rock fragmentation reached in this work.
Author Contributions
Conceptualization, V.F.N.T., C.C., M.E.V., J.R.F. and L.G.C.S.; Methodology, V.F.N.T., C.C., M.E.V. and L.G.C.S.; Validation, V.F.N.T., J.R.F. and L.G.C.S.; Data Curation, C.C. and M.E.V.; Original Draft Preparation, C.C. and M.E.V.; Writing, Review and Editing, C.C.; M.E.V. and J.R.F.; Supervision V.F.N.T. All authors have read and agreed to the published version of the manuscript.
Funding
This research received no external funding.
Institutional Review Board Statement
Not applicable.
Informed Consent Statement
Not applicable.
Data Availability Statement
Not applicable.
Acknowledgments
The authors would like to thank the Vale Institute of Technological, Vale S.A. and Walm Engenharia e Tecnologia Ambiental for the material resources for the preparation of this study and Itasca Chile for providing the data.
Conflicts of Interest
The authors declare no conflict of interest.
References
- Ozdemir, B.; Kumral, M. A system-wide approach to minimize the operational cost of bench production in open-cast mining operations. Int. J. Coal Sci. Tech. 2019, 6, 84–94. [Google Scholar] [CrossRef]
- Gadikor, J. Optimization of Drilling and Blasting Practices at a Western US Open Pit Copper Mine. Master’s Thesis, University of Montana, Butte, MT, USA, 2018. [Google Scholar]
- Park, J.; Kim, P. Use of drilling performance to improve rock-breakage efficiencies: A part of mine-to-mill optimization studies in a hard-rock mine. Int. J. Min. Sci. Tech. 2020, 30, 179–188. [Google Scholar] [CrossRef]
- Zhang, Z.X.; Qiao, Y.; Chi, L.Y.; Hou, D.F. Experimental study of rock fragmentation under different stemming conditions in model blasting. Int. J. Rock Mech. Min. Sci. 2021, 143, 104797. [Google Scholar] [CrossRef]
- Singh, P.K.; Roy, M.P.; Paswan, R.K.; Sarim, M.D.; Kumar, S.; Jha, R.R. Rock fragmentation control in opencast blasting. J. Rock Mech. Geotech. Eng. 2016, 8, 225–237. [Google Scholar] [CrossRef]
- Majid, A.; Gholamreza, L.; Alireza, Y.B.; Mohammada, G. Blastability evaluation for rock mass fragmentation in Iran central iron ore mines. Int. J. Rock Mech. Min. Sci. 2015, 25, 59–66. [Google Scholar]
- Ke, B.; Pan, R.; Zhang, J.; Wang, W.; Hu, Y.; Lei, G.; Chi, X.; Ren, G.; You, Y. Parameter optimization and fragmentation prediction of fan-shaped deep hole blasting in Sanxin gold and copper mine. Minerals 2022, 12, 788. [Google Scholar] [CrossRef]
- Leng, Z.; Fan, Y.; Gao, Q.; Hu, Y. Evaluation and optimization of blasting approaches to reducing oversize boulders and toes in open-pit mine. Int. J. Min. Sci. Tech. 2020, 30, 373–380. [Google Scholar] [CrossRef]
- Amoako, R.; Jha, A.; Zhong, S. Rock fragmentation prediction using an artificial neural network and support vector regression hybrid approach. Mining 2022, 2, 233–247. [Google Scholar] [CrossRef]
- Ouchterlony, F.; Sanchidrián, J.A. A review of development of better prediction equations for blast fragmentation. J. Rock Mech. Geotech. Eng. 2019, 11, 1094–1109. [Google Scholar] [CrossRef]
- Coello-Velázquez, A.L.; Quijano Arteaga, V.; Menéndez-Aguado, J.M.; Pole, F.M.; Llorente, L. Use of the Swebrec function to model particle size distribution in an industrial-scale Ni-Co ore grinding circuit. Metals 2019, 9, 882. [Google Scholar] [CrossRef]
- Tang, J.; Tan, X.; Li, X.; Wei, B.; Wang, Z.; Zheng, C. Research on edge detection algorithm based on line laser scanning. Procedia 2019, 84, 1101–1106. [Google Scholar] [CrossRef]
- Wang, Y.; Tu, W.; Li, H. Fragmentation calculation method for blast muck piles in open-pit copper mines based on three-dimensional laser point cloud data. Int. J. Appl. Earth Obs. Geoinf. 2021, 100, 102338. [Google Scholar] [CrossRef]
- Toriya, H.; Tungol, Z.P.L.; Ikeda, H.; Owada, N.; Jang, H.D.; Adachi, T.; Kitahara, I.; Kawamura, Y. Fragmentation size distribution measurement by GNSS-aided photogrammetry at real mine site. Mining 2022, 2, 438–448. [Google Scholar] [CrossRef]
- Rosin, P.; Rammler, E. The laws governing fineness of powdered coal. J. Inst. Fuel. 1933, 7, 29–36. [Google Scholar]
- Rodríguez, B.A.; García, G.G.; Coello-Velázquez, A.L.; Menéndez-Aguado, J.M. Product size distribution function influence on interpolation calculations in the Bond ball mill grindability test. Int. J. Miner. Process. 2016, 157, 16–20. [Google Scholar] [CrossRef]
- Ouchterlony, F. Fragmentation characterization; the Swebrec function and its use in blast engineering. In Fragblast 9, Proceedings of the 9th International Symposium on Rock Fragmentation by Blasting, Granada, Spain, 13–17 August 2009; Taylor and Francis: Oxfordshire, UK; pp. 3–22.
- Castro, C.; Valencia, M.E. Optimizing Blast Fragmentation in Salobo Mine, Report ITASCA-669.004.04; Itasca Chile: Santiago de Chile, Chile, 2020. [Google Scholar]
- Braithwaite, M.; Sharpe, G. Simulation of real detonations as an energy source term for the hybrid stress blasting model. In Proceedings of the 9th International Symposium on Rock Fragmentation (Fragblast 9), Grenada, Spain, 13–15 September 2009; Sanchidrian, J.A., Ed.; CRC Press: Boca Raton, FL, USA. [Google Scholar]
- Itasca Consulting Group, Inc. Blo-Up User’s Guide, Release 2.7; Minneapolis: Itasca, IL, USA, 2016. [Google Scholar]
- Kapila, A.K.; Bdzil, J.B.; Stewart, B.S. On the structure and accuracy of programmed burn. Combust. Theory. Modell. 2006, 10, 289–321. [Google Scholar] [CrossRef]
- Vale S.A.; WALM, E.T.A. Estudo Geral—Cava da Mina Elaboração Modelo Geomecânico da Cava Relatório Final do Modelo Geomecânico Relatório Técnico, RL-1000SA-X-00008; Vale S.A.: Marabá, Brazil, 2019; Unpublished work. [Google Scholar]
- Hoek, E.; Diederichs, M.S. Empirical estimation of rock mass modulus. Int. J. Rock Mech. Min. Sci. 2006, 43, 203–215. [Google Scholar] [CrossRef]
- Orica. Relatório de Desmonte L3_127_005_R00; Vale S.A.: Marabá, Brazil, 2019; Unpublished work. [Google Scholar]
- Orica. Fortis™ Advantage System. Technical Data Sheet. Available online: http://www.oricaminingservices.com/cn/en/product/products_and_services/bulk_systems/page_bulk_systems/fortan_advantage/43 (accessed on 12 July 2022).
| Publisher’s Note: MDPI stays neutral with regard to jurisdictional claims in published maps and institutional affiliations. |
© 2022 by the authors. Licensee MDPI, Basel, Switzerland. This article is an open access article distributed under the terms and conditions of the Creative Commons Attribution (CC BY) license (https://creativecommons.org/licenses/by/4.0/).


 ,
, 
