5.2. The Usability Landscape (RQ1)
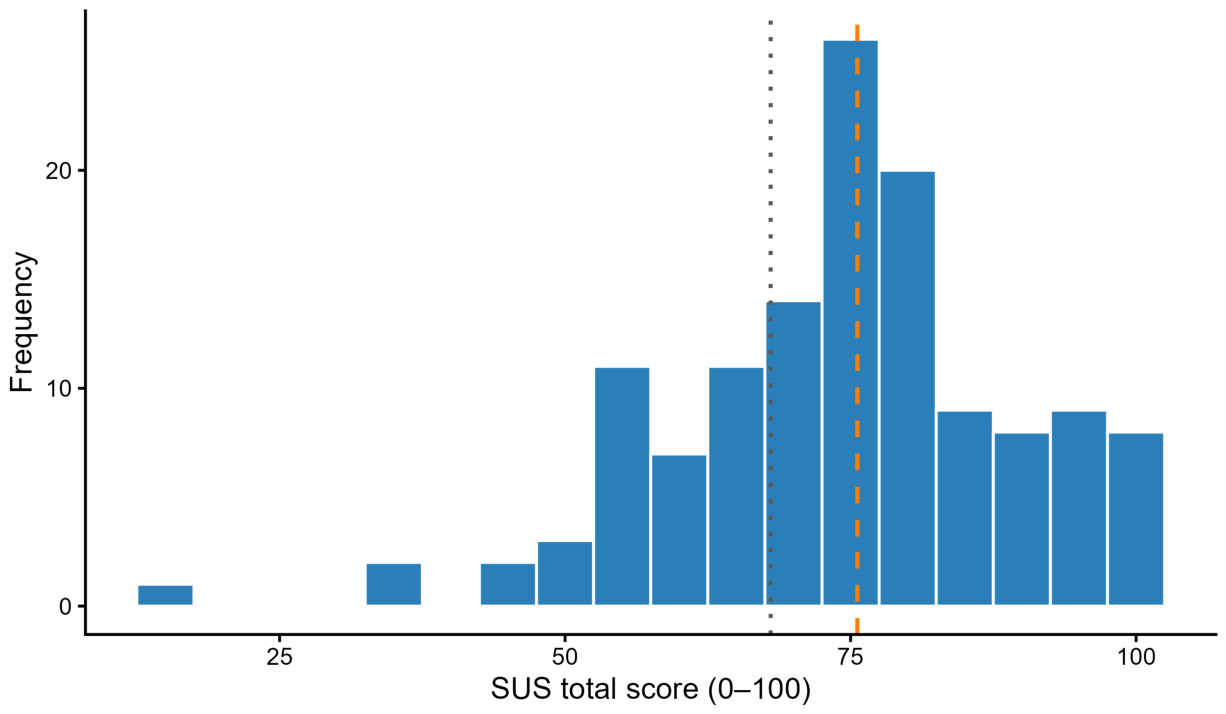
Most students perceived VLEPIC as usable and easy to navigate. On average, the SUS score was 75.59 (SD = 14.82), with a median of 75. Interpreted against established SUS benchmarks, the mean score of 75.59 is above the commonly reported average benchmark and falls within an acceptable-to-good usability range [
62]. Internal consistency was also examined, with results indicating adequate reliability (α = 0.839; ω = 0.884).
Table 3 shows the results for each SUS item.
Figure 7 illustrates that most of the scores are in the mid-to-high range. Only a small number of students reported low scores, indicating that the overall usability experience was generally positive.
Item-level results provide further insight into students’ perceptions. Most students responded positively to the integration of system functions (M = 4.22) and the system’s learnability (M = 4.05). They also reported confidence in using the system (M = 4.02) and considered that the interface was simple (M = 3.98).
On the other hand, negatively worded items received low scores, which is positive for the general usability of the VLE. Students did not perceive the system as too complex (M = 2.02) or inconsistent (M = 1.92). They also reported limited need for technical assistance (M = 2.02), and the overall experience was not perceived as cumbersome (M = 1.85), as shown in
Table 3.
The results suggest that usability issues did not affect the system globally. Instead, they were mainly concentrated in the early stages of interaction. For the qualitative analysis, open-ended responses were coded using the SUS items as an analytical guide. In total, 108 students provided comments, which yielded 256 coded segments. As shown in
Table 4, most of these comments were general opinions or reflections on how students progressed. However, there was also a smaller group of comments specifically about the difficulties or friction points encountered while using the platform.
At the category level, General appraisal indicated favourable perceptions of VLEPIC. For example, one student said, “For me, the whole application was easy to use, and I would not improve anything because it is fine” (SS36) and another wrote, “I would not change anything; everything is very nice and easy” (SS29). Regarding Discoverability and IA, students said the dashboard and menus were easy to follow: “The main menu had several options, and they were very easy to understand” (SS116).
The Onboarding and learnability category showed that some students had problems at the start but found it easier after exploring the platform. One student mentioned, “Everything seemed somewhat complicated at the beginning, but once I explored it, it became easy” (SS104) and another said, “Logging in was difficult because I did not know how to access it” (SS9). The comments also indicated that having help in Spanish was essential: “I really liked the help in Spanish” (SS115).
In terms of Interaction comprehensibility, most students understood the activities, but a few reported difficulties with specific tools: “The videos were difficult because I did not understand them” (SS126). Task workflow also had some minor difficulties, especially with submitting work: “Submitting tasks was a bit confusing at the beginning” (SS70) and “It was hard for me to see the grades” (SS2).
Finally, the Engagement and progression category showed that students responded positively to the missions and rewards: “I really like the missions because I go at my own pace” (SS33). Students also suggested future improvements, including: “I would improve it so that when we move to the next mission, the page does not reload” (SS69) and “I would like there to be less text and more integrated graphics” (SS62). Overall, these comments suggest that the difficulties were mainly concentrated in the initial stages and did not indicate confusion with the system as a whole.
5.3. Characterising the UX (RQ2)
UX was analysed through the five GAMEX dimensions, as shown in
Table 5. Most of the scores were in the mid-to-high range, particularly for enjoyment and activation. The highest score was for Activation (M = 3.33), while the lowest was for Absence of negative affect (M = 2.94). Internal consistency estimates indicated acceptable reliability across the dimensions (α = 0.81; ω = 0.81).
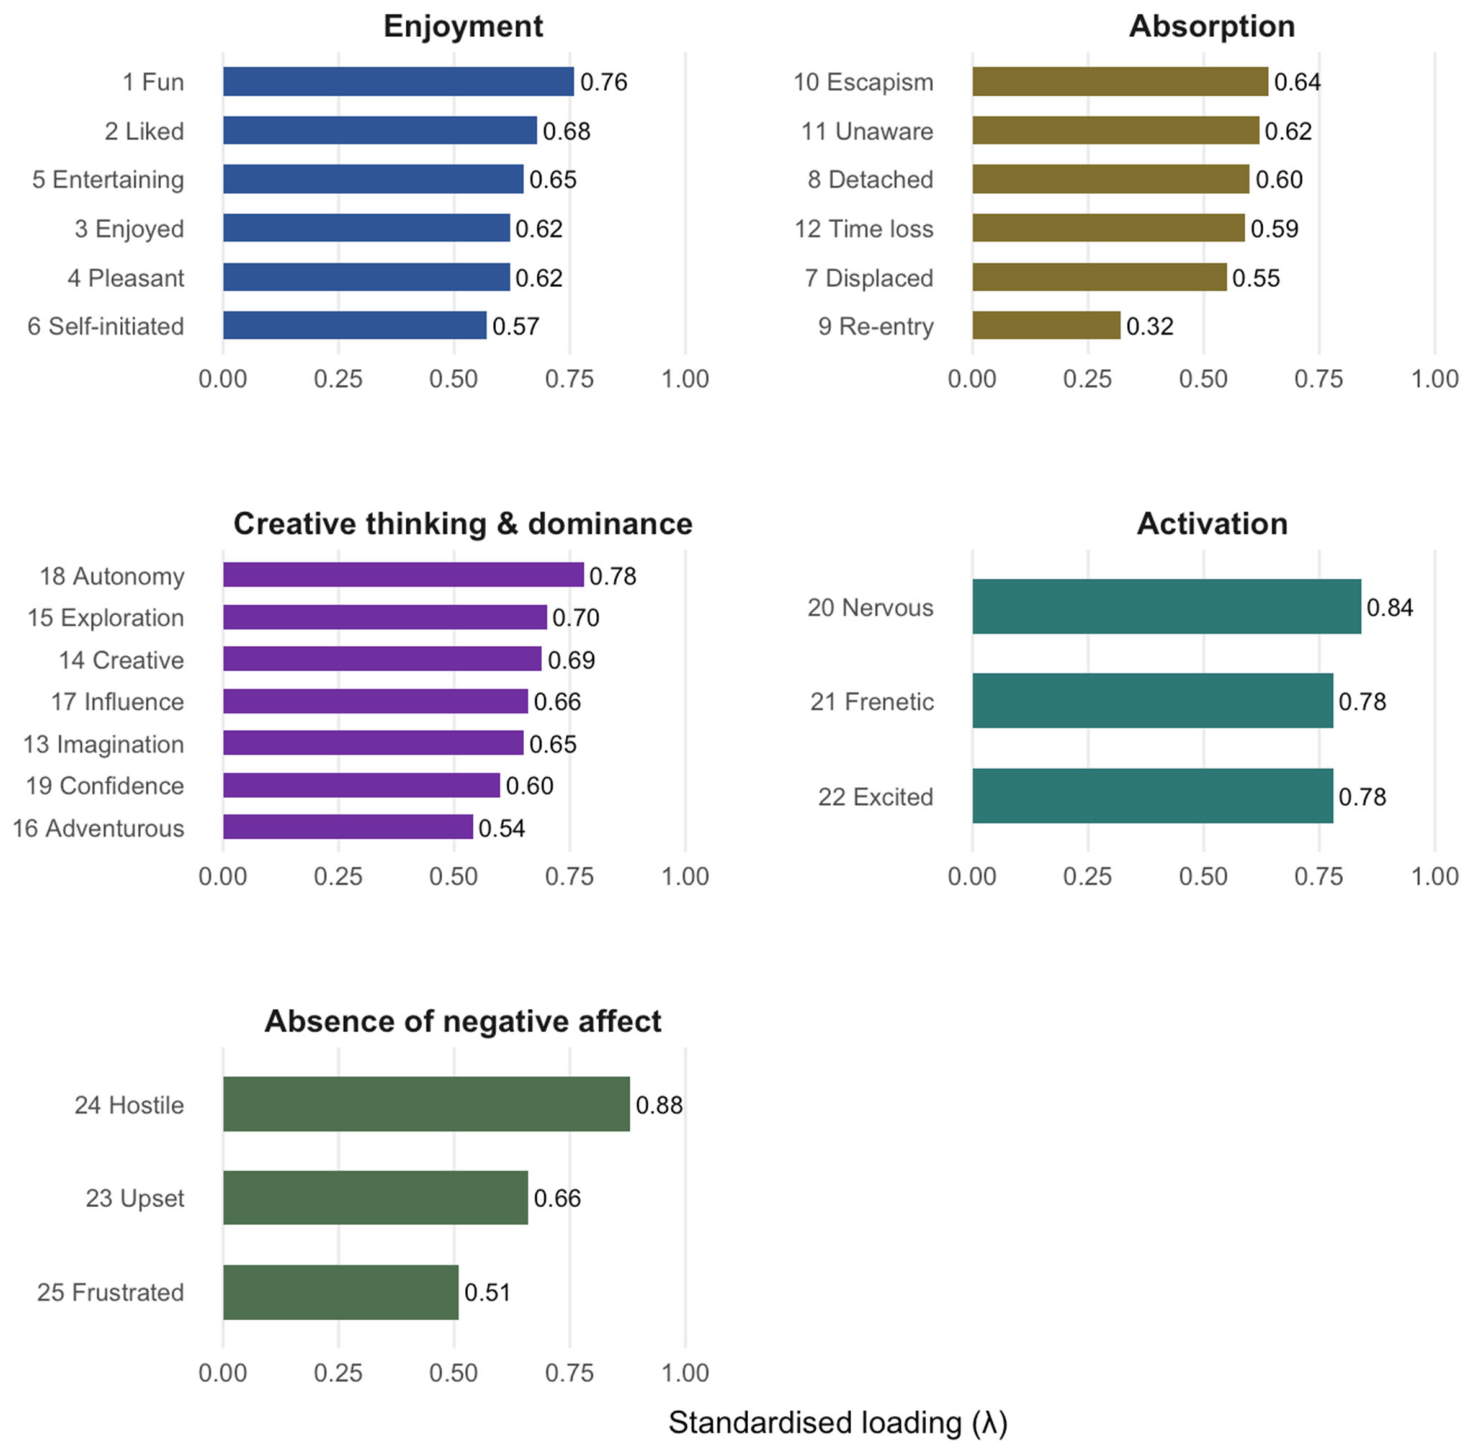
A CFA was performed using the GAMEX items according to the five-factor structure. The standardised loadings (λ) indicated how well each item represented its corresponding factor. The five-factor model showed an acceptable overall fit (scaled χ2 (265) = 311.54, p = 0.026; CFI = 0.958; TLI = 0.952; RMSEA = 0.037; SRMR = 0.076). The significant chi-square value indicates that the model did not reach a perfect fit; however, the remaining indices support an acceptable interpretation of the model, so the results were interpreted cautiously. Activation showed strong and consistent loadings (λ = 0.78–0.84), although the “Nervous” item had the lowest loading within this dimension.
Absorption showed more varied loadings (λ = 0.32–0.64). “Escapism” (λ = 0.64) and “Unaware” (λ = 0.62) had the highest loadings in this dimension, while “Re-entry” had the lowest loading (λ = 0.32). The item was retained because re-entry is theoretically relevant to the IxD of VLEPIC, where students often return to the platform after interruptions to resume tasks and continue the mission sequence. However, its lower loading suggests that re-entry may function more as a task-continuity and recovery feature in this context than as a strong indicator of Absorption. Creative thinking and dominance also showed varied loadings (λ = 0.54–0.78), with “Autonomy” (λ = 0.78) and “Exploration” (λ = 0.70) showing the highest values. “Confidence” (λ = 0.60) and “Adventurous” (λ = 0.54) were lower, although still adequate for retention in the model.
Figure 8 shows all standardised loadings (λ).
At the same time, perceived personalisation scores were above the scale midpoint (M = 3.79, SD = 0.57), as seen in
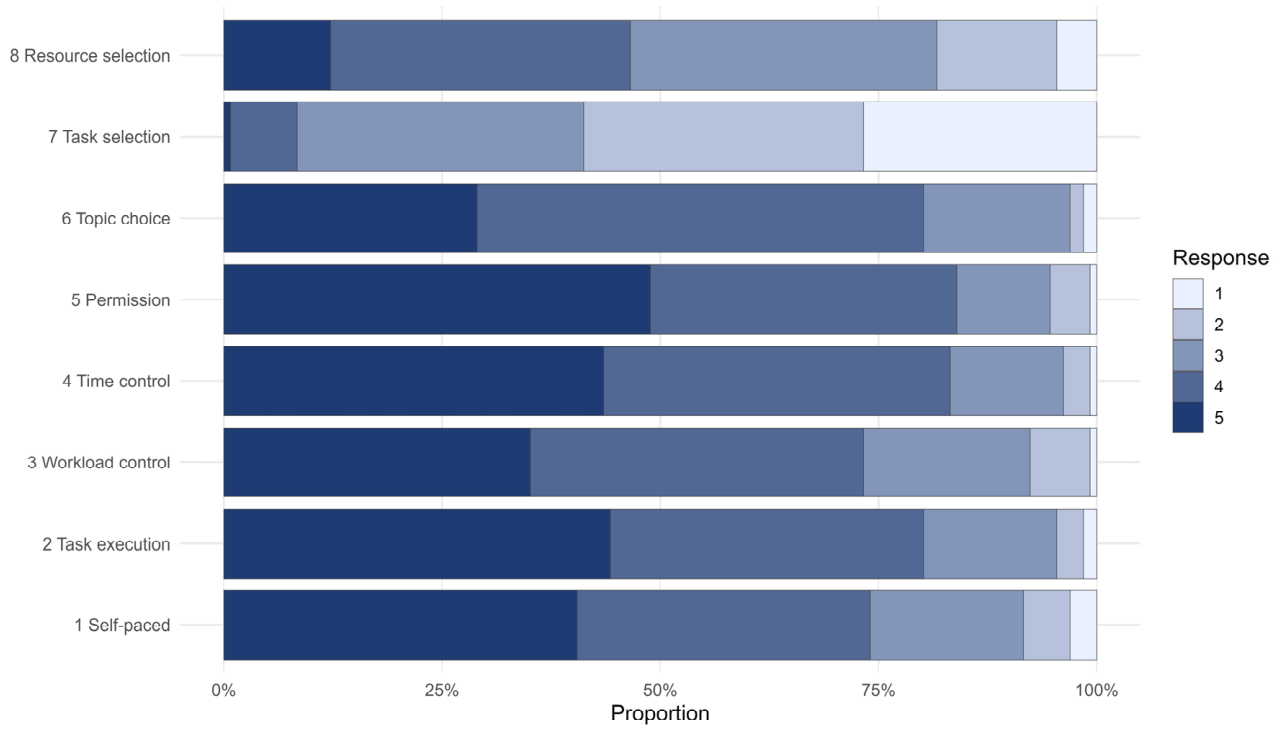
Table 6. Item-level results in
Figure 9 indicate that this high score was mainly driven by perceptions of autonomy and self-management. For items 1 to 6, the averages were high (M = 4.00–4.27). Specifically, between 73% and 84% of students gave the highest ratings, with limited disagreement across these items. However, task selection was the weakest aspect (item 7; M = 2.24). Most students disagreed with this item, indicating that perceived choice remained limited. Resource selection showed a more balanced pattern (item 8; M = 3.36); many students were neutral, while others agreed. Overall, these results suggest that for these students, personalisation meant having control over their pace and how they approached the activities, instead of being able to choose the actual tasks.
To complement the quantitative results, 94 students provided feedback in the open-ended question of GAMEX. These responses were divided into 140 segments for analysis. By using a deductive approach, we applied five specific codes to these comments, which are summarised in
Table 7.
Playful engagement mainly concerned with how much students enjoyed the different game-like activities. For instance, one student commented: “I liked that it has many options to speak, write, listen, and answer questions through games” (SG43), while another said: “Doing the sentences was fun, and I did not get bored while using VLEPIC” (SG12). Regarding the Progression loop, the comments emphasised how seeing rewards and progress kept them motivated: “When I learnt and got achievements, it motivated me to keep completing each mission” (SG113).
The Learning value category linked the students’ experience to their perceived progress in the language. Comments included: “Through its missions I learnt new words and how to pronounce them well” (SG102). Although Social collaboration and competition appeared less often, it reflected the effort to improve rankings: “It motivates me to beat my record and improve my position on the leaderboard” (SG115).
5.4. Behavioural Patterns (RQ3)
Data from GA4 (October–December 2025) suggested episodic clusters around specific tasks, instead of showing daily use. Since GA4 was configured for the entire site and not for specific class groups, the metrics show general traffic based on devices and cookies. Once students logged in, they were redirected to the Explorer Dashboard. However, in the reports, most of this activity is grouped under the main site address (/), which is also the public home page. Accordingly, GA4 was treated as site-level contextual evidence. It was used to describe general access and navigation patterns, not to reconstruct individual learning trajectories, class-level participation, or Expedition-specific behaviour.
Across 2807 sessions, most traffic came from Organic Search (75.06%) and Direct sources (24.72%). While the engagement rate was high (86.89%), the time spent per session was brief, averaging 46 s. Although sessions were short, they were highly active, with about 12 events per session. This suggests that students visited the site to perform specific, quick actions, although these data do not allow users’ exact intentions to be inferred.
At the page level, activity was highly concentrated: the login page and the site root dominated the reports, accounting for 8948 views across the two top routes.
Table 8 illustrates this density: the login page accounted for 52.2% of views, while the site root accounted for 47.1%. The GA4 user counts should be interpreted as route-level traffic indicators, not as the number of participating students, because authenticated participation was verified through the internal platform logs. Overall, these patterns suggest that most activity occurred within the main interface and did not involve movement across many different pages in GA4.
To complement the web analytics trends, platform logs were examined to describe students’ mission-related activity. Two log sources were used: AL to identify logins and uploads, and GP to examine XP and game events. We did not link the logs to specific names across the different files; therefore, the analysis was conducted at the cohort level.
Table 9 shows that 131 users logged in 856 times. The logs also recorded 1317 submitted tasks by 125 different students. This indicates that nearly all registered students submitted at least one task. The number of uploaded files matched the number of submitted tasks, which suggests active production and submission beyond passive on-screen reading.
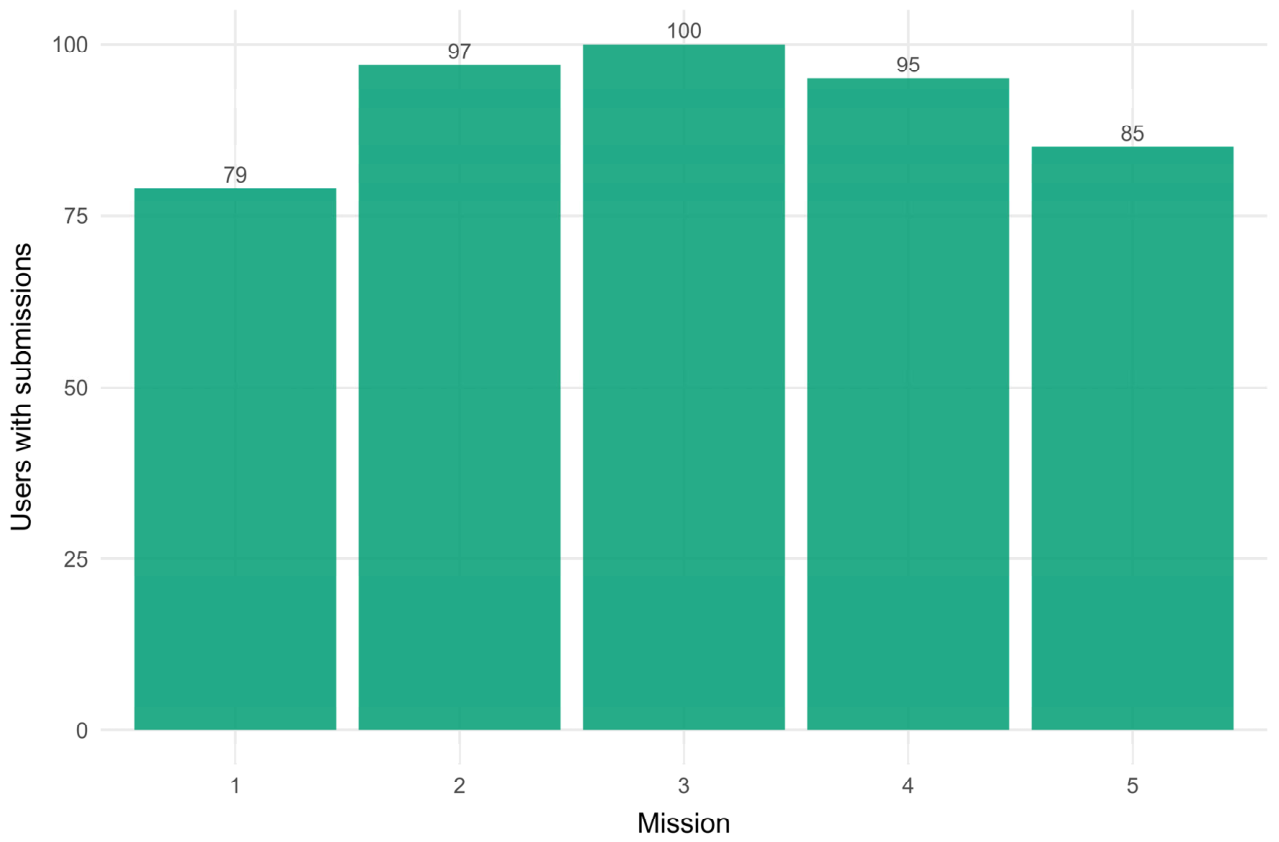
Participation was maintained through the middle of the sequence. As shown in
Figure 10, the number of unique users who submitted at least one task across Quest 1 (Q1) and Quest 2 (Q2) increased from Mission 1 (M1, n = 79) to Mission 3 (M3, n = 100), and then declined in Mission 4 (M4, n = 95) and Mission 5 (M5, n = 85). This suggests that participation remained stable during the central part of the sequence, with a clearer decline only towards the end. This pattern indicates that initial access to the mission sequence was not the main barrier, because the number of unique submitters increased from M1 to M3. The later decline from M3 to M5 points instead to a continuity issue near the end of the sequence, where learners may require clearer completion cues and stronger support to sustain participation until the final mission.
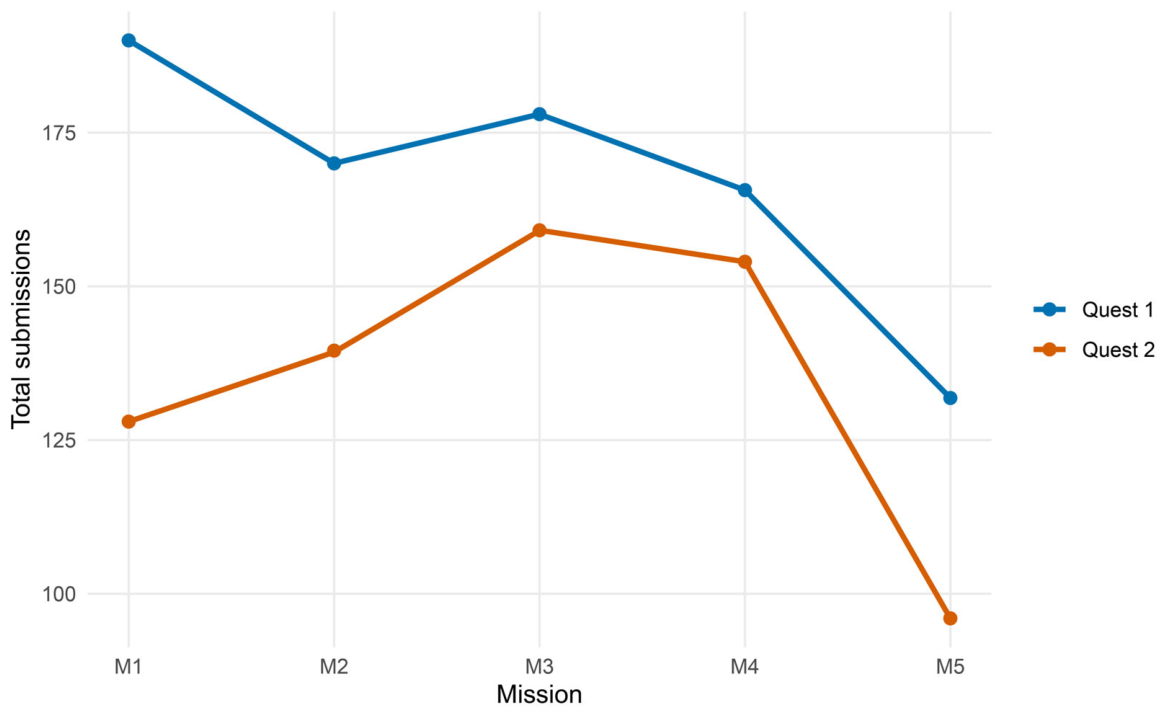
Figure 11 shows how submission volume fluctuated from M1 to M4, but then it declined markedly in M5. In each mission, students submitted more assignments for Q1 than for Q2. This difference was smaller in M4, but in M5, the number of submissions for both quests dropped, and Q2 had the largest decrease.
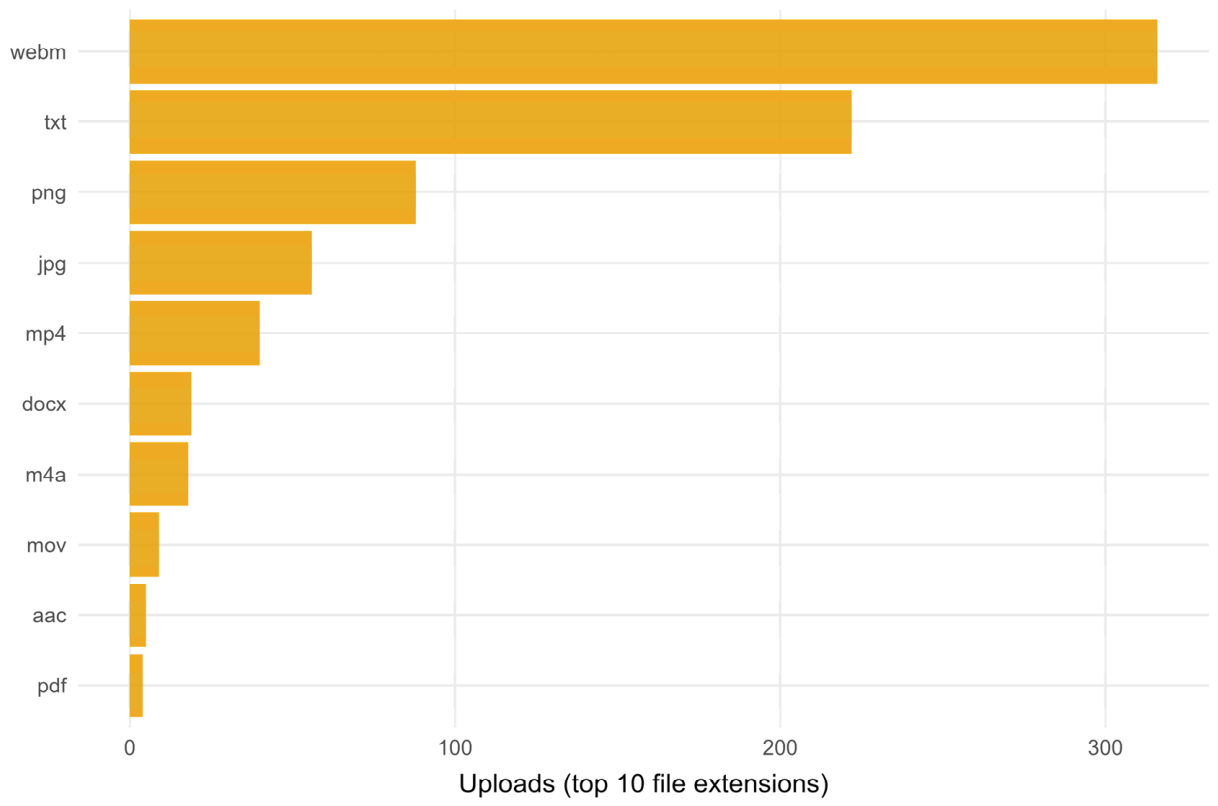
Regarding the types of files students uploaded,
Figure 12 shows that most were .webm and .txt. This pattern reflects the task design and file-saving mechanism. For example, speaking tasks were recorded directly in the VLE and saved as small .webm files. By contrast, writing tasks automatically created text files (.txt).
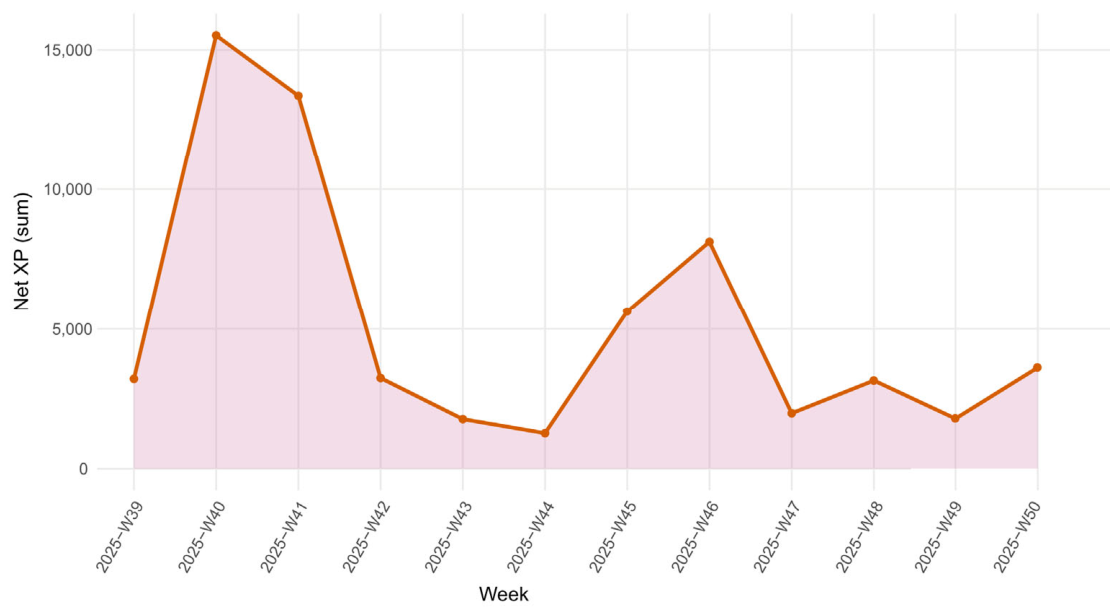
Gamification data also showed how XP accumulated during the study period. A total of 54,584 XP points was accrued, as shown in
Table 9.
Figure 13 shows that XP accrual peaked at specific points during the study period. There was a peak around Week 40 and Week 41 of 2025. After that, the activity decreased sharply, with only a further modest increase around Week 45 and Week 46. For the rest of the time, from Week 47 to Week 50, activity remained low.
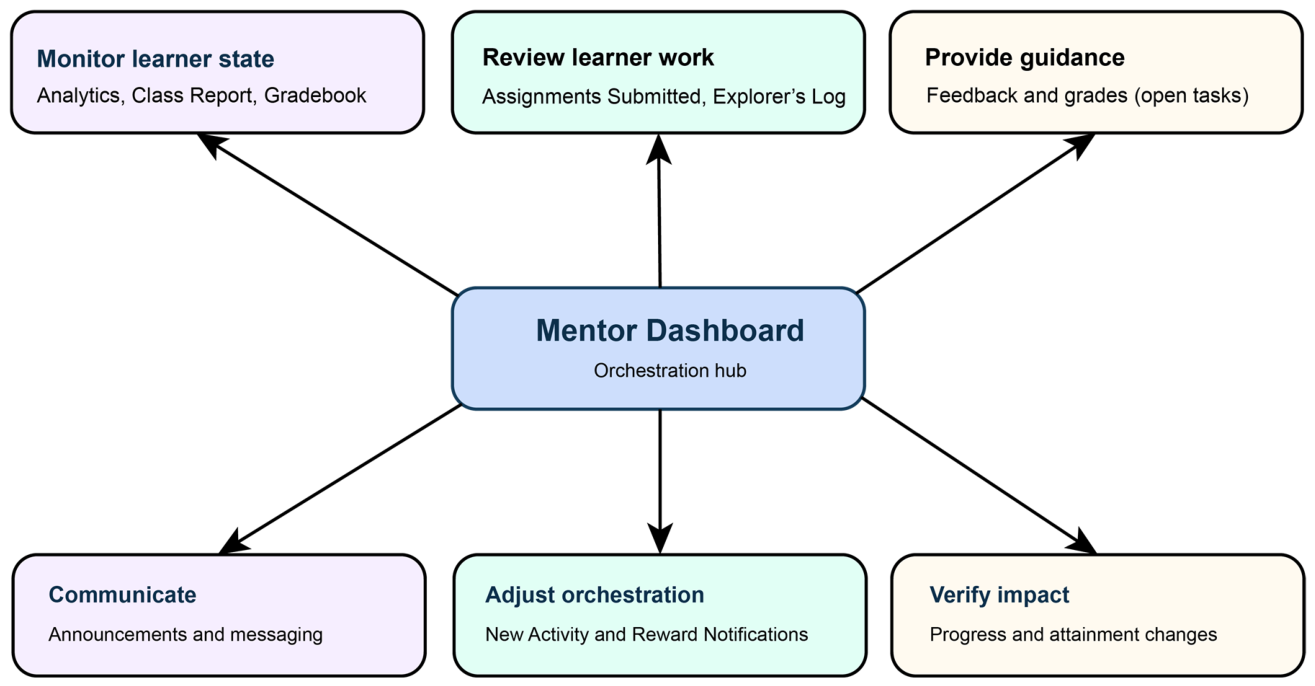
Although teacher evidence was limited, the implementation notes provided useful contextual evidence about the Mentor Dashboard. The teacher described it as “very visual and clear” and explained that “most of the information I need is in one place”, which made it practical to use during class. It was also helpful for tracking student progress, as the teacher noted: “I can see the student’s name, grade, class group, rank, expedition, quest, and mission. This helps me know exactly where each student is.” At the same time, some aspects were less clearly traceable. As one note explained, “I cannot clearly monitor the completion of automatic tasks. I mainly control the open tasks that students submit for review.” Other entries also mentioned the usefulness of the gradebook and announcements in everyday classroom work. Overall, these notes suggest that the dashboard was useful for monitoring and classroom management, although some tasks were easier to track than others.