1. Introduction
Clear aligner therapy relies heavily on bonded composite attachments to enhance retention and optimize the expression of planned tooth movements [
1,
2,
3,
4,
5,
6]. Despite their routine clinical use, the mechanical integrity and long-term stability of these attachments remain critical, as surface degradation or geometric distortion may reduce aligner engagement and compromise biomechanical efficiency. Composite selection is therefore a central yet understudied variable in aligner therapy, particularly because different materials exhibit distinct filler systems, viscosities, polymerization depths, and wear behaviors [
7,
8,
9,
10,
11]. Currently, conventional and bulk-fill composites are available in paste or flow forms. These composites have varying filler compositions and formats, which impact their strength and surface wear characteristics [
10,
11]. Depending on the composite type, surface durability and shape retention may be compromised, directly affecting aligner tracking and, consequently, the efficacy of treatment.
Recent clinical evidence has demonstrated that attachments undergo progressive volumetric wear over the course of aligner therapy [
12], and that a non-negligible proportion of attachments fail during the early phases of treatment—approximately 13.7% within the first six months [
13]. Despite these observations, the literature remains limited with respect to controlled quantification of such wear and its direct relationship with retention force under standardized and reproducible mechanical cycling. Prior studies have examined attachment morphology or reproduction accuracy, but few have provided quantitative volumetric data capable of elucidating how different composite resins degrade under simulated clinically protocols of aligner insertion–removal.
Attachments experience hundreds of insertion–removal cycles each month, and even small volumetric losses have the potential to influence aligner seating, retention, and force delivery. In this context, understanding the influence of the resin type and its mechanical properties is of utmost importance to contribute to an adequate treatment duration, without compromising the effectiveness of tooth movement due to superficial losses that affect the retention of the aligners and the proper engagement of the attachments. The present study aimed at quantifying the volumetric wear of three commonly used composite resins during the first months of orthodontic treatment with aligners (Transbond™ Supreme LV, Filtek™ Bulk Fill Flow, or Filtek™ Z250XT) and to determine whether progressive attachment wear influences aligner detachment forces. The primary hypothesis was that the three composites would exhibit no significant differences in volumetric wear. The secondary hypothesis was that attachment wear would not significantly affect aligner removal force across simulated usage cycles.
2. Materials and Methods
2.1. Sample Size Calculation
Since a novel methodology was adopted for the purpose of the present research, a pilot study was performed using three samples, reproducing all phases of the study described in the methodology, with the standard Filtek™ Z250XT (3M Unitek, Monrovia, CA, USA) as the attachment design material. During the pilot study, a mean surface wear of −0.559 mm3 was encountered (−7.42% of the initial volume), with a standard deviation of 0.180 mm3, and the mean total attachment volume of the samples used was 5.924 mm3. Based on these results, a mean attachment volume loss of 9.43% (SD 0.30%) was found. Therefore, assuming a minimal difference of 10% in surface wear, a Type I error of α = 0.05, and a statistical power of 80%, the minimum required sample size was calculated to be four specimens per group. To maintain adequate power and account for potential sample loss, the planned sample size was increased to six specimens per group.
2.2. Specimen Construction
To create specimens for laboratory tests, intraoral digital scanning images of a real patient were selected and imported into ArchForm 1.9.2 software (ArchForm Inc., San Mateo, CA, USA). After reconstructing the images, the virtual model was sectioned to generate the left hemi-arch image, which included the canine, first and second premolars, and the first and second molars. The image was duplicated to create a hemiarch with an attachment inserted in the vestibular area of the second premolar. The option was to use a hemi-arch primarily because patients typically press one side of the arch to disengage the aligner, followed by pressing the other side, applying force to each hemi-arch. Secondly, the methodology designed to simulate the force required to remove the aligner using an Instron machine involves only one traction point. Using a single traction point to disengage the entire aligner does not accurately represent what occurs clinically.
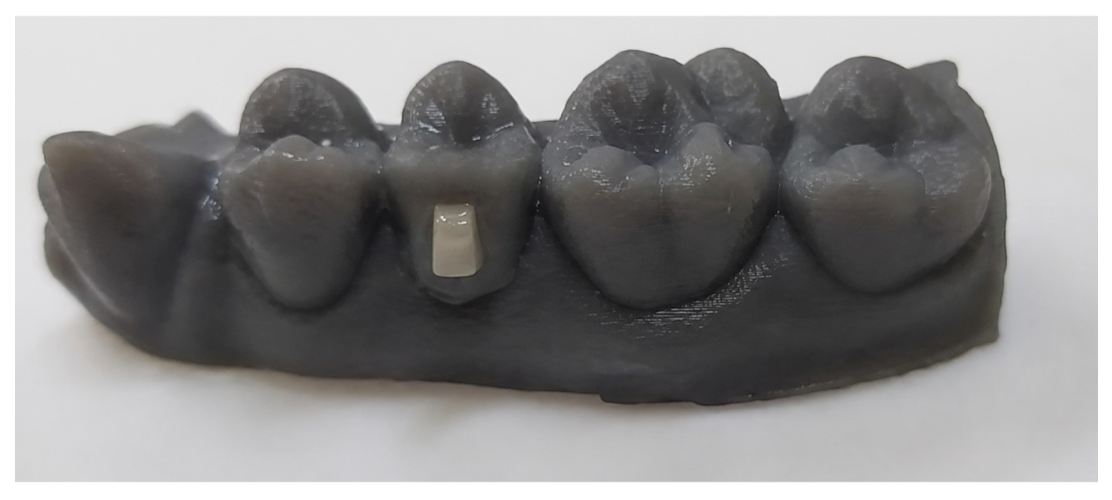
To form the three experimental groups, 19 resin models were 3D printed. Of these, 18 models were printed without attachments for the experimental samples, and one model was printed with a 5 mm × 3 mm × 3 mm rectangular vertical attachment on the crown of the second premolar, serving as the base for an attachment template polymerization (
Figure 1). Printing was performed using a Moonray SprintRay S100 3D printer with a resolution of 50 µm, utilizing Horus DLP technology in gray color (SprintRay, Los Angeles, CA, USA). The printer operates with pre-calibrated and manufacturer-optimized exposure settings, which are automatically applied through proprietary software (RayWare 2.8.X, SprintRay, Los Angeles, CA, USA). All prints were performed under the recommended standard protocol to ensure optimal polymerization and consistency of the printed models, as validated by the manufacturer for this resin and equipment combination.
2.3. Randomization
An independent, blinded examiner not involved in the study, was responsible for randomization and attachment fabrication. Using an online random number generator, an independent examiner assigned each printed model an identification number from 1 to 18 and randomly allocated the specimens into three composite resin groups (n = 6 per group):
- -
Two low-viscosity composites
3M Unitek® Transbond Supreme LV (3M, Saint Paul, MN, USA);
3M EspeTM FiltekTM Bulk Fill Flow (3M, Saint Paul, MN, USA).
- -
One conventional high-viscosity composite
The correspondence between model number and resin type was recorded in a confidential spreadsheet. This allocation list remained concealed from all other examiners until the conclusion of the statistical analysis, ensuring allocation blinding throughout the study.
2.4. Attachment Design
To fabricate the attachments, a 0.6 mm PET-G thermoplastic sheet (Bio-Art Dental Equipments, São Carlos, São Paulo, Brazil) was used to produce a standardized template. Six templates were produced and used randomly for every three models. After surface cleaning and application of a universal adhesive, attachments were bonded onto all 18 experimental models.
The composite resins used in this study presented distinct rheological and handling characteristics. Transbond™ Supreme LV and Filtek™ Bulk Fill Flow are flowable, low-viscosity composites characterized by reduced filler content and lower elastic modulus, which facilitate adaptation to the attachment template and improved material adaptation during insertion. In contrast, Filtek™ Z250XT is a conventional nanohybrid composite with higher viscosity, increased filler loading, and greater stiffness, requiring incremental placement and mechanical adaptation with a spatula to ensure proper condensation and morphology reproduction. These differences in viscosity and handling may influence the initial adaptation of the material within the attachment template; however, all materials were standardized in terms of insertion protocol and light-curing procedures to minimize procedural variability.
For the flowable resins, the tip of the dispenser was positioned at the bottom center of the mold, and the resin was injected until the mold was completely filled. The dispenser was moved gently back and forth to minimize bubble formation. Subsequently, the template was pressed against the model to allow excess material to be expressed. For the conventional high-viscosity composite, the resin was removed from the syringe using a spatula and inserted in three increments: the first on one side of the mold, the second on the opposite side, and the third in the center. The spatula was used to gently adapt the material, and a slight excess was intentionally left to ensure complete filling of the attachment. The template was then pressed against the model to remove excess material. For all resin types, final adaptation was performed using the flat side of the spatula over the mold, followed by pressure applied to the left and right sides of the attachment mold, as well as to the cervical and occlusal aspects. Light curing of all attachments was performed using a standardized protocol with a Schuster Emitter B device (Schuster Medical Equipment and Dental, Santa Maria, Brazil) set to 40 s. Excess resin was removed using a No. 15 carbon steel scalpel blade, which was replaced for each model.
2.5. Initial Volume Measurement
An initial surface analysis of the attachments was conducted on all 18 experimental models using a computerized microtomography SkyScan 1174 v2 (SkyScan, Kontich, Belgium), operated at 50 kV and 800 µA, with imaging parameters set to a voxel size of 29.71 μm and 180° rotation scanning. Each scan produced images of 1024 × 1304 pixels. Data reconstruction was performed using NReconv1.6.4.8 software (SkyScan, Kontich, Belgium), generating three-dimensional images of the attachments for analysis by delineating regions of interest (ROI) for each sample.
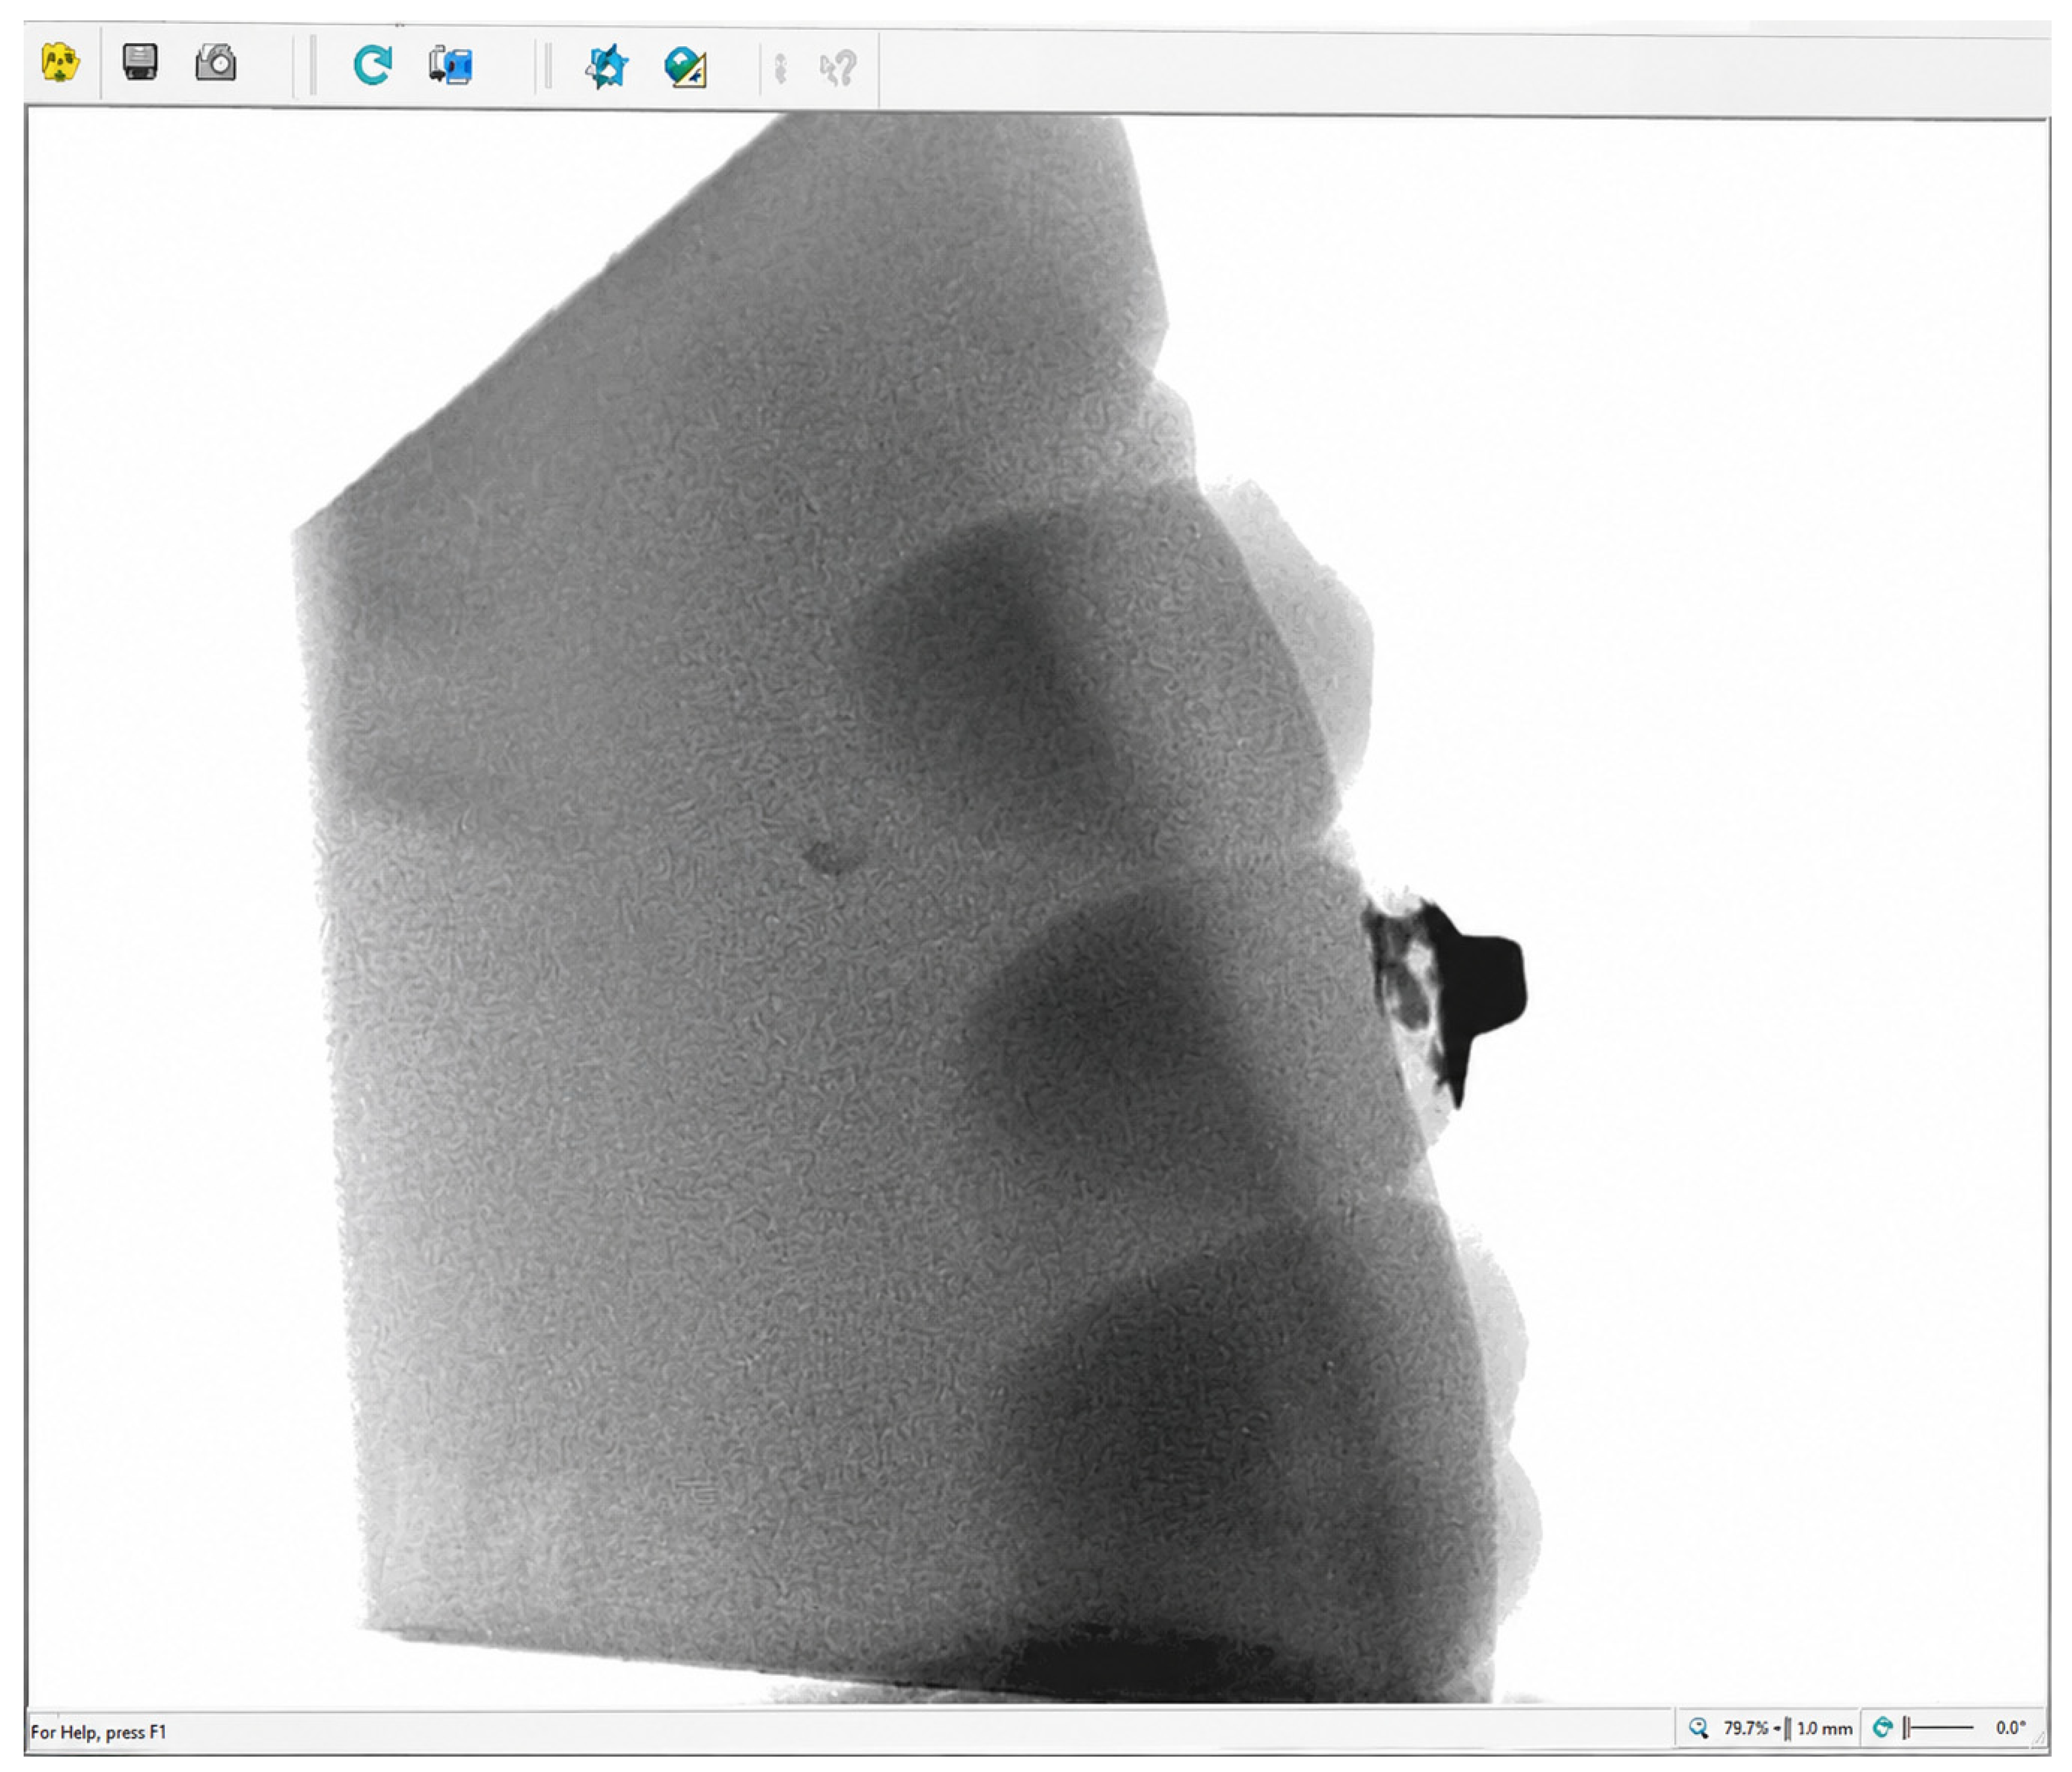
The examiner responsible for the initial and final microCT volumetric assessments remained fully blinded to group allocation during both measurement time points. Following manual selection of the area of interest (attachments) in the software, the image underwent binarization. The software then processed the binarized image to calculate the volume of the black-colored area, corresponding to the attachment. For quantitative analysis, CTan v1.11.10.0 software (SkyScan, Kontich, Belgium) was employed, automatically determining the volume of material in cubic millimeters (mm
3) (
Figure 2). After volume measurement, the models were prepared for traction tests.
2.6. Traction Tests
Fabrication of the aligners: Over the printed models with attachments in place, 0.76 mm thick aligners were formed using ProAlign plates (Ø 125 × 0.76 mm—30.11.0053, Orthometric Ind., Marília, SP, Brazil). Nine aligners were created for each model, totaling 162 aligners to simulate a three-month (90 days) treatment period, considering a ten days period of aligner usage. Aligners were stamped using a Plastvac P7 Bio-Art vacuum plasticizer (Bio-Art Dental Equipments, São Carlos, SP, Brazil), with a standard stamping time of 1 min and 15 s. Subsequently, the aligners were manually trimmed using a micromotor, leaving a 2 mm margin from the cervical region of the teeth both lingually and buccally, resulting in specimens ready for analysis.
Traction testing was performed by a third examiner who was likewise blinded to resin assignment and to the randomization scheme. This examiner received only the numbered models and conducted all mechanical cycling procedures without any information regarding composite type.
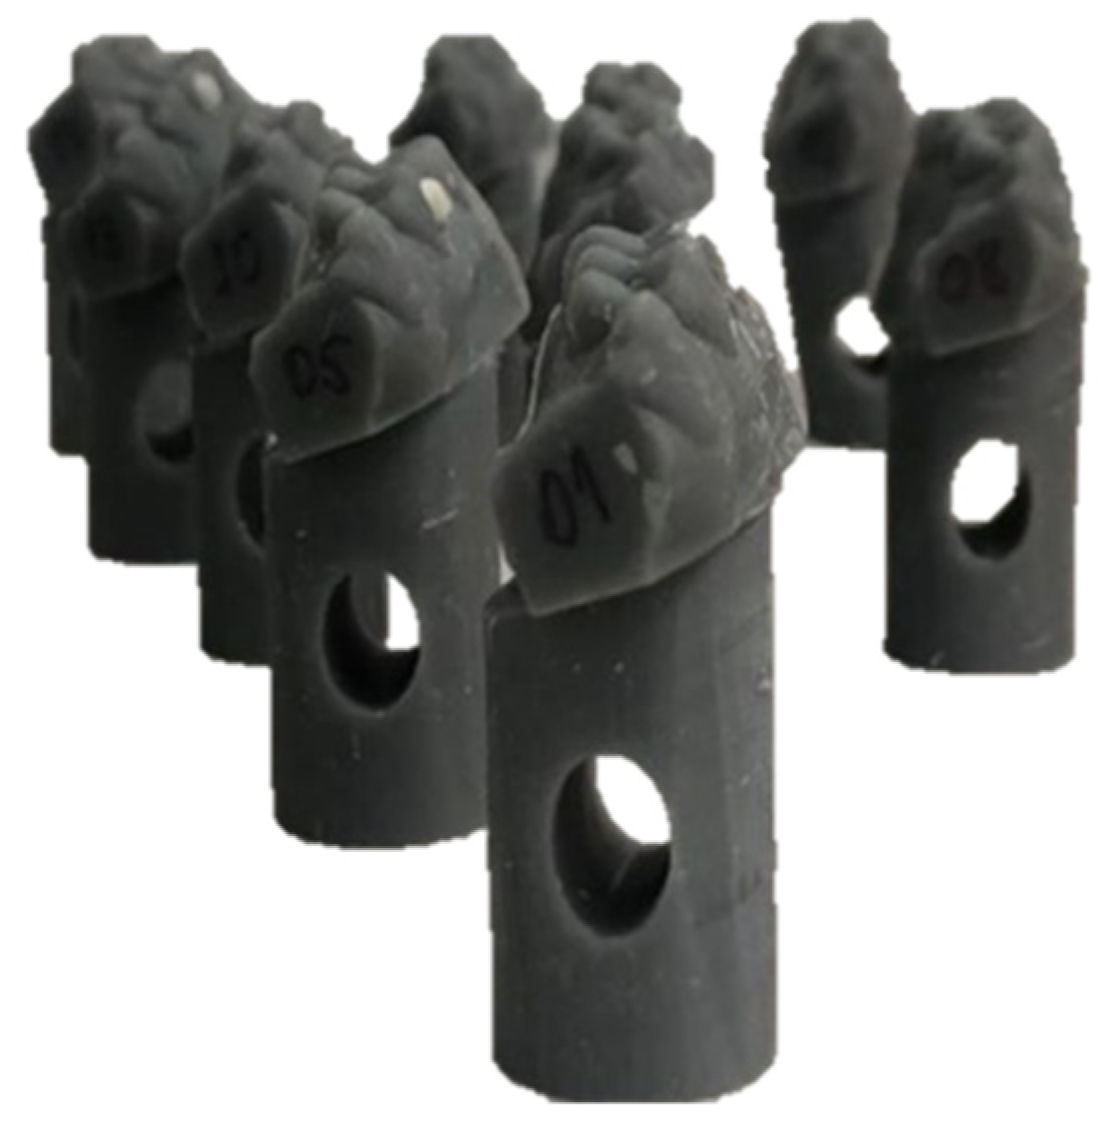
Adaptation to the Testing Machine: For the traction tests, a cylindrical base (35 × 29 × 17 mm) was designed using Meshmixer 3.5 software (Autodesk Inc., San Rafael, CA, USA). The base was designed at a 30-degree angle corresponding to the surface to be bonded to the model. This adaptation was made after several tests to calculate the required inclination, ensuring that the buccal and lingual cervical margins of the teeth were in the same plane. Subsequently, 18 bases were 3D printed using the Moonray SprintRay S100 3D printer (Astroscience3D, Uberaba, MG, Brazil). These bases were bonded to the experimental models using super glue to securely fix them in the universal testing machine (Shimadzu EZ-S 500N, Nakagyo-Ku, Kyoto, Japan). This alignment allowed the aligner to be pulled equally in both buccal and lingual directions simultaneously (
Figure 3).
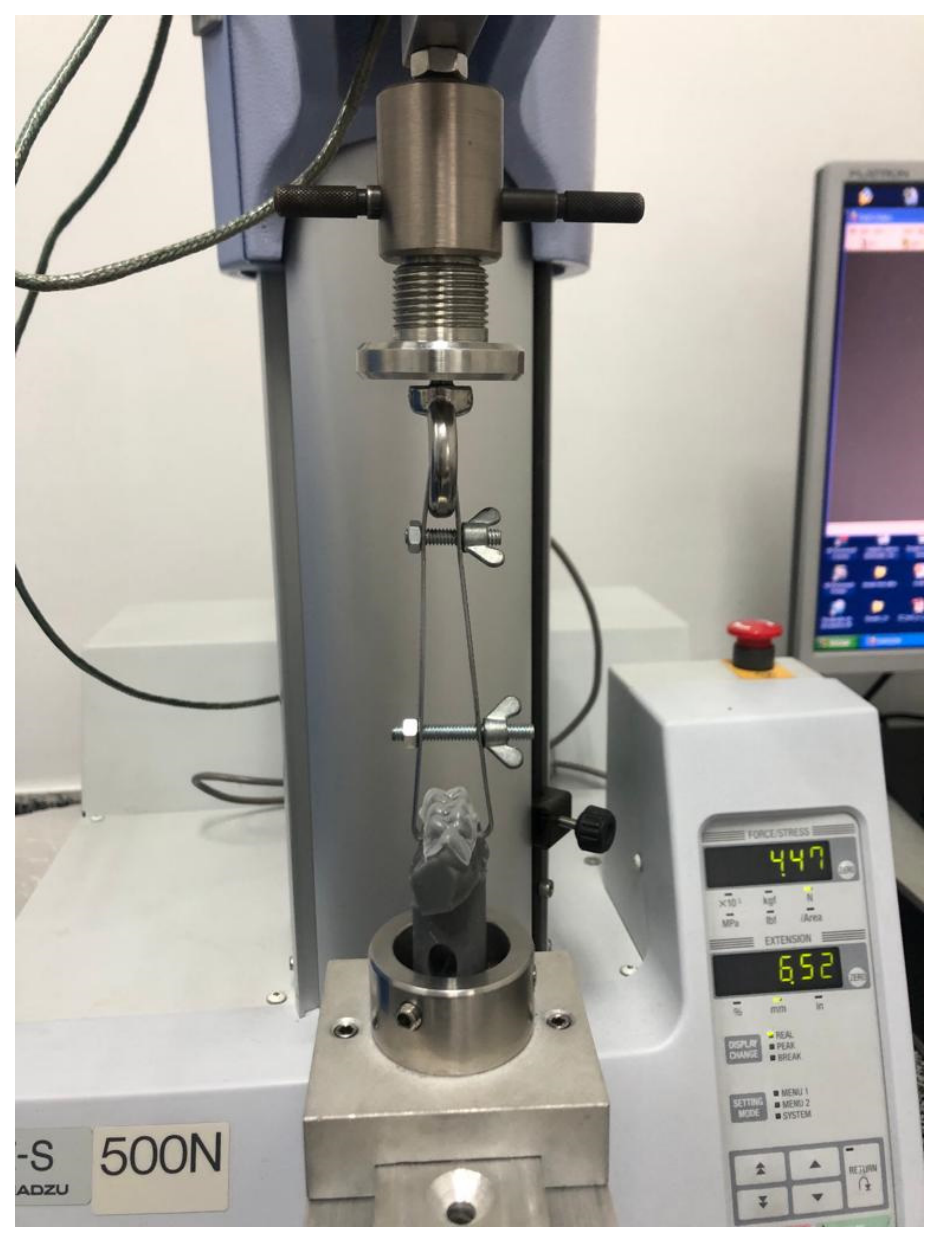
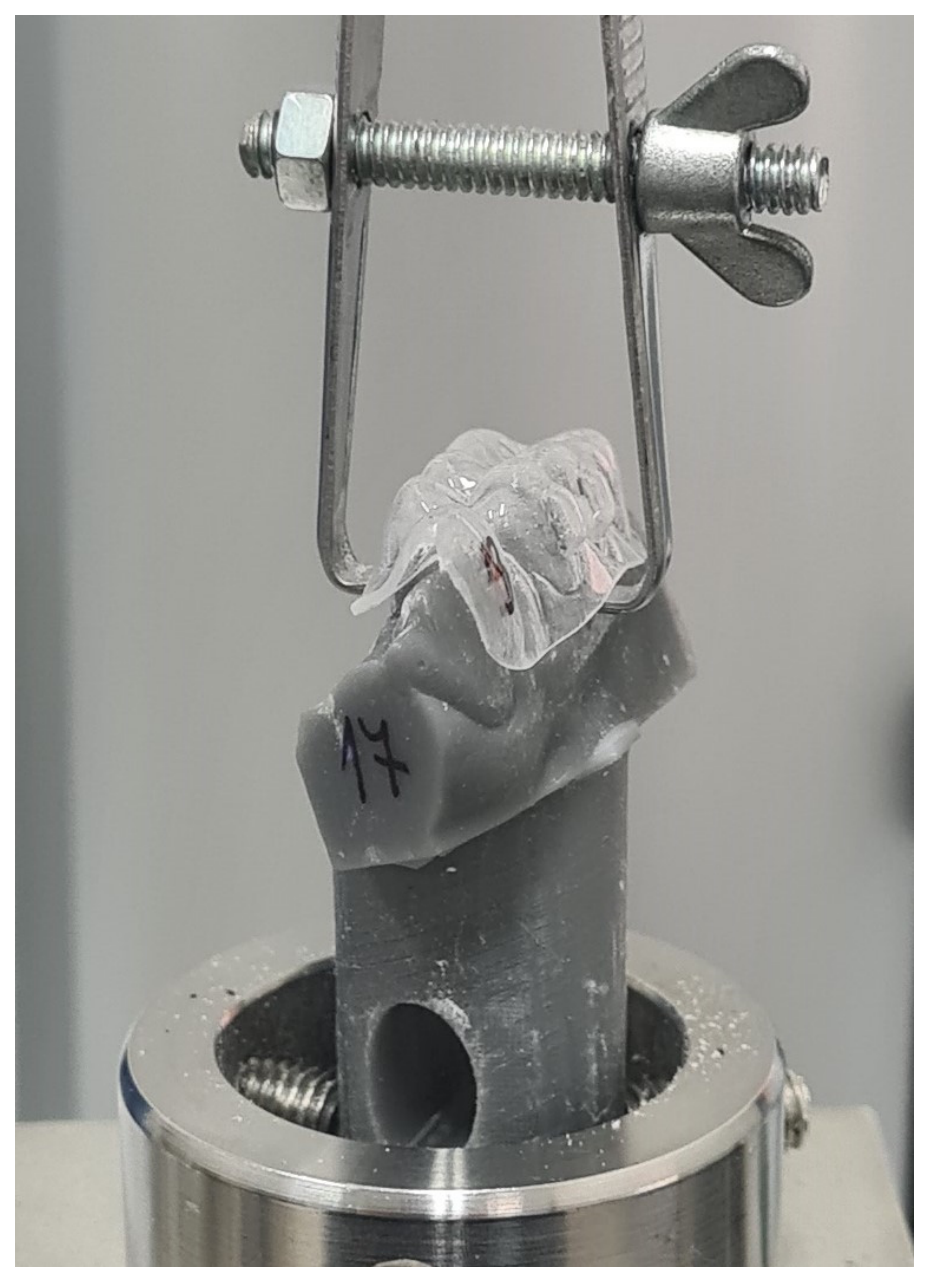
After bonding the cylindrical bases, the model was secured at the lower end of the traction structure within the testing machine. A custom traction device was fabricated specifically for this purpose, comprising a clamp with bent tips to fit the buccal and lingual bases of the aligners. Additionally, two adjustable screws provided flexibility for removing and repositioning each tested aligner while ensuring a secure fit during traction (
Figure 4). The clamp was adapted to the upper end of the traction structure in the universal testing machine.
Traction Procedure: After securing the clamp to the base of the aligner, the testing machine was zeroed, and the traction test commenced. A vertical displacement was set at a speed of 3 mm/min until aligner disengagement (
Figure 5).
Monitoring was conducted using a 50 N load cell to measure the maximum force required for aligner disengagement. Each aligner was subjected to 30 insertion–removal cycles, a value selected to simulate a 10-day interval aligner use protocol with three daily insertion–removals, which corresponds to typical patient routines related to meals and hygiene. This number also aligns with previously adopted simulation protocols in in vitro studies evaluating aligner fatigue and retention.
In clinical practice, aligners are commonly prescribed to be worn for 7, 10, or 14 days, depending on the manufacturer and orthodontist preference. To represent a mid-range, a 10-day wearing period was adopted for this study. Therefore, each aligner underwent 30 cycles to simulate its full clinical lifespan. After completing the 30 cycles, the aligner was replaced, and the procedure was repeated for nine consecutive aligners, totaling 270 traction cycles per model.
The maximum force recorded at the point of aligner disengagement was documented using TRAPEZIUM Lite X software (Shimadzu, Nakagyo-ku, Kyoto, Japan) and was logged in an Excel spreadsheet. These data facilitated comparison of traction forces throughout the evaluation period, enabling assessment of potential tracking loss due to resin wear or potential plastic deformation.
Upon completion of the traction tests, the hemiarch was detached from the cylindrical base to perform the second measurement of attachment volume using microCT (Post-test Volume).
During the traction tests, five specimens experienced attachment debonding and had to be excluded. Because group allocation had been performed beforehand under blinded conditions, the examiner was unaware of the group assignment of these specimens. After the tests were completed, we consulted the allocation spreadsheet to identify their respective groups: two belonged to Transbond™ Supreme LV, two to Filtek™ Z250XT, and one to Filtek™ Bulk Fill Flow. To facilitate statistical analysis, one additional specimen from the Bulk Fill group was randomly excluded, resulting in four specimens per group in the final analysis.
2.7. Statistical Analysis
All statistical analyses were performed using Jamovi 2.3.X (
https://www.jamovi.org, accessed 23 May 2026). Normality of residuals was evaluated using the Shapiro–Wilk test. For the volumetric comparison (pre- vs. post-microCT), paired
t-tests were used within each resin group, with results reported as mean difference, using 95% confidence intervals. Intergroup volumetric differences were evaluated using one-way ANOVA, followed by an ANCOVA to account for differences in initial resin volume between groups.
Because each model generated nine sequential aligners, and each aligner underwent 30 consecutive insertion–removal cycles, tensile-force data exhibited a nested longitudinal structure. To avoid inflated Type I error from 270 repeated measurements per specimen, data were aggregated into clinically meaningful blocks:
Aligner-level grouping: aligners 1–3, 4–6, and 7–9, representing three consecutive “months” of aligner use.
Cycle-level grouping: cycles 1–10, 11–20, and 21–30, representing early, mid, and late fatigue within each aligner.
This approach allows evaluation of force decay patterns, rather than focusing on individual cycles with minimal clinical relevance.
Intergroup comparisons of tensile forces were conducted using repeated-measures ANOVA with resin type as the between-subject factor and cycle/aligner blocks as within-subject factors. Bonferroni-adjusted post hoc tests were applied. Confidence intervals of 95% were reported for all statistically significant findings.
A significance level of α = 0.05 was adopted for all analyses.
3. Results
A total of 12 experimental models (four per resin group) completed all microCT assessments and 270 insertion–removal cycles, resulting in 1080 traction cycles analyzed per composite resin.
The random and systematic errors for microCT data reading were assessed using the final models, with repeated measurements taken at a 15-day interval. The systematic error was evaluated using a t-test (p = 0.717992), and the random error was calculated using the Dahlberg formula (0.1844), indicating minimal error.
Initial and final microCT measurements demonstrated measurable volumetric loss in two of the three resin groups (
Table 1). Transbond™ Supreme LV and Filtek™ Z250XT exhibited statistically significant reductions in attachment volume after mechanical cycling (
p < 0.05), whereas Filtek™ Bulk Fill Flow showed no significant wear. Due to statistically significant differences in the initial volume between groups (
Table 1), with Filtek™ Bulk Fill Flow presenting a lower initial volume, an ANCOVA test was performed to assess the difference in volume loss, with the initial volume as a covariate (
Table 2). However, the results revealed no significant differences among the three groups regarding total volumetric loss (
p = 0.407), indicating that intergroup variation was not statistically meaningful despite the intragroup changes and the influence of initial volume differences.
- 2.
Tensile removal force analysis
The analysis of tensile forces showed that most variables reached statistically significant values, both within and between groups (
Table 3 and
Table 4). Across all resin types, tensile force values followed a consistent pattern. Each aligner exhibited a progressive decline in removal force over the 30-cycle period, followed by partial recovery upon replacement with the next aligner. However, the recovery forces showed some differences between groups.
In the first group (Transbond™ Supreme LV), the removal force significantly increased from the first set of three aligners to the second set and then decreased from the second to the third set, showing overall maintenance from the initial to the final aligners. This result may be explained by initial optimization of the aligner–attachment interface. During early cycles, improved mechanical interlocking and seating adaptation may occur as minor surface irregularities are smoothed, increasing retention forces. With continued cycling, progressive surface wear and fatigue may lead to a slight reduction in retention. Differences compared to Filtek™ Z250XT and Bulk Fill Flow may be attributed to their distinct filler content and mechanical stiffness.
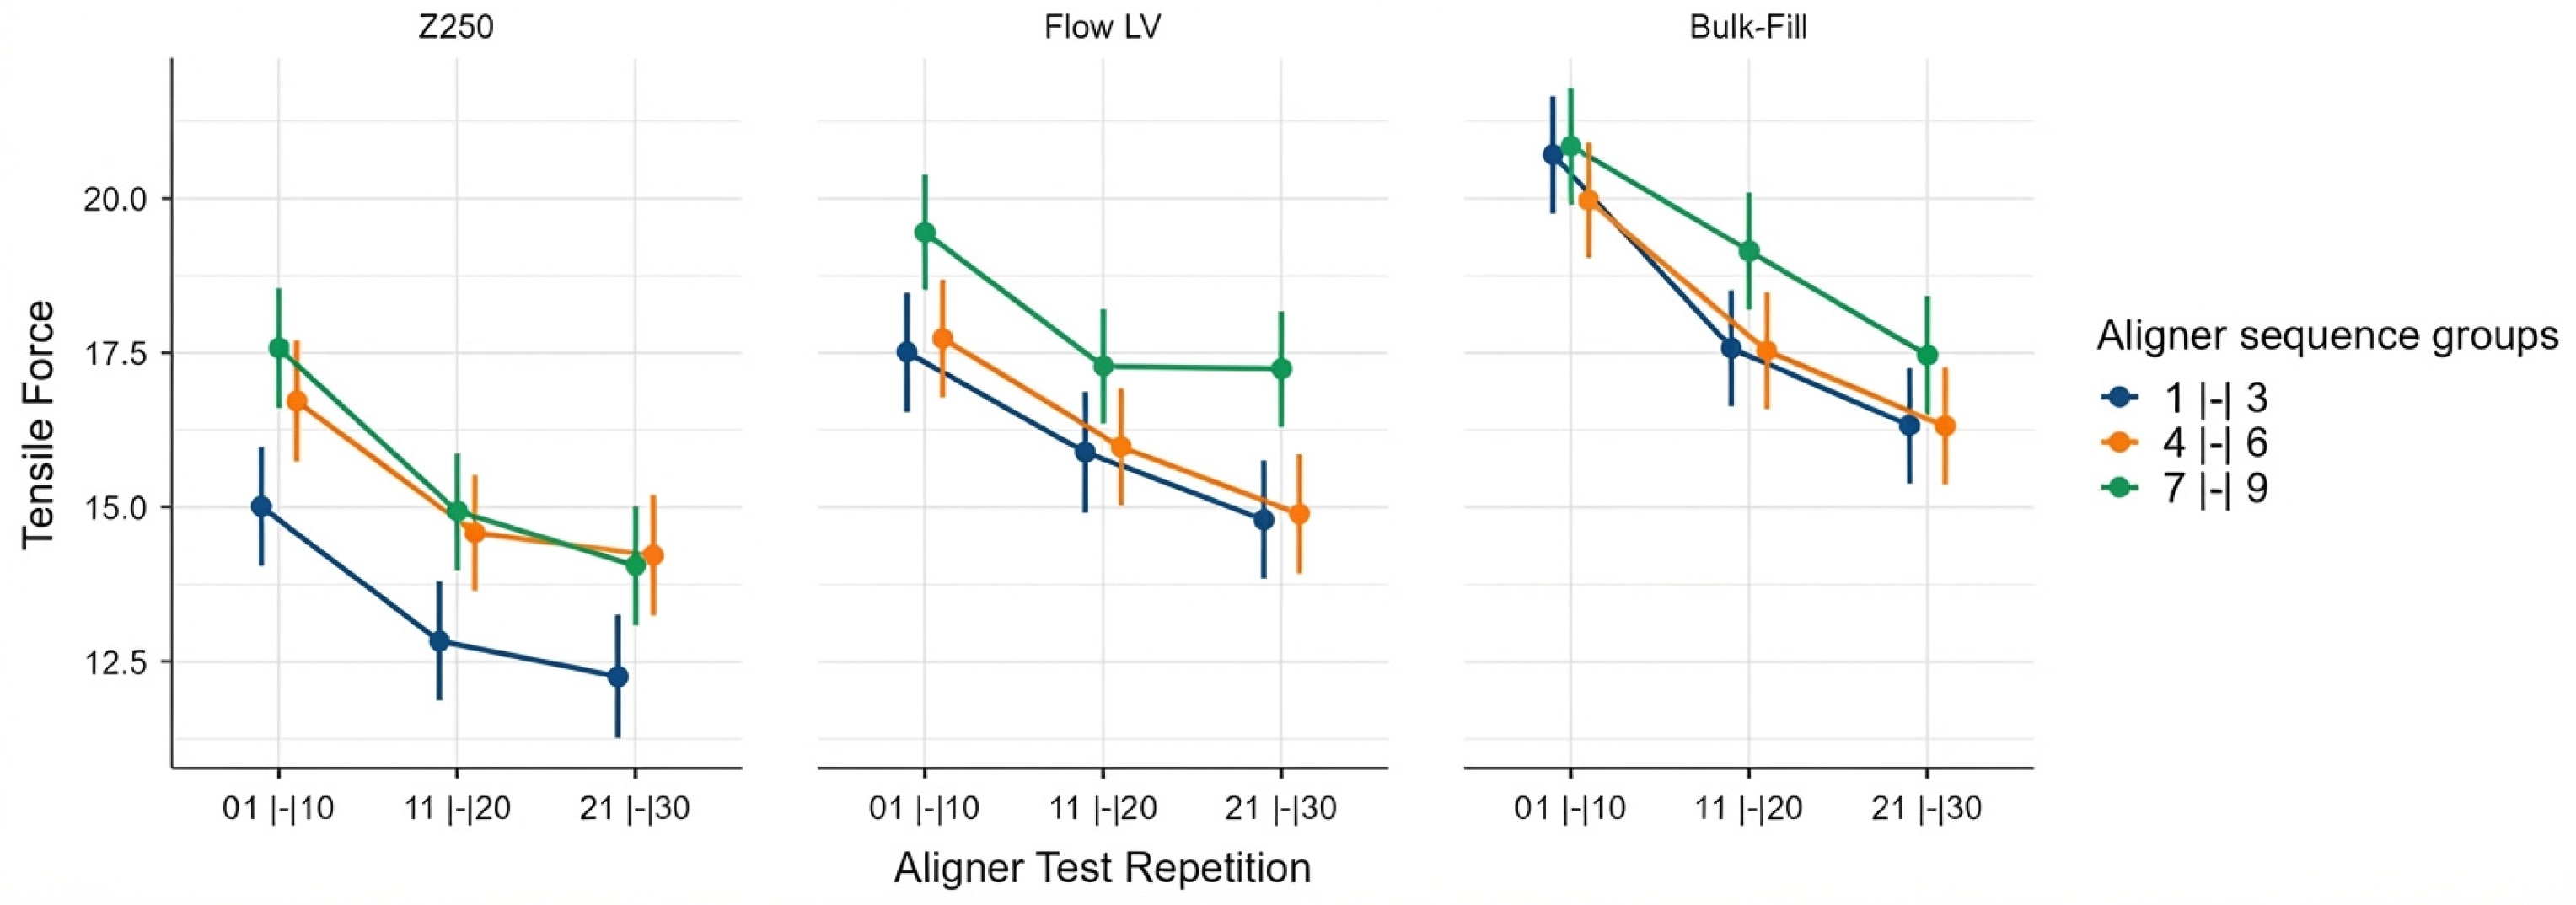
In the second group (Filtek™ Bulk Fill Flow), no statistically significant differences were observed in removal forces among the three sets of aligners, indicating more consistent traction forces. This group also exhibited the highest numerical retention forces (
Figure 6). In the third group (Filtek™ Z250XT), the removal forces increased from the first to the second set of aligners, with no significant change from the second to the third set, indicating a gradual increase in traction forces from the first to the final set of aligners.
When comparing the groups for each set of aligners, statistically significant differences were observed during the traction force tests (
Table 3). Filtek™ Bulk Fill Flow exhibited the highest forces, which were significantly higher than those of Filtek™ Z250XT in all three sets of aligners (
p < 0.00001) and higher than Transbond™ Supreme LV in the first and third sets (
p < 0.00001). Differences between Transbond™ Supreme LV and Filtek™ Z250XT were observed in the first and second sets of aligners (
p < 0.00001), while forces were similar in the final set.
Considering the forces measured during the 30 insertion and removal cycles, all resin groups showed a reduction in force over time, with statistically significant differences between groups (
Table 4). The progressive reduction in detachment force over repeated cycles may be related to viscoelastic relaxation of the aligner material combined with minor surface smoothing of the attachment interface. Filtek™ Bulk Fill Flow exhibited the highest forces, with a progressive decrease from the first 10 cycles to the 30th cycle, followed by Transbond™ Supreme LV and Filtek™ Z250XT (
Figure 6). Only during the third cycle were the forces of groups one and two similar (
Table 4).
4. Discussion
This study quantitatively evaluated the volumetric wear of three composite resins used for orthodontic attachments and analyzed their influence on aligner detachment forces over a simulated three-month period. Two flowable resins were compared with a packable composite, considering that flowable materials substantially reduce chair time during attachment placement—by approximately 7.3 min [
13,
14]—and facilitate application due to their syringe-based delivery. Alshammari et al. (2025) [
15] highlight that the mechanical properties of composite resins vary considerably among materials, justifying careful material selection depending on expected treatment duration and biomechanical demands.
MicroCT analysis revealed that Transbond™ Supreme LV and Filtek™ Z250XT exhibited significant volumetric reduction, whereas Filtek™ Bulk Fill Flow showed minimal wear. This behavior may be associated with differences in filler loading and resin matrix composition, since materials with higher filler content generally exhibit improved resistance to abrasive wear and volumetric degradation under cyclic loading conditions. To highlight the significance of surface wear relative to the total volume of the resin attachment, the percentage of reduction was calculated. Transbond™ Supreme LV showed a mean volume reduction of 12.66%, whereas Filtek™ Z250XT and Filtek™ Bulk-Fill Flow showed reductions of 7.39% and 7.57%, respectively. Despite these structural differences, no significant intergroup differences were detected in aligner detachment force, which consistently decreased within each 30-cycle interval.
Considering that the sample size calculation was based on detecting a minimum difference of 10% in the pilot study, the results showed no intergroup divergence. The observed volume losses were similar to those obtained in the pilot study, with a mean value slightly higher for Transbond™ Supreme LV and slightly lower for the other two resins.
Our findings are consistent with Li & Yang (2024) [
13], who documented a gradual decrease in attachment volume over 8 months of aligner use, particularly at gingival edge corners of 3 mm rectangular attachments.
The negligible wear of the bulk-fill flowable resin is consistent with its favorable depth of cure and reduced polymerization stress. The improved stability observed for the Bulk Fill composite may be attributed to its higher degree of conversion and enhanced polymer network density, which increase mechanical resistance to repeated stress application. While the recommended incremental thickness for conventional composites is limited to 2 mm [
16,
17], the attachments in the present study were 3 mm deep. In contrast, bulk-fill flowable composites can be effectively photoactivated in increments up to 4 mm. Bulk-fill materials also exhibit a higher degree of conversion (43.6–76.5%) than conventional composites, enhancing hardness and wear resistance [
18]. These characteristics may have contributed to the distinct pre–post performance observed for this resin. A study employing scanning electron microscopy (SEM) compared Tetric EvoCeram Bulk Fill and Tetric EvoFlow composites and reported higher attachment precision with bulk-fill resin [
5]. While conventional composites exhibited greater wear, the present findings indicate that small volumetric losses may not translate into clinically significant reductions in aligner retention, at least within short-term treatment intervals.
The lack of statistically significant differences in surface wear among the groups supports the clinical suitability of all three resins during the first three months of treatment, when some volume loss is expected. Clinicians should consider attachment size to ensure adequate aligner retention throughout longer orthodontic treatments. Significant resin wear, observed in two of the three tested resin groups in small attachments, could reduce aligner retention and affect the predictability of tooth movement.
To assess the influence of this surface wear in 5 × 3 × 3 mm attachments, traction forces were measured in the 12 sample models (four per resin), capturing both intergroup differences and the effects of repeated aligner insertion and removal, which patients typically perform three times daily during meals. Over 10 days of use per aligner, this corresponded to 30 cycles. Statistically significant differences between groups were observed across the three cycle periods.
Given the large number of insertion–removal cycles (1080 cycles per resin group), some statistically significant differences likely reflect statistical sensitivity rather than clinically meaningful effects. The consistent recovery of retention with each new aligner underscores the dominant influence of aligner fatigue over attachment degradation.
Filtek™ Bulk Fill Flow exhibited the highest force values, followed by Transbond™ Supreme LV, with Filtek™ Z250XT showing the lowest. Differences in detachment forces among materials may be explained by variations in stiffness and elastic modulus, which directly influence the degree of mechanical interlocking between the attachment and the aligner.
Intragroup analysis revealed a progressive reduction in attachment force over the 30 cycles, with recovery occurring upon placement of a new aligner—a pattern observed across all three resin groups. Interestingly, the initial force at the start of each new cycle tended to be higher as the aligners were replaced. These results suggest that surface wear is not substantial enough, given the attachment size used in this study, to compromise attachment integrity; the preserved geometry and design of the new aligner allow recovery of attachment force and readiness for the next cycle. Yangin et al. [
19] similarly reported that reductions in disengagement force do not necessarily correlate with clinical failure or tracking issues.
Our findings support the interpretation that aligner material relaxation (viscoelastic relaxation) may be directly related to short-term loss of retention. This is consistent with previous studies demonstrating viscoelastic stress relaxation in thermoplastic orthodontic appliances, independent of attachment morphology [
20].
Previous studies have described discrepancies in attachment reproduction accuracy and wear resistance among composites; however, few have quantified volumetric loss using high-resolution microCT under standardized mechanical cycling.
The present methodology reinforces earlier observations that resin wear does not necessarily compromise clinical tracking. From a clinical perspective, clinicians should be more concerned with aligner replacement intervals and patient compliance than with small differences in composite wear, when properly shaped attachments are used.
Nonetheless, Filtek™ Bulk Fill Flow demonstrated some advantages, including negligible surface wear over the study period, higher traction forces, and greater consistency in force across aligner cycles.
This in vitro model simulates only a three-month treatment period and does not incorporate intraoral variables such as mastication or humidity that may amplify material degradation, nor evaluated aligner material wear, and these should be considered limitations. The difference in baseline volume among the groups may have influenced the wear outcomes. Therefore, although an ANCOVA test was performed, the results should be interpreted with caution. Moreover, to simulate aligner disengagement, a hemi-arch was used, which may not fully represent the clinical situation, as the removal of an aligner from a full dental arch may generate greater resistance on the composite attachments compared to removal from a hemi-arch.
It is important to emphasize that this study evaluated only mechanical parameters, including volumetric wear and aligner detachment forces, under controlled in vitro conditions. Therefore, no direct assessment was made regarding orthodontic treatment outcomes, such as the accuracy of tooth movement or treatment efficiency.
Although the specific composite resins evaluated in this study may not be universally available across different countries, the findings may be interpreted in terms of material-dependent properties. In general, flowable composites with lower viscosity facilitate adaptation and handling, while higher filler content and increased degree of conversion are associated with improved mechanical stability and wear resistance. Therefore, the selection of composite resins for orthodontic attachments should be based on intrinsic material properties that influence adaptation, mechanical performance, and resistance to cyclic loading, rather than on specific commercial formulations.
Results should be considered as a clinical reference, as comparative values between groups more than the absolute numbers of force traction. Future studies should evaluate longer treatment intervals, larger sample sizes, and alternative cycling protocols to better reflect clinical conditions.




 ,
,