Case Report

Three-Dimensional Stereophotogrammetric Evaluation of Facial Aesthetic Changes Following Radiotherapy for Head and Neck Cancer—Report of Two Cases


1
Institute of Dental Clinic, A. Gemelli University Policlinic IRCCS, Catholic University of Sacred Heart, 00168 Rome, Italy
2
Postgraduate School of Orthodontics, Catholic University of Sacred Heart, Largo A. Gemelli 8, 00168 Rome, Italy
*
Author to whom correspondence should be addressed.
These authors contributed equally to this work.
These authors also contributed equally to this work.
Submission received: 3 February 2026 / Revised: 1 April 2026 / Accepted: 8 April 2026 / Published: 10 April 2026

Abstract

Background/Objectives: This study aimed to describe and quantify facial soft tissue changes in two patients who underwent radiotherapy (RT) for head and neck cancers, using three-dimensional (3D) stereophotogrammetry and surface deviation analysis. The aims were (i) to assess the progression of morphological alterations over time (ii) and to evaluate the clinical potential of 3D surface mapping in documenting RT-related aesthetic changes. Methods: Two patients with head and neck cancer undergoing RT were analyzed using three-dimensional stereophotogrammetry (3dMD Trio-system, Atlanta, GA, USA) at three timepoints: before RT (T0), 45 days after the start of RT (T1), and 6 months after the start of RT (T2). Facial 3D scans were processed using Geomagic Control 2014 software (v.3D Systems, Morrisville, NC, USA) to perform standardized alignments and calculate volumetric deviations, create colorimetric deviation maps, and conduct Root Mean Square (RMS) analysis. Results: Between T0 and T1, both patients showed soft tissue volume reduction, primarily in the mandibular and submental regions, likely reflecting acute treatment effects and weight loss. Between T0 and T2, an increase in soft tissue volume was observed, especially in the lower face and neck, consistent with late radiation effects such as lymphedema and post-treatment weight gain. RMS values ranged from 5.53 mm to 6.87 mm across patients and time points, indicating measurable morphological changes. The upper third of the face remained stable and served as a reliable reference region for alignment. Conclusions: RT may be associated with significant, region-specific changes in facial and cervical soft tissues in HNC patients, but these preliminary observations must always be correlated with weight loss and confirmed by further studies. 3D stereophotogrammetry is a reliable, non-invasive method for detecting and quantifying these alterations over time. This technique can offer valuable insights for clinical monitoring and could promote better patient counseling and potentially mitigate the psychological burden associated with facial changes.

1. Introduction

Head and neck cancers (HNC) and their treatments often result in profound changes in patients’ facial appearance. While the disfiguring effects of surgical resection in HNC are well documented and largely irreversible due to the invasive nature of oncologic surgery [1,2], radiotherapy (RT) alone can also be responsible for several adverse events, such as Osteoradionecrosis [3] and Trismus [4], which may ultimately lead to significant alterations in facial soft tissues. Early facial changes are mainly attributable to weight loss secondary to the acute effects of radiotherapy of the head and neck area, such as the onset of mucositis [5], dysphagia [6], and taste alterations. Moreover, late alterations are: persistent lymphedema, fibrosis, the appearance of scars associated with irradiation, changes in the color and texture of the skin, swelling and loss of muscle or fat tone and volume, especially in the cervical and mandibular areas. These changes may persist for a long time and alter the patient’s aesthetic appearance and quality of life [7,8]. Late effects, which are often independent of acute symptoms, are driven by stromal, vascular, and connective tissue damage and usually appear months after the start of therapy [8,9]. Moreover, the reduction in mid-facial volume and alteration in soft tissue support can be further aggravated by tooth loss due to extractions, which patients often undergo as a preventive measure before starting radiotherapy in the head and neck area [10]. Facial appearance changes are deeply linked with psychosocial well-being. In fact, alterations in self-image following HNC treatment have been linked to anxiety, depression, and body dysmorphic disorders, with significant implications for long-term mental health [11,12].
Although these aspects are well known to specialists in the field, collecting precise data on how the effects of RT change the appearance of patients over time and quantifying these changes could promote better patient counseling and potentially mitigate the psychological burden associated with facial changes. Three-dimensional (3D) stereophotogrammetry has become an increasingly important tool in the field of craniofacial analysis. As a non-invasive and highly reliable technique, it enables the acquisition of high-resolution facial surface data with remarkable accuracy. This capability is particularly valuable for detailed morphological documentation, where precision is essential. One of the key advantages of 3D stereophotogrammetry lies in its rapid acquisition speed combined with extensive surface coverage reaching up to 360 degrees [13,14,15]. These features represent a significant improvement over earlier surface imaging technologies, such as laser scanning, which often required longer processing times and offered more limited coverage [13,16,17]. Due to these benefits, 3D stereophotogrammetry has been widely adopted in clinical and research settings. It has proven especially useful in the assessment of facial aesthetics and in the evaluation of morphological changes associated with conditions such as tooth loss or orthognathic surgery [18,19]. The emergence of 3D stereophotogrammetry marks a substantial advancement in facial surface imaging, offering a non-invasive, fast, and comprehensive method that not only enhances the quality of data available for morphological studies and aesthetic evaluations but also proves invaluable for documenting facial changes over time in both diagnostic and treatment planning processes [13,20]. In this context, this pilot study report describes and quantifies facial soft tissue changes in two patients undergoing RT for HNC, using 3D stereophotogrammetry (3dMD Trio System, Atlanta, GA, USA) for face and neck surface acquisition. Given the considerable clinical heterogeneity between the two patients (age, tumor region, and treatment protocols), the aim of this report is not to draw generalizable conclusions but rather to present a feasible and reproducible protocol for facial surface acquisition, alignment and landmark-based comparison. By illustrating the potential of this methodology for documenting changes in facial soft tissue over time, this report aims to provide a preliminary framework for future studies investigating radiotherapy-related aesthetic changes and their possible implications for patient counseling and psychosocial well-being. Furthermore, this approach may help provide patients with more objective information about the changes they may undergo, potentially supporting patient counseling, improving quality of life, and reducing the risk of dysmorphic concerns.

2. Materials and Methods

The present case report was carried out in the department of Orthodontics of “Fondazione Policlinico Universitario A. Gemelli IRCCS (Rome)” teaching hospital. The present study was conducted according to the Declaration of Helsinki, and all patients signed an informed consent form. The present paper represents the first report of a prospective observational study, whose protocol was approved by the Ethics Committee of the Università Cattolica del Sacro Cuore (ID. 2132) and registered at ClinicalTrials.gov (ID: NCT04009161). The study was reported according to the CARE guidelines [21].

2.1. Patient Selection and Information

The participants were selected according to the following inclusion criteria:
-
Patients diagnosed with HNC, with specific prescription of local RT, either for palliative or curative purposes, whether or not receiving chemotherapy (CTx);
-
Patients diagnosed with HNC, with specific prescription of local RT as an adjuvant to surgical therapy involving only the neck lymph nodes of levels III, IV, V, and VI, whether or not receiving CTx.
Radiotherapy was delivered using a Volumetric Modulated Arc Therapy (VMAT) technique. Patient 1 received a total dose of 66.6 Gy delivered in 37 fractions (1.8 Gy/fx). Patient 2 received a total dose of 66 Gy delivered in 30 fractions (2.2 Gy/fx). Specific dosimetric parameters were extracted from the Treatment Planning System (TPS) for both cases to correlate regional radiation exposure with the volumetric changes detected. Patient 1 received a total dose of 66.6 Gy (37 fractions of 1.8 Gy), targeting the nasopharynx and bilateral neck (Levels II-VII). Detailed mean and maximum doses for the mandible and submandibular regions are summarized in Table 1.
Exclusion criteria were:
-
Patients diagnosed with HNC, with a specific prescription for local radiotherapy (RT) as an adjuvant to surgical resection therapy of the head and neck district involving an area other than neck lymph nodes in levels III, IV, V and VI, whether or not receiving CTx;
-
Patients unable to attend scheduled appointments
Patient 1 was a 14-year-old girl with squamous cell carcinoma of the nasopharynx (EBV+) who received chemotherapy and RT of the head and neck region. Specifically, the patient underwent neoadjuvant CTx with Cisplatin and 5-Fluorouracil and radiotherapy treatment of the nasopharynx and bilateral neck lymph nodes; during RT, the patient underwent another cycle of CTx with Cisplatin. The patient started RT without the need for any tooth extractions. The patient was fully dentate and did not show periodontitis nor any caries.
Patient 2 was a 57-year-old man diagnosed with squamous cell carcinoma of the left tonsil. He underwent radiotherapy involving the head and neck region, specifically targeting the left tonsil, the area around the left tonsil and left cervical lymph nodes. The patient began treatment without requiring any dental extractions prior to radiotherapy. The patient was fully dentate and did not show periodontitis nor any caries.
Facial stereophotogrammetry acquisitions with 3D stereophotogrammetry (3dMD Trio-system, Atlanta, GA, USA) were performed at three times on all patients who were included, specifically before the beginning of RT (T0), 45 days after the beginning of RT (T1) and 6 months after the beginning of RT (T2).
In addition, to monitor any weight loss associated with cancer treatments, patients’ weight was monitored at various times; specifically, weight was recorded before the start of RT, after approximately 45 days, and 6 months after the start of RT. No patient required enteral feeding during the observation period, and both patients maintained oral intake, although reduced during the acute phase of treatment.

2.2. Qualitative 3D Analysis

The analysis was performed on 3D stereophotogrammetry (3dMD Trio System, Atlanta, GA, USA) three-dimensional face and neck surface acquisitions under standardized conditions.
Each subject was seated upright with the head in Natural Head Position (NHP) with a relaxed facial expression with eyes open and mouth closed during the scan. The scans were performed in a controlled lighting environment using the system’s integrated LED flash units to provide uniform illumination and eliminate shadows. No natural light sources were allowed during acquisition to prevent variability in surface texture representation. The camera system was positioned directly in front of the subject at facial height, and calibration was verified prior to each session. All acquisitions were performed by the same trained operator to minimize operator-related variability. Informed written consent was obtained from each patient before the acquisition of the scan. This standardized protocol was applied identically across all timepoints to ensure consistency in longitudinal comparisons [13].
The 3D image acquisition and processing followed standardized protocols for facial digital imaging, ensuring high intra-observer reliability and accuracy in surface representation. These procedures align with established recommendations for 3D stereophotogrammetry in clinical settings, which emphasize the importance of controlled lighting, fixed camera distance, and neutral facial expressions to minimize measurement artifacts [13]. Furthermore, the management of late radiation effects, such as lymphedema and fibrosis, was interpreted in light of current clinical guidelines for post-radiotherapy soft tissue care [22].
Three-dimensional facial scans were exported as STL (Standard Tessellation Language) files and then imported into Geomagic Control 2014 software (3D Systems, Morrisville, NC, USA).
The STLs of T0 were selected as “reference” and underwent surface-based superimposition into T1 (selected as “test”) and subsequently into T2 (selected as “test”) with the aim of assessing the occurrence of acute and chronic changes compared to T0 due to RT for HNC.
The “3-2-1 Alignment” function and the “Best Fit Alignment” function were used to macroscopically align the “reference” and “test” models. These steps were necessary to facilitate accurate landmark identification in the subsequent steps.
As a first step, the “3-2-1 Alignment” function was performed by selecting the following landmarks respectively:
For the “Plan” section:
  • Left mandibular angle (Ma L) (left junction of the body and the ramus of the mandible)
  • Right mandibular angle (Ma R) (right junction of the body and the ramus of the mandible)
  • Menton (Me) (Inferior point on chin)
For the “Axis” section:
  • Left exocanthion (Exc L) (Outer commissure of the left eye fissure)
  • Right exocanthion (Exc R) (Outer commissure of the right eye fissure)
For the “Origin” section:
  • Nasion (Na) (Deepest point of the nasal bridge)
Subsequently the “Best Fit Alignment” function was performed. On the “reference” and “test” models, the forehead was identified as a stable anatomical region for alignment. The “Lasso” tool into the “Polygon” section was used to manually delineate the desired area. Then, the “Best Fit Alignment” function was applied in order that the “reference” and “test” models were macroscopically aligned by binding to the stabilization region, reducing errors due to local deformations.
Subsequently “RPS (Reference Point System) alignment” function was performed based on 16 predefined surface landmarks. The procedure consisted of the following steps:
On the “reference” model, 16 anatomical landmarks were identified using the “Centroid” tool available in the selection tools. This function calculates the geometric center of a manually selected surface patch. For each landmark, a small and consistent polygonal area was selected around the anatomical feature, and its centroid was computed and saved as a point.
The same procedure was repeated on the “test” model: identical surface areas corresponding to those on the reference were selected, and centroid points were calculated and saved.
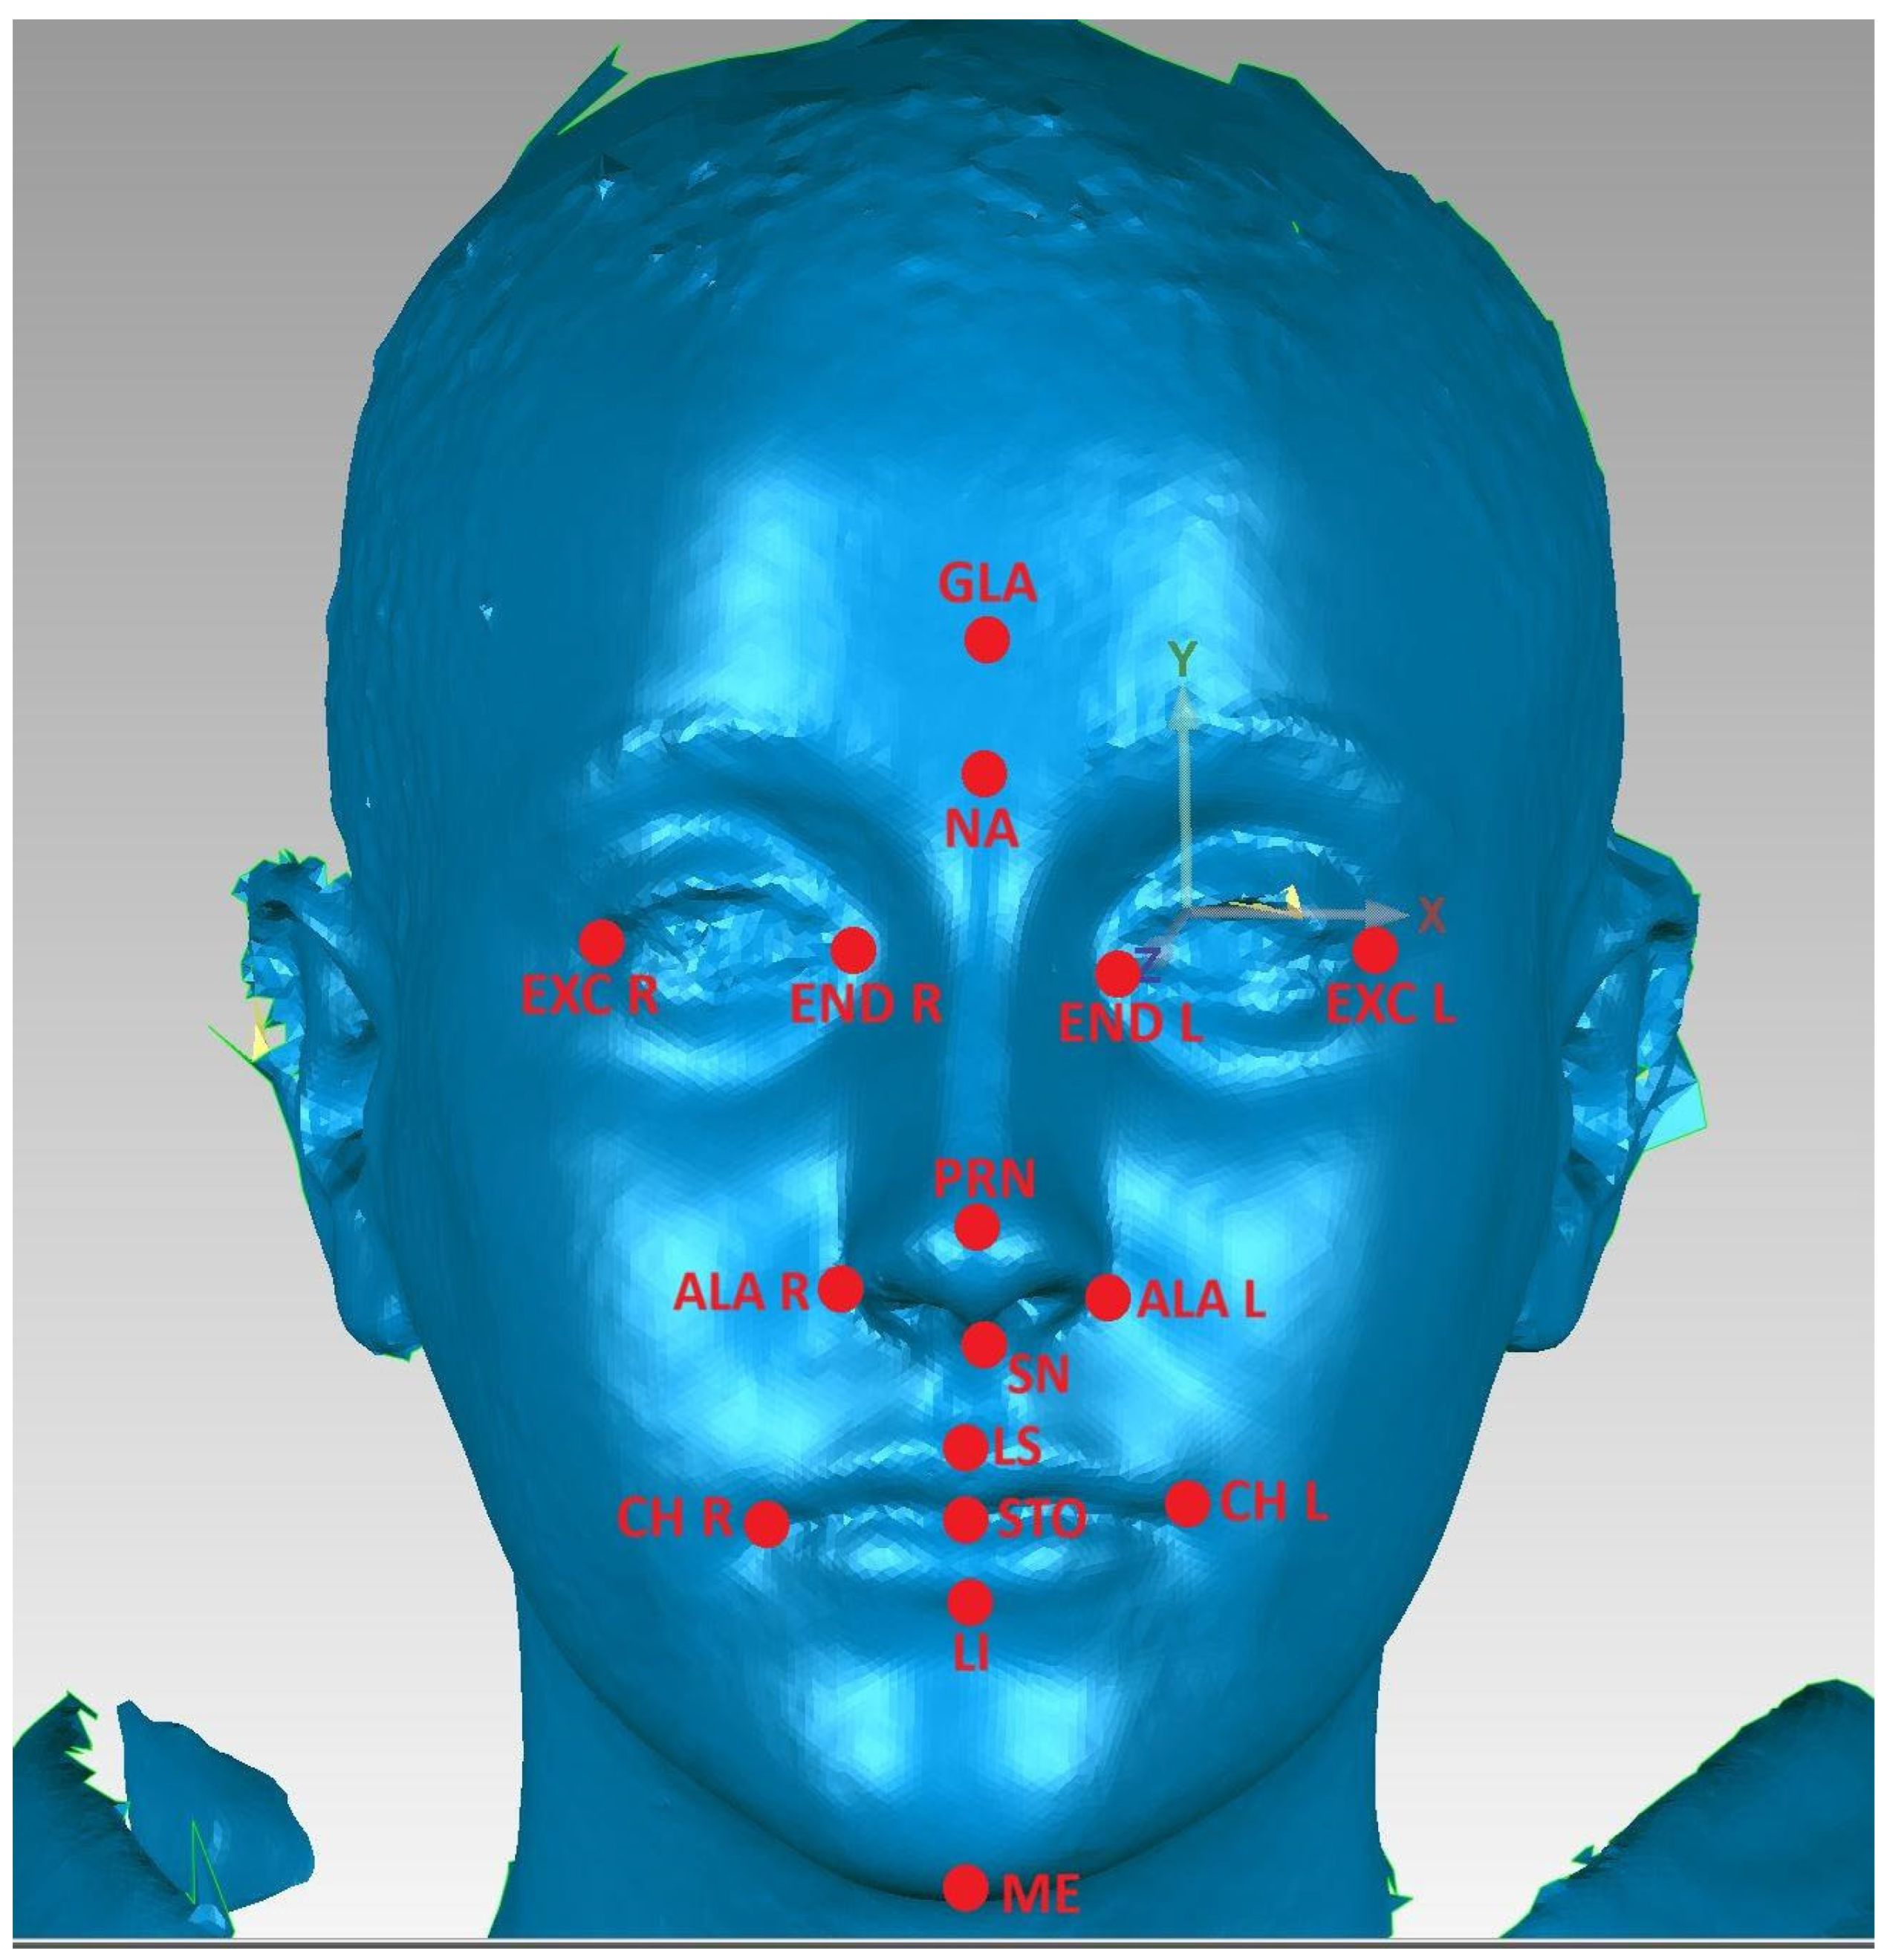
Sixteen anatomical landmarks were selected as surface centroids [23,24] and are shown in Figure 1 and reported in Table 2.
The “RPS Alignment” function was used to align the two models based on the 16 pairs of corresponding centroid points. Each pair was manually assigned, ensuring point-to-point correspondence in the same order.
Then the “3D comparison” function was used, in which the software compares the surface of the “reference” model with that of the “test” model, calculating the differences point by point. This function generated a color map with a deviation range of ±5 mm and a critical threshold at 0.5 mm. The 0.5 mm threshold was selected as a conservative ‘limit of detection’ based on the established technical precision and reproducibility of 3D stereophotogrammetry systems, where mean measurement errors are typically below this value. This ensures that the colorimetric changes represent true morphological variations rather than inherent measurement noise or registration artifacts. The ±5 mm range was chosen to provide optimal visual contrast for the maximum volumetric fluctuations observed, preventing signal saturation on the deviation maps [23].
This function generated a color map with a deviation range of ±5 mm and a critical threshold at 0.5 mm that visually showed the differences between “reference” and “test” models:
  • Green: The test model is within the tolerance limits.
  • Red: Outward displacement of the test model compared to the reference.
  • Blue: Inward displacement of test model material compared to reference.
Furthermore, the superimposition of the different acquisitions enables the calculation of the Root Mean Square. The RMS (Root Mean Square) value reflects the average amplitude of the variation in volume changes in the tissues, providing an overall measure of tissue deformation.

3. Results

Colorimetric 3D deviation maps were used to evaluate volumetric facial and cervical changes over time in two patients undergoing head and neck radiotherapy. The analysis focused on two comparison intervals for each patient: T0 vs. T1 (baseline vs. 45 days from the start of RT) and T0 vs. T2 (baseline vs. 6 months from the start of RT).

3.1. Patient 1 (Figure 2)

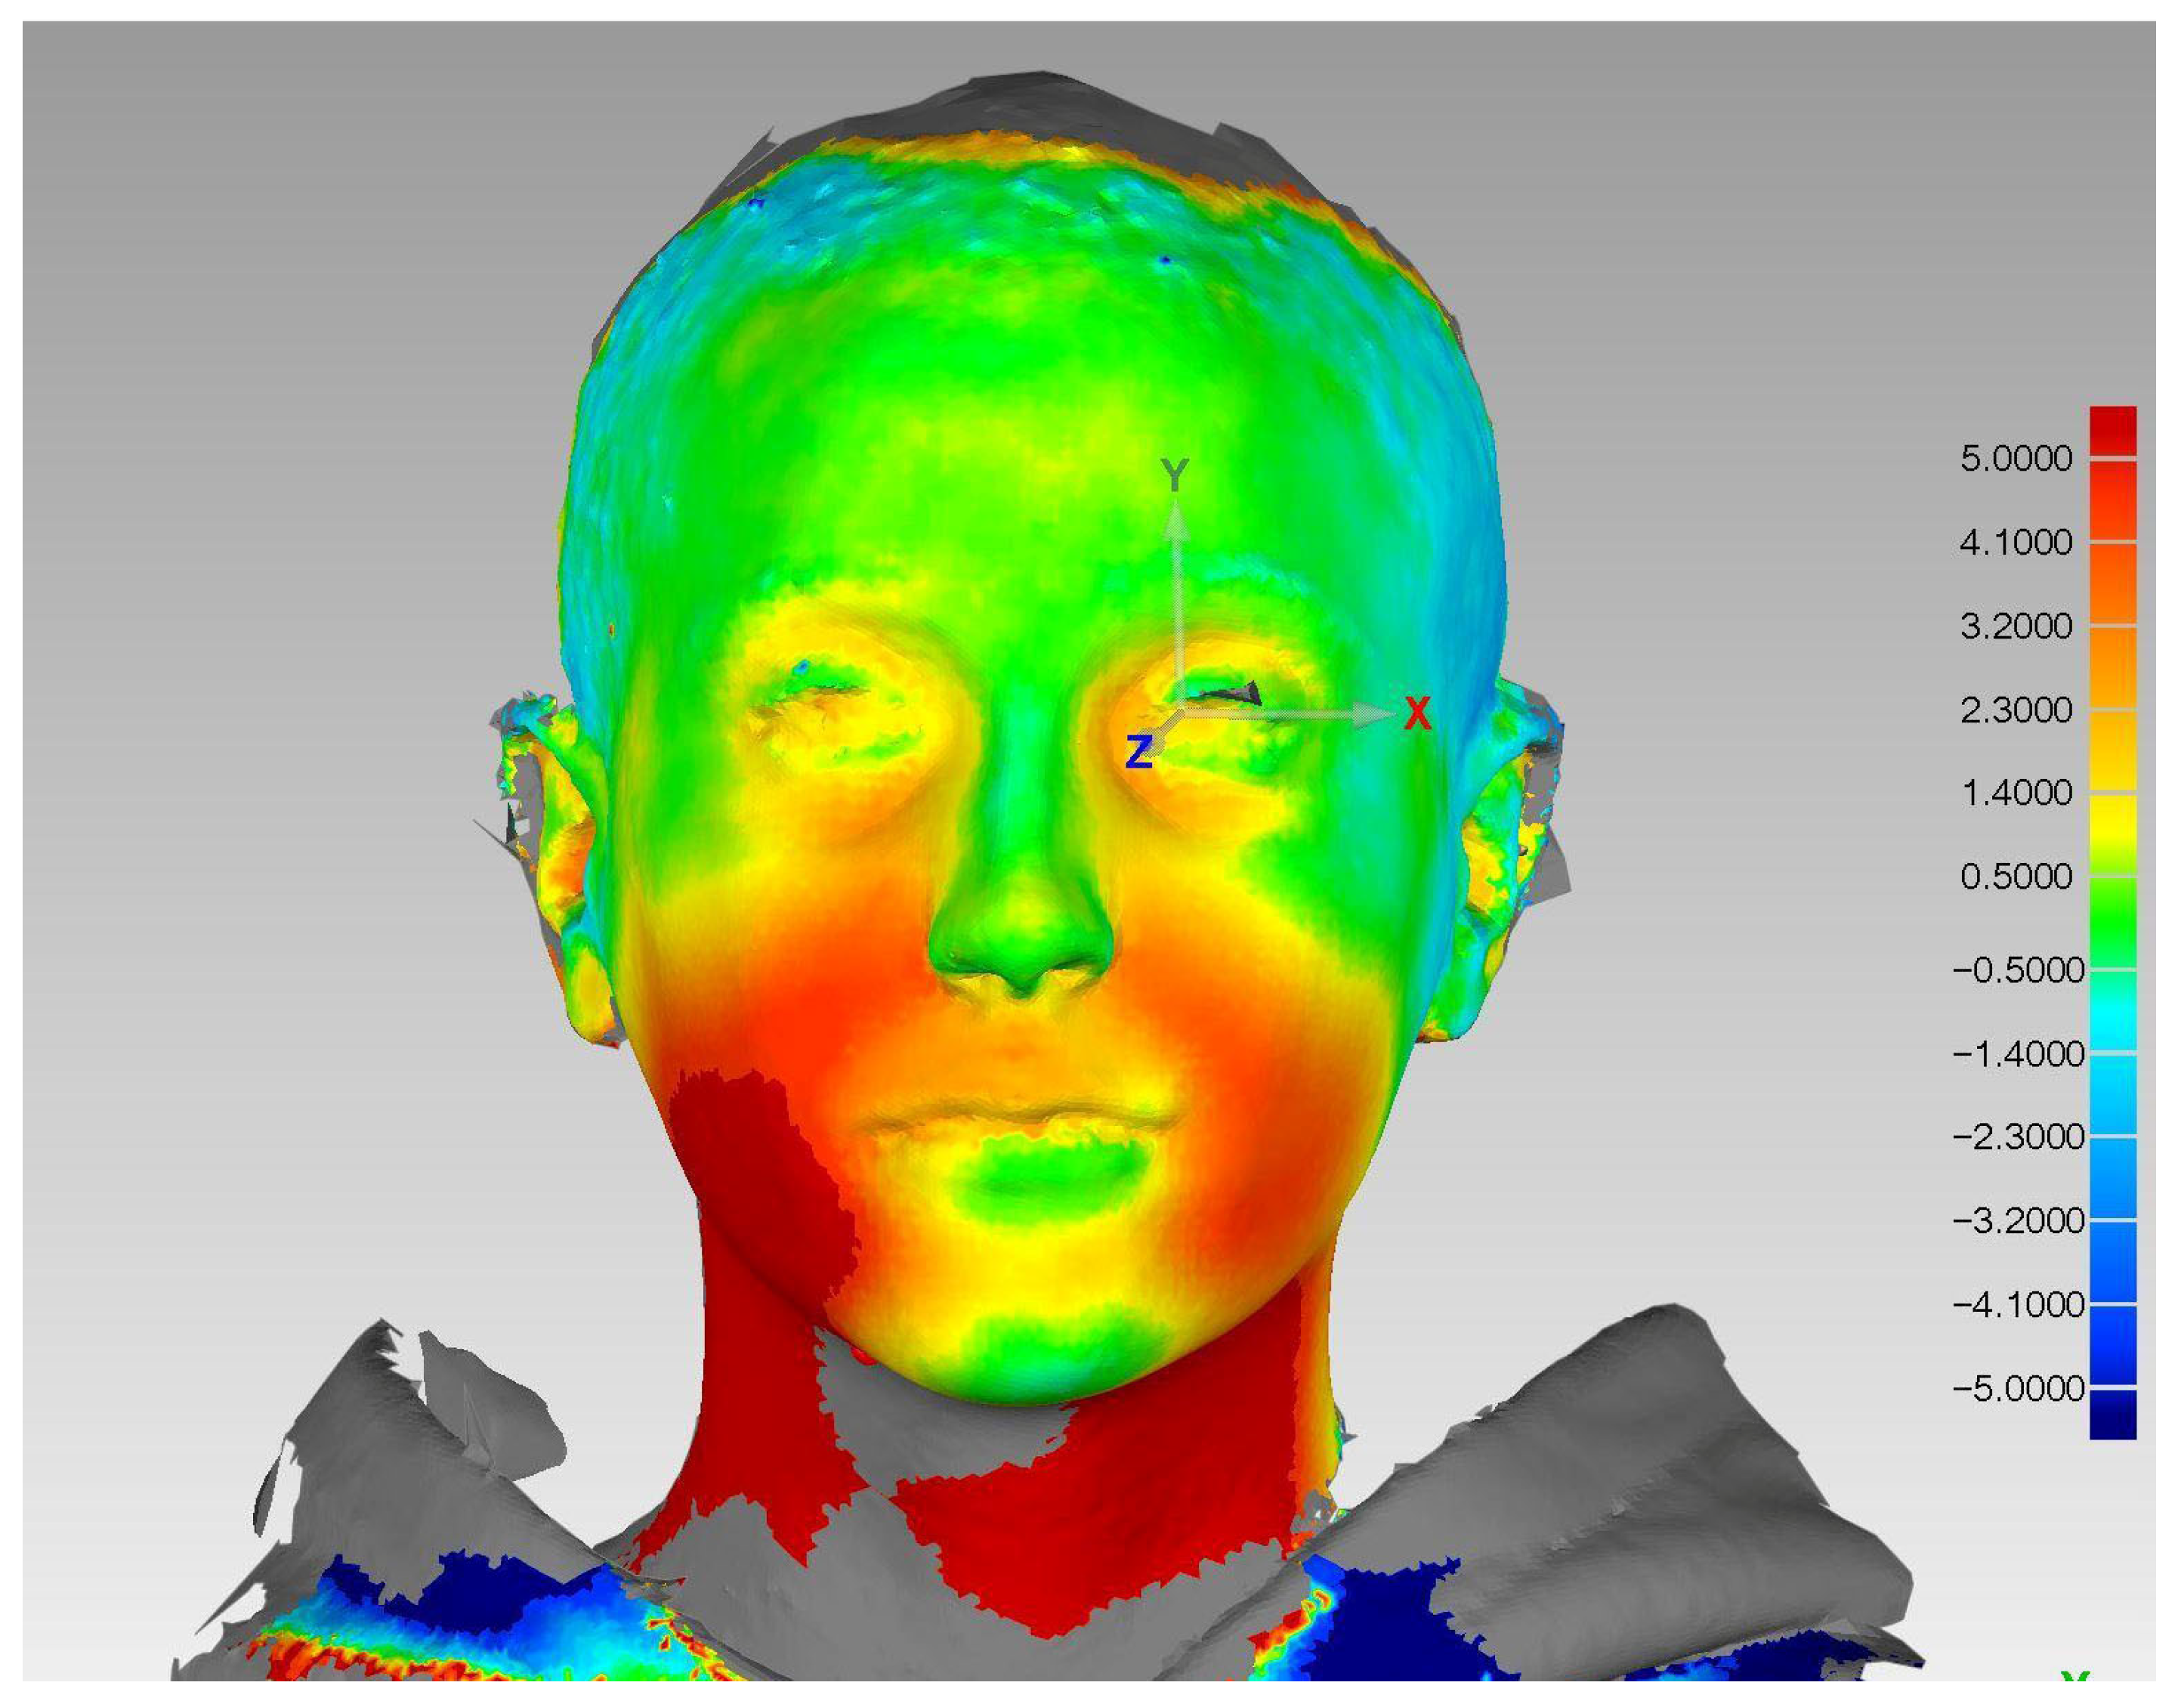
Between T0 and T1, patient 1 showed a moderate reduction in soft tissue volume. The greatest reductions were observed around the mandibular border, in the submandibular area, and in the submandibular region, particularly on the right side, with a standard deviation of 5.46 mm and an RMS of 5.53 mm. This asymmetric pattern of volume reduction may be explained by the combined effects of weight loss (approximately 2 kg, weight changes are reported in Table 3) and the higher radiation dose administered to the left side of the neck, which likely influenced the distribution of tissue changes. The asymmetric volume reduction observed may be correlated with the dosimetric distribution delivered to the submandibular regions (50.8 Gy on the left vs. 60.4 Gy on the right). These findings may be linked to an early loss of soft tissue volume caused by the acute effects of radiotherapy and chemotherapy, including weight loss. The patient did not develop oral mucositis or experience a reduction in oral intake.
Figure 2. Example of a three-dimensional color map created with Geomagic software showing the volumetric facial and cervical changes in patient 1.
Oral 06 00043 g002
In contrast, the colorimetric map obtained from the superimposition of T0 and T2 scans revealed an overall increase in soft tissue volume. This change was especially noticeable in the lower third of the face and neck and may be attributed to late-onset post-radiation swelling but not to the possible weight gain following cancer therapies, because weight remained stable compared to the assessment at 45 days (Table 3). The superimposition resulted in a standard deviation of 5.60 mm and an RMS of 6.16 mm.

3.2. Patient 2 (Figure 3)

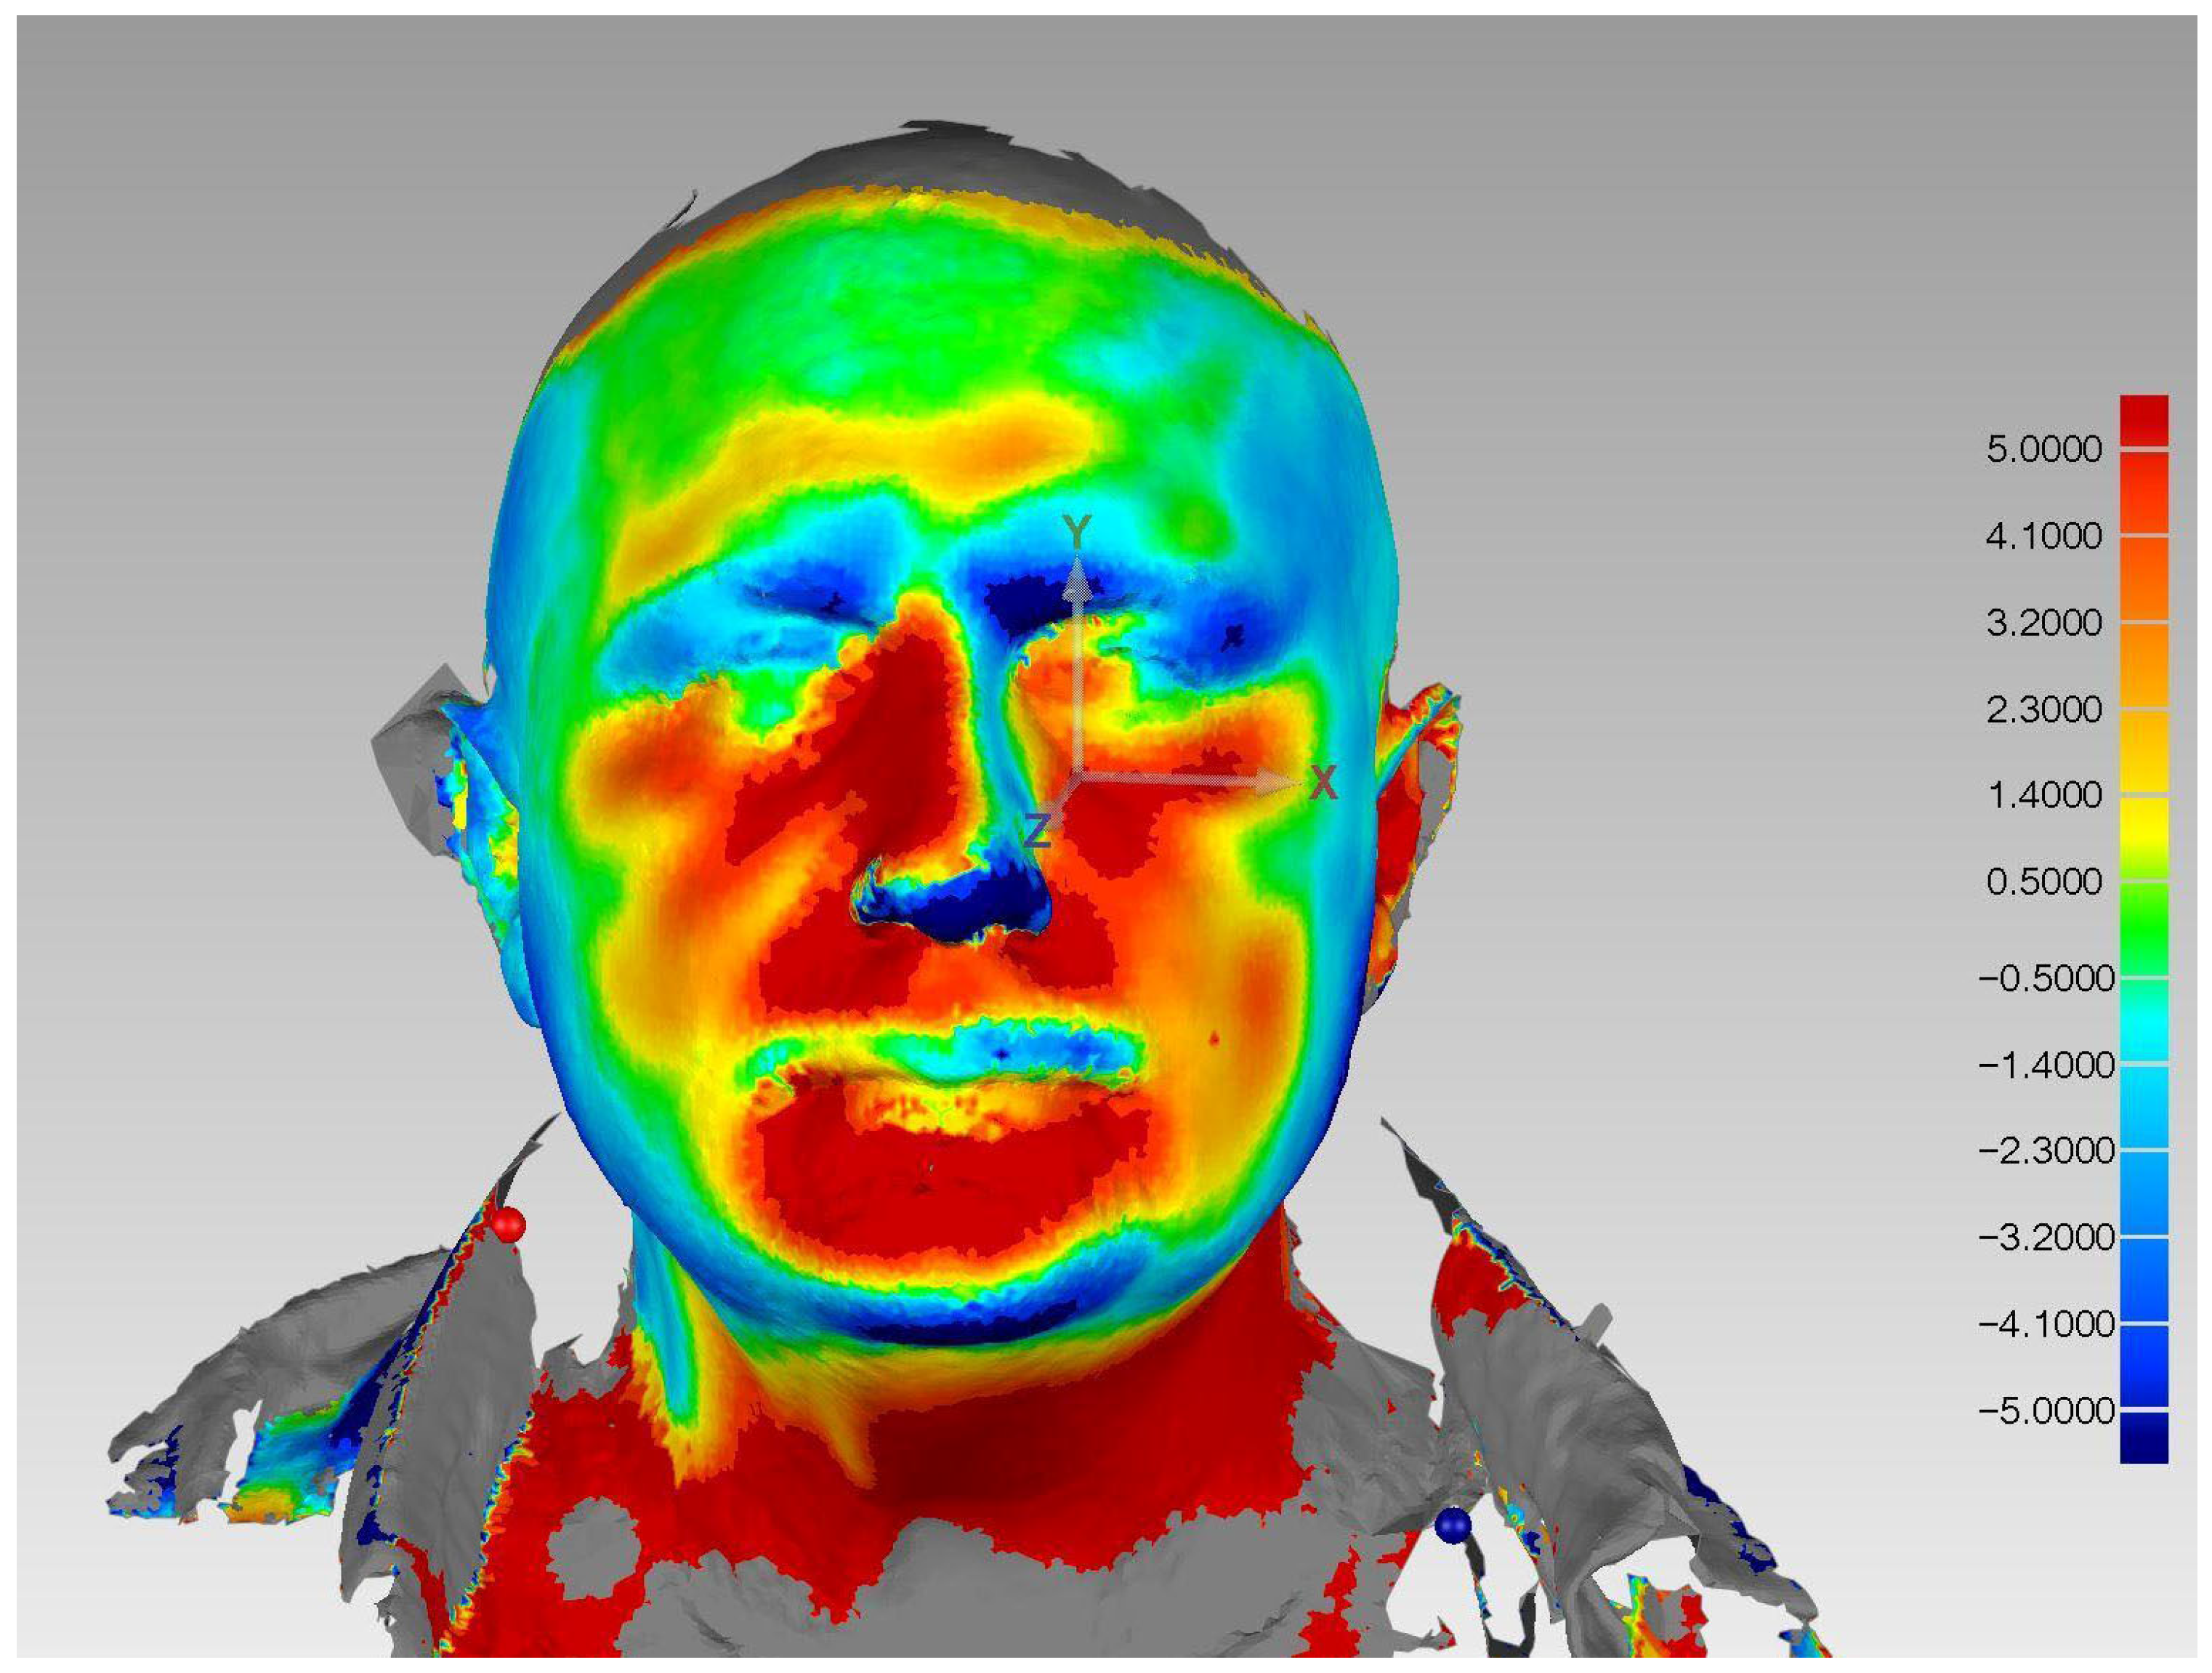
Between T0 and T1, the patient exhibited a pronounced reduction in soft tissue volume, primarily localized on the left side of the face and neck, the regions that were exposed to radiotherapy. The pronounced asymmetric volume loss on the left side may be correlated with the dosimetric distribution; the left submandibular region received a mean dose of 56.6 Gy, whereas the contralateral right side received only 28.8 Gy. This asymmetric volume loss, with a standard deviation of 7.3 mm and an RMS of 5.78 mm, likely reflects both overall weight loss during treatment, caused also by the oral mucositis extending to the soft palate with the consequent onset of dysphagia, and the localized atrophy of irradiated tissues. In fact, 45 days after starting RT, the patient had lost approximately 8 kg (Table 3).
Figure 3. Example of a three-dimensional color map created with Geomagic software showing the volumetric facial and cervical changes in patient 2.
Oral 06 00043 g003
In contrast, the colorimetric map obtained from the superimposition of T0 and T2 scans revealed an overall increase in soft tissue volume, with a more uniform distribution. The increase in soft tissue volume, particularly involving the lower facial and cervical regions, was associated with a standard deviation of 6.71 mm and an RMS of 6.87 mm, and it is probably attributed to delayed radiation-induced edema and post-treatment weight gain following the initial oncologic therapies. In fact, six months after the start of RT, patient 2 had almost completely recovered the weight he had lost in the first 45 days of RT (Table 3).
Regarding patient-reported experiences, although standardized psychometric questionnaires were not administered, qualitative clinical interviews were conducted. Patient 1 (and her parents) reported a mild concern regarding ‘facial thinning’ during the acute phase, which resolved as the patient’s weight stabilized. Patient 2 reported a subjective sensation of ‘tightness’ and ‘heaviness’ in the submental area during the 6-month follow-up, which closely correlated with the volumetric increase (edema/fibrosis) detected by the 3D surface analysis.

4. Discussion

The analysis of soft tissue volume changes between T0 and T1 for both patients revealed alterations that may be associated with the acute and late effects of radiotherapy and cancer treatments. It should be emphasized that several factors commonly affecting patients with head and neck cancer may contribute to facial soft tissue changes independently of RT. In particular, dysphagia, oral mucositis, reduced oral intake, dehydration, and cancer-related catabolic metabolism frequently lead to weight loss and sarcopenia. These conditions may significantly influence facial physiognomy and, therefore, represent important potential confounders when interpreting volumetric facial changes [25,26].
For Patient 1, between T0 and T1, a moderate reduction in soft tissue volume was observed, particularly in the mandibular border, submandibular area, and submental region. The standard deviation of 5.46 mm and RMS of 5.53 mm indicated a localized volume loss, which may be associated with radiotherapy and the weight loss typical during cancer treatments. On the other hand, the comparison between T0 and T2 showed an increase in soft tissue volume, especially in the lower third of the face and neck. This change, as reflected by a standard deviation of 5.60 mm and an RMS of 6.16 mm, may be associated with late effects of RT, like swelling of the tissues, and the weight gain that often follows the completion of radiotherapy.
For Patient 2, a more pronounced and asymmetric reduction in volume was noted between T0 and T1, primarily on the left side of the face and neck, which were the areas treated with radiotherapy. The observed standard deviation of 7.3 mm and RMS of 5.78 mm further suggests the hypothesis of localized atrophy of irradiated tissues, worsened by a general weight loss during therapy. The comparison between T0 and T2 showed a more uniform increase in soft tissue volume, particularly in the lower face and cervical regions, with a standard deviation of 6.71 mm and an RMS of 6.87 mm. These findings suggest that alterations in the face and neck associated with the late effects of RT, such as swelling and lymphoedema, may occur six months after the start of radiotherapy, whilst there is a reduction in tissue volume loss linked to the weight loss that occurred during treatment.
Regarding the selection of technical parameters in the Geomagic Control software (3D Systems, Morrisville, NC, USA), three-dimensional analysis, the guidelines established in other studies were followed. In particular, the threshold value for technical detection was set at 0.5 mm, in accordance with the study by Blasi et al. [23]. Furthermore, according to the study by Ueda et al. [27], an inverse correlation was found between the RMS value and subjective perception; it has been suggested that RMS values exceeding approximately 3 mm are associated with clinically perceptible facial asymmetry. RMS (Root Mean Square) values could provide a quantitative measure of the extent of volume changes, indicating by how much soft tissue volume deviates from the baseline value over time. Therefore, the RMS value measured through three-dimensional facial analysis using 3D stereophotogrammetry could provide a supporting aesthetic assessment [23,27,28].
Therefore, the RMS values of Patient 1 and Patient 2 may reflect region-specific patterns of tissue remodeling potentially associated with RT and weight loss. The middle and lower third of the face and neck, where muscles, glands, and lymphatic structures are well represented, are particularly affected by the consequences of RT, including fibrosis, edema, and fat loss [29]. In contrast, the upper third of the face remained relatively stable, suggesting that certain areas of the face may serve as stable reference points for overlays. This is caused by the different tissue composition in those areas, which makes them less susceptible to changes associated with weight loss but is also associated with the differential administration of radiation and shielding during treatment planning.
The results of this exploratory case report suggest that radiotherapy may be associated with measurable soft tissue alterations, particularly affecting the lower facial and cervical regions [30], but in the present cases, weight changes were systematically recorded during follow-up (Table 3) and showed a temporal relationship with the observed facial volumetric variations, particularly during the acute treatment phase. Therefore, the observed changes should be interpreted as the result of a complex interaction between radiotherapy, systemic treatment, and nutrition-related factors rather than as a direct effect of radiotherapy alone.
Several methods of measuring radiation-induced fibrosis were proposed, each with its own specific strengths and limitations, including indentation, aspiration, magnetic resonance imaging, ultrasound and shear-wave elastography (SWE), an ultrasound technique that maps the elastic properties and stiffness of soft tissues, capable of helping identify or measure the progression of diseases associated with increased tissue stiffness [31].
3D stereophotogrammetry provides an accurate, reproducible, and non-invasive method for evaluating soft tissue fibrosis and offers several advantages in the assessment of soft tissue changes, postoperative swelling, and facial morphology over time, offering strong inter- and intra-observer reliability. Unlike traditional two-dimensional photography or subjective clinical scoring, stereophotogrammetry objectively captures three-dimensional changes in contour and volume, allowing for a more comprehensive assessment of fibrotic tissue. Furthermore, the rapid acquisition and analysis process makes it suitable for routine clinical use, supporting both clinical follow-up and research on treatment outcomes in patients with fibrotic skin conditions [32,33]. The proposed method of facial analysis seems to be reproducible and effective in describing and quantifying RT-induced aesthetic changes and evaluating their progression over time.
A key strength of the present analysis lies in the use of colorimetric deviation maps, which provide a clear and intuitive visual representation of soft tissue alterations over time. These maps enabled the identification of both localized and diffuse changes in facial morphology by highlighting areas of inward displacement (blue), indicating volume loss, and outward displacement (red), reflecting tissue swelling or volume gain. In both patients, the first maps (T0 vs. T1) predominantly displayed blue areas along the mandibular contour and submental region, supporting the presence of acute volume loss likely due to treatment-related weight loss [34].
Another strength of the study relies in the fact that the two patients did not experience significant adverse events related to the oral cavity. Firstly, they did not undergo major oncologic surgery, which has a significant impact on facial appearance, oral health-related quality of life, and weight loss beyond radiotherapy [35,36,37].
Furthermore, at the baseline examination, the oral and dental health of the two patients was assessed, and the patients did not show any edentulism or dental disease, which is an uncommon finding in HNC patients [38]. Consequently, they did not experience dental extractions, which might require antibiotic prophylaxis according to the hospital protocols [39], might be responsible for the onset of ORN [40], and might ultimately impair the quality of life of HNC patients, with reduced food intake and significant weight loss, which might increase also in the long term after RT [41]. The only adverse effect affecting the oral cavity that probably played a decisive role in weight loss during RT was oral mucositis, which affected only patient 2.
On the other hand, the second-stage superimpositions (T0 vs. T2) were characterized by red areas, especially in the lower face and neck, suggesting the onset of post-radiation lymphedema, swelling, and weight gain. Instead, the green areas (representing stability) were consistently observed in the upper third of the face, validating its selection as a stable reference region for superimposition and alignment. This visual and quantitative combination enhances the clinician’s ability to detect subtle changes that may not be perceptible on traditional two-dimensional photographs or clinical examination alone.
Clinically, these morphological changes may have significant implications for patients, potentially affecting their psychosocial well-being and functional capabilities.
Facial slimming, changes in skin color and texture, and alterations in the contours of the neck can significantly impact patients’ perception of their self-image. This can lead to a further reduction in patients’ quality of life and can lead to an increase in social anxiety disorders and depression, especially when facial changes remain stable over time.
The present study represents the first exploratory report of a protocol for facial 3D scans, alignment, and landmark-based comparison in patients suffering from HNC and highlights that alterations of the face and neck do not follow a stable pattern in the first six months after the start of RT.
A key limitation of this study is the limited sample size, which restricts the generalizability of the findings and limits the ability to explore inter-individual variability or adjust for potential confounders. Moreover, the cases included in this case report present marked clinical heterogeneity, including substantial differences in terms of age (14 vs. 57 y.o), growth status, tumor location, and treatment protocols. These differences restrict the possibility of comparison between the two patients and exclude the formulation of generalizable conclusions on changes in facial soft tissues related to RT.
A potential methodological limitation of facial acquisition using 3D stereophotogrammetry is the presence of technical artifacts linked to patient motion, interference caused by hair or beards, and variations in soft tissue tension during image acquisition. These factors can affect the accuracy of surface reconstruction, leading to partial loss of relevant data or slight distortions in soft tissue morphology if they are not carefully controlled during acquisition [13].
Another important limitation concerns the potential influence of nutritional status and weight fluctuations on facial soft-tissue volume. Body weight was systematically monitored throughout the follow-up period, revealing weight changes during treatment, particularly in patient 2. These variations in body weight may have contributed, at least partially, to the facial soft-tissue changes detected by 3D stereophotogrammetry. Therefore, the observed morphological variations should be interpreted as the result of multiple interacting factors, including treatment-related nutritional changes.
However, it is important to acknowledge that other contributing factors may have influenced the observed volumetric changes. While acute volume loss is strongly linked to weight reduction and mucositis, the late-phase volume gain observed at T2 could also be associated with post-radiotherapy inflammatory processes and medication-related fluid retention, such as the use of corticosteroids for symptom management. Although these factors were not specifically quantified in this study, they represent potential confounders that should be considered alongside lymphedema and weight recovery when interpreting late-onset morphological shifts.
Another limitation of this report is the absence of quantitative Patient-Reported Outcomes. Future longitudinal studies with larger cohorts should integrate 3D morphometric data with validated scales to statistically correlate objective tissue changes with subjective psychological distress and quality of life. In addition, the follow-up interval was limited to 6 months post-RT initiation. While this timeframe allowed for the detection of acute volume loss and early-onset swelling, late radiation effects such as progressive fibrosis and chronic lymphedema often follow a more protracted clinical course, potentially manifesting or worsening between 12 and 24 months after treatment and consequently, our findings reflect the early post-therapeutic phase.
A further limitation is that 3D stereophotogrammetry requires specialized equipment, dedicated software, and trained personnel, which may increase costs and limit its widespread use in routine clinical practice.
Future longitudinal studies with extended follow-up are essential to investigate the long-term persistence of these soft-tissue changes and to identify late-onset morphological alterations that may affect patients’ facial aesthetics and functional outcomes over time. Moreover, studies including larger cohorts will be necessary to correlate the quantitative measurements obtained through 3D stereophotogrammetry with clinical findings and patient-reported outcomes. Establishing such correlations could help to define clinically significant thresholds for soft tissue variation and clarify how such measurements might support clinical monitoring and decision-making in patients undergoing radiotherapy for head and neck cancer, whilst presenting a feasible and reproducible protocol for facial surface acquisition, alignment, and landmark-based comparison.

5. Conclusions

The present case report suggests that radiotherapy, also in the absence of surgical intervention, can be associated with progressive, region-specific changes in facial and cervical soft tissues in patients with HNC. However, these morphological variations should be interpreted cautiously, as they may reflect the combined influence of several treatment-related factors, including systemic therapies and changes in nutritional status and body weight during treatment. Consequently, no causal inference can be drawn, and the findings should be considered as purely associative. The morphological changes occurred in a complex clinical context in which radiotherapy was accompanied by treatment-related weight fluctuations, nutritional changes, lymphoedema and oral side effects, all of which may have contributed to the soft tissue alterations detected.
Nevertheless, this report also highlights the potential of 3D photogrammetry in detecting and quantifying soft tissue changes over time, providing a valuable tool for non-invasive and rapid monitoring.

Author Contributions

Conceptualization, C.L. and A.S.; methodology, A.S., C.L., C.R. and E.S.; software, E.S.; validation, R.P., G.G. and C.L.; formal analysis, A.S.; investigation, A.S., D.G. and C.C.N.; resources, E.S.; data curation, A.S.; writing—original draft preparation, A.S., D.G. and C.C.N.; writing—review and editing, C.R., E.S. and C.L.; visualization, R.P. and G.G.; supervision, C.L.; project administration, C.L. All authors have read and agreed to the published version of the manuscript.

Funding

This research received no external funding.

Institutional Review Board Statement

The present protocol was approved by the Ethics Committee of the Università Cattolica del Sacro Cuore (ID. 2132) on 30 August 2023.

Informed Consent Statement

Informed consent was obtained from all subjects involved in the study.

Data Availability Statement

The original contributions presented in this study are included in the article. Further inquiries can be directed to the corresponding author.

Conflicts of Interest

The authors declare no conflicts of interest.

References

  1. Thompson, A.R.; Sewards, I.; Baker, S.R. Cancer and changes in facial appearance: A meta-ethnography of qualitative studies. Br. J. Health Psychol. 2020, 25, 129–151. [Google Scholar] [CrossRef]
  2. Hung, T.M.; Lin, C.R.; Chi, Y.C.; Lin, C.Y.; Chen, E.Y.; Kang, C.J.; Huang, S.F.; Juang, Y.Y.; Huang, C.Y.; Chang, J.T. Body image in head and neck cancer patients treated with radiotherapy: The impact of surgical procedures. Health Qual. Life Outcomes 2017, 15, 165. [Google Scholar] [CrossRef]
  3. Pereira, I.F.; Firmino, R.T.; Meira, H.C.; Vasconcelos, B.C.; Noronha, V.R.; Santos, V.R. Osteoradionecrosis prevalence and associated factors: A ten years retrospective study. Med. Oral Patol. Oral Cir. Bucal 2018, 23, e633–e638. [Google Scholar] [CrossRef]
  4. Louise Kent, M.; Brennan, M.T.; Noll, J.L.; Fox, P.C.; Burri, S.H.; Hunter, J.C.; Lockhart, P.B. Radiation-induced trismus in head and neck cancer patients. Support. Care Cancer 2008, 16, 305–309. [Google Scholar] [CrossRef]
  5. Trotti, A.; Bellm, L.A.; Epstein, J.B.; Frame, D.; Fuchs, H.J.; Gwede, C.K.; Komaroff, E.; Nalysnyk, L.; Zilberberg, M.D. Mucositis incidence, severity and associated outcomes in patients with head and neck cancer receiving radiotherapy with or without chemotherapy: A systematic literature review. Radiother. Oncol. 2003, 66, 253–262. [Google Scholar] [CrossRef]
  6. Sellstrom, D.; Patterson, J.M.; Finch, T.; O’Hara, J.; Haighton, C. Late radiation-associated dysphagia following treatment for head and neck cancer: A scoping review. Support. Care Cancer 2025, 33, 493. [Google Scholar] [CrossRef] [PubMed]
  7. Brook, I. Early side effects of radiation treatment for head and neck cancer. Cancer Radiother. 2021, 25, 507–513. [Google Scholar] [CrossRef] [PubMed]
  8. Bronstein, A.D.; Nyberg, D.A.; Schwartz, A.N.; Shuman, W.P.; Griffin, B.R. Soft-tissue changes after head and neck radiation: CT findings. AJNR Am. J. Neuroradiol. 1989, 10, 171–175. [Google Scholar] [PubMed] [PubMed Central]
  9. Brook, I. Late side effects of radiation treatment for head and neck cancer. Radiat. Oncol. J. 2020, 38, 84–92. [Google Scholar] [CrossRef]
  10. Tallgren, A. The reduction in face height of edentulous and partially edentulous subjects during long-term denture wear A longitudinal roentgenographic cephalometric study. Acta Odontol. Scand. 1966, 24, 195–239. [Google Scholar] [CrossRef]
  11. Rhoten, B.A.; Murphy, B.; Ridner, S.H. Body image in patients with head and neck cancer: A review of the literature. Oral Oncol. 2013, 49, 753–760. [Google Scholar] [CrossRef]
  12. Rohde, R.L.; Adjei Boakye, E.; Challapalli, S.D.; Patel, S.H.; Geneus, C.J.; Tobo, B.B.; Simpson, M.C.; Mohammed, K.A.; Deshields, T.; Varvares, M.A.; et al. Prevalence and sociodemographic factors associated with depression among hospitalized patients with head and neck cancer-Results from a national study. Psycho-Oncol. 2018, 27, 2809–2814. [Google Scholar] [CrossRef]
  13. Heike, C.L.; Upson, K.; Stuhaug, E.; Weinberg, S.M. 3D digital stereophotogrammetry: A practical guide to facial image acquisition. Head Face Med. 2010, 6, 18. [Google Scholar] [CrossRef]
  14. Luhmann, T.; Robson, S.; Kyle, S.; Harley, E.I. Close Range Photogrammetry: Principles, Techniques and Applications; John Wiley and Sons: Hoboken, NJ, USA, 2007. [Google Scholar]
  15. Da Silveira, A.C.; Martinez, O.; Da Silveira, D.; Daw, J.L., Jr.; Cohen, M. Three-dimensional technology for documentation and record keeping for patients with facial clefts. Clin. Plast. Surg. 2004, 31, 141–148. [Google Scholar] [CrossRef] [PubMed]
  16. Wen, Y.F.; Wong, H.M.; McGrath, C.P. Longitudinal Photogrammetric Analysis of Soft Tissue Facial Changes: A Systematic Review of the Literature and a Summary of Recommendations. J. Craniofac. Surg. 2015, 26, 1830–1834. [Google Scholar] [CrossRef] [PubMed]
  17. Ayaz, I.; Shaheen, E.; Aly, M.; Shujaat, S.; Gallo, G.; Coucke, W.; Politis, C.; Jacobs, R. Accuracy and reliability of 2-dimensional photography versus 3-dimensional soft tissue imaging. Imaging Sci. Dent. 2020, 50, 15–22. [Google Scholar] [CrossRef]
  18. Chortrakarnkij, P.; Lonic, D.; Lin, H.H.; Lo, L.J. Establishment of a Reliable Horizontal Reference Plane for 3-Dimensional Facial Soft Tissue Evaluation Before and After Orthognathic Surgery. Ann. Plast. Surg. 2017, 78, S139–S147. [Google Scholar] [CrossRef] [PubMed]
  19. Nike, E.; Radzins, O.; Pirttiniemi, P.; Vuollo, V.; Slaidina, A.; Abeltins, A. Evaluation of facial soft tissue asymmetric changes in Class III patients after orthognathic surgery using three-dimensional stereophotogrammetry. Int. J. Oral Maxillofac. Surg. 2023, 52, 361–370. [Google Scholar] [CrossRef]
  20. Toyoshima, G.H.L.; Pucciarelli, M.G.R.; Neppelenbroek, K.H.; Sforza, C.; Menezes, M.; Oliveira, T.M.; Soares, S. Evaluation by 3D stereophotogrammetry of facial changes in edentulous patients after rehabilitation. J. Appl. Oral Sci. 2021, 30, e20210462. [Google Scholar] [CrossRef]
  21. Gagnier, J.J.; Kienle, G.; Altman, D.G.; Moher, D.; Sox, H.; Riley, D.; CARE Group. The CARE guidelines: Consensus-based clinical case reporting guideline development. Headache 2013, 53, 1541–1547. [Google Scholar] [CrossRef]
  22. Deng, J.; Wulff-Burchfield, E.M.; Murphy, B.A. Late Soft Tissue Complications of Head and Neck Cancer Therapy: Lymphedema and Fibrosis. J. Natl. Cancer Inst. Monogr. 2019, 2019, lgz005. [Google Scholar] [CrossRef]
  23. Blasi, A.; Nucera, R.; Ronsivalle, V.; Candida, E.; Grippaudo, C. Asymmetry index for the photogrammetric assessment of facial asymmetry. Am. J. Orthod. Dentofac. Orthop. 2022, 162, 394–402. [Google Scholar] [CrossRef]
  24. Farkas Leslie, G. Anthropometry of the Head and Face, 2nd ed.; Raven Press: New York, NY, USA, 1994. [Google Scholar]
  25. Bressan, V.; Stevanin, S.; Bianchi, M.; Aleo, G.; Bagnasco, A.; Sasso, L. The effects of swallowing disorders, dysgeusia, oral mucositis and xerostomia on nutritional status, oral intake and weight loss in head and neck cancer patients: A systematic review. Cancer Treat. Rev. 2016, 45, 105–119. [Google Scholar] [CrossRef]
  26. Baxi, S.S.; Schwitzer, E.; Jones, L.W. A review of weight loss and sarcopenia in patients with head and neck cancer treated with chemoradiation. Cancers Head Neck 2016, 1, 9. [Google Scholar] [CrossRef] [PubMed]
  27. Ueda, N.; Imai, Y.; Yamakawa, N.; Yagyuu, T.; Tamaki, S.; Nakashima, C.; Nakagawa, M.; Kirita, T. Assessment of facial symmetry by three-dimensional stereophotogrammetry after mandibular reconstruction: A comparison with subjective assessment. J. Stomatol. Oral Maxillofac. Surg. 2021, 122, 56–61. [Google Scholar] [CrossRef] [PubMed]
  28. Tangthaweesuk, N.; Raocharernporn, S. The accuracy of three-dimensional facial scan obtained from three different 3d scanners. PLoS ONE 2025, 20, e0322358. [Google Scholar] [CrossRef] [PubMed]
  29. Kim, J.; Shin, E.S.; Kim, J.E.; Yoon, S.P.; Kim, Y.S. Neck muscle atrophy and soft-tissue fibrosis after neck dissection and postoperative radiotherapy for oral cancer. Radiat. Oncol. J. 2015, 33, 344–349. [Google Scholar] [CrossRef]
  30. Baudelet, M.; Van den Steen, L.; Tomassen, P.; Bonte, K.; Deron, P.; Huvenne, W.; Rottey, S.; De Neve, W.; Sundahl, N.; Van Nuffelen, G.; et al. Very late xerostomia, dysphagia, and neck fibrosis after head and neck radiotherapy. Head Neck 2019, 41, 3594–3603. [Google Scholar] [CrossRef]
  31. Alapati, R.; Bon Nieves, A.; Wagoner, S.; Lawrence, A.; Jones, J.; Bur, A.M. Quantitative measurements of radiation-induced fibrosis for head and neck cancer: A narrative review. Laryngoscope Investig. Otolaryngol. 2024, 9, e1249. [Google Scholar]
  32. Peake, M.; Pan, K.; Rotatori, R.M.; Powell, H.; Fowler, L.; James, L.; Dale, E. Incorporation of 3D stereophotogrammetry as a reliable method for assessing scar volume in standard clinical practice. Burns 2019, 45, 1614–1620. [Google Scholar] [CrossRef]
  33. Buitenhuis, M.B.; Klijn, R.J.; Rosenberg, A.J.W.P.; Speksnijder, C.M. Reliability of 3D Stereophotogrammetry for Measuring Postoperative Facial Swelling. J. Clin. Med. 2022, 11, 7137. [Google Scholar] [CrossRef]
  34. Chophy, A.; Gupta, S.; Singh, P.; Sharma, N.; Krishnan, A.S.; Namitha, R.S.; Roushan, R.; Rastogi, A.; Nair, S.; Diundi, A.; et al. Evaluation of dosimetric and volumetric changes in target volumes and organs at risk during adaptive radiotherapy in head and neck cancer: A prospective study. J. Med. Imaging Radiat. Sci. 2023, 54, 306–311. [Google Scholar] [CrossRef] [PubMed]
  35. Castagnola, R.; Rupe, C.; Gioco, G.; Almadori, G.; Galli, J.; Tagliaferri, L.; Cassano, A.; Gallenzi, P.; Lajolo, C. Clinical outcomes of teeth adjacent to the site of mandibulotomy or mandibulectomy in patients with head and neck cancer: Results from a multidisciplinary mono-institutional head and neck tumor board. BMC Oral Health 2023, 23, 357. [Google Scholar] [CrossRef]
  36. Calabrese, L.; Bruschini, R.; Giugliano, G.; Ostuni, A.; Maffini, F.; Massaro, M.A.; Santoro, L.; Navach, V.; Preda, L.; Alterio, D.; et al. Compartmental tongue surgery: Long term oncologic results in the treatment of tongue cancer. Oral Oncol. 2011, 47, 174–179. [Google Scholar] [CrossRef]
  37. Ottosson, S.; Lindblom, U.; Wahlberg, P.; Nilsson, P.; Kjellén, E.; Zackrisson, B.; Levring Jäghagen, E.; Laurell, G. Weight loss and body mass index in relation to aspiration in patients treated for head and neck cancer: A long-term follow-up. Support. Care Cancer 2014, 22, 2361–2369. [Google Scholar] [CrossRef]
  38. Rupe, C.; Basco, A.; Schiavelli, A.; Cassano, A.; Micciche’, F.; Galli, J.; Cordaro, M.; Lajolo, C. Oral Health Status in Patients with Head and Neck Cancer before Radiotherapy: Baseline Description of an Observational Prospective Study. Cancers 2022, 14, 1411. [Google Scholar] [CrossRef]
  39. Rupe, C.; Gioco, G.; Massaccesi, M.; Tagliaferri, L.; Pastore, F.; Micciché, F.; Galli, J.; Mele, D.; Specchia, M.L.; Cassano, A.; et al. Osteoradionecrosis incidence in pre-radiation teeth extractions: A prospective study. Oral Dis. 2024, 30, 5129–5139. [Google Scholar] [CrossRef]
  40. Berrone, M.; Lajolo, C.; De Corso, E.; Settimi, S.; Rupe, C.; Crosetti, E.; Succo, G. Cooperation between ENT surgeon and dentist in head and neck oncology. Acta Otorhinolaryngol. Ital. 2021, 41, S124–S137. [Google Scholar] [CrossRef] [PubMed]
  41. Kramer, B.; Wenzel, A.; Boerger, M.; Lippert, B.; Feist, K.; Petrasch, R.; Riemann, R.; Hoermann, K.; Aderhold, C. Long-Term Quality of Life and Nutritional Status of Patients with Head and Neck Cancer. Nutr. Cancer 2019, 71, 424–437. [Google Scholar] [CrossRef]
Figure 1. Example of anatomical landmarks selected as surface centroids on Geomagic software 3D superimpositions.
Oral 06 00043 g001
Table 1. Detailed mean and maximum doses for the mandible and submandibular regions.
ParameterPatient 1 (14 y, F)Patient 2 (57 y, M)
DiagnosisNasopharyngeal SCCLeft Tonsil SCC
Total Dose/Fx66.6 Gy/37 fx (1.8 Gy/fx)66 Gy/30 fx (2.2 Gy/fx)
RT FieldNasopharynx + Bilateral neck (II–VII)Left Tonsil + Ipsilateral neck (I–IV)
Mandible DoseMean: 36.5 Gy (Max: 62.5 Gy)Mean: 23.2 Gy (Max: 56.6 Gy)
Submandibular (L)Mean: 50.8 Gy (Max: 61.5 Gy)Mean: 56.6 Gy (Max: 66.3 Gy)
Submandibular (R)Mean: 60.4 Gy (Max: 68.3 Gy)Mean: 28.8 Gy (Max: 43.8 Gy)
Weight (T0/T1)51 kg/49 kg108 kg/100 kg
Table 2. Anatomical landmarks selected and surface centroids.
No.Landmark NameAbbreviationDescription
1GlabellaGlaMost prominent midline point between the eyebrows
2NasionNaDeepest point of the nasal bridge
3PronasalePrnMost protruded point of the apex nasi
4SubnasaleSnMidpoint of angle at columella base
5Labial SuperiusLsMidpoint of the upper vermilion line
6StomionStoMidpoint of the mouth orifice
7Labial InferiusLiMidpoint of the lower vermilion line
8MentonMeInferior point on chin
9Exocanthion RightExc ROuter commissure of the right eye fissure
10Exocanthion LeftExc LOuter commissure of the left eye fissure
11Endocanthion RightEnd RInner commissure of the right eye fissure
12Endocanthion LeftEnd LInner commissure of the left eye fissure
13Alar Curvature RightAla RMost lateral point on the right alar contour
14Alar Curvature LeftAla LMost lateral point on the left alar contour
15Cheilion RightCh RPoint located at the right lateral labial commissure
16Cheilion LeftCh LPoint located at the left lateral labial commissure
Table 3. Patient conditions, therapy, RT dose, weight course and nutritional status.
SexAgeDiagnosisTherapyRT DoseWeight Course T0Weight Course T1 (45 Days)Weight Course T2 (6 Months)Enteral Feeding Oral Supplements
Patient 1Female14 y.o.Nasopharynx squamous cell carcinoma CTx and RT66.6 Gy/37 fx (1.8 Gy/fx)51 kg49 kg49 kgNoNo
Patient 2Male57 y.o.Left Tonsil squamous cell carcinomaRT66 Gy/30 fx (2.2 Gy/fx)108 kg100 kg106 kgNo No
Disclaimer/Publisher’s Note: The statements, opinions and data contained in all publications are solely those of the individual author(s) and contributor(s) and not of MDPI and/or the editor(s). MDPI and/or the editor(s) disclaim responsibility for any injury to people or property resulting from any ideas, methods, instructions or products referred to in the content.