
Article

Stakeholder-Informed Destination Planning Framework for Regional Tourism Routing and Development

by
Kasin Ransikarbum
1,*,
Woramol C. Watanabe
2,
Patchanee Patitad
2 and
Jettarat Janmontree
3
1
Department of Industrial Engineering, Ubonratchathani University, Ubon Ratchathani 34190, Thailand
2
Faculty of Logistics and Digital Supply Chain, Naresuan University, Phitsanulok 65000, Thailand
3
Institute of Logistics and Material Handling Systems, Otto von Guericke University Magdeburg, 39106 Magdeburg, Germany
*
Author to whom correspondence should be addressed.
Tour. Hosp. 2026, 7(8), 225; https://doi.org/10.3390/tourhosp7080225
Submission received: 2 May 2026 / Revised: 12 July 2026 / Accepted: 22 July 2026 / Published: 1 August 2026

Abstract

Tourism is a key driver of regional development, particularly in emerging destinations around the globe. Despite its critical role, aligning tourism services with tourists’ needs requires effective planning and management that reflect key stakeholder perceptions and resource allocation to enhance the overall competitiveness of a destination. This study aims to integrate the perspectives of tourists and tourism service providers using a logistics performance framework to support data-driven tourism management. Using the Best–Worst Method (BWM), stakeholder-based evaluations are conducted to prioritize key decision criteria, including economic efficiency, reliability, responsiveness, and safety, which are essential for supporting operational efficiency and tourism planning. Next, a Multi-Objective Traveling Salesman Problem (MOTSP) model is applied to evaluate travel routing and ensure efficient resource allocation. Data collection and analysis are conducted for popular tourist attractions, using a case study of Ubon Ratchathani, Thailand. The findings provide practical insights for regional planners and tourism managers seeking to enhance infrastructure planning through stakeholder-informed and logistics-driven decision-making for regional tourism development.

1. Introduction

Tourism has long been recognized as a powerful catalyst for economic and regional development, especially in emerging destinations across nations striving to gain a competitive edge in the global market. Strategic Tourism Planning and Management (TPM) not only stimulates local economies through job creation but also supports the expansion of infrastructure and community welfare (Camilleri, 2024). However, as global tourism continues to expand, increasing pressure to deliver high-quality experiences that meet the evolving preferences of tourists is inevitable. This challenge is particularly critical in developing regions, where infrastructure and planning may lag behind the growth in tourist demand (Ahmed, 2025). A central challenge in TPM lies in aligning the supply of services with tourists’ expectations. In many regions, decision-making is often top-down and lacks adequate stakeholder engagement, which can lead to inefficiencies in service delivery and reduced destination competitiveness. Therefore, stakeholder perceptions, especially those of tourists and service providers, are crucial data that should be incorporated into the planning process.
Evaluating TPM using logistics-related criteria is crucial for ensuring efficient and effective tourism operations and supporting long-term regional destination management. Logistics performance criteria play an important role in many service- and product-oriented operations in today’s industries. They also directly influence the value of tourist experiences and the operational effectiveness of service providers in the tourism and logistics sectors (Puchongkawarin & Ransikarbum, 2021). By systematically analyzing these criteria, policymakers and planners can identify service gaps and optimize resource allocation. Moreover, integrating a logistics-based analytical model further enhances this process by enabling the evaluation of various planning scenarios with quantifiable economic outcomes. This approach not only supports the strategic alignment of tourism services with high tourism demand but also promotes the efficient use of resources, thereby fostering long-term regional competitiveness (Agrawal et al., 2022).
According to the United Nations World Tourism Organization (UNWTO, 2023), international tourist arrivals reached 90% of pre-pandemic levels in 2023, highlighting a strong recovery in global travel. United Nations World Tourism Organization (UNWTO, 2023) also notes that tourism has the potential to enhance infrastructure and accessibility, support revitalization efforts, and help safeguard cultural and natural resources, thereby contributing to sustainable cities and communities as outlined in the Sustainable Development Goals (SDGs). In Thailand, tourism contributed approximately 9% to the national GDP in 2024, with regional destinations such as Ubon Ratchathani experiencing a steady increase in domestic tourist flows. In particular, the tourism sector generated 2.6 trillion THB in revenue in 2024, marking a 25% increase compared to the previous year (World Bank, 2025). Despite this growth, infrastructure and logistics systems in secondary cities in Thailand remain underdeveloped, with logistical challenges identified as barriers to tourist satisfaction (Cheunkamon et al., 2022; Nopphakate & Aunyawong, 2022). These figures underscore the need for data- and stakeholder-driven infrastructure planning to enhance tourism development in emerging destinations.
To address complex challenges in TPM, the integration of structured decision-making tools offers a promising solution. Various Multi-Criteria Decision Analysis (MCDA) methods have proven effective in quantifying stakeholder preferences and prioritizing performance under conflicting criteria (Vatankhah et al., 2023; Ransikarbum et al., 2024). When combined with logistics performance frameworks and optimization models, these tools enable policymakers to evaluate stakeholder needs and support more effective resource allocation, including decisions related to rest area placement and tourism routing based on quantifiable inputs. Building on this, this study integrates MCDA with a logistics optimization approach by linking the Best–Worst Method (BWM) with a Multi-Objective Traveling Salesman Problem (MOTSP). The BWM is employed to derive stakeholder-informed weights for key criteria, which are then incorporated into the MOTSP to evaluate routing alternatives under multiple objectives. This sequential integration supports more rational and regionally adaptive decision-making that reflects both the supply-side perspectives of service providers and the demand-side expectations of tourists.
Using a case study in Ubon Ratchathani Province, Thailand, the proposed framework demonstrates how decision-makers can prioritize criteria and subsequently inform routing solutions through a multi-objective optimization model. In this study, tourism routing is treated as a destination planning mechanism in which tourism routing plans can be aligned with stakeholder priorities related to economic efficiency, reliability, responsiveness, and safety. In this sense, the study focuses on the operational dimension of destination management, showing how stakeholder preferences can be incorporated into routing and infrastructure planning to support more informed, adaptive, and risk-aware decision-making in regional and emerging tourism destinations. The findings provide practical insights for policymakers and planners by demonstrating the value of data-driven and participatory approaches for strengthening regional tourism competitiveness. The research contributions are summarized as follows.
  • This study addresses the research gap in aligning tourism planning with both tourist and service provider perspectives by integrating stakeholder input through the BWM, thereby ensuring more inclusive, stakeholder-informed, and demand-responsive tourism planning.
  • This study contributes a new conceptual perspective by bridging stakeholder-based decision analysis and spatial routing optimization within a unified destination management framework. An integrated decision-making framework that combines stakeholder preference analysis (BWM) with the MOTSP model is proposed, enabling destination managers to translate stakeholder priorities into spatial route decisions.
  • This study develops a logistics performance framework for tourism management based on economic efficiency, reliability, responsiveness, and safety. The framework extends destination management research by operationalizing these dimensions as planning criteria that influence both tourist experiences and destination performance.
  • This study demonstrates how tourism routing decisions can function as an operational instrument of destination management. By translating stakeholder priorities into routing and resource allocation outcomes, the framework links logistics decisions with broader tourism planning objectives.
  • This study provides practical, region-specific insights through a case study in Ubon Ratchathani, Thailand, demonstrating how decision science- and data-driven logistics planning can support tourism and infrastructure development in secondary cities.
The remainder of the paper is organized as follows. Section 2 reviews the relevant literature. Section 3 outlines the proposed methodology and integrated framework. Section 4 presents the results along with a discussion. Section 5 highlights practical and managerial implications, while Section 6 concludes the study and suggests directions for future research.

2. Literature Review

2.1. Stakeholder-Centric Decision Making in Tourism

TPM has increasingly emphasized the importance of involving diverse stakeholder groups to ensure more inclusive and effective outcomes. These stakeholders, including tourists, local communities, government agencies, and service providers, typically have differing but interrelated interests that shape the planning landscape and decision-making across various regional destinations. Recognizing these diverse interests can enhance decision-making, mitigate conflicts, and foster long-term cooperation among tourism actors (ur Rehman et al., 2024). From the perspective of Stakeholder Theory, tourism destinations can be viewed as multi-actor systems in which diverse stakeholders influence planning outcomes through their differing interests, expectations, and levels of decision-making power (Donaldson & Preston, 1995; Freeman, 2010; Panagiotopoulou & Skoultsos, 2025). In tourism studies, stakeholder-oriented approaches have been widely associated with destination governance and participatory planning, emphasizing the importance of incorporating multiple perspectives into tourism development processes (Jánová et al., 2025). Effective tourism planning therefore requires mechanisms that can systematically translate stakeholder preferences into practical operational and managerial decisions. In many cases, especially in emerging or secondary destinations, TPM remains top-down and centralized, failing to incorporate local feedback or insights from tourist experiences (Bramwell & Lane, 2000; Priatmoko et al., 2021). This disconnect can lead to missed opportunities for strategic development that genuinely reflects the needs of diverse stakeholders.
Additionally, tourism planning is grounded in destination management and destination governance literature, which conceptualizes destinations as coordinated systems of interdependent actors, resources, infrastructure, and supporting services. Foundational tourism studies argue that destination development and competitiveness depend not only on core tourism resources but also on the ability of destination managers and governance structures to coordinate accessibility, service delivery, infrastructure provision, and risk management across multiple stakeholder groups (Bramwell & Lane, 2000; Ritchie & Crouch, 2003; Crouch, 2011). In this perspective, stakeholder involvement is a managerial requirement for aligning tourism development with heterogeneous expectations. Recent destination governance research similarly emphasizes that effective destination management requires participatory and evidence-based mechanisms capable of integrating stakeholder preferences into practical planning decisions, particularly in destinations characterized by fragmented service systems and multiple public–private actors (Bono i Gispert et al., 2023; Çakar, 2023; Bono i Gispert et al., 2024). Accordingly, stakeholder-centric tourism planning can be viewed as a governance mechanism through which stakeholder priorities are translated into destination-level decisions concerning infrastructure, accessibility, service coordination, and visitor management.
In response to these limitations, researchers have increasingly turned to structured decision-making approaches to support stakeholder inclusion. In this study, a stakeholder-informed approach refers to the integration of stakeholder priorities into operational tourism planning decisions, particularly routing and resource allocation, which aligns with the tourism planning literature emphasizing collaborative and evidence-based decision-making in destination management (Walas et al., 2024; Panagiotopoulou & Skoultsos, 2025). Traditional MCDA tools have been widely used to capture decision makers’ judgment and local knowledge in several studies (Wattanasaeng & Ransikarbum, 2024). While effective to an extent, these methods may lack consistency in weight estimation and can be time-intensive, particularly when dealing with large sets of criteria (Corrente et al., 2024). More recent developments in decision science have positioned MCDA as a robust framework for evaluating multiple criteria and/or alternatives based on input from diverse stakeholder groups. In recent years, the application of MCDA tools has emerged as a structured approach to incorporating diverse stakeholder perspectives and balancing complex decision criteria (Janmontree et al., 2025; Kumar, 2025). A growing body of literature demonstrates how these tools support the evaluation of tourism development initiatives within tourism development contexts. Accordingly, MCDA-based approaches provide a useful mechanism for translating stakeholder preferences into practical planning and managerial decisions in tourism systems.
Several researchers have conducted literature reviews related to sustainable tourism planning. For instance, Correia and Kozak (2022) highlight that tourism research has traditionally focused on analyzing the industry’s impacts and performance, revealing a gap in addressing broader interdisciplinary perspectives. The authors suggest that emerging themes such as innovation, entrepreneurship, governance, and the role of human activity need greater emphasis to reflect evolving trends both within and beyond the tourism research community. Moreover, Manumpil et al. (2023) examine the application of MCDA methods in sustainable and low-carbon tourism studies. Their findings indicate that the most frequently studied regional case studies are located in China, Italy, Taiwan, Spain, and India. The most commonly used analytical tools include the Analytic Hierarchy Process (AHP), followed by Data Envelopment Analysis (DEA), fuzzy techniques, and Geographic Information Systems (GIS). Existing studies also evaluate sustainable development in TPM using diverse tools and case studies. For example, Adamczyk and Wałdykowski (2022) examine sustainable TPM through a case study of a national park in Poland, evaluating tourism activities categorized as sustainable options, such as hiking, cycling, and horseback riding. The authors also assess environmentally impactful investments and ecological costs using the AHP. In addition, Gu et al. (2022) evaluate the tourism attractiveness of nature-based destinations by integrating AHP with fuzzy techniques, identifying four key dimensions: tourist attractions, accessibility, development conditions, and supporting services. More recently, Bader (2025) evaluates the global competitiveness of tourism villages in Jordan using MCDA tools, highlighting tourist facilities and environmental sustainability as influential criteria. Similarly, Salehipour et al. (2025) develop a framework based on an MCDA approach to assess the tourism development potential of Persian caravanserais, with a specific focus on a case study in Iran. The key criteria in their analysis include network connectivity and access, tourist attractions, climatic conditions, geomorphological features and hazards, and facilities.
While existing studies underscore the significance of sustainability-related criteria, tourism accessibility, and tourism mobility in TPM, most studies evaluate tourism routing, destination attractiveness, or smart tourism systems with limited attention given to how stakeholder priorities can be systematically translated into operational routing and infrastructure planning decisions. In particular, existing tourism routing and smart tourism studies often overlook the managerial implications of balancing stakeholder-informed logistics performance dimensions. Consequently, there remains a theoretical and practical gap in understanding how stakeholder priorities can be operationalized into spatial and logistical planning decisions that support both regional tourism competitiveness and destination management. Accordingly, this study investigates how different stakeholder groups prioritize logistics performance criteria and how these priorities can be translated into spatial route decisions for destination planning.

2.2. Logistics Performance in Tourism Planning

Logistics performance plays a crucial role in enhancing efficiency and effectiveness across diverse service operations, including the tourism supply chain. However, it is often overlooked in traditional service-related applications (Akhtar, 2023). According to the APICS Supply Chain Council (2017), an efficient logistics system encompasses storage and distribution activities as well as transportation infrastructure, in which cost efficiency, reliability, and service responsiveness are essential performance dimensions in the Supply Chain Operations Reference (SCOR) model. These logistics performance dimensions are also critical for enhancing the overall tourist experience and improving operational coordination among service providers (Deb et al., 2024). From a tourism management perspective, logistics performance can also be interpreted as a supporting mechanism of destination competitiveness. Efficient transportation connectivity, reliable service systems, responsive infrastructure, and safe travel environments directly influence tourist satisfaction, accessibility, and destination image (Nopphakate & Aunyawong, 2022; Rheeders, 2022). In this regard, logistics performance extends beyond operational efficiency and contributes to how destinations compete for tourist demand, particularly in emerging or secondary cities where infrastructure limitations may constrain tourism growth. Particularly in emerging destinations or secondary cities, inadequate logistics often manifests in poorly located rest areas, uncoordinated transportation services, and unsafe travel environments (Arvianto et al., 2021). These deficiencies can significantly reduce tourist satisfaction and limit repeat visits, thereby affecting regional competitiveness.
The connection between logistics performance and destination management becomes important when tourism planning is viewed as a governance task. The classical destination management literature emphasizes that destination competitiveness depends on the coordinated management of supporting resources, infrastructure, accessibility, information provision, and visitor safety (Dwyer & Kim, 2003). Recent studies further suggest that destination competitiveness is increasingly shaped by network efficiency, resilience, mobility systems, and the ability of destinations to manage visitor flows under changing demand and risk conditions (H. P. Yen et al., 2021; Luštický & Štumpf, 2021; J. Song & Xu, 2024; Panagiotopoulou & Skoultsos, 2025). Under this view, economic efficiency can be linked to resource utilization, reliability to accessibility and service continuity, responsiveness to the ability of destinations to accommodate visitor mobility and time-sensitive service needs, and safety to destination assurance and resilience. Accordingly, logistics-related criteria are relevant not simply because they improve transport operations, but because they represent operational dimensions through which destination managers can influence visitor experience, service performance, and the functioning of the destination system as a whole.
Building on this destination management perspective, the present study focuses on logistics-related planning dimensions as operational criteria for tourism routing and infrastructure planning. These dimensions capture a set of operational planning concerns that are relevant to tourism mobility management in regional destinations. Thus, the core dimensions of logistics performance related to economic efficiency, reliability, responsiveness, and safety are reflected as important criteria influencing how tourists navigate and perceive a destination. While these metrics are widely studied in supply chain and freight management, their application in tourism has been relatively limited (Vatankhah et al., 2023). The tourism sector typically focuses on marketing and experience delivery, often overlooking the infrastructural and operational aspects that support mobility and service provision. This gap between logistics research and tourism planning is particularly evident in secondary cities, which often struggle with limited data and funding. Existing studies have shown that incorporating logistics indicators can improve travel efficiency and support more rational resource allocation (Wang et al., 2023). Logistics models, including mathematical and simulation approaches commonly used in supply chain settings, can be adapted to smart tourism to evaluate travel routing strategies and optimize site selection for rest stops or visitor centers. The benefits of such decision-support systems for TPM include not only enhanced economic feasibility of tourism investments but also improved practical utility for stakeholders.
Recent TPM-related research has increasingly embraced logistics-focused tools, particularly mathematical models, to address the complex challenges of infrastructure, mobility, and resource allocation. For instance, Piya et al. (2023) introduce a multi-objective optimization framework that enables tourists to create personalized itineraries based on their individual preferences, which is tested using a case study in Oman. Wu et al. (2024) propose a tourist recommendation system designed to generate customized day-tour routes for urban travelers, incorporating hotel selection into the planning process. Their bi-objective optimization model evaluates both the total utility of selected points of interest and the average utility of chosen hotels. In addition, Chen et al. (2024) focus on developing a self-service tourism route planning system tailored for rural tourism, applying a hybrid genetic algorithm to optimize travel routes.
By integrating logistics performance into tourism planning, destinations can shift from reactive development to proactive strategies. This is especially important in areas where tourism is growing but infrastructure has not yet matured. However, existing studies have not explained how stakeholder-based logistics performance priorities influence operational routing and destination-related decisions or whether different stakeholder preferences impact route selection. The present study addresses this gap by proposing a logistics-based mathematical model in conjunction with stakeholder-informed priorities, offering a decision-support framework for tourism routing and infrastructure planning. Specifically, the framework examines how stakeholder priorities related to economic efficiency, reliability, responsiveness, and safety influence route optimization outcomes. Thus, this study conceptualizes tourism planning as a stakeholder-oriented and logistics-supported decision-making process in which priorities influence operational planning outcomes related to routing and infrastructure allocation. The proposed framework therefore bridges tourism planning, destination management, and logistics performance by integrating stakeholder-informed MCDA with multi-objective routing optimization.

3. Methodology

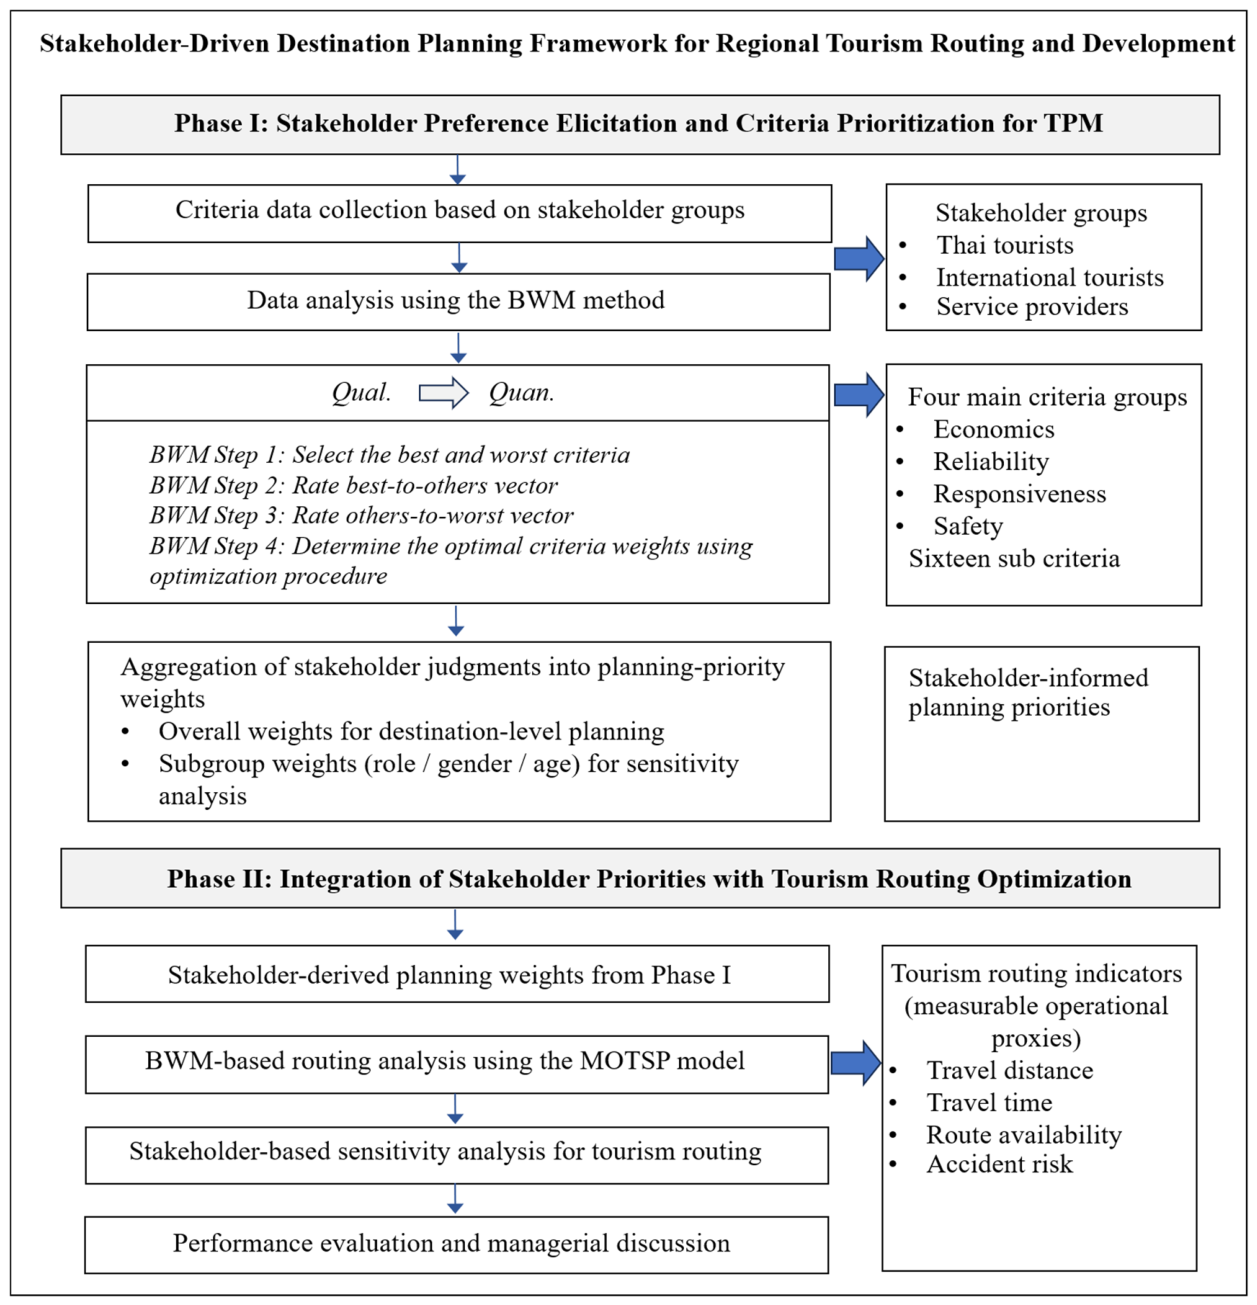
In this study, a two-phase framework is proposed to enhance decision-making in TPM through a mixed-methods research approach, as illustrated in Figure 1. The framework integrates both qualitative and quantitative techniques and is divided into two main phases: Phase I focuses on multi-criteria decision analysis based on four main criteria groups—Economic Efficiency, Reliability, Responsiveness, and Safety—comprising sixteen sub-criteria, while Phase II emphasizes multi-objective mathematical modeling for tourism routing analysis, incorporating travel distance, travel time, route availability, and accident risk through stakeholder-based sensitivity analysis. This mixed-methods integration enables stakeholder preferences to be incorporated directly into logistics-based tourism planning, thereby linking stakeholder-oriented decision analysis with operational destination management. In the first phase, the framework employs the BWM to transform qualitative insights into quantifiable decision criteria; initially, criteria data are collected, and optimal criteria weights are subsequently computed. The second phase adopts a quantitative approach by applying a logistics-based model to tourism destinations. Latitude and longitude data serve as the basis for travel routing and analysis with the aid of mathematical models. Thus, the proposed two-phase framework represents a comprehensive approach that balances decision analysis with tourism logistics analysis. The following section presents each main method employed in this study.

3.1. The Best–Worst Method (BWM) Approach

The BWM, developed by Rezaei (2015), is a systematic MCDA technique designed to derive optimal weights for evaluation criteria based on decision makers’ judgments. Unlike traditional approaches, BWM offers enhanced efficiency by significantly reducing the number of required pairwise comparisons while also ensuring greater consistency in decision-makers’ inputs (Wu et al., 2024). This improvement makes BWM particularly suitable for complex decision problems, where maintaining consistency and minimizing cognitive effort are critical. These characteristics are important in this study because the respondents comprise heterogeneous stakeholder groups including Thai tourists, international tourists, and service providers, who are expected to express relative planning priorities across multiple tourism criteria. In such a context, a weighting method that is manageable and transparent is important for eliciting stakeholder preferences for tourism planning.
Following the identification of the best and worst criteria, two vectors of pairwise comparisons are constructed to quantify preferences. The first is the Best-to-Others vector, which captures the degree of preference of the best criterion over each of the remaining criteria. The second is the Others-to-Worst vector, which reflects how strongly each of the remaining criteria is preferred over the worst criterion. These preferences are generally represented using a standardized numerical scale, as shown in Table 1. In this study, the 1–9 pairwise comparison scale is adopted in line with established practice and is consistent with the conceptual basis of the BWM, which is rooted in the Analytic Hierarchy Process (AHP) framework developed by Saaty (2008). This scale is commonly applied to capture different degrees of preference intensity, offering a balance between ease of cognitive judgment and analytical expressiveness, while allowing subjective evaluations to be converted into quantifiable inputs for subsequent analysis. These quantified inputs are interpreted as stakeholder-based evaluations of the relative importance of tourism planning criteria. Equations (1) and (2) present the Best-to-Others and Others-to-Worst vectors, respectively.
A B   =   ( a B 1 ,   a B 2 , ,   a B n ) ;   w h e r e   a B B   =   1
A W   =   ( a 1 W ,   a 2 W , ,   a n W ) ;   w h e r e   a W W   =   1
Next, the process for determining the optimal weights in the BWM is outlined in Equations (3)–(7), which involve solving a linear programming model aimed at minimizing inconsistency in the judgments. This optimization procedure derives a set of criterion weights that best fits the pairwise preferences of respondents while minimizing the maximum deviation among comparisons. Accordingly, BWM is used to translate stakeholder judgments into a weighting structure representing the relative importance of tourism planning objectives. It is important to emphasize that these BWM-derived weights represent priorities associated with the four main dimensions of economic efficiency, reliability, responsiveness, and safety from stakeholders. These planning-priority weights are subsequently integrated with measurable routing indicators in the MOTSP model, where route performance is evaluated using operational proxy data such as travel distance, route availability, travel time, and accident records. Thus, the methodological role of BWM in this study is to identify which planning objectives should receive greater emphasis from a stakeholder perspective, while the routing model evaluates how alternative tourism routes perform under those prioritized objectives.
M i n i m i z e       ξ
S u b j e c t   t o                   w B w j a B j     ξ ;                   j
w j w W a j W     ξ ;           j
j w j   =   1
w j     0 ;           j
Next, to ensure the reliability of the pairwise comparisons, this study applies the input-based Consistency Ratio (CR) within the BWM framework proposed by Liang et al. (2020). The CR assesses the coherence of decision-makers’ judgments directly from their preference inputs. Importantly, the acceptable consistency threshold in BWM is not fixed but depends on the maximum rating scale used and the number of criteria considered. As shown in Table 2, different combinations of scale and criteria size generate corresponding threshold values used as consistency benchmarks. In this study, using a 1–9 rating scale and four main criteria with each four sub-criteria, the applicable consistency threshold is 0.2681. The calculated CR values ranged from 0.041 to 0.257 with an average of 0.153 indicating that all decision matrices satisfy the acceptable consistency requirement. This procedure helps verify that the pairwise comparisons are consistent and that the derived weights reflect the decision-makers’ preferences.

3.2. Logistics Mathematical Modeling

Following the first phase, in which the BWM is used to prioritize key criteria and generate policy implications with potential links to tourism routing considerations, the next phase seeks to translate these insights into a quantitative modeling framework. In particular, the derived weights are incorporated into a multi-objective mathematical model to support tourism route planning and evaluation. The integration of the BWM and the MOTSP constitutes the core methodological contribution of this study. Specifically, stakeholder preferences elicited through the BWM are incorporated into the multi-objective routing model to guide the evaluation of alternative tourism routes. In this subsection, a logistics-based mathematical analysis is presented to examine tourism route planning with a focus on stakeholder perceptions using a multi-objective approach. Specifically, the MOTSP model is introduced and applied to tourism routing analysis. The traditional TSP identifies the shortest possible route that visits each tourist attraction once and returns to the starting point, thereby minimizing total travel distance or time (Pop et al., 2024). In this study, the MOTSP model considers multiple objective functions aligned with the key criteria evaluated using BWM in the first-phase framework. The multi-objective integer linear programming model is formulated as presented in Equations (8)–(16).
That is, the first objective function evaluates the total travel distance, which is used here as a surrogate indicator for the economic objective (Equation (8)). Shorter travel distances are associated with lower transportation costs and more efficient utilization of tourism resources, thereby reflecting the economic efficiency dimension of tourism planning. The second objective function considers the number of available driving routes between two destinations as a proxy for the reliability objective (Equation (9)), where a greater number of alternative routes reflects higher network flexibility and robustness in the presence of disruptions. This measure captures the ability of the tourism transportation network to maintain service continuity and accessibility under varying operating conditions. The third objective function examines the shortest travel time between locations, serving as a surrogate for the responsiveness objective (Equation (10)). Reduced travel time reflects the capacity of the tourism system to respond to visitor mobility needs and facilitate smoother travel experiences across destinations. Finally, the fourth objective function incorporates road accident statistics at the district level as a proxy for the safety objective (Equation (11)). Lower accident exposure reflects safer travel conditions and supports risk reduction within regional tourism networks.
The selection of these four dimensions is further supported by the destination competitiveness literature, which suggests that the ability of destinations to generate tourism value depends not only on tourism resources and attractions but also on supporting infrastructure, accessibility, risk management, and destination management capabilities. These studies emphasize that destination competitiveness is increasingly shaped by the effectiveness of supporting systems within tourism networks (Boes et al., 2016; J. Song & Xu, 2024; Z. Song, 2025). Accordingly, economic efficiency contributes to value creation and effective resource utilization, reliability supports destination accessibility and service continuity, responsiveness reflects the ability of destinations to efficiently accommodate visitor mobility and service needs, and safety represents a fundamental prerequisite for destination attractiveness, resilience, and tourism performance (Duro et al., 2024; Plzáková & Smeral, 2026). It is important to note that these surrogate measures are adopted to illustrate a proof of concept for integrating BWM-derived weights into a multi-objective routing framework. While they provide measurable and practical representations of the underlying criteria, they do not fully capture all dimensions of stakeholder-defined criteria. Thus, if more granular and tourism-specific data become available, such as perceived safety indices, real-time service performance, or destination-level service quality scores, alternative or more refined surrogate indicators could be incorporated. This flexibility allows the proposed framework to be adapted and extended, enabling more accurate and context-sensitive modeling of tourism routing decisions in future applications.
The constraint sets for the MOTSP model are presented next, ensuring that each destination is visited exactly once by enforcing that only one path enters and exits each location (Equations (12) and (13)). In addition, the constraints in Equations (14)–(16) eliminate subtours by introducing auxiliary variables that track the sequence of visits and impose appropriate variable bounds. Together, these constraints guarantee a single, continuous tour, consistent with the fundamental structure of routing problems in tourism planning. It is important to note that the current formulation follows the classical MOTSP structure to illustrate the applicability of the multi-objective approach, which can be extended to more complex and realistic tourism applications. For instance, additional constraints could incorporate time windows for attraction opening hours (Gao et al., 2020) or budget constraints (Mak et al., 2024). Similarly, routing models could be expanded to include multi-day itineraries and multiple starting or ending points (Pan et al., 2023). These extensions demonstrate that the proposed framework is flexible and can be adapted to more advanced MOTSP variants, enabling more realistic representations of TPM scenarios.
Set
N : Set of all travel destinations, i , j     N .
Parameters
d i j : Distance travel between travel destination i and j (kilometer).
r i j : Number of alternative routes travel destination i and j (numbers).
t i j : Travel time between travel destination i and j (numbers).
a i j : Road accident data between travel destination i and j (numbers).
n : Number of available destinations (numbers).
Decision variables
X i j : A binary variable if a tourist travels from travel destination i and j .
U i : An auxiliary continuous variable for subtour elimination.
Objective functions:
Minimize   Z 1 :   i     N j     N d i j X i j
Maximize   Z 2 :   i     N j     N r i j X i j
Minimize   Z 3 :   i     N j     N t i j X i j
Minimize   Z 4 :   i     N j     N a i j X i j
Constraints:
j     N ;   j i X i j   =   1 ;           i     N
i     N ;   i j X i j   =   1 ;           j     N
U i     U j   +   n X i j     n 1 ;           i , j     2 , , n ;   i j
X i j     0 , 1 ;           i , j     N ;   i j
U i     1 ;           i   N
The illustrated MOTSP model can support planners in enhancing the travel experience by ensuring route efficiency and improving accessibility between diverse destinations. By incorporating weighted priorities derived from the BWM into the proposed framework, the routing model can be customized to reflect the preferences of both tourists and service providers, enabling a more tailored and user-centric tourism strategy. To account for multiple objectives and varying criteria weights, a linear normalization technique is employed to transform the MOTSP into a single-objective optimization model by converting each objective function into a unitless score between 0 and 1 for both minimization and maximization types, as shown in Equations (17) and (18), respectively. These normalized values are structured such that lower values are considered better, thereby forming a single-objective minimization problem. Subsequently, these normalized values are combined with the criteria weights derived from the BWM to construct a single weighted objective function, as presented in Equations (19) and (20), respectively.
Z i n o r m   =   Z i     Z i m i n Z i m a x     Z i m i n ;   where   Z i m i n ( Z i m a x )   is   the   anti-ideal   solution   ( ideal )   solution
Z i n o r m   =   Z i m a x     Z i Z i m a x     Z i m i n ;   where   Z i m i n ( Z i m a x )   is   the   anti-ideal   solution   ( ideal )   solution
Minimize Z A l l :
i     N j     N ( w c 1 Z 1     Z 1 m i n Z 1 m a x     Z 1 m i n   +   w c 2 Z 2 m a x     Z 2 Z 2 m a x     Z 2 m i n   +   w c 3 Z 3     Z 3 m i n Z 3 m a x     Z 3 m i n +   w c 4 Z 4     Z 4 m i n Z 4 m a x     Z 4 m i n ) X i j
w c 1   +   w c 2 + w c 3   +   w c 4   =   1

4. Case Study and Results

4.1. The BWM-Based Criteria Analysis for TPM

The criteria data are collected based on an extensive literature review related to logistics, tourism planning, and supply chain management, in which both the main criteria and sub-criteria are outlined in Table 3. Specifically, the evaluation framework includes four main criteria: the economic efficiency criterion (C1), the reliability criterion (C2), the responsiveness criterion (C3), and the safety criterion (C4). In total, 16 sub-criteria are identified, with four sub-criteria assessed under each main criterion to ensure a balanced and comprehensive evaluation structure. Next, key stakeholders involved in TPM are invited to evaluate each sub-criterion within the case study, reflecting a group decision-making approach in the proposed BWM framework during the first-phase analysis. In this study, a total of 90 decision-makers participate in the evaluation process based on the case study of Ubon Ratchathani Province. These respondents are categorized into three main stakeholder groups (Thai tourists, international tourists, and service providers), allowing for a comparative analysis of perspectives across different roles. The stakeholder groups are selected because they represent key actors within the destination system with different roles and priorities. Thai tourists reflect domestic travel demand, international tourists represent external market expectations, and service providers contribute operational perspectives on tourism services and resource management. Their combined perspectives support stakeholder-informed tourism planning. The respondents are selected using purposive sampling at major tourism and transportation hubs, such as the airport, railway stations, bus terminals, and key tourist attraction areas, where participants are approached randomly during the data collection period. Before completing the BWM pairwise comparisons, all participants receive an explanation of the evaluation procedure, including the meaning of each criterion and the comparison scale to ensure that the pairwise comparison process is well understood. It should be noted that Ubon Ratchathani is a secondary tourism destination in Thailand, where domestic tourism currently dominates visitor demand, while international tourism is still in an expansion stage under ongoing regional promotion strategies (Tourism Authority of Thailand, 2018; Chanwanwakul, 2025).
In this study, individual BWM preference vectors are aggregated using the arithmetic mean approach to obtain group-level weights for each stakeholder category. This method is commonly used in group decision-making contexts due to its simplicity and ability to preserve the central tendency of individual judgments. Decision-makers’ perceptions are gathered through a structured questionnaire, which also captures general demographic information, including role, gender, and age, as summarized in Table 4.

4.1.1. Main Criteria Analysis

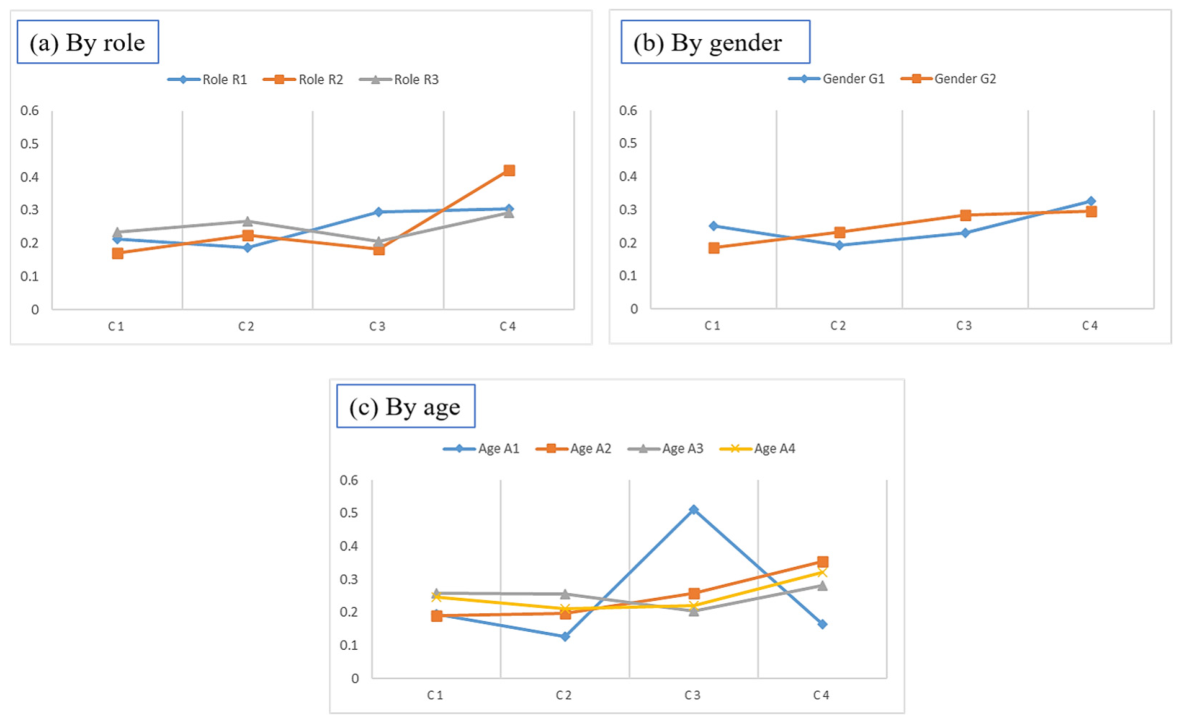
The numerical weights of the main criteria derived using the BWM, along with the corresponding ranking results, are presented in Table 5, where group decision-making outcomes are reported. In addition, the evaluation of ranking trade-offs is visualized in Figure 2. Based on the results from the Best–Worst Method (BWM), the overall prioritization of the main criteria clearly identifies Safety (C4) as the top concern, with the highest weight (0.4335), followed by Responsiveness (C3) (0.2587), Economic (C1) (0.2160), and Reliability (C2) (0.2153). This ranking implies that, across all stakeholder groups, safety concerns such as accident prevention, health standards, and emergency preparedness are paramount in tourism planning and service design. It reflects a heightened awareness of risk management in unfamiliar destinations. The prominence of safety in the Ubon Ratchathani context may reflect international tourists’ concerns regarding uncertainty in secondary destinations. The second ranking of responsiveness suggests that the ability to deliver timely services is essential in shaping a high-quality tourist experience. Conversely, while cost and reliability remain important, they appear slightly less critical compared to safety and responsive service delivery in TPM.
From a destination management perspective, the prominence of safety suggests that tourism planning in the Ubon Ratchathani context must also incorporate destination assurance, which implies that transport routing and supporting infrastructure should be evaluated not only for efficiency but also for their ability to reduce perceived visitor risk. The prominence of safety may also be interpreted in relation to the regional tourism characteristics of Ubon Ratchathani. As a large province in northeastern Thailand with tourist attractions distributed across multiple districts, tourism in Ubon Ratchathani often requires road-based travel between dispersed destinations rather than movement within a compact urban tourism area. In such a setting, the quality of the tourism experience depends also on the safety and predictability of traveling between them. This interpretation is aligned with the destination management literature, which suggests that in regional and secondary destinations, mobility-related safety and infrastructure assurance form an important part of destination competitiveness and visitor confidence. The result also aligns with tourism risk perception studies showing that tourists tend to assign greater importance to safety when traveling in unfamiliar destinations, particularly when they depend on local transport systems, route information, and supporting services to move between attractions (Sasithornwetchakul & Choibamroong, 2019). In this study, such concerns appear particularly relevant for international tourists, who assign the highest weight to safety among the stakeholder groups. This suggests that safety in the Ubon Ratchathani case should be understood more broadly as a destination assurance issue that affects tourists’ confidence in navigating the destination and revisit intention.
Next, the data are disaggregated by stakeholder roles and demographic characteristics. Thai tourists (R1) prioritize safety and responsiveness but place less importance on reliability. International tourists (R2) also rank safety as the highest priority; however, they assign a higher weight to reliability (0.2245), likely reflecting unfamiliarity with local systems and a greater need for dependable services. In contrast, service providers (R3) emphasize both economic (0.2343) and reliability (0.2679) criteria, indicating an operational focus on cost efficiency and consistent service delivery. Furthermore, male decision-makers (G1) prioritize cost more than females (G2), while females place greater importance on responsiveness. The results also reveal clear age-based differences in tourism priorities. Specifically, group A1 ranks responsiveness highest (0.5123), followed by economic considerations (0.1959), highlighting a preference for fast and cost-effective travel. The A2 group also values responsiveness (0.2575) but places safety first (0.3549), reflecting a balance between service speed and personal security. In contrast, groups A3 and A4 both prioritize safety (0.2828 and 0.3224, respectively), followed by economic considerations, with less emphasis on responsiveness. The results indicate that stakeholder groups do not evaluate tourism system performance according to a single shared logic, which has important implications for destination governance and planning trade-offs. For instance, younger tourists tend to place greater emphasis on responsiveness and travel convenience, whereas service providers assign relatively greater importance to reliability and economic efficiency. International tourists, in turn, place the emphasis on safety and dependable services.
This observed heterogeneity implies that destination planning is a governance process in which multiple stakeholder groups seek different forms of value from the same tourism system. From a destination management perspective, these differences matter because they directly affect how limited public and private resources should be allocated across the tourism network (Shi et al., 2023). For example, a planning strategy shaped primarily by younger tourists’ preference for responsiveness may prioritize shorter travel times, more direct routing, and faster service coordination between attractions. By contrast, a strategy informed by international tourists’ concern for safety and reliability may require greater investment in route clarity and road safety measures. Service providers’ emphasis on economic efficiency and reliability indicates an additional concern with maintaining service continuity and infrastructure utilization while controlling operating costs.

4.1.2. Sub-Criteria Analysis

The sub-criteria are evaluated to obtain their respective weights under each main criterion, as presented in Table 6. The BWM-based sub-criteria analysis highlights key priorities across each dimension, revealing nuanced stakeholder preferences within the overall evaluation framework. For Economic efficiency (C1), C1.3: Budget planning and management ranks highest (0.3383), followed by C1.2: Direct travel expenses, C1.1: Perceived value, and C1.4: Comparative cost advantage, respectively, indicating a stronger emphasis on effective financial planning over individual cost components. In Reliability (C2), C2.4: Service readiness leads (0.2865), followed by C2.2: Accessibility and C2.3: Timeliness, while C2.1: Service consistency is the least emphasized. For Responsiveness (C3), C3.4: Real-time customer interaction is top-ranked (0.2869), highlighting the growing importance of timely communication and digital engagement in enhancing the tourist experience. This is followed by C3.3: Response to unplanned interruptions, C3.1: Travel time, and C3.2: Proactive preparedness, respectively. In Safety (C4), C4.3: Accommodation security is the most important (0.273), followed by C4.4: Emergency preparedness, while C4.1: Incident prevention and C4.2: Health standards are slightly less prioritized. Overall, the results suggest that stakeholders place greater emphasis on immediate and tangible safety measures, such as secure accommodation and emergency readiness, compared to broader preventive or regulatory aspects.
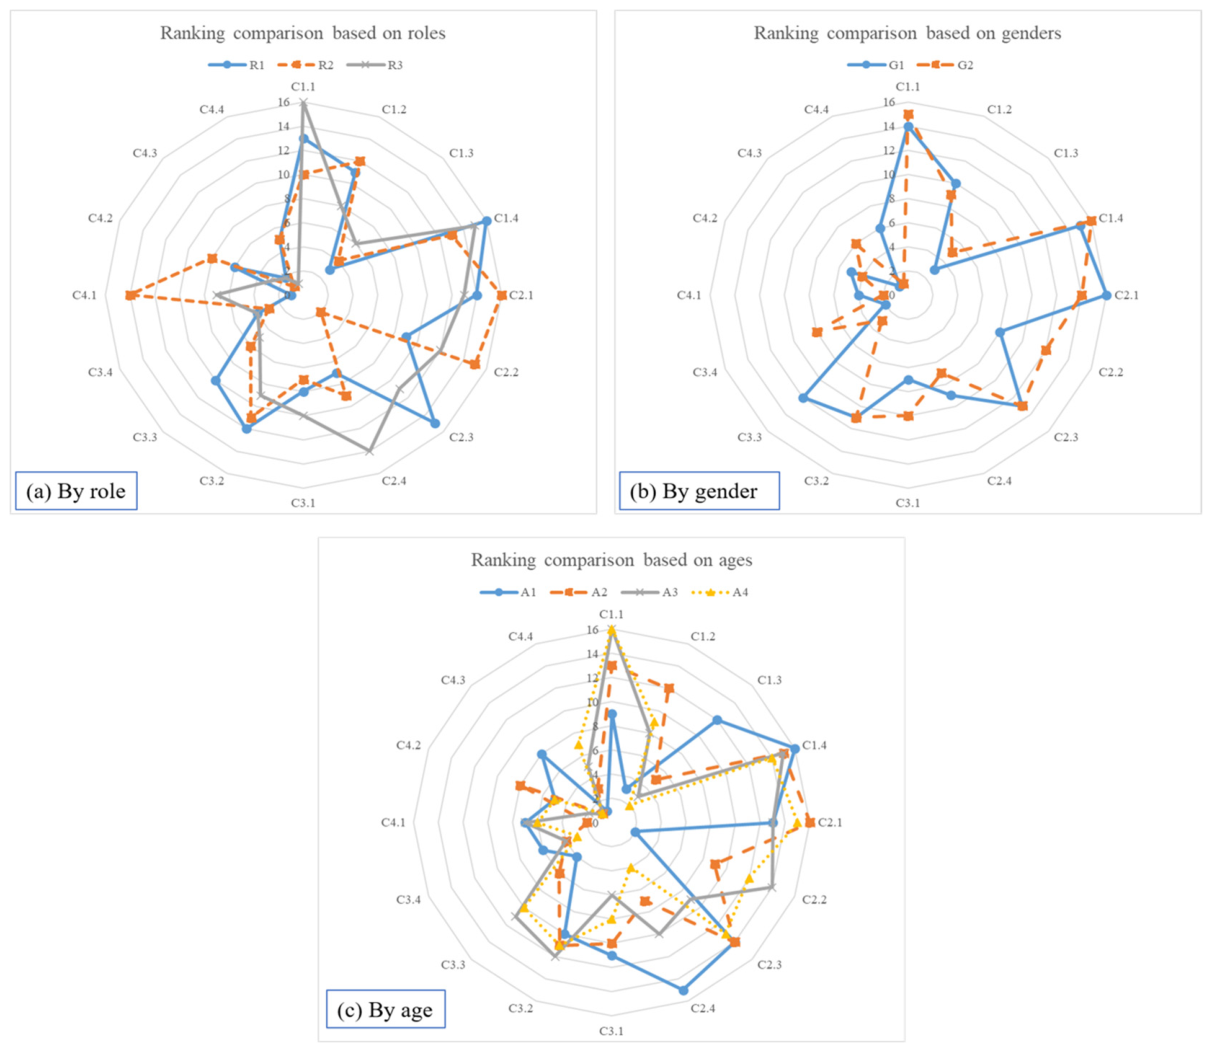
In addition, a synthesis analysis of the main and sub-criteria is conducted to derive global weights and rankings (shown in parentheses), as presented in Table 7, while Figure 3 visualizes the ranking results. The BWM findings indicate that safety-related criteria dominate across most decision-maker groups, particularly C4.3 (Accommodation security), C4.4 (Emergency preparedness), and C4.1 (Incident prevention), with C4.3 consistently ranked highest—especially among international tourists and older respondents. This reflects an increasing concern for risk preparedness. Responsiveness also ranks highly, notably C3.4 (Real-time customer interaction) and C3.3 (Response to unplanned interruptions), highlighting the demand for flexible and adaptive services, particularly among younger and international tourists. In contrast, economic and reliability criteria are relatively less emphasized, although C1.3 (Budget planning) and C2.4 (Service readiness) remain moderately important, especially for Thai tourists and older groups. Overall, the lower ranking of cost-related and routine reliability factors suggests a shift from price-driven decisions toward safety and service responsiveness in tourism planning.
Additionally, the high-weight criteria identified through the BWM analysis are examined to derive targeted policy implications. These prioritized factors provide a structured basis for translating stakeholder preferences into potential strategies for tourism planning and management, as presented in Table 8. In particular, Accommodation security (C4.3) ranks highest, especially among international tourists, emphasizing the need for standardized certification and transparent safety ratings (e.g., Lee et al., 2025; Varol & Emiroğlu, 2026). This is followed by Emergency preparedness (C4.4) and Incident prevention (C4.1), highlighting the importance of proactive risk management through integrated emergency systems, staff training, and enhanced surveillance (Zhang et al., 2023; Badiora et al., 2022; Zhao & Zhang, 2024). Responsiveness, reflected in Real-time interaction (C3.4) and Response to unplanned interruptions (C3.3), further underscores the growing role of digital platforms and flexible service delivery (Sivarethinamohan, 2023; Bansal et al., 2025; Polukhina et al., 2025). Health and hygiene standards (C4.2) remain essential, particularly from the service provider perspective (Mic, 2021; Nugraheni et al., 2022; Yohesh et al., 2026), followed by Travel time efficiency (C3.1) (Iamtrakul et al., 2025; Ransikarbum et al., 2026).
These priorities can inform the design and evaluation of future tourism routing plans. Safety-related policies suggest incorporating secure destinations, avoiding high-risk areas, and considering access to emergency services. Responsiveness highlights the need for dynamic, real-time routing enabled by digital platforms, while reliability and efficiency support travel time optimization and the provision of alternative routing options. Economic considerations further indicate the relevance of cost-weighted objectives. Overall, these findings suggest that stakeholder-informed priorities can guide the development of multi-objective routing frameworks, providing a foundation for more comprehensive tourism planning approaches.

4.2. Integrated BWM–MOTSP Analysis for Tourism Logistics Planning

4.2.1. Multi-Criteria Routing Results

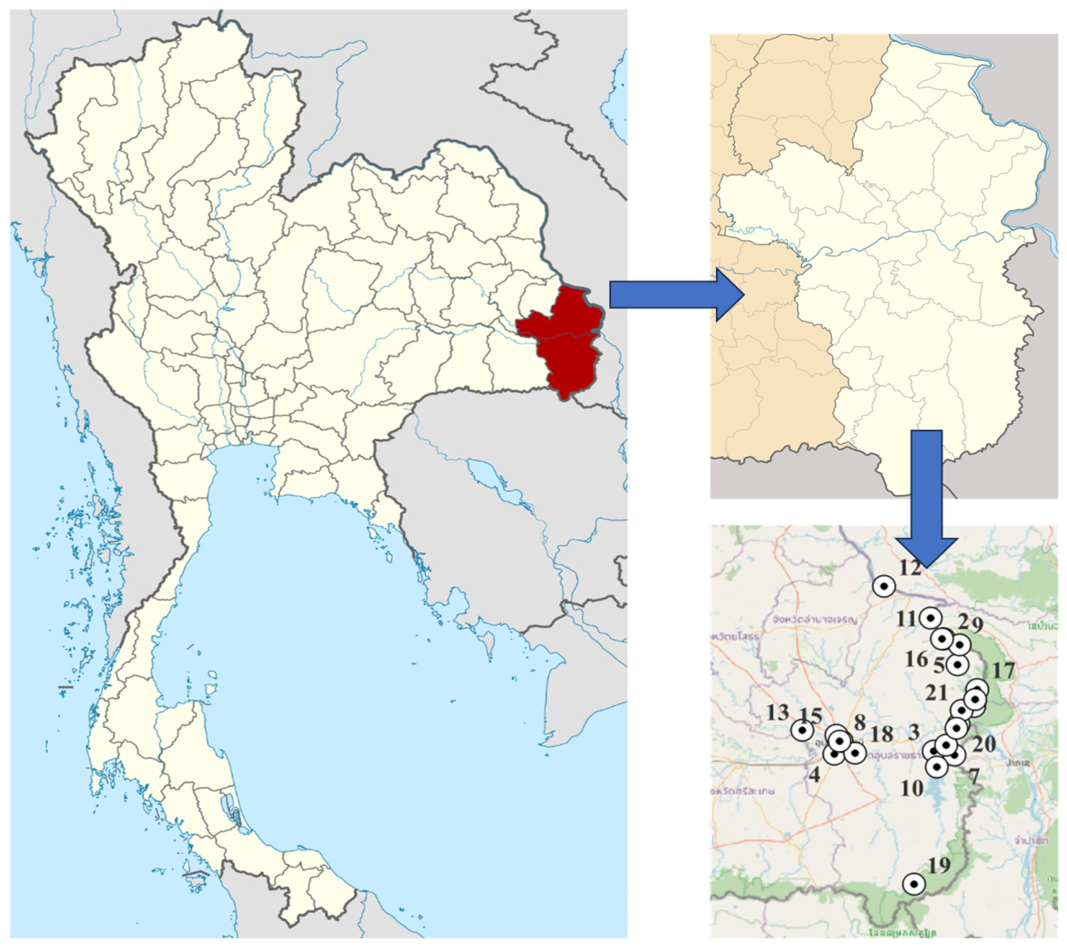
The logistics routing analysis for travel destinations using the MOTSP model is presented next. The BWM-based main criteria weights are used as input data to illustrate the integrated approach for decision-based routing analysis, using a case study of 24 travel destinations in Ubonratchathani Province, Thailand (Tourism Authority of Thailand, 2025). The locational data, including latitude and longitude, are shown in Table 9 and Figure 4. Ubon Ratchathani, a province in northeastern Thailand, holds significant potential for tourism development through strategic planning and policy implementation. As part of the northeastern region, it boasts unique cultural assets, a rich temple heritage, and diverse natural attractions. In 2024, Ubon Ratchathani’s tourism sector demonstrated modest growth, reflecting both opportunities and challenges in regional TPM.
Next, the origin–destination matrices for distance, alternative routes between destinations, fastest travel time between destinations, and historical road accident rates are constructed using a Geographic Information System (GIS) and relevant sources (Ransikarbum et al., 2023; Google, 2025, Thai Route Service Center, 2025). In particular, travel distances are calculated based on latitude and longitude coordinates, while travel time and route availability are obtained from Google Maps (https://maps.google.com/). In addition, historical accident data are collected from the Thai Route Service Center public database. In this study, these data are used as surrogate measures for the economic, reliability, responsiveness, and safety criteria, respectively. The proposed logistics routing model, MOTSP, is then solved by incorporating the BWM-based main criteria weights to obtain practical results, as presented in Table 10.
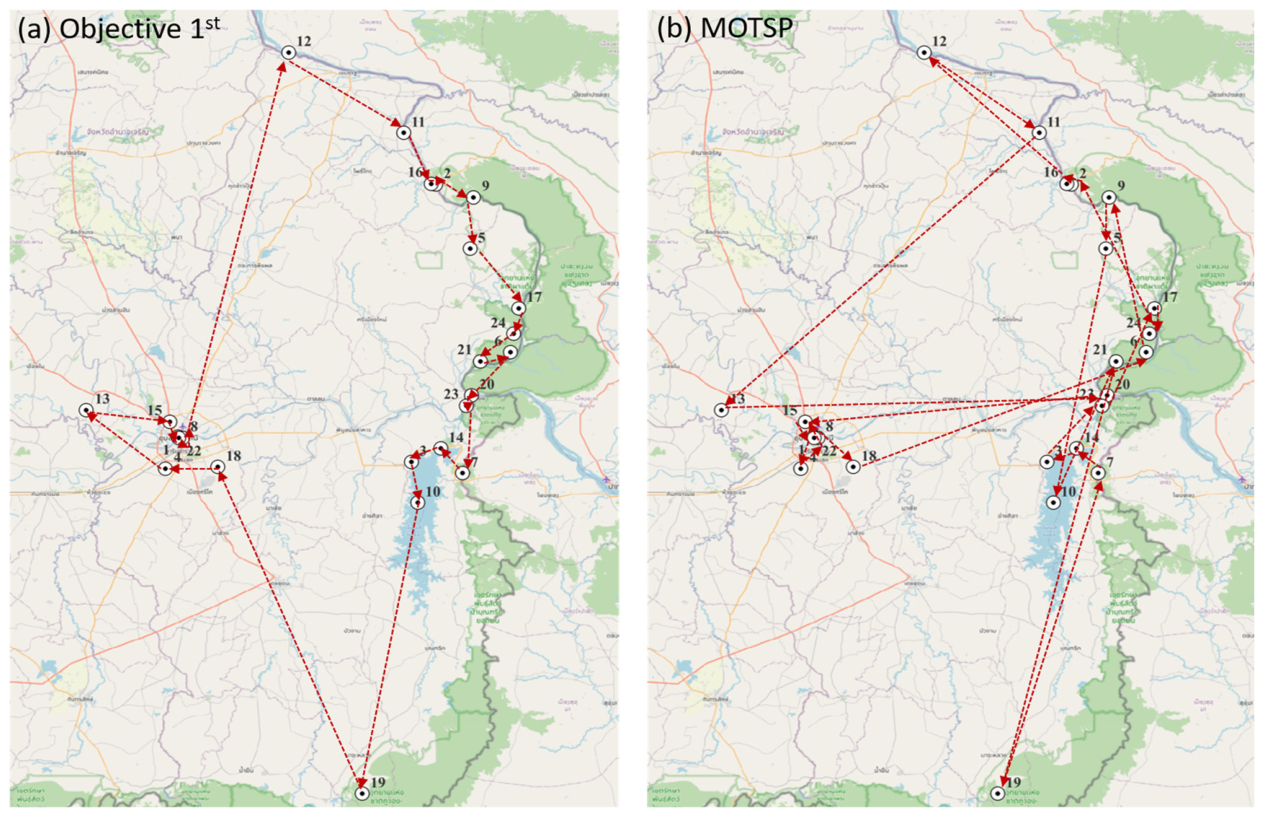
The results of the MOTSP model clearly demonstrate how focusing on a single objective can lead to suboptimal outcomes in other aspects of travel planning. For instance, optimizing for economic efficiency (i.e., minimizing total distance) results in the shortest route (724.45 km) with moderate exposure to historical accident rates and fewer route alternatives. In contrast, the route optimized for reliability—aiming to maximize alternative routes—achieves the highest number of route options (72) among destination pairs but at the cost of the longest distance, highest travel time, and greater exposure to accident risk. Similarly, while responsiveness optimization delivers the fastest travel time (835 min) with minimal sacrifice in distance, it shows limited route differentiation and a comparable level of accident exposure to the economic objective. The safety-focused route, on the other hand, minimizes accident exposure (114 cases) but requires increased travel distance and time, highlighting the inverse relationship between safety and efficiency. The multi-objective solution using the overall aggregated BWM-derived weights shown earlier (i.e., C1 = 0.2610, C2 = 0.2153, C3 = 0.2587, C4 = 0.3100) presents a balanced outcome across all four dimensions, achieving a moderate reduction in distance (1280 km), maintaining high route flexibility (59 alternatives), offering reasonable responsiveness (1277 min), and keeping safety incidents relatively low (120 cases). Thus, this case study highlights the value of trade-off analysis in multi-criteria evaluation. Rather than pursuing one goal at the expense of others, decision-makers may select a compromise solution that integrates stakeholder preferences—such as economic, safety, and service delivery priorities—into a unified logistics plan for TPM.
Additionally, Figure 5 illustrates a visual comparison between routing based on a single economic objective of minimizing travel distance in Figure 5a and a balanced MOTSP approach in Figure 5b. The route in Figure 5a follows a direct path with minimal travel length, prioritizing the shortest physical distance. However, this simplicity often compromises other important factors such as safety, service reliability, and responsiveness. In contrast, the MOTSP result in Figure 5b reveals a more interconnected and flexible route network with additional detours that balance distance with alternative route availability, travel time efficiency, and accident risk reduction. This visualization highlights how a multi-objective approach leads to a more robust and adaptable tourism logistics plan, addressing stakeholder needs more comprehensively than a purely cost-driven solution.
From a destination management perspective, the observed differences between single-objective and multi-objective routing solutions highlight the importance of integrated planning in tourism systems. Each single-objective solution represents a narrow planning priority, such as cost efficiency, accessibility, service responsiveness, or safety. However, destination management in practice requires balancing these objectives simultaneously rather than optimizing them in isolation (Al Mahrizi et al., 2024; Panagiotopoulou & Skoultsos, 2025). In this regard, the multi-objective solution reflects a more realistic planning scenario in which tourism managers may reconcile competing stakeholder priorities and operational constraints within a unified spatial framework. Accordingly, the results demonstrate that tourism routing can be interpreted as a strategic destination management task, in which the trade-offs observed across distance, travel time, route flexibility, and safety suggest that destination performance is inherently multi-dimensional, requiring decision-makers to adopt planning approaches that integrate economic efficiency with service quality and risk considerations.

4.2.2. Sensitivity Analysis of Stakeholder Preference Weights

Next, the sensitivity analysis based on different combinations of stakeholder perceptions is examined as shown in Table 11. The BWM results aggregated for each main criterion presented earlier indicate variations in criterion priorities across different stakeholder groups, including roles, gender, and age segments. Specifically, while safety (C4) is consistently ranked as the most important criterion across most groups, notable heterogeneity exists in the relative importance assigned to economic efficiency (C1), reliability (C2), and responsiveness (C3). For example, international tourists (R2) assign higher importance to safety compared to other groups, whereas younger respondents (A1) prioritize responsiveness more than other criteria. These observed differences provide initial evidence of heterogeneity in stakeholder preferences. Thus, a sensitivity analysis is further conducted to examine how these preference differences lead to operational changes in routing outcomes. This step is essential for assessing the robustness and behavioral relevance of weighting schemes in the proposed MOTSP framework.
The sensitivity analysis results present how different stakeholder-based weighting scenarios, including role-based, gender-based, and age-based configurations, affect the routing plans. As shown in Table 11, the optimized routes exhibit noticeable variations across the four logistics objectives depending on stakeholder preferences. The base scenario, derived from the overall stakeholder weights, resulted in a balanced solution with a total travel distance of 1280 km, 59 alternative routes, a total travel time of 1277 min, and an accident exposure of 120 cases. In contrast, Scenario 2 (international tourists), which assigned the highest priority to safety, produced the safest route with the lowest accident exposure (117 cases) and the highest network reliability (64 alternative routes), but also required the longest travel distance (1611 km) and travel time (1639 min). Conversely, Scenario 6 (respondents aged 20 years and below), where responsiveness received the greatest weight, generated the shortest route (958 km) and the lowest travel time (1006 min), while resulting in the lowest reliability (50 alternative routes) and the highest accident exposure (123 cases). These contrasting outcomes clearly demonstrate the inherent trade-offs between travel efficiency, network robustness, and travel safety when different stakeholder priorities are incorporated into the destination planning process. The remaining stakeholder scenarios represent compromise solutions, with moderate changes in travel distance, travel time, reliability, and safety, indicating that different stakeholder preference structures lead to distinct routing outcomes without substantially altering the overall tourism network.
From a destination management perspective, these findings highlight that tourism route planning should not rely on a single optimal solution but instead accommodate the diverse priorities of key stakeholder groups to achieve a balanced allocation of tourism resources and transportation infrastructure. The results further confirm that variations in stakeholder-derived criteria weights influence routing performance and destination accessibility, illustrating how stakeholder heterogeneity can shape tourism development strategies through different trade-offs among economic efficiency, service reliability, responsiveness, and travel safety. In this regard, routing design serves as a planning mechanism that enables destination managers to align tourism infrastructure and visitor mobility with the differing expectations of tourists and service providers. Accordingly, the proposed framework provides a stakeholder-informed and logistics-based foundation for supporting more flexible and evidence-based destination planning, thereby contributing to the sustainable and competitive development of regional tourism destinations.

5. Discussion

5.1. Managerial and Policy Insights

We next discuss managerial insights and policy implications in this section. The integration of the logistics performance framework with the BWM and logistics routing models allows planners to make quantitative decisions within a structured decision-support framework for operational tourism planning. The relatively lower importance of economic and reliability criteria suggests that tourists value safety and responsiveness more than price or schedule adherence. Thus, emphasizing safety features in policy design could increase destination attractiveness and strengthen tourist trust. In addition, notable variations exist across age groups, genders, and tourist origins. A one-size-fits-all approach in tourism development may therefore be ineffective, and segment-specific travel packages may be needed to ensure alignment with different tourist profiles. However, this result should be interpreted as context-dependent and reflective of the specific sample and study setting rather than a universal behavioral rule. These findings demonstrate that stakeholder preferences can be systematically translated into operational tourism planning decisions through the proposed integrated framework. Rather than relying solely on managerial judgment, the integration of stakeholder-derived criteria weights with logistics routing optimization provides destination planners with a transparent decision-support mechanism for balancing multiple planning objectives. This stakeholder-informed approach is particularly valuable for regional destinations where infrastructure investment and tourism development must accommodate diverse stakeholder expectations while operating under resource constraints.
Accordingly, extending this segmentation perspective, age-based variations in priorities indicate the need for differentiated service strategies in tourism planning. Younger tourists, who value responsiveness and affordability, may benefit from services that emphasize travel time optimization, real-time route information, and cost-effective routing options. In contrast, older age groups, who prioritize safety, may place greater value on safety-focused route packages, the use of safer and more reliable travel routes, and transport arrangements that prioritize route safety and accessibility. In this regard, tourism authorities and service providers may use these segmented preference patterns as indicative inputs when considering how to align service design and operational planning with the needs of different visitor groups (Patterson & Balderas-Cejudo, 2023; C. H. Yen et al., 2023). These findings are consistent with stakeholder-oriented destination governance perspectives, which emphasize heterogeneity in stakeholder preferences and the need for differentiated tourism service design (Kar et al., 2023; Panagiotopoulou & Skoultsos, 2025). That is, the proposed framework integrates the perspectives of both stakeholder groups into a common decision structure. Consequently, stakeholder preferences become explicit inputs to operational planning decisions, thereby supporting stakeholder-informed destination governance through a transparent and evidence-based planning process. In addition, the proposed framework may be viewed as a stakeholder-informed decision-support approach for the operational dimension of destination management, particularly in regional tourism contexts where inter-destination mobility, service coordination, and infrastructure constraints are important planning concerns. Within this scope, the framework provides practical support for tasks such as regional tourism route design and operational infrastructure prioritization that must balance multiple stakeholder priorities.
The results of the logistics mathematical model (MOTSP) further underscore the critical need for tourism policymakers and transport planners to collaborate in route planning and infrastructure development. Relying solely on a single criterion may yield localized benefits but ultimately compromises safety, service quality, or route flexibility. This suggests that national and regional transportation policies should incorporate integrated performance indicators that balance cost efficiency with other logistics and risk-based measures. The multi-objective solution thus provides a practical framework for designing tours or travel packages that offer moderate efficiency, acceptable safety, and high service reliability. Planners can also develop differentiated products for various market segments, such as tailored packages for senior travelers or economically optimized routes for budget tourists (Piya et al., 2023; Pitakaso et al., 2024). Thus, the use of decision tools and scenario-based route modeling is essential for enhancing the competitive advantages of tourism logistics in TPM.

5.2. Theoretical Implications

This study also contributes to the destination management literature. From a theoretical perspective, the findings highlight the role of logistics performance as an operational mechanism within destination management, through which competitiveness-related objectives can be translated into planning and resource allocation decisions. This perspective is particularly relevant for emerging tourism destinations where infrastructure constraints require more systematic approaches to tourism planning and routing. Thus, the proposed framework reinforces the view that destination competitiveness depends not only on tourism resources and attractions but also on the effectiveness of supporting management systems, accessibility, and infrastructure that facilitate tourism experiences (Ritchie & Crouch, 2003; Dwyer & Kim, 2003; Boes et al., 2016). In particular, the theoretical contributions of the proposed framework can be discussed from three perspectives within destination management literature.
First, this study extends stakeholder-oriented destination management by positioning stakeholder preferences as direct inputs into operational planning rather than solely as descriptive information for policy formulation. Through the integration of the BWM and the MOTSP, stakeholder priorities become explicit decision parameters that influence tourism routing and infrastructure planning. Consequently, the proposed framework provides a mechanism for stakeholder-informed governance by linking stakeholder preference elicitation with destination management decisions (Donaldson & Preston, 1995; Panagiotopoulou & Skoultsos, 2025). Second, the proposed framework contributes to the destination competitiveness literature by operationalizing competitiveness-related concepts through measurable logistics performance dimensions. Existing destination competitiveness research emphasizes that accessibility, supporting infrastructure, management capability, and service quality are important drivers of destination performance (Crouch, 2011; Arici & Köseoglu, 2025). The present study demonstrates how these concepts can be represented through logistics performance dimensions including economic efficiency, reliability, responsiveness, and safety, and subsequently incorporated into mathematical routing models that support tourism planning. Finally, this study contributes to sustainable tourism planning by demonstrating that tourism routing can be conceptualized as an operational instrument of destination management that supports more sustainable tourism operations. Routing decisions influence not only travel efficiency but also accessibility, infrastructure utilization, visitor mobility, destination attractiveness, visitor experiences, and overall destination performance (Boes et al., 2016; Duro et al., 2024; Z. Song, 2025).
Accordingly, the proposed framework demonstrates how stakeholder-informed routing decisions can translate destination management objectives into operational planning and resource allocation decisions. In doing so, it strengthens the conceptual relationship between logistics management and destination management within regional tourism systems.

5.3. Limitations and Practical Considerations

This study has limitations and practical constraints that should be considered when interpreting the results. The proposed model focuses on four logistics performance dimensions (i.e., economic efficiency, reliability, responsiveness, and safety), which are selected to represent operational routing and logistics-related planning in TPM. These dimensions capture several operational aspects that are relevant to sustainable destination management. For example, economic efficiency can support more effective infrastructure utilization and resource allocation, reliability and responsiveness contribute to service continuity and accessibility, and safety supports risk reduction and visitor protection in tourism mobility planning. However, this set of criteria does not incorporate broader tourism dimensions emphasized in sustainable tourism literature, such as environmental sustainability, cultural heritage preservation, destination image, and impacts on local communities. These dimensions may also influence tourism planning and destination development outcomes.
In addition, the MOTSP formulation relies on practical proxy indicators to operationalize each criterion. Specifically, total travel distance represents economic efficiency, the number of alternative routes represents reliability, travel time represents responsiveness, and accident statistics represent safety. In this study, these proxy variables are interpreted as simplified operational representations of stakeholder-defined planning dimensions developed under data availability constraints and intended primarily as a proof-of-concept for linking stakeholder preference structures with multi-objective routing analysis. That is, economic efficiency cannot be fully represented by travel distance alone, as actual travel costs may also be shaped by fuel prices, toll systems, vehicle operating costs, and the opportunity cost of travel time. Similarly, safety in tourism contexts extends beyond recorded accident exposure to include perceived security, emergency accessibility, health preparedness, and tourists’ psychological comfort when traveling across unfamiliar destinations. Reliability may also depend not only on the availability of alternative routes but also on infrastructure condition, information availability, and the ability of the destination transport system to function under disruptions. While these indicators are commonly adopted in logistics and transportation studies, they may not fully capture the broader complexity of tourism systems, where factors such as congestion levels, infrastructure quality, perceived safety, and emergency response capacity may also influence routing decisions. Nevertheless, the use of measurable proxy indicators enables practical implementation under existing data availability constraints, particularly in emerging tourism destinations where comprehensive public tourism and mobility datasets remain limited. The dataset also contains a higher proportion of domestic tourists, reflecting regional tourism structure and available data sources. Furthermore, this study includes tourists and service providers and does not incorporate the perspectives of public agencies or local community representatives. This limitation should be considered when interpreting the findings and applying the framework in broader tourism planning contexts.

6. Conclusions

This study proposed a stakeholder-informed tourism planning framework that integrates the BWM with an MOTSP model to support operational tourism routing and logistics planning. The findings demonstrate that integrating stakeholder preferences into routing analysis can support more balanced tourism mobility decisions across economic efficiency, reliability, responsiveness, and safety dimensions. The results further show that optimizing tourism routing based on a single criterion may lead to trade-offs in other performance dimensions, whereas the multi-objective approach provides more balanced routing solutions for tourism planning contexts. From a tourism management perspective, the study contributes by demonstrating how stakeholder-informed priorities can be systematically translated into operational routing and infrastructure-related decisions through a logistics-oriented decision-support framework. In addition, the findings highlight the importance of differentiated tourism planning strategies across tourist groups, particularly in emerging tourism destinations where transportation and tourism infrastructure remain constrained.
This study provides practical insights for policymakers and tourism managers in prioritizing multi-criteria approaches for planning tourism mobility solutions. Despite these contributions, the proposed framework should be interpreted within the scope of operational tourism planning and logistics-based decision support. However, the study is not without limitations. The analysis is based on a specific case study with a limited set of decision-making groups, which may not fully capture seasonal variability or emerging mobility patterns. In addition, the proposed framework focuses primarily on logistics-related operational dimensions and does not explicitly incorporate broader tourism sustainability factors such as environmental impacts, cultural heritage preservation, destination image, or local community perspectives. This study could also be extended by incorporating measurable indicators such as carbon emissions and transportation capacity for environmental assessment, as well as quality of life and perceived tourism impacts to better represent local community perspectives. Future research may consider integrating broader demographic sampling to further validate and refine the proposed framework. Consequently, incorporating additional criteria and a wider range of stakeholders could further enhance the applicability of TPM strategies. Future studies may also benefit from more comprehensive public tourism and mobility datasets, particularly in emerging tourism destinations where data availability remains limited. Furthermore, the MOTSP model may be extended using more complex formulations to reflect realistic operational constraints and enhance the robustness and applicability of TPM planning in smart tourism contexts.

Author Contributions

Writing—original draft preparation, K.R.; methodology, K.R.; investigation, W.C.W. and P.P.; resources, J.J.; writing—review and editing, J.J. All authors have read and agreed to the published version of the manuscript.

Funding

This research received no external funding.

Institutional Review Board Statement

Ethical review and approval were waived for this study because it qualified for exemption under the institutional ethics guidelines for surveys, interviews, or observation of public behaviors.

Informed Consent Statement

Informed consent was obtained from all subjects involved in the study.

Data Availability Statement

The original contributions presented in this study are included in the article. Further inquiries can be directed to the corresponding author.

Acknowledgments

The authors sincerely thank all respondents for their valuable participation and for providing the data essential to this study.

Conflicts of Interest

The authors declare no conflict of interest.

References

  1. Adamczyk, J., & Wałdykowski, P. (2022). Planning for sustainable development of tourism in the Tatra National Park Buffer zone using the MCDA approach. Miscellanea Geographica, 26(1), 42–51. [Google Scholar] [CrossRef] [Scilit]
  2. Agarwal, S., Page, S. J., & Mawby, R. (2021). Tourist security, terrorism risk management and tourist safety. Annals of Tourism Research, 89, 103207. [Google Scholar] [CrossRef] [Scilit]
  3. Agrawal, R., Wankhede, V. A., Kumar, A., Luthra, S., & Huisingh, D. (2022). Big data analytics and sustainable tourism: A comprehensive review and network based analysis for potential future research. International Journal of Information Management Data Insights, 2(2), 100122. [Google Scholar] [CrossRef] [Scilit]
  4. Ahmed, S. (2025). Tourism today: Trends, challenges, and opportunities. Journal of Educational Studies, 3(1), 42–56. [Google Scholar] [CrossRef] [Scilit]
  5. Akhtar, M. (2023). Logistics services outsourcing decision making: A literature review and research agenda. International Journal of Production Management and Engineering, 11(1), 73–88. [Google Scholar] [CrossRef] [Scilit]
  6. Al Mahrizi, A. S. K., Gray, T., Gregory-Smith, D., & Stead, S. M. (2024). The role of stakeholder participation in Oman’s tourism planning system. Tourism Planning & Development, 21(6), 881–916. [Google Scholar] [CrossRef] [Scilit]
  7. Antolini, F., Cesarini, S., & Simonetti, B. (2024). Factors determining Italian tourists’ expenses: A machine learning approach. Quality & Quantity, 60, 8059–8077. [Google Scholar] [CrossRef] [Scilit]
  8. APICS Supply Chain Council. (2017). Supply chain operations reference model (SCOR) (Version 12.0). APICS. [Google Scholar]
  9. Arici, H. E., & Köseoglu, M. A. (2025). What are the most influential drivers of tourism destination competitiveness? Journal of Destination Marketing & Management, 36, 100990. [Google Scholar] [CrossRef] [Scilit]
  10. Arvianto, A., Sopha, B. M., Asih, A. M. S., & Imron, M. A. (2021). City logistics challenges and innovative solutions in developed and developing economies: A systematic literature review. International Journal of Engineering Business Management, 13, 18479790211039723. [Google Scholar] [CrossRef] [Scilit]
  11. Bader, M. (2025). Tourism village competitiveness analysis using MCDA approach (MACBETH technique). Journal of Vacation Marketing, 13567667251333148. [Google Scholar] [CrossRef] [Scilit]
  12. Badiora, A. I., Adedotun, S. B., Sobowale, T. O., & Afolabi, H. (2022). Safety and security assessment of tourist destinations: A field study in a Nigerian geopark: Safety and security assessment of tourist attraction sites. Journal of Event, Tourism and Hospitality Studies, 2, 106–149. [Google Scholar]
  13. Bafekr, P. (2024). Investigating the effect of service innovation, response speed, and information transparency on customer trust in travel agencies of east Gilan province. Creative Economy and New Business Management Approaches, 2, 76–91. [Google Scholar]
  14. Bansal, A., Mukherjee, S., & Prayag, G. (2025). From crisis to care: Redesigning work and jobs for employee well-being in hospitality and tourism. Tourism and Hospitality Research, 14673584251321038. [Google Scholar] [CrossRef] [Scilit]
  15. Blättler, K., Wallimann, H., & von Arx, W. (2024). Free public transport to the destination: A causal analysis of tourists’ travel mode choice. Transportation Research Part A: Policy and Practice, 187, 104166. [Google Scholar] [CrossRef] [Scilit]
  16. Boes, K., Buhalis, D., & Inversini, A. (2016). Smart tourism destinations: Ecosystems for tourism destination competitiveness. International Journal of Tourism Cities, 2(2), 108–124. [Google Scholar] [CrossRef] [Scilit]
  17. Bono i Gispert, O., Anton Clavé, S., & Casadesús Fa, M. (2023). The internalization of participation and coherence dimensions of governance in tourism destination management organizations—An exploratory approach. Sustainability, 15(3), 2449. [Google Scholar] [CrossRef] [Scilit]
  18. Bono i Gispert, O., Anton Clavé, S., & Casadesús Fa, M. (2024). The TDG Barometer: A self-assessment tool to integrate quality in the measurement of tourism destination governance. International Journal of Tourism Research, 26(5), e2774. [Google Scholar] [CrossRef] [Scilit]
  19. Bramwell, B., & Lane, B. (Eds.). (2000). Collaboration and partnerships in tourism planning. In Tourism collaboration and partnerships: Politics, practice and sustainability (Vol. 2, pp. 1–19). Channel View Publications. [Google Scholar]
  20. Brochado, A., Cristovao Verissimo, J. M., & de Oliveira, J. C. L. (2022). Memorable tourism experiences, perceived value dimensions and behavioral intentions: A demographic segmentation approach. Tourism Review, 77(6), 1472–1486. [Google Scholar] [CrossRef] [Scilit]
  21. Camilleri, M. A. (Ed.). (2024). Tourism planning and destination marketing. Emerald Publishing Limited. [Google Scholar]
  22. Chanwanwakul, S. (2025). Tourism behavior in Ubon Ratchathani province. Journal of Social Sciences, 9, 145–159. (In Thai) [Google Scholar]
  23. Chen, Z., Zhang, P., & Peng, L. (2024). Application of a hybrid genetic algorithm based on the travelling salesman problem in rural tourism route planning. International Journal of Computing Science and Mathematics, 19(1), 1–14. [Google Scholar] [CrossRef] [Scilit]
  24. Cheunkamon, E., Jomnonkwao, S., & Ratanavaraha, V. (2022). Impacts of tourist loyalty on service providers: Examining the role of the service quality of tourism supply chains, tourism logistics, commitment, satisfaction, and trust. Journal of Quality Assurance in Hospitality & Tourism, 23(6), 1397–1429. [Google Scholar]
  25. Ciarlante, K., Mejia, C., & Broker, E. (2024). A research agenda for occupational safety, health, & well-being in hospitality & tourism management. International Journal of Hospitality Management, 123, 103887. [Google Scholar] [CrossRef] [Scilit]
  26. Correia, A., & Kozak, M. (2022). Past, present and future: Trends in tourism research. Current Issues in Tourism, 25(6), 995–1010. [Google Scholar]
  27. Corrente, S., Greco, S., & Rezaei, J. (2024). Better decisions with less cognitive load: The Parsimonious BWM. Omega, 126, 103075. [Google Scholar] [CrossRef] [Scilit]
  28. Crouch, G. I. (2011). Destination competitiveness: An analysis of determinant attributes. Journal of Travel Research, 50(1), 27–45. [Google Scholar]
  29. Çakar, K. (2023). Towards an ICT-led tourism governance: A systematic literature review. European Journal of Tourism Research, 34, 3404. [Google Scholar] [CrossRef] [Scilit]
  30. Deb, S. K., Biswas, C., Kuri, B. C., & Sharmin, S. (2024). Integrating tourism supply chain operations reference model into circular economy principles in the context of achieving sustainable development goals (SDGs). In International handbook of skill, education, learning, and research development in tourism and hospitality (pp. 763–776). Springer Nature. [Google Scholar]
  31. Donaldson, T., & Preston, L. E. (1995). The stakeholder theory of the corporation: Concepts, evidence, and implications. Academy of Management Review, 20(1), 65–91. [Google Scholar] [CrossRef] [Scilit]
  32. Duro, J. A., Fernández-Fernández, M., Pérez-Laborda, A., & Rosselló-Nadal, J. (2024). Towards a risk-adjusted tourism and travel competitiveness index. Tourism Economics, 30(4), 947–968. [Google Scholar]
  33. Dwyer, L., & Kim, C. (2003). Destination competitiveness: Determinants and indicators. Current Issues in Tourism, 6(5), 369–414. [Google Scholar] [CrossRef] [Scilit]
  34. Freeman, R. E. (2010). Strategic management: A stakeholder approach. Cambridge University Press. [Google Scholar]
  35. Gao, J., Jia, S., Mitchell, J. S., & Zhao, L. (2020, May). Approximation algorithms for time-window TSP and prize collecting TSP problems. In Algorithmic foundations of robotics XII: Proceedings of the twelfth workshop on the algorithmic foundations of robotics (pp. 560–575). Springer International Publishing. [Google Scholar]
  36. Google. (2025). Google maps. Available online: https://maps.google.com/ (accessed on 26 May 2025).
  37. Gu, X., Hunt, C. A., Jia, X., & Niu, L. (2022). Evaluating nature-based tourism destination attractiveness with a Fuzzy-AHP approach. Sustainability, 14(13), 7584. [Google Scholar] [CrossRef] [Scilit]
  38. Han, J., Zuo, Y., Law, R., Chen, S., & Zhang, M. (2021). Service quality in tourism public health: Trust, satisfaction, and loyalty. Frontiers in Psychology, 12, 731279. [Google Scholar] [CrossRef] [Scilit] [PubMed]
  39. Iamtrakul, P., Chayphong, S., Seo, D., & Trinh, T. A. (2025). Promoting accessibility for sustainable tourism: A spatial analysis of tourist attractions and public transportation networks in Bangkok. City, Territory and Architecture, 12(1), 13. [Google Scholar] [CrossRef] [Scilit]
  40. Janmontree, J., Zadek, H., & Ransikarbum, K. (2025). Analyzing solar location for green hydrogen using multi-criteria decision analysis. Renewable and Sustainable Energy Reviews, 209, 115102. [Google Scholar] [CrossRef] [Scilit]
  41. Jánová, V., Herntrei, M., & Fialová, D. (2025). From aspirations of citizen power to the persistence of tokenism: A systematic review of citizen participation in destination governance. Frontiers in Sustainable Tourism, 4, 1693707. [Google Scholar] [CrossRef] [Scilit]
  42. Kar, A. K., Choudhary, S. K., & Ilavarasan, P. V. (2023). How can we improve tourism service experiences: Insights from multi-stakeholders’ interaction. Decision, 50(1), 73–89. [Google Scholar] [CrossRef] [Scilit]
  43. Kumar, R. (2025). A comprehensive review of MCDM methods, applications, and emerging trends. Decision Making Advances, 3(1), 185–199. [Google Scholar] [CrossRef] [Scilit]
  44. Lee, T. J., Pai, C. K., Chen, T., & Kim, D. K. (2025). Tourists’ perception of destination, destination trust, protection effectiveness and travel intentions. International Journal of Tourism Research, 27(2), e70018. [Google Scholar] [CrossRef] [Scilit]
  45. Liang, F., Brunelli, M., & Rezaei, J. (2020). Consistency issues in the best worst method: Measurements and thresholds. Omega, 96, 102175. [Google Scholar] [CrossRef] [Scilit]
  46. Luštický, M., & Štumpf, P. (2021). Leverage points of tourism destination competitiveness dynamics. Tourism Management Perspectives, 38, 100792. [Google Scholar] [CrossRef] [Scilit]
  47. Mak, K. T., Gonzalez, C., Magnaye, Z., Gonzalez, J., Chen, Y., & Tang, B. (2024, December 2–4). Budget-constrained traveling salesman problem: A cooperative multi-agent reinforcement learning approach. 21st Annual IEEE International Conference on Sensing, Communication, and Networking (SECON) (pp. 1–9), Phoenix, AZ, USA. [Google Scholar]
  48. Manumpil, F. E., Utomo, S. W., Koestoer, R. H. S., & Soesilo, T. E. B. (2023). Multicriteria decision making in sustainable tourism and low-carbon tourism research: A systematic literature review. Tourism: An International Interdisciplinary Journal, 71(3), 447–471. [Google Scholar] [CrossRef] [Scilit]
  49. Mic, M. (2021). Tourism certification audits: Reviewing sustainable certification programs. In Handbook for sustainable tourism practitioners (pp. 447–469). Edward Elgar Publishing. [Google Scholar]
  50. Nopphakate, K., & Aunyawong, W. (2022). The relationship of tourism logistics management and destination brand loyalty: The mediating role of Thailand tourist satisfaction. International Journal of Health Sciences, 6, 356–366. [Google Scholar] [CrossRef] [Scilit]
  51. Nugraheni, A., Nurcahyo, R., & Gabriel, D. S. (2022, March 7–10). Certification of tourism business standards and CHSE standards in Indonesia. International conference on industrial engineering and operations management (pp. 239–250), Istanbul, Turkey. [Google Scholar]
  52. Pan, X., Jin, Y., Ding, Y., Feng, M., Zhao, L., Song, L., & Bian, J. (2023). H-tsp: Hierarchically solving the large-scale traveling salesman problem. In Proceedings of the AAAI conference on artificial intelligence (Vol. 37, pp. 9345–9353). AAAI Press. [Google Scholar]
  53. Panagiotopoulou, P., & Skoultsos, S. (2025). Stakeholders’ involvement in sustainable destination management: A systematic literature review of existing multi-stakeholder frameworks and approaches. Tourism and Hospitality, 6(5), 250. [Google Scholar] [CrossRef] [Scilit]
  54. Patterson, I., & Balderas-Cejudo, A. (2023). Tourism towards healthy lives and well-being for older adults and senior citizens: Tourism agenda 2030. Tourism Review, 78(2), 427–442. [Google Scholar] [CrossRef] [Scilit]
  55. Paulose, D., & Shakeel, A. (2022). Perceived experience, perceived value and customer satisfaction as antecedents to loyalty among hotel guests. Journal of Quality Assurance in Hospitality & Tourism, 23(2), 447–481. [Google Scholar]
  56. Pitakaso, R., Srichok, T., Khonjun, S., Gonwirat, S., Nanthasamroeng, N., & Boonmee, C. (2024). Multi-objective sustainability tourist trip design: An innovative approach for balancing tourists’ preferences with key sustainability considerations. Journal of Cleaner Production, 449, 141486. [Google Scholar] [CrossRef] [Scilit]
  57. Piya, S., Triki, C., Al Maimani, A., & Mokhtarzadeh, M. (2023). Optimization model for designing personalized tourism packages. Computers & Industrial Engineering, 175, 108839. [Google Scholar] [CrossRef] [Scilit]
  58. Plzáková, L., & Smeral, E. (2026). Identifying key factors of city resilience supporting competitiveness of destinations: A tourism perspective. Competitiveness Review: An International Business Journal, 1–14. [Google Scholar] [CrossRef] [Scilit]
  59. Polukhina, A., Sheresheva, M., Napolskikh, D., & Lezhnin, V. (2025). Digital solutions in tourism as a way to boost sustainable development: Evidence from a transition economy. Sustainability, 17(3), 877. [Google Scholar] [CrossRef] [Scilit]
  60. Pop, P. C., Cosma, O., Sabo, C., & Sitar, C. P. (2024). A comprehensive survey on the generalized traveling salesman problem. European Journal of Operational Research, 314(3), 819–835. [Google Scholar] [CrossRef] [Scilit]
  61. Priatmoko, S., Kabil, M., Vasa, L., Pallás, E. I., & Dávid, L. D. (2021). Reviving an unpopular tourism destination through the placemaking approach: Case study of Ngawen temple, Indonesia. Sustainability, 13(12), 6704. [Google Scholar] [CrossRef] [Scilit]
  62. Puchongkawarin, C., & Ransikarbum, K. (2021). An integrative decision support system for improving tourism logistics and public transportation in Thailand. Tourism Planning & Development, 18(6), 614–629. [Google Scholar]
  63. Ransikarbum, K., Paoprasert, N., & Anussornnitisarn, P. (2026). Evaluating public transportation criteria and congestion using multi-criteria assessment and simulation modeling. Modelling, 7(2), 73. [Google Scholar] [CrossRef] [Scilit]
  64. Ransikarbum, K., Wattanasaeng, N., & Madathil, S. C. (2023). Analysis of multi-objective vehicle routing problem with flexible time windows: The implication for open innovation dynamics. Journal of Open Innovation: Technology, Market, and Complexity, 9(1), 100024. [Google Scholar] [CrossRef] [Scilit]
  65. Ransikarbum, K., Zadek, H., & Janmontree, J. (2024). Evaluating renewable energy sites in the green hydrogen supply chain with integrated multi-criteria decision analysis. Energies, 17(16), 4073. [Google Scholar] [CrossRef] [Scilit]
  66. Rezaei, J. (2015). Best-worst multi-criteria decision-making method. Omega, 53, 49–57. [Google Scholar] [CrossRef] [Scilit]
  67. Rheeders, T. (2022). A review of the determinants of tourism destination competitiveness. Journal of Contemporary Management, 19(2), 238–268. [Google Scholar] [CrossRef] [Scilit]
  68. Ritchie, J. B., & Crouch, G. I. (2003). The competitive destination: A sustainable tourism perspective. Cabi. [Google Scholar]
  69. Rucci, A. C., & Porto, N. (2022). Accessibility in tourist sites in Spain: Does it really matter when choosing a destination? European Journal of Tourism Research, 31, 3108. [Google Scholar] [CrossRef] [Scilit]
  70. Saaty, T. L. (2008). Decision making with the analytic hierarchy process. International Journal of Services Sciences, 1(1), 83–98. [Google Scholar] [CrossRef] [Scilit]
  71. Salehipour, M., Kazemi, N., Jokar Arsanjani, J., & Karimi Firozjaei, M. (2025). Developing a multi-criteria decision model to unlock sustainable heritage tourism potential. Sustainability, 17(8), 3703. [Google Scholar] [CrossRef] [Scilit]
  72. Sasithornwetchakul, A., & Choibamroong, T. (2019). Evaluation of tourism management in Nakhon Si Thammarat province, Thailand as a secondary tourism city. Asian Administration & Management Review, 2(2). Available online: https://ssrn.com/abstract=3654557 (accessed on 25 May 2026).
  73. Seow, A. N., Choong, Y. O., Low, M. P., Ismail, N. H., & Choong, C. K. (2024). Building tourism SMEs’ business resilience through adaptive capability, supply chain collaboration and strategic human resource. Journal of Contingencies and Crisis Management, 32(2), e12564. [Google Scholar] [CrossRef] [Scilit]
  74. Shi, S., Li, M., Li, Z., & Xi, J. (2023). Spatial heterogeneity and influencing factors of high-grade tourist attractions in the Tibetan plateau. International Journal of Environmental Research and Public Health, 20(5), 4650. [Google Scholar] [CrossRef] [Scilit] [PubMed]
  75. Sivarethinamohan, R. (2023). Exploring the transformation of digital tourism: Trends, impacts, and future prospects. In International conference on digital applications, transformation & economy (ICDATE) (pp. 260–266). IEEE. [Google Scholar]
  76. Song, J., & Xu, B. (2024). Evaluation model of urban tourism competitiveness in the context of sustainable development. Frontiers in Public Health, 12, 1396134. [Google Scholar] [CrossRef] [Scilit] [PubMed]
  77. Song, Z. (2025). Research on assessing comprehensive competitiveness of tourist destinations within cities, based on field theory and competitiveness theory. Sustainability, 17(1), 90. [Google Scholar] [CrossRef] [Scilit]
  78. Stylos, N., Zwiegelaar, J., & Buhalis, D. (2021). Big data empowered agility for dynamic, volatile, and time-sensitive service industries: The case of tourism sector. International Journal of Contemporary Hospitality Management, 33(3), 1015–1036. [Google Scholar] [CrossRef] [Scilit]
  79. Suanpang, P., & Jamjuntr, P. (2024). Optimizing service scheduling by genetic algorithm support decision-making in smart tourism destinations. Decision Making: Applications in Management and Engineering, 7(1), 624–650. [Google Scholar]
  80. Thai Route Service Center. (2025). Road accident statistics. Available online: https://www.thairsc.com/ (accessed on 26 May 2026). (In Thai)
  81. Torralba, M. A., & Ylagan, A. D. (2021). Safety and security among resorts in Batangas province. Asia Pacific Journal of Management and Sustainable Development, 9(2), 80–88. [Google Scholar]
  82. Tourism Authority of Thailand. (2018, November 21). TAT curates three concepts to promote 55 secondary cities. TAT Newsroom. Available online: https://www.tatnews.org/2018/11/tat-curates-three-concepts-to-promote-55-secondary-cities/ (accessed on 15 March 2025).
  83. Tourism Authority of Thailand. (2025). Ubon Ratchathani. Available online: https://www.tourismthailand.org/Destinations/Provinces/Ubon-Ratchathani/587 (accessed on 26 May 2025).
  84. Trusova, N. V., Tsviliy, S. M., Gurova, D. D., Demko, V. S., & Samsonova, V. V. (2023). Budget instruments for stimulating the development of the investment potential of the tourism industry in Ukraine. Economic Affairs, 68(1s), 253–269. [Google Scholar] [CrossRef] [Scilit]
  85. United Nations World Tourism Organization (UNWTO). (2023). International tourism highlights (2023 ed.). United Nations World Tourism Organization. Available online: https://www.unwto.org (accessed on 17 May 2025).
  86. ur Rehman, S., Khan, S. N., Antohi, V. M., Bashir, S., Fareed, M., Fortea, C., & Cristian, N. P. (2024). Open innovation big data analytics and its influence on sustainable tourism development: A multi-dimensional assessment of economic, policy, and behavioral factors. Journal of Open Innovation: Technology, Market, and Complexity, 10(2), 100254. [Google Scholar] [CrossRef] [Scilit]
  87. Vanhove, N. (2022). The economics of tourism destinations: Theory and practice. Routledge. [Google Scholar]
  88. Varol, S., & Emiroğlu, B. (2026). The impact of crime and security perception on revisit and recommendation: The mediating role of visitor satisfaction. Journal of Tourism Leisure and Hospitality, 7(2), 163–181. [Google Scholar] [CrossRef] [Scilit]
  89. Vatankhah, S., Darvishmotevali, M., Rahimi, R., Jamali, S. M., & Ale Ebrahim, N. (2023). Assessing the application of multi-criteria decision making techniques in hospitality and tourism research: A bibliometric study. International Journal of Contemporary Hospitality Management, 35(7), 2590–2623. [Google Scholar] [CrossRef] [Scilit]
  90. Walas, B., Szromek, A. R., Kruczek, Z., & Rončák, M. (2024). Minimizing conflicts between residents and local tourism stakeholders as a way to achieve sustainable tourism in Prague, Krakow and Braga. Tourism Review, 79(7), 1367–1384. [Google Scholar]
  91. Wang, Y., Li, Y., & Lu, C. (2023). Evaluating the effects of logistics center location: An analytical framework for sustainable urban logistics. Sustainability, 15(4), 3091. [Google Scholar] [CrossRef] [Scilit]
  92. Wattanasaeng, N., & Ransikarbum, K. (2024). Sustainable planning and design for eco-industrial parks using integrated multi-objective optimization and fuzzy analytic hierarchy process. Journal of Industrial and Production Engineering, 41(3), 256–275. [Google Scholar]
  93. Wilks, J., Pendergast, D., Leggat, P. A., & Morgan, D. (Eds.). (2021). Tourist health, safety and wellbeing in the New Normal. Springer. [Google Scholar]
  94. World Bank. (2025, March 10). Thailand economic monitor. Available online: https://openknowledge.worldbank.org (accessed on 25 May 2026).
  95. Wu, L., Wang, Z., Liao, Z., Xiao, D., Han, P., Li, W., & Chen, Q. (2024). Multi-day tourism recommendations for urban tourists considering hotel selection: A heuristic optimization approach. Omega, 126, 103048. [Google Scholar] [CrossRef] [Scilit]
  96. Yen, C. H., Tsaur, S. H., & Ho, C. Y. (2023). Comparing older and younger adults’ valuation of friendly destination attributes: A mixed-method empirical study. Journal of Hospitality and Tourism Insights, 6(5), 2030–2051. [Google Scholar]
  97. Yen, H. P., Chen, P. C., & Ho, K. C. (2021). Analyzing destination accessibility from the perspective of efficiency among tourism origin countries. Sage Open, 11(2), 21582440211005752. [Google Scholar] [CrossRef] [Scilit]
  98. Yin, J. (2024). Distinguishing the determinants of low-cost and high-cost sustainable travel behaviors. Journal of Hospitality and Tourism Insights, 7(4), 1890–1910. [Google Scholar]
  99. Yohesh, J., Rizwan, N., Tamilselvan, B., & Gayathri, M. (2026). Enhancing guest safety: The role of hygiene and health regulations in hospitality management. Journal of Advanced Research and Innovation, 2(2), 25–29. [Google Scholar]
  100. Yu, Y. (2024). A strategic study on the planning of accommodation facilities in tourist attractions to enhance tourist experience. International Journal for Housing Science and Its Applications, 45, 10–21. [Google Scholar] [CrossRef] [Scilit]
  101. Zang, Z., Xu, X., Qu, K., Chen, R., & Chen, A. (2022). Travel time reliability in transportation networks: A review of methodological developments. Transportation Research Part C: Emerging Technologies, 143, 103866. [Google Scholar] [CrossRef] [Scilit]
  102. Zhang, Y., Moyle, B., Dupré, K., Lohmann, G., Desha, C., & MacKenzie, I. (2023). Tourism and natural disaster management: A systematic narrative review. Tourism Review, 78(6), 1466–1483. [Google Scholar] [CrossRef] [Scilit]
  103. Zhao, Y., & Zhang, X. (2024). Ecological safety early warning and emergency management system of tourist attractions based on spatiotemporal evolution analysis. Journal of Biotech Research, 19, 209–220. [Google Scholar]
Figure 1. The proposed framework based on two-phase methodology for TPM.
Tourismhosp 07 00225 g001
Figure 2. The BWM-based main criteria tradeoff analysis (a) by roles, (b) by genders, (c) by ages.
Tourismhosp 07 00225 g002
Figure 3. The radar charts for ranking comparisons based on (a) roles, (b) genders, (c) ages.
Tourismhosp 07 00225 g003
Figure 4. The case study of travel destinations in Ubon Ratchathani province, Thailand.
Tourismhosp 07 00225 g004
Figure 5. Logistics travel routing based on (a) total distance and (b) balancing diverse criteria.
Tourismhosp 07 00225 g005
Table 1. Pairwise comparison scale for BWM.
ScaleDescriptionInterpretation of Preference
1Equal importanceBoth criteria are considered equally important
2Weak importanceIntermediate level between equal and moderate preference
3Moderate importanceOne criterion is moderately more important than the other
4Moderate-to-strong importanceIntermediate level between moderate and strong preference
5Strong importanceOne criterion is strongly preferred over the other
6Strong-to-very strong importanceIntermediate level between strong and very strong preference
7Very strong importanceOne criterion is very strongly more important than the other
8Very strong-to-extreme importanceIntermediate level between very strong and extreme preference
9Extreme importanceOne criterion is extremely more important than the other
Table 2. Input-based consistency thresholds in BWM.
Scale3 Criteria4 Criteria5 Criteria6 Criteria7 Criteria
1–2-----
30.16670.16670.16670.16670.1667
40.11210.15290.18980.22060.2527
50.13540.19940.23060.25460.2716
60.13300.19900.26430.30440.3144
70.12940.24570.28190.30290.3144
80.13090.25210.29580.31540.3408
90.13590.26810.30620.33370.3517
Table 3. Criteria description for the TPM case study.
CriteriaDescription (Relevant References)
C1: Economic efficiency
C1.1: Perceived value for travel tripTourists’ overall perception of whether the entire travel experience is worth the money spent (Brochado et al., 2022; Paulose & Shakeel, 2022).
C1.2: Direct travel expenses Travel-related expenses such as transportation modes, accommodations, and relevant fees (Antolini et al., 2024; Blättler et al., 2024).
C1.3: Budget plan and management The aspect of regional tourism authority in planning and distributing financial resources to support tourist experience (Trusova et al., 2023).
C1.4: Comparative cost advantageCost comparisons between different travel routes, packages, or agencies to determine better decision (Blättler et al., 2024; Yin, 2024).
C2: Reliability
C2.1: Service consistency and stabilityServices are delivered consistently and without interruption, ensuring tourists and stakeholders can rely on dependable experiences (Zang et al., 2022).
C2.2: Accessibility of travel destinationsThe tourism infrastructure offers routes and options enhancing flexibility for unexpected events and maintain smooth operations (Rucci & Porto, 2022).
C2.3: Timeliness and schedule adherenceServices consistently operate according to their scheduled times demonstrating dependable performance (Suanpang & Jamjuntr, 2024).
C2.4: Service readiness and availability Services are consistently available with adequate capacity to meet tourist demand ensuring dependable operations (Arici & Köseoglu, 2025).
C3: Responsiveness
C3.1: Speed of service and travel timeThe ability to provide efficient services combined with responsive travel time between destinations ensuring tourists experience (Bafekr, 2024).
C3.2: Proactive service preparednessThe ability of service providers to anticipate tourist needs and rapidly adjust resources and operations to meet tourist requirements (Stylos et al., 2021).
C3.3: Unplanned interruption responseThe capacity of service providers to promptly provide alternative solutions when faced with unexpected service disruptions (Seow et al., 2024).
C3.4: Real-Time customer interaction The ability of service providers to maintain timely communication with tourists via digital platforms or on-site support (Kar et al., 2023).
C4: Safety
C4.1: Incident prevention at tourist destinationsImplementation of safety measures at tourist destinations to prevent unexpected incidents for visitors (Agarwal et al., 2021; Han et al., 2021).
C4.2: Health and safety standardsEnforcement of public health and hygiene standards that protect the well-being of tourists (Wilks et al., 2021; Ciarlante et al., 2024).
C4.3: Accommodation securityThe extent to which lodging facilities ensure guest safety through security mechanisms (Torralba & Ylagan, 2021; Yu, 2024).
C4.4: Emergency plan and preparednessThe implementation of safety measures and coordination to handle emergencies from hazards due to critical events (Han et al., 2021).
Table 4. General information of stakeholders in the case study.
General InformationDescriptionPercentage of Respondents
Role R1: Thai tourist62.2%
R2: International tourist 7.8%
R3: Service provider 30.0%
GenderG1: Male 46.7%
G2: Female53.3%
AgeA1: 20 and below4.4%
A2: 21–40 41.1%
A3: 41–60 32.2%
A4: Above 6022.2%
Table 5. The BWM-based main criteria analysis.
StakeholdersC1C2C3C4
Overall analysis (Rank)0.2160 (3)0.2153 (4)0.2587 (2)0.3100 (1)
RoleR10.2129 (3)0.1877 (4)0.2944 (2)0.3049 (1)
R20.1720 (4)0.2245 (2)0.1833 (3)0.4202 (1)
R30.2343 (3)0.2679 (2)0.2049 (4)0.2929 (1)
GenderG10.2505 (2)0.1935 (4)0.2301 (3)0.3259 (1)
G20.1861 (4)0.2331 (3)0.2841 (2)0.2966 (1)
AgeA10.1959 (2)0.1260 (4)0.5123 (1)0.1657 (3)
A20.1913 (4)0.1963 (3)0.2575 (2)0.3549 (1)
A30.2579 (2)0.2560 (3)0.2033 (4)0.2828 (1)
A40.2454 (2)0.2110 (4)0.2212 (3)0.3224 (1)
Table 6. The BWM-based sub-criteria analysis under each main criterion.
C1 (Economic Efficiency Criterion)C2 (Reliability Criterion)
C1.1C1.2C1.3C1.4C2.1C2.2C2.3C2.4
Overall0.1992 (3)0.2706 (2)0.3383 (1)0.1919 (4)0.2073 (4)0.2717 (2)0.2345 (3)0.2865 (1)
R10.2037 (3)0.2647 (2)0.3493 (1)0.1823 (4)0.1957 (3)0.2969 (2)0.1929 (4)0.3144 (1)
R20.246 (2)0.2272 (3)0.3456 (1)0.1812 (4)0.1423 (4)0.1426 (3)0.4588 (1)0.2563 (2)
R30.1775 (4)0.2944 (2)0.3134 (1)0.2147 (3)0.2466 (3)0.2509 (2)0.2611 (1)0.2414 (4)
G10.2148 (3)0.2524 (2)0.3327 (1)0.2001 (4)0.1966 (4)0.2894 (1)0.2402 (3)0.2738 (2)
G20.1854 (3)0.2867 (2)0.3431 (1)0.1848 (4)0.2157 (4)0.2593 (2)0.2287 (3)0.2963 (1)
A10.2686 (2)0.3969 (1)0.2171 (3)0.1174 (4)0.2125 (2)0.4132 (1)0.1972 (3)0.1771 (4)
A20.2217 (3)0.2532 (2)0.3312 (1)0.1939 (4)0.1918 (4)0.2904 (2)0.2114 (3)0.3064 (1)
A30.1524 (4)0.2843 (2)0.3655 (1)0.1978 (3)0.2314 (3)0.2208 (4)0.2769 (1)0.2709 (2)
A40.1193 (4)0.2904 (2)0.3987 (1)0.1916 (3)0.1641 (4)0.2459 (2)0.2263 (3)0.3637 (1)
C3 (Responsiveness Criterion)C4 (Safety Criterion)
C3.1C3.2C3.3C3.4C4.1C4.2C4.3C4.4
Overall0.2462 (3)0.2118 (4)0.2551 (2)0.2869 (1)0.2425 (3)0.2343 (4)0.2730 (1)0.2502 (2)
R10.2588 (2)0.2060 (4)0.2456 (3)0.2896 (1)0.2741 (1)0.2323 (4)0.2581 (2)0.2355 (3)
R20.2536 (3)0.1963 (4)0.2543 (2)0.2958 (1)0.1129 (4)0.1929 (3)0.4571 (1)0.2371 (2)
R30.2181 (4)0.2278 (3)0.2749 (2)0.2792 (1)0.2106 (4)0.2494 (3)0.2558 (2)0.2842 (1)
G10.2563 (2)0.2035 (3)0.2035 (4)0.3367 (1)0.2301 (2)0.2253 (3)0.3213 (1)0.2233 (4)
G20.2374 (3)0.2191 (4)0.3003 (1)0.2432 (2)0.2534 (2)0.2423 (3)0.2306 (4)0.2737 (1)
A10.1873 (4)0.1967 (3)0.3304 (1)0.2856 (2)0.2131 (3)0.2709 (2)0.2126 (4)0.3034 (1)
A20.2416 (3)0.2134 (4)0.2673 (2)0.2777 (1)0.2633 (2)0.2083 (4)0.2671 (1)0.2613 (3)
A30.2614 (2)0.2111 (4)0.2251 (3)0.3024 (1)0.2111 (4)0.2738 (2)0.2902 (1)0.2249 (3)
A40.2518 (2)0.2184 (4)0.2251 (3)0.3047 (1)0.2369 (3)0.2509 (2)0.2979 (1)0.2143 (4)
Table 7. The BWM-based global sub-criteria weight analysis and top ranks.
C1 (Economic Efficiency Criterion)C2 (Reliability Criterion)
C1.1C1.2C1.3C1.4C2.1C2.2C2.3C2.4
Overall0.0430.0580.073 (5)0.0410.0450.0580.0510.062
R10.0440.0570.0750.0390.0420.0640.0420.068
R20.0530.0490.0750.0390.0310.0310.0990.055
R30.0380.0640.0680.0460.0530.0540.0560.052
G10.0460.0550.0720.0430.0420.0620.0520.059
G20.0400.0620.0740.0400.0460.0560.0490.064
A10.0580.0860.0470.0250.0460.0890.0420.038
A20.0480.0550.0710.0420.0410.0630.0460.066
A30.0330.0610.0790.0430.0500.0480.0600.058
A40.0260.0630.0860.0410.0350.0530.0490.078
C3 (Responsiveness Criterion)C4 (Safety Criterion)
C3.1C3.2C3.3C3.4C4.1C4.2C4.3C4.4
Overall0.064 (8)0.0550.066 (7)0.074 (4)0.075 (3)0.072 (6)0.085 (1)0.078 (2)
R10.0670.0530.0640.0750.0850.0720.0800.073
R20.0650.0510.0660.0760.0350.0590.1420.074
R30.0560.0590.0710.0720.0650.0770.0790.088
G10.0660.0530.0530.0870.0710.0690.0990.069
G20.0620.0560.0770.0630.0780.0750.0720.085
A10.0480.0510.0850.0740.0660.0840.0660.094
A20.0630.0550.0690.0720.0820.0650.0830.081
A30.0680.0540.0580.0780.0650.0850.0900.069
A40.0650.0560.0580.0790.0740.0780.0920.066
Table 8. Policy implications with prioritized criteria.
CriteriaWeightTarget RolesPotential Policies
C4.3: Accommodation security0.085All (emphasis for international tourists)Standardized hotel security certification; safety ratings (Lee et al., 2025; Varol & Emiroğlu, 2026)
Tourist routing plan: Incorporate secure nodes as priority stops in routing
C4.4: Emergency preparedness0.078 Emphasis for service providersIntegrated emergency response systems; staff training (Zhang et al., 2023)
Tourist routing plan: Consider distance to hospitals or emergency units
C4.1: Incident prevention0.075 Emphasis for Thai touristsImproving surveillance systems and risk monitoring at attractions (Badiora et al., 2022; Zhao & Zhang, 2024)
Tourist routing plan: Assign risk scores for high-risk areas to destinations
C3.4: Real-Time customer interaction 0.074 All (emphasis for Thai tourists)Invest in digital tourism platforms such as apps and chatbots to provide functions such as real-time route updates, multilingual travel guidance, and transportation information (Sivarethinamohan, 2023; Polukhina et al., 2025)
Tourist routing plan: Enable dynamic route adjustment based on traffic conditions, destination congestion, or emergency situations
C1.3: Budget plan and management0.073 Emphasis for Thai touristsConsidering public funding allocation across high-demand destinations (Vanhove, 2022)
Tourist routing plan: Consider cost-weighted routing objective plan
C4.2: Health & safety standards0.072 Emphasis for service providersEnforcing hygiene certification systems and inspections (Mic, 2021; Nugraheni et al., 2022; Yohesh et al., 2026)
Tourist routing plan: Prioritize routes with certified destinations
C3.3: Unplanned interruption response0.066 Emphasis for service providersStaff training in crisis handling; flexible itinerary option (Bansal et al., 2025)
Tourist routing plan: Consider contingency routing plans with alternative paths
C3.1: Travel time efficiency0.064 Emphasis for Thai and international touristsImproving transport connectivity; reduce bottlenecks (Iamtrakul et al., 2025; Ransikarbum et al., 2026)
Tourist routing plan: Optimize travel time using real-time traffic information and adaptive route scheduling
Table 9. Detailed latitude and longitude data for the case study.
DestinationTourist AttractionLatitudeLongitude
D1Thungsimuang Park15.230496104.857209
D2Hong Beach15.793081105.411026
D3Little Pattaya15.174438105.358695
D4Nongpaphong Temple15.159035104.829017
D5Paphupang Temple15.649715105.484538
D6Phasok Cliff15.418333105.571003
D7Sirindhornwararam Temple15.149051105.467735
D8Taiphrachaoyaionetue Temple15.227507104.866314
D9Banphachan Village15.763705105.492244
D10Phukratae Island15.083572105.371560
D11Chomdao Beach15.907755105.341399
D12Changmob Rapids16.086325105.094220
D13Khuaoi Bridge15.289171104.659398
D14Sirindhorn Dam15.204447105.421608
D15Phrathatnongbua Temple15.263516104.838777
D16Samphanbok Canyon15.794764105.401055
D17Saengchan Waterfall15.516123105.589735
D18Nongyama Grassland15.163239104.941389
D19Phuchongnayoi National Park14.434520105.252136
D20Thamkhuhasawan Temple15.322794105.487663
D21Phataem National Park15.398978105.507504
D22Ubon National Museum15.228015104.857660
D23Kaengtana National Park15.299733105.477085
D24Sroisawan Waterfall15.460175105.578070
Table 10. Results for logistics routing model for the case study.
Objective TypeTotal Distance
(Kilometer)
Alternative Routes (Number)Total Travel Time (Minute)Accident Data (Case)
Economic
obj. function
724.45 km35 numbers841 min128 cases
Routing: D1–D22–D8–D12–D11–D16–D2–D9–D5–D17–D24–D21–D6–D23–D20–D7–D14–D3–D10–D19–D18–D4–D13–D15–D1
Reliability
obj. function
2699 km72 numbers2612 min174 cases
Routing: D1–D16–D15–D5–D13–D7–D19–D21–D10–D17–D22–D2–D23–D3–D11–D14–D12–D20–D8–D24–D18–D9–D4–D6–D1
Responsiveness obj. function726.15 km40 numbers835 min128 cases
Routing: D1–D8–D4–D18–D19–D10–D3–D14–D7–D20–D23–D6–D21–D24–D17–D5–D9–D2–D16–D11–D12–D13–D15–D22–D1
Safety
obj. function
1763 km52 numbers1773 min114 cases
Routing: D1–D9–D10–D24–D11–D23–D19–D5–D21–D16–D14–D7–D3–D2–D17–D6–D12–D15–D22–D4–D18–D13–D20–D8–D1
Multi-obj. function 1280 km59 numbers1277 min120 cases
Routing: D1–D4–D22–D15–D18–D6–D9–D5–D10–D21–D19–D7–D14–D3–D23–D17–D24–D2–D16–D12–D11–D13–D20–D8–D1
Table 11. Results for sensitivity analysis based on stakeholders’ roles, genders, ages.
ScenarioWeight (Table 5)Total Distance
(Kilometer)
Alternative Routes (Number)Total Travel Time (Minute)Accident Data (Case)
Base scenarioOverall128059 1277120
Scenario 1R11443581243120
Scenario 2R21611641639117
Scenario 3R31435641479120
Scenario 4G11278591423117
Scenario 5G21400621352120
Scenario 6A1958501006123
Scenario 7A21429611392117
Scenario 8A31168631485120
Scenario 9A41381621426120
Disclaimer/Publisher’s Note: The statements, opinions and data contained in all publications are solely those of the individual author(s) and contributor(s) and not of MDPI and/or the editor(s). MDPI and/or the editor(s) disclaim responsibility for any injury to people or property resulting from any ideas, methods, instructions or products referred to in the content.