Article

Unveiling the Pathway from Digitalization and Innovation Perceptions to Sharing Intentions Through the Lens of Destination Competitiveness


1
Faculty of Hospitality and Tourism, Tourism Department, Universitas Pelita Harapan, M.H. Thamrin Boulevard 1100, Tangerang 15811, Indonesia
2
Faculty of Hospitality and Tourism, Hospitality Management Department, Universitas Pelita Harapan, M.H. Thamrin Boulevard 1100, Tangerang 15811, Indonesia
*
Authors to whom correspondence should be addressed.
Tour. Hosp. 2026, 7(6), 177; https://doi.org/10.3390/tourhosp7060177
Submission received: 1 April 2026 / Revised: 10 June 2026 / Accepted: 12 June 2026 / Published: 16 June 2026

Abstract

Tourism destinations increasingly rely on digitalization and innovation to strengthen their competitive position and stimulate tourists’ post-visit behaviors. However, empirical evidence explaining how tourists’ perceptions of digitalization and innovation are translated into sharing intentions, particularly from an integrated competitiveness perspective, remains limited. Addressing this gap and grounded in Service-Dominant Logic, this study investigates the relationships between digitalization perceptions, innovation perceptions, destination competitiveness, and tourists’ sharing intentions. Using a quantitative approach, data were collected from Generation Z domestic tourists who had visited digitally enabled destinations within the past 12 months. The proposed research model was tested using Partial Least Squares Structural Equation Modeling (PLS-SEM). The findings reveal that perceptions of digitalization and innovation significantly enhance destination competitiveness, which in turn positively influences tourists’ sharing intentions. Moreover, destination competitiveness is confirmed as a partial mediator in the relationships between digitalization perceptions and sharing intentions, as well as between innovation perceptions and sharing intentions. The novelty of this study lies in conceptualizing destination competitiveness as a behavioral transmission mechanism that converts perceived digital and innovative destination attributes into tourists’ voluntary sharing behavior, rather than treating digitalization and innovation as direct antecedents alone. The theoretical contribution of this study lies in reconceptualizing destination competitiveness as a dynamic value co-creation mechanism that mediates the transformation of digitalization and innovation into tourists’ sharing intentions within a Service-Dominant Logic framework.

1. Introduction

Tourism destinations worldwide are increasingly embracing digitalization and innovative strategies to meet evolving traveler expectations and remain competitive. As tourists become more technologically savvy, their perceptions of digital advancements and innovative features at destinations significantly influence their experiences and subsequent behaviors, including their willingness to share and recommend these destinations to others. Understanding the mechanisms through which digitalization and innovation shape tourists’ sharing intentions is crucial for destination managers and policymakers seeking to foster destination competitiveness in a dynamic global market Cristina et al., 2022; Sigala, 2023).
The global tourism industry has undergone a rapid digital transformation in recent years, characterized by the widespread adoption of smart technologies, digital marketing platforms, and innovative service delivery (Gretzel et al., 2020). Destinations that effectively implement digital tools and foster a culture of innovation are better positioned to enhance visitor satisfaction and build a distinct competitive advantage (Mariani et al., 2023). However, there remains a limited understanding of how tourists’ perceptions of these digital and innovative efforts translate into behavioral outcomes, such as intentions to share experiences. Previous studies have explored the roles of digitalization and innovation in tourism separately, but few have integrated both constructs into a holistic model that accounts for the mediating effect of destination competitiveness on sharing intentions (Shampy Kamboj, 2023).
Innovation research has been mostly focused on service innovation, experiential enhancement, and destination attractiveness as determinants of tourism competitiveness. Also, separate streams of literature explore tourists’ sharing intentions and electronic word-of-mouth behavior as outcomes of memorable tourism experiences and digital engagement.
However, despite these important contributions, limited research has systematically integrated digitalization perceptions, innovation perceptions, and tourists’ sharing behavior within a unified framework that explains the mediating role of destination competitiveness. Existing studies are more likely to treat destination competitiveness as a static destination attribute or performance indicator than a dynamic mechanism through which digitally enabled and innovative tourism experiences are translated into behavioral advocacy outcomes.
This study aims to empirically investigate the pathway by which perceptions of digitalization and innovation influence tourists’ sharing intentions, specifically through the mediating role of destination competitiveness. By developing and testing a structural model, the research seeks to clarify the relationships among these constructs and provide actionable insights for destination marketing and management.
Despite growing academic interest in digitalization and innovation in tourism, the mechanisms linking these factors to tourists’ post-visit behaviors remain underexplored. There is a lack of empirical evidence on whether and how a destination’s competitiveness mediates the effects of tourists’ perceptions of digitalization and innovation on their intentions to share or recommend the destination. This research addresses the following key problem: How do perceptions of digitalization and innovation influence tourists’ sharing intentions, and what is the mediating role of destination competitiveness in this relationship?
The purpose of this study is to explore the impact of tourists’ perceptions of digitalization and innovation on their sharing intentions with the mediating role of destination competitiveness. More specifically, this study aims to answer the following research question: How do perceptions of digitalization and perceptions of innovation influence destination competitiveness? And how does destination competitiveness influence tourists’ sharing intentions? Based on Service-Dominant Logic, this study proposes a structural model to explain how digital and innovative destination attributes are transformed into behavioral advocacy outcomes.
This study is anchored in Service-Dominant Logic, a contemporary theoretical perspective in marketing and tourism research that positions value co-creation as the core of all exchange processes (Ballantyne & Varey, 2008). In the context of tourism, S-D Logic views destinations, tourists, technologies, and communities as networked actors who interact and integrate resources to co-create unique, personalized experiences.
Service-Dominant Logic, therefore, explains the interconnections between digitalization, innovation, competitiveness, and sharing intentions as an ongoing, interactive process of value creation. Tourists’ positive perceptions of digital and innovative practices lead to greater engagement, more competitive destination images, and a higher likelihood of sharing their co-created experiences, thereby feeding back into the value creation system (Sigala, 2023).
This study adopts a value co-creation perspective to explain how the tourism experience is formed and transformed into behavioral outcomes, in line with Service-Dominant Logic (SDL) (Lusch & Vargo, 2011). In SDL, value is not embedded in products or services but is co-created through interactions among multiple actors. Here, digitalization and innovation are considered as operant resources (intangible resources such as knowledge, skills, and digital technologies) that enable actors to engage in value creation. In this way, tourists are conceived as active co-creators of destination services, digital platforms, and personal experiences. Destinations can enhance their competitiveness by integrating resources, reflecting the effectiveness of co-created value. In turn, tourists’ sharing intentions are a value-in-use outcome expressed through user-generated content and electronic word-of-mouth, thereby further enhancing the value of the destination within the tourism ecosystem.
Digitalization refers to the integration of digital technologies into destination services and experiences, enhancing operational efficiency, visitor satisfaction, and overall destination appeal (Cristina et al., 2022). In tourism, digital tools such as mobile apps, virtual tours, online booking platforms, and real-time information systems have transformed how tourists plan, experience, and share their journeys (Sigala, 2023). Prior studies have established that digitalization positively affects both perceived value and loyalty (Gretzel et al., 2020) and is a significant driver of tourists’ willingness to engage in electronic word-of-mouth (eWOM) (Shampy Kamboj, 2023).
Destination competitiveness refers to a destination’s ability to attract and satisfy tourists better than its rivals (Crouch & Ritchie, 1999). It encompasses dimensions such as resource endowment, service quality, technology adoption, and innovative capacity (Dwyer & Edwards, 2020). Enhanced competitiveness not only boosts destination performance but also mediates the effects of digitalization and innovation on tourists’ post-visit behaviors, such as advocacy and sharing intentions (Shampy Kamboj, 2023).
Innovation in tourism involves introducing novel products, services, or experiences that differentiate a destination from its competitors (Mariani et al., 2023). Tourists’ perceptions of innovation—such as unique attractions, creative marketing, or sustainable practices—play a pivotal role in shaping their destination image and satisfaction (Hjalager, 2018). Research has shown that innovation enhances destination attractiveness and can trigger positive behavioral intentions, including sharing experiences and recommending destinations (Li et al., 2022). Unlike prior studies, this research explicitly operationalizes Service-Dominant Logic by linking operant resources, resource integration, and value co-creation processes to destination competitiveness and tourists’ sharing behavior within a unified empirical framework.

2. Literature Review

From an SDL perspective, the relationships investigated in this paper are a dynamic process of resource integration and value co-creation (Zaman, 2023). Digitalization enables the integration of informational and technological resources, also ensuring an easy interaction between tourists and destinations. Innovation creates new and meaningful tourism experiences and adds to experiential value (Peng & Gu, 2024). These operant resources together constitute the essence of destination competitiveness, resulting from proper value co-creation at the system level. Therefore, tourists’ sharing intention can be seen as a behavioral reflection of value-in-use, where co-created experiences are communicated and spread via digital platforms. This perspective allows the study to go beyond traditional input–output models and to explain how value is created, integrated, and expressed in tourism contexts (Orts-Cardador et al., 2025).
Guided by SDL, this study conceptualizes digitalization and innovation as operant resources that drive resource integration processes, while destination competitiveness represents the co-created value outcome that ultimately influences tourists’ behavioral responses (Kumar & Barua, 2024). Although previous studies generally support positive relationships among digitalization, innovation, competitiveness, and tourist behavioral outcomes, important conceptual differences remain within the literature (Xu et al., 2024; Zhou et al., 2024). While technology-oriented studies emphasize accessibility, convenience, and information integration as key drivers of tourist engagement, experiential tourism studies highlight novelty, immersion, and the creation of emotional value as central determinants of destination attractiveness. This divergence suggests that digitalization and innovation may contribute to competitiveness through distinct value creation pathways, thereby requiring a more integrated theoretical explanation (Alhaddar & Kummitha, 2025).
Although digital perceptions and innovation perception are closely related within digitally enabled tourism environments, the two constructs represent conceptually distinct dimensions. Digital perceptions primarily refer to tourists’ evaluations of technological infrastructure, digital accessibility, information integration, and technology-supported interaction within destination services. This construct emphasizes the role of digital capabilities in facilitating convenience, communication, and service efficiency within tourism experiences (Khoshroo & Soltani, 2025).
In contrast, innovation perception reflects tourists’ evaluations of novelty, creativity, experiential differentiation, and innovative tourism offerings that enhance destination uniqueness and experiential engagement. While digitalization focuses on technology-enabled interaction processes, innovation emphasizes the creation of new, meaningful, and differentiated tourism experiences (Mogaji, 2025). Therefore, digitalization and innovation contribute differently to value co-creation and destination competitiveness within tourism ecosystems.

2.1. Digitalization Perceptions Have a Positive Effect on Destination Competitiveness

From the SDL perspective, digitalization enables the integration of resources by allowing tourists and destinations to connect through technological platforms, improving information accessibility, and delivering digitized services. Such interactions enhance tourists’ assessments of destination competitiveness in terms of enhanced experiential quality and service efficiency.
Digitalization has fundamentally reshaped the tourism sector, enabling destinations to streamline operations, enhance visitor engagement, and deliver seamless services. The integration of digital tools, ranging from online booking systems and virtual tours to AI-powered chatbots and smart tourism infrastructure, has enabled destinations to offer superior convenience and personalized experiences to travelers (Seyfi et al., 2025). As tourists increasingly expect real-time information and digital connectivity during their journeys, destinations that meet these expectations can stand out in a competitive market. Moreover, studies confirm that comprehensive digital strategies enable destinations to compete globally, attract new market segments, and adapt rapidly to changing visitor demands.
Recent empirical research demonstrates that the adoption of digitalization is closely linked to improved destination image and visitor decision making. A study on heritage tourism in Vietnam found that digital accessibility and interactivity not only enhance the perceived image of a destination but also significantly influence tourists’ destination choices (Duc & Tien, 2025). Furthermore, destinations with advanced digital services, such as mobile guides, virtual ticketing, and interactive maps, report higher tourist satisfaction, repeat visitation, and a longer average length of stay (Zunaidi et al., 2022). These technological advancements reduce friction in the travel experience and allow destinations to respond swiftly to feedback, ultimately strengthening their competitive positioning.
The link between tourists’ perceptions of digitalization and competitiveness is further reinforced by conceptual and case-based research. In Indonesia’s marine tourism, for example, digital transformation is recognized as a critical driver of value co-creation and stakeholder collaboration, boosting both operational efficiency and market differentiation (Lemy et al., 2021). Additional studies highlight that tourists’ positive perceptions of digital technology adoption increase their satisfaction and loyalty, underscoring the strategic imperative for destinations to continuously innovate digitally (I. K. A. Wong et al., 2020). As a result, the body of evidence strongly supports the following hypothesis:
H1. 
Digitalization perceptions have a positive effect on destination competitiveness.

2.2. Innovation Perceptions Have a Positive Effect on Destination Competitiveness

SDL suggests that innovation contributes to the co-creation of experiential value by enabling destinations to offer novel, engaging, and differentiated tourism experiences. Through these co-created experiences, tourists are more likely to perceive destinations as competitive and attractive.
Innovation within SDL is a way of co-creating experiential value by delivering new, exciting, and meaningful tourism experiences. Tourists are active co-creators of value through innovative service delivery and destination experiences that improve perceptions of destination competitiveness.
Innovations can span diverse aspects—from digital enhancements and sustainable practices to creative events and unique local offerings. In rapidly evolving tourism markets, the ability to innovate becomes essential for sustaining competitive advantage and responding to shifting traveler expectations.
Research in different regions confirms that innovation significantly moderates and drives destination competitiveness. Vietnam’s Central Highlands, innovation is found to be a crucial intermediary factor linking cultural and natural resources to destination competitiveness (Ngo & Creutz, 2022). Similarly, consumer-centric models reveal that product and input innovations not only enhance tourist experiences but also increase revisit intentions and perceived competence of a destination (Cevdet Altunel et al., 2015). Destinations that invest in innovative solutions are better equipped to create memorable tourism experiences, which are vital for long-term competitiveness.
Destination innovativeness leads to competitive advantage through entrepreneurship learning, knowledge quality, and effective marketing strategies (Wardhani & Widodo, 2020). Innovative destinations can also leverage unique experiences and local specialties to cultivate loyalty and repeat visitation (Jiang, 2020; Savva et al., 2004; Wang et al., 2020). Thus, perceptions of innovation not only enrich the destination’s image but also serve as a strategic asset in a highly competitive global tourism landscape (Ben Youssef et al., 2019).
H2. 
Innovation perceptions have a positive effect on destination competitiveness.

2.3. Destination Competitiveness Positively Influences Tourists’ Sharing Intentions

SDL suggests that value co-creation outcomes affect subsequent behavioral responses. This study conceptualizes destination competitiveness as a co-created value outcome at the system level that enhances tourists’ emotional engagement and promotes sharing intentions via digital advocacy and electronic word-of-mouth.
Destination competitiveness refers to a destination’s ability to attract and satisfy tourists through unique offerings, high-quality services, and distinctive experiences. Research has consistently shown that when tourists perceive a destination as competitive—meaning it stands out in terms of appeal, value, and quality—they are more likely to share their positive experiences through recommendations and electronic word-of-mouth (eWOM) (Pramono et al., 2021). Positive sharing intentions are important for a destination’s reputation and future visitation, as satisfied tourists often become ambassadors, influencing others’ travel decisions (Regmi et al., 2023).
Empirical evidence supports the notion that core competitiveness attributes—such as strong destination management, unique attractions, and supporting infrastructure—increase tourists’ satisfaction and their intentions to revisit or recommend a destination (Lestari & Muttaqin, 2022). Studies in Egypt and other competitive tourism markets confirm that overall tourist satisfaction, derived from these competitive attributes, is a significant predictor of both intention to recommend and re-purchase intention (Jolly et al., 2019). Furthermore, recent research highlights how destination competitiveness factors such as climate advocacy, service quality, and unique experiences can increase destination loyalty, which, in turn, fosters tourists’ sharing intentions (Zaman, 2024).
Other studies show that competitiveness is not only about hard infrastructure but also soft factors such as destination appeal and knowledge sharing among stakeholders. For example, (Chin et al., 2022) found that competitiveness leads to positive outcomes for rural tourism, including increased sustainability and word-of-mouth recommendations (Chin et al., 2022). Therefore, when tourists perceive a destination as highly competitive, their likelihood to share their experiences with others—online or offline—is substantially increased (Priatmoko et al., 2021).
H3. 
Destination competitiveness positively influences tourists’ sharing intentions.

2.4. Digitalization Perceptions Have a Positive Effect on Tourists’ Sharing Intentions

Digitalization and innovation, as operant resources within SDL, can directly stimulate tourists’ behavioral responses by enhancing perceived value, experiential engagement, and interaction quality.
The digitalization of tourism experiences, including the widespread use of mobile apps, social media integration, and online booking platforms, has transformed the way tourists interact with destinations and share their experiences. Digital tools facilitate immediate communication, simplify sharing processes, and enable tourists to broadcast their journeys in real-time (Liu & Id, 2024). The perceived ease and usefulness of digital technologies have been found to significantly encourage tourists to engage in eWOM, such as posting reviews, photos, and recommendations online (Sarker et al., 2019).
Research grounded in the Technology Acceptance Model shows that the quality, usefulness, and satisfaction with digital marketing tools and platforms are significant predictors of tourists’ intentions to share their experiences (Juliana et al., 2024). Furthermore, studies in both ecotourism and urban tourism contexts demonstrate that tourists who find digital experiences valuable and enjoyable are more likely to adopt and advocate for new technologies, sharing their experiences both during and after their visits (Line & Hanks, 2020; Song et al., 2019).
Additional literature highlights the roles of digital literacy and technophilia (a positive attitude toward technology) in shaping tourists’ sharing intentions, especially in digitally advanced destinations (Domurath et al., 2020). As tourists become increasingly comfortable with digital platforms, their propensity to share content about their travel experiences rises, amplifying the destination’s online presence and reputation. Thus, digitalization not only enhances the tourist experience but also increases tourists’ willingness to share and recommend destinations (Kozak et al., 2004).
H4. 
Digitalization perceptions positively influence tourists’ sharing intentions.

2.5. Innovation Perceptions Have a Positive Effect on Tourists’ Sharing Intentions

Innovative tourism experiences—such as augmented reality tours, smart accommodations, or novel attractions—create memorable and emotionally engaging encounters for travelers. Research shows that when tourists perceive a destination as innovative, they are more likely to share their unique and novel experiences with others, motivated by a sense of excitement and discovery (Xue et al., 2022). This sharing occurs through both direct recommendations and social media channels, thereby amplifying the destination’s visibility and appeal (Gračan & Lučić, 2022).
The relationship between innovation perceptions and sharing intentions is well-documented in the context of technology adoption and service innovation. Studies indicate that higher personal innovativeness reduces barriers and increases willingness to engage in sharing-based services, such as sharing accommodations and user-generated content (H. Nguyen et al., 2021). In addition, perceived innovativeness during the travel planning and experience phases positively correlates with tourists’ expectations and their intent to share or recommend the experience to others (Veréb & Azevedo, 2019).
Empirical findings confirm that innovation in tourism not only fosters revisit intentions but also motivates tourists to generate eWOM and advocate for the destination (M. N. Nguyen et al., 2025). Furthermore, consumer studies highlight the value of innovation across the tourism value chain, noting its strong influence on tourists’ purchase decisions and willingness to recommend (Goeltom et al., 2020). Therefore, perceptions of innovation serve as a catalyst for tourists’ sharing intentions, benefiting both destinations and stakeholders (Juliana et al., 2025b).
H5. 
Innovation perceptions have a positive effect on tourists’ sharing intentions.

2.6. Destination Competitiveness Mediates the Relationship Between Digitalization Perceptions and Tourists’ Sharing Intentions

From the SDL perspective, destination competitiveness acts as a transmission mechanism that converts operant resources into behavioral outcomes. This mediating role reflects how digitalization and innovation contribute to tourists’ sharing intentions by creating and integrating competitive experiential value.
The mediating effect of destination competitiveness suggests that the influence of digitalization perceptions on tourists’ sharing intentions is not entirely direct but operates, in part, through enhanced competitiveness. When digital technologies improve service delivery, personalization, and information accessibility, tourists are likely to perceive the destination as more competitive. This perception, in turn, increases their willingness to share their positive experiences with others (Ha Le & Ngoc, 2024).
Recent research demonstrates that digitalization enhances destinations’ perceived image and competitiveness, significantly contributing to increased tourist loyalty, satisfaction, and sharing intentions (Khoshroo & Soltani, 2025) When tourists experience seamless digital services, their perceptions of the destination’s overall quality and competitiveness are strengthened, making them more likely to recommend and promote the destination through eWOM (Juliana et al., 2025a).
Conceptual and empirical frameworks underscore the role of destination competitiveness as a bridge between technological advancement and tourist behaviors (Racela et al., 2019). Additional studies show that only when digitalization translates into competitive advantages, such as better experiences, more efficient services, and stronger branding, do tourists’ sharing intentions markedly increase (Sigala, 2023). Therefore, destination competitiveness acts as a vital mediator, amplifying the effect of digitalization perceptions on tourists’ willingness to share their travel stories.
H6. 
Destination competitiveness mediates the relationship between digitalization perceptions and tourists’ sharing intentions.

2.7. Destination Competitiveness Mediates the Relationship Between Innovation Perceptions and Sharing Intentions

The mediating role of destination competitiveness is theoretically grounded in SDL, which suggests that operant resources influence behavioral outcomes through value co-creation processes. In this study, digitalization and innovation contribute to tourists’ evaluations of destination competitiveness, which, in turn, shapes their willingness to share tourism experiences through digital platforms and electronic word-of-mouth behavior.
The positive impact of innovation perceptions on tourists’ sharing intentions is often amplified when such innovations are perceived as directly enhancing destination competitiveness. Tourists are more inclined to recommend and share their experiences when they perceive that innovative offerings distinguish a destination, making it superior to alternatives (Seyfi et al., 2020). The mediating role of competitiveness ensures that innovations are not only noticed but also valued for their contribution to the overall destination experience.
Empirical studies show that innovative destinations foster loyalty, repeat visits, and active sharing behavior—particularly when tourists attribute their positive experiences to the destination’s competitive advantages (Fayzullaev, 2021; Su, 2020) When innovation leads to improved services, distinctive attractions, or enhanced experiences, these factors increase perceived competitiveness, which in turn drives tourists to engage in eWOM.
Theoretical and practical models in tourism research suggest that the pathway from innovation perceptions to sharing intentions is strengthened when innovation is translated into tangible, competitive benefits (Wardhani & Widodo, 2020). As such, competitiveness serves as a critical mediator in this relationship, ensuring that innovation is effectively leveraged to promote positive sharing behaviors among tourists (Suryaningsih, 2020).
H7. 
Destination competitiveness mediates the relationship between innovation perceptions and sharing intentions.
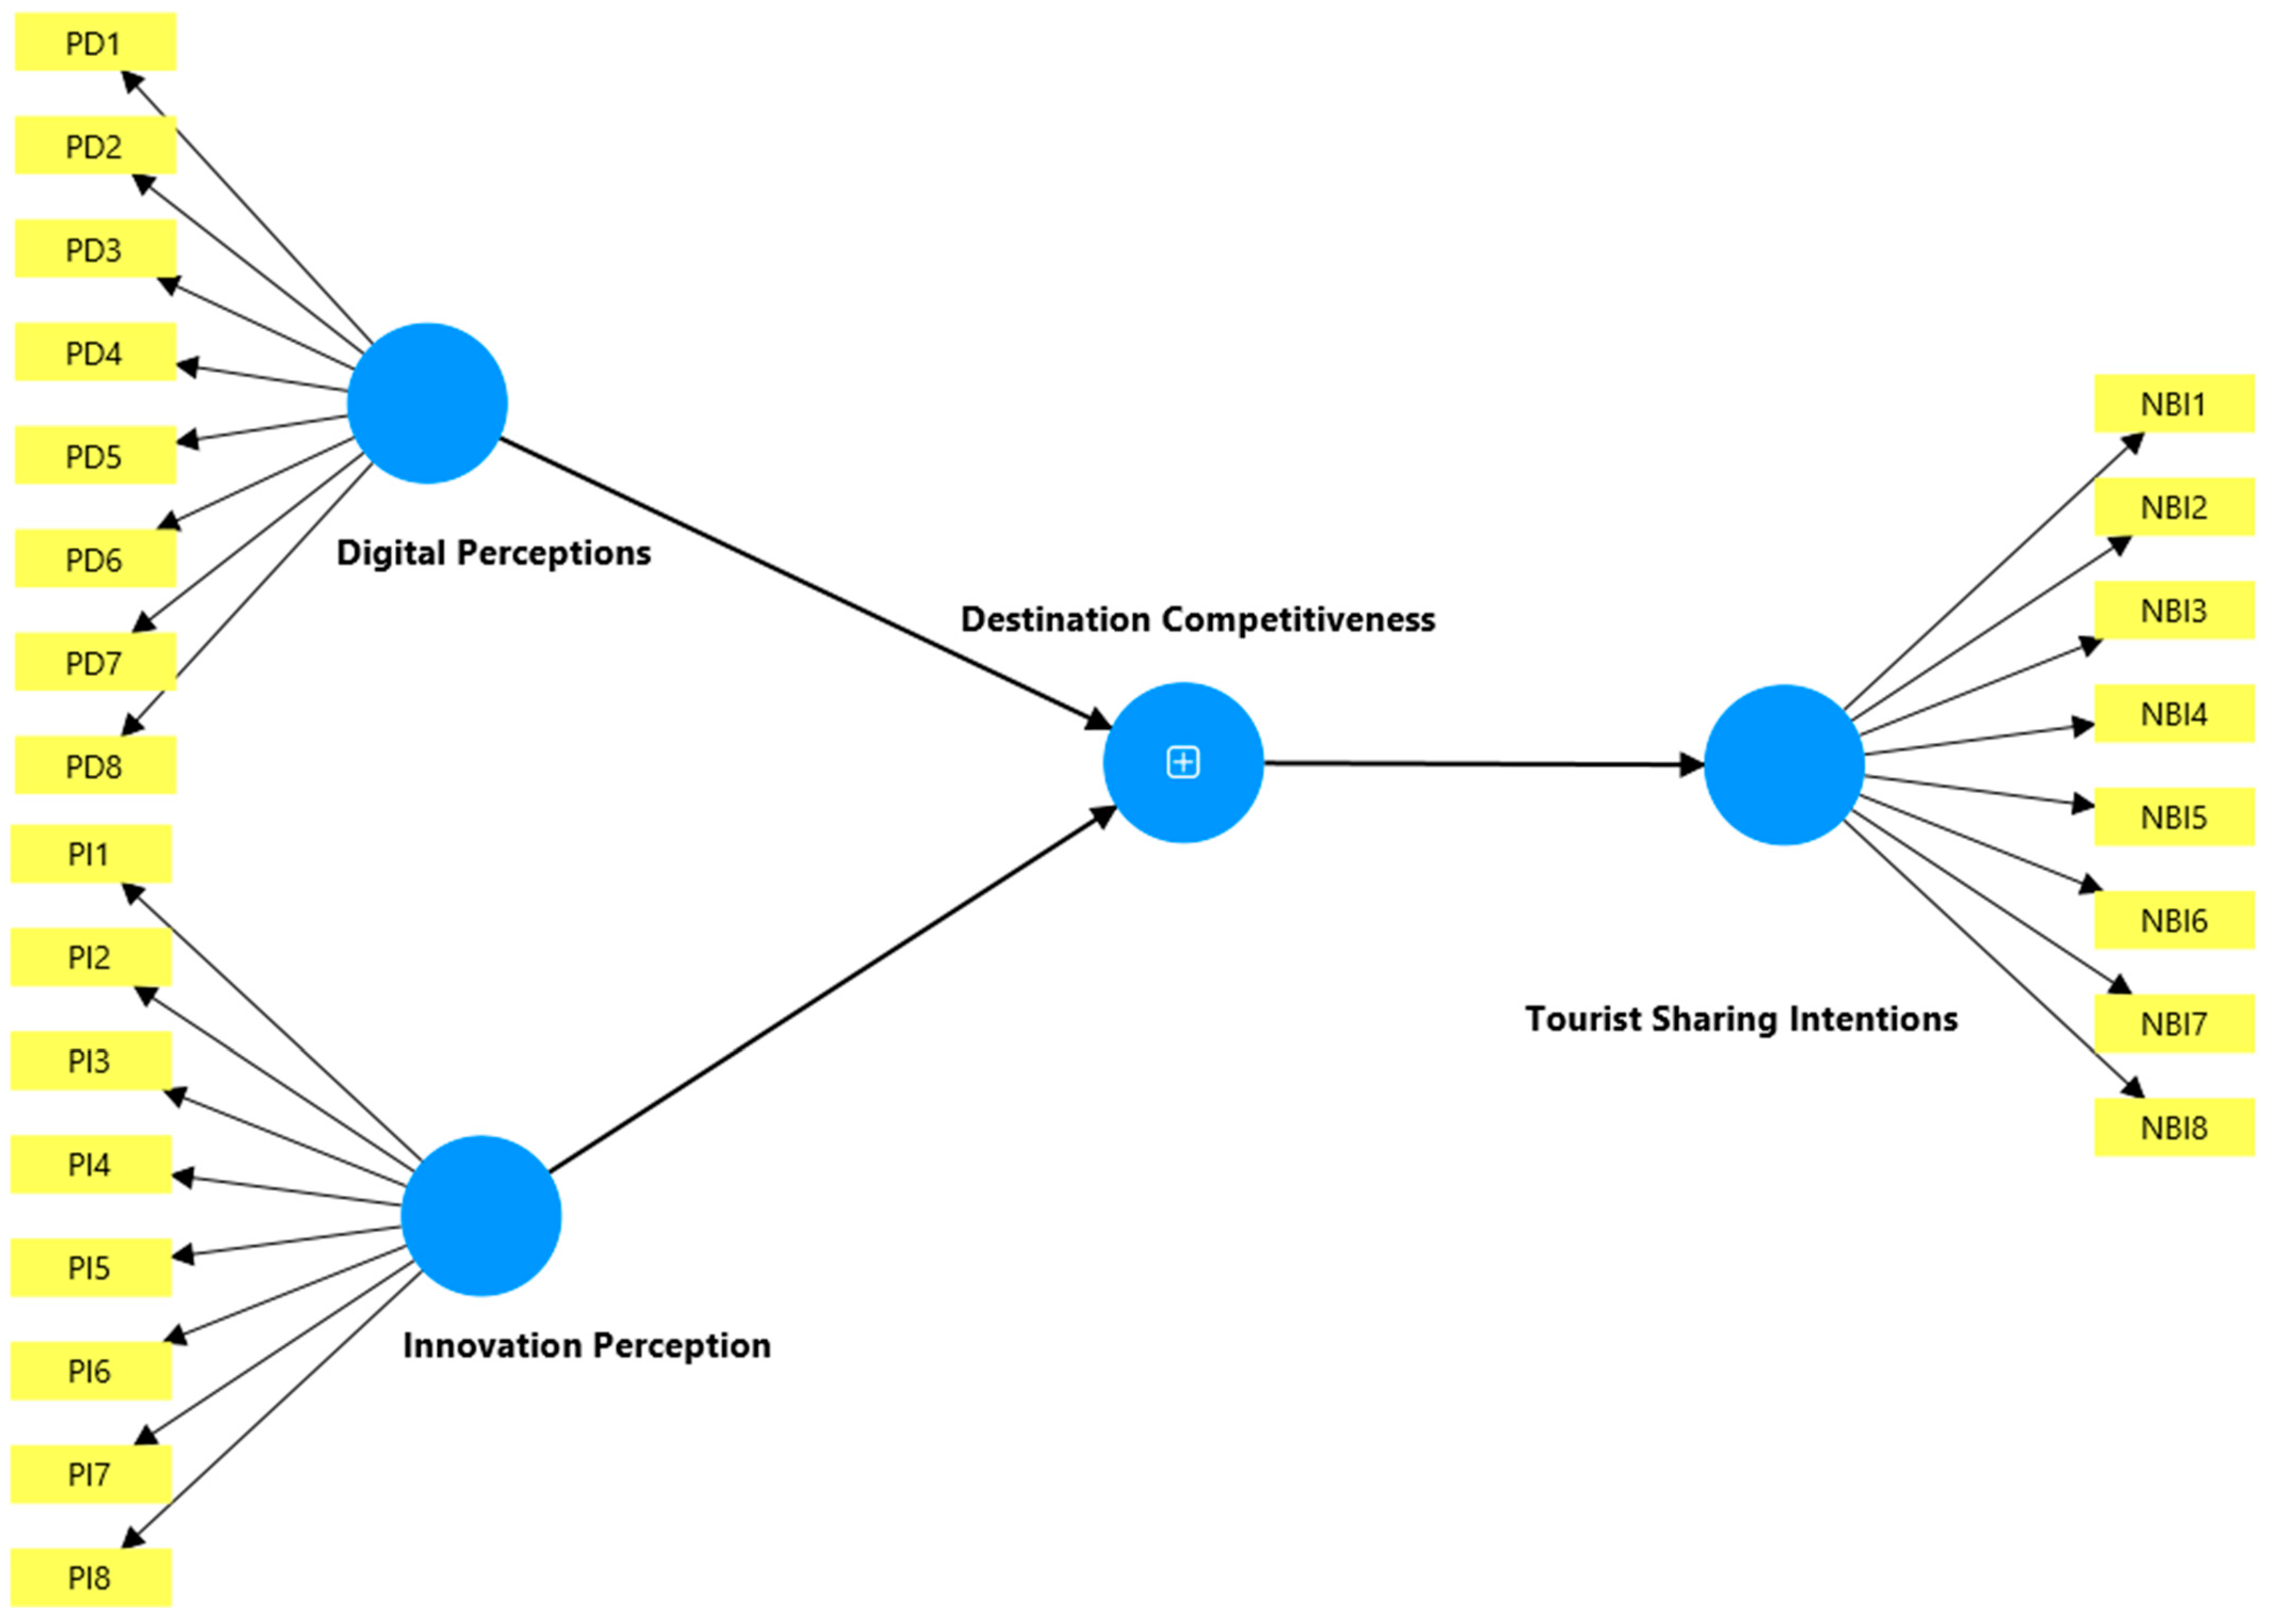
Figure 1 illustrates the proposed research model that examines how Digital Perceptions and Innovation Perceptions influence Tourist Sharing Intentions through the mediating role of Destination Competitiveness.

3. Methodology

3.1. Research Design

This study was designed to answer three primary research questions: (1) How do digitalization perceptions and innovation perceptions influence destination competitiveness? (2) How does destination competitiveness influence tourists’ sharing intentions? and (3) Does destination competitiveness mediate the relationships between digitalization perceptions, innovation perceptions, and tourists’ sharing intentions? To address these questions, seven hypotheses were developed based on Service-Dominant Logic and tested using Partial Least Squares Structural Equation Modeling (PLS-SEM). The present study used a quantitative cross-sectional research design to examine the relationships between digital perceptions, innovation perception, destination competitiveness, and tourist sharing intentions in digitally enabled tourism destinations. The quantitative approach was appropriate for the study because the proposed theoretical relationships and mediation effects were to be empirically tested using structured statistical analyses. The research model was based on Service-Dominant Logic (SDL), which considers digitalization and innovation as operant resources influencing tourists’ behavioral outcomes through value co-creation processes.
The study used a survey design, with a structured questionnaire to elicit uniform responses from respondents. This design enabled systematic measurement of latent constructs and the use of Partial Least Squares Structural Equation Modeling (PLS-SEM) for hypothesis testing. The cross-sectional design was chosen because it allows for the study of tourists’ perceptions and behavioral intentions in digitally supported tourism environments at a specific point in time. The quantitative approach is chosen to provide empirical evidence on the hypothesized pathways, test the mediation effects, and ensure the generalizability of the findings to the broader population of young domestic tourists (Kline, 2016).

3.2. Sampling and Data Collection

The population of this study was Indonesian domestic tourists from Generation Z who had visited a digitally enabled tourism destination in the last 12 months. Generation Z was selected because this group of digitally native travelers is highly familiar with social media, mobile technologies, and technology-supported tourism experiences. Their high involvement in digital ecosystems makes them particularly relevant for studying the impact of digitalization and innovation perceptions on destination competitiveness and sharing behavior.
A purposive sampling method was used to ensure that the respondents met the specific inclusion criteria. The requirements for the participants were to (1) be from Generation Z, (2) have recent domestic tourism experience, and (3) actively use digital platforms or technologies during travel activities. The data collection was performed online via social media, tourism communities, and university networks to reach digitally active respondents effectively.
This targeted approach ensures that the data reflects the experiences and perceptions of digitally engaged young tourists, who are considered key drivers in the adoption and diffusion of tourism innovation (Etikan et al., 2016). Recruitment is primarily conducted online through social media platforms, university networks, and digital tourism communities popular with Generation Z. The use of purposive sampling was considered appropriate for the study of digitally engaged Generation Z tourists, but it can lead to selection bias among respondents who are more familiar with digital platforms and technology-supported tourism experiences. Hence, the results may not be extrapolated to wider tourist populations, such as older generations or less digitally active travelers. However, the focus on Generation Z is theoretically relevant because this cohort is digitally native tourists who are actively engaged in digital communication, online interaction, and technology-mediated tourism experiences. The choice of Generation Z tourists is justified both theoretically and practically as this cohort is the most digitized group of modern travelers. Their heavy use of mobile technologies, digital platforms, social media and online tourism services makes them particularly suitable for evaluating destination digitalization, innovation and sharing behavior. Generation Z therefore constitutes a relevant empirical setting to test the hypothesized relationships in a digitally enabled tourism destination.
A priori power analysis using G*Power (version 3.1) was conducted for multiple regression with four predictors (digitalization perceptions, innovation perceptions, destination competitiveness, and sharing intentions). Assuming a medium effect size (f2 = 0.15), α = 0.05, and power = 0.80, the minimum recommended sample size was 85. To enhance statistical robustness for SEM, a larger sample of 200–300 participants was targeted (Kline, 2016).
In the final analysis, 357 valid responses were collected and included. The sample size exceeded the minimum recommended for PLS-SEM analysis and met statistical power requirements. This study focused on digitally engaged tourist segments, and the use of a purposive sampling method was considered appropriate, although it may limit the generalizability of the findings.

3.3. Measurement Instruments

The research instrument was a structured questionnaire, developed from previously validated scales in the literature of tourism, digitalization, innovation, and behavioral intention. All measurement items were adapted to the context of digitally enabled tourism destinations. The questionnaire had five sections, including demographic information, measurement items for digital perceptions, innovation perceptions, destination competitiveness, and tourist sharing intentions.
All constructs were measured on a six-point Likert scale (1 “Strongly Disagree” to 6 “Strongly Agree”). The six-point scale was selected specifically to avoid central tendency bias and to encourage respondents to make more discriminating ratings of their perceptions and experiences. This eliminated the neutral midpoint and nudged respondents to express more definite directional attitudes about digitalization, innovation, competitiveness, and sharing intentions in digitally enabled tourism contexts.
Digital perceptions were measured using indicators of tourists’ evaluations of digital accessibility, technological convenience, and information availability. Innovation perception was respondents’ perceptions of novelty, creativity, and the innovative tourism experience. Destination competitiveness reflected tourists’ evaluations of the destination’s attractiveness, quality, and competitive positioning, and tourist sharing intentions measured respondents’ willingness to share travel experiences via digital communication and electronic word-of-mouth platforms. Indicators for each construct, digitalization perceptions, innovation perceptions, destination competitiveness, and sharing intentions, are adapted from established sources in tourism and marketing literature (Buhalis, 2000; Hjalager, 2018; Kim et al., 2022; Shampy Kamboj, 2023). The questionnaire includes screening questions to confirm eligibility and sections to capture demographic and travel-related information.

3.4. Data Analysis

The data was analyzed using Partial Least Squares Structural Equation Modeling (PLS-SEM) analysis in SmartPLS 4. PLS-SEM was chosen because it is appropriate for prediction-oriented research, complex mediation models, and studies with latent constructs measured by multiple indicators. Moreover, PLS-SEM is suitable for exploratory theory building and testing and does not require strong assumptions of multivariate normality.
The analysis consisted of two parts: the evaluation of the measurement model and the evaluation of the structural model. The measurement model was evaluated for indicator reliability, internal consistency reliability, convergent validity, and discriminant validity through Cronbach’s alpha, composite reliability, average variance extracted (AVE), and the heterotrait–monotrait ratio (HTMT). The structural model assessment included path coefficients, coefficient of determination (R2), predictive relevance (Q2), effect size (f2), and mediation analysis (Hair & Alamer, 2022).
The significance of direct and indirect relationships was assessed using bootstrapping with 5000 resamples. The mediation effects were further assessed with Variance Accounted For (VAF) to determine the type of mediation effect. In addition, we tested for common method bias using Harman’s single-factor test and a full collinearity variance inflation factor (VIF) analysis to assess the robustness and validity of the results. To assess the potential presence of common method bias (CMB), two additional statistical procedures were conducted. First, Harman’s single-factor test was performed to evaluate whether a single factor accounted for the majority of the variance in the dataset. The results showed that the first factor explained less than 50% of the total variance, indicating that common method bias was unlikely to substantially influence the findings. Second, a full collinearity variance inflation factor (VIF) analysis was conducted in accordance with recommended PLS-SEM procedures. All VIF values were below the threshold of 3.3, further confirming the absence of severe common method bias within the structural model (Nitzl et al., 2016).

4. Findings

4.1. Demographic Analysis

This study analyzed data from 357 Generation Z domestic tourists who had visited digitally enabled tourism destinations within the past 12 months. The sample size is considered adequate for Partial Least Squares Structural Equation Modeling (PLS-SEM), ensuring sufficient statistical power for estimating relationships among digital perceptions, innovation perception, destination competitiveness, and tourist sharing intentions.
The respondents represent a digitally active segment of young travelers who are highly familiar with mobile applications, social media platforms, and technology-supported tourism services. As Generation Z tourists are typically intensive users of digital information sources and interactive tourism technologies, their participation provides an appropriate basis for evaluating perceptions related to destination digitalization and innovation-driven competitiveness.
Most respondents reported recent travel experiences in the last year, supporting the reliability of their evaluations of digitally enabled destination environments. Recent visitation ensures that responses reflect current perceptions of destination competitiveness rather than retrospective judgments. This strengthens the validity of the structural relationships examined in the research model.
Furthermore, Generation Z tourists play an important role in shaping destination image and competitiveness through their active engagement in online communication and experience-sharing behavior. Their familiarity with digital tourism ecosystems makes them particularly well-suited to examining the influence of digital perceptions and innovation perceptions on destination competitiveness and tourist sharing intentions. The demographic characteristics of respondents indicate that the sample is appropriate for investigating the proposed research model and provides a reliable empirical basis for analyzing technology-related tourism perceptions and behavioral intentions in digitally enabled destination contexts. The sample size also exceeds the minimum requirement suggested by the ten-times rule and recent statistical power recommendations for PLS-SEM analysis, confirming the adequacy of the dataset for structural model estimation.

4.2. Outer Model

Table 1 presents the results of the reliability and convergent validity assessment for all constructs included in the research model. The findings indicate that all measurement indicators satisfy the recommended thresholds for internal consistency reliability and convergent validity.
The values of Cronbach’s alpha for all constructs range from 0.916 to 0.933, exceeding the minimum recommended threshold of 0.70, which confirms strong internal consistency reliability among the indicators measuring each construct. Similarly, the values of composite reliability (rho_a) range from 0.920 to 0.941, and those of composite reliability (rho_c) range from 0.932 to 0.945, both of which exceed the recommended cutoff of 0.70, further demonstrating satisfactory construct reliability.
The results also confirm adequate convergent validity, as indicated by average variance extracted (AVE) values ranging from 0.630 to 0.682, all above the recommended threshold of 0.50. This indicates that each construct explains more than 50% of the variance of its indicators, confirming that the measurement items adequately represent their respective latent constructs.
Among the constructs, tourist sharing intentions show the highest reliability values (Cronbach’s alpha = 0.933; composite reliability = 0.945), indicating particularly strong internal consistency in measuring tourists’ intentions to share travel experiences. Meanwhile, innovation perception demonstrates the highest AVE value (0.678), suggesting that this construct has the strongest indicator convergence among all variables in the model.
The results in Table 1 show that all constructs have satisfactory internal consistency reliability and convergent validity. Cronbach’s alpha and composite reliability values are greater than the recommended threshold of 0.70 whereas AVE values are greater than 0.50. These findings confirm that the measurement model meets the established reliability and validity criteria and is suitable for subsequent structural model testing.
The structural model assessment comprises the analysis of the coefficient of determination (R2), adjusted R2, and predictive relevance (Q2 predict) to evaluate the explanatory and predictive capacity of the proposed model. The results are shown in Table 2. The results show that destination competitiveness had an R2 of 0.418 and an adjusted R2 of 0.415. This indicates that digital perceptions and innovation perception together explain about 41.8% of the variance in destination competitiveness. This level of explanatory power can be considered as moderate according to generally accepted guidelines in behavioral and tourism research. This indicates that the model has adequate capability to explain tourists’ evaluations of destination competitiveness. The relatively small difference between R2 and adjusted R2 also suggests that the model is robust and not over-inflated by the number of predictors.
Tourist sharing intentions obtained an R2 value of 0.322 and an adjusted R2 value of 0.320, which means that digital perceptions, innovation perception, and destination competitiveness explain approximately 32.2% of the variance in tourists’ sharing behavior. Although the explanatory power is moderate, these findings are considered acceptable in tourism behavioral research because tourists’ decision making and sharing behavior are influenced by many other psychological, experiential, and contextual factors not included in the current model.
The assessment of predictive relevance also indicates a satisfactory model performance. The Q2 predicted value for destination competitiveness is 0.408. Tourist sharing intentions had a Q2 predicted value of 0.418. All Q2 values are greater than zero. Therefore, the model possesses sufficient predictive relevance for both endogenous constructs. The findings indicate that the proposed model has significant predictive power and can effectively predict tourists’ perceptions of destination competitiveness and their sharing intentions in digitally enabled tourism contexts.
The R2 and Q2 results, in general, support the robustness and predictive validity of the proposed structural model. The results indicate that perceptions of digitalization and innovation significantly contribute to the co-creation of destination competitiveness, which, in turn, affects tourists’ willingness to share tourism experiences via digital platforms and electronic word-of-mouth behavior.
Table 3 presents the results of the heterotrait–monotrait ratio (HTMT) analysis used to assess discriminant validity among the constructs included in the research model. Discriminant validity ensures that each construct captures a distinct concept and is empirically different from other constructs in the model.
The HTMT values between destination competitiveness and digital perceptions (0.635), destination competitiveness and innovation perception (0.615), and destination competitiveness and tourist sharing intentions (0.594) are all below the recommended threshold of 0.85, indicating satisfactory discriminant validity between these constructs. Similarly, the HTMT values between digital perceptions and innovation perception (0.697), digital perceptions and tourist sharing intentions (0.739), and innovation perception and tourist sharing intentions (0.746) also remain below the conservative threshold of 0.85, confirming that these constructs are empirically distinct from one another.
These results demonstrate that the measurement model satisfies the recommended criteria for discriminant validity, suggesting that each construct represents a unique theoretical dimension within the structural model. Therefore, the constructs of digital perceptions, innovation perception, destination competitiveness, and tourist sharing intentions can be considered sufficiently independent and suitable for subsequent structural model analysis. The HTMT findings confirm that the measurement model meets the discriminant validity requirements recommended in PLS-SEM literature, supporting the robustness and credibility of the construct relationships examined in this study.
The model fit assessment was performed with a number of goodness-of-fit measures, including the standardized root mean residual (SRMR), d_ULS, d_G, Chi-square, and Normed Fit Index (NFI). The results for the saturated model and estimated model are shown in Table 4.
The SRMR value for the saturated model is 0.069, which is below the recommended threshold of 0.08 and indicates an acceptable fit. However, the SRMR value for the estimated model is 0.136, which exceeds the recommended threshold and indicates that there are still discrepancies between the observed and predicted covariance matrices in the estimated structural model. However, SRMR in PLS-SEM studies should be interpreted with caution, as prediction-oriented models and complex mediation structures tend to produce higher SRMR values than covariance-based SEM approaches.
The discrepancy measures, including d_ULS and d_G, are relatively higher in the estimated model relative to the saturated model. This indicates that the estimated model imposes additional structural constraints, increasing the distance between the empirical and model-implied correlation matrices. In particular, the d_ULS value increased from 2.504 in the saturated model to 9.764 in the estimated model, and the d_G value increased slightly from 1.845 to 1.972. The results indicate that the structural relationships in the model contribute to the complexity of the model estimation process.
The Chi-square value for the saturated model is 2891.839, and for the estimated model, it is 3047.370. These values indicate the overall difference between the observed covariance matrix and the estimated covariance matrix. However, Chi-square statistics in SEM are highly sensitive to sample size and model complexity, especially when latent constructs and large numbers of indicators are involved. Thus, the importance of Chi-square values should not be the sole basis for evaluating model adequacy in PLS-SEM.
The values for the Normed Fit Index (NFI) are 0.728 for the saturated model and 0.713 for the estimated model, showing moderate model fit. However, these values do not exceed the widely recommended cutoff value of 0.90. Recent PLS-SEM literature acknowledges that prediction-oriented models in behavioral research often exhibit moderate NFI values due to the exploratory and complex nature of constructs of human behavior.
The model provides an acceptable fit for prediction-oriented PLS-SEM analysis in general, particularly given the exploratory nature of the study, the mediation structure, and the complexity of digitally mediated tourism behavior. The findings support the adequacy of the structural model to examine the proposed relationships between digitalization, innovation perception, destination competitiveness, and tourists’ sharing intentions.

4.3. Inner Model

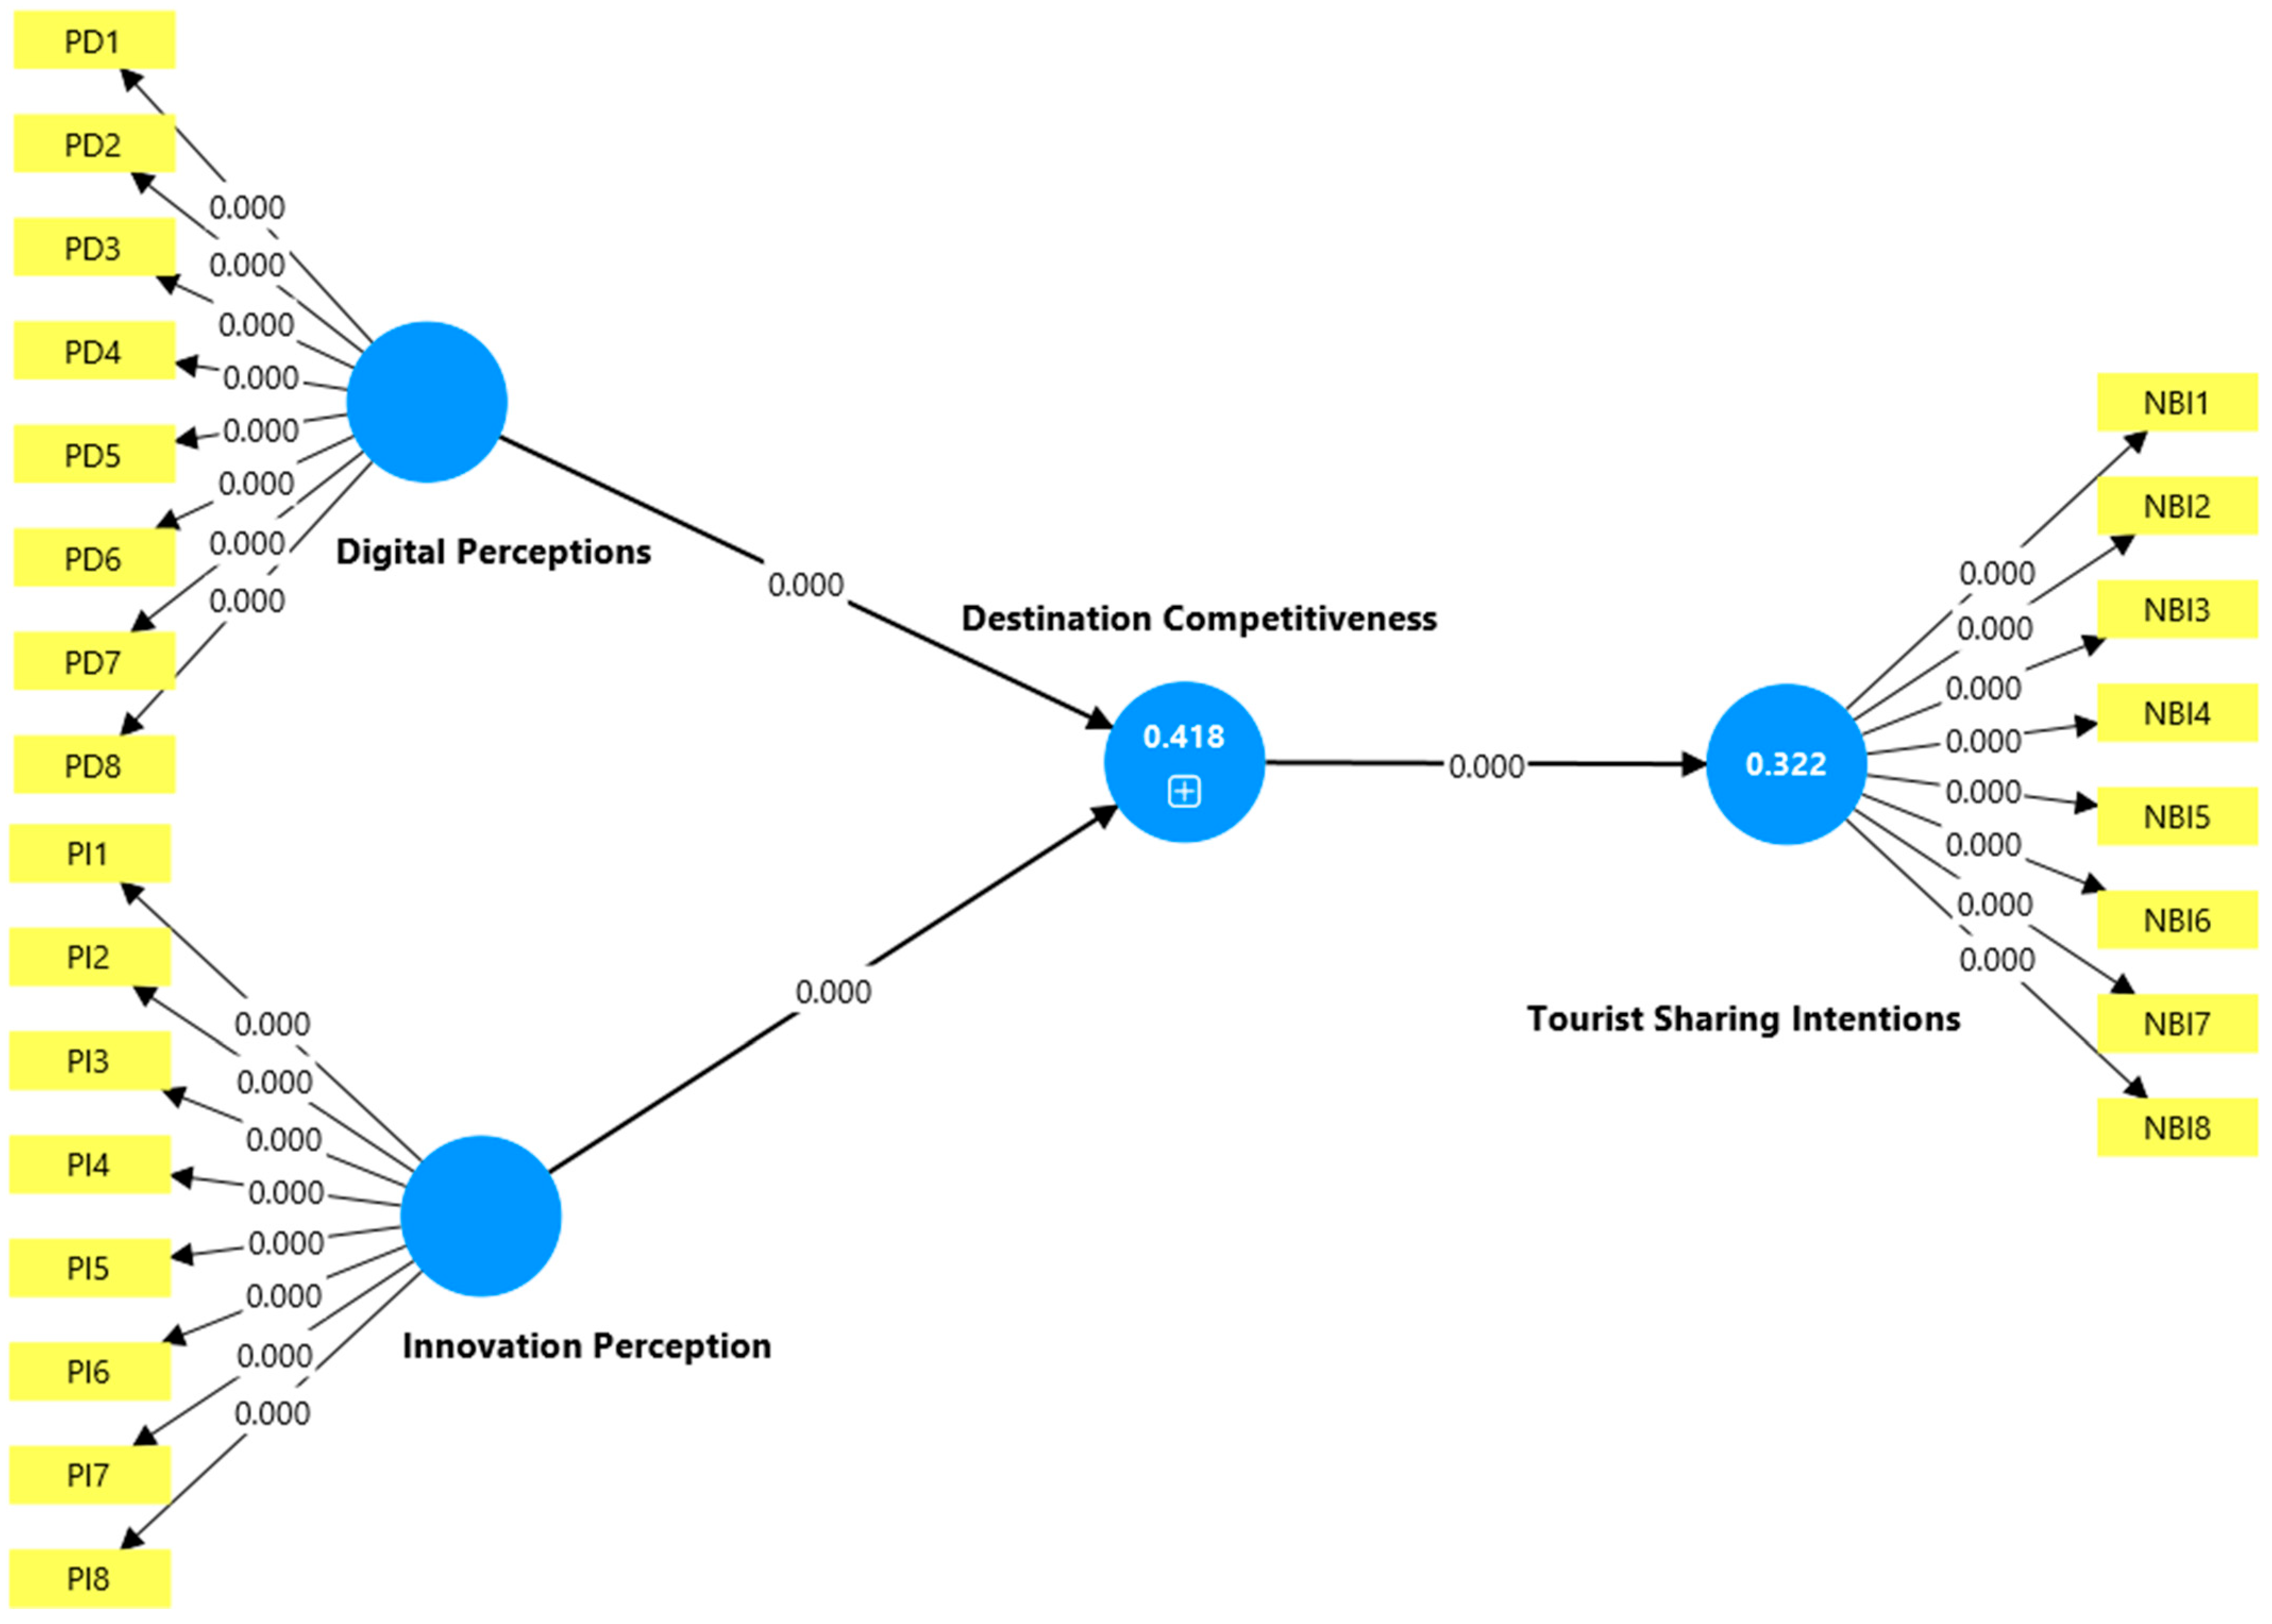
The structural model relationships were evaluated using the bootstrapping procedure in PLS-SEM to test the significance of the proposed hypotheses. Table 5 and Figure 2 present the path coefficients, t-statistics, and p-values for both direct and indirect effects among the constructs.
First, the results indicate that destination competitiveness has a significant positive effect on tourist sharing intentions (β = 0.567, t = 13.950, p < 0.001). This finding suggests that higher perceived destination competitiveness significantly increases tourists’ intentions to share their travel experiences on digital platforms. The strong coefficient also indicates that destination competitiveness is the most influential predictor of sharing behavior within the proposed model.
Second, digital perceptions significantly influence destination competitiveness (β = 0.384, t = 6.387, p < 0.001), indicating that tourists’ evaluations of digital infrastructure, information accessibility, and technology-supported services contribute positively to destination competitiveness. Similarly, innovation perception also has a significant positive effect on destination competitiveness (β = 0.327, t = 5.574, p < 0.001), confirming that perceptions of innovative tourism services enhance destination competitiveness in digitally enabled tourism environments.
Furthermore, the results show that digital perceptions directly influence tourist sharing intentions (β = 0.218, t = 5.425, p < 0.001), suggesting that positive digital experiences encourage tourists to actively share their travel experiences online. Likewise, innovation perception has a significant positive effect on tourist sharing intentions (β = 0.186, t = 4.855, p < 0.001), indicating that innovative destination features also contribute to increasing sharing behavior among tourists.
The results support all proposed hypotheses and confirm that digital perceptions and innovation perception enhance tourist sharing intentions both directly and indirectly through destination competitiveness, highlighting the important mediating role of competitiveness in digitally enabled tourism destinations.
As for the mediation analysis, the indirect effect of digitalization perceptions on tourist sharing intentions through destination competitiveness is positive and statistically significant (β = 0.218, t = 5.425, p < 0.001). In the same vein, innovation perception exerts an indirect effect on tourist sharing intentions through destination competitiveness (β = 0.186, t = 4.855, p < 0.001). These results confirm that destination competitiveness partially mediates the relationships between digitalization, innovation, and tourists’ sharing behavior.
The mediation results also suggest that digitalization and innovation directly and indirectly contribute to tourists’ sharing intentions by co-creating destination competitiveness. This result is consistent with SDL and supports the proposition that destination competitiveness functions as a behavioral transmission process, converting operant resources into value-in-use outcomes communicated through tourists’ digital advocacy behavior. These results confirm that destination competitiveness partially mediates the relationships between digital perceptions, innovation perception, and tourist sharing intentions. Moreover, the Variance Accounted For (VAF) values indicate complementary partial mediation, meaning that the direct and indirect effects operate simultaneously. This suggests that digitalization and innovation have both direct and indirect impacts on tourists’ sharing intention through improved destination competitiveness. In general, all proposed hypotheses are supported, implying that digitalization, innovation perception, and destination competitiveness are important factors in determining tourists’ sharing intention in digitally enabled tourism ecosystems.
The effect size (f2) and variance inflation factor (VIF) results for the structural model relationships are presented in Table 6. These analyses were conducted to determine the relative contribution of each exogenous construct to the endogenous variables and to assess multicollinearity in the model.
The results show that the relationship between destination competitiveness and tourist sharing intentions has an f2 value of 0.474, which is considered a large effect size according to commonly accepted PLS-SEM guidelines. The finding suggests that destination competitiveness accounts for a significant portion of the variance in tourists’ sharing behavior and is a robust predictor in the structural model. The finding further supports the theoretical argument that destination competitiveness is an important value co-creation outcome that influences tourists’ behavioral advocacy and electronic word-of-mouth intentions.
The relationship between digital perceptions and destination competitiveness had an f2 value of 0.146, indicating a moderate effect size. This indicates that digital capacities are important in tourists’ evaluations of destination competitiveness via enhanced interaction with services, access to information, and digitally enabled tourism experiences. Similarly, the innovation perception had an f2 value of 0.106 for destination competitiveness, which can be considered a moderate effect. The finding implies that innovation contributes to competitiveness through experiential differentiation, novelty, and tourism value creation.
The collinearity assessment further shows that all VIF values are well below the recommended threshold of 3.3. The VIF values vary from 1.000 to 1.737. The results indicate that there is no serious multicollinearity among the predictor constructs, suggesting that the independent variables are conceptually distinct and do not cause multicollinearity in the structural model. Low VIF values also provide further support for the robustness and validity of the estimated relationships.
The results of f2 and VIF indicate that the proposed model provides a satisfactory explanatory contribution and statistical stability overall. Findings also add further evidence regarding the role of digitalization and innovation as important operant resources that contribute to destination competitiveness and tourists’ sharing intentions in digitally enabled tourism ecosystems.
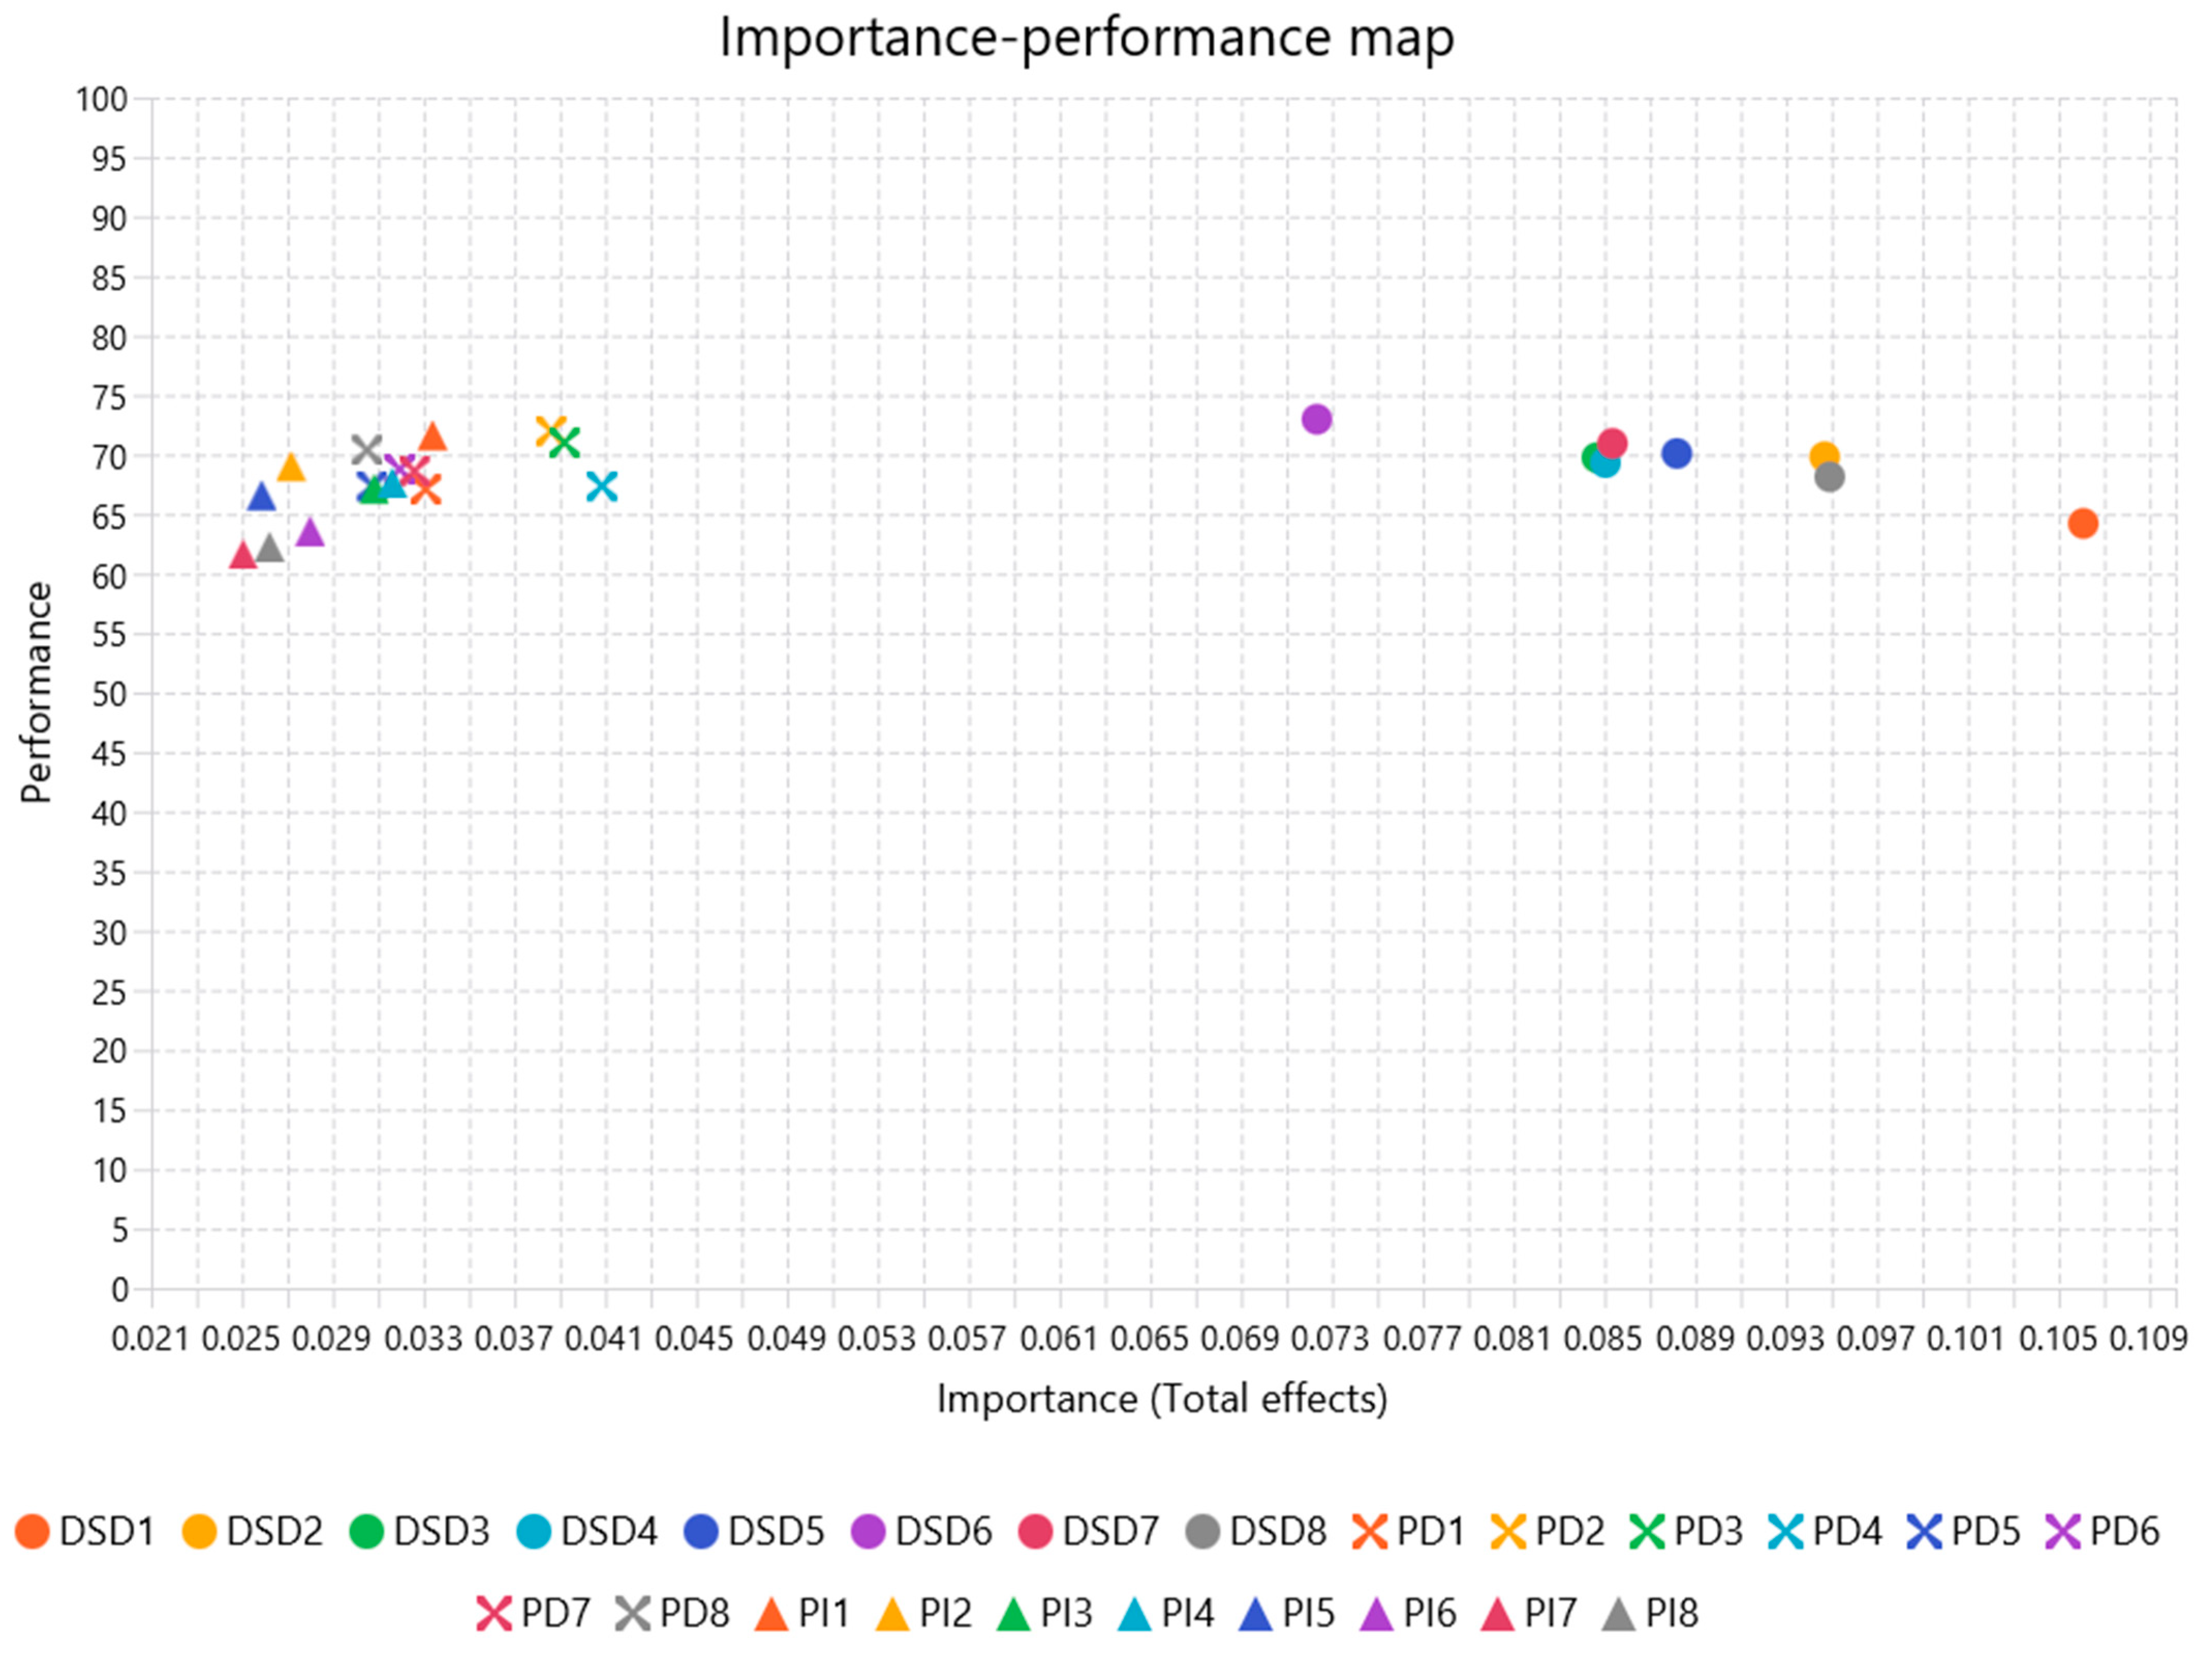
An Importance–Performance Map Analysis (IPMA) (Figure 3) was conducted to extend the interpretation of the structural model results by identifying which indicators contribute most strongly to tourist sharing intentions and evaluating their relative performance levels. IPMA enables a deeper understanding of priority areas for managerial improvement by comparing each indicator’s importance (total effects) and performance (index values scaled from 0 to 100). The Importance–Performance Map Analysis (IPMA) provides additional insight into the relative strategic importance and performance of the constructs influencing tourists’ sharing intentions. Unlike conventional path analysis, IPMA not only evaluates the strength of relationships but also identifies managerial priority areas by comparing construct importance with performance levels. Constructs demonstrating high importance but lower performance indicate areas where destination managers should allocate greater strategic attention and resource investment to improve tourism outcomes.
The results show that several indicators associated with destination competitiveness demonstrate the highest importance values in predicting tourist sharing intentions. In particular, indicators such as DSD1, DSD5, and DSD7 are among the strongest contributors, suggesting that competitiveness-related attributes play a central role in encouraging tourists to share their experiences on digital platforms. Although these indicators already show relatively strong performance levels (approximately 68–72), their high importance suggests that further improvement in these areas could significantly enhance tourists’ sharing behavior.
Similarly, indicators from digital perceptions, including PD1, PD2, and PD3, also demonstrate substantial importance with moderate-to-high performance scores. This indicates that tourists’ perceptions of digital accessibility, information availability, and technological convenience are critical drivers supporting destination competitiveness and subsequent sharing intentions. Strengthening these digital components could therefore further amplify destination visibility through user-generated content.
Indicators associated with innovation perception, particularly PI2, PI4, and PI5, also exhibit meaningful importance values with performance scores generally above 65. These findings suggest that innovative tourism services and technology-enabled experiences contribute positively to tourists’ engagement and willingness to share their travel experiences online. Enhancing innovation-based service elements may therefore strengthen the destination’s competitive positioning in digitally enabled tourism environments.
However, several indicators with moderate importance but relatively low performance, such as PI7 and PI8, represent priority areas for managerial improvement. These indicators should receive particular attention from destination managers because improvements in these areas are likely to lead to measurable increases in tourist sharing intentions.
IPMA results confirm that destination competitiveness indicators represent the most influential priority drivers, followed by digital perceptions and innovation perception indicators, in shaping tourists’ intentions to share their travel experiences. These findings provide practical guidance for destination managers to prioritize investments in digital infrastructure, service innovation, and competitiveness-enhancing attributes to strengthen tourists’ engagement and advocacy behavior in digitally supported tourism destinations.

5. Discussion

This study examined how digital perceptions and innovation perception influence tourist sharing intentions, both directly and indirectly through destination competitiveness, among Generation Z domestic tourists visiting digitally enabled destinations. The findings provide empirical support for the proposed structural model and extend the current tourism competitiveness literature by positioning destination competitiveness as a behavioral transmission mechanism that links digital transformation to tourists’ online advocacy behavior.
This study enriches the development of Service-Dominant Logic by providing empirical evidence of how digitalization and innovation serve as operant resources that trigger value co-creation processes in tourism destinations. The results suggest that destination competitiveness is not only an outcome variable but an expression of efficient resource integration by actors in the tourism ecosystem. Moreover, tourists’ sharing intentions are a value-in-use outcome where co-created experiences are externalized through digital communication and user-generated content. This study extends SDL into the realm of digital tourism and destination competitiveness by integrating operational resources, resource integration, and behavioral outcomes within a unified model.
The results indicate that destination competitiveness has the strongest direct effect on tourist sharing intentions. This finding confirms that tourists are more likely to share their travel experiences when they perceive destinations as attractive, accessible, innovative, and digitally responsive. In digitally connected tourism environments, competitiveness is no longer determined solely by physical infrastructure or natural attractions but increasingly by technology-supported experiences and service efficiency. These findings are consistent with recent tourism competitiveness frameworks emphasizing the role of experiential quality, digital accessibility, and service responsiveness in shaping tourist behavioral engagement and destination promotion behavior (Zhang et al., 2018; Gretzel et al., 2020). Importantly, this result aligns with previous studies demonstrating that destination competitiveness strengthens tourists’ emotional attachment and advocacy behavior through experiential interaction and perceived service value (Kanje et al., 2019).
The findings further show that perceptions of digital infrastructure significantly influence destination competitiveness, confirming that tourists view it as an essential component of destination attractiveness. Generation Z tourists, as digital-native travelers, evaluate destinations through their interaction with mobile applications, online information systems, navigation platforms, and social media-based communication channels. These digital touchpoints shape their perceptions of convenience, transparency, and accessibility, ultimately strengthening perceived destination competitiveness. This result supports earlier research indicating that smart tourism technologies enhance tourists’ experience quality and satisfaction by facilitating access to information and interactive engagement (Gretzel et al., 2020). Similarly, previous studies demonstrate that digital interaction quality and experiential communication significantly influence tourists’ engagement and electronic word-of-mouth behavior in rural tourism environments (Juliana et al., 2022).
The analysis also reveals that innovation perception significantly contributes to destination competitiveness, suggesting that tourists interpret service innovation as an indicator of destination readiness and adaptability. Innovative tourism services, including digital storytelling platforms, interactive experiences, and technology-enabled service delivery, enhance tourists’ evaluation of destination uniqueness and attractiveness. This finding reinforces previous tourism innovation literature, suggesting that destinations capable of integrating service innovation into visitor experiences achieve stronger competitive positioning and higher visitor engagement levels (Monterrubio et al., 2020). Consistent with this perspective, earlier research has shown that experiential innovation enhances memorable tourism experiences and strengthens tourists’ emotional responses toward destinations, which subsequently influences behavioral intention and destination advocacy (Silitonga et al., 2025).
In addition to indirect relationships, this study confirms that digital perceptions directly influence tourist sharing intentions, indicating that positive digital interaction experiences encourage tourists to communicate their travel experiences through online platforms. This result suggests that digital convenience and accessibility not only enhance destination competitiveness but also directly stimulate user-generated promotional behavior. Such findings are consistent with research emphasizing the importance of digital communication quality in shaping tourists’ willingness to share experiences through social media environments (Leung et al., 2021). Moreover, previous research demonstrates that digital interaction quality strengthens positive electronic word-of-mouth (PEWOM) by increasing tourists’ experiential satisfaction and emotional engagement during destination visits (Souki et al., 2022).
Innovation perception directly influences tourist sharing intentions, indicating that innovative tourism experiences stimulate visitors’ motivation to communicate and promote destinations. Innovative service features create novelty value, enhancing tourists’ experiential memorability and increasing their willingness to share travel experiences digitally. This finding supports experiential tourism theory, suggesting that novelty-driven experiences increase tourists’ psychological engagement and destination advocacy behavior (Im et al., 2012). Prior studies also confirm that experiential novelty and esthetic value significantly contribute to memorable tourism experiences and enhance tourists’ intention to recommend destinations through digital platforms (J. W. C. Wong et al., 2020).
Most importantly, the mediation analysis demonstrates that destination competitiveness plays a complementary mediating role between digital perceptions, innovation perception, and tourist sharing intentions. This finding suggests that digital and innovation-related destination attributes strengthen sharing behavior, both directly and indirectly, through improved perceptions of competitiveness. In other words, tourists’ digital experience not only influences sharing behavior independently but also strengthens destination positioning as a competitive tourism environment that encourages advocacy behavior. This result extends previous tourism competitiveness models by integrating digital perception as a psychological antecedent of competitiveness-driven behavioral outcomes and showing that experiential satisfaction and servicescape interaction operate as mediating mechanisms linking tourism environment quality with behavioral intention and destination promotion behavior (Naumov & Dutta, 2020).
From a generational perspective, the findings highlight the importance of understanding Generation Z tourists as digitally embedded communicators of experiences. Unlike previous tourist cohorts, Generation Z travelers actively participate in destination promotion through social media interactions, storytelling, and experience sharing. Their travel decisions and communication patterns are strongly influenced by perceived digital convenience and service innovation. Previous studies suggest that Generation Z tourists tend to evaluate tourism destinations based on interactive experiences rather than passive service consumption (Silitonga et al., 2025). This reinforces earlier research emphasizing that co-created tourism experiences and experiential engagement significantly strengthen tourist delight and electronic word-of-mouth behavior in digitally connected tourism environments (Souki et al., 2022).
This study contributes to the tourism competitiveness literature by demonstrating that digital perceptions and innovation perceptions function as strategic experiential drivers of destination competitiveness, thereby strengthening tourists’ sharing intentions. The findings extend previous experiential tourism and smart tourism frameworks by empirically confirming that competitiveness functions as a behavioral transmission mechanism, linking digital transformation to advocacy behavior among Generation Z tourists. These results also reinforce earlier empirical work highlighting the importance of experiential interaction, servicescape satisfaction, and co-creation processes in shaping tourists’ emotional engagement and destination promotion behavior across rural and digitally enabled tourism contexts (Zeng et al., 2022).
The findings provide an empirical contribution to Service-Dominant Logic by showing that digitalization and innovation can be viewed as operant resources activating value co-creation processes in tourism destinations. The results indicate that destination competitiveness is a system-level co-created value outcome from the effective integration of resources among tourists, technologies, and destination stakeholders. Moreover, tourists’ sharing intentions can be seen as expressions of value-in-use, in which co-created experiences are externalized through digital communication and user-generated content. This view adds to the tourism competitiveness literature by providing a coherent theoretical framework to link resource integration processes and destination advocacy behavior.
Unlike prior tourism competitiveness studies that primarily treat competitiveness as a static outcome variable, this study conceptualizes competitiveness as a dynamic co-created value mechanism that transforms digital and innovative resources into tourists’ behavioral advocacy outcomes. By integrating operant resources, resource integration, and value-in-use outcomes within a unified framework, this study advances SDL applications in tourism competitiveness and digitally mediated tourist behavior research.
The findings add further support to the basic proposition of Service-Dominant Logic that value is co-created through interactions among multiple actors and resources. In the study, digitalization and innovation are operant resources to enable value creation, while the destination competitiveness is the outcome of value co-created and perceived by tourists. The significant impact of destination competitiveness on sharing intentions indicates that the value co-created translates into behavioral outcomes that can further enhance destination visibility and competitiveness through the voluntary advocacy behavior of tourists.

6. Conclusions

This study examined the relationships between digital perceptions, innovation perception, destination competitiveness, and tourist sharing intentions among Generation Z domestic tourists visiting digitally enabled tourism destinations. The findings confirm that destination competitiveness plays a central role in shaping tourists’ willingness to share travel experiences through digital platforms. Among the examined relationships, destination competitiveness had the strongest influence on tourist sharing intentions, highlighting its importance as a strategic driver of destination advocacy behavior.
The results further show that digital perceptions and innovation perception significantly contribute to strengthening destination competitiveness. These findings indicate that tourists increasingly evaluate destination attractiveness not only through physical attributes but also through digital accessibility, service responsiveness, and technology-supported tourism experiences. In addition, both digital perceptions and innovation perception directly influence tourist sharing intentions, suggesting that positive digital interaction experiences and innovative tourism services encourage tourists to actively promote destinations through online communication channels.
Importantly, destination competitiveness was found to function as a complementary mediating variable linking digital perceptions and innovation perception with tourist sharing intentions. This confirms that digitally supported tourism environments enhance sharing behavior both directly and indirectly through competitiveness enhancement. Overall, the findings demonstrate that strengthening digital interaction quality and service innovation represents an effective strategy for encouraging advocacy behavior among Generation Z tourists.
The findings consistently support all proposed hypotheses and confirm the mediating role of destination competitiveness in transforming tourists’ perceptions of digitalization and innovation into sharing intentions. These results provide empirical support for the application of Service-Dominant Logic within digitally enabled tourism destinations.

7. Recommendations

This study contributes to tourism research by strengthening the understanding of destination competitiveness within digitally enabled tourism environments. The findings demonstrate that destination competitiveness functions not only as an outcome of destination attributes but also as a behavioral transmission mechanism that connects digital interaction experiences with tourists’ sharing intentions.
This study also expands the role of digital perceptions and innovation perception as key experiential determinants influencing destination competitiveness in contemporary tourism settings. These findings highlight the importance of integrating technology-based interaction quality and service innovation into tourism competitiveness frameworks, particularly when examining digitally oriented tourist segments.
The results contribute to the growing understanding of Generation Z tourism behavior by confirming that digitally native tourists evaluate destinations through their interaction with digital services, information accessibility, and innovative tourism experiences. This supports the perspective that digital readiness and service innovation are critical components in explaining experience-sharing behavior in modern tourism environments.
The findings provide several practical implications for destination managers and tourism stakeholders seeking to enhance destination competitiveness and encourage tourists to share their experiences.
First, destination managers should prioritize improving digital tourism infrastructure, including integrated information systems, mobile-accessible services, and interactive visitor platforms. Strengthening digital accessibility improves tourists’ perceptions of convenience and responsiveness, which contributes to stronger destination competitiveness. From a managerial perspective, the IPMA findings highlight that improving high-importance constructs may yield stronger behavioral outcomes than focusing solely on high-performing attributes. Therefore, destination stakeholders should prioritize strategic investment in digitally enabled tourism experiences and innovative service development to strengthen destination competitiveness and stimulate tourists’ digital advocacy and electronic word-of-mouth behavior.
Second, tourism stakeholders should invest in innovation-oriented tourism services that enhance visitor engagement through interactive experiences and technology-supported service delivery. These innovations increase experiential value and strengthen tourists’ motivation to share travel experiences through digital platforms.
Third, destination managers should actively encourage user-generated content through digital engagement strategies such as social media interaction campaigns and experience-sharing initiatives. Supporting tourists’ participation in digital storytelling activities can strengthen destination visibility and competitiveness in increasingly connected tourism markets. Policymakers should incorporate digital transformation strategies into destination development planning to ensure that tourism competitiveness aligns with the expectations of digitally oriented tourist segments, particularly Generation Z travelers.
This study has several limitations that provide opportunities for future research.
First, this study focused only on Generation Z domestic tourists visiting digitally enabled destinations. Future research may examine different generational groups or international tourist segments to improve the generalizability of the findings.
Second, this study examined destination competitiveness as the primary mediating variable linking digital perceptions and innovation perception with tourist sharing intentions. Future studies may extend the research model by incorporating additional experiential variables, such as destination attachment, memorable tourism experience, tourist engagement, or experiential value co-creation. Third, this study applied a cross-sectional research design. Future research may adopt longitudinal approaches to examine how digital tourism experiences influence behavioral intentions over time.
Third, the use of purposive sampling focusing exclusively on Generation Z domestic tourists in Indonesia may limit the generalizability of the findings to broader tourist populations and international contexts. Respondents recruited through online platforms may also exhibit stronger digital engagement than other traveler segments, potentially introducing sampling bias. Therefore, future studies are encouraged to examine more diverse demographic groups, international tourists, and cross-cultural settings to strengthen external validity and provide broader comparative insights into digital tourism behavior.

Author Contributions

Conceptualization, M.H. and J.J.; methodology, M.H. and J.J.; formal analysis, M.H. and J.J.; investigation, M.H. and J.J.; resources and funding acquisition, M.H.; writing—original draft, M.H. and J.J.; writing—review and editing, M.H. and J.J.; supervision, J.J. All authors have read and agreed to the published version of the manuscript.

Funding

This research received no external funding.

Institutional Review Board Statement

Ethical review and approval were waived for this study due to an exemption for faculty of hospitality & tourism, Universitas Pelita Harapan. It is a non-interventional social research project that does not involve medical procedures, clinical interventions, or the collection of sensitive personal information. The research only utilized anonymized information data, ensuring no harm or risk to human participants.

Informed Consent Statement

Informed consent was obtained from all the subjects involved in the study.

Data Availability Statement

The original contributions presented in the study are included in the article; further inquiries can be directed to the corresponding author.

Acknowledgments

We would also like to express our gratitude to the Faculty of Hospitality and Tourism at Universitas Pelita Harapan for their assistance throughout this research. We hope that this research will be beneficial to a wide range of individuals.

Conflicts of Interest

The authors declare no conflicts of interest.

References

  1. Alhaddar, M., & Kummitha, H. R. (2025). Digitalization and sustainable branding in tourism destinations from a systematic review perspective. Discover Sustainability, 6, 1167. [Google Scholar] [CrossRef]
  2. Ballantyne, D., & Varey, R. J. (2008). The service-dominant logic and the future of marketing. Journal of the Academy of Marketing Science, 36(1), 11–14. [Google Scholar] [CrossRef]
  3. Ben Youssef, K., Leicht, T., & Marongiu, L. (2019). Storytelling in the context of destination marketing: An analysis of conceptualisations and impact measurement. Journal of Strategic Marketing, 27(8), 696–713. [Google Scholar] [CrossRef]
  4. Buhalis, D. (2000). Marketing the competitive destination of the future. Tourism Management, 21, 97–116. [Google Scholar] [CrossRef]
  5. Cevdet Altunel, M., Erkurt, B., & Erkut, B. (2015). Cultural tourism in Istanbul: The mediation effect of tourist experience and satisfaction on the relationship between involvement and recommendation intention. Journal of Destination Marketing and Management, 4(4), 213–221. [Google Scholar] [CrossRef]
  6. Chin, C.-H., Lo, M.-C., Nair, V., & Songan, P. (2022). Examining the effects of environmental components on tourism destination competitiveness: The moderating impact of community support. Asian Academy of Management Journal, 21(2), 75–104. [Google Scholar] [CrossRef]
  7. Cristina, M., Buhalis, D., & Licata, M. C. (2022). The future eTourism intermediaries. University of Surrey, 23, 207–220. [Google Scholar] [CrossRef]
  8. Crouch, G. I., & Ritchie, B. (1999). Tourism, competitiveness, and societal prosperity. Journal of Business Research, 44(3), 137–152. [Google Scholar] [CrossRef]
  9. Domurath, A., Patzelt, H., & Liebl, A. (2020). Does negative feedback impact new ventures’ organizational identity? The role of founding teams’ human capital and feedback source. Journal of Business Venturing, 35(3), 105987. [Google Scholar] [CrossRef]
  10. Duc, T. M., & Tien, N. V. (2025). Analyzing the efforts of digitizing cultural heritage in Vietnam and its role in preserving indigenous knowledge, promoting education, and tourism. Journal of Posthumanism, 3576(5), 1584–1605. [Google Scholar] [CrossRef]
  11. Dwyer, L., & Edwards, D. (2020). Nature-based tourism on the edge of urban development. Journal of Sustainable Tourism, 1, 267–287. [Google Scholar] [CrossRef]
  12. Etikan, I., Musa, S. A., & Alkassim, R. S. (2016). Comparison of convenience sampling and purposive sampling. American Journal of Theoretical and Applied Statistics, 5(1), 1–4. [Google Scholar] [CrossRef]
  13. Fayzullaev, K. (2021). Destination image in Uzbekistan–heritage of the silk road and nature experience as the core of an evolving post soviet identity. Service Industries Journal, 41(7), 446–461. [Google Scholar] [CrossRef]
  14. Goeltom, V. A. H., Kristiana, Y., Juliana, J., Bernato, I., & Pramono, R. (2020). The effect of service quality and value of five-star hotel services on behavioral intentions with the role of consumer satisfaction as mediator. Journal of Asian Finance, Economics and Business, 7(11), 967–976. [Google Scholar] [CrossRef]
  15. Gračan, D., & Lučić, L. (2022). The impact of tourism development on the quality of life of the locals in a tourist destination. Pomorstvo, 36(1), 105–112. [Google Scholar] [CrossRef]
  16. Gretzel, U., Fuchs, M., Baggio, R., Hoepken, W., Law, R., Neidhardt, J., Pesonen, J., Zanker, M., & Xiang, Z. (2020). e-Tourism beyond COVID-19: A call for transformative research. Information Technology & Tourism, 22(2), 187–203. [Google Scholar] [CrossRef]
  17. Hair, J., & Alamer, A. (2022). Partial least squares structural equation modeling (PLS-SEM) in second language and education research: Guidelines using an applied example. Research Methods in Applied Linguistics, 1(3), 100027. [Google Scholar] [CrossRef]
  18. Ha Le, T.-M., & Ngoc, B. M. (2024). Consumption-related social media peer communication and online shopping intention among Gen Z consumers: A moderated-serial mediation. Devdutt Pattanaik, 32(1), 108100. [Google Scholar] [CrossRef]
  19. Hjalager, A.-M. (2018). Repairing innovation defectiveness in tourism. Tourism Management, 23(5), 465–474. [Google Scholar] [CrossRef]
  20. Im, H. H., Kim, S. S., Elliot, S., & Han, H. (2012). Conceptualizing destination brand equity dimensions from a consumer-based brand equity perspective. Journal of Travel & Tourism Marketing, 29(4), 385–403. [Google Scholar] [CrossRef]
  21. Jiang, Y. (2020). A cognitive appraisal process of customer delight: The moderating effect of place identity. Journal of Travel Research, 59(6), 1029–1043. [Google Scholar] [CrossRef]
  22. Jolly, E., Tamir, D. I., Burum, B., & Mitchell, J. P. (2019). Wanting without enjoying: The social value of sharing experiences. PLoS ONE, 14(4), e0215318. [Google Scholar] [CrossRef] [PubMed]
  23. Juliana, J., Aditi, B., Nagoya, R., Wisnalmawati, W., & Nurcholifah, I. (2022). Tourist visiting interests: The role of social media marketing and perceived value. International Journal of Data and Network Science, 6(2), 469–476. [Google Scholar] [CrossRef]
  24. Juliana, J., Indra, F., Sianipar, R., & Djakasaputra, A. (2025a). Reimagining heritage tourism through co-creation: Insights from prenggan tourism village, yogyakarta. Sustainability, 17, 11112. [Google Scholar] [CrossRef]
  25. Juliana, J., Pramezwary, A., Djakasaputra, A., Muhlis, M., & Jie, F. (2025b). The missing link in urban tourism: Connecting leisure, accessibility and resident participation for enhanced value. Cogent Social Sciences, 11(1), 2556473. [Google Scholar] [CrossRef]
  26. Juliana, J., Sihombing, S. O., Antonio, F., Sijabat, R., & Bernarto, I. (2024). The role of tourist experience in shaping memorable tourism experiences and behavioral intentions. International Journal of Sustainable Development and Planning, 19(4), 1319–1335. [Google Scholar] [CrossRef]
  27. Kanje, P., Charles, G., Tumsifu, E., Mossberg, L., & Andersson, T. (2019). Customer engagement and eWOM in tourism. Journal of Hospitality and Tourism Insights, 3(3), 273–289. [Google Scholar] [CrossRef]
  28. Khoshroo, M., & Soltani, M. (2025). Digital transformation of tourism: Towards a model of technology acceptance by tourists in the Industry 5.0. European Journal of Innovation Management, 28(5), 2101–2124. [Google Scholar] [CrossRef]
  29. Kim, Y., Ribeiro, M. A., & Li, G. (2022). Tourism memory, mood repair and behavioral intention. Annals of Tourism Research, 93, 103369. [Google Scholar] [CrossRef]
  30. Kline. (2016). Principles and practice of structural equation modelling. The Guilford Press. [Google Scholar]
  31. Kozak, M., Bigné, E., & Andreu, L. (2004). Satisfaction and destination loyalty: A comparison between non-repeat and repeat tourists. Journal of Quality Assurance in Hospitality & Tourism, 5(1), 43–59. [Google Scholar] [CrossRef]
  32. Kumar, A., & Barua, C. S. (2024). Leveraging digital innovations in tourism marketing: A study of destination promotion strategies. International Journal of Business and Management Research, 12, 8–12. [Google Scholar] [CrossRef]
  33. Lemy, D. M., Pramezwary, A., Juliana, Pramono, R., & Qurotadini, L. N. (2021). Explorative study of tourist behavior in seeking information to travel planning. International Journal of Sustainable Development and Planning, 16(8), 1583–1589. [Google Scholar] [CrossRef]
  34. Lestari, F., & Muttaqin, R. (2022). Tourist experience model saung ciburial tourism village. Adpebi International Journal of Multidisciplinary Sciences, 1(1), 91–98. [Google Scholar] [CrossRef]
  35. Leung, X. Y., Sun, J., & Bai, B. (2021). Social media research in hospitality and tourism: A causal chain framework of literature review. Tourism and Hospitality Management, 27(3), 455–477. [Google Scholar] [CrossRef]
  36. Li, Z., Wang, D., Abbas, J., Hassan, S., & Mubeen, R. (2022). Tourists’ health risk threats amid COVID-19 era: Role of technology innovation, transformation, and recovery implications for sustainable tourism. Frontiers in Psychology, 12, 769175. [Google Scholar] [CrossRef] [PubMed]
  37. Line, N. D., & Hanks, L. (2020). A holistic model of the servicescape in fast casual dining. International Journal of Contemporary Hospitality Management, 32(1), 288–306. [Google Scholar] [CrossRef]
  38. Liu, L., & Id, H. Z. (2024). Research on consumers’ purchase intention of cultural and creative products—Metaphor design based on traditional cultural symbols. PLoS ONE, 9(5), e0301678. [Google Scholar] [CrossRef]
  39. Lusch, R. F., & Vargo, S. L. (2011). Service-dominant logic: A necessary step. European Journal of Marketing, 45(7), 1298–1309. [Google Scholar] [CrossRef]
  40. Mariani, M., Platanakis, E., Stafylas, D., & Sutcliffe, C. (2023). Identifying a destination ’ s optimal tourist market mix: Does a superior portfolio model exist ? Tourism Management, 96, 104722. [Google Scholar] [CrossRef]
  41. Mogaji, E. (2025). Reimagining transformative services in unregulated markets: Conceptualising inclusive service provision in informal and developing country contexts. Journal of Services Marketing, 40, 188–200. [Google Scholar] [CrossRef]
  42. Monterrubio, C., Rodríguez Madera, S. L., & Pérez, J. (2020). Trans women in tourism: Motivations, constraints and experiences. Journal of Hospitality and Tourism Management, 43, 169–178. [Google Scholar] [CrossRef]
  43. Naumov, N., & Dutta, P. (2020). Food culture: Gastronomic experiences in Singapore. Journal of Gastronomy Hospitality and Travel (JOGHAT), 3(1), 20–29. [Google Scholar] [CrossRef]
  44. Ngo, T. H., & Creutz, S. (2022). Assessing the sustainability of community-based tourism: A case study in rural areas of Hoi An, Vietnam. Cogent Social Sciences, 8(1), 2116812. [Google Scholar] [CrossRef]
  45. Nguyen, H., Martin, B. A. S., & Kerr, G. (2021). Effects of materialism on brand-related user-generated content and positive WOM on social media. Australasian Marketing Journal, 31(2), 135–141. [Google Scholar] [CrossRef]
  46. Nguyen, M. N., Hoang, V. H., Nguyen, P. B., & Le, Q. N. H. (2025). The relationship between electronic word of mouth, destination images, travel intention and information on Covid: Case of Da Nang. Acta Psychologica, 261, 105878. [Google Scholar] [CrossRef] [PubMed]
  47. Nitzl, C., Roldan, J. L., & Cepeda, G. (2016). Mediation analysis in partial least squares path modelling, Helping researchers discuss more sophisticated models. Industrial Management and Data Systems, 116(9), 1849–1864. [Google Scholar] [CrossRef]
  48. Orts-Cardador, J., Gálvez, J. C. P., Fuentes, G. M. G.-C., & Alba, C. A. J. (2025). Mapping co-creation research in tourism: A bibliometric visualisation review. SAGE Open, 15, 21582440251335473. [Google Scholar] [CrossRef]
  49. Peng, P., & Gu, J. (2024). Analysis of the impact of service-dominant logic on value co-creation in online tourism enterprises. International Journal of Management Science Research, 7(4), 6–9. [Google Scholar] [CrossRef] [PubMed]
  50. Pramono, R., Sondakh, L. W., Bernarto, I., Juliana, J., & Purwanto, A. (2021). Determinants of the small and medium enterprises progress: A case study of SME entrepreneurs in Manado, Indonesia. Journal of Asian Finance, Economics and Business, 8(1), 881–889. [Google Scholar] [CrossRef]
  51. Priatmoko, S., Kabil, M., Purwoko, Y., & Dávid, L. D. (2021). Rethinking sustainable community-based tourism: A villager’s point of view and case study in Pampang Village, Indonesia. Sustainability, 13(6), 3245. [Google Scholar] [CrossRef]
  52. Racela, O. C., Thoumrungroje, A., Racela, O. C., & Thoumrungroje, A. (2019). When do customer orientation and innovation capabilities matter? An investigation of contextual impacts. Asia Pacific Journal of Marketing and Logistics, 32(2), 445–472. [Google Scholar] [CrossRef]
  53. Regmi, S., Neupane, A., Neupane, R., & Pokharel, A. (2023). Potentiality of community-based tourism homestay for sustainable livelihood in Nepal: A review. Economic Growth and Environment Sustainability, 2(1), 01–04. [Google Scholar] [CrossRef]
  54. Sarker, M. M., Mohd-Any, A. A., & Kamarulzaman, Y. (2019). Conceptualising consumer-based service brand equity (CBSBE) and direct service experience in the airline sector. Journal of Hospitality and Tourism Management, 38, 39–48. [Google Scholar] [CrossRef]
  55. Savva, A., Trimis, E., & Zachariou, A. (2004). Exploring the links between visual arts and environmental education: Experiences of teachers participating in an in-service training programme. International Journal of Art and Design Education, 23(3), 246–255. [Google Scholar] [CrossRef]
  56. Seyfi, S., Hall, C. M., & Rasoolimanesh, S. M. (2020). Exploring memorable cultural tourism experiences. Journal of Heritage Tourism, 15(3), 341–357. [Google Scholar] [CrossRef]
  57. Seyfi, S., Ja, M., Nazifi, A., Murdy, S., & Vo-thanh, T. (2025). Understanding tourist barriers and personality influences in embracing generative AI for travel planning and decision-making. International Journal of Hospitality Management, 126, 104105. [Google Scholar] [CrossRef]
  58. Shampy Kamboj, M. S. (2023). Social media adoption behaviour: Consumer innovativeness and participation intention. International Journal Of Consumer Studies, 47(2), 523–544. [Google Scholar] [CrossRef]
  59. Sigala, M. (2023). Thriving in Wine Tourism Through Technology and Innovation: A Survival or a Competitiveness Need? In Technology advances and innovation in wine tourism (Vol. 1, Issue 2). Springer Books. [Google Scholar] [CrossRef]
  60. Silitonga, P., Juliana, J., Rini, G. P., & Sitohang, A. P. S. (2025). Unveiling the outcome of the implementation of experiential value co-creation on the behavioral intention of online travelers. Tourism and Hospitality, 6(3), 157. [Google Scholar] [CrossRef]
  61. Song, H., Phan, B. V., & Kim, J. H. (2019). The congruity between social factors and theme of ethnic restaurant: Its impact on customer’s perceived authenticity and behavioural intentions. Journal of Hospitality and Tourism Management, 40, 11–20. [Google Scholar] [CrossRef]
  62. Souki, G. Q., Oliveira, A. S. D., Guerreiro, M. M. M., Mendes, J. D. C., & Moura, L. R. C. (2022). Do memorable restaurant experiences affect eWOM? The moderating effect of consumers’ behavioural engagement on social networking sites. TQM Journal, 35, 2255–2281. [Google Scholar] [CrossRef]
  63. Su, D. N. (2020). The link between travel motivation and satisfaction towards a heritage destination: The role of visitor engagement, visitor experience and heritage destination image. Tourism Management Perspectives, 34, 100634. [Google Scholar] [CrossRef]
  64. Suryaningsih, I. (2020). Reflection of customer experience and destination image of tourist trust through satisfaction mediation. Hasanuddin Economics and Business Review, 4(1), 1–6. [Google Scholar] [CrossRef]
  65. Veréb, V., & Azevedo, A. (2019). A quasi-experiment to map innovation perception and pinpoint innovation opportunities along the tourism experience journey. Journal of Hospitality and Tourism Management, 41(2), 208–218. [Google Scholar] [CrossRef]
  66. Wang, C., Liu, J., Wei, L., & Zhang, T. (2020). Impact of tourist experience on memorability and authenticity: A study of creative tourism. Journal of Travel and Tourism Marketing, 37(1), 48–63. [Google Scholar] [CrossRef]
  67. Wardhani, W. N. R., & Widodo, W. (2020). Destination innovativeness towards tourism competitive advantage. In Proceedings of the 3rd Asia pacific management research conference (pp. 39–45). Atlantis Press. [Google Scholar] [CrossRef]
  68. Wong, I. K. A., Ma, J., & Xiong, X. (2020). Touristic experience at a nomadic sporting event: Craving cultural connection, sacredness, authenticity, and nostalgia. Journal of Hospitality and Tourism Management, 44, 70–78. [Google Scholar] [CrossRef]
  69. Wong, J. W. C., Lai, I. K. W., & Tao, Z. (2020). Sharing memorable tourism experiences on mobile social media and how it influences further travel decisions. Current Issues in Tourism, 23(14), 1773–1787. [Google Scholar] [CrossRef]
  70. Xu, J., Shi, P., & Chen, X. (2024). Exploring digital innovation in smart tourism destinations: Insights from 31 premier tourist cities in digital China. Tourism Review, 80, 681–709. [Google Scholar] [CrossRef]
  71. Xue, J., Zhou, Z., Majeed, S., Chen, R., & Zhou, N. (2022). Stimulating tourist inspiration by tourist experience: The moderating role of destination familiarity. Frontiers in Psychology, 13, 895136. [Google Scholar] [CrossRef] [PubMed]
  72. Zaman, U. (2023). Nexus between digital tourism hackathon, value cocreation, reward-based crowdfunding and destination competitiveness in post-pandemic tourism. Pakistan Journal of Commerce and Social Sciences, 17, 793–825. [Google Scholar] [CrossRef]
  73. Zaman, U. (2024). Nexus of regenerative tourism destination competitiveness, climate advocacy and visit intention: Mediating role of travel FOMO and destination loyalty. Sustainability, 16(17), 7827. [Google Scholar] [CrossRef]
  74. Zeng, Y., Liu, L., & Xu, R. (2022). The effects of a virtual reality tourism experience on tourist’ s cultural dissemination behavior. Tourism and Hospitality, 3(1), 314–329. [Google Scholar] [CrossRef]
  75. Zhang, H., Wu, Y., Buhalis, D., Zhang, H., Wu, Y., & Buhalis, D. (2018). A model of perceived image, memorable tourism experiences and revisit intention. Journal of Destination Marketing and Management, 8, 326–336. [Google Scholar] [CrossRef]
  76. Zhou, L., Buhalis, D., Fan, D., Ladkin, A., & Lian, X. (2024). Attracting digital nomads: Smart destination strategies, innovation and competitiveness. Journal of Destination Marketing & Management, 31, 100850. [Google Scholar] [CrossRef]
  77. Zunaidi, A., Nofirman, N., Juliana, J., & Wurarah, R. N. (2022). The impact of the development of cultural tourism on the cultural, economic, and social aspects of local communities. Dinar: Jurnal Ekonomi Dan Keuangan Islam, 9(2), 1–18. [Google Scholar] [CrossRef]
Figure 1. The conceptual framework of this study.
Tourismhosp 07 00177 g001
Figure 2. The inner model.
Tourismhosp 07 00177 g002
Figure 3. The IPMA indicator.
Tourismhosp 07 00177 g003
Table 1. Reliability and validity.
Cronbach’s Alpha Composite Reliability (rho_a) Composite Reliability (rho_c) Average Variance Extracted (AVE)
Destination Competitiveness 0.920 0.924 0.935 0.642
Digital Perceptions 0.916 0.920 0.932 0.630
Innovation Perception 0.932 0.937 0.944 0.678
Tourist Sharing Intentions 0.933 0.941 0.945 0.682
Table 2. R-square results.
R-Square R-Square Adjusted Q Square Predict
Destination Competitiveness 0.418 0.415 0.408
Tourist Sharing Intentions 0.322 0.320 0.418
Table 3. HTMT.
Table 3. HTMT.
Destination Competitiveness Digital Perceptions Innovation Perception Tourist Sharing Intentions
Destination Competitiveness
Digital Perceptions 0.635
Innovation Perception 0.615 0.697
Tourist Sharing Intentions 0.594 0.739 0.746
All the HTMT values for each pair of constructs are less than the recommended threshold of 0.85, which confirms adequate discriminant validity. This way, each construct is a unique conceptual domain and empirically distinct from the other constructs in the model.
Table 4. SRMR.
Table 4. SRMR.
Saturated Model Estimated Model
SRMR 0.069 0.136
d_ULS 2.504 9.764
d_G 1.845 1.972
Chi-square 2891.839 3047.370
NFI 0.728 0.713
Table 5. Hypothesis test results.
Hypothesis Original Sample (O) Sample Mean (M) Standard Deviation (STDEV) T Statistics (|O/STDEV|) p Values
Destination Competitiveness -> Tourist Sharing Intentions 0.567 0.570 0.041 13.950 0.000
Digitalization Perceptions -> Destination Competitiveness 0.384 0.387 0.060 6.387 0.000
Innovation Perception -> Destination Competitiveness 0.327 0.327 0.059 5.574 0.000
Digitalization Perceptions -> Destination Competitiveness -> Tourist Sharing Intentions 0.218 0.221 0.040 5.425 0.000
Innovation Perception -> Destination Competitiveness -> Tourist Sharing Intentions 0.186 0.187 0.038 4.855 0.000
Table 6. F-square, q-square, and VIF.
Path Analysisf-Square VIF
Destination Competitiveness -> Tourist Sharing Intentions 0.474 1.000
Digital Perceptions -> Destination Competitiveness 0.146 1.737
Innovation Perception -> Destination Competitiveness 0.106 1.737
Disclaimer/Publisher’s Note: The statements, opinions and data contained in all publications are solely those of the individual author(s) and contributor(s) and not of MDPI and/or the editor(s). MDPI and/or the editor(s) disclaim responsibility for any injury to people or property resulting from any ideas, methods, instructions or products referred to in the content.