Article

Understanding Attitudes, Benefits and Acceptance of Artificial Intelligence (AI) in Travel and Tourism: Evidence from Generation Z

Faculty of Management and Business, University of Prešov, 080 01 Prešov, Slovakia
*
Author to whom correspondence should be addressed.
Tour. Hosp. 2026, 7(6), 150; https://doi.org/10.3390/tourhosp7060150
Submission received: 27 March 2026 / Revised: 9 May 2026 / Accepted: 21 May 2026 / Published: 25 May 2026

Abstract

This study examines the perceived usefulness, perceived benefits, and acceptance of artificial intelligence (AI) technologies in tourism, with a specific focus on Generation Z. Drawing on established technology acceptance frameworks, the research investigates how key perceptual factors influence the adoption of AI in travel planning and tourism services. The empirical analysis is based on a questionnaire survey conducted among 531 university students from Slovakia. The study employs factor analysis, correlation analysis, regression modeling, and non-parametric tests to explore relationships between perceived usefulness, perceived benefits, acceptance, trust, and experience with AI technologies. The results reveal strong and statistically significant relationships among all three core constructs. However, regression analysis indicates that perceived usefulness does not directly influence acceptance when perceived benefits are included, suggesting a mediating effect. Perceived benefits emerge as the strongest predictor of acceptance, emphasizing the importance of experiential value, such as efficiency, personalization, and improved decision-making. Trust in AI-generated travel information and perceptions of AI’s contribution to quality of life significantly influence all constructs. Additionally, prior experience with AI tools positively affects user attitudes. The findings suggest that AI adoption can enhance tourism competitiveness and support tourism development, provided that trust, information quality, and human–technology balance are effectively managed.

1. Introduction

The tourism and hospitality industry has undergone a significant transformation in recent years due to rapid technological development and digitalization. Among emerging technologies, artificial intelligence (AI) has become one of the most influential drivers of change, fundamentally reshaping how tourism services are designed, delivered, and consumed. AI enables organizations to automate processes, analyze large volumes of data, and enhance decision-making through advanced analytical capabilities, thereby improving operational efficiency and customer experience (Huang et al., 2021; H. Kim et al., 2024; Limna, 2023; López-Naranjo et al., 2025; García-Madurga & Grilló-Méndez, 2023).
In tourism, AI is increasingly deployed across customer service, travel planning, marketing, pricing strategies, and destination management. Tools such as chatbots, virtual assistants, recommendation systems, and predictive analytics allow tourism providers to deliver personalized, efficient, and data-driven services (Awasthi, 2022; H. Kim et al., 2024; Ling et al., 2025). These technologies help reduce information overload, support decision-making, and generate more relevant and customized travel experiences (Gavalas et al., 2014; Hassannia et al., 2019; S. Ma & Zhang, 2024). Concurrently, AI contributes to operational optimization through demand forecasting, resource allocation, and pricing strategies, thereby enhancing the competitiveness of tourism organizations (Gayathri, 2025; García-Madurga & Grilló-Méndez, 2023).
Despite these benefits, AI adoption in tourism is not uniform and depends on multiple factors. Prior research highlights the importance of perceived usefulness, perceived benefits, trust, and ease of use in shaping users’ attitudes and behavioral intentions toward AI technologies (Davis, 1989; Li et al., 2024; Mogaji et al., 2024). At the same time, ethical concerns, privacy issues, and the potential reduction in human interaction continue to represent barriers to adoption (H. Kim et al., 2024; Awasthi, 2022; Buhalis et al., 2024). Consequently, understanding how users perceive AI technologies has become a key research topic in tourism and hospitality studies.
Consumer behavior in tourism is also increasingly shaped by generational differences. Generation Z has emerged as a particularly relevant segment due to its strong digital orientation and familiarity with advanced technologies. As digital natives, these individuals rely extensively on mobile devices, social media, and online platforms throughout the entire travel journey, from information search to post-travel sharing (Pricope Vancia et al., 2023; Ivasciuc et al., 2025; Chang et al., 2023). Their expectations for personalized, convenient, and technology-driven services make them especially relevant for studying AI adoption in tourism.
Although Generation Z is generally more receptive to technological innovation and exhibits lower levels of technological anxiety (Vitezić & Perić, 2021), acceptance of AI is not unconditional. Evidence suggests that adoption is driven by perceived benefits such as efficiency, usefulness, and service quality, as well as by trust and perceived value (Hameed & Nigam, 2023; Gupta & Pande, 2023). At the same time, this cohort may simultaneously value technological convenience while remaining sensitive to issues such as authenticity, privacy, and the quality of human interaction (Belanche et al., 2020; Lu et al., 2019).
Given these characteristics, Generation Z represents an important group for examining the determinants of AI acceptance in tourism. Their digital competence, frequent use of AI-based tools, and evolving expectations for personalized experiences provide a suitable context for analyzing the interrelationships among perceived usefulness, perceived benefits, and acceptance of AI technologies.
The primary aim of this study is to examine the attitudes, perceived benefits, and acceptance of AI technologies in travel and tourism among Generation Z university students. Particular attention is paid to identifying the underlying dimensions of AI perception and examining their interrelationships. Furthermore, the study investigates whether behavioral factors (prior use of AI tools, level of trust in AI-generated information, and perceptions of AI’s impact on quality of life) influence the perception and acceptance of AI in tourism. The study thus provides empirical evidence on the determinants of AI adoption among young consumers in the tourism context.
Existing studies on Generation Z and AI in tourism have primarily focused either on AI-enabled hospitality devices and emotional responses (e.g., Vitezić & Perić, 2021) or on broader tourism experiences and AI-generated insights (e.g., Ivasciuc et al., 2025). However, limited attention has been devoted to examining the interrelationships between perceived usefulness, perceived benefits, and the acceptance of AI technologies in tourism services, particularly in the context of Central and Eastern Europe. Moreover, previous studies have not sufficiently explored whether perceived benefits mediate the relationship between usefulness perceptions and AI acceptance among Generation Z travelers. This study contributes to the existing literature in three ways. First, it extends prior research on Generation Z and AI adoption in tourism by distinguishing between perceived usefulness and perceived benefits as separate explanatory constructs. Second, the study demonstrates that perceived benefits mediate the relationship between perceived usefulness and acceptance of AI technologies, highlighting the importance of experiential value in AI adoption. Third, the study provides empirical evidence from Slovakia, contributing to the limited body of research on AI acceptance in tourism within Central and Eastern European contexts.

2. Literature Review

2.1. AI in Tourism and Hospitality

AI has become a central component of the digital transformation of tourism and hospitality. It is commonly defined as the ability of computer systems to simulate human intelligence, including learning, reasoning, and decision-making (Limna, 2023; H. Kim et al., 2024). Through machine learning, natural language processing, and predictive analytics, AI enables tourism organizations to transform large-scale data into actionable insights that support both service delivery and managerial decision-making (Huang et al., 2021).
AI application in tourism spans multiple domains, including customer service, marketing, pricing, and operations (Gayathri, 2025; Awasthi, 2022). AI-powered chatbots and virtual assistants are widely used to provide real-time customer support, assist with bookings, and deliver personalized recommendations (Ling et al., 2025; Kazak et al., 2020). Similarly, recommendation systems and predictive analytics enhance personalization by analyzing user behavior and preferences, thereby improving customer satisfaction and loyalty (Awasthi, 2022; H. Kim et al., 2024).
AI also plays a significant role in travel planning and decision-making by reducing information overload and enabling more efficient and personalized choices (Gavalas et al., 2014; Hassannia et al., 2019). In addition, AI contributes to operational efficiency through demand forecasting, pricing optimization, and resource management (García-Madurga & Grilló-Méndez, 2023). At the destination level, AI is increasingly integrated into smart tourism, combining digital infrastructure and intelligent systems to enhance both tourist experiences and destination management (Buhalis et al., 2019; Gretzel et al., 2015).
Despite these benefits, AI adoption also presents challenges related to data privacy, ethical concerns, and implementation complexity (H. Kim et al., 2024; López-Naranjo et al., 2025). Furthermore, the increasing use of automation raises concerns about the reduction in human interaction, which remains a key element of hospitality services (Awasthi, 2022).

2.2. Perceived Usefulness and Benefits of AI

Perceived usefulness is one of the most important determinants of technology adoption and is defined as the degree to which a user believes that using a system enhances performance (Davis, 1989). In tourism, this concept extends beyond productivity to include convenience, improved decision-making, reduced uncertainty, and enhanced travel experiences (Lai, 2013; S.-Y. Lin et al., 2020; Zhao et al., 2022).
Empirical evidence consistently shows that AI technologies are perceived as useful when they save time, reduce cognitive effort, and simplify travel-related tasks (Gavalas et al., 2014; S.-Y. Lin et al., 2020). For example, AI-powered applications enable efficient information search, personalized recommendations, and streamlined booking processes, which positively influence user attitudes and behavioral intentions (Zhao et al., 2022; Hassannia et al., 2019).
Perceived usefulness is closely linked to perceived benefits, which include efficiency, personalization, information quality, and convenience (Gavalas et al., 2014; Zhao et al., 2022). AI technologies provide accurate, timely, and relevant information, which is essential for effective travel planning (Lai, 2013; Tom Dieck & Jung, 2015). They also support multilingual communication, real-time updates, and integration with other services (Dogru et al., 2023; Gursoy et al., 2023).
AI-driven tools such as chatbots, virtual assistants, and recommendation systems further enhance the travel experience by offering continuous support and personalized services (Zhang et al., 2024; Ling et al., 2025). In hospitality settings, AI enables automated concierge services, smart room technologies, and improved customer interaction, contributing to higher service quality and satisfaction (Jamshed et al., 2024).
Importantly, perceived usefulness also influences perceived benefits. When users recognize that AI improves efficiency and decision-making, they are more likely to perceive broader advantages associated with its use (Theodoridis & Gkikas, 2019). This relationship is particularly relevant for understanding how AI adoption develops in tourism contexts.

2.3. Acceptance of AI Technologies

Acceptance of AI technologies in tourism refers to users’ willingness to adopt and interact with AI systems in service contexts (Abou-Shouk et al., 2021; Ivanov et al., 2022). While traditional models, such as the Technology Acceptance Model (TAM), emphasize perceived usefulness and ease of use, recent research highlights the importance of additional factors, including trust, social influence, emotional responses, and perceived risk (Go et al., 2020; Pillai & Sivathanu, 2020).
Perceived usefulness remains a key driver of acceptance, as users are more likely to adopt AI technologies when they perceive them as beneficial and efficient (Li et al., 2024; Mogaji et al., 2024). Similarly, perceived benefits such as improved service quality, convenience, and personalization contribute to positive attitudes toward AI adoption (Chi et al., 2020; Gursoy et al., 2019; H. Lin et al., 2020).
Trust is another critical determinant, as users must perceive AI systems as reliable and capable of performing tasks effectively (Go et al., 2020; Song et al., 2024). Acceptance is often task-specific, with users more willing to rely on AI for routine and information-based tasks than for emotionally complex interactions (Ivanov et al., 2022; Lei et al., 2021).
At the same time, several barriers to acceptance remain. Privacy concerns, perceived risks, and ethical issues related to data usage can negatively influence adoption (Buhalis et al., 2024; Sousa et al., 2024). Additionally, the perceived loss of human interaction may reduce acceptance in contexts where personal service is highly valued.
AI acceptance in tourism is shaped by a combination of cognitive and emotional factors, including perceived usefulness, perceived benefits, trust, and contextual influences. This multidimensional perspective highlights the need to examine how these factors interact, particularly within specific user groups such as Generation Z.
Although prior research generally confirms the positive role of perceived usefulness and perceived benefits in AI adoption, the existing literature remains fragmented in several respects. First, studies differ considerably in their methodological approaches, target populations, and operationalization of AI-related constructs, which limits comparability of findings. Second, empirical evidence regarding acceptance of more advanced or human-replacing AI applications remains inconsistent. While some studies report positive attitudes toward AI-enabled personalization and automation, others highlight concerns related to trust, privacy, emotional adequacy, and the loss of human interaction in tourism services. In addition, much of the existing research focuses either on general technology adoption or on specific AI applications, while fewer studies examine how multiple perceptual factors jointly influence AI acceptance among Generation Z travelers. These gaps support the need for further research integrating usefulness, benefits, trust, and experiential dimensions within a tourism-specific context.

2.4. Hypotheses Development

2.4.1. Perceived Usefulness and Acceptance of AI

Perceived usefulness represents one of the most fundamental determinants of technology adoption in tourism and hospitality. According to TAM, users are more likely to adopt a technology when they believe it enhances their performance and improves their task efficiency (Davis, 1989). In the tourism context, perceived usefulness is associated with faster information search, reduced uncertainty, improved planning, and overall convenience (Lai, 2013; S.-Y. Lin et al., 2020; Zhao et al., 2022).
AI-based tools such as chatbots, recommendation systems, and travel applications are particularly valued for their ability to simplify complex decision-making processes and provide relevant, real-time information (Gavalas et al., 2014; Hassannia et al., 2019). Empirical studies consistently show that when users perceive AI technologies as useful, they are more likely to develop positive attitudes toward them and demonstrate a higher intention to use them (Li et al., 2024; Mogaji et al., 2024).
Based on these theoretical and empirical insights, the following hypothesis is proposed:
Hypothesis 1. 
Perceived usefulness of AI in tourism has a positive and statistically significant effect on acceptance of AI technologies in tourism services.

2.4.2. Perceived Benefits and Acceptance of AI

Beyond usefulness, perceived benefits represent a broader evaluation of the value that AI technologies provide to users. These benefits include improved service quality, personalization, convenience, efficiency, and enhanced travel experiences (Gavalas et al., 2014; Zhao et al., 2022). AI-driven personalization, in particular, has been identified as a key factor contributing to customer satisfaction and loyalty (S. Ma & Zhang, 2024; García-Madurga & Grilló-Méndez, 2023).
In tourism, users are more likely to accept AI technologies when they perceive clear advantages such as time savings, better recommendations, and improved decision-making support. Previous studies indicate that perceived benefits have a strong positive effect on users’ attitudes and behavioral intentions toward AI-based systems (Chi et al., 2020; Gursoy et al., 2019; H. Lin et al., 2020).
Therefore, the following hypothesis is formulated:
Hypothesis 2. 
Perceived benefits of AI for travel have a positive and statistically significant effect on acceptance of AI technologies in tourism services.

2.4.3. Relationship Between Perceived Usefulness and Perceived Benefits

Although perceived usefulness and perceived benefits are closely related constructs, the literature suggests a directional relationship between them. Perceived usefulness reflects a functional evaluation of a system’s performance, while perceived benefits represent a broader assessment of its overall value and outcomes.
When users recognize that AI technologies improve efficiency, simplify tasks, and support decision-making, they are more likely to perceive additional benefits associated with their use (Theodoridis & Gkikas, 2019). In tourism, this relationship is particularly relevant because AI applications not only enhance task performance but also contribute to improved travel experiences and satisfaction (Chase, 2016).
Empirical studies also confirm that perceived usefulness often acts as a precursor to perceived benefits, especially in digital and AI-driven environments (S.-Y. Lin et al., 2020; Zhao et al., 2022).
Accordingly, the following hypothesis is proposed:
Hypothesis 3. 
Perceived usefulness of AI in tourism has a positive and statistically significant effect on perceived benefits of AI for travel.

2.4.4. Use of AI Tools in Travel Planning

The increasing availability of AI-based tools has transformed how tourists plan and experience travel. Applications such as chatbots, voice assistants, AI-powered search platforms, and recommendation systems provide users with real-time information, personalized suggestions, and decision support (Ling et al., 2025; Samala et al., 2022).
Frequent use of these tools enhances users’ familiarity with AI technologies, reduces uncertainty, and increases perceived usefulness and benefits. Prior experience with AI also positively influences attitudes and acceptance, as users become more confident in interacting with such systems (Mathiraj & Vinayagam, 2025).
Given that Generation Z actively uses digital tools throughout the travel journey, their experience with AI applications is expected to play a significant role in shaping their perceptions.
Therefore, the following hypothesis is formulated:
Hypothesis 4. 
The use of AI tools in travel planning (e.g., chatbots, voice assistants, AI search platforms) significantly influences perceived usefulness, acceptance, and perceived benefits of AI in tourism.

2.4.5. Trust in AI-Generated Information

Trust is widely recognized as a critical factor influencing the adoption of AI technologies. Users are more likely to accept and rely on AI systems when they perceive them as reliable, accurate, and capable of providing high-quality information (Go et al., 2020; Song et al., 2024).
In tourism, AI-generated information plays a key role in travel planning and decision-making. Travelers depend on AI tools to provide recommendations, compare options, and deliver real-time updates. Therefore, trust in AI-generated content directly affects how users evaluate its usefulness and benefits.
Previous research shows that higher levels of trust lead to more positive attitudes, greater perceived usefulness, and stronger behavioral intentions to use AI technologies (Pillai & Sivathanu, 2020; Sousa et al., 2024).
Based on these findings, the following hypothesis is proposed:
Hypothesis 5. 
Higher levels of trust in AI-generated travel information are associated with higher perceived usefulness, acceptance, and perceived benefits of AI in tourism.

2.4.6. Perceived Impact of AI on Quality of Life

The perception of how AI affects quality of life represents an important but less frequently examined factor in tourism research. AI technologies can improve quality of life by increasing convenience, saving time, reducing effort, and enhancing access to information and services (Mogaji et al., 2024; Paliwal et al., 2025).
In the tourism context, AI contributes to more efficient travel planning, better decision-making, and improved overall travel experiences. When users perceive that AI positively influences their daily lives, they are more likely to evaluate it as useful and beneficial and to accept its application in tourism services.
This perspective is particularly relevant for Generation Z, whose lifestyle is strongly integrated with digital technologies and who may perceive AI as a natural extension of everyday activities.
Thus, the following hypothesis is formulated as follows:
Hypothesis 6. 
Perceptions of AI’s contribution to quality of life significantly influence perceived usefulness, acceptance, and perceived benefits of AI in tourism.

3. Materials and Methods

This section outlines the materials and methods applied in the study. It is divided into two subsections: the first describes the research sample, while the second presents the research methods, including the questionnaire design and the statistical techniques used for data analysis.

3.1. Research Sample

The study is based on primary data collected through a questionnaire survey conducted among university students belonging to Generation Z at the University of Prešov in Slovakia. All respondents were students enrolled in the study programme Economics and Management. The study did not differentiate respondents according to year of study or mode of study (full-time/external), as the primary selection criterion was membership in Generation Z based on age. All participants remained anonymous. A total of 531 valid responses were obtained. The sample consisted of 193 men (36.3%) and 338 women (63.7%). The age of respondents ranged from 18 to 28 years, with a mean age of 21.19 years (median = 21; standard deviation = 2.03), indicating a relatively homogeneous sample typical of university populations. To better characterize the respondents’ tourism-related behavior, participants were also asked about the frequency of international travel. The largest group reported travelling abroad once per year (31.3%), followed by twice per year (28.2%) and three times per year (20.2%). Smaller proportions reported travelling four times per year (12.2%) or selected other travel frequencies (8.1%).
Although the sample provides valuable insights into Generation Z university students, the findings should be interpreted with caution in terms of generalizability. The study is based on a single-institution convenience sample from Slovakia and focuses specifically on students in economics and management. Therefore, the results may not fully represent all members of Generation Z, students from other academic disciplines, or populations from different cultural and socio-economic contexts.

3.2. Methods

The data for this study were collected between November and December 2025 through a structured questionnaire survey. The research specifically targeted respondents belonging to Generation Z. To ensure the relevance of the findings, the study applied strict selection criteria. Only individuals who actively travel or have previously traveled abroad were included in the analysis. In addition, respondents were required to have prior experience with artificial intelligence technologies. Participants who did not meet these criteria—i.e., those without travel experience or without any use of AI—were excluded from the dataset. This targeted sampling approach ensured that all respondents had sufficient familiarity with both travel-related decision-making and AI tools, allowing for more accurate evaluation of perceived usefulness, perceived benefits, and acceptance of AI in tourism. However, this selection approach may have resulted in a sample characterized by relatively higher levels of technological familiarity and openness toward AI technologies. As a consequence, the sample may overrepresent more digitally engaged or “early adopter” members of Generation Z. Therefore, the reported levels of perceived usefulness, perceived benefits, trust, and acceptance of AI in tourism may be higher than those that would be observed among less technologically engaged young consumers. Future research could compare respondents with different levels of AI experience in order to better understand potential differences in attitudes toward AI adoption in tourism.
The questionnaire included items focusing on the use of AI in travel planning, perceived trust in AI-generated travel information, and the perceived impact of AI on people’s quality of life. The use of AI in travel planning was measured using multiple items representing different forms of AI applications. Specifically, respondents were asked whether they use tools such as ChatGPT, digital voice assistants, AI-powered search platforms and websites, reservation systems, and electronic travel guides. Responses were recorded using a three-point categorical scale (no, yes, not sure). Perceived trust in AI-generated travel information and the perceived impact of AI on quality of life were measured using single-item indicators. Respondents evaluated each statement on a five-point Likert scale ranging from 1 (lowest level) to 5 (highest level).
In addition, the questionnaire included 15 items measuring attitudes toward AI in tourism, evaluated on a five-point Likert scale ranging from strong disagreement to strong agreement. The items were designed to capture different aspects of AI perception, including usefulness, acceptance, and perceived benefits. The questionnaire items were developed based on themes and constructs identified in prior research addressing AI adoption and tourism-related technologies. Although the items were inspired by existing literature (see Table 1), they were formulated specifically for the purposes of this study rather than directly adopted from previously validated scales. To support content relevance and clarity, the questionnaire design was informed by a review of prior studies focusing on AI in tourism and technology acceptance. The wording of the items was adjusted to reflect the tourism context and the characteristics of Generation Z respondents. Since the questionnaire was originally administered in Slovak, no translation or back-translation procedure was required.
To identify the underlying structure of the measured variables, exploratory factor analysis (EFA). Because moderate correlations between the extracted constructs were expected, an oblique rotation method (Promax) was applied in the EFA. The suitability of the data for factor analysis was confirmed by the Kaiser–Meyer–Olkin measure and Bartlett’s test of sphericity. Internal consistency of the identified factors was assessed using Cronbach’s alpha coefficients.
Subsequently, Spearman’s rank correlation analysis was conducted to examine relationships between the extracted factors. In addition to correlation analysis, regression analysis was conducted to examine the directional relationships between the identified factors and to test the proposed research hypotheses more rigorously. Ordinary least squares (OLS) regression models including intercept were initially estimated to assess the relationships between perceived usefulness of AI, perceived benefits of AI, and acceptance of AI technologies in tourism. Separate models were specified to examine the individual effects of each predictor, followed by a combined model including both variables to assess their relative explanatory power and potential overlapping or mediating relationships. The results were evaluated based on regression coefficients (β), statistical significance, and explanatory power (coefficient of determination, R2). To provide a more robust test of the hypothesised relationships and to account for measurement error in the latent constructs, a structural equation modeling (SEM) approach was subsequently employed. SEM allows for the simultaneous estimation of both the measurement and structural components of the model. The structural model was estimated using maximum likelihood with bootstrap standard errors (5000 replications) to obtain robust confidence intervals for indirect effects. This approach enables a formal test of the hypothesised mediation mechanism between perceived usefulness, perceived benefits, and acceptance of AI technologies in tourism. Despite the ordinal origin of the data, factor scores were treated as continuous variables, which is a common approach in social science research.
Due to the non-normal distribution of the data, non-parametric tests were applied. The Kruskal–Wallis test was applied to examine differences across multiple groups (AI usage, trust levels, and perceived impact on quality of life). In addition, the Kruskal–Wallis test results are complemented by effect size estimates (ε2) to assess the magnitude of observed group differences beyond statistical significance. Post-hoc comparisons were performed using the Siegel and Castellan method.
Data processing and statistical analysis were conducted using StataNow 19 SE and Statistica 14 for statistical computations and Microsoft Excel for data preparation.

4. Results

The results section is structured into several interrelated analytical steps that together provide a comprehensive examination of Generation Z students’ perceptions of AI in tourism. It begins with the results of the questionnaire survey, which offer an overview of respondents’ attitudes toward AI applications in travel and tourism based on descriptive statistics. This is followed by factor analysis, aimed at identifying the underlying dimensions that structure these attitudes and verifying the reliability and validity of the measurement instrument. Subsequently, correlation analysis is employed to explore the relationships between the identified factors, providing insight into how perceived usefulness, acceptance, and perceived benefits of AI are interconnected. Finally, differences testing is conducted using non-parametric methods to examine whether these perceptions vary across selected groups defined by socio-demographic characteristics, prior experience with AI technologies in travel, levels of trust in AI in tourism, and broader attitudes toward its impact on quality of life. Together, these analytical procedures enable a detailed and multidimensional understanding of the determinants influencing AI acceptance in tourism among Generation Z.

4.1. Results of the Questionnaire Survey

Table 2 presents the frequency distributions for the use of different forms of AI in travel planning. The results indicate that ChatGPT is the most used tool, with 66.85% of respondents reporting its use, while only 30.70% indicated that they do not use it. In contrast, digital voice assistance tools are used much less frequently, with 77.59% of respondents reporting no use and only 16.57% indicating usage. The use of AI-enabled search platforms and websites appears more balanced, with 48.78% of respondents reporting use and 42.18% indicating non-use. Similarly, reservation systems show a relatively even distribution (44.26% yes vs. 47.65% no). Electronic guides are among the least used tools, with 67.42% of respondents reporting no use and only 18.27% indicating that they use them. The proportion of respondents who were unsure was relatively low across all categories, although slightly higher for electronic guides (14.31%).
Table 3 summarizes two separate constructs: (i) respondents’ perceptions of trust in travel information provided by AI and (ii) the extent to which AI is perceived to improve people’s quality of life. Both variables were measured using individual Likert-scale items ranging from 1 (the least) to 5 (the most).
Trust in AI-generated travel information is moderate overall, with the largest proportion of respondents selecting the value of 3 (49.34%). A further 32.39% expressed a higher level of trust (value 4), while only a small proportion indicated very high trust (2.45%) or very low trust (2.64%).
In terms of perceived impact on quality of life, responses are more positively distributed. The largest share of respondents selected higher values on the scale, with 40.87% choosing value 4 and 16.01% selecting the highest value (5). This suggests that respondents generally perceive AI as having a positive effect on people’s quality of life, although moderate responses (value 3: 32.20%) remain substantial.
Trust in AI-generated travel information is moderate overall, with the most frequent response being value 3. In contrast, perceptions of AI’s impact on quality of life are more positive, with a higher proportion of respondents selecting values 4 and 5.
The descriptive analysis (Table 4) indicates generally moderate to positive attitudes toward AI in tourism. The highest mean value was observed for the statement that AI saves time when planning a trip (ID 3) (mean = 3.669), followed by the belief that AI technologies can make traveling more efficient (ID 15) (mean = 3.461). Respondents also expressed relatively positive perceptions regarding AI’s ability to improve decision-making (ID 7) and provide personalized recommendations (ID 5).
Conversely, lower mean values were recorded for items related to trust in autonomous AI systems, such as robot receptionists (ID 10) (mean = 2.580) and voice assistants in hotel rooms (ID 11) (mean = 2.606), suggesting a certain level of skepticism toward more advanced or human-replacing AI applications.

4.2. Factor Analysis

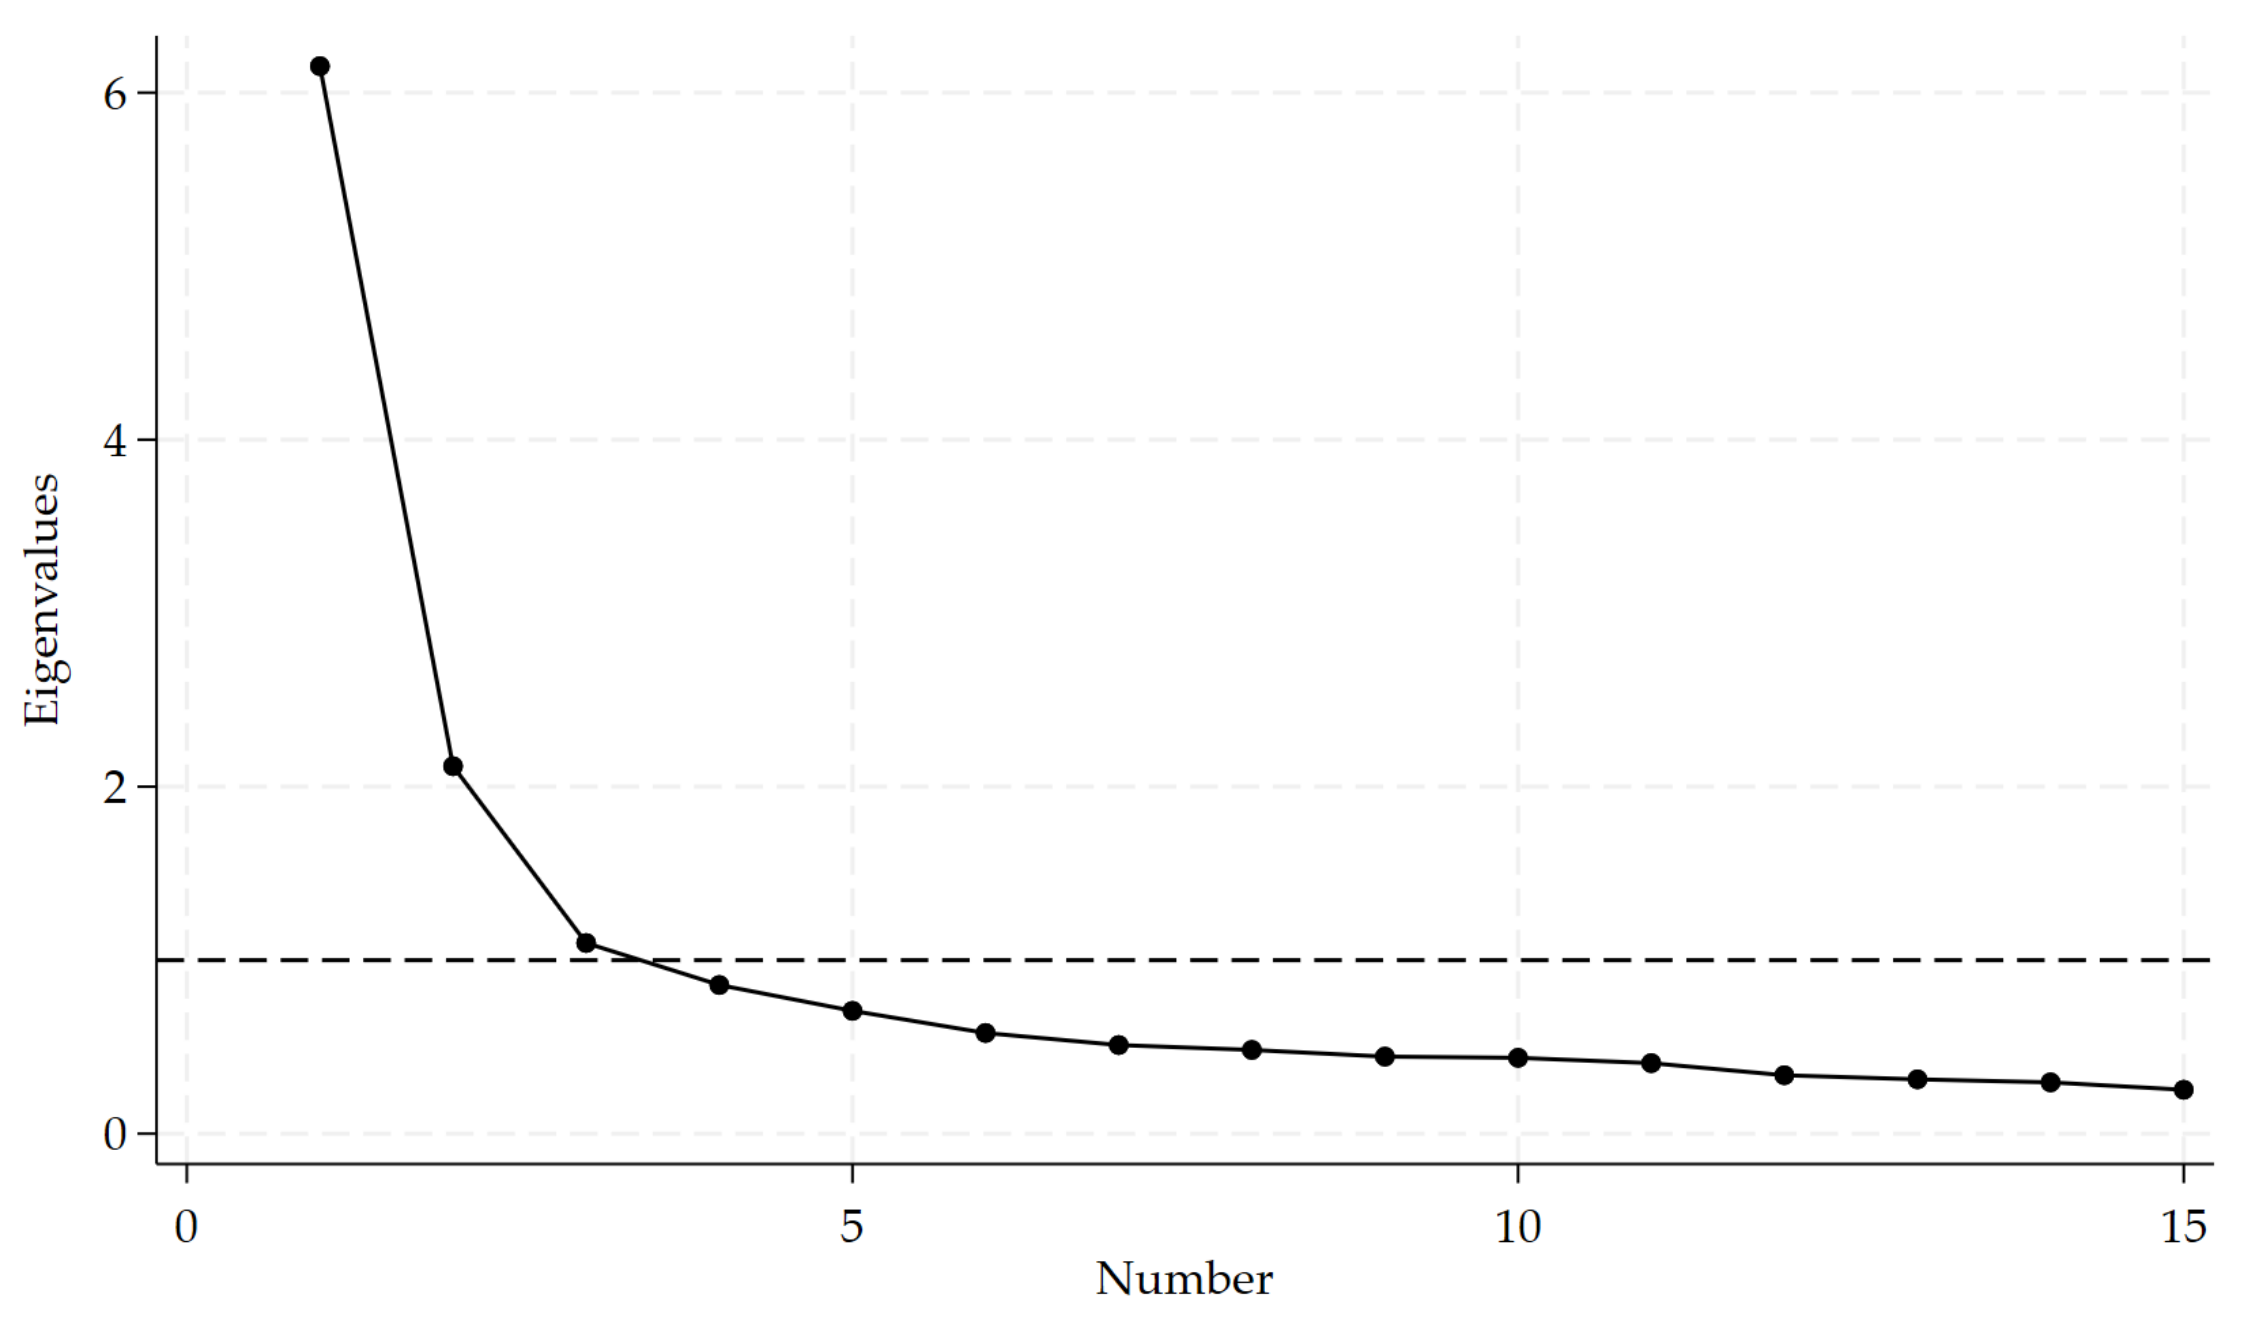
The EFA revealed a three-factor structure (Table 5). The correlation matrix of the rotated factors (Table A1 in the Appendix A) confirmed moderate associations between the constructs, supporting the appropriateness of oblique rotation. The extracted factors collectively accounted for 88.77% of the total variance (Table 6), indicating a high level of explained variance in the dataset. The number of factors was determined based on multiple criteria, including eigenvalues greater than 1 (Table 6) and visual inspection of the scree plot (Figure 1), both of which consistently supported the retention of a three-factor solution. The suitability of the data for factor analysis was confirmed by the Kaiser–Meyer–Olkin (KMO = 0.899) measure and Bartlett’s test of sphericity (χ2 = 3749.198, p < 0.001) (Table 6).
The first factor, Perceived usefulness of AI in tourism, explained 33.93% of the variance and included items related to efficiency, decision-making, and control. The second factor, Acceptance of AI technologies in tourism services, accounted for 25.07% of the variance and captured trust and willingness to use AI-based services. The third factor, Perceived benefits of AI for travel, explained 29.77% of the variance and reflected broader positive outcomes such as enjoyment and personalization. The resulting factor structure demonstrated strong primary loadings and limited secondary cross-loadings. Although certain items related to personalization and efficiency may conceptually overlap with perceived usefulness and perceived benefits, the empirical results showed that the items loaded clearly onto their intended factors, supporting the distinction between perceived usefulness, perceived benefits, and acceptance of AI technologies in tourism.
All factors demonstrated high internal consistency, with Cronbach’s alpha values ranging from 0.812 to 0.876, and an overall reliability of α = 0.894, indicating strong measurement reliability.

4.3. Correlation and Regression Analysis

The correlation analysis (Table 7) confirmed significant positive relationships among all three factors. Perceived usefulness was moderately correlated with acceptance (rs = 0.3466, p < 0.001) and strongly correlated with perceived benefits (rs = 0.5628, p < 0.001). Acceptance of AI technologies also showed a strong positive correlation with perceived benefits (rs = 0.4949, p < 0.001).
To further examine the directional relationships between the identified factors, OLS regression analysis was conducted. In Table 8, the results provide deeper insight into the relative importance of perceived usefulness and perceived benefits in explaining the acceptance of AI technologies in tourism. As a robustness check, an ordered logistic regression was estimated using the dependent variable measured on a Likert-type scale. The results were consistent with the OLS estimates in terms of direction and statistical significance of the effects, indicating that the findings are not sensitive to the choice of estimation method.
The first model confirms Hypothesis 1 that perceived usefulness of AI in tourism significantly influences acceptance of AI technologies in tourism services (β = 0.424, p < 0.001), explaining 11.7% of the variance. The second model shows that perceived benefits of AI for travel have an even stronger effect (β = 0.613, p < 0.001), with substantially higher explanatory power (R2 = 0.269) (Hypothesis 2).
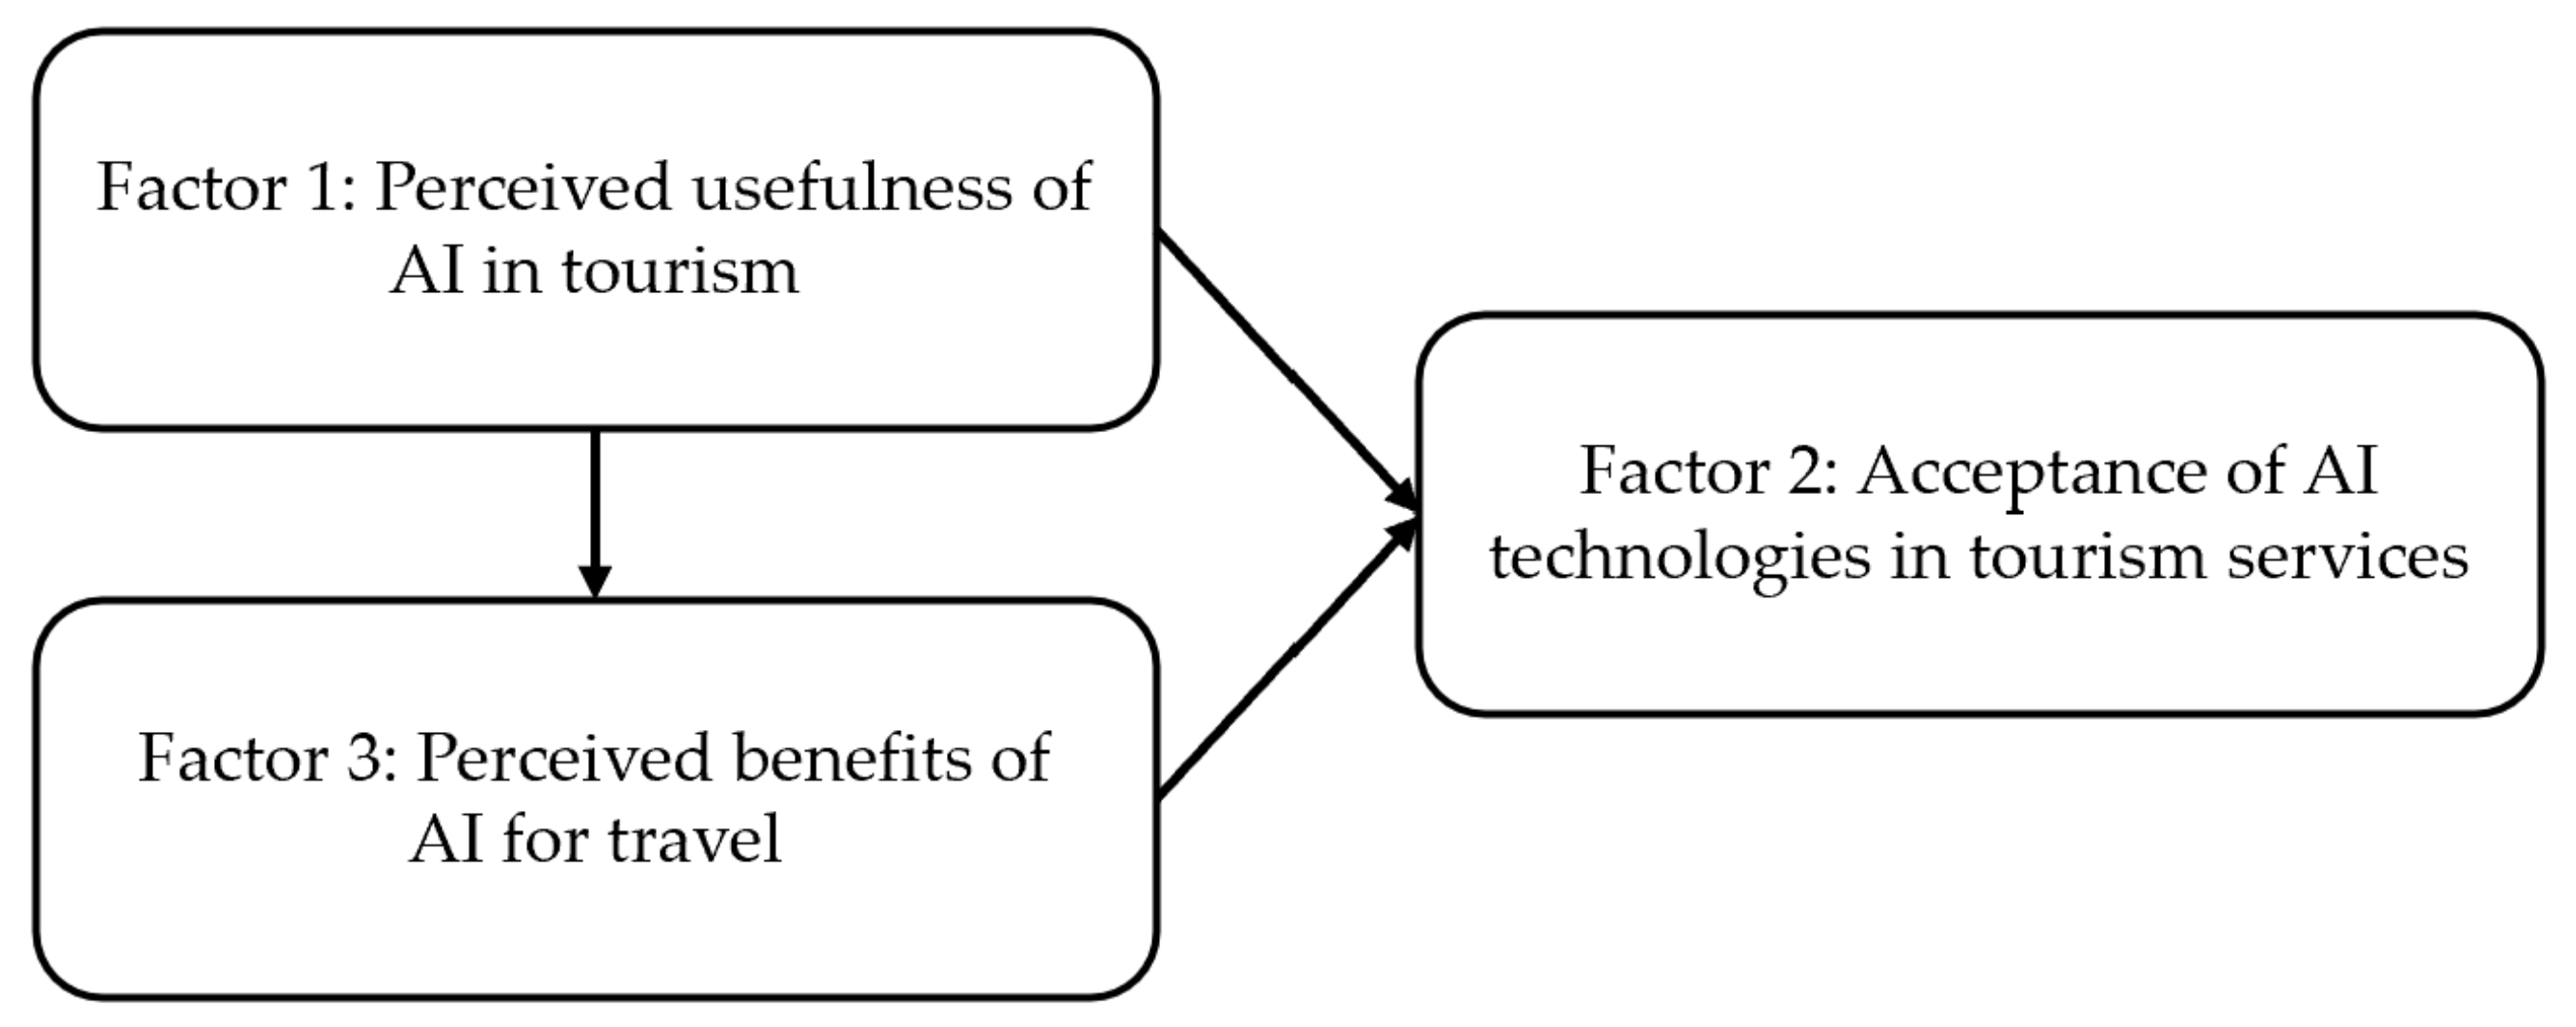
However, when both predictors are included simultaneously, only perceived benefits remain statistically significant (β = 0.566, p < 0.001), while the effect of perceived usefulness becomes insignificant. This finding of the third model suggests that the influence of perceived usefulness on acceptance may be indirect and mediated through perceived benefits.
Finally, the results of the fourth model confirm Hypothesis 3 that the perceived usefulness of AI in tourism significantly affects the perceived benefits of AI for travel (β = 0.597, p < 0.001), explaining 32.5% of their variance. This indicates that usefulness perceptions play a foundational role in shaping the perceived value of AI in tourism.
Figure 2 illustrates the relationships between the identified factors based on regression analysis. The results indicate that the perceived usefulness of AI in tourism significantly influences the perceived benefits of AI for travel, which in turn strongly affects the acceptance of AI technologies in tourism services. While perceived usefulness of AI in tourism initially shows a significant direct effect on acceptance of AI technologies in tourism services, this relationship becomes insignificant when perceived benefits are included in the model, suggesting an indirect effect mediated through perceived benefits.
Table 9 presents the results of the structural equation model. The structural equation model revealed a significant positive effect of perceived usefulness on perceived benefits (β = 0.634, p < 0.001), and a strong positive effect of perceived benefits on acceptance of AI technologies (β = 0.696, p < 0.001). In contrast, the direct effect of perceived usefulness on acceptance was not statistically significant (β = −0.008, p = 0.921), confirming a full mediation effect.
The regression results presented in Table 8 are largely consistent with the SEM results in terms of the direction and significance of the relationships. However, the SEM analysis provides a more accurate representation of the underlying structural relationships by accounting for measurement error and simultaneously estimating all paths. While the regression models suggested a partial mediation effect, the SEM results indicate full mediation, showing that perceived benefits fully transmit the effect of perceived usefulness on acceptance of AI technologies in tourism.

4.4. Differences Testing

The Kruskal–Wallis test (Table 10) identified significant differences in perceptions of AI in tourism based on self-reported use of specific AI tools in travel planning. Respondents who reported using AI tools such as ChatGPT, digital voice assistants, and AI-based search platforms generally exhibited more positive perceptions of perceived usefulness and perceived benefits. Effect sizes (ε2) indicate small to modest differences across groups, suggesting that while statistically significant, the practical magnitude of group differences is limited. Post-hoc comparisons (Table 11) further indicate statistically significant differences particularly between users and non-users of AI tools. However, these results reflect general usage categories rather than frequency or intensity of use. Therefore, Hypothesis 4 is supported in terms of group differences in attitudes associated with AI tool usage.
A strong and consistent pattern was observed regarding trust in AI-generated travel information (Table 12). Higher levels of trust were associated with significantly higher mean ranks across all three factors. The differences were statistically significant at the 0.1% level. Effect size estimates (ε2) indicate medium to large differences across trust levels, particularly for perceived usefulness, suggesting that trust in AI-generated information plays a substantial role in shaping attitudes toward AI in tourism. Post-hoc comparisons (Table 13) confirmed that respondents with the highest trust levels differed significantly from those with lower trust levels. These results support Hypothesis 5 and emphasize trust in AI-generated travel information as a key determinant of perceived usefulness, acceptance, and perceived benefits of AI in tourism.
Similarly, perceptions of AI’s contribution to quality of life significantly influenced all three factors (Table 14). Respondents who believed that AI improves quality of life exhibited substantially higher levels of perceived usefulness, acceptance, and perceived benefits of AI in tourism. Effect size estimates (ε2) indicate large differences across groups, particularly for perceived usefulness, suggesting that perceived impact of AI on quality of life is a strong differentiating factor in shaping attitudes toward AI in tourism. The Kruskal–Wallis test results were highly significant, and post-hoc analysis (Table 15) revealed consistent differences between lower and higher evaluation groups. These findings support Hypothesis 6 and suggest that broader attitudes toward AI strongly shape its acceptance in tourism contexts.
Given the relatively large number of Kruskal–Wallis tests and post-hoc comparisons performed across different AI tools and constructs, the possibility of inflated Type I error cannot be fully excluded. Therefore, results with marginal significance levels should be interpreted with appropriate caution.

4.5. Summary of Hypotheses Testing

The summary of hypotheses (Table 16) and their empirical verification provide a clear synthesis of the study’s key findings and allows for an integrated interpretation of the relationships identified in the analysis.
As shown in Table 16, the results strongly support the existence of significant interrelationships among the core constructs of the study. Specifically, Hypotheses 1, 2, and 3 were confirmed, indicating that the perceived usefulness of AI in tourism plays a central role in shaping both the acceptance of AI technologies and the perceived benefits associated with their use. Moreover, the positive relationship between acceptance and perceived benefits further suggests that these constructs are mutually reinforcing, highlighting a coherent attitudinal framework toward AI among Generation Z respondents.
Hypothesis 4 was supported, revealing that prior experience with specific AI tools plays an important, yet differentiated, role. The results indicate that the use of advanced AI applications, such as ChatGPT, digital voice assistants, and AI-powered search platforms, is significantly associated with higher levels of perceived usefulness and perceived benefits and, in some cases, also acceptance. However, not all AI tools demonstrated consistent effects across all factors, and some relationships were not statistically significant. This suggests that the impact of AI usage on attitudes depends on the type and functionality of the technology, as well as the level of user familiarity.
Hypotheses 5 and 6 were supported, underscoring the importance of broader cognitive and attitudinal determinants. Higher levels of trust in AI-generated travel information were consistently associated with stronger perceptions of usefulness, acceptance, and benefits. Similarly, respondents who perceived AI as contributing positively to overall quality of life reported significantly more favorable attitudes across all dimensions. These findings highlight trust and general technological optimism as key drivers of AI acceptance in tourism.
Results show that experiential and perceptual variables—particularly trust, perceived usefulness, and prior interaction with AI technologies—play a decisive role in shaping the acceptance and evaluation of AI in the tourism context.

5. Discussion

The findings of this study provide important insights into the mechanisms underlying the acceptance of AI in tourism, particularly among Generation Z. The results demonstrate strong and statistically significant relationships among perceived usefulness, perceived benefits, and acceptance of AI technologies, while also revealing a more nuanced structure of these relationships.
A key contribution of this study lies in clarifying the role of perceived usefulness. Consistent with the TAM (Davis, 1989) and its applications in tourism (Ukpabi & Karjaluoto, 2017; Li et al., 2024; Mogaji et al., 2024), perceived usefulness initially exhibits a significant positive effect on acceptance. However, this effect becomes statistically insignificant once perceived benefits are included in the model. This suggests that perceived usefulness does not directly drive acceptance but rather operates indirectly through perceived benefits.
This finding aligns with recent tourism research, which increasingly conceptualizes usefulness in AI contexts in broader terms, including convenience, efficiency, personalization, and decision support (S.-Y. Lin et al., 2020; Zhao et al., 2022; H. Kim et al., 2024). In this sense, perceived benefits capture a more comprehensive evaluation of AI technologies, integrating both functional and experiential dimensions. The results therefore reinforce the argument that perceived usefulness is necessary but not sufficient for AI adoption in tourism (Li et al., 2024; Mogaji et al., 2024).
The strong effect of perceived benefits on acceptance further confirms prior research highlighting personalization, time efficiency, and decision support as central advantages of AI in tourism (Gavalas et al., 2014; Hassannia et al., 2019; López-Naranjo et al., 2025). This interpretation is reinforced by the descriptive results, which show high agreement with statements related to efficiency, time savings, and improved decision-making. Generation Z respondents appear to evaluate AI primarily through the tangible value it delivers to the travel experience rather than its technical capabilities alone.
Trust emerges as another critical determinant of AI acceptance. The results indicate that higher levels of trust in AI-generated travel information are associated with higher perceived usefulness, perceived benefits, and acceptance. This is consistent with prior studies emphasizing trust as a central factor in adoption of AI, particularly in contexts characterized by uncertainty and information asymmetry (Fusté-Forné & Jamal, 2021; Song et al., 2024). In line with research on chatbots and AI systems (Pillai & Sivathanu, 2020; Pereira et al., 2022), the findings suggest that users are more likely to accept AI technologies when they perceive them as reliable, accurate, and supportive of decision-making processes.
The results also highlight the importance of general attitudes toward AI, particularly perceptions of its contribution to quality of life. Respondents who believe that AI positively influences quality of life report significantly higher scores across all three factors. This supports broader technology acceptance research indicating that positive emotional and cognitive predispositions toward technology play a key role in shaping adoption behavior (Vitezić & Perić, 2021; Lu et al., 2019). In tourism, this suggests that acceptance of AI is not limited to specific use cases but is embedded in broader perceptions of technological progress and innovation.
Experience and familiarity with AI tools further strengthen these effects. Consistent with the Unified Theory of Acceptance and Use of Technology-based research (Venkatesh et al., 2003), respondents who actively use AI tools—such as ChatGPT, digital voice assistants, and AI-powered search platforms—report significantly higher levels of perceived usefulness and perceived benefits. This supports previous findings that direct interaction with AI technologies reduces uncertainty and enhances perceived value (S.-Y. Lin et al., 2020; Pereira et al., 2022). However, the results also indicate that not all AI applications are perceived equally, which is consistent with research showing that acceptance depends on task type and context (Ivanov et al., 2022; Lei et al., 2021). ChatGPT and AI-powered search platforms demonstrated the strongest differentiation in user attitudes across multiple dimensions, suggesting that interactive and personalized AI tools are especially valued by Generation Z users. In contrast, reservation systems showed comparatively weaker effects, indicating that respondents may perceive them more as routine digital infrastructure than as innovative AI applications. These findings suggest that tourism and hospitality providers may benefit more from investing in AI solutions that enhance personalization, recommendation quality, and user interaction rather than focusing exclusively on automated transactional systems.
In particular, lower levels of trust in more advanced or human-replacing AI applications, such as robot receptionists or in-room voice assistants, reflect concerns identified in prior studies regarding social presence, emotional adequacy, and the appropriateness of automation in service encounters (Go et al., 2020; Tussyadiah et al., 2020; Jin, 2023). This suggests that, while Generation Z is generally open to AI, their acceptance remains selective and context-dependent. The relatively low mean scores for trust in robot receptionists (mean = 2.580) and in-room voice assistants (mean = 2.606) (see in Table 4) correspond with the lower overall levels observed within the acceptance factor. These findings indicate that Generation Z respondents are more comfortable with AI technologies that support travel planning and information processing than with AI systems replacing direct interpersonal service interactions. From a practical perspective, tourism and hospitality providers should therefore consider implementing AI primarily as a supportive or hybrid service tool rather than a full substitute for human staff. Maintaining opportunities for human interaction alongside AI-based services may improve user comfort, trust, and overall acceptance of AI technologies in tourism environments.
The findings point toward a shift in how AI technologies are evaluated in tourism. Rather than focusing solely on functional efficiency, users—especially Generation Z—prioritize broader experiential and value-based outcomes. This supports recent calls in the literature to extend traditional technology acceptance models by incorporating constructs such as perceived benefits, trust, and experiential value (Li et al., 2024; Mogaji et al., 2024).
From a practical standpoint, tourism providers should therefore move beyond emphasizing technical capabilities and instead focus on clearly communicating and delivering tangible benefits, particularly in terms of personalization, convenience, and enhanced travel experiences. Strengthening trust, ensuring high-quality information, and maintaining an appropriate balance between automation and human interaction remain essential for successful AI implementation in tourism services.

5.1. Theoretical and Practical Implications

This study contributes to the existing literature on technology acceptance in tourism by extending traditional frameworks such as the TAM and the Unified Theory of Acceptance and Use of Technology. While these models emphasize perceived usefulness and ease of use as primary determinants of adoption, the present findings suggest that, in the context of AI, perceived benefits play a more central and direct role.
The identification of perceived benefits as a mediating variable provides an important theoretical refinement. It suggests that usefulness alone may not fully capture how users evaluate AI technologies, particularly in experience-based industries such as tourism. Instead, users appear to translate perceived usefulness into more concrete benefits, such as time savings, improved decision-making, personalization, and enhanced travel experiences. This supports recent research calling for broader conceptualizations of value in AI adoption studies.
Moreover, the study reinforces the importance of trust and general technological attitudes as key determinants of acceptance. In line with emerging research on AI and automation, the findings confirm that acceptance is shaped not only by instrumental factors but also by perceptions of reliability, safety, and broader societal impact. This highlights the need to integrate cognitive, emotional, and social dimensions into future models of AI acceptance in tourism.
Finally, by focusing on Generation Z, the study contributes to a growing body of research examining generational differences in technology adoption. The results suggest that younger users may place greater emphasis on experiential and value-based outcomes, indicating a potential shift in how technology acceptance should be conceptualized in future research.
The findings of this study have several implications for tourism practitioners, including travel agencies, hospitality providers, and destination management organizations. First, the results indicate that focusing solely on the technical capabilities of AI systems is insufficient to ensure user acceptance. Instead, organizations should prioritize clearly on communicating and delivering tangible, experience-oriented benefits particularly in terms of time savings, decision support, personalization, and overall improvements in travel efficiency. These value dimensions appear to be particularly salient for Generation Z, which prioritizes convenience, speed, and tailored experiences.
Second, trust emerges as a critical determinant of AI acceptance. Tourism organizations should therefore place strong emphasis on transparency, reliability, and information quality in AI-enabled services. This includes providing accurate and up-to-date information, clearly communicating how AI-generated recommendations are produced, and implementing robust data privacy safeguards. Building trust in this way can substantially strengthen users’ willingness to rely on AI systems in travel-related decision-making.
Third, the findings highlight the importance of user experience and familiarity in shaping AI adoption. Encouraging repeated interaction with AI tools—such as chatbots, AI-powered search platforms, or recommendation systems—can reduce uncertainty and improve perceived value. This may be achieved through intuitive system design, user-friendly interfaces, and seamless integration of AI tools into existing digital travel ecosystems. For example, hotels introducing AI-based chatbots or voice assistants for younger guests could improve acceptance by clearly communicating the role of these technologies during the first interaction and by offering users the possibility to switch to human assistance when needed. Similarly, AI recommendation systems integrated into travel platforms could provide personalized suggestions based on previous travel preferences while simultaneously explaining why specific recommendations are generated. Such practices may help reduce uncertainty, strengthen trust, and improve the overall user experience, particularly among first-time users of AI-supported tourism services.
Fourth, tourism providers should recognize that acceptance of AI is not purely technology-driven but strongly influenced by experiential and emotional factors. While AI can enhance efficiency and service consistency, human interaction remains important, particularly in complex, ambiguous or emotionally sensitive situations. Accordingly, hybrid service models that integrate AI capabilities with human empathy and flexibility are likely to be the most effective approach.

5.2. Limitations and Future Research Directions

Despite its contributions, this study has several limitations that should be acknowledged. First, the research is based on a sample of university students from Slovakia, which may limit the generalizability of the findings. Although Generation Z represents a key segment of future travelers, their attitudes may differ from those of other demographic groups. Second, although the study focused on Generation Z respondents, the applied age range extended to 28 years in accordance with commonly used generational definitions. Nevertheless, the sample was strongly concentrated around younger university-aged respondents, as reflected by the mean age of 21.19 years and median age of 21 years, while only a small proportion of participants belonged to the upper end of the age range. Potential differences in AI-related attitudes between younger and older members of Generation Z were not examined separately in the present study and therefore represent a potential limitation. Third limitation is that the study intentionally included only respondents with prior experience using AI technologies. Although this ensured informed evaluation of AI applications in tourism, it may have biased the sample toward more technologically confident and innovation-oriented individuals, potentially leading to more favorable attitudes toward AI adoption than would be found among less digitally engaged members of Generation Z. Fourth, this study focuses on perceived usefulness, perceived benefits, and acceptance of AI technologies in tourism, and does not include additional constructs commonly used in technology acceptance research, such as perceived ease of use (TAM) and perceived risk or privacy concerns. The exclusion of these variables was driven by the study’s focus on experiential and benefit-oriented perceptions of AI in tourism rather than general technology usability or risk assessment. However, their omission represents a limitation, as prior research suggests that both ease of use and perceived risk may significantly influence AI adoption. Fifth, the cross-sectional design of the study does not allow for the examination of changes in perceptions over time. As AI technologies continue to evolve and become more integrated into tourism services, user attitudes may also change. User perceptions and acceptance of AI may change quickly as new tools, functionalities, and forms of interaction emerge and become normalized in everyday life. Consequently, the findings should be interpreted within the specific technological context in which the data were collected. Finally, while the study focuses on key perceptual constructs, it does not include all possible variables influencing AI acceptance, such as perceived risk, privacy concerns, or cultural factors, which may also play an important role.
Future research should address these limitations by expanding the scope of analysis. Comparative studies involving different countries, cultures, and age groups would provide a more comprehensive understanding of AI acceptance in tourism. In addition, future research could explore intra-generational differences within Generation Z in greater detail. Longitudinal research could also offer valuable insights into how user perceptions evolve over time as AI technologies become more widespread. Additionally, future studies should explore the role of additional variables, such as ease of use, perceived risk, privacy concerns, and ethical considerations, which are increasingly relevant in the context of AI. Perceived ease of use, a core component of the TAM, may strengthen the direct relationship between perceived usefulness and acceptance of AI technologies, as users are generally more willing to adopt technologies perceived as intuitive and easy to use. Conversely, perceived risk and privacy concerns could weaken the positive influence of perceived benefits on acceptance, particularly in the context of AI-driven tourism services that involve personal data, travel preferences, and automated decision-making. Future research could benefit from integrating additional theoretical perspectives. For example, the Unified Theory of Acceptance and Use of Technology may provide deeper insight into the role of social influence and facilitating conditions in AI adoption, while Uses and Gratifications Theory could help explain the motivational and experiential aspects of AI use among younger travelers. Incorporating such frameworks may contribute to a more comprehensive understanding of AI acceptance in tourism contexts. The integration of qualitative methods could also provide deeper insights into user experiences and expectations. Further research could also examine specific AI applications in greater detail, such as service robots, virtual assistants, or immersive technologies, to better understand how different forms of AI influence user perceptions and behavior.

6. Conclusions

This study provides a comprehensive examination of the relationships between perceived usefulness, perceived benefits, and acceptance of AI technologies in tourism, with a particular focus on Generation Z. By integrating multiple analytical approaches, including factor analysis, correlation analysis, regression modeling, and non-parametric testing, the research offers a robust understanding of how key perceptual and experiential variables shape attitudes toward AI in the tourism context.
The findings confirm that perceived usefulness, perceived benefits, and acceptance are strongly interconnected. However, a key contribution of this study lies in identifying the mediating role of perceived benefits. While perceived usefulness initially appears as a significant predictor of acceptance, its effect becomes insignificant when perceived benefits are included in the model. This indicates that usefulness influences acceptance indirectly, through the benefits users perceive in practice. In this sense, perceived benefits represent a broader and more comprehensive evaluation of AI technologies, incorporating both functional and experiential dimensions.
Furthermore, the results highlight the critical role of trust and general attitudes toward AI. Trust in AI-generated travel information and perceptions of AI’s contribution to quality of life significantly influence all three key constructs. These findings suggest that acceptance of AI in tourism is not driven solely by rational evaluations of utility, but also by broader cognitive and affective factors. Additionally, the study confirms that prior experience with AI tools positively shapes perceptions, reinforcing the importance of familiarity and direct interaction.
The results indicate that Generation Z evaluates AI technologies in tourism not only based on their usefulness but primarily on the value and benefits they provide. This reflects a shift from purely functional assessments toward more holistic, experience-oriented evaluations of technology.


Author Contributions

Conceptualization, P.V., K.M., I.B., and N.K.; methodology, P.V., K.M., I.B., and N.K.; software, P.V.; validation, P.V., K.M., I.B., and N.K.; formal analysis, P.V., K.M., I.B., and N.K.; investigation, P.V., K.M., I.B., and N.K.; resources, P.V., K.M., I.B., and N.K.; data curation, P.V.; writing—original draft preparation, P.V., K.M., I.B., and N.K.; writing—review and editing, P.V., K.M., I.B., and N.K.; visualization, P.V.; supervision, P.V., K.M., I.B., and N.K.; project administration, P.V. and K.M.; funding acquisition, P.V. and K.M. All authors have read and agreed to the published version of the manuscript.

Funding

This research was funded by the Grant Agency for Doctoral Students and Young Researchers of the University of Prešov (grant no. GaPU 22/2025–Changes in Generation Z Travel Behavior), the Scientific Grant Agency of the Ministry of Education, Research, Development and Youth of the Slovak Republic and the Slovak Academy of Sciences (grant no. 1/0241/25–VEGA), and by the Cultural and Educational Grant Agency of the Ministry of Education, Research, Development and Youth of the Slovak Republic (grant No. 001PU-4/2025–KEGA).

Institutional Review Board Statement

Ethical review and approval were waived for this study due to the Ethics Committee of the University of Prešov, the Code of Ethics and Conduct of Research of our University (https://www.unipo.sk/public/media/39741/Code%20of%20Ethics_.pdf) (accessed on 1 November 2025).

Informed Consent Statement

Informed consent was obtained from all subjects involved in the study.

Data Availability Statement

The raw data supporting the conclusions of this article will be made available by the authors on request.

Conflicts of Interest

The authors declare no conflicts of interest.

Abbreviations

The following abbreviations are used in this manuscript:
AIArtificial intelligence
CIConfidence Interval
KMOKaiser–Meyer–Olkin
HTest statistics of Kruskal–Wallis test
MRMean Rank
R2Coefficient of determination
rsSpearman rank correlation coefficient
SDStandard Deviation
SEStandard Error
SEMStructural Equation Modeling
tTest statistics of correlation analysis
TAMTechnology Acceptance Model
βRegression coefficient
ε2Effect size within Kruskal–Wallis test

Appendix A

Table A1. Correlation matrix of the rotated common factors.
FactorFactor 1Factor 2Factor 3
Factor 11
Factor 20.3121
Factor 30.5190.4661

References

  1. Abo-Elsoud, E., & Morsy, J. (2022). The role of artificial intelligence in improving service and strengthening tourist experience in Egypt. Majallat Kulliyat al-Siyahah wa-al-Fanadiq Jamiat al-Mansurah, 11(2), 821–855. [Google Scholar] [CrossRef]
  2. Abou-Shouk, M., Gad, H. E. S., & Abdelhakim, A. (2021). Exploring customers’ attitudes to the adoption of robots in tourism and hospitality. Journal of Hospitality and Tourism Technology, 12(4), 762–776. [Google Scholar] [CrossRef]
  3. Angskun, T., & Angskun, J. (2018). A qualitative attraction ranking model for personalized recommendations. Journal of Hospitality and Tourism Technology, 9(1), 2–13. [Google Scholar] [CrossRef]
  4. Awasthi, P. (2022). Revolutionizing the hospitality and tourism industry through AI-powered personalization: A comprehensive review of AI integration and its impact on customer experience. International Journal Research of Leading Publication, 3(1), 1–12. [Google Scholar]
  5. Baltacı, F., Başer, M. Y., & Çelik, M. (2024). Attitude towards service robots in tourism and hospitality services settings—The effect of multidimensional anthropomorphism and technology readiness. International Journal of Tourism Research, 26(4), e2685. [Google Scholar] [CrossRef]
  6. Belanche, D., Casaló, L. V., & Flavián, C. (2020). Frontline robots in tourism and hospitality: Service enhancement or cost reduction? Electronic Markets, 31(3), 477–492. [Google Scholar] [CrossRef]
  7. Benaddi, L., Souha, A., & Ouaddi, C. (2025). Enhancing smart tourism with chatbots: Focus on the metamodel of domain-specific language and emerging technologies. Expert Systems, 42(7), e70083. [Google Scholar] [CrossRef]
  8. Buhalis, D., Efthymiou, L., & Uzunboylu, N. (2024). Charting the progress of technology adoption in tourism and hospitality in the era of industry 4.0. EuroMed Journal of Business, 19(1), 1–20. [Google Scholar] [CrossRef]
  9. Buhalis, D., Harwood, T., Bogicevic, V., Viglia, G., Beldona, S., & Hofacker, C. (2019). Technological disruptions in services: Lessons from tourism and hospitality. Journal of Service Management, 30(4), 484–506. [Google Scholar] [CrossRef]
  10. Buhalis, D., & Moldavska, I. (2021). Voice assistants in hospitality: Using artificial intelligence for customer service. Journal of Hospitality and Tourism Technology, 13(3), 386–403. [Google Scholar] [CrossRef]
  11. Cai, R., Cain, L., & Jeon, H. (2022). Customers’ perceptions of hotel AI-enabled voice assistants: Does brand matter? International Journal of Contemporary Hospitality Management, 34(8), 2807–2831. [Google Scholar] [CrossRef]
  12. Chang, T.-Z., Kong, W. H., & Bahl, A. (2023). Personal values and travel social media use among Generation Z. Consumer Behavior in Tourism and Hospitality, 18(1), 49–65. [Google Scholar] [CrossRef]
  13. Chase, C. (2016). The economic singularity: Artificial intelligence and the death of capitalism. Three Cs. [Google Scholar]
  14. Chen, C., & Wei, Z. (2024). Role of Artificial Intelligence in travel decision making and tourism product selling. Asia Pacific Journal of Tourism Research, 29(3), 239–253. [Google Scholar] [CrossRef]
  15. Chi, O. H., Denton, G., & Gursoy, D. (2020). Artificially intelligent device use in service delivery: A systematic review, synthesis and research agenda. Journal of Hospitality Marketing & Management, 29(7), 757–786. [Google Scholar] [CrossRef]
  16. Davis, F. D. (1989). Perceived usefulness, perceived ease of use, and user acceptance of information technology. MIS Quarterly, 13(3), 319–340. [Google Scholar] [CrossRef]
  17. Dogru, T., Line, N., Mody, M., Hanks, L., Abbott, J. A., Acikgoz, F., Assaf, A., Bakir, S., Berbekova, A., Bilgihan, A., Dalton, A., Erkmen, E., Geronasso, M., Gomez, D., Graves, S., Iskender, A., Ivanov, S., Kizildag, M., Lee, M., … Zhang, T. (2023). Generative artificial intelligence in the hospitality and tourism industry: Developing a framework for future research. Journal of Hospital & Tourism Research, 49(2), 235–253. [Google Scholar]
  18. El Kafy, J. A., Eissawy, T., & Hasanein, A. A. (2022). Tourists’ perceptions toward using artificial intelligence services in tourism and hospitality. Journal of Tourism Hotels and Heritage, 5(1), 1–20. [Google Scholar] [CrossRef]
  19. Fan, A., Lu, Z., & Mao, Z. E. (2022). To talk or to touch: Unraveling consumer responses to two types of hotel in-room technology. International Journal of Hospitality Management, 101, 103112. [Google Scholar] [CrossRef]
  20. Ferhataj, A. (2024, December 3–5). AI-driven personalization in tourism: Analyzing sustainable travel preferences with machine learning. 8th International Halich Congress on Multidisciplinary Scientific Research (pp. 244–260), Istanbul, Turkey. [Google Scholar]
  21. Ferhataj, A., & Memaj, F. (2025). Challenges and opportunities of AI implementation in tourism: An ethical and technological perspective. Studijos—Verslas—Visuomenė: Dabartis Ir Ateities Įžvalgos, 1(IX), 217–231. [Google Scholar]
  22. Fusté-Forné, F., & Jamal, T. (2021). Co-creating new directions for service robots in hospitality and tourism. Tourism and Hospitality, 2(1), 43–61. [Google Scholar] [CrossRef]
  23. García-Madurga, M.-Á., & Grilló-Méndez, A.-J. (2023). Artificial intelligence in the tourism industry: An overview of reviews. Administrative Sciences, 13(8), 172. [Google Scholar] [CrossRef]
  24. Gavalas, D., Konstantopoulos, C., Mastakas, K., & Pantziou, G. (2014). Mobile recommender systems in tourism. Journal of Network and Computer Applications, 39, 319–333. [Google Scholar] [CrossRef]
  25. Gayathri, N. (2025). Enhancing efficiency of hospitality and tourism sector with artificial intelligence. ComFin Research, 13(S1-i1-Mar), 74–77. [Google Scholar] [CrossRef]
  26. Go, H., Kang, M.-H., & Suh, S. C. (2020). Machine learning of robots in tourism and hospitality: Interactive technology acceptance model (iTAM)—Cutting edge. Tourism Review, 75(4), 625–636. [Google Scholar] [CrossRef]
  27. Gretzel, U., Werthner, H., Koo, C., & Lamsfus, C. (2015). Conceptual foundations for understanding smart tourism ecosystems. Computers in Human Behavior, 50, 558–563. [Google Scholar] [CrossRef]
  28. Gupta, K. P., & Pande, S. (2023). Understanding Generation Z consumers’ revisit intentions to robotic service restaurants. Young Consumers, 24(3), 331–351. [Google Scholar] [CrossRef]
  29. Gursoy, D., Chi, O. H., Lu, L., & Nunkoo, R. (2019). Consumers acceptance of artificially intelligent (AI) device use in service delivery. International Journal of Information Management, 49, 157–169. [Google Scholar] [CrossRef]
  30. Gursoy, D., Li, Y., & Song, H. (2023). ChatGPT and the hospitality and tourism industry: An overview of current trends and future research directions. Journal of Hospitality Marketing & Management, 32(5), 579–592. [Google Scholar] [CrossRef]
  31. Hamed, R. (2021). Egyptian millennial travellers’ willingness to adopt and use travel chatbots: An exploratory study. Journal of Association of Arab Universities for Tourism and Hospitality, 21(1), 49–69. [Google Scholar] [CrossRef]
  32. Hameed, S., & Nigam, A. (2023). Exploring India’s Generation Z perspective on AI enabled internet banking services. Foresight, 25(2), 287–302. [Google Scholar] [CrossRef]
  33. Hassannia, R., Vatankhah Barenji, A., Li, Z., & Alipour, H. (2019). Web-based recommendation system for smart tourism: Multiagent technology. Sustainability, 11(2), 323. [Google Scholar] [CrossRef]
  34. Huang, A., Chao, Y., de la Mora Velasco, E., Bilgihan, A., & Wei, W. (2021). When artificial intelligence meets the hospitality and tourism industry: An assessment framework to inform theory and management. Journal of Hospitality and Tourism Insights, 5(5), 1080–1100. [Google Scholar] [CrossRef]
  35. Ivanov, S., Webster, C., & Seyitoğlu, F. (2022). Humans and/or robots? Tourists’ preferences towards the humans–robots mix in the service delivery system. Service Business, 17(1), 195–231. [Google Scholar] [CrossRef]
  36. Ivasciuc, I.-S., Candrea, A. N., & Ispas, A. (2025). Exploring tourism experiences: The vision of Generation Z versus artificial intelligence. Administrative Sciences, 15(5), 186. [Google Scholar] [CrossRef]
  37. Jamshed, K., Qureshi, M. A., Kishwer, R., & Jamshaid, S. (2024). Chapter 8: The benefits and challenges of artificial intelligence applications in tourism industry: How the hospitality industry in Japan is transforming. In A. Alnoor, G. E. Bayram, C. XinYing, & S. H. A. Shah (Eds.), The role of artificial intelligence in regenerative tourism and green destinations. Emerald Publishing Limited. [Google Scholar]
  38. Jin, D. (2023). Where have the ethical and moral standards landed? Consumer self-congruency and psychological distance in the context of AI-based services. International Hospitality Review, 39(1), 144–167. [Google Scholar] [CrossRef]
  39. Kazak, A. N., Chetyrbok, P. V., & Olieinikov, N. N. (2020). Artificial intelligence in the tourism sphere. IOP Conference Series: Earth and Environmental Science, 421(4), 042020. [Google Scholar] [CrossRef]
  40. Kim, H., So, K. K. F., Shin, S., & Li, J. (2024). Artificial intelligence in hospitality and tourism: Insights from industry practices, research literature, and expert opinions. Journal of Hospitality & Tourism Research, 49(2), 366–385. [Google Scholar] [CrossRef]
  41. Kim, J., Erdem, M., & Kim, B. (2023). Adoption of in-room voice assistants: A cross-cultural study. Journal of Hospitality and Tourism Insights, 7(4), 1911–1933. [Google Scholar] [CrossRef]
  42. Kim, J. H., Kim, J., & Kim, S. (2023). Effects of AI ChatGPT on travelers’ travel decision-making. Tourism Review, 79(5), 1038–1057. [Google Scholar] [CrossRef]
  43. Kim, M., & Qu, H. (2014). Travelers’ behavioral intention toward hotel self-service kiosks usage. International Journal of Contemporary Hospitality Management, 26(2), 225–245. [Google Scholar] [CrossRef]
  44. Lai, I. K. W. (2013). Traveler acceptance of an app-based mobile tour guide. Journal of Hospitality & Tourism Research, 39(3), 401–432. [Google Scholar] [CrossRef]
  45. Lalicic, L., & Weismayer, C. (2021). Consumers’ reasons and perceived value co-creation of using artificial intelligence-enabled travel service agents. Journal of Business Research, 129, 891–901. [Google Scholar] [CrossRef]
  46. Lei, S. I., Shen, H., & Ye, S. (2021). A comparison between chatbot and human service: Customer perception and reuse intention. International Journal of Contemporary Hospitality Management, 33(11), 3977–3995. [Google Scholar] [CrossRef]
  47. Leung, R. (2022). “Konnichiwa, Mr. Robot”: A direct observation of hotel visitors’ attitudes and anxiety regarding service robots. International Hospitality Review, 38(1), 11–27. [Google Scholar] [CrossRef]
  48. Li, F., Zhu, D., & Lin, M.-T. (2024). The technology acceptance model and hospitality and tourism consumers’ intention to use mobile technologies: Meta-analysis and structural equation modeling. Cornell Hospitality Quarterly, 65(4), 461–477. [Google Scholar] [CrossRef]
  49. Limna, P. (2023). Artificial intelligence (AI) in the hospitality industry: A review article. International Journal of Computing Sciences Research, 7, 1306–1317. [Google Scholar] [CrossRef]
  50. Lin, H., Chi, O. H., & Gursoy, D. (2020). Antecedents of customers’ acceptance of artificially intelligent robotic device use in hospitality services. Journal of Hospitality Marketing & Management, 29(5), 530–549. [Google Scholar]
  51. Lin, S.-Y., Juan, P.-J., & Lin, S.-W. (2020). A TAM framework to evaluate the effect of smartphone application on tourism information search behavior of foreign independent travelers. Sustainability, 12(22), 9366. [Google Scholar] [CrossRef]
  52. Ling, E. C., Tussyadiah, I., Liu, A., & Stienmetz, J. (2025). Perceived intelligence of artificially intelligent assistants for travel: Scale development and validation. Journal of Travel Research, 64(2), 299–321. [Google Scholar] [CrossRef]
  53. López-Naranjo, A. L., Puente-Riofrio, M. I., Carrasco-Salazar, V. A., Erazo-Rodríguez, J. D., & Buñay-Guisñan, P. A. (2025). Artificial intelligence in the tourism business: A systematic review. Frontiers in Artificial Intelligence, 8, 1599391. [Google Scholar] [CrossRef]
  54. Lu, L., Cai, R., & Gursoy, D. (2019). Developing and validating a service robot integration willingness scale. Journal of Hospitality Management, 80, 36–51. [Google Scholar] [CrossRef]
  55. Lv, L., Chen, S., & Liu, G. (2024). Alleviating travelers’ privacy concern in personalized recommendations through perceived information autonomy: Strategies via hedge words and communication styles. Journal of Travel Research, 64(8), 1974–1988. [Google Scholar] [CrossRef]
  56. Ma, S., & Zhang, L. (2024). Enhancing tourists’ satisfaction: Leveraging artificial intelligence in the tourism sector. Pacific International Journal, 7(3), 89–98. [Google Scholar] [CrossRef]
  57. Ma, X., Chen, X., & Yuan, C. (2025, February 21–23). Crossroads of AI and tourism: Enhancing destination management and traveler engagement [Conference session]. GAIIS ‘25: Proceedings of the 2025 2nd International Conference on Generative Artificial Intelligence and Information Security (pp. 31–36), Hangzhou, China. [Google Scholar]
  58. Mathiraj, S. P., & Vinayagam, A. (2025). Assessing the impact of AI-based travel applications on travel decision-making behavior among Indian travelers. International Journal for Multidisciplinary Research, 7(5), 1–6. [Google Scholar] [CrossRef]
  59. Mogaji, E., Viglia, G., Srivastava, P., & Kustandini, D. (2024). Is it the end of the technology acceptance model in the era of generative artificial intelligence? International Journal of Contemporary Hospitality Management, 36(10), 3324–3339. [Google Scholar] [CrossRef]
  60. Paliwal, M., Buhalis, D., & Jha, S. (2025). Exploring Generation Z motivations to use metaverse for travel planning. International Journal of Tourism Research, 27(4), e70074. [Google Scholar] [CrossRef]
  61. Pereira, T., Limberger, P. F., Minasi, S. M., & de Souza Meira, J. V. (2022). New insights into consumers’ intention to continue using chatbots in the tourism context. Journal of Quality Assurance in Hospitality & Tourism, 25(4), 754–780. [Google Scholar] [CrossRef]
  62. Pillai, R., & Sivathanu, B. (2020). Adoption of AI-based chatbots for hospitality and tourism. International Journal of Contemporary Hospitality Management, 32(10), 3199–3226. [Google Scholar] [CrossRef]
  63. Pricope Vancia, A. P., Băltescu, C. A., Brătucu, G., Tecău, A. S., Chițu, I. B., & Duguleană, L. (2023). Examining the disruptive potential of Generation Z tourists on the travel industry in the digital age. Sustainability, 15(11), 8756. [Google Scholar] [CrossRef]
  64. Samala, N., Katkam, B., Bellamkonda, R., & Rodriguez, R. (2022). Impact of AI and robotics in the tourism sector: A critical insight. Journal of Tourism Futures, 8(1), 73–87. [Google Scholar] [CrossRef]
  65. Sharma, A. K., & Sharma, R. (2026). Analysing the dark side of artificial intelligence in tourism and its influence on young consumers’ behaviour. Aslib Journal of Information Management, Ahead-of-print. [Google Scholar]
  66. Song, X., Gu, H., & Ling, X. (2024). Understanding trust and rapport in hotel service encounters: Extending the service robot acceptance model. Journal of Hospitality and Tourism Technology, 15(5), 842–861. [Google Scholar] [CrossRef]
  67. Sousa, A. E., Cardoso, P., Dias, F., & Salvador, R. (2024). The use of artificial intelligence systems in tourism and hospitality: The tourists’ perspective. Administrative Sciences, 14(8), 165. [Google Scholar] [CrossRef]
  68. Theodoridis, P. K., & Gkikas, D. C. (2019). How artificial intelligence affects digital marketing. In A. Kavoura, E. Kefallonitis, & A. Giovanis (Eds.), Strategic innovative marketing and tourism (pp. 1319–1327). Springer. [Google Scholar]
  69. Tom Dieck, M. C., & Jung, T. (2015). A theoretical model of mobile augmented reality acceptance in urban heritage tourism. Current Issues in Tourism, 21(2), 154–174. [Google Scholar] [CrossRef]
  70. Tussyadiah, I. P., Zach, F. J., & Wang, J. (2020). Do travelers trust intelligent service robots? Annals of Tourism Research, 81, 102886. [Google Scholar] [CrossRef]
  71. Ukpabi, D., & Karjaluoto, H. (2017). Consumers’ acceptance of information and communications technology in tourism: A review. Telematics and Informatics, 34(5), 618–644. [Google Scholar] [CrossRef]
  72. Venkatesh, V., Morris, M. G., Davis, G. B., & Davis, F. D. (2003). User acceptance of information technology: Toward a unified view. MIS Quarterly, 27(3), 425–478. [Google Scholar] [CrossRef]
  73. Vitezić, V., & Perić, M. (2021). Artificial intelligence acceptance in services: Connecting with Generation Z. The Service Industries Journal, 41(13–14), 926–946. [Google Scholar] [CrossRef]
  74. Wüst, K., & Bremser, K. (2025). Artificial intelligence in tourism trough chatbot support in the booking process—En experimental investigation. Tourism and Hospitality, 6(1), 36. [Google Scholar] [CrossRef]
  75. Xu, H., Law, R., Lovett, J., Luo, J. M., & Liu, L. (2024). Tourist acceptance of ChatGPT in travel services: The mediating role of parasocial interaction. Journal of Travel & Tourism Marketing, 41(7), 955–972. [Google Scholar] [CrossRef]
  76. Zhang, J., Chen, Q., Lu, J., Wang, X., Liu, L., & Feng, Y. (2024). Emotional expression by artificial intelligence chatbots to improve customer satisfaction: Underlying mechanism and boundary conditions. Tourism Management, 100, 104835. [Google Scholar] [CrossRef]
  77. Zhao, Y., Wang, H., & Guo, Z. (2022). Online reservation intention of tourist attractions in the COVID-19 context: An extended technology acceptance model. Sustainability, 14(16), 10395. [Google Scholar] [CrossRef]
Figure 1. Scree plot. Source: own processing.
Tourismhosp 07 00150 g001
Figure 2. Relationships between the identified factors based on regression analysis. Source: own processing.
Tourismhosp 07 00150 g002
Table 1. Questionnaire items.
IDItemResources
1Using AI gives me a sense of control over travel planning.Wüst and Bremser (2025), El Kafy et al. (2022), Hamed (2021)
2Using AI reduces the stress associated with travel planning.Xu et al. (2024), El Kafy et al. (2022), Hamed (2021)
3Using AI saves time when planning a trip.Ferhataj and Memaj (2025), Ferhataj (2024), Wüst and Bremser (2025), Abo-Elsoud and Morsy (2022), Lalicic and Weismayer (2021)
4AI helps obtain more relevant recommendations.Sharma and Sharma (2026), Benaddi et al. (2025), Xu et al. (2024), Lalicic and Weismayer (2021)
5AI helps obtain more personalized recommendations.Benaddi et al. (2025), Xu et al. (2024), Chen and Wei (2024), Lv et al. (2024), Lalicic and Weismayer (2021), Angskun and Angskun (2018)
6AI helps make better decisions about how to travel.Sharma and Sharma (2026), Wüst and Bremser (2025), X. Ma et al. (2025), Ferhataj (2024), Xu et al. (2024), Chen and Wei (2024), J. H. Kim et al. (2023), El Kafy et al. (2022)
7AI helps make better decisions when choosing a destination.Sharma and Sharma (2026), Xu et al. (2024), Chen and Wei (2024), J. H. Kim et al. (2023), El Kafy et al. (2022)
8I would be willing to contact a chatbot or voice assistant if I wanted to change my reservation.El Kafy et al. (2022), Hamed (2021), Buhalis and Moldavska (2021)
9I would feel comfortable checking in at a hotel using an automated kiosk without human assistance.M. Kim and Qu (2014)
10I would trust a robot receptionist to assist guests.Baltacı et al. (2024), Leung (2022), Tussyadiah et al. (2020)
11I would trust voice assistants available in hotel rooms.J. Kim et al. (2023), Cai et al. (2022), Fan et al. (2022)
12I would like AI to remember my travel and accommodation preferences and tailor its services when helping me plan future trips.Benaddi et al. (2025), Chen and Wei (2024), Angskun and Angskun (2018)
13I would like to receive personalized recommendations (e.g., trips, restaurants, attractions) from AI-based systems.Benaddi et al. (2025), Lv et al. (2024), Xu et al. (2024), Angskun and Angskun (2018)
14I believe that AI technologies can make traveling more enjoyable.El Kafy et al. (2022), Abo-Elsoud and Morsy (2022)
15I believe that AI technologies can make traveling more efficient.Wüst and Bremser (2025), Xu et al. (2024), Chen and Wei (2024), El Kafy et al. (2022)
Table 2. Use of AI in travel: frequency distributions.
Form of AINoYesNot Sure
ChatGPT30.70%66.85%2.45%
Digital voice assistance77.59%16.57%5.84%
Search platforms and websites with AI42.18%48.78%9.04%
Reservation systems47.65%44.26%8.10%
Electronic guide67.42%18.27%14.31%
Table 3. Perception of trust in travel information from AI and improvement of people’s quality of life: frequency distributions.
Item12345
Trust in travel information from AI2.64%13.18%49.34%32.39%2.45%
AI improves people’s quality of life2.26%8.66%32.20%40.87%16.01%
Note: values 1–5 denotes level from the least to the most.
Table 4. Description statistics.
IDItemMeanSD12345
1Using AI gives me a sense of control over travel planning.3.0191.1110.92%18.83%36.16%25.61%8.47%
2Using AI reduces the stress associated with travel planning.3.1641.149.79%17.14%32.02%29.00%12.05%
3Using AI saves time when planning a trip.3.6691.083.39%12.24%23.54%35.78%25.05%
4AI helps obtain more relevant recommendations.3.1540.975.08%18.64%38.61%31.07%6.59%
5AI helps obtain more personalized recommendations.3.3071.044.90%17.70%30.51%35.59%11.30%
6AI helps make better decisions about how to travel.3.2431.036.21%15.44%35.78%32.96%9.60%
7AI helps make better decisions when choosing a destination.3.3281.035.65%14.69%31.64%37.29%10.73%
8I would be willing to contact a chatbot or voice assistant if I wanted to change my reservation.2.7611.2320.34%20.90%29.94%19.96%8.85%
9I would feel comfortable checking in at a hotel using an automated kiosk without human assistance.2.9021.2617.51%19.96%29.00%21.85%11.68%
10I would trust a robot receptionist to assist guests.2.5801.1622.79%23.16%32.96%15.44%5.65%
11I would trust voice assistants available in hotel rooms.2.6061.1922.41%25.24%27.50%19.02%5.84%
12I would like AI to remember my travel and accommodation preferences and tailor its services when helping me plan future trips.3.2621.189.42%16.57%27.87%30.70%15.44%
13I would like to receive personalized recommendations (e.g., trips, restaurants, attractions) from AI-based systems.3.2411.118.47%15.44%31.45%32.77%11.86%
14I believe that AI technologies can make traveling more enjoyable.3.3280.963.95%12.99%39.55%33.33%10.17%
15I believe that AI technologies can make traveling more efficient.3.4610.932.82%10.55%35.78%39.36%11.49%
Note: SD denotes standard deviation.
Table 5. Factor loadings after rotation and Cronbach’s α.
IDItem Description and Factor NameFactor LoadingsCronbach’s α
Factor 1: Perceived usefulness of AI in tourism 0.876
1Using AI gives me a sense of control over travel planning.0.755−0.0130.0290.889
2Using AI reduces the stress associated with travel planning.0.672−0.0710.1410.890
3Using AI saves time when planning a trip.0.684−0.0330.1260.889
4AI helps obtain more relevant recommendations.0.8050.081−0.1820.892
5AI helps obtain more personalized recommendations.0.7280.099−0.0580.890
6AI helps make better decisions about how to travel.0.8000.0300.0140.887
7AI helps make better decisions when choosing a destination.0.753−0.0890.1310.888
Factor 2: Acceptance of AI technologies in tourism services 0.839
8I would be willing to contact a chatbot or voice assistant if I wanted to change my reservation.0.0210.7220.1140.891
9I would feel comfortable checking in at a hotel using an automated kiosk without human assistance.0.0030.7890.0250.893
10I would trust a robot receptionist to assist guests.−0.0230.8690.0000.892
11I would trust voice assistants available in hotel rooms.0.0090.835−0.0100.893
Factor 3: Perceived benefits of AI for travel 0.812
12I would like AI to remember my travel and accommodation preferences and tailor its services when helping me plan future trips.0.0600.0230.7230.889
13I would like to receive personalized recommendations (e.g., trips, restaurants, attractions) from AI-based systems.0.0590.0240.7160.889
14I believe that AI technologies can make traveling more enjoyable.0.0410.0530.7980.886
15I believe that AI technologies can make traveling more efficient.−0.0440.0250.8440.889
Note. All factor loadings are reported. Bold values indicate the factor loading corresponding to the factor to which the item was as-signed (primary loading).
Table 6. Factor analysis statistical measures.
Factor Analysis Statistical MeasuresFactor 1Factor 2Factor 3
Eigenvalues6.1532.1181.099
Variance5.0893.7604.466
Proportion33.93%25.07%29.77%
Total Cronbach’s αα = 0.894
Bartlett test of sphericityχ2 = 3749.198, df = 105, p-value = 0.000
Kaiser–Meyer–Olkin Measure of Sampling AdequacyKMO = 0.899
Table 7. Correlation analysis.
Variablesrstp
Factor 1 (Perceived usefulness of AI) and Factor 2 (Acceptance of AI technologies)0.34668.49790.0000 ***
Factor 3 (Perceived benefits of AI) and Factor 2 (Acceptance of AI technologies)0.494913.09830.0000 ***
Factor 1 (Perceived usefulness of AI) and Factor 3 (Perceived benefits of AI)0.562815.65800.0000 ***
Note: rs denotes Spearman rank correlation coefficient; t denotes test statistics; *** indicates significance at the 0.1% level.
Table 8. Regression analysis.
ModelDependent VariableIndependent Variable(s)βSEtp95% CI Lower95% CI UpperR2
1Factor 2Factor 10.4240.0518.390<0.001 ***0.3250.5240.117
2Factor 2Factor 30.6130.04413.940<0.001 ***0.5270.6990.269
3Factor 2Factor 10.0870.0561.5510.122−0.0230.1970.272
Factor 30.5660.05310.590<0.001 ***0.4610.671
4Factor 3Factor 10.5970.03715.950<0.001 ***0.5230.6700.325
Note: β denotes unstandardized regression coefficient; SE denotes standard errors; CI denotes confidence interval; R2 denotes coefficient of determination; *** indicates significance at the 0.1% level.
Table 9. Structural equation model results.
RelationshipStandardized βBootstrap SEzp95% CI Lower95% CI Upper
Factor 1 → Factor 30.6340.0689.32<0.001 ***0.5010.767
Factor 3 → Factor 20.6960.0917.66<0.001 ***0.5180.874
Factor 1 → Factor 2−0.0080.082−0.100.921−0.1700.154
Note: Standardized coefficients β are reported. Standard errors (SE) and p-values are based on bootstrap estimation with 5000 replications. CI denotes confidence interval and *** indicates significance at the 0.1% level.
Table 10. Kruskal–Wallis Test: Differences based on the use of AI in travel planning.
Form of AIFactorMR NoMR YesMR Not SureHpε2
ChatGPTFactor 1215.4240.4301.023.5950.0000 ***0.041
Factor 2259.8252.0282.04.8280.08940.005
Factor 3217.4246.9293.815.5330.0004 ***0.026
Digital voice assistanceFactor 1251.0315.0326.517.8010.0001 ***0.030
Factor 2256.0299.6303.47.8670.0196 *0.011
Factor 3253.1307.1320.913.3060.0013 **0.021
Search platforms and websites with AIFactor 1230.8297.5260.222.8070.0000 ***0.039
Factor 2253.8285.0220.79.6290.0081 **0.015
Factor 3236.8296.7236.820.3620.0000 ***0.035
Reservation systemsFactor 1251.3281.0271.04.6280.09890.005
Factor 2263.4271.0254.40.5700.75210.003
Factor 3245.3283.8290.28.9150.0116 *0.013
Electronic guideFactor 1256.0318.0246.513.9210.0009 ***0.022
Factor 2267.8264.4259.40.2040.90280.003
Factor 3260.3287.5265.22.4110.29950.000
Note: MR means Mean Rank; H denotes test statistics; * indicates significance at the 5% level, ** at the 1% level, and *** at the 0.1% level; ε2 denotes effect size.
Table 11. Siegel and Castellan post-hoc test (Hypothesis 4).
Factor 1Factor 2Factor 3
Form of AINo vs. YesNo vs. Not SureYes vs. Not SureNo vs. YesNo vs. Not SureYes vs. Not SureNo vs. YesNo vs. Not SureYes vs. Not Sure
ChatGPT0.0000 ***1.00000.0157 *0.0017 **1.00000.20160.0000 ***0.51281.0000
Digital voice assistance0.0011 **0.0246 *1.00000.0465 *0.29081.00000.0082 **0.05301.0000
Search platforms and websites with AI0.0000 ***0.68730.36620.07770.52430.0230 *0.0001 ***1.00000.0392 *
Reservation systems0.09801.00001.00001.00001.00001.00000.0168 *0.22941.0000
Electronic guide0.0013 **1.00000.0071 **1.00001.00001.00000.36691.00001.0000
Note: * indicates significance at the 5% level, ** at the 1% level, and *** at the 0.1% level.
Table 12. Kruskal–Wallis Test: Differences based on the level of trust in travel information from AI.
FactorMR 1MR 2MR 3MR 4MR 5Hpε2
Factor 1111.7160.5245.1342.1413.2106.7940.0000 ***0.195
Factor 2169.7201.4257.6306.3353.735.0560.0000 ***0.059
Factor 3125.6184.0252.0326.1345.264.3520.0000 ***0.115
Note: MR means Mean Rank; values 1–5 denotes level from the least to the most; H denotes test statistics; *** indicates significance at the 0.1% level; ε2 denotes effect size.
Table 13. Siegel and Castellan post-hoc test (Hypothesis 5).
Factor1 vs. 21 vs. 31 vs. 41 vs. 52 vs. 32 vs. 42 vs. 53 vs. 43 vs. 54 vs. 5
Factor 11.00000.0152 *0.0000 ***0.0000 ***0.0004 ***0.0000 ***0.0000 ***0.0000 ***0.0012 **1.0000
Factor 21.00000.36780.0135 *0.0185 *0.06550.0000 ***0.0102 *0.0120 *0.27531.0000
Factor 31.00000.02680.0000 ***0.0020 **0.0099 **0.0000 ***0.0051 **0.0000 ***0.32631.0000
Note: Values 1–5 denotes level from the least to the most; * indicates significance at the 5% level, ** at the 1% level, and *** at the 0.1% level.
Table 14. Kruskal–Wallis Test: Differences based on the extent to which people think AI improves people’s quality of life.
FactorMR 1MR 2MR 3MR 4MR 5Hpε2
Factor 151.1134.4223.4285.8402.9142.3350.0000 ***0.263
Factor 2167.8164.8228.3291.8344.764.1560.0000 ***0.114
Factor 3136.6149.6223.9292.1365.490.6370.0000 ***0.165
Note: MR means Mean Rank; values 1–5 denotes level from the least to the most; H denotes test statistics; *** indicates significance at the 0.1% level; ε2 denotes effect size.
Table 15. Siegel and Castellan post-hoc test (Hypothesis 6).
Factor1 vs. 21 vs. 31 vs. 41 vs. 52 vs. 32 vs. 42 vs. 53 vs. 43 vs. 54 vs. 5
Factor 10.93970.0017 **0.0000 ***0.0000 ***0.0048 **0.0000 ***0.0000 ***0.0007 ***0.0000 ***0.0000 ***
Factor 21.00001.00000.06400.0018 **0.12840.0000 ***0.0000 ***0.0005 ***0.0000 ***0.0707
Factor 31.00000.56830.0063 **0.0000 ***0.0355 *0.0000 ***0.0000 ***0.0001 ***0.0000 ***0.0019 **
Note: Values 1–5 denotes level from the least to the most; * indicates significance at the 5% level, ** at the 1% level, and *** at the 0.1% level.
Table 16. Summary of hypotheses and results.
HypothesisSupported/Rejected
1: Perceived usefulness of AI in tourism has a positive and statistically significant effect on acceptance of AI technologies in tourism services.Supported in simple regression (Model 1); not supported in combined model (Model 3).
2: Perceived benefits of AI for travel have a positive and statistically significant effect on acceptance of AI technologies in tourism services.Supported (Models 2 and 3).
3: Perceived usefulness of AI in tourism has a positive and statistically significant effect on perceived benefits of AI for travel.Supported (Model 4).
4: The use of AI tools in travel planning (e.g., chatbots, voice assistants, AI search platforms) significantly influences perceived usefulness, acceptance, and perceived benefits of AI in tourism.Supported for:
ChatGPT–perceived usefulness, perceived benefits.
Digital voice assistance–perceived usefulness, acceptance, perceived benefits.
Search platforms and websites with AI–perceived usefulness, acceptance, perceived benefits.
Reservation systems–perceived benefits.
Electronic guide–perceived usefulness.
Rejected for all other constraining factors.
5: Higher levels of trust in AI-generated travel information are associated with higher perceived usefulness, acceptance, and perceived benefits of AI in tourism.Supported for all factors.
6: Perceptions of AI’s contribution to quality of life significantly influence perceived usefulness, acceptance, and perceived benefits of AI in tourism.Supported for all factors.
Disclaimer/Publisher’s Note: The statements, opinions and data contained in all publications are solely those of the individual author(s) and contributor(s) and not of MDPI and/or the editor(s). MDPI and/or the editor(s) disclaim responsibility for any injury to people or property resulting from any ideas, methods, instructions or products referred to in the content.