Article

Determining Factors of Tourism Resilience in the Face of Global Crises: Adaptability and Competitiveness

by
Juanita Angélica Monroy Mongua
1 and
Luz Natalia Tobón Perilla
2,*
1
Faculty of Economic and Administrative Sciences, Universidad Pedagógica y Tecnológica de Colombia, Tunja 15001, Colombia
2
School of Business Administration, Faculty of Economic and Administrative Sciences, Universidad Pedagógica y Tecnológica de Colombia, Tunja 15001, Colombia
*
Author to whom correspondence should be addressed.
Tour. Hosp. 2026, 7(4), 96; https://doi.org/10.3390/tourhosp7040096
Submission received: 14 February 2026 / Revised: 10 March 2026 / Accepted: 18 March 2026 / Published: 2 April 2026

Abstract

This study examines the determinants of tourism resilience and recovery following global crises using a comparative cross-country approach. A composite Tourism Resilience Index (TRI) is constructed based on post-crisis recovery in tourism employment, tourism GDP and international arrivals, and its determinants are analyzed through descriptive, correlational and exploratory multivariate regression analysis. The results reveal significant heterogeneity in resilience trajectories across countries, indicating that income level alone does not explain recovery patterns. Institutional and structural factors, including the degree of economic liberalization and market composition, play a critical role in shaping post-crisis tourism performance. These findings contribute to the literature on tourism resilience by providing empirical evidence with policy implications for improving adaptive capacity in tourism-dependent economies. Furthermore, the results highlight the multidimensional nature of tourism resilience and provide evidence-based insights for the design of differentiated policy strategies aimed at strengthening the sector’s capacity to withstand future global crises.

1. Introduction

The tourism sector is widely recognized as one of the most vulnerable economic activities to global crises, including financial downturns, pandemics and geopolitical conflicts (Yeh, 2021). Due to its strong dependence on discretionary consumption, international mobility and consumer confidence, tourism tends to experience sharper contractions than other sectors during periods of global instability (Mensah & Boakye, 2021). The contractions caused by the crises affect the sustainability of tourism companies and the sector’s job opportunities (Khawaja et al., 2021; Bauzá Martorell & Melgosa Arcos, 2020). However, empirical evidence shows that the magnitude of these impacts and the speed of subsequent recovery vary significantly across countries (Nunes & Cooke, 2021).
In order to address the situation by country, we begin with the most critical case, China, a country that implemented a zero-COVID policy until 2022 (Ge, 2023), reopening its borders to international tourism in January 2023 (The Lancet Regional Health, 2023). As the epicenter of the main crisis analyzed, China has been affected by factors that impact the hotel industry (Tang et al., 2025; Hao et al., 2020). Measures to recover tourism in China have mainly focused on prices, leading to higher market shares for companies that have shown flexibility (Luo et al., 2021).
In Latin American countries, global conflicts and health problems also influence tourism activity. Colombia, thanks to policies to attract tourists, has become an alternative for new travelers (Mestanza-Ramon & Jimenez-Caballero, 2021). Furthermore, qualitative factors such as responsiveness, reliability, safety, and empathy in customer service can be crucial for resilience (Vergara-Schmalbach et al., 2021). Adaptability and innovation are also key factors in the sustainable tourism industry (Tobón et al., 2022). In Mexico, Colombia, and Ecuador, one strategy that has contributed to the recovery of consumption of tourism services, among other goods, is the accessibility of online shopping and payments (Larios-Gómez et al., 2021). In Peru, the pandemic paralyzed the tourism sector and negatively affected the employment of artisans (Luz Arelis et al., 2021). Added to this crisis in Peru are global geopolitical issues and, mainly, an internal government crisis that hinders the reactivation of tourism in this important South American destination (Sánchez, 2020).
In Finland, R&D platforms and resources are promoted and used to develop attractive products and services (Sauvola et al., 2025). Portugal, for its part, launched a digital marketing and virtual experiences strategy to promote its destinations as the next big thing after the pandemic (McTeigue et al., 2021). In Greece, government support and funding is focused on the strongest companies, leaving small businesses unprotected (Meramveliotakis & Manioudis, 2021). Israel, for its part, has focused on training social skills in professionals related to the provision of services such as hospitality and tourism (K. Lee et al., 2021). In other global scenarios, there is the case of South Africa, where self-management and agility of response are suggested for micro-businesses associated with tourism and hospitality; public policy has reduced border access restrictions (Booyens et al., 2022). In New Zealand, restrictive policies to mitigate the effect of the pandemic led to closures and declines in revenue for weaker companies, affecting the economy and employment (Yeoman et al., 2022).
Globally, the concept of tourism resilience has gained increasing attention as a framework to understand these heterogeneous recovery patterns (Lamhour et al., 2023). Beyond the simple notion of returning to pre-crisis levels, resilience emphasizes the capacity of tourism systems to adapt, reorganize and transform in response to external shocks (King et al., 2021). The existing literature suggests that factors such as economic development, institutional quality, market structure and dependence on international tourism flows play a crucial role in shaping recovery trajectories (S. Lee & Pennington, 2025). Nevertheless, comparative empirical evidence across countries with different structural characteristics remains limited.
This study addresses this gap by analyzing the determinants of tourism resilience and recovery in a sample of twelve countries from different continents and levels of development over the period 2015–2022. By combining multiple dimensions of recovery into a composite resilience index and applying a comparative quantitative approach, the research seeks to answer the following question: Which structural economic factors are associated with differentiated trajectories of tourism resilience and recovery in the context of global crises?
The contribution of this paper is threefold. First, it provides a comparative international assessment of tourism resilience using a multidimensional index. Second, it offers empirical evidence on the role of economic and institutional factors in shaping recovery outcomes. Third, it contributes to ongoing debates on whether economic liberalization enhances or constrains the resilience of the tourism sector in times of crisis.

2. Literature Review and Theoretical Framework

2.1. Global Crises and Tourism Vulnerability

Tourism is widely recognized as one of the economic sectors most exposed to global crises due to its dependence on international mobility, discretionary consumption, and risk perception (Gössling et al., 2021; Song et al., 2021). Financial downturns, health emergencies, and geopolitical disruptions tend to generate immediate contractions in tourism demand, employment, and investment, often exceeding those observed in other economic sectors (Brida et al., 2020). Analyses of overnight stays in different destinations indicate a greater impact on income from accommodation and tourist services in general, which immediately affects employment (Bauzá Martorell & Melgosa Arcos, 2020).
Recent studies emphasize that the intensity of tourism downturns and subsequent recovery paths vary significantly across countries and destinations. Tobón et al. (2022), using evidence, show that expectations of recovery and perceived risk strongly shape tourists’ behavioral responses after crises, influencing the speed and pattern of demand recovery; this may be due to each country’s policies on tourist arrivals, the stability and security offered by the destination, and the experiences offered by the domestic industry (Perelló, 2022). Similarly, Casado et al. (2021) highlight that structural characteristics and market composition condition post-crisis tourism dynamics, reinforcing the need for comparative analyses.
In addition, UN Tourism has highlighted that the economic cost of institutional unpreparedness in the tourism sector is considerable. According to the organization, the absence of adequate crisis preparedness mechanisms contributed to an estimated loss of $1.3 trillion in international tourism export revenues in 2020 alone (UN Tourism, 2025c). This figure underscores the relevance of incorporating institutional variables into empirical models of tourism resilience, as the ability to mitigate losses during crises is closely linked to the regulatory and fiscal tools available to destination managers and public policy makers.

2.2. Conceptual Approaches to Tourism Resilience

The concept of tourism resilience has evolved from a narrow focus on recovery toward a broader understanding of adaptive and transformative capacity. Drawing from ecological and socio-economic resilience theory (Holling, 1973; Folke, 2016), tourism resilience is understood as the ability of destinations and tourism systems to absorb shocks, adapt to changing conditions, and reorganize without losing core functions (Zheng et al., 2021).
Recent contributions conceptualize destinations as complex systems of flows and interactions. (Carswell et al., 2023) argue that resilience emerges through collaborative learning, adaptive governance, and stakeholder coordination in post-crisis contexts. Complementarily, (Lamhour et al., 2023) emphasize that tourism resilience is inherently multidimensional, integrating economic, social, institutional, and environmental dimensions, which supports the construction of composite resilience indices in empirical research.

2.3. Structural and Institutional Determinants of Tourism Resilience

A growing body of literature identifies structural and institutional factors as key determinants of tourism resilience. Income level and economic development are often associated with greater fiscal capacity to implement countercyclical policies; however, empirical evidence suggests that higher income does not automatically translate into faster tourism recovery (Martin & Sunley, 2015; S. Lee & Pennington, 2025).
Institutional quality and governance arrangements also play a central role. (Espinoza et al., 2024), in a study, demonstrate that regulatory flexibility, stakeholder participation, and adaptive governance enhance resilience in tourism-related activities. Along the same lines, García Moreno and Fernández Alcantud (2020) propose five key approaches for the recovery of tourism activities: governance, innovation, technology, sustainability, and accessibility. It is also worth highlighting the importance of knowledge and the use of Tourism Intelligence Systems that enable sound decision-making. For example, the design of gastronomic, rural tourism, and agricultural experiences has contributed to an increase in tourism activity in certain destinations (Chávez, 2022).
Furthermore, economies highly dependent on international tourism flows tend to exhibit greater vulnerability to global shocks, particularly during border closures and mobility restrictions (Gössling et al., 2021; World Tourism Organization, 2023). These findings justify the integration of structural exposure variables when explaining heterogeneous resilience outcomes.

2.4. Tourism Resilience, Governance, and Demand Side Dynamics

Beyond supply side and institutional factors, recent research highlights the importance of demand-side dynamics in shaping tourism resilience. Tourists’ perceptions, loyalty, and post-visit behavior influence the stability and recovery of tourism demand following crises (Prayag et al., 2020).
Some studies provide empirical support for this perspective. (Balaskas et al., 2025) show that responsible tourist behavior contributes to destination sustainability and long-term resilience, while (Leyva et al., 2025) demonstrate that perceived experience quality and loyalty enhance demand stability. Additionally, (Pécsek & Gyurkó, 2025) argue that diversified and experience-based destination offerings reduce vulnerability to external shocks, reinforcing adaptive capacity.
Together, these contributions support an integrated analytical framework in which tourism resilience emerges from the interaction between structural conditions, institutional arrangements, and demand-side behavior, an approach consistent with the empirical model adopted in this study.
From an applicability standpoint, resilience as a measurable factor has gained relevance in recent years. In 2021, the Pacific Asia Travel Association (PATA) launched the Tourism Destination Resilience Program, through which it developed assessment tools that measure resilience in three phases: the ability to take preventive action before a crisis, the effectiveness of responses during a crisis, and the ability to recover afterward (PATA, 2025).
The institutional dimension of tourism resilience has recently been formalized through multilateral public policy initiatives. In 2025, UN Tourism launched the Safe and Secure Destinations (SAFE - D) initiative, a global framework designed to strengthen crisis preparedness, response, and recovery in tourist destinations worldwide (UN Tourism, 2025b). The initiative notes that the increasing frequency and diversity of crises affecting tourism, from climate threats and health emergencies to geopolitical instability and infrastructure failures, constitute a structural challenge that requires governance arrangements. In operational terms, UN Tourism’s SAFE-D framework also sets out three phases for dealing with crises: pre, during, and post.

2.5. Heterogeneity in Recovery: Global Patterns and Differences by Level of Development

Tourism recovery varies significantly between countries, due to factors such as dependence on international tourism, economic diversification, fiscal capacity, and the policies implemented (Yeh, 2021). According to Mensah and Boakye (2021), these structural differences directly influence the magnitude of the impact and the speed of recovery, which is clearly evident in the trajectories of tourism GDP, employment, and international arrivals.
For their part, Navarro-Chávez et al. (2019) confirm that even in developing countries, dissimilar trajectories can be observed, influenced by their economic model, the proportion of domestic tourism compared to international tourism, and the design of different reactivation strategies. Similarly, Pyke et al. (2021) point out that the limited fiscal capacity of many emerging economies restricts the implementation of effective countercyclical policies, which increases vulnerability to tourism shocks. Innovation in institutional strategies has also made a difference; have positive impacts on tourist arrivals and the recovery of sectoral GDP (Nunes & Cooke, 2021).
The most recent data from international organizations confirm that the heterogeneous patterns of recovery persisted beyond the initial post-crisis phase. According to (UN Tourism, 2025a), approximately 1.4 billion international tourist arrivals were recorded worldwide in 2024, marking the effective recovery of global tourism from the worst crisis in the sector’s history. However, this aggregate figure masks significant regional disparities. While Europe exceeded pre-pandemic arrival levels by 1% and the Middle East consolidated its position as the region with the fastest recovery, Asia and the Pacific barely reached 87% of 2019 levels at the end of 2024, compared to 66% at the end of 2023.

3. Materials and Methods

The sample consists of twelve countries representing different levels of economic development and tourism structures: Colombia, Mexico, Peru, Portugal, Finland, Greece, India, China, Israel, Mauritius, South Africa and New Zealand. For analytical purposes, countries are classified into three groups: emerging economies (Colombia, Mexico, Peru, India and South Africa), developed economies (Portugal, Finland, Greece and New Zealand), and special cases (China, Israel and Mauritius). The latter category includes economies that, due to their unique geopolitical conditions, atypical tourism structures or distinctive crisis-response trajectories, do not fit neatly into the conventional emerging–developed classification. The analysis covers the period 2015–2022, allowing the identification of pre-crisis conditions, the peak of the crisis and the initial recovery phase.
Data were obtained from official international sources to ensure comparability: tourism employment and tourism GDP from the World Travel & Tourism Council (WTTC) and the OECD; GDP per capita from the World Bank; international tourist arrivals from the World Tourism Organization (UNWTO); and the Index of Economic Freedom (IEF) from the Heritage Foundation.
Tourism resilience is measured through a composite index that captures post-crisis recovery relative to pre-crisis levels. The index combines recovery in tourism GDP (weighted 35%), international arrivals (35%) and tourism employment (30%), reflecting the relative importance of economic output and demand recovery, while acknowledging the structural role of employment in tourism-dependent economies. The empirical strategy comprises three stages: (i) descriptive analysis of recovery trajectories, (ii) Pearson correlation analysis to explore bivariate associations between variables, and (iii) an exploratory multivariate regression model estimated by Ordinary Least Squares, adapting the model applied by Khawaja et al. (2021), and Sagi (2023), to identify potential determinants of tourism resilience. Given the limited sample size, the regression results are interpreted as indicative associations rather than causal relationships.
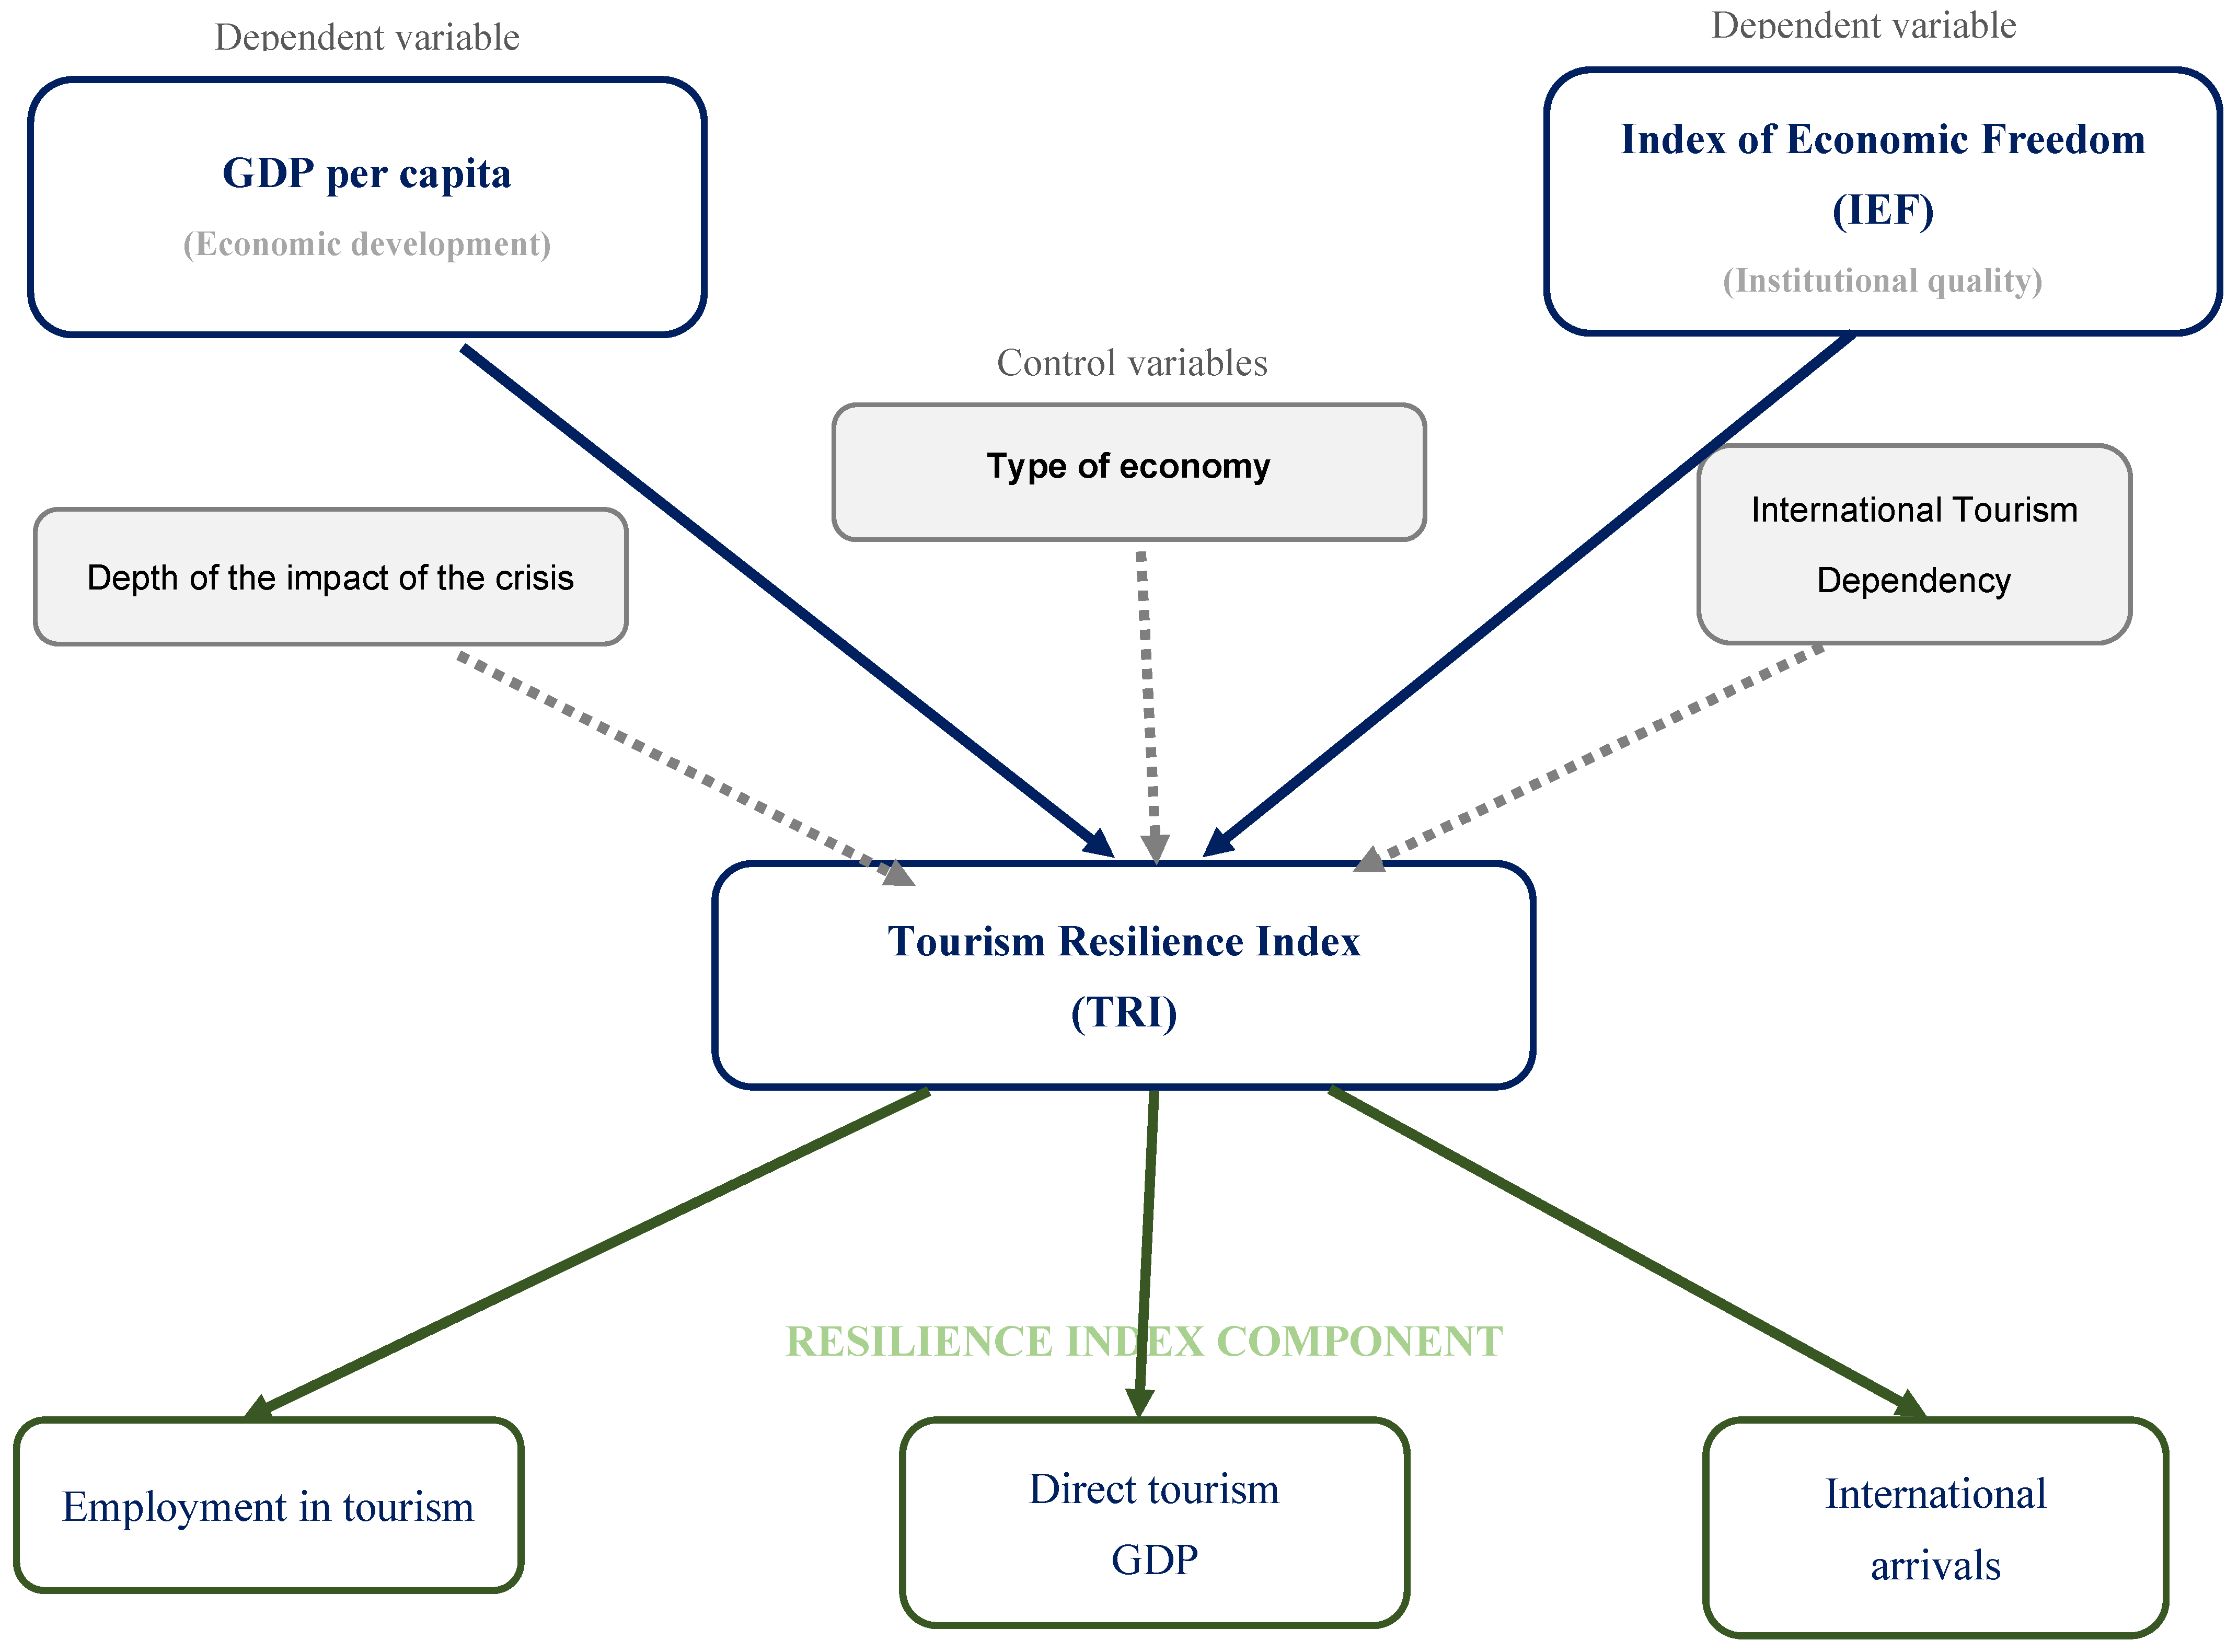
In order to explain the relationship between the variables obtained from the review of various bibliographic sources, Figure 1 was developed in the inferential analyses:
The equation representing the OLS regression model is:
TR2022i = β0 + β1ln(GDPpc)i + β2IEFi + β3CIDi + β4ITDi + β5EMEi + εi
where
TR2022i = Tourism Recovery Index for country i (dependent variable)
β0 = Constant or intercept
β1ln(GDPpc)i = Natural logarithm of GDP per capita for country i
β2IEFi = Index of Economic Freedom for country i
β3CIDi = Crisis impact depth for country i
β4ITDi = International tourism dependence for country i
β5EMEi = Dummy variable for emerging economies (1 emerging, 0 developed)
εi = Error term

4. Results

This section presents the empirical results obtained from the comparative analysis of twelve countries during the period 2015–2022, with the aim of evaluating the different trajectories of resilience and recovery of the tourism sector in the face of global crises. The results are organized into four sections: descriptive analysis, analysis of the tourism resilience index, correlational analysis, and multivariate analysis.

4.1. Recovery Trajectories of the Tourism Sector

The descriptive analysis shows marked structural heterogeneity in the tourism sector among the countries analyzed. Tourism employment shows the greatest relative dispersion, with a coefficient of variation of over 200%, reflecting substantial differences in the scale and weight of the sector between developed and emerging economies. Likewise, tourism GDP as a percentage of total GDP shows significant variations, indicating different degrees of tourism specialization.
During the year when the crisis had the greatest impact (2020), all countries experienced sharp declines in employment and tourism GDP. However, the recovery phase (2022) reveals different trajectories. Emerging economies, on average, show a more dynamic recovery in tourism employment, while several developed economies show a slower recovery, particularly in the labor market, despite having higher levels of per capita income. Table 1 summarizes the behavior of variables related to tourism resilience and recovery.
Tourism employment shows the greatest heterogeneity among the variables studied, with a coefficient of variation of 248.63%. The difference between the mean of 2,837,582 and the median of 499,055 indicates a distribution skewed toward high values, where large-scale economies such as India and China raise the average. The observed range from 22,500 to more than 27 million employees reflects radically different tourism structures depending on the population size and development model of each country.
Tourism GDP as a proportion of total GDP has an average of 4.24% and a coefficient of variation of 60.88%. Values range from 0.08% to 9.30%, and the median of 3.40% is below the average, suggesting that most countries maintain a moderate dependence on tourism, while a few outliers raise the average.
Per capita GDP shows considerable dispersion (coefficient of variation = 77.22%), with values ranging from USD 1584 to USD 46,016. This range is due to the sample design, which deliberately included countries with different levels of development in order to assess their impact on resilience. International arrivals have the second highest coefficient of variation at 149.10%. The median of 4.6 million tourists, well below the average of 16.4 million, shows the concentration of flows in a small group of established destinations.
Finally, the Index of Economic Freedom shows the lowest dispersion coefficient of variation = 12.78%, with an average of 66.66 points, indicating relative institutional convergence among the countries in the sample.

4.1.1. Temporal Analysis: Pre-Crisis, Crisis, and Recovery

Temporal segmentation allows us to identify different patterns of impact and recovery. During the crisis, particularly in 2020 and 2021, tourism employment contracted by 10.13%, while tourism GDP fell by 44.29% and international arrivals plummeted by 65.48%. Table 2 facilitates understanding by providing averages for the pre-crisis, crisis, and post-crisis periods.
As shown in Table 2, in the pre-crisis period, employment in tourism fell from 2,900,342 to 2,606,577 workers during the crisis, representing a contraction of −10.13%. However, in 2022, there was a recovery to 2,985,789 employees, equivalent to an increase of 14.55% compared to previous years.
In relation to tourism GDP as a percentage of total GDP, the decline was more pronounced. The indicator fell from 4.88% in the 2015–2019 period to 2.72% during the crisis, a reduction of −44.29%. Although it reached an average of 4.15% during the recovery phase, this value still remains below the pre-crisis level, despite growth of 52.83% compared to the lowest point.
GDP per capita shows a different dynamic. Its variation was minimal during the crisis, −0.09%, from $20,486 to $20,467, reflecting some stability in the aggregate indicator. In the recovery phase, there was an increase of 5.49%, with an average value of $21,591.
International arrivals show the greatest impact. The average fell from 20,879 thousand tourists in the pre-crisis period to just 7207 thousand in 2020–2021, representing a contraction of −65.48%. Although there was a 72.08% increase in 2022, with an average of 12,403 thousand visitors, this figure still represents just over half the level observed in the initial period.
Finally, the Economic Freedom Index performed marginally. During the crisis, it increased by 2.12%, from 66.45 to 67.86 points, and then fell by 3.78% in the recovery phase, to a value of 65.29 points.

4.1.2. Comparative Analysis by Level of Development

Analysis by country group reveals differences according to the level of economic development. Although emerging economies have a considerably lower GDP per capita, tourism has a greater relative weight in total employment, which shows greater labor intensity in the sector in these countries, as can be seen in Table 3.
In terms of employment in tourism, emerging economies have an average of 6,397,218 workers, a figure much higher than that of developed economies (389,246) and special cases (169,303). The difference is statistically significant, as indicated by the F-ratio value of 10.34 p < 0.01.
Tourism GDP as a proportion of total GDP has a higher relative share in developed economies, at 5.04%, compared to 3.68% in emerging economies and 4.13% in special cases. The F-ratio of 2.93, p < 0.05, confirms the existence of significant differences between the groups. In terms of GDP per capita, the gaps are marked. Emerging economies report an average of $6,108, while developed economies reach $31,093 and special cases $30,839. The contrast is highly significant: F-ratio = 67.84, p < 0.01.
With regard to international arrivals, emerging economies receive an average of 22,466 thousand visitors, a figure higher than that observed in developed economies (10,764 thousand) and special cases (13,810 thousand). The F-ratio 2.25 p < 0.10 indicates a marginally significant difference.
The Index of Economic Freedom (IEF) averages 70.32 in developed economies, 67.19 in special cases, and 63.40 in emerging economies. The differences are statistically significant, with an F-ratio of 6.55, p < 0.01.

4.1.3. Patterns of Impact and Differentiated Recovery

Analysis of the impact of the crisis and recovery processes shows significant heterogeneity between countries and groups. The classification into three groups—high recovery, moderate recovery, and limited recovery—does not fully coincide with the traditional division between developed and emerging economies. This suggests that, in addition to structural factors, other elements determine crisis response capabilities. Table 4 shows the impact of the crisis and recovery by country as a percentage.
The high resilience group (≥90%) includes Portugal, Colombia, Greece, India, South Africa, and Mexico. Portugal achieved the strongest overall recovery, with increases of over 70% in tourism GDP and 209% in arrivals during 2022. India showed a remarkable rebound with growth of 208% in tourism GDP and 114.7% in arrivals. Colombia and South Africa recorded solid recoveries in employment, while Greece and Mexico managed to stabilize their indicators despite sharp initial declines.
The medium resilience group (70–89%) includes Mauritius, Israel, and Finland. Mauritius experienced the greatest initial impact, −81.5%, in arrivals but achieved an extraordinary rebound in 2022, with a 304.6% increase in arrivals, which could be explained by the early reopening of its borders, although it did not manage to reach pre-crisis levels. Israel followed a similar trajectory, with a sharp decline and partial recovery. Finland showed a more moderate dynamic in both impact and recovery.
Finally, the low resilience group (<70%) includes Peru, New Zealand, and China. Peru suffered significant declines (−84.2%) in arrivals, with a partial recovery. New Zealand reflects an atypical trajectory: arrivals recovered by 138.4%, but employment and tourism GDP continued to contract. China presents the most restrictive scenario, with minimal recovery following the extreme losses suffered during the crisis.

4.2. Tourism Resilience Index

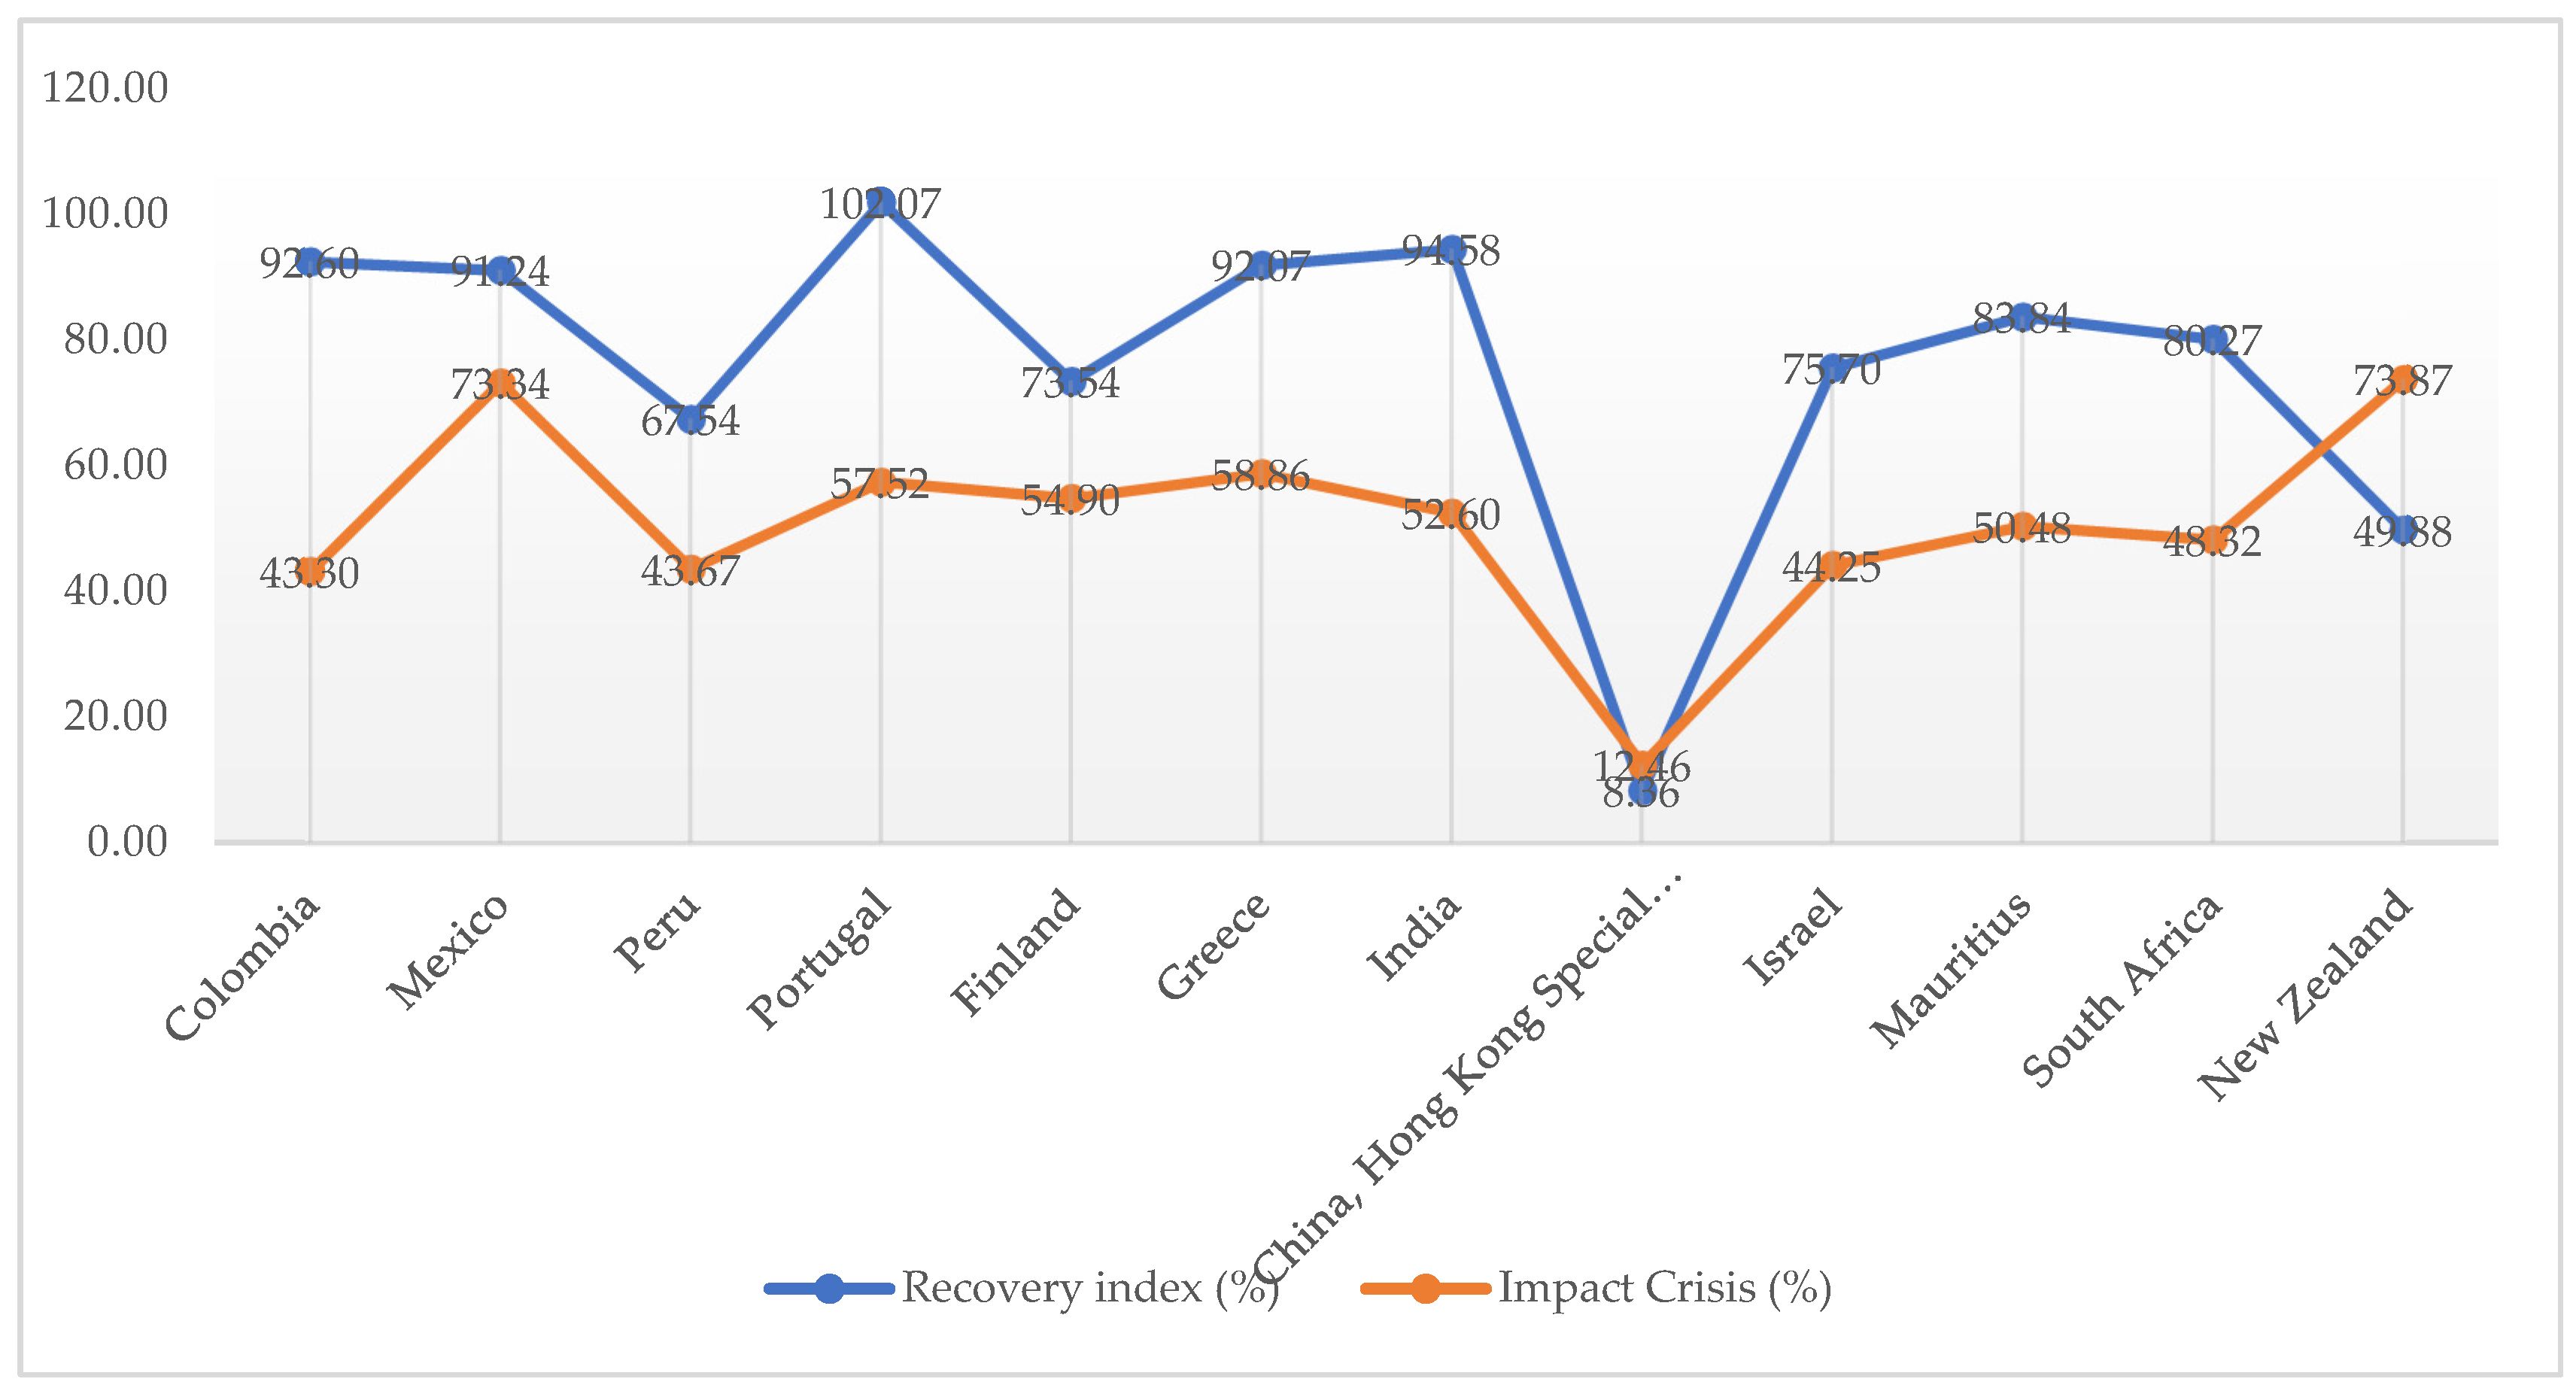
The tourism resilience index (TRI) confirms that the sector’s ability to recover does not depend exclusively on the level of economic development. Some middle-income countries achieve levels of resilience comparable to or higher than those of advanced economies, especially in terms of employment. These results suggest that tourism resilience responds to a combination of structural, institutional, and tourism market configuration factors. The tourism recovery index, compared with the impact of the crisis, is shown in Figure 2.
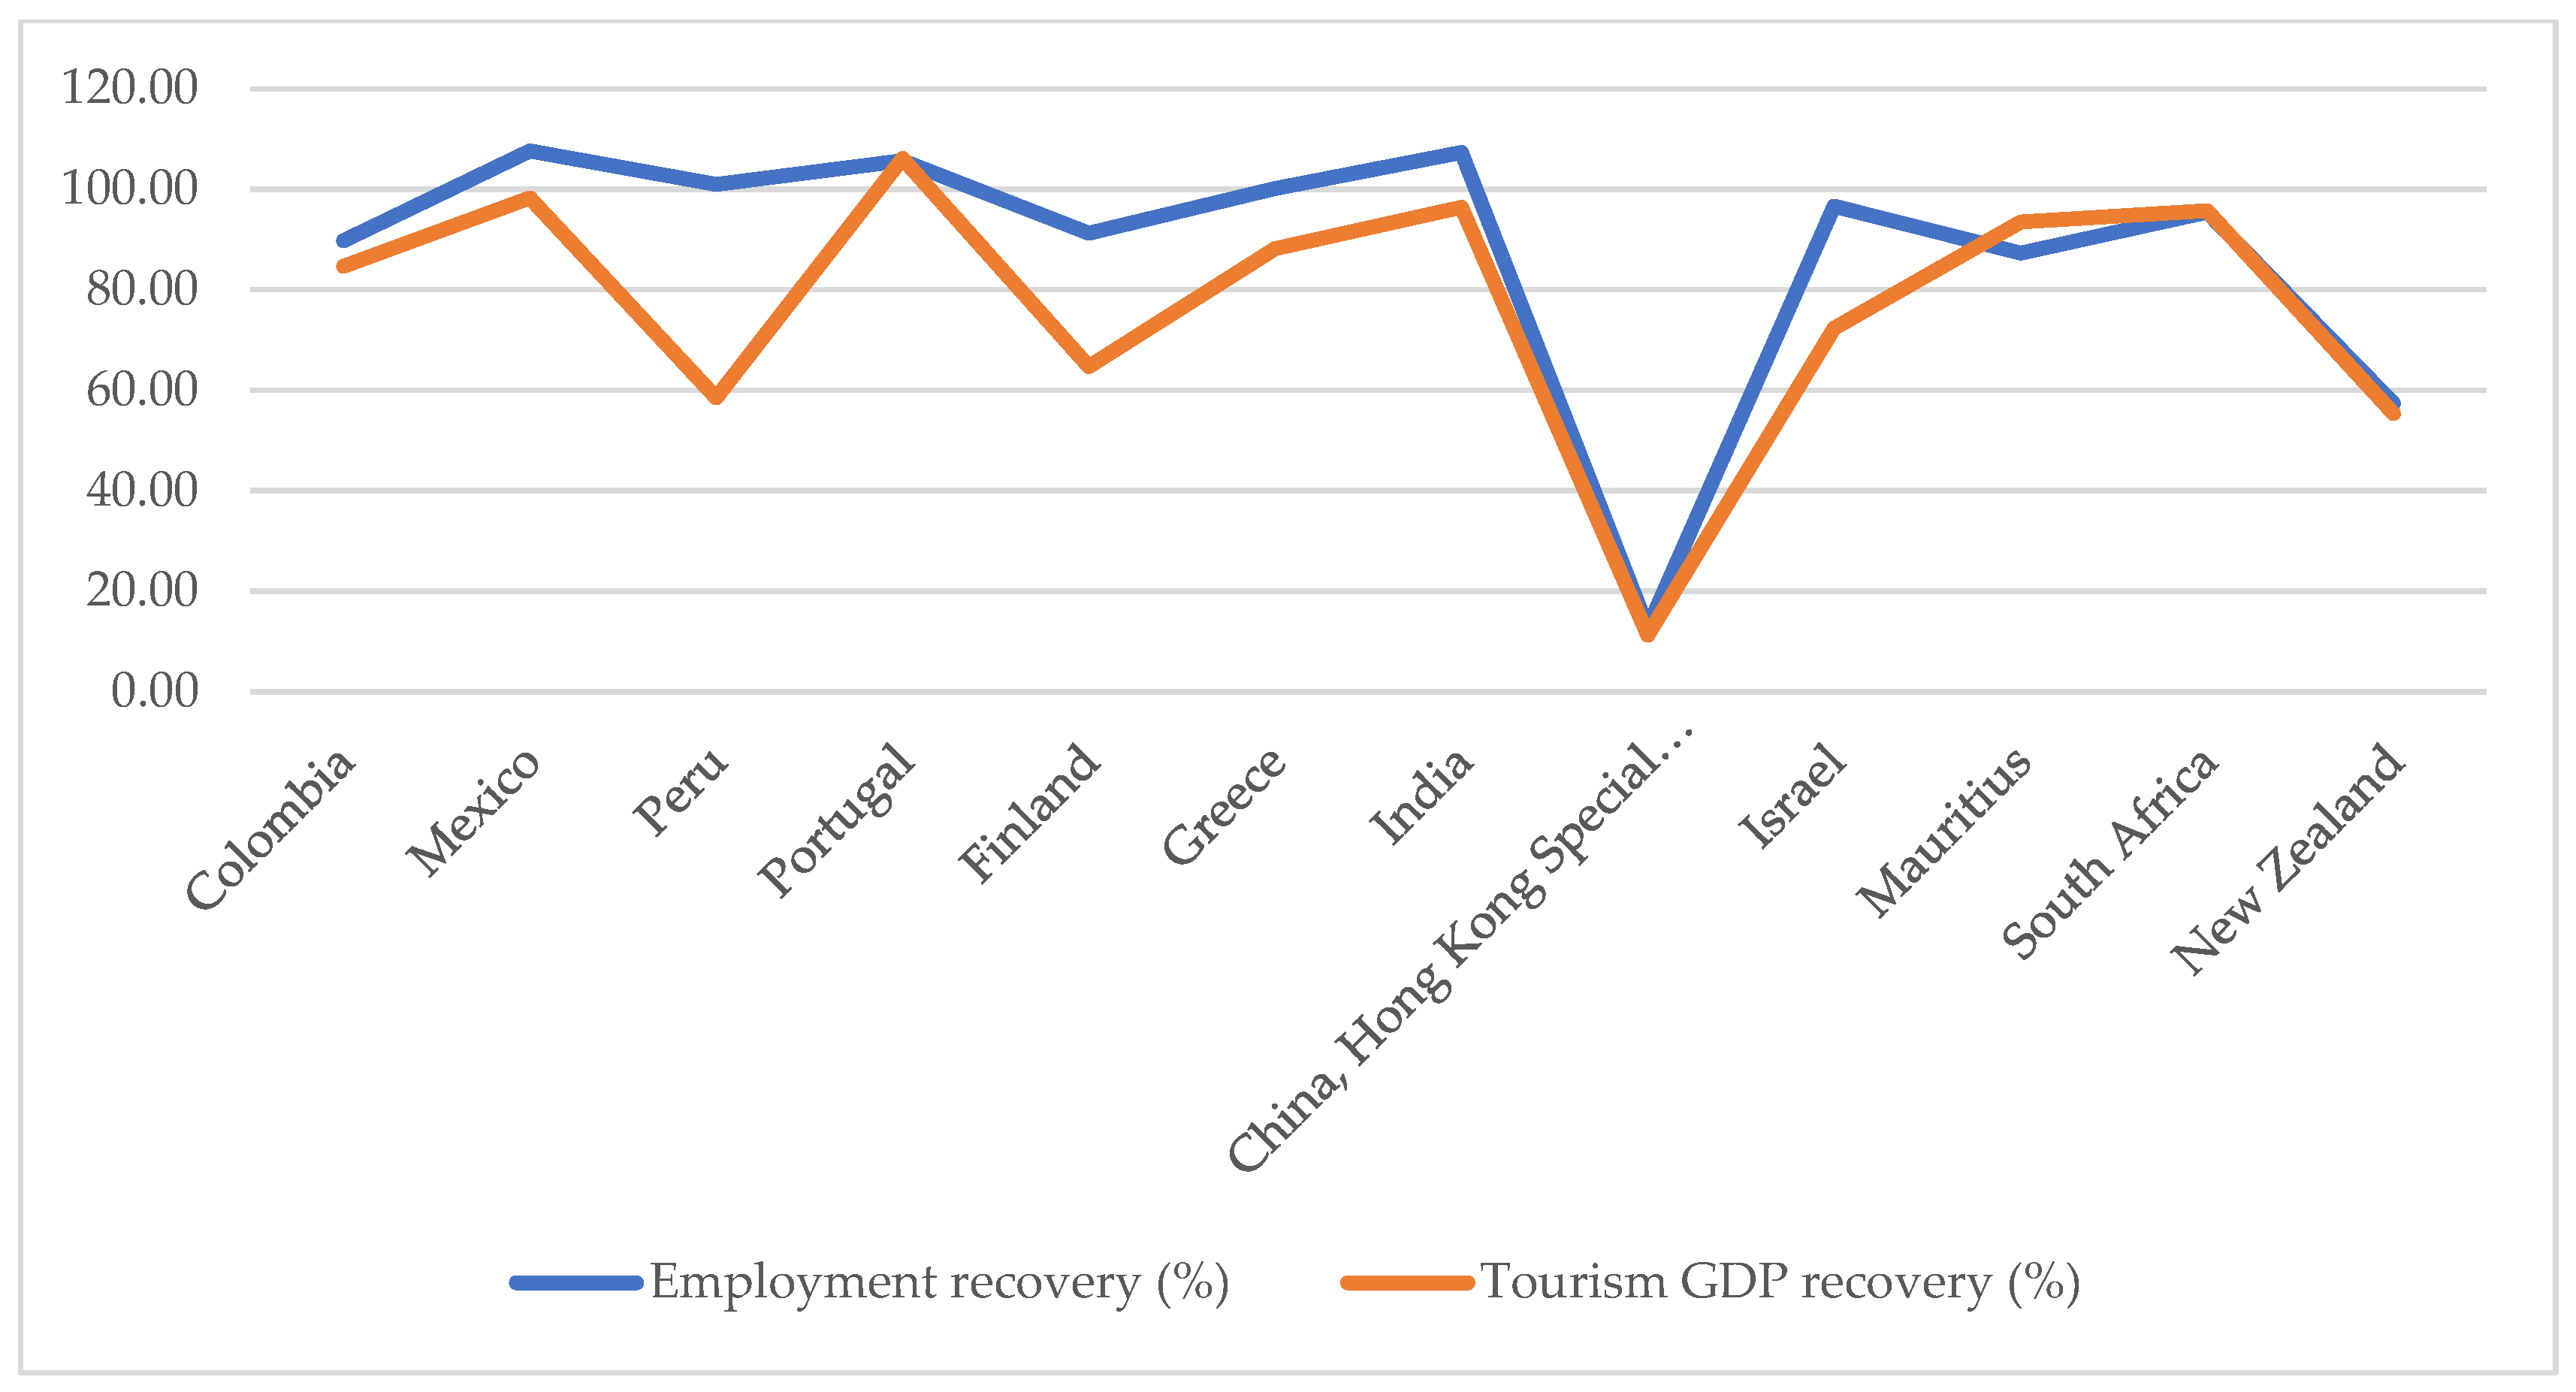
According to Figure 2, Portugal has the highest tourism recovery value, with an index of 102.7, followed by countries with high recovery (≥90%) such as Colombia, Greece, India, South Africa, and Mexico. China, meanwhile, is at the lowest end of the recovery scale, although the crisis impact indicators are also the lowest. It is followed by New Zealand, with recovery indices below the crisis impact index, suggesting that urgent measures are needed. Peru and Finland, meanwhile, barely exceeded basic recovery levels, although they are above the impact indices indices (detailed country-level recovery values are reported in Table A1). To complement the analysis of the recovery index, Figure 3 compares the percentage of employment recovery with the percentage of GDP recovery in the tourism sector of each country.
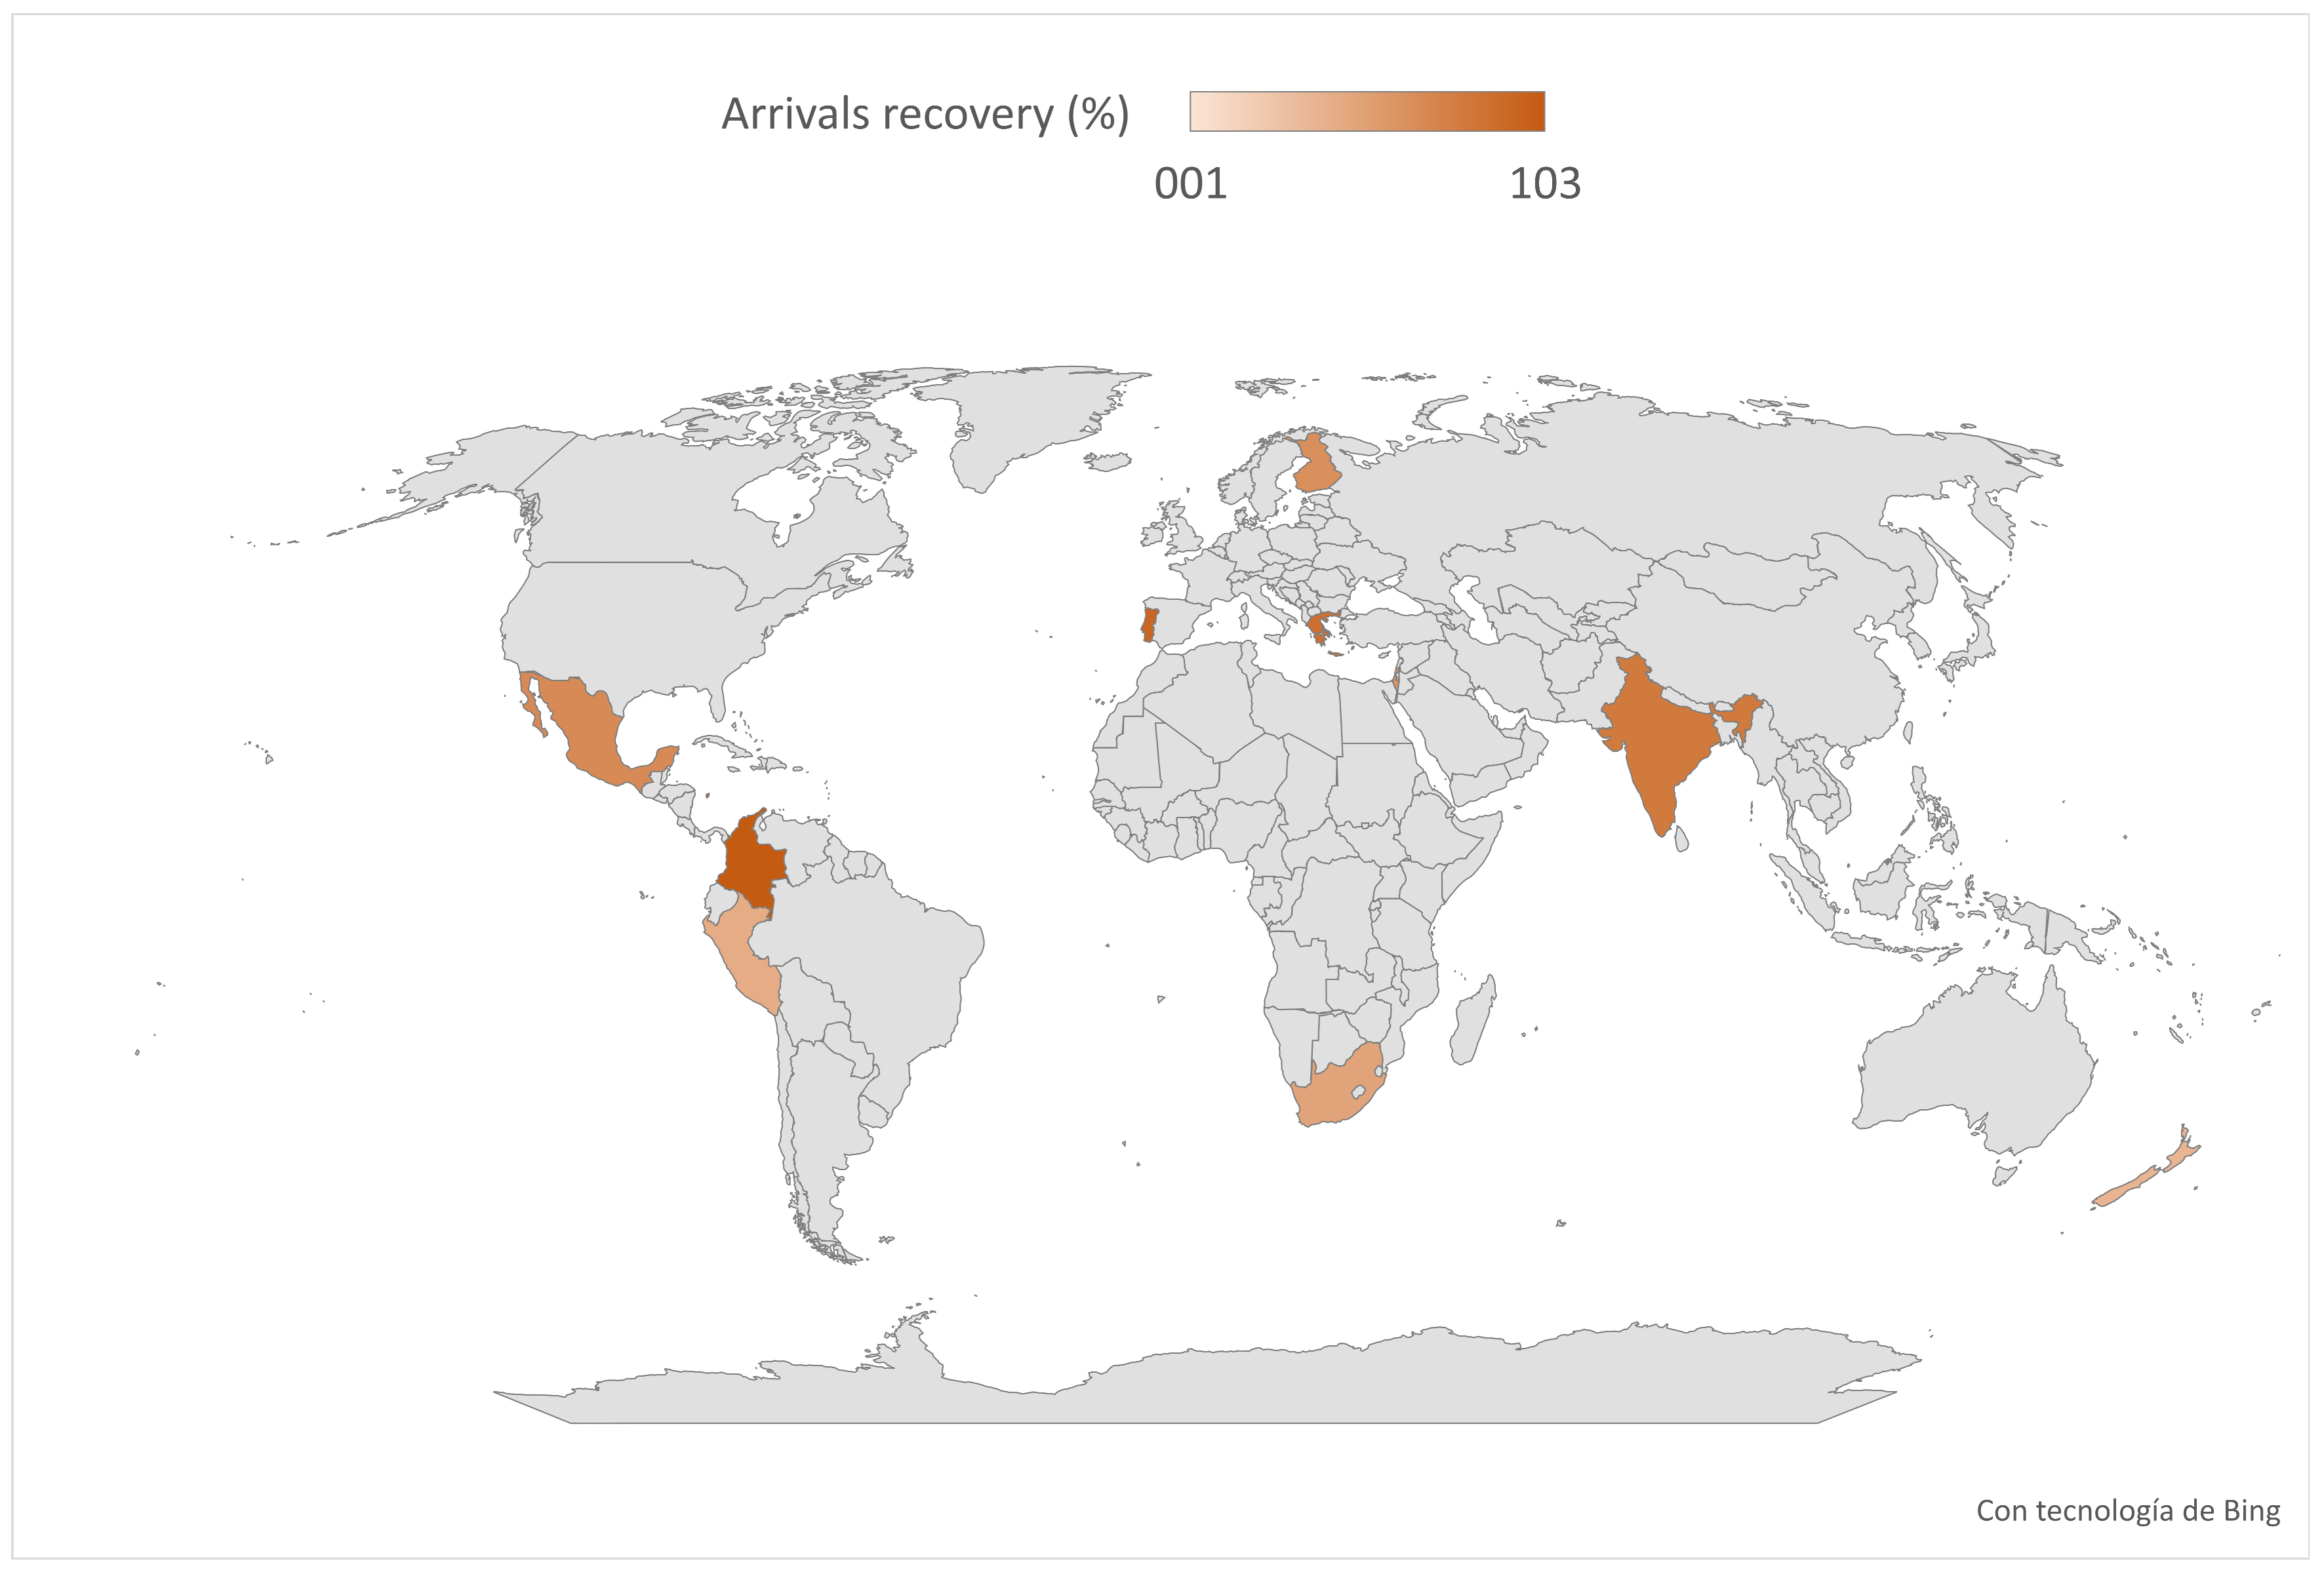
In most countries, job recovery has outpaced tourism GDP recovery, although in general the trend shows a strong correlation. In emerging economies such as Colombia, Mexico, Peru, and India, restoring employment has been a priority over economic growth in the sector. China and Mauritius, considered special cases due to their political dynamics and, in the case of China, due to its longer border closures, have given priority to GDP over employment. However, China justifies its exceptional statistical performance on the grounds that its economy is not primarily based on tourism and that its borders were reopened to international arrivals until January 2023. Mexico, Greece, and India show balanced progress in both employment and tourism GDP. The analysis is integrated with the index of international arrivals in each country in Figure 4.
Figure 4 shows the recovery of international arrivals in each country, revealing significant differences between destinations. In Europe, Finland has one of the highest recovery rates, exceeding 100%. This indicates that arrivals have already surpassed 2019 levels. In southern Europe, Portugal and Greece show an intermediate recovery of between 70% and 90%, meaning that their recovery is progressing. In Latin America, Colombia and Mexico are in the 80–95% range, indicating a significant recovery in international tourist flows, while Peru is undergoing a slower recovery process, with only 43%. In the African region, the island of Mauritius stands out with a recovery rate of 71%, while South Africa is making progress in its recovery but has not yet reached 50%. In Asia, India is the only country with a high recovery rate of close to 80%. China, however, barely appears in the index with 1%. Finally, in Oceania, New Zealand is in the early stages of recovery in international tourism activity.
In general, the highest resilience indices, above 100%, are found in Portugal, which also exceeded the GDP recovery percentage, followed by India and Mexico, which lead in employment recovery. However, the recovery dynamics of South Africa, Colombia, and India are attractive, given that they are emerging economies.


4.3. Correlational Analysis

The correlation matrix shows relevant associations between structural variables. GDP per capita is positively associated with the Index of Economic Freedom (IEF), reflecting the relationship between the level of development and economic institutionality. However, GDP per capita shows negative correlations with tourism employment and international arrivals, indicating that in higher-income economies, tourism tends to be less labor-intensive and less volume-intensive.
International arrivals show a positive and statistically significant correlation with tourism employment, confirming the close relationship between the reactivation of external demand and the sector’s employment recovery. For its part, the IEF shows negative correlations with tourism employment and international arrivals, suggesting that greater economic liberalization does not necessarily translate into immediate growth in the tourism sector. These correlations are presented in Table 5.

4.4. Determinants of Resilience: Multivariate Analysis

The multiple regression model explains 59.6% of the variation in the tourism resilience index, indicating moderate explanatory power given the sample size. The main statistically significant result is the negative relationship between the Index of Economic Freedom and tourism resilience, suggesting that higher levels of economic liberalization could be associated with a lower capacity for recovery in the sector in the face of global crises.
The other variables, GDP per capita, depth of the crisis impact, dependence on international tourism, and membership in the group of emerging economies, do not reach statistical significance, although they show signs consistent with the theoretical literature. Overall, the results support the relational hypothesis of the study but limit causal inference, reinforcing the exploratory nature of the multivariate analysis. Table 6 shows the determinants of tourism recovery.

5. Discussion

The results confirm that tourism resilience is a complex and multidimensional phenomenon, in line with approaches that conceive tourism as a nonlinear adaptive system. Empirical evidence shows that recovery trajectories do not depend exclusively on income levels, but rather on the interaction between productive structure, dependence on international tourism, and economic institutions. This finding is consistent with (Ritchie & Jiang, 2019), who argue that resilience emerges from systemic interactions rather than from isolated structural advantages.
The relatively stronger recovery of tourism employment in emerging economies is consistent with studies that highlight the role of tourism as an employment buffer in contexts of lower productive diversification (Brida et al., 2014; Brida et al., 2020; Orîndaru et al., 2021). This result suggests that, in these countries, the tourism sector plays a more relevant countercyclical role than in advanced economies.
The finding of a negative relationship between the Index of Economic Freedom and tourism resilience introduces an important nuance to the existing literature. While previous studies argue that flexible institutional environments facilitate adaptation to crises, the results of this study suggest that greater economic liberalization may increase the sector’s exposure to external shocks, especially in contexts of high dependence on international tourism. This result is consistent with critical approaches that warn of the vulnerability of highly open economies to recurring global crises.
Likewise, the strong association between international arrivals and tourism employment confirms that the revival of external demand remains a key determinant of labor recovery, as noted by (Zenker & Kock, 2020) and (Prayag et al., 2024). However, the evidence suggests that a sustainable recovery requires complementing this revival with strategies for diversification, innovation, and strengthening the domestic market. This result supports the theory of complex adaptive systems applied to tourism (Baggio, 2008).
The country-level analysis reinforces these findings. In the high resilience group, Portugal benefited from European labor retention programs that preserved formal employment during the crisis (Markovic et al., 2021), while India’s large domestic market buffered the collapse of international flows and enabled accelerated digital transformation of tourism services (Nunes & Cooke, 2021). Colombia and South Africa prioritized employment stability through public subsidies, achieving solid labor recoveries even when tourism GDP lagged behind (Tobón et al., 2022).
At the other end, the low resilience group reveals structural limits. New Zealand’s prolonged border closures produced irreversible losses in sectoral capacity: despite rebounding arrivals, employment and tourism GDP continued to contract, as stated by Pyke et al. (2021). China’s asymmetric recovery, with rising tourism GDP but persistent decline in arrivals, reflects a deliberate pivot toward high-value domestic tourism (Song et al., 2021). These cases confirm that recovery is not a linear return to pre-crisis levels but a transformative process where different components adjust at unequal rates (Lamhour et al., 2023).
The evidence also reveals a structural duality: emerging economies operate labor-intensive models where job creation depends heavily on external demand, while developed economies pursue productivity-oriented models with slower post-crisis labor adjustment. This duality calls for differentiated policies: strengthening social protection in emerging economies and rapid-response frameworks in developed ones (Mensah & Boakye, 2021; S. Lee & Pennington, 2025). This observation is consistent with the findings of this study, where the tourism resilience index (TRI) reveals that post-crisis recovery does not necessarily follow a linear return to previous levels, but rather involves differentiated trajectories conditioned by the interaction between macroeconomic structure, institutional quality, and labor market dynamics.
By comparing the results with PATA (2025) regional analysis, trends can be identified, as the report on international visitor arrivals to Asia-Pacific destinations showed a recovery rate of 91.9% compared to 2019, which may partly explain the moderate recovery in China and New Zealand. However, the future of tourism in this region of the world can be viewed with optimism, thanks to border reopening measures and the potential for better adaptation and coping with global crises. Adaptation trends suggest a structural change in which destinations not only adopt pre-crisis conditions but also adapt their tourism models to incorporate new demand patterns, as suggested by UN Tourism (2025a).
Taken together, the results expand the literature on tourism resilience by providing international comparative evidence and challenging the idea that higher levels of economic liberalization guarantee a faster recovery of the sector. These findings have important implications for the design of public policies tailored to the level of development and structure of tourism.

6. Conclusions

This study provides empirical evidence that tourism resilience and recovery following global crises are highly heterogeneous and cannot be explained solely by differences in income levels across countries. The results show that emerging economies, on average, display a relatively stronger recovery in tourism employment, while several developed economies experience slower labor market adjustments despite higher income levels and institutional capacity.
The negative association between the Index of Economic Freedom and tourism resilience is one of the most unexpected findings, leading to the most relevant conclusions as it challenges the conventional hypothesis that more liberalized economic environments necessarily improve the tourism sector’s ability to adapt. On the contrary, the results suggest that higher levels of market openness and liberalization may increase exposure to external shocks, especially in economies with a strong dependence on international tourist flows.
On the other hand, analysis of economic freedom index variables and analysis of the degree of dependence of each country’s economy on tourism led to the conclusion that economies with greater dependence on tourism for their growth and development are those that most quickly activate crisis response mechanisms and financially support their companies, favoring employment and a lesser impact on tourism GDP. Therefore, these tourism-based countries tend to achieve higher levels of resilience.
Overall, the evidence supports the affirmation that tourism resilience is a multidimensional phenomenon shaped by structural, institutional and market-related factors. From a policy perspective, the results underscore the need for differentiated resilience strategies tailored to the specific characteristics of each country.
Key aspects of resilience have been the strengthening of domestic tourism by promoting affordability and integrated experiences; likewise, the diversification of tourism products in line with preferences and expectations duly compiled in recent data; similarly, the wider use of applications and the digitization of payments is contributing to increased tourism demand. On the other hand, strengthening the adaptability of the labor market is emerging as a key element in improving resilience in future crisis scenarios.
Overall, the most pressing recommendations are:
  • Protect employment, as countries that subsidized job retention from the onset of the crisis recovered more quickly than those that waited for the market to adjust on its own.
  • Strengthen domestic tourism. It acts as a buffer when international flows collapse. Diversifying local products and experiences reduces exposure to external shocks.
  • Activate rapid response mechanisms in countries that require greater resilience in the tourism sector.
  • Accelerate the digital transformation of tourism services in line with demand trends.
Future research could expand the sample of countries and incorporate dynamic econometric approaches to better capture causal relationships.

Author Contributions

Research design based on the developed framework, J.A.M.M. and L.N.T.P.; formulation of methodology, J.A.M.M.; data collection, J.A.M.M. and L.N.T.P.; use of Stata software version 13.1 (StataCorp LP, College Station, TX, USA) for data analysis, J.A.M.M.; validation and formal analysis of results, J.A.M.M. and L.N.T.P.; writing and preparation of the original draft, J.A.M.M. and L.N.T.P.; review and editing, L.N.T.P.; supervision, L.N.T.P.; project and resource management, J.A.M.M. and L.N.T.P. All authors have read and agreed to the published version of the manuscript.

Funding

This research received no external funding.

Institutional Review Board Statement

Not applicable.

Informed Consent Statement

Not applicable.

Data Availability Statement

The original contributions presented in this study are included in the article. Further inquiries can be directed to the corresponding author. Links to data sources: https://www.untourism.int/tourism-statistics/tourism-statistics-database, https://economicfreedom.heritage.org/pages/all-country-scores and https://datos.bancomundial.org/indicador?tab=all, (accessed on 15 October 2025).

Acknowledgments

During the preparation of this manuscript, the authors used ChatGPT based on GPT-5.3 to synthesize the analysis of results from several studies by other authors cited. The authors have reviewed and edited the results and assume full responsibility for the content of this publication. Artificial intelligence (Deepl.com) was also used to translate into English.

Conflicts of Interest

The authors declare no conflicts of interest.

Appendix A

As part of the study, the table in Appendix A was prepared but replaced by Figure 1 due to its length. However, it highlights key data on the tourism resilience index. The table shows that middle-income countries are achieving higher levels of recovery than advanced economies, particularly in terms of employment.
Table A1. Tourism recovery indices.
CountryGroupRecovery IndexRecovery (%)—Tourism GDPRecovery (%)—ArrivalsRecovery (%)—EmploymentCrisis ImpactAvg. EFIGDP per Capita
High recovery (≥90%)
PortugalDeveloped economies102.07106.1794.36105.6757.5265.87520.547
ColombiaEmerging economies92.6084.63103.4289.7443.3068.856.359
GreeceDeveloped economies92.0788.2187.86100.1558.8657.437518.710
IndiaEmerging economies94.5896.4579.99107.3152.6055.001.845
South AfricaEmerging economies80.2795.7449.6295.4548.3260.355.949
MexicoEmerging economies91.2498.2767.75107.6973.3464.98759.968
Medium recovery (70–89%)
MauritiusSpecial cases83.8493.4870.7487.2950.4874.587510.103
IsraelSpecial cases75.7072.3158.1296.6644.2571.462538.833
FinlandDeveloped economies73.5464.7464.6591.2454.9074.887544.836
Low recovery (<70%)
PeruEmerging economies67.5458.4743.19100.9543.6767.8256.418
New ZealandDeveloped economies49.8855.3636.8857.3973.8783.07540.280
ChinaSpecial cases8.3611.271.0812.7212.4655.52543.580

References

  1. Baggio, R. (2008). Symptoms of complexity in a tourism system. Tourism Analysis, 13(1), 1–20. [Google Scholar] [CrossRef] [Scilit]
  2. Balaskas, S., Yfantidou, I., Panteli, A., Komis, K., & Nikolopoulos, T. (2025). From intention to action: Modeling post-visit responsible behavior in ecotourism. Tourism and Hospitality, 6(4), 170. [Google Scholar] [CrossRef] [Scilit]
  3. Bauzá Martorell, F. J., & Melgosa Arcos, F. J. (Directors). (2020). Turismo post COVID-19. El turismo después de la pandemia global: Análisis, perspectivas y vías de recuperación. Ediciones Universidad de Salamanca y AECIT. [Google Scholar] [CrossRef] [Scilit]
  4. Booyens, I., Rogerson, C. M., Rogerson, J. M., & Baum, T. (2022). COVID-19 crisis management responses of small tourism firms in South Africa. Tourism Review International, 26(1), 121–137. [Google Scholar] [CrossRef] [Scilit]
  5. Brida, J. G., London, S., & Rojas, M. (2014). El turismo como fuente de crecimiento económico: Impacto de las preferencias intertemporales de los agentes. Investigación Económica, 73(289), 59–77. [Google Scholar] [CrossRef] [Scilit]
  6. Brida, J. G., Matesanz Gómez, D., & Segarra, V. (2020). On the empirical relationship between tourism and economic growth. Tourism Management, 81, 104131. [Google Scholar] [CrossRef] [Scilit]
  7. Carswell, J., Jamal, T., Lee, S., Sullins, D. L., & Wellman, K. (2023). Post-pandemic lessons for destination resilience and sustainable event management: The complex learning destination. Tourism and Hospitality, 4(1), 91–140. [Google Scholar] [CrossRef] [Scilit]
  8. Casado, A. L. A., Sánchez, F. J., & Bastidas, M. A. B. (2021). Tourism research after the COVID-19 outbreak: Insights for more sustainable, local and smart cities. Sustainable Cities and Society, 73, 103126. [Google Scholar] [CrossRef] [Scilit]
  9. Chávez, J. M. (2022). Turismo en América Latina, un análisis después de la pandemia. Universitat de Barcelona. [Google Scholar]
  10. Espinoza, R. I. J., Chávez, D. R. M., & Heckel, G. (2024). Resilience components in Mexican whale-watching regulation. Tourism and Hospitality, 5(4), 1028–1041. [Google Scholar] [CrossRef] [Scilit]
  11. Folke, C. (2016). Resilience (republished). Ecology and Society, 21(4), art44. [Google Scholar] [CrossRef] [Scilit]
  12. García Moreno, B., & Fernández Alcantud, A. (2020). Los destinos turísticos inteligentes: El pilar de la recuperación turística. Ayana. Revista de Investigación en Turismo, 1(1), 17–29. [Google Scholar] [CrossRef] [Scilit]
  13. Ge, J. (2023). The COVID-19 pandemic in China: From dynamic zero-COVID to current policy. Herz, 48(3), 226–228. [Google Scholar] [CrossRef] [Scilit]
  14. Gössling, S., Scott, D., & Hall, C. M. (2021). Pandemics, tourism and global change: A rapid assessment of COVID-19. Journal of Sustainable Tourism, 29(1), 1–20. [Google Scholar] [CrossRef] [Scilit]
  15. Hao, F., Xiao, Q., & Chon, K. (2020). COVID-19 and China’s hotel industry: Impacts, a disaster management framework, and post-pandemic agenda. International Journal of Hospitality Management, 90, 102636. [Google Scholar] [CrossRef] [Scilit]
  16. Holling, C. S. (1973). Resilience and stability of ecological systems. Annual Review of Ecology and Systematics, 4(1), 1–23. [Google Scholar] [CrossRef] [Scilit]
  17. Khawaja, K. F., Sarfraz, M., Rashid, M., & Rashid, M. (2021). How is COVID-19 pandemic causing employee withdrawal behavior in the hospitality industry? An empirical investigation. Journal of Hospitality and Tourism Insights, 5(3), 687–706. [Google Scholar] [CrossRef] [Scilit]
  18. King, C., Iba, W., & Clifton, J. (2021). Reimagining resilience: COVID-19 and marine tourism in Indonesia. Current Issues in Tourism, 24(19), 2784–2800. [Google Scholar] [CrossRef] [Scilit]
  19. Lamhour, O., Safaa, L., & Perkumienė, D. (2023). What does the concept of resilience in tourism mean in the time of COVID-19? Results of a bibliometric analysis. Sustainability, 15(12), 9797. [Google Scholar] [CrossRef] [Scilit]
  20. Larios-Gómez, E., Fischer, L., Peñalosa, M., & Ortega-Vivanco, M. (2021). Purchase behavior in COVID-19: A cross study in Mexico, Colombia, and Ecuador. Heliyon, 7(3), e06468. [Google Scholar] [CrossRef] [Scilit]
  21. Lee, K., Chuang, N. K., Lee, S. A., & Israeli, A. A. (2021). How COVID-19 influences the future of service management professions. Journal of Hospitality and Tourism Insights, 5(3), 629–646. [Google Scholar] [CrossRef] [Scilit]
  22. Lee, S., & Pennington, G. L. (2025). Measuring resilience of the tourism sector: Reflective Resilience Index (REFLEX) approach. Annals of Tourism Research, 114, 103983. [Google Scholar] [CrossRef] [Scilit]
  23. Leyva, H. S. N., Ramos, L. L., Barrera, P. O. T., & Camarena, O. J. M. (2025). Experience, price, and loyalty: A comparative analysis of wine and beer in Baja California, Mexico. Tourism and Hospitality, 6(4), 195. [Google Scholar] [CrossRef] [Scilit]
  24. Luo, Y., Li, Y., Wang, G., & Ye, Q. (2021). Agent-based modeling and simulation of tourism market recovery strategy after COVID-19 in Yunnan, China. Sustainability, 13(21), 11750. [Google Scholar] [CrossRef] [Scilit]
  25. Luz Arelis, M. Q., Victoria, M. I., Milagros, A. C., & Elena, S. J. (2021). Business ideas to reactivate tourism in a pandemic context in “la Encantada”, Chulucanas, Peru. Revista Venezolana de Gerencia, 26, 173–186. [Google Scholar] [CrossRef] [Scilit]
  26. Markovic, S., Koporcic, N., Arslanagic-Kalajdzic, M., Kadic-Maglajlic, S., Bagherzadeh, M., & Islam, N. (2021). Business-to-business open innovation: COVID-19 lessons for small and medium-sized enterprises from emerging markets. Technological Forecasting and Social Change, 170, 120883. [Google Scholar] [CrossRef] [Scilit]
  27. Martin, R., & Sunley, P. (2015). On the notion of regional economic resilience: Conceptualization and explanation. Journal of Economic Geography, 15(1), 1–42. [Google Scholar] [CrossRef] [Scilit]
  28. McTeigue, C., Sanchez, C., Santos, E., Walter, C. E., & Au-Yong-oliveira, M. (2021). A strategy for tourism growth, rebound, and revival: Promoting portugal as a destination post-COVID-19. Sustainability, 13(22), 12588. [Google Scholar] [CrossRef] [Scilit]
  29. Mensah, E. A., & Boakye, K. A. (2021). Conceptualizing post-COVID 19 tourism recovery: A three-step framework. Tourism Planning & Development, 20(1), 37–61. [Google Scholar] [CrossRef] [Scilit]
  30. Meramveliotakis, G., & Manioudis, M. (2021). Sustainable development, COVID-19 and small business in Greecep: Small is not beautiful. Administrative Sciences, 11(3), 90. [Google Scholar] [CrossRef] [Scilit]
  31. Mestanza-Ramon, C., & Jimenez-Caballero, J. L. (2021). Nature tourism on the colombian-ecuadorian amazonian border: History, current situation, and challenges. Sustainability, 13(8), 4432. [Google Scholar] [CrossRef] [Scilit]
  32. Navarro-Chávez, J. C. L., Gómez, M., & Marín-Leyva, R. A. (2019). Tourism demand from Europe to Mexico, 2005–2018: A cointegration analysis. Revista Nicolaita de Estudios Económicos, 14(2), 135–143. Available online: https://search.ebscohost.com/login.aspx?direct=true&db=bth&AN=145970689&lang=es&site=bsi-live (accessed on 10 March 2026). [CrossRef] [Scilit]
  33. Nunes, S., & Cooke, P. (2021). New global tourism innovation in a post-coronavirus era. European Planning Studies, 29(1), 1–19. [Google Scholar] [CrossRef] [Scilit]
  34. Orîndaru, A., Popescu, M.-F., Alexoaei, A. P., Căescu, Ștefan-C., Florescu, M. S., & Orzan, A.-O. (2021). Tourism in a post-COVID-19 era: Sustainable strategies for industry’s recovery. Sustainability, 13(12), 6781. [Google Scholar] [CrossRef] [Scilit]
  35. PATA [Pacific Asia Travel Association]. (2025). Asia Pacific tourism nearing full recovery, reaching 295.7 million in the first half of 2025 [Comunicado de prensa]. Available online: https://www.pata.org/press-release/pata-asia-pacific-tourism-nearing-full-recovery-reaching-295-million-in-the-first-half-of-2025 (accessed on 6 March 2026).
  36. Perelló, J. L. (2022). Reseña del libro: Turismo en el Caribe: Pasado, presente y futuro (1st ed.). Editorial Akelarre. [Google Scholar]
  37. Pécsek, B., & Gyurkó, Á. (2025). Building resilient destinations: Spatial mapping and analysis of potential therapeutic milieus in Hungary. Tourism and Hospitality, 6(5), 226. [Google Scholar] [CrossRef] [Scilit]
  38. Prayag, G., Muskat, B., & Dassanayake, C. (2024). Leading for resilience: Fostering employee and organizational resilience in tourism firms. Journal of Travel Research, 63(3), 659–680. [Google Scholar] [CrossRef] [Scilit]
  39. Prayag, G., Spector, S., Orchiston, C., & Chowdhury, M. (2020). Psychological resilience, organizational resilience and life satisfaction in tourism firms: Insights from the Canterbury earthquakes. Current Issues in Tourism, 23(10), 1216–1233. [Google Scholar] [CrossRef] [Scilit]
  40. Pyke, J., Lindsay-Smith, G., Gamage, A., Shaikh, S., Nguyen, V. K., de Lacy, T., & Porter, C. (2021). Building destination resilience to multiple crises to secure tourism’s future. Asia Pacific Journal of Tourism Research, 26(11), 1225–1243. [Google Scholar] [CrossRef] [Scilit]
  41. Ritchie, B. W., & Jiang, Y. (2019). A review of research on tourism risk, crisis and disaster management: Launching the annals of tourism research curated collection on tourism risk, crisis and disaster management. Annals of Tourism Research, 79, 102812. [Google Scholar] [CrossRef] [Scilit]
  42. Sagi, L. (2023). Hacia la resiliencia del turismo: Gestión de crisis y desastres. Inter-American Development Bank. Libreta Didáctica. [Google Scholar]
  43. Sauvola, J., Hyysalo, J., Kinnunen, M., Kosonen, P., Jokitalo, P., Jurmu, M., & Riekki, J. (2025). Endorsing organisations towards international business: Insights from Finland. International Journal of Business and Globalisation, 39(1), 1–21. [Google Scholar] [CrossRef] [Scilit]
  44. Sánchez, M. M. (2020). Instability, violence and tourism in Peru: Approach from the role of the state. Araucaria, 22(43), 367–392. [Google Scholar] [CrossRef] [Scilit]
  45. Song, H. J., Jihwan, Y., & Seoki, L. (2021). Impact of the COVID-19 pandemic: Evidence from the US restaurant industry. International Journal of Hospitality Management, 92, 102702. [Google Scholar] [CrossRef] [Scilit] [PubMed]
  46. Tang, Y., Weng, G., Qin, S., & Pan, Y. (2025). Spatial and temporal evolution of tourism flows among 296 Chinese cities in the context of COVID-19: A study based on Baidu Index. Humanities and Social Sciences Communications, 12(1), 19. [Google Scholar] [CrossRef] [Scilit]
  47. The Lancet Regional Health—Western Pacific. (2023). The end of zero-COVID-19 policy is not the end of COVID-19 for China. In The Lancet Regional Health—Western Pacific (Vol. 30). Elsevier Ltd. [Google Scholar] [CrossRef] [Scilit]
  48. Tobón, L. N., Urquía, E., & Cano, E. I. (2022). Economic and organizational impact of COVID-19 on Colombia’s tourism sector. Sustainability, 14(20), 13350. [Google Scholar] [CrossRef] [Scilit]
  49. UN Tourism. (2025a). International tourism recovers pre-pandemic levels in 2024. World Tourism Barometer. [Google Scholar]
  50. UN Tourism. (2025b). Safety of Destinations (SAFE-D) initiative. Available online: https://unric.org/en/safe-destinations-challenge/ (accessed on 6 March 2026).
  51. UN Tourism. (2025c). UN Tourism launches the “Safe Destinations Challenge” to strengthen tourism resilience in Europe and beyond [Comunicado de prensa]. Available online: https://www.untourism.int/es/news/un-tourism-launches-the-safe-destinations-challenge-to-strengthen-tourism-resilience-in-europe-and-beyond (accessed on 6 March 2026).
  52. Vergara-Schmalbach, J. C., Maza-Avila, F. J., Martinez-Nagle, O., & Girado-Guzmán, C. A. (2021). Evaluation of the quality of the tourist service offered to foreign tourists in the City of Cartagena de Indias, Colombia. Tourism and Hospitality Management, 27(2), 293–314. [Google Scholar] [CrossRef] [Scilit]
  53. World Tourism Organization. (2023). UNWTO Tourism recovery tracker. UNWTO. [Google Scholar]
  54. Yeh, S.-S. (2021). Tourism recovery strategy against COVID-19 pandemic. Tourism Recreation Research, 46(2), 188–194. [Google Scholar] [CrossRef] [Scilit]
  55. Yeoman, I. S., Postma, A., & Hartman, S. (2022). Scenarios for New Zealand tourism: A COVID-19 response. Journal of Tourism Futures, 8(2), 177–193. [Google Scholar] [CrossRef] [Scilit]
  56. Zenker, S., & Kock, F. (2020). The coronavirus pandemic—A critical discussion of a tourism research agenda. Tourism Management, 81, 104164. [Google Scholar] [CrossRef] [Scilit]
  57. Zheng, D., Luo, Q., & Ritchie, B. W. (2021). Afraid to travel after COVID-19? Self-protection, coping and resilience against pandemic ‘travel fear’. Tourism Management, 83, 104261. [Google Scholar] [CrossRef] [Scilit]
Figure 1. Theoretical model.
Tourismhosp 07 00096 g001
Figure 2. Tourism recovery profiles by country versus impact of crises. Source: elaboration based on data from UNWTO, the World Bank, and the Heritage Foundation.
Tourismhosp 07 00096 g002
Figure 3. Comparison of employment recovery with GDP recovery in the tourism sector. Source: elaboration based on data from UNWTO, the World Bank, and the Heritage Foundation.
Tourismhosp 07 00096 g003
Figure 4. Global location and international arrivals index. Source: elaboration based on data from UNWTO, the World Bank, and the Heritage Foundation. The data used to create Figure 2, Figure 3 and Figure 4 are detailed in Appendix A.
Tourismhosp 07 00096 g004
Table 1. Descriptive statistics of the main variables (2015–2022).
VariableNMeanStd. Dev.CV (%)MinQ1MedianQ3Max
Tourism employment962,837,5827,055,077248.6322,500259,425499,0551,021,72027,472,438
Tourism GDP (%)964.242.5860.880.082.463.406.309.30
GDP per capita (USD)9620,61915,92377.221584642814,22239,64646,016
International tourist arrivals (thousands)9616,40224,455149.10912654460915,70499,349
Economic Freedom Index9666.668.5212.7848.0059.6567.1572.8584.40
Note: Authors’ own elaboration based on data from UNWTO, the World Bank, and the Heritage Foundation.
Table 2. Comparison of mean values by period.
VariablePre-Crisis (2015–2019)Crisis (2020–2021)Recovery (2022)Crisis Change (%)Recovery Change (%)
Tourism employment2,900,3422,606,5772,985,789−10.1314.55
Tourism GDP (%)4.882.724.15−44.2952.83
GDP per capita (USD)20,48620,46721,591−0.095.49
International tourist arrivals (thousands)20,879720712,403−65.4872.08
Economic Freedom Index66.4567.8665.292.12−3.78
Note: Authors’ own elaboration based on data from UNWTO, the World Bank, and the Heritage Foundation.
Table 3. Average indicators by country group (2015–2022).
IndicatorEmerging EconomiesDeveloped EconomiesSpecial CasesF-Ratio
Tourism employment6,397,218389,246169,30310.34 ***
Tourism GDP (%)3.685.044.132.93 **
GDP per capita (USD)610831,09330,83967.84 ***
International tourist arrivals (thousands)22,46610,76413,8102.25 *
Index of Economic Freedom (IEF)63.4070.3267.196.55 ***
Note: Significance levels: *** p < 0.01, ** p < 0.05, * p < 0.10. Source: elaboration based on data from UNWTO, the World Bank, and the Heritage Foundation.
Table 4. Crisis impact and recovery by country (% change).
CountryGroupCrisis Impact—EmploymentCrisis Impact—Tourism GDPCrisis Impact—ArrivalsRecovery 2022—EmploymentRecovery 2022—Tourism GDPRecovery 2022—Arrivals
MauritiusSpecial Cases−5.2−72.8−81.5−6.0244.0304.6
IndiaEmerging Economies−8.7−68.1−57.612.7208.9114.7
IsraelSpecial Cases−9.6−65.7−83.313.8111.3342.4
PortugalDeveloped Economies8.5−32.5−64.312.770.3209.1
South AfricaEmerging Economies−24.0−26.6−77.847.362.1124.2
ColombiaEmerging Economies−39.1−34.7−55.966.652.2165.3
PeruEmerging Economies−17.3−58.6−84.228.941.2191.6
GreeceDeveloped Economies−2.0−28.9−62.68.133.3163.8
FinlandDeveloped Economies−10.2−43.6−71.88.420.5149.8
MexicoEmerging Economies−5.3−16.2−44.015.917.624.0
New ZealandDeveloped Economies−14.1−24.1−83.4−30.2−29.5138.4
ChinaSpecial Cases−86.0−95.0−96.9−17.284.0−67.0
Note: Negative values indicate contraction during the crisis period and incomplete recovery in 2022. Source: elaboration based on data from UNWTO, the World Bank, and the Heritage Foundation.
Table 5. Pearson correlation matrix.
VariableTourism GDPGDP per CapitaArrivals IEFEmployment
Tourism GDP1.000
GDP per capita−0.1511.000
International Arrivals−0.218 *−0.324 *1.000
IEF0.0810.352 *−0.392 *1.000
Employment−0.210 *−0.405 *0.955 *−0.426 *1.000
Significance: * p < 0.10. Source: elaboration based on data from UNWTO, the World Bank, and the Heritage Foundation.
Table 6. Determinants of tourism recovery (OLS regression).
VariableCoefficientStandard Errort-Statp-Value
Constant85.747335.8260.260.807
GDP per capita (log)47.07534.4811.370.221
IEF−7.950 **2.809−2.830.030
Depth of crisis impact−0.00030.0068−0.050.962
Dependence on international tourism−230.9773412.603−0.070.948
Emerging economies dummy−14.45957.229−0.250.809
Adjusted R20.596
F-statistic2.67 0.132
N12
Significance: ** p < 0.05. Source: elaboration based on data from UNWTO, the World Bank, and the Heritage Foundation.
Disclaimer/Publisher’s Note: The statements, opinions and data contained in all publications are solely those of the individual author(s) and contributor(s) and not of MDPI and/or the editor(s). MDPI and/or the editor(s) disclaim responsibility for any injury to people or property resulting from any ideas, methods, instructions or products referred to in the content.