1. Introduction
The Association of Zoos and Aquariums (AZA) envisions a world where animals thrive because all people respect, value, and conserve wildlife and wild places. In 2015, AZA SAFE: Saving Animals From Extinction was publicly launched with a mission to combine the power of zoo and aquarium visitors with the resources and collective expertise of AZA members and partners to save animals from extinction. AZA-accredited zoos and aquariums have a long history of conservation [
1] which has often been advanced by individual organizations, subject matter experts, or small interest groups. Field biologists, political leaders, and the general public have long valued zoos and aquariums for their roles in teaching and informing the public, as well as fostering respect for living creatures and increasing awareness about their plights in the wild [
2]. Interdisciplinarity has been recognized as essential to solving complex ecological problems, as has the need to decrease the barriers that discourage multi-disciplinary collaboration [
3]. The AZA SAFE framework built on the community’s conservation history and public trust to unify efforts and integrate the public and the multi-dimensional range of conservation expertise [
4] available in zoos and aquariums.
In 2017, AZA projected what would have happened if AZA SAFE were to have been successful after ten years. Anticipated outcomes included AZA members doing more conservation, positive effects on animals and habitats in the wild, increasingly favorable public and professional perceptions of AZA-accredited zoos and aquariums, and changes in organizational culture, such that both conservation activities with demonstrable impact in the wild (hereafter, field conservation) and collaborative conservation had become cultural norms and professional obligations [
5].
The ideas with respect to culture were twofold and self-reinforcing: that more organizational engagement in AZA SAFE would encourage the integration of conservation into the cultures of member organizations, and that this same integration of conservation would encourage more involvement in conservation—including environmental sustainability, conservation action and engagement, and field conservation. Work completed by participants in AZA’s 2018 Executive Leadership Development Program (ELDP) [
6] and several AZA accredited member organizations supported this hypothesis, with reports that integrating conservation into organizational culture [
7] led to improvements in employee engagement, increased conservation action on the part of both employees and guests, and increased conservation-related philanthropy. A synthesis of literature exploring the drivers of organizational culture and subsequent culture change also highlighted the need to look at people’s values, beliefs, and engagement in the mission of the organization [
8,
9,
10,
11,
12,
13,
14]. What was less clear was which specific tactics were particularly effective at cultivating and strengthening a conservation culture, whether the value of those tactics varied by organization, or whether those tactics would be effective and produce similar outcomes across AZA member organizations. Furthermore, the relationship between individuals’ internal motivations and organizational mission had not been explored. One perspective on a culture change model that works is to first look at existing strengths of the organization [
15] and then identify key behavioral shifts that are important to achieve the desired culture change. The same suggested model for culture change advocates for taking small, incremental steps and actively monitoring and measuring how culture changes over time. Other models also recommend first taking stock of the current culture, articulating the visions for the future state, and then creating a roadmap for how to accomplish the cultural change [
16,
17].
These discussions and the anecdotal evidence from organizations beginning to assess and characterize conservation culture raised the question of whether these strategies and subsequent results could be generalizable to other zoos and aquariums. In 2019, AZA’s Board of Directors appointed a one-year Conservation Culture Task Force with representation from a diversity of AZA committees, member organizations, and partners to explore this in more depth. The task force’s scope of work included the development of cultural metrics and an associated baseline assessment, along with dissemination of that baseline assessment and a report on its findings.
The assessment explored:
Employee awareness of, connection to, and pride in an organization’s conservation efforts;
Employee comfort with asking guests to support/get involved with an organization’s conservation efforts; and
Approaches and tactics to integrate the organization’s conservation mission more effectively into operations.
By March 2020, the Conservation Culture Task Force completed its work and was disbanded by AZA’s board of directors. Products included an annotated bibliography on organizational culture; a workshop to develop a social science research agenda that reflected priorities, trends, and emerging issues identified as most relevant to meet organizational missions and to guide the next decade of social science research by and about zoos and aquariums in the AZA community [
18]; a logic model articulating activities and outcomes associated with a conservation culture along with the assumptions driving these efforts; and the baseline assessment of conservation culture. The logic model modeled short-term, mid-term, and long-term outcomes associated with internal stakeholders (staff, volunteers), organizations (zoos/aquariums), the broader AZA community of professionals (boards of directors, volunteers, vendors, and commercial partners), and local communities wherein these organizations operate. The outcomes included cognitive, affective, skills-based, and behavioral changes for these various audiences. The logic model also included suggestive, rather than prescriptive, strategies and tactics that could potentially influence the attainment of these outcomes for individual organizations to consider. Each organization was expected to embark on revealing, strengthening, or changing their culture of conservation from a different starting point and there would likely be other contextual factors that would influence this change. The logic model provided a north star to guide zoos and aquariums as they began to reflect on their own conservation cultures.
The task force also identified steps to continue the work into the future, which resulted in the creation of SAFE PACT: People Advancing Conservation Together in late 2020 and a roadmap published in 2023 to focus intentionally on integrating people as part of conservation solutions. Using a facilitated co-design process [
19,
20], representatives from a range of committees, advisory groups, SAFE species programs, and member organizations reaffirmed the long-term desired impact from the logic model: a future where humans and wildlife thrive together. Over the course of those three years, community conversations, including focus groups; discussions at conferences; surveys; facilitated meetings with AZA members, field partners, and other experts; and participatory events convened to (1) identify when we were already integrating people into solutions and (2) what doing more of this could look like in the future. These engagements with the zoo and aquarium community contributed to developing a community of practice and promoting the sharing of tools and resources. Evaluation criteria that have demonstrated increases in long-term motivation of people to engage in conservation were used to measure progress on the roadmap [
19,
20]. According to Cranston et al. [
19,
20], these five conservation psychology criteria include meaningful ownership, effective autonomy, community demand, group efficacy, and self-regulated understanding. These criteria were also used as guideposts for understanding the conservation culture assessment.
The next logical step in this work toward advancing a conservation culture in zoos and aquariums was to establish a baseline understanding of the AZA community’s current conservation culture. The decision was made to gather data from a representative sample of zoos and aquariums to help characterize conservation culture over time and begin to identify areas to target for behavioral shifts. The intention was to look at conservation culture from a holistic view of the AZA community and not to compare institution to institution at this time. This approach could help elucidate variables to take a closer look at, from institution to institution, at a future date.
2. Materials and Methods
In September 2019, members of the Conservation Culture Task Force, representing twenty-three AZA member organizations, were invited to share any organizational assessment/survey instruments being used to assess internal conservation cultures. The intention was to look across a sampling of current instruments already in use for commonalities and approaches. A draft survey was developed by a consultant, based on instruments used by two AZA-accredited organizations, and further informed by the literature review, materials used at three other accredited organizations, and the work of the ELDP. Some of the initial items on the instruments shared by these organizations were more visitor-facing in nature and looked at perceptions of conservation rather than culture. The consultant worked to adapt items to be oriented towards staff and volunteers and representative of organizational culture. The authors of the ELDP document were invited to provide feedback, after which the instrument was shared with members of the task force from AZA’s Research and Technology Committee. That same group from the task force then developed sampling methods.
To maximize anonymity, the assessment was administered as a survey hosted on the SurveyMonkey account of a third-party consultant, and no identifiers to individuals or organizations were collected. Antioch University New England’s Internal Review Board (IRB) reviewed the survey questions and its dissemination methodology.
As the intent of the assessment was to monitor trends over time, the quantitative measures on the survey remained the same from the 2020 to the 2023 assessments. However, the survey administrators made minor changes, namely adapting some previously open-ended questions to categorical responses based on prior analyses and adding three open-ended responses to elaborate on scale items, allowing the respondent to provide additional thoughts and context. In addition, the 2023 administration of the survey included questions prompting the respondents to reflect on how the conservation efforts of their organization compared in 2023 with 2020 and, subsequently, why there was or was not a change in those three years.
Lastly, following the 2020 administration of the survey, many participating organizations expressed interest in getting their results. At the time, identifying information as to which organizations respondents were affiliated with were not gathered. For the 2023 administration of the survey, respondents were given the option of indicating at which organization they worked. The third-party consultant then delineated the data by organization and created a threshold for the number of responses per organization that warranted sharing with that organization without compromising the anonymity of respondents. While the 2020 survey and methodology were reviewed by Antioch University New England’s IRB, a different third-party consultant administered the 2023 round of the assessment, and the survey underwent review by the Lincoln Park Zoo’s IRB and received approval. The survey continued to be hosted on the SurveyMonkey platform.
The survey itself consisted of 34 items, including five demographic questions. Survey items were largely informed by the conservation culture logic model and items from other assessments shared by organizations. The survey items were segmented into seven sections:
Conservation familiarity;
Conservation mission connection;
Organization’s efforts;
Organization’s purpose;
Communicating conservation to others;
Change in culture;
About you.
Within conservation familiarity, there were seven items in total. Six items were scaled. One item prompted respondents to rate the importance of conservation to them personally. The remaining five items prompted respondents to rate their level of awareness about different facets of their organization’s conservation efforts. The final item was an open-ended question providing respondents with an opportunity to explain any of their ratings.
The conservation mission connection section of the survey included six items. Items were a combination of scale and categorical response options. Respondents rated their personal connection to their organization’s mission and chose factors that they felt either contributed to or inhibited this connection. Respondents also rated to what extent they felt their work contributed to the mission of the organization. The response to this question then led to skip logic prompting respondents to choose reasons why their work did or did not connect to the mission.
In the organization’s efforts section, five items probed for respondents’ perceptions of the organization’s current conservation efforts. The items were a combination of scale and categorical response options. One item explicitly asked respondents if they felt their organization did enough for conservation. The response to this question again used skip logic to direct respondents to a follow up question to choose reasons why they either felt their organization was or was not doing enough for conservation.
The organization’s purpose section consisted of three items. The first item was a ranked response option. Respondents were asked to rank the purpose of their organization from most important to least important. The next two items were statements on agreement scales regarding the role of the organization’s conservation work in their community and internal engagement that drives connection to the conservation mission.
The section on communicating conservation to others consisted of two items. The first item asked respondents to indicate how frequently they initiated conversations with guests at zoos and aquariums. The next item included several statements for respondents to rate their level of agreement about their knowledge and comfort in communicating about conservation.
The change in culture section was a new one for the 2023 assessment. This section consisted of four items. The items were a combination of scale and open-ended questions. The first item prompted respondents to rate how their organization’s current conservation efforts compared to these efforts three years ago. The second item was a follow-up, open-ended response question to elaborate on what the respondent thought the biggest change in their organization’s efforts had been in the past three years. The third item asked respondents to rate if they felt more or less connected to the organization’s conservation efforts today compared to three years ago. The fourth item in this section was an open-ended question to explain this rating.
The final section, about you, included five demographic questions, which were all optional for completion. The demographics included name of the organization, department, staff or volunteer status, leadership role, and tenure at the organization.
In both 2020 and 2023, the survey was distributed to all CEO/Directors of AZA-accredited facilities. In both years of survey administration, an additional 20 AZA member facilities, stratified by number of staff (50% had 30 or fewer staff; 50% > 30 staff), were randomly selected and asked whether they would be willing to forward the survey to all staff and volunteers. If not, another randomly selected AZA member of that size class was invited to participate. In both rounds of assessment, the survey was administered in December of that year (2020 and 2023, respectively).
Both 2020 and 2023 scaled survey responses were re-coded, and initial descriptive statistical analyses were completed in Microsoft Excel. Two-tailed t-tests were performed to analyze the differences in items between the survey administrations utilizing the Excel data analysis toolkit. The data analysis toolkit was also utilized to perform correlation analyses between select items in the 2023 survey. Chi-square and regression analyses were carried out using the stats package in R software version 4.4.3. [
21]. Qualitative data was analyzed by an independent reviewer from the third-party consulting team using Microsoft Excel software. Qualitative responses were inductively coded to identify themes. Sentiment analysis of responses was conducted in appropriate cases to understand respondents attitudes toward the topic before determining themes within each sentiment. Sentiment was categorized as either positive, neutral, or negative. Open-ended responses were reviewed and coded using one of these three categories.
3. Results
The results of this study are further described below. The results are organized by the six major categories of questions explored in the survey:
Conservation familiarity;
Conservation mission connection;
Organization’s efforts;
Organization’s purpose;
Communicating conservation to others;
Change in culture;
Comparisons between 2020 and 2023 data are made whenever possible, and statistical significance is denoted in charts and figures. In addition, we compared sample demographics to ensure representativeness across tenure and positions.
3.1. Sample Demographics
The 2020 survey administration received 1254 responses complete enough to be included in the analysis, and in 2023, we received 803 responses. In both administrations of the survey, respondents came from every role and department across zoos and aquariums. Volunteers comprised a larger proportion of the respondents in 2020 than in 2023 (32% and 9%, respectively). Tenure at their organizations was similar across both administrations (
Table 1), but leadership made up a larger proportion of respondents in 2023 (52%) than in 2020 (40%). However, as the following results will show, 2023 leadership responses generally trended lower than 2020 responses, and as such we do not suspect leadership bias affected the results as previous AZA surveys have shown leadership tends to rate their organization’s efforts higher.
In 2023, we asked respondents to indicate their organization. Ninety-eight different AZA organizations were represented in the responses to this question, with 19 of those having more than one respondent. Response rates were calculated using staffing levels on record at AZA for each of the 19 organizations with multiple respondents and ranged from 1% to 30%.
Individual institutional demographics (e.g., geographic location, operating budget, annual visitation, etc.) were not included in data collection or analysis as this study did not seek to make distinction based on these variables at this time. Rather, the intent was to characterize conservation culture for AZA organizations broadly. However, such distinction by these variables could be useful in future administrations of the survey and subsequent analysis of the data.
3.2. Familiarity with Conservation Efforts
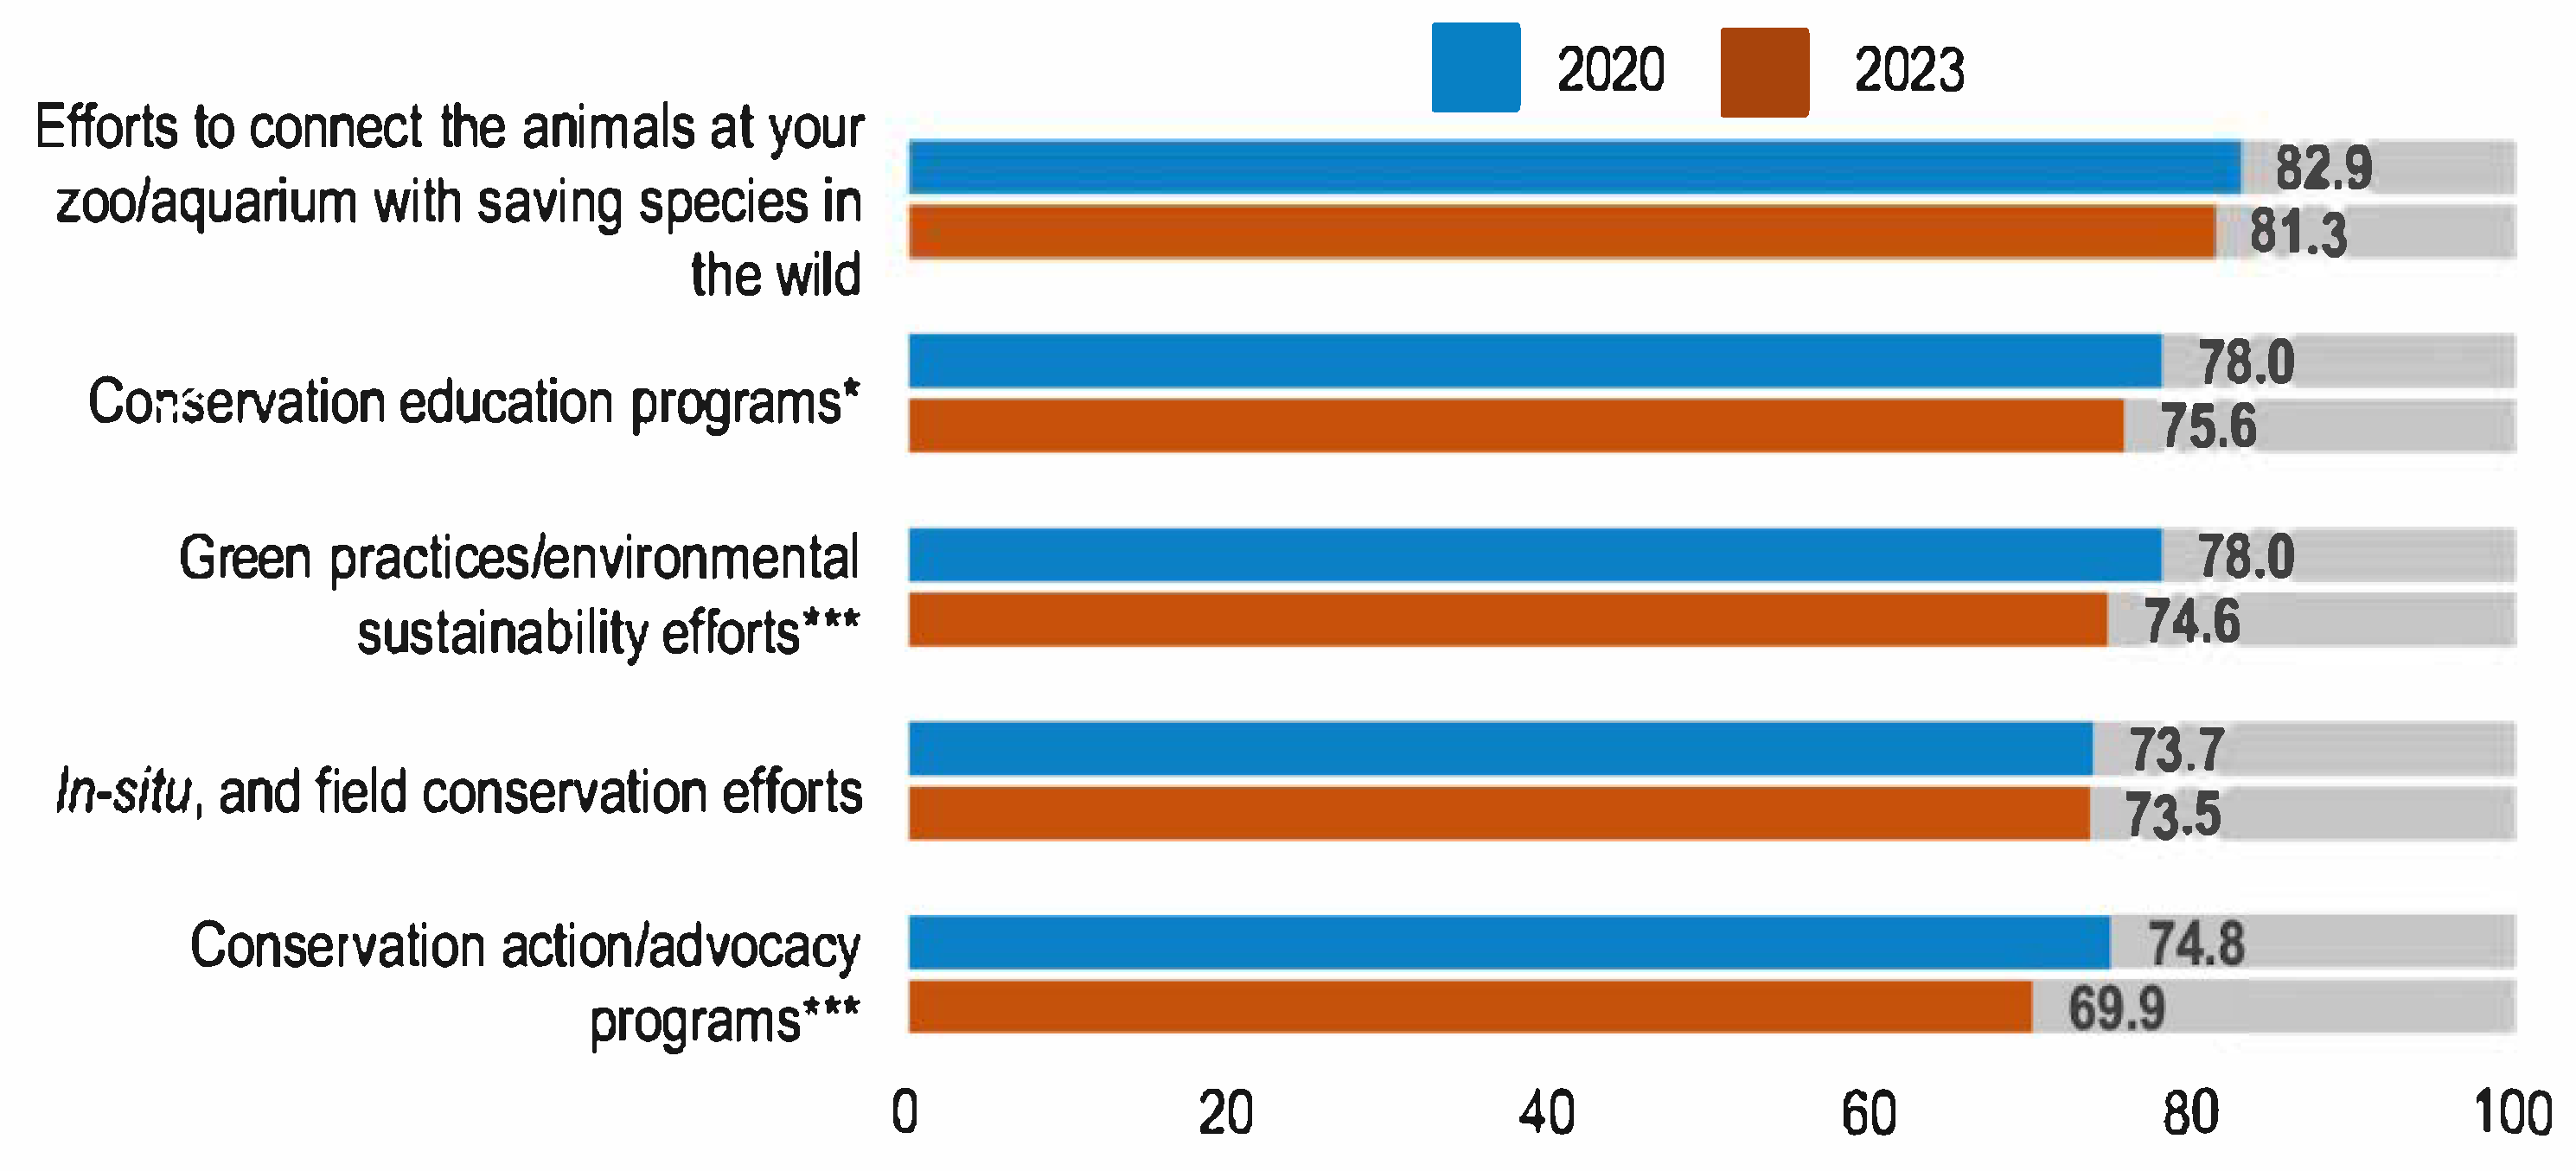
Respondents were first asked to rate their familiarity with the organization’s conservation efforts on a sliding scale of 0 to 100 across five items covering both in situ and ex situ settings. In 2020, they ranged from 73.7 to 82.9, while in 2023, the mean ratings ranged from 69.9 to 81.3. While these ratings are generally high, three of the five areas of conservation efforts had a statistically significant lower rating for familiarity in 2023 compared with 2020: green practices, conservation education, and conservation action/policy (
Figure 1).
Respondents were also given the opportunity to explain these ratings in an open-ended response (new to the 2023 survey). Responses highlighted reasons both for being more familiar as well as why some expressed being less familiar. The most frequently shared reasons for their rating were that they had limited knowledge (37%, n = 41) or awareness (26%, n = 29), or were directly involved in the efforts (26%, n = 29) (
Table 2).
Further analysis of these items showed little to no correlation between familiarity with an organization’s conservation efforts and engagement in different activities, such as participating in conservation activities, discussions with colleagues, etc. (
Table 3). The only activity that had some correlation, albeit low, was familiarity with the organization’s conservation education programs and talking to guests about conservation, which had a Pearson correlation coefficient of r = 0.40.
3.3. Connection to Conservation Mission
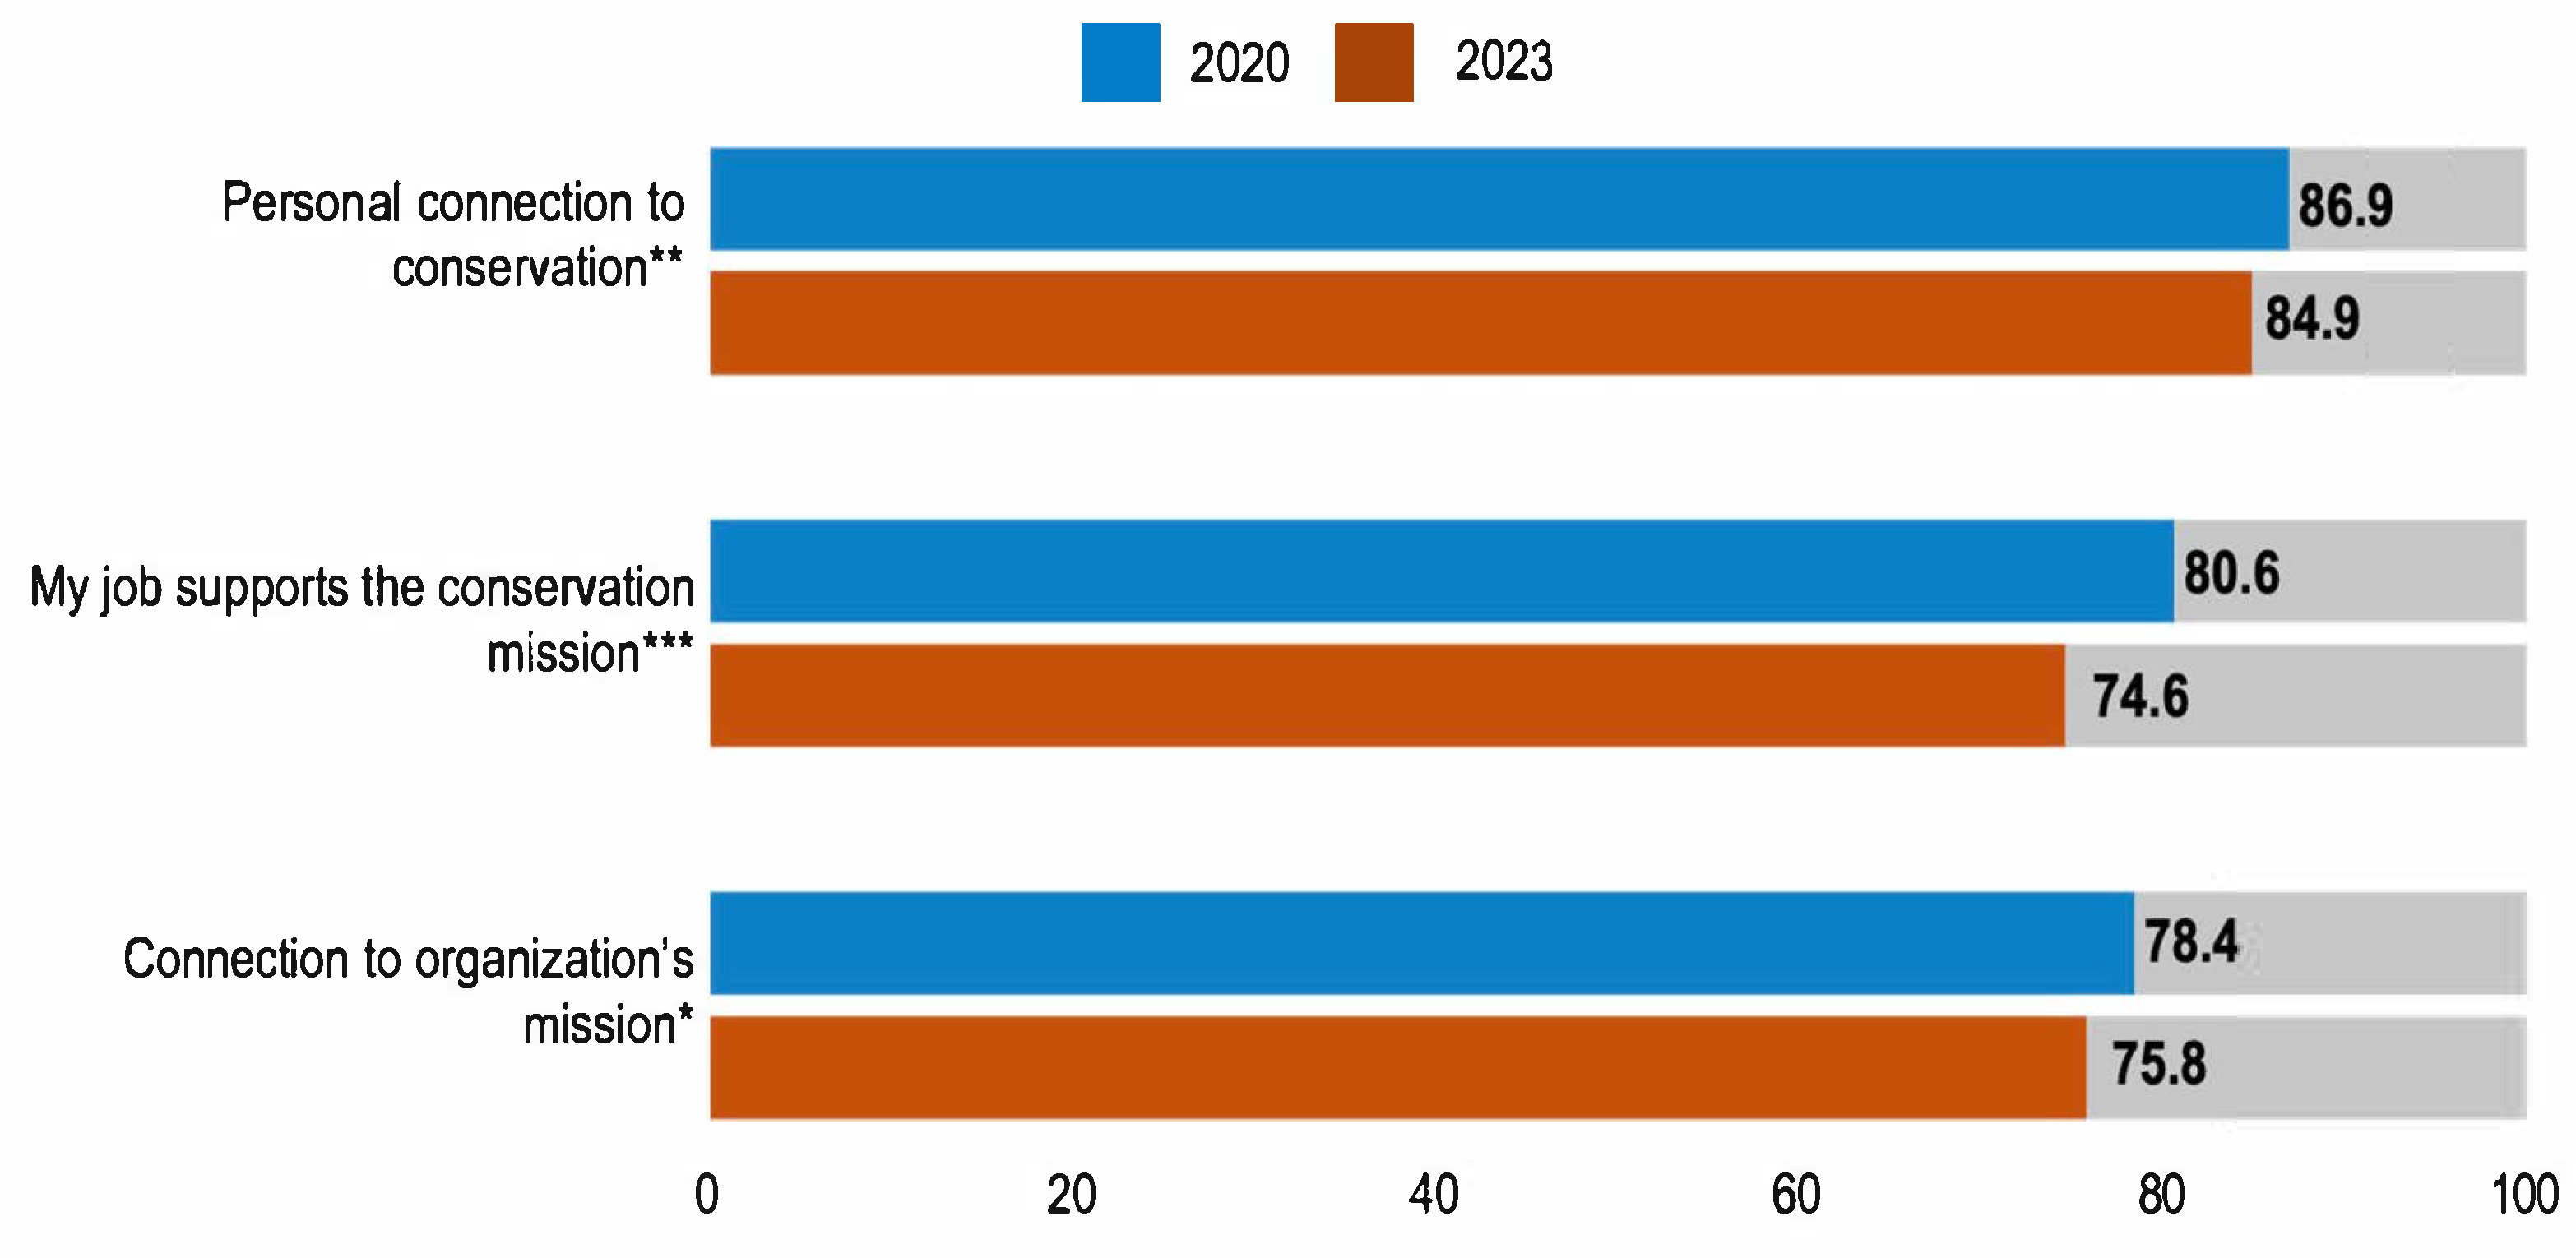
Respondents also rated their level of connection to the conservation mission of their organization using three items on the same sliding 100-point scale. Mean ratings ranged from 78.4 to 86.9 in 2020 and from 74.6 to 84.9 in 2023. All three items were statistically significantly lower in 2023, though again, ratings were still considered to be high overall (
Figure 2).
In the 2023 survey administration, participants were asked to select why they did or did not feel that their job supported the conservation mission (
Table 4). Public engagement around conservation as part of their job was the most frequently cited reason (28%, n = 210). Conversely, lack of direct engagement in conservation activities (30%, n = 15) was the most frequently cited reason for those who felt that their job did not support conservation efforts.
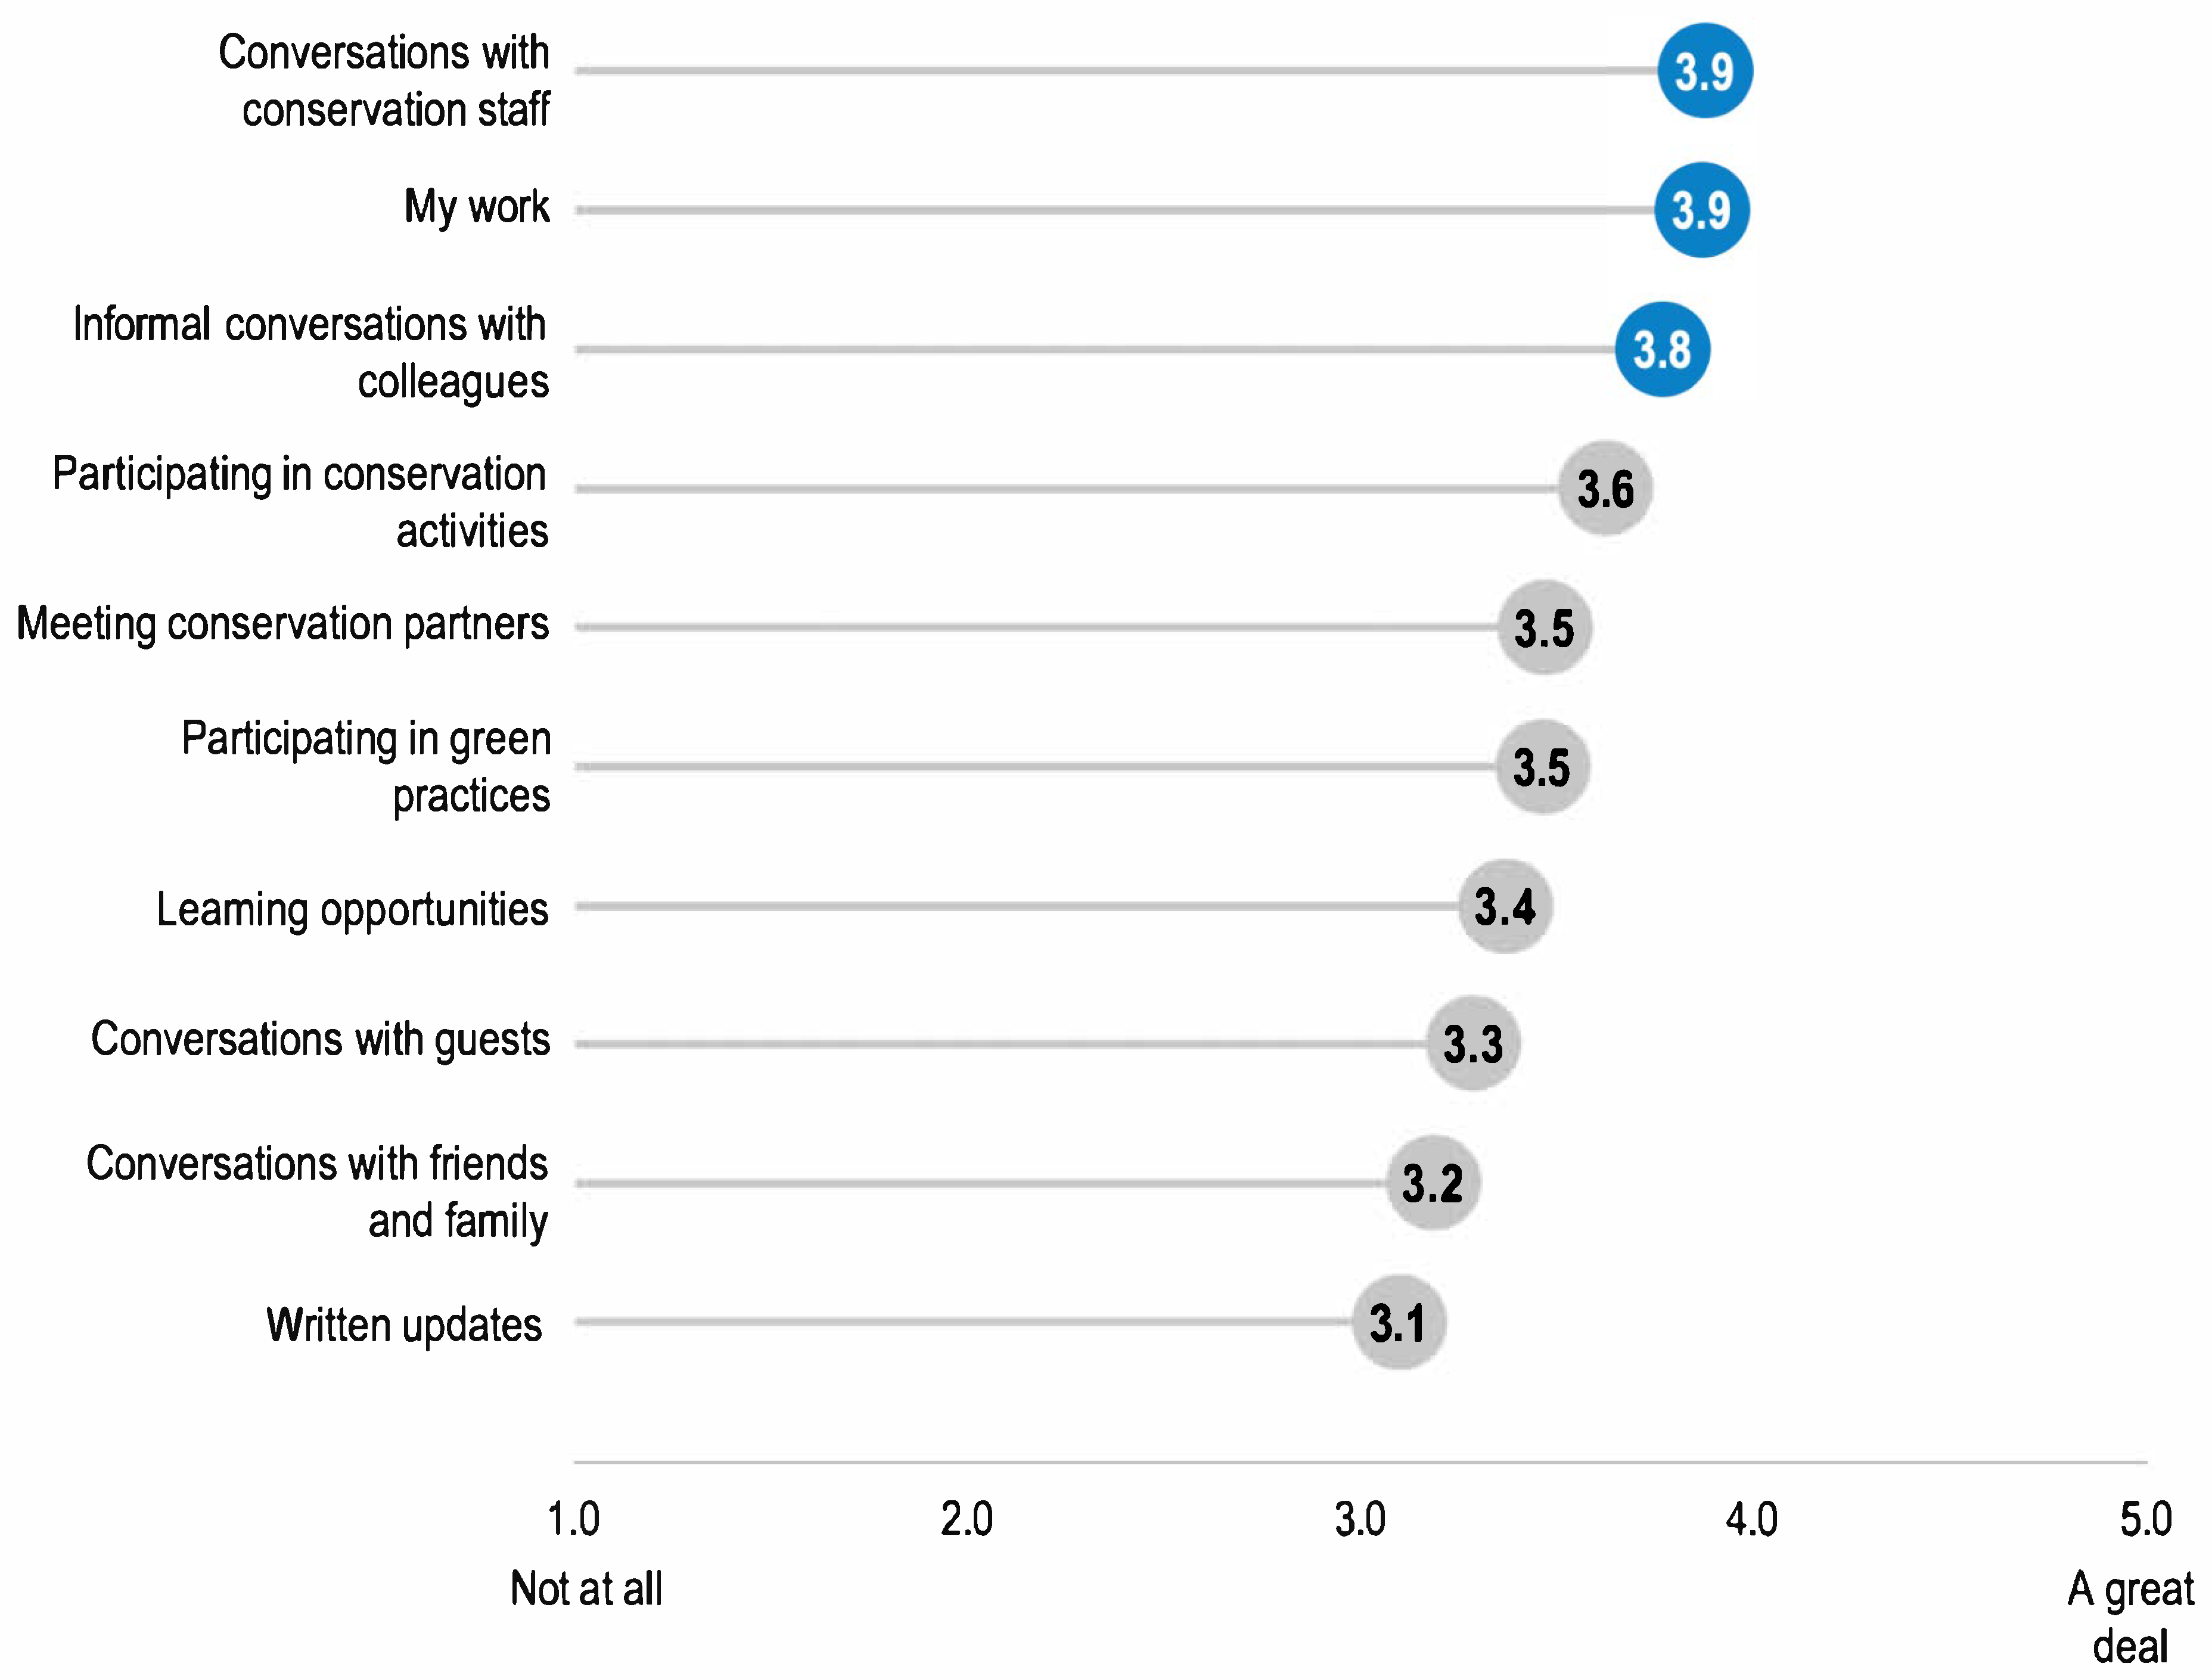
Respondents were then asked to rate which activities had the greatest impact on their connection to the organization’s mission on a 5-point Likert scale, from 1 (not at all) to 5 (a great deal). The activities received mean ratings between 3.1 and 3.9 (
Figure 3). The lowest-rated activity was “written updates” at 3.1. The highest-rated activities were “my work” and “conversations/interactions with staff doing conservation” at 3.9.
Those who indicated “my work” had the greatest impact had a mild correlation with their personal connection to the organization’s conservation mission (r = 0.49) (
Table 5). Conversations or interacting with staff doing conservation also had some relationship with feeling connected to the mission, with a Pearson correlation coefficient of r = 0.41.
3.4. Perceptions of Conservation Efforts
Respondents were also asked whether or not they felt their organization was doing enough for conservation. In 2020, 48% (n = 618) of respondents felt their organization was doing enough; this dropped to 42% (n = 320) in 2023 (
Table 6). In 2020, 31% (n = 391) felt the organization was not doing enough, and this rose to 35% (n = 262) in 2023. A Chi-square test was performed to examine differences in these responses between the two survey administrations. There was a statistically significant difference between the two time periods, with respondents in 2020 being more likely to indicate that their organization was doing enough for conservation,
X2 (2, n = 687) = 19.63,
p < 0.005.
Respondents also had the opportunity to choose reasons why they felt the organization was or was not doing enough for conservation after this question in 2023. For those who thought the organization was doing enough, the top reason was that it was an organizational priority (33%, n = 105), followed by the organization’s general involvement in field conservation (17%, n = 51). For those who did not feel the organization was doing enough, the top reason was that, in general, they felt the organization could do more (29%, n = 102).
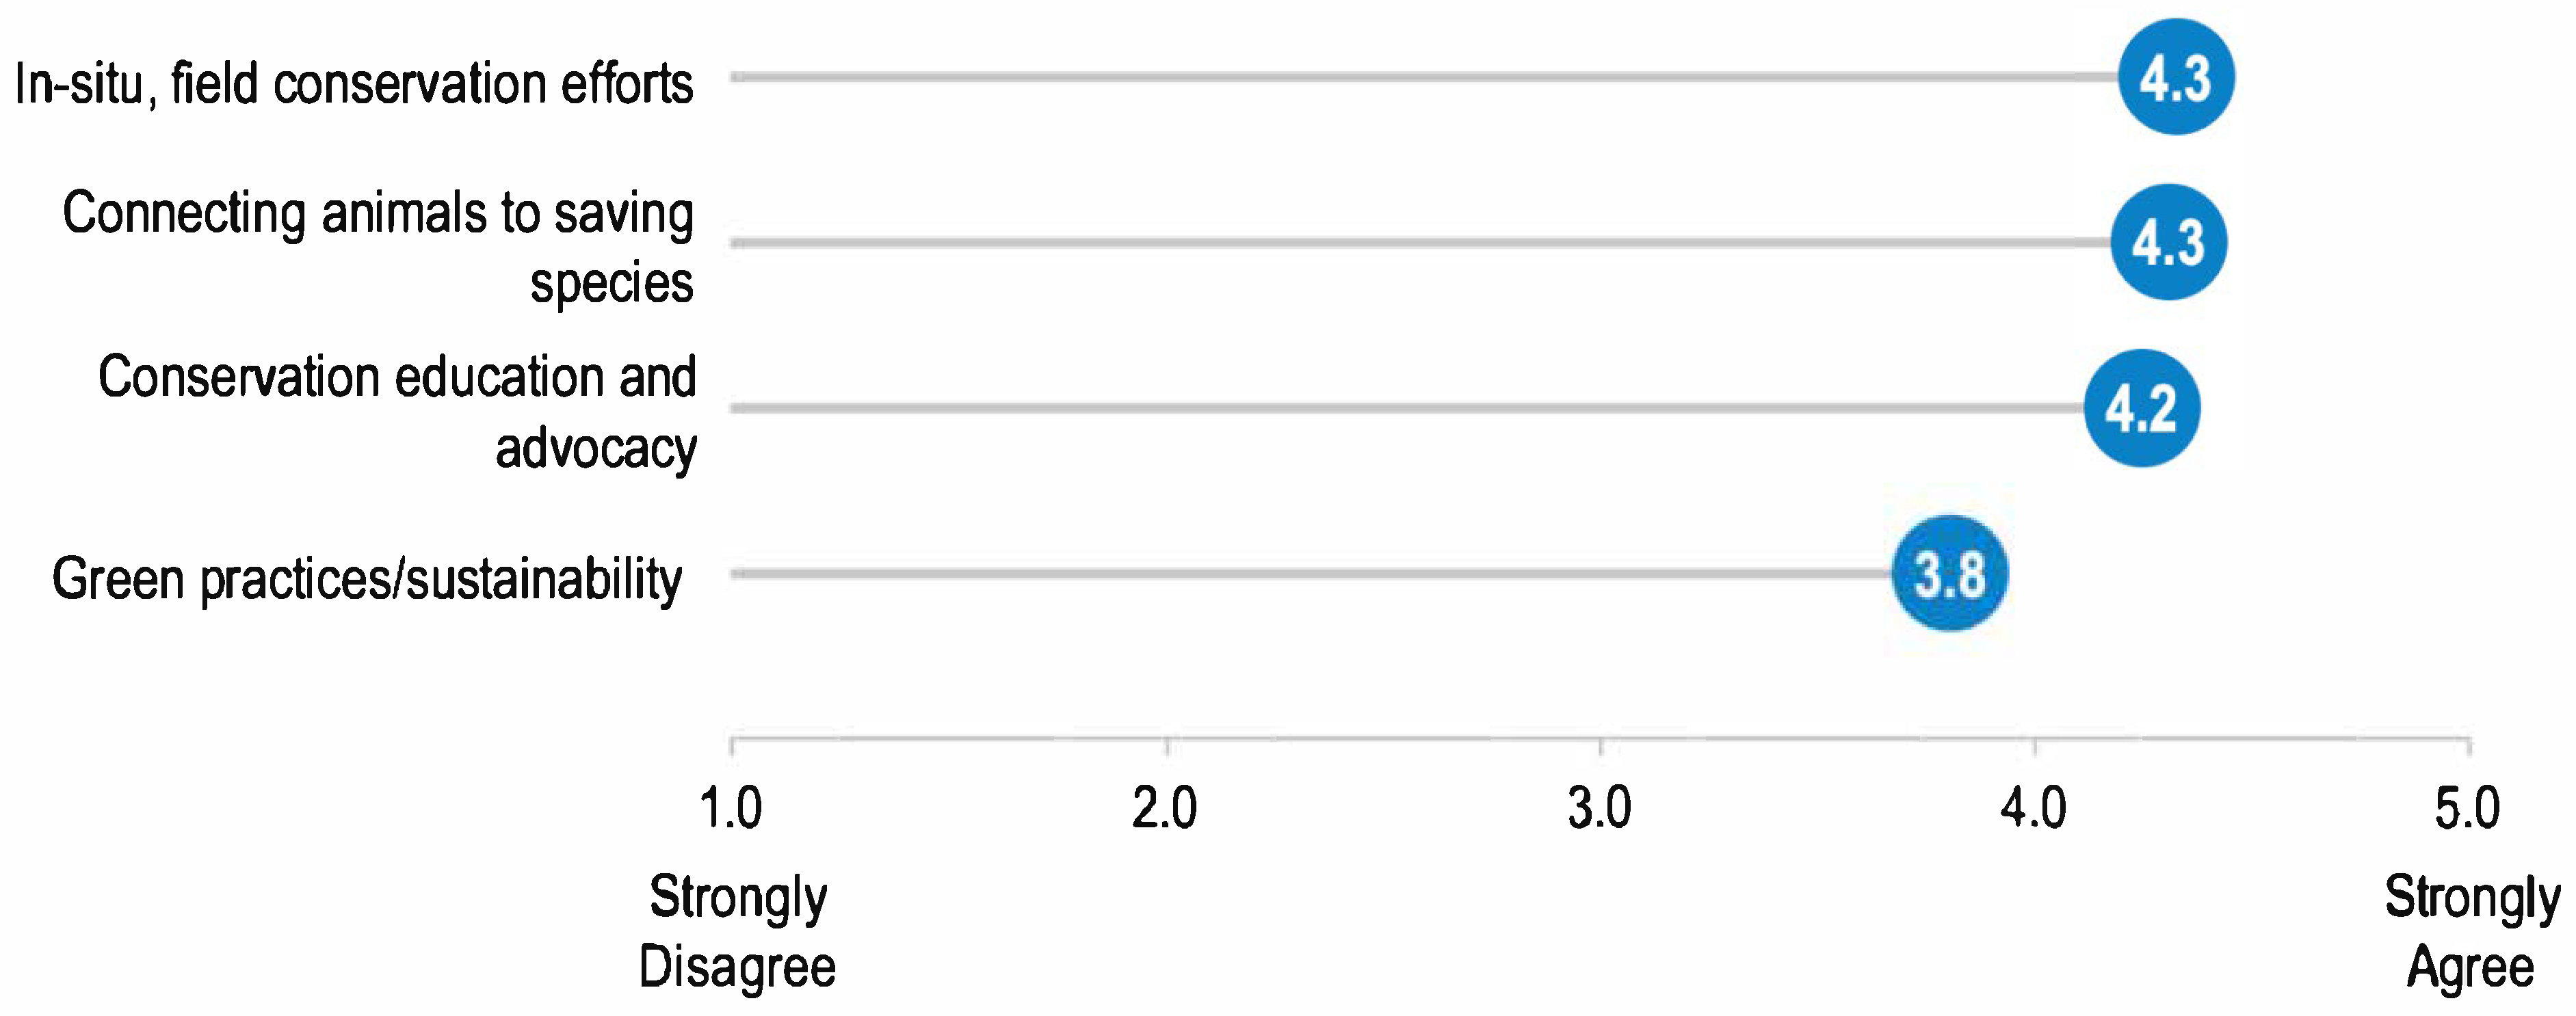
Respondents were then asked about pride in their organization’s efforts (
Figure 4). On a 5-point Likert scale for agreement, respondents were most proud of their organization’s efforts in in situ conservation (
= 4.3) and connecting animals at the zoo/aquarium to saving species in the wild (
= 4.3). Pride in their organization’s green practices was rated lowest (
= 3.8). These questions were only included in the 2023 survey administration.
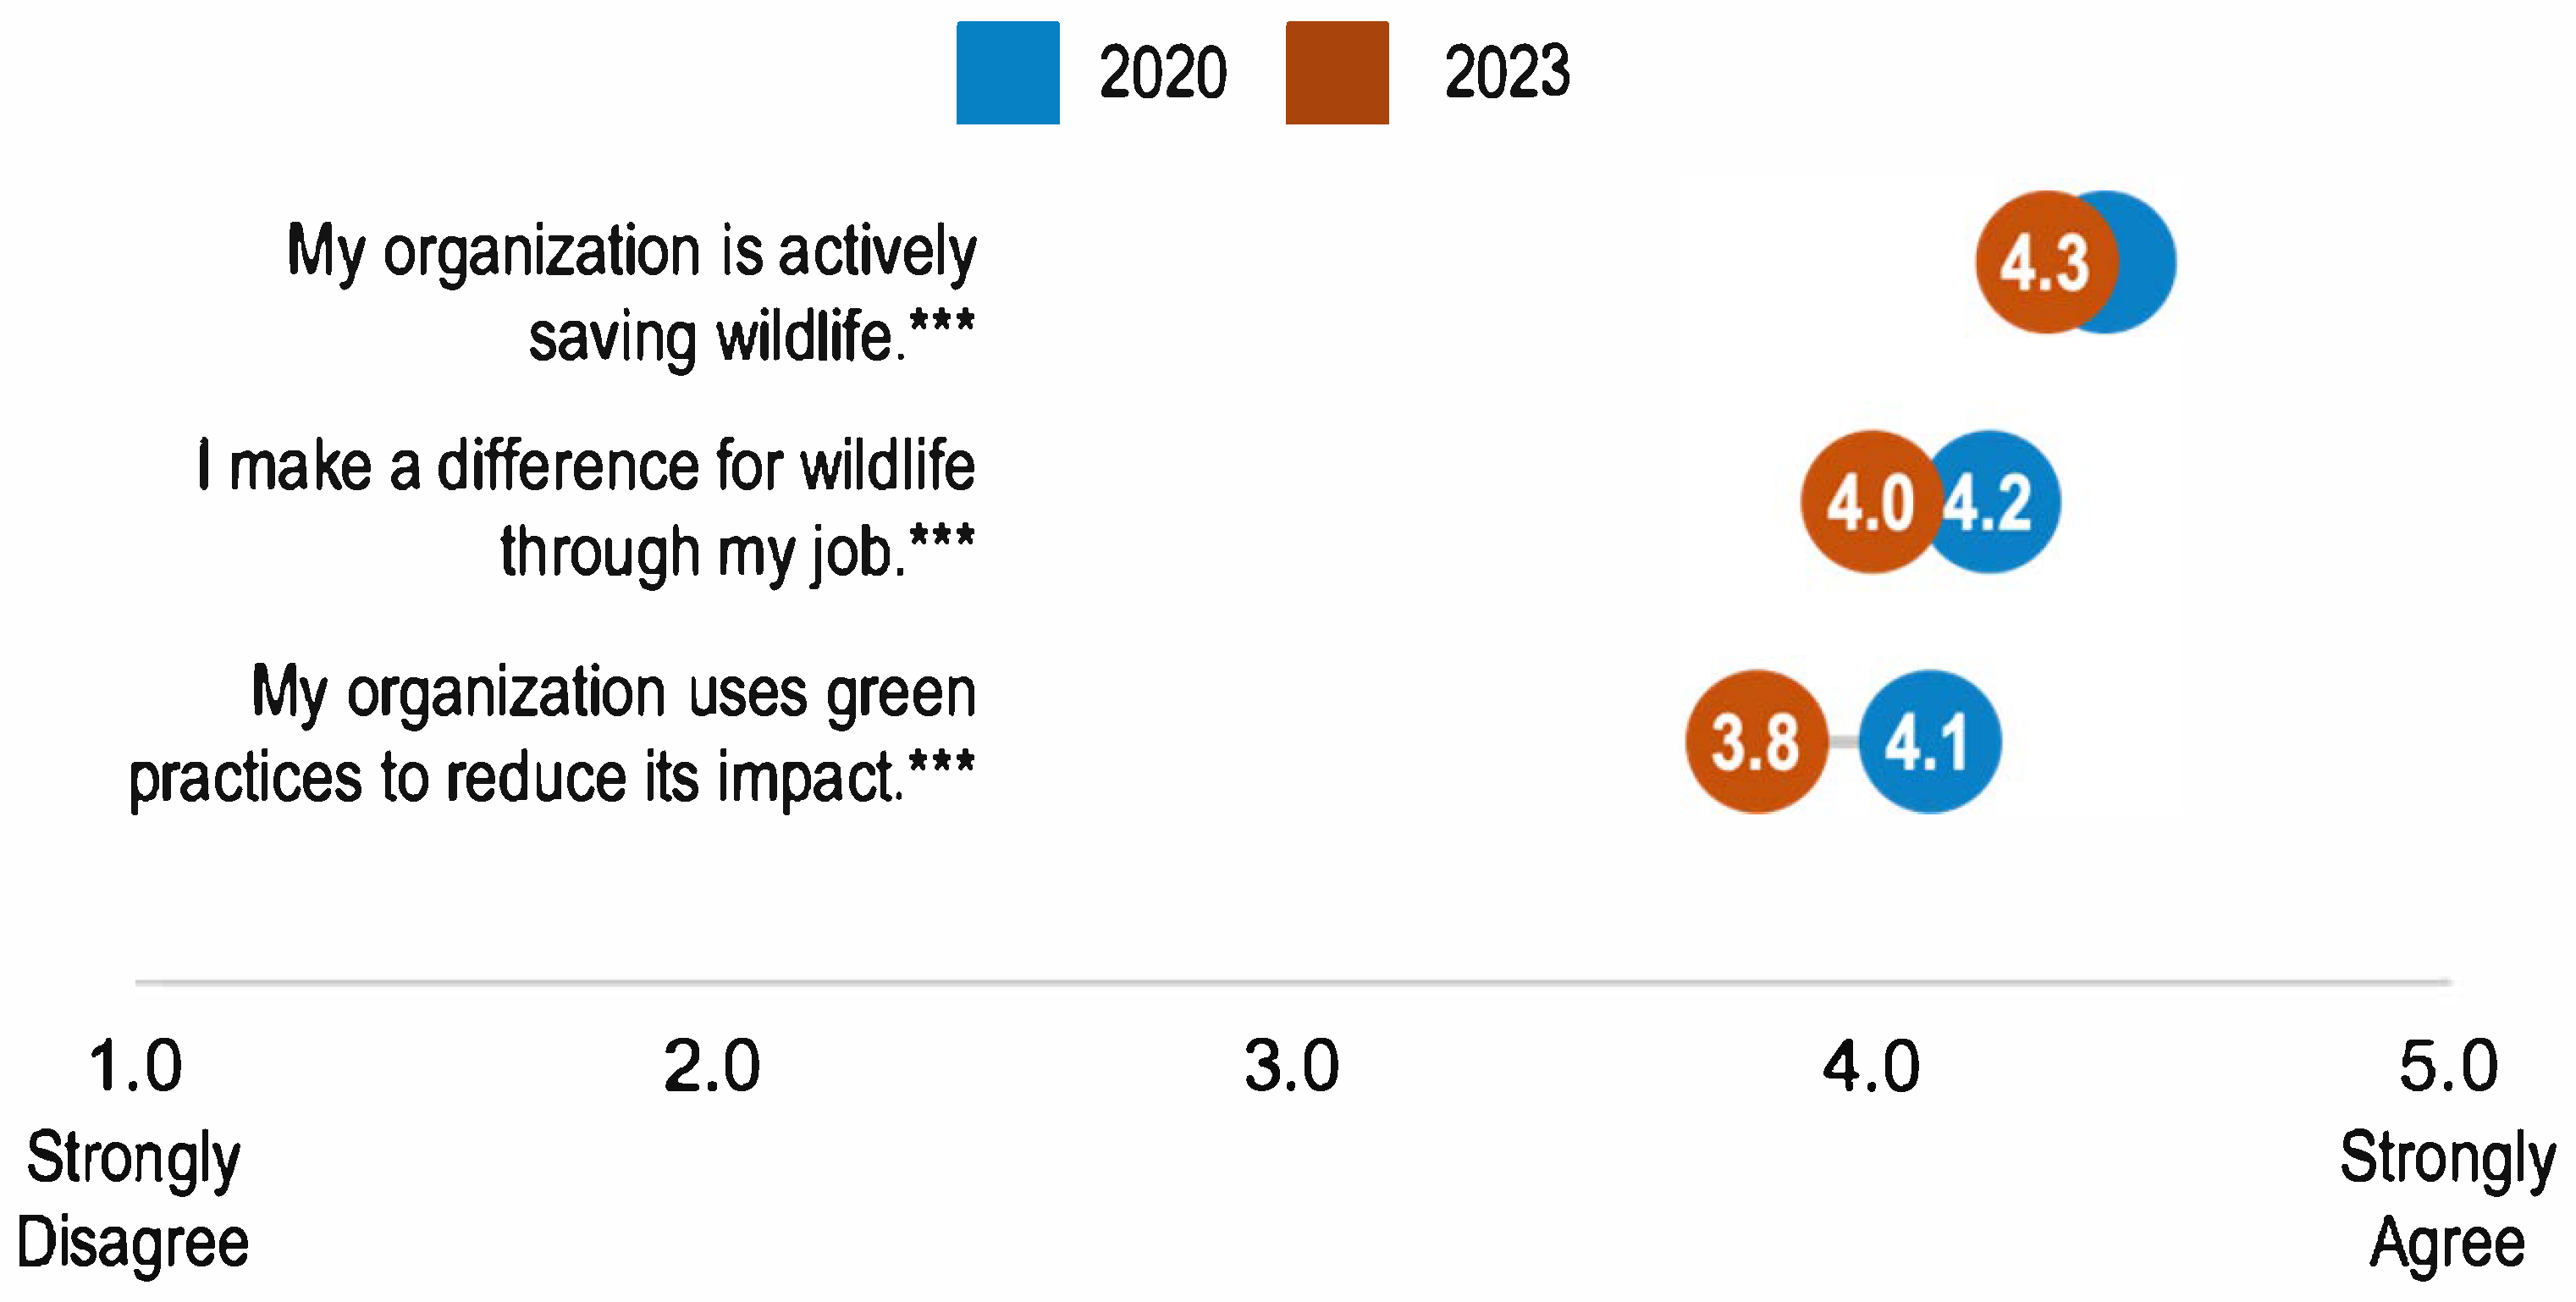
Respondents mostly agreed that their work and the work of the organization were making a difference for wildlife. However, ratings for all three items were slightly lower in 2023 compared to 2020 (
Figure 5). Ratings for the organization’s green practices were lowest in both survey administrations, a recurring pattern across many survey items addressing internal sustainability efforts.
3.5. Perceptions of Organizations’ Purpose
Finally, respondents were asked to rank the purpose of their organization, given eight different options. The ranking ranged from 1 (most important) to 8 (least important). As shown in the table below, mean rankings stayed fairly consistent in 2020 and 2023 for almost all options except two: “provide amusement to people in our community” and “provide opportunities for people to actively engage in conservation activities.” Providing amusement went up in ranking for importance from 2020 to 2023, and providing opportunities to take action in conservation went down in ranking. The highest-ranked purpose for both survey administrations was “creating learning opportunities for the public.” (
Table 7).
A closer look at the distribution of rankings for each purpose demonstrates where there was synergy around specific items (
Figure 6). For example, the purpose of “creating learning opportunities for the public,” rankings were clustered across rankings of 1 (most important), 2, 3, and 4. Conversely, “advance conservation education in our community” had a wider distribution across 2 through 6, demonstrating less agreement about its importance in the purpose of the organization. Further analysis demonstrated no correlation between personal connection to the conservation mission of the organization and these rankings of purpose (
Table 8).
3.6. Self-Efficacy for Communication and Conservation
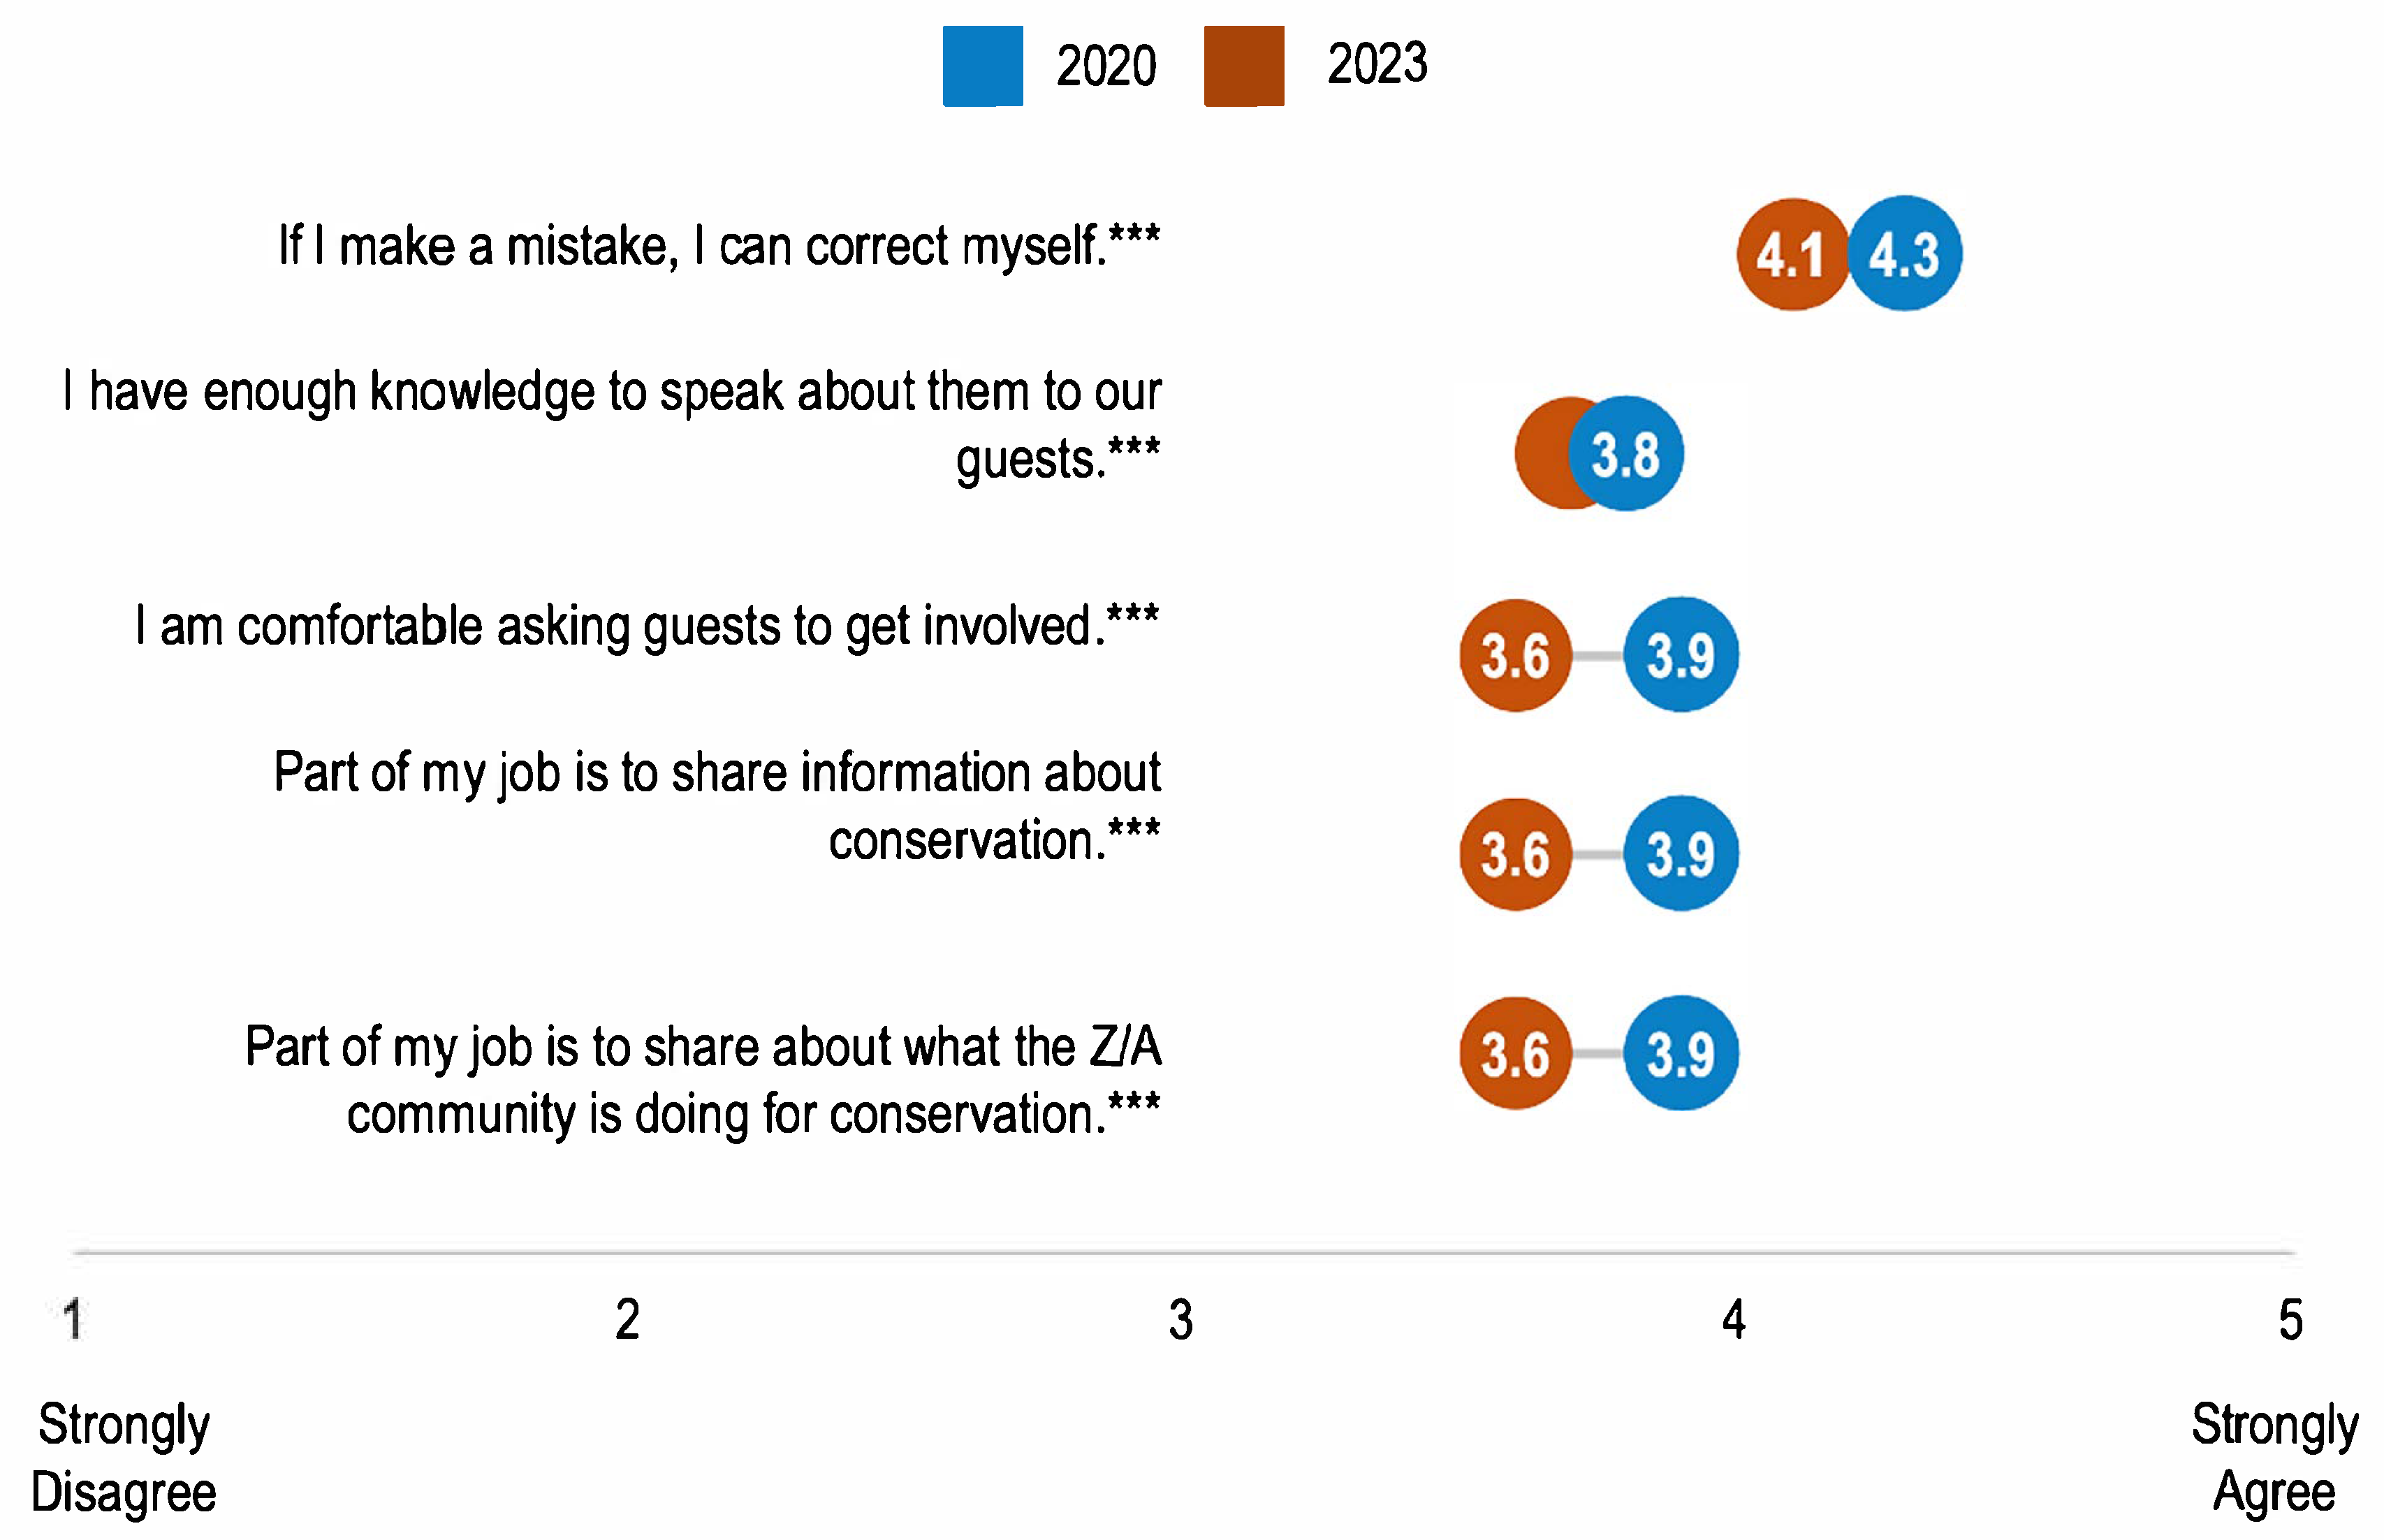
Both in 2020 and 2023, average ratings on a 5-point Likert scale about communicating conservation to others were all between neutral and agree (
Figure 7). In 2023, the mean ratings ranged from 3.6 to 4.1 on the 5-point agreement scale from 5 (strongly agreed) to 1 (strongly disagreed), down from mean ratings ranging from 3.9 to 4.3 in 2020.
3.7. Change in Conservation Culture
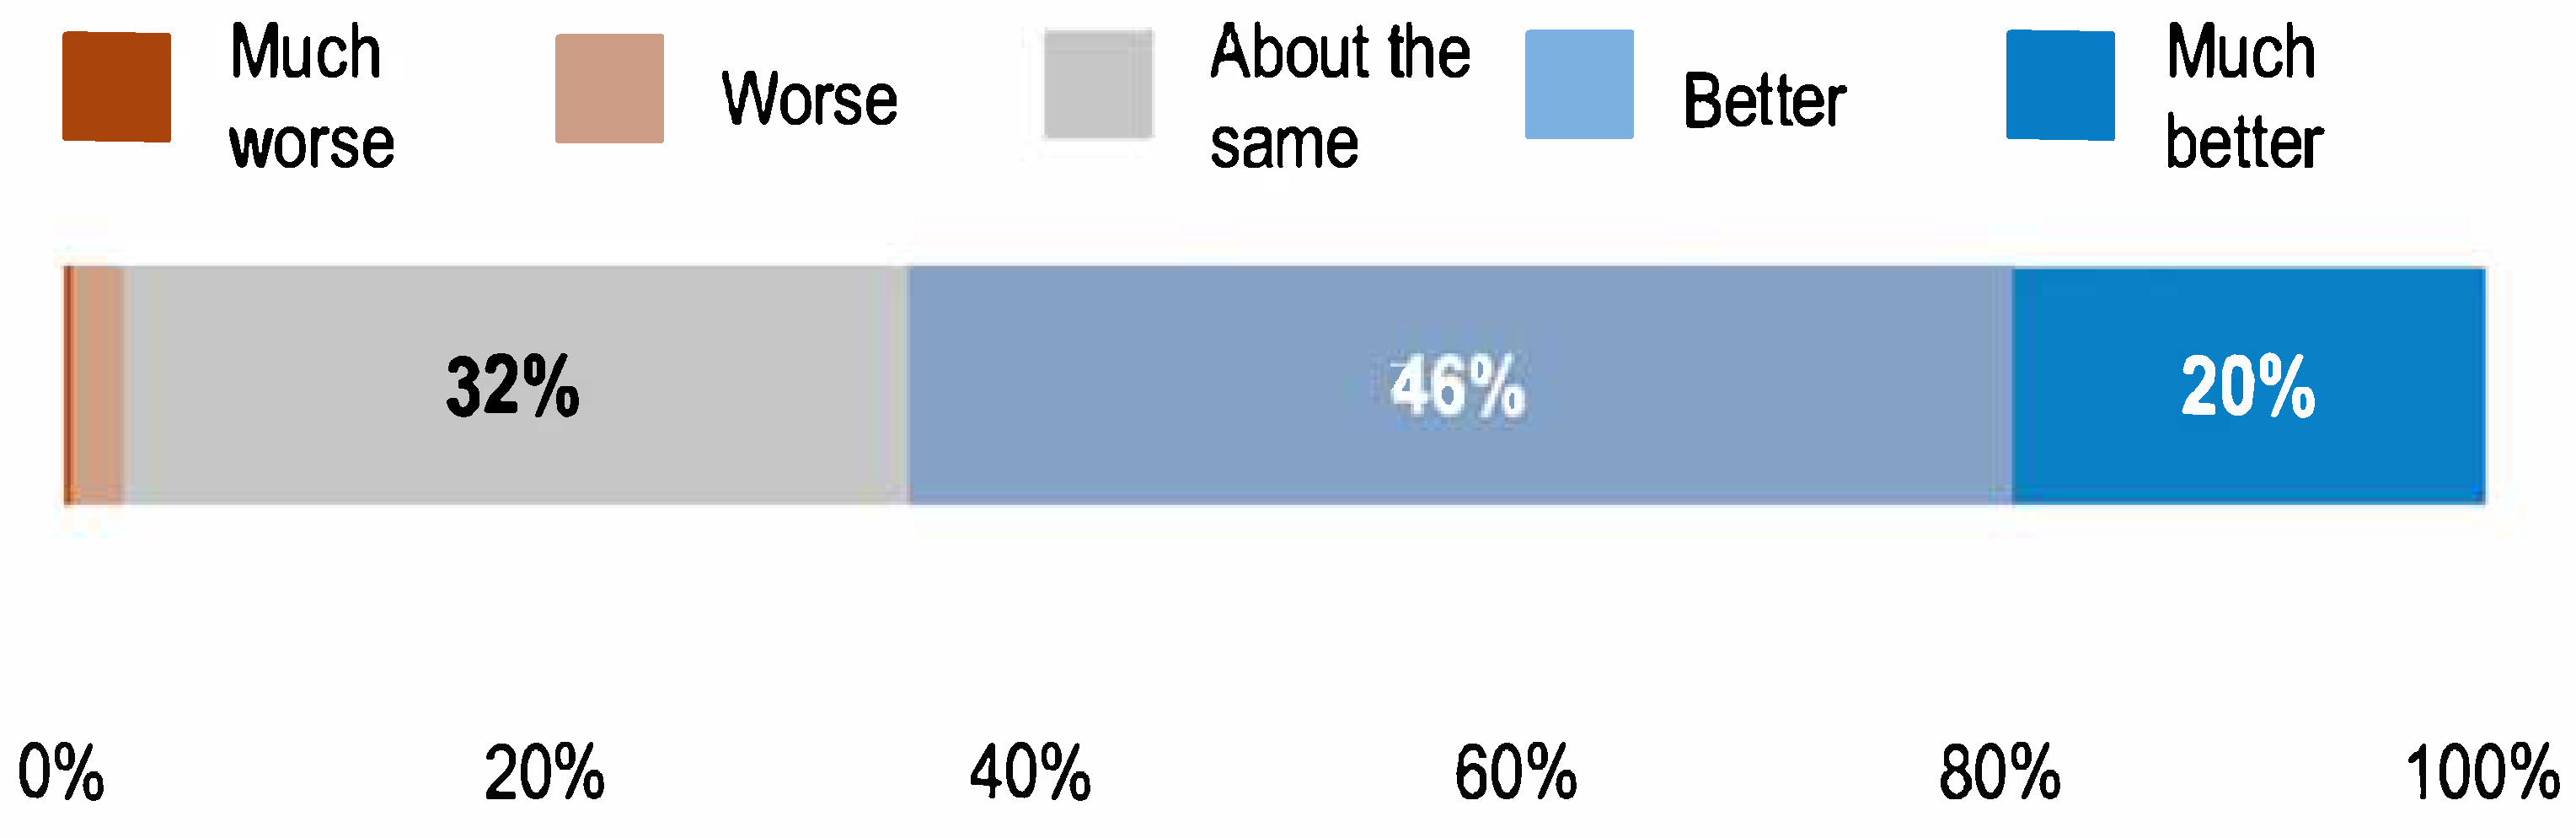
New to the survey in 2023 was a question about how respondents felt their organization’s conservation efforts today, in 2023, compared with those three years prior, in 2020. Respondents could choose on a 5-point scale from 5 (much better) to 1 (much worse). The average rating was
=3.8, which is between about the same and better (
Figure 8).
Open-ended responses further explained these changes. Sentiment analysis demonstrated that of the 412 responses provided, n = 315 (76%) were positive in nature (
Table 9). Of the positive comments, most attributed improvements in conservation efforts to communicating more (both to the public and internally; n = 88, 28%), funding (n = 39, 12%), and internal conservation efforts (e.g., green practices) (n = 31, 10%) (
Table 10). Changes in leadership (n = 22, 7%) and staffing changes (n = 20, 6%) were also amongst some of the most frequently described reasons for positive change.
4. Discussion
The results of both the 2020 and 2023 assessments provided insight as to what factors contribute to the conservation culture of zoos and aquariums. First, staff and volunteer familiarity with their organization’s conservation efforts was moderate, signaling some room for improvement. Conservation efforts at zoos and aquariums are multifaceted, and responses indicated that staff and volunteers were more familiar with some of these efforts than others. Staff and volunteers had the greatest familiarity with broader efforts to connect the animals in their care with efforts to save their counterparts in the wild. Staff and volunteers had the least familiarity with their organization’s advocacy efforts. Overall, these data demonstrate an opportunity to communicate about and engage staff and volunteers more in the organization’s conservation efforts.
Second, staff and volunteer’s personal connection with conservation and their direct contribution to conservation efforts drive stronger connections to the organization’s conservation mission. There was a positive relationship between one’s role contributing to conservation and perceived connection to the organization’s mission. In short, when a staff member or volunteer person can identify how their work supports conservation, they feel a stronger connection to the organization’s mission. These results highlight an opportunity for organizations to articulate more clearly how different roles at the organization support conservation efforts. When asked what other activities contributed to their connection to organizational mission, there was no definitive answer. Conversations with staff about conservation and an individual’s work were highest, but by a slim margin. Most activities were rated as fairly neutral in terms of contribution to feeling connected to the mission, which has implications when organizations consider investing in various strategies to reinforce connections to the mission. It may be that it is the aggregate of multiple variables that influences the connection as opposed to one individual activity versus another. This, too, may warrant further exploration in future research.
Next, in both assessments, staff and volunteers appreciated the conservation efforts of the organization but felt more could be done, particularly around internal green practices. This raises questions about how staff and volunteers perceive what it means to be a conservation organization. What proportion of the organization’s work should be directly linked to conservation in order to be considered a conservation organization? These questions warrant further exploration in future research. In addition, the ranking by staff and volunteers of the purpose of their organization ranked education and conservation high, though engaging people directly in conservation action was lower. This further affirms the need to probe deeper, perhaps with more qualitative data, into how staff perceive and define a conservation organization.
Lastly, staff and volunteers felt their organization’s conservation efforts had somewhat improved in the three years between the assessments, but again with the caveat that more needs to be done. Qualitative responses indicated a mix of reasons for these ratings from staff. Some staff and volunteers cited staff and/or leadership turnover and a reallocation of resources towards conservation, indicating a period of transition for some organizations. The 2023 assessment results demonstrated some optimism for what the future may bring for conservation efforts, but ultimately, time will tell how this work will evolve in subsequent years.
This optimism was particularly noteworthy because, for most of the measures, the 2023 results were slightly lower than the 2020 results. While there was no apparent correlation between tenure and the results, qualitative data demonstrated that many organizations had significant personnel transitions (both positive and negative) between 2020 and 2023. This period also marked the peak of, and early recovery from, the COVID-19 pandemic, which catalyzed a tumultuous time for visitor-based organizations such as zoos and aquariums. In organizational culture change models, the type of change management approach and the role of leadership is critical [
22]. Kavanagh explored three different change management styles (indifferent, immediate, and incremental) and their effects on organizational culture. The incremental approach saw the most positive effects in the organizational culture. These findings are relevant because the COVID-19 pandemic triggered exceptionally immediate changes in the organizational culture, including its structure and function, within zoos and aquariums. By the time of the 2023 survey administration, organizations were still navigating the different approaches to change management and the turnover of leadership likely influenced which approach was adopted at individual organizations. This study has helped to characterize the state of conservation culture for zoos and aquariums and it has identified aspects of conservation culture that could benefit from incremental shifts, such as focusing on internal green practices.
Lastly, there are other social and political factors that influence organizational culture, and these may be worth exploring in future studies. Another factor that could contribute to differences in the survey findings may be the make-up of the respondents, since volunteers comprised a larger proportion of the respondents than staff in 2020 than in 2023 (32% and 9%, respectively). We did run analyses to compare staff and volunteer responses and found that in some cases, volunteers rated higher than staff. However, it was not the intent of this paper to explore differences by role and indeed the literature [
15,
16,
22] supports that it is important to address culture change across all positions. We recommend a future study and paper look closer at the differences based on positions to better understand which roles to focus on with specific behavioral shifts.
AZA hypothesized that both conservation activities with demonstrable impact on animals and habitats in the wild and collaborative conservation would become cultural norms and professional obligations by 2027 if SAFE were to have been successful ten years after it was launched publicly. Given the relatively high rankings and ratings regarding connections to organizational mission and conservation, even in the first assessment in 2020, those norms may have already been established in the community. The 2023 assessment, where ratings were lower but feelings that organizations were doing more conservation, may suggest that respondents had become more nuanced about their connections and expectations of conservation organizations and connections to organizational missions.
While this study provides valuable insights into the conservation culture of AZA-accredited zoos and aquariums, some limitations should be acknowledged. First, only two administrations of the survey and the diversity of people that responded make it difficult to ascertain a pattern. A third administration of the survey (expected in 2026) should help rectify this issue. A broader dataset could also help provide greater insight into the nuances of conservation culture based on different organizational factors, as well as the benefits (i.e., on conservation impact, staff recruitment and retention, business performance) of having organizations with strong cultures of conservation and staff highly connected to the organizational mission. Second, the findings are based on data collected from two snapshots in time set three years apart and during a tumultuous period of time (the COVID-19 pandemic). Organizational culture is complex and dynamic and there are nuances to culture that may not be captured in these two time periods alone. As the qualitative data showed, staff reported changes in staffing, including leadership, in this time. Leadership change in particular can be disruptive and the ripple effects of this (both positive and negative) take time to settle in. Additionally, the survey data presented here are still primarily quantitative in nature. While this is effective for monitoring metrics over time and making comparisons, it still does not paint a complete picture. More qualitative data, or additional quantitative data related to business performance or conservation investment, and perhaps case studies of different zoos and aquariums could help respond to some of the questions that have been raised in these studies. This study did not address individual institutional variables that may affect culture, such as geographic location, annual visitation, and so forth. Much of the literature on organizational culture has stemmed from the medical/healthcare field or corporate organizations. The nature of how zoos and aquariums function and who is attracted to working within these organizations is fundamentally different from these other contexts. Even within the zoo and aquarium field, some facilities are non-profit, some are for-profit, and others are operated as municipal organizations run by local governance. This also why we feel this study would benefit from a complementary qualitative approach such as case studies to better understand the specifics of zoo and aquarium culture. Qualitative data, coupled with a larger sample of AZA facilities responding to the survey, could provide the greatest insight into what is or is not driving culture. Lastly, culture is driven by people and individual zoos and aquariums may want to consider engaging staff in an appreciative inquiry approach [
23] to help facilitate change and gather data to monitor and measure the evolving conservation culture at their organization.
Author Contributions
Conceptualization, S.G. and J.O.; methodology, data curation, and data analysis, J.K. and A.L.; interpretation, S.G., J.K., A.L. and J.O.; writing, S.G., J.K. and A.L.; review, J.O. All authors have read and agreed to the published version of the manuscript.
Funding
This research was supported by the Association of Zoos and Aquariums.
Institutional Review Board Statement
The study was conducted in accordance with the Declaration of Helsinki, and the protocol was approved by the Ethics Committee of the Lincoln Park Zoo, IRB-EX-23-004 on 22 November 2023.
Informed Consent Statement
Informed consent for participation was obtained from all subjects involved in the study.
Data Availability Statement
The data from this study are not publicly accessible, however, they may be provided upon request through the corresponding author and with approval from the Association of Zoos and Aquariums.
Acknowledgments
This study is the culmination of years of work involving a number of people engaged with the AZA community. We would like to thank participants in AZA’s Executive Leadership Development Program (ELDP) 2018 and 2019 cohorts for their contributions to spearhead the initial work in this area. We would like to thank members of AZA’s Conservation Culture Task Force, chaired and championed by Jackie Ogden, for carrying on this work. The logic model that the task force produced helped define many of the aspects of conservation culture that the AZA community now strives to achieve. In particular, we would like to thank Vicki Searles for her work in refining the logic model alongside consultants from Inform Evaluation & Research. We would also like to thank the members of the task force, and especially John Fraser, Rich Bergl, Louise Bradshaw, Katie Leighty, Joy Kubarek, and Vicki Searles, who informed and reviewed the conservation assessment tool. Additional thanks to Antioch University New England, and especially Kayla Cranston, Kathryn Clemens, Meaghan Guckian, and Victoria Threadgill for their reviews of the survey instrument and data analyses of the 2020 assessment. We would like to thank Amy Rutherford for supporting these efforts and helping develop communities of practice and resource-sharing, liaisons with AZA’s Board of Directors, including Alejandro Grajal and Doug Piekarz, and members of AZA’s Human Resources Committee, especially Kristin Finney, Jeff Vanek, and Kyle Lundby.
Conflicts of Interest
Authors Joy Kubarek and Amanda Lindell were employed by the company Inform Evaluation & Research, Inc. The remaining authors declare that the research was conducted in the absence of any commercial or financial relationships that could be construed as a potential conflict of interest.
References
- Fraser, J.; Sickler, J. Why Zoos and Aquariums Matter; Institute for Learning Innovation: Edgewater, MD, USA, 2008; Available online: https://wzam.org/wp-content/uploads/Fraser.Sickler.2008_Why-Zoos-and-Aquariums-Matter-Handbook.pdf (accessed on 17 January 2024).
- Henson, P. American zoos: A shifting balance between recreation and conservation. In The Ark and Beyond: The Evolution of Zoo and Aquarium Conservation; Minteer, B.A., Maienschein, J., Collins, J.P., Eds.; University of Chicago Press: Chicago, IL, USA, 2018. [Google Scholar] [CrossRef]
- Goring, S.J.; Weathers, K.C.; Dodds, W.K.; Soranno, P.A.; Sweet, L.C.; Cheruvelil, K.S.; Kominoski, J.S.; Rüegg, J.; Thorn, A.M.; Utz, R.M. Improving the Culture of Interdisciplinary Collaboration in Ecology by Expanding Measures of success. Front. Ecol. Environ. 2014, 12, 39–47. [Google Scholar] [CrossRef]
- Spooner, S.L.; Walker, S.L.; Dowell, S.; Moss, A. The value of zoos for species and society: The need for a new model. Biol. Conserv. 2023, 279, 109925. [Google Scholar] [CrossRef]
- Ripple, K.J.; Sandhaus, E.A.; Brown, M.E.; Grow, S. Increasing AZA-accredited zoo and aquarium engagement in conservation. Front. Environ. Sci. 2021, 9, 594333. [Google Scholar] [CrossRef]
- Wong, W.; Thompson, M.; Murphy, H.; Deheija, N.; Criss, L. Executive Leadership Development Program: Conservation Culture Report, Unpublished work; Association of Zoos and Aquariums: Silver Springs, MD, USA, 2019.
- Morell, K. The Conservationist Redefined: Empowering People to Identify as Conservationists; Connect. January 2020. Available online: https://www.aza.org/connect-stories/stories/the-conservationist-redefined (accessed on 5 February 2025).
- Andriukaitiene, R.; Cherep, A.V.; Voronkova, V.H.; Punchenko, O.P.; Kyvliuk, O.P. Managing Organizational Culture as a Factor in Organizational Change. Humanit. Bull. Zaporizhzhe State Eng. Acad. 2018, 75, 169–179. [Google Scholar] [CrossRef]
- Brady, W.H. Storytelling Defines Your Organizational Culture. Physician Exec. J. 2013, 39, 40–43. [Google Scholar] [CrossRef]
- Bregman, P. A Good Way to Change a Corporate Culture. Harv. Bus. Rev. Digit. Artic. 2009, 87, 2–4. [Google Scholar] [CrossRef]
- Deutschman, M.T. An Enthnographic Study of Nursing Home Culture to Define Organizational Realities of Culture Change. J. Health Hum. Serv. Adm. 2005, 28, 246–281. [Google Scholar] [CrossRef] [PubMed]
- Liudmyla, K. Organizational Culture Study as the System Element of Internal Business Communication. Skhid 2019, 161, 41–46. [Google Scholar] [CrossRef]
- O’Reilly, C.A., III; Chatman, J.; Caldwell, D.F. People and Organizational Culture: A Profile Comparison Approach to Assessing Person-Organization Fit. Acad. Manag. J. 1991, 34, 487–516. [Google Scholar] [CrossRef]
- Rappaport, J.; Richter, S. An Application of Schien’s Theory of Organizational Culture to Experiential Learning. In Proceedings of the Northeast Region Decision Sciences Institute (NEDSI), Baltimore, MD, USA, 16–19 November 2013; pp. 387–401. [Google Scholar]
- Katzenback, J.; Steffen, I.; Kronley, C. Cultural change that sticks: Start with what’s already working. Harv. Bus. Rev. 2012, 90, 110–118. [Google Scholar]
- Mierke, J.; Williamson, V. A framework for achieving organizational culture change. Libr. Leadersh. Manag. 2017, 31, 1–16. [Google Scholar] [CrossRef]
- Kotter, J. Leading Change; Harvard Business School Press: Boston, MA, USA, 1996; 187p. [Google Scholar] [CrossRef]
- Kubarek, J.; Ogden, J.; Rutherford, A.; Grow, S.; Searles, V.M. The AZA Social Science Research Agenda 2020: How the Social Sciences Can Help People and Wildlife Thrive Together. In Zoos and Aquariums in the Public Mind. Psychology and Our Planet; Fraser, J., Heimlich, J.E., Riedinger, K., Eds.; Springer: Cham, Switzerland, 2023; pp. 159–175. [Google Scholar] [CrossRef]
- Cranston, K.A.; Wong, W.Y.; Knowlton, S.; Bennett, C.; Rivadeneira, S. Five psychological principles of codesigning conservation with (not for) communities. Zoo Biol. 2022, 41, 409–417. [Google Scholar] [CrossRef] [PubMed]
- Cranston, K. Building and Measuring Psychological Capacity for Biodiversity and Conservation. Ph.D. Thesis, Antioch University, New England, Keene, NH, USA, 2016. [Google Scholar]
- R Core Team. R: A Language and Environment for Statistical Computing; R Foundation for Statistical Computing: Vienna, Austria, 2025; Available online: https://www.R-project.org/ (accessed on 5 February 2025).
- Kavanagh, M.H.; Ashkanasy, N.M. The impact of leadership and change management strategy on organizational culture and individual acceptance of change during a merger. Br. J. Manag. 2006, 17, S81–S103. [Google Scholar] [CrossRef]
- Trinkley, R. Nurturing a Culture of Change: Creativity and Docents. J. Mus. Educ. 2014, 39, 187–196. [Google Scholar] [CrossRef]
Figure 1.
Respondents’ familiarity with their organization’s conservation efforts. n = 1308, 803. * p < 0.05; *** p < 0.001.
Figure 1.
Respondents’ familiarity with their organization’s conservation efforts. n = 1308, 803. * p < 0.05; *** p < 0.001.
Figure 2.
Respondents’ connection with their organization’s conservation mission. n = 1307, 759. * p < 0.05; ** p < 0.01; *** p < 0.001.
Figure 2.
Respondents’ connection with their organization’s conservation mission. n = 1307, 759. * p < 0.05; ** p < 0.01; *** p < 0.001.
Figure 3.
Activities that impact respondents’ connection to their organization’s mission. n = 718.
Figure 3.
Activities that impact respondents’ connection to their organization’s mission. n = 718.
Figure 4.
Respondents’ pride in their organization’s conservation efforts. n = 727.
Figure 4.
Respondents’ pride in their organization’s conservation efforts. n = 727.
Figure 5.
Respondents’ attitudes toward organizational conservation practices. n = 1274, 756. *** p < 0.001.
Figure 5.
Respondents’ attitudes toward organizational conservation practices. n = 1274, 756. *** p < 0.001.
Figure 6.
Histograms of 2023 organizational purpose rankings. n = 696.
Figure 6.
Histograms of 2023 organizational purpose rankings. n = 696.
Figure 7.
Respondents’ self-efficacy for communication and conservation. n = 739, 1260. *** p < 0.001.
Figure 7.
Respondents’ self-efficacy for communication and conservation. n = 739, 1260. *** p < 0.001.
Figure 8.
Respondents’ perceptions of changes in their organization’s conservation efforts in the previous three years. n = 690.
Figure 8.
Respondents’ perceptions of changes in their organization’s conservation efforts in the previous three years. n = 690.
Table 1.
Organizational tenure of respondents in each survey administration (n = 1197, 692).
Table 1.
Organizational tenure of respondents in each survey administration (n = 1197, 692).
| Time at Organization | 2020 | 2023 |
|---|
| Less than 1 year | 8% | 9% |
| 1–5 years | 38% | 38% |
| 6–10 years | 19% | 21% |
| 11–15 years | 12% | 11% |
| More than 16 years | 23% | 22% |
Table 2.
Most frequent themes about familiarity with conservation efforts (2023, n = 111).
Table 2.
Most frequent themes about familiarity with conservation efforts (2023, n = 111).
| Theme | % (n) | Example Quote |
|---|
| Limited knowledge | 37% (41) | My job is not directly related to my organization’s conservation efforts, and so there are bound to be details I’m unaware of regarding daily efforts. |
| Awareness | 26% (29) | I feel like I am overall aware of our in situ conservation efforts, but do not know a lot of details about the programs. I also am aware of some of the efforts put forth at the zoo for education and advocacy, but also realize there are probably a lot of programs and messaging that I am not aware of. |
| Involved | 23% (26) | I’m actively involved in my organization’s in situ conservation programs, but I don’t know how the zoo’s messaging is related to my program. |
Table 3.
Pearson correlation coefficients between conservation activities and familiarity with conservation (n = 803).
Table 3.
Pearson correlation coefficients between conservation activities and familiarity with conservation (n = 803).
| | Familiarity with Your Organization’s |
|---|
| Activities | In situ, and field conservation efforts? | Green practices/environmental sustainability efforts? | Conservation education programs? | Conservation action/advocacy programs? | Efforts to connect the animals at your zoo/aquarium with saving species in the wild? |
| Conversations/interacting with staff doing conservation | 0.35 | 0.27 | 0.29 | 0.33 | 0.29 |
| My work | 0.34 | 0.24 | 0.33 | 0.30 | 0.30 |
| Informal conversations with colleagues | 0.30 | 0.28 | 0.32 | 0.32 | 0.25 |
| Conversations with guests | 0.21 | 0.27 | 0.40 | 0.31 | 0.33 |
| Conversations with friends, and/or family | 0.20 | 0.24 | 0.27 | 0.28 | 0.28 |
| Participating in conservation activities | 0.31 | 0.23 | 0.19 | 0.26 | 0.24 |
| Written updates | 0.24 | 0.28 | 0.23 | 0.23 | 0.21 |
| Learning opportunities (e.g., trainings, staff seminars) | 0.15 | 0.24 | 0.25 | 0.25 | 0.19 |
| Meeting people from outside our organization that do conservation work | 0.26 | 0.21 | 0.21 | 0.24 | 0.22 |
| Participating in green practices | 0.12 | 0.34 | 0.20 | 0.20 | 0.20 |
Table 4.
(a,b): Reasons for job connection (a), or not (b) to organization’s conservation mission. If respondents rated the item ‘my job supports the conservation mission’ above 50.0, they were asked why they feel that their job supports the conservation mission.
Table 4.
(a,b): Reasons for job connection (a), or not (b) to organization’s conservation mission. If respondents rated the item ‘my job supports the conservation mission’ above 50.0, they were asked why they feel that their job supports the conservation mission.
| (a) Reasons why your job supports your organization’s conservation mission (n = 710) |
| | Count | % |
| Conservation-related public engagement is part of my job | 210 | 30% |
| Organizational support for conservation | 139 | 20% |
| Conservation is part of my job | 129 | 18% |
| Communication | 77 | 11% |
| Involvement in direct conservation activities | 69 | 10% |
| Involvement in green practices/sustainability | 57 | 8% |
| Involvement in other conservation initiatives | 29 | 4% |
| Grand Total | 710 | 100% |
| (b) Reasons why your job does not support your organization’s conservation mission (n = 49) |
| | Count | % |
| Lack of direct involvement in conservation activities | 15 | 30% |
| Lack of general involvement in conservation initiatives | 8 | 16% |
| Lack of organizational support | 8 | 16% |
| Other | 7 | 15% |
| Conservation is not part of my job | 7 | 15% |
| Conservation-related public engagement is not part of my job | 2 | 4% |
| Lack of communication | 2 | 4% |
| Grand Total | 49 | 100% |
Table 5.
Pearson correlation coefficients for activities and connection to organization’s mission (n = 803).
Table 5.
Pearson correlation coefficients for activities and connection to organization’s mission (n = 803).
| Activities | Connection to Conservation Mission |
|---|
| My work | 0.49 |
| Conversations/interacting with staff doing conservation | 0.41 |
| Informal conversations with colleagues | 0.37 |
| Conversations with guests | 0.32 |
| Conversations with friends, and/or family | 0.32 |
| Participating in conservation activities | 0.33 |
| Written updates | 0.28 |
| Learning opportunities (e.g., trainings, staff seminars) | 0.24 |
| Meeting people from outside our organization that do conservation work | 0.25 |
| Participating in green practices | 0.25 |
Table 6.
Respondents’ perceptions of their organization’s conservation efforts (n = 1277, 755).
Table 6.
Respondents’ perceptions of their organization’s conservation efforts (n = 1277, 755).
| Response | 2020 (n, %) | 2023 (n, %) |
|---|
| No—my organization is not doing enough for conservation | 391 (31%) | 262 (35%) |
| Unsure | 268 (21%) | 173 (23%) |
| Yes—my organization is doing enough for conservation | 618 (48%) | 320 (42%) |
Table 7.
Respondent rankings of organizational purpose (n = 1184, 711).
Table 7.
Respondent rankings of organizational purpose (n = 1184, 711).
| | Organizational Purpose |
| 2020 | Create learning opportunities for the public | Advance conservation education in our community | Give access to the public to animals that they otherwise would likely not see in person. | Promote awareness of environmental issues (e.g., promoting the importance of decreasing waste, energy and water that will lessen threats to wildlife) | Provide amusement to people in our community | Support efforts to protect animals and their habitats in the wild (e.g., stopping extinctions and/or increasing animal populations in situ, and field) | Help people connect to nature | Provide opportunities for people to actively engage in conservation activities |
| n | 1091 | 1094 | 1102 | 1099 | 1144 | 1118 | 1138 | 1184 |
| median | 3 | 4 | 3 | 5 | 8 | 4 | 4 | 6 |
| avg | 3.6 | 4.0 | 3.9 | 4.5 | 6.2 | 4.0 | 3.8 | 5.6 |
| st dev | 1.89 | 1.81 | 2.33 | 1.84 | 2.40 | 2.26 | 2.31 | 2.03 |
| 2023 | | | | | | | | |
| n | 687 | 685 | 687 | 692 | 704 | 698 | 704 | 711 |
| median | 4 | 4 | 3 | 5 | 7 | 4 | 3 | 6 |
| avg | 3.6 | 4.2 | 3.9 | 4.7 | 5.6 | 4.1 | 3.8 | 6.0 |
| st dev | 1.81 | 1.86 | 2.34 | 1.92 | 2.64 | 2.28 | 2.27 | 1.88 |
| p-value | 0.88 | 0.22 | 1.00 | 0.07 | <0.001 | 0.69 | 0.89 | <0.001 |
Table 8.
Pearson correlation coefficients for rankings and connection to their organization’s mission (n = 1091, 92).
Table 8.
Pearson correlation coefficients for rankings and connection to their organization’s mission (n = 1091, 92).
| | How Connected do You Feel to Your Organization’s Conservation Mission? |
|---|
| Organization Purpose | 2020 | 2023 |
|---|
| Create learning opportunities for the public | 0.01 | 0.06 |
| Advance conservation education in our community | −0.05 | −0.07 |
| Give access to the public to animals that they otherwise would likely not see in person | 0.15 | 0.07 |
| Promote awareness of environmental issues (e.g., promoting the importance of decreasing waste, energy and water that will lessen threats to wildlife) | −0.08 | 0.05 |
| Provide amusement to people in our community | 0.23 | 0.12 |
| Support efforts to protect animals and their habitats in the wild (e.g., stopping extinctions and/or increasing animal populations in situ, and field) | −0.12 | −0.03 |
| Help people connect to nature | −0.10 | −0.13 |
| Provide opportunities for people to actively engage in conservation activities | −0.09 | −0.06 |
Table 9.
Sentiment analysis of responses (n = 412).
Table 9.
Sentiment analysis of responses (n = 412).
| Sentiment | Count | Prevalence |
|---|
| Positive | 315 | 76% |
| Neutral | 45 | 11% |
| Negative | 52 | 13% |
Table 10.
Themes in reasons for sentiments about changes in conservation efforts at organizations (n = 315, 52).
Table 10.
Themes in reasons for sentiments about changes in conservation efforts at organizations (n = 315, 52).
| Positive Changes | Negative Changes |
|---|
| Theme | Count | Prevalence | Theme | Count | Prevalence |
|---|
| Public communication | 53 | 17% | COVID | 9 | 17% |
| Funding | 39 | 12% | Internal communication | 9 | 17% |
| Internal communication | 35 | 11% | Funding | 7 | 13% |
| Internal conservation efforts | 31 | 10% | Staff change | 6 | 12% |
| Culture focus | 27 | 9% | Leadership support | 5 | 10% |
| COVID | 23 | 7% | Public communication | 3 | 6% |
| Leadership change | 22 | 7% | Leadership change | 1 | 2% |
| Leadership support | 18 | 6% | Conservation staff | 1 | 2% |
| Staff change | 20 | 6% | Staff involvement in conservation | 1 | 2% |
| Conservation staff | 17 | 5% | Internal conservation efforts | 1 | 2% |
| External conservation efforts | 16 | 5% | Integration in operations | 1 | 2% |
| Restructuring/growth | 15 | 5% | Conservation strategy | 1 | 2% |
| Staff involvement in conservation | 15 | 5% | Lack of mission integration | 1 | 2% |
| Conservation strategy | 14 | 4% | |
| Training | 14 | 4% |
| Integration in operations | 10 | 3% |
| Integration in mission | 7 | 2% |
| Guest engagement | 6 | 2% |
| General conservation efforts | 4 | 1% |
| Disclaimer/Publisher’s Note: The statements, opinions and data contained in all publications are solely those of the individual author(s) and contributor(s) and not of MDPI and/or the editor(s). MDPI and/or the editor(s) disclaim responsibility for any injury to people or property resulting from any ideas, methods, instructions or products referred to in the content. |
© 2025 by the authors. Licensee MDPI, Basel, Switzerland. This article is an open access article distributed under the terms and conditions of the Creative Commons Attribution (CC BY) license (https://creativecommons.org/licenses/by/4.0/).


