
Science Education in Primary Students in Ireland: Examining the Use of Zoological Specimens for Learning


Abstract
1. Introduction
2. Materials and Methods
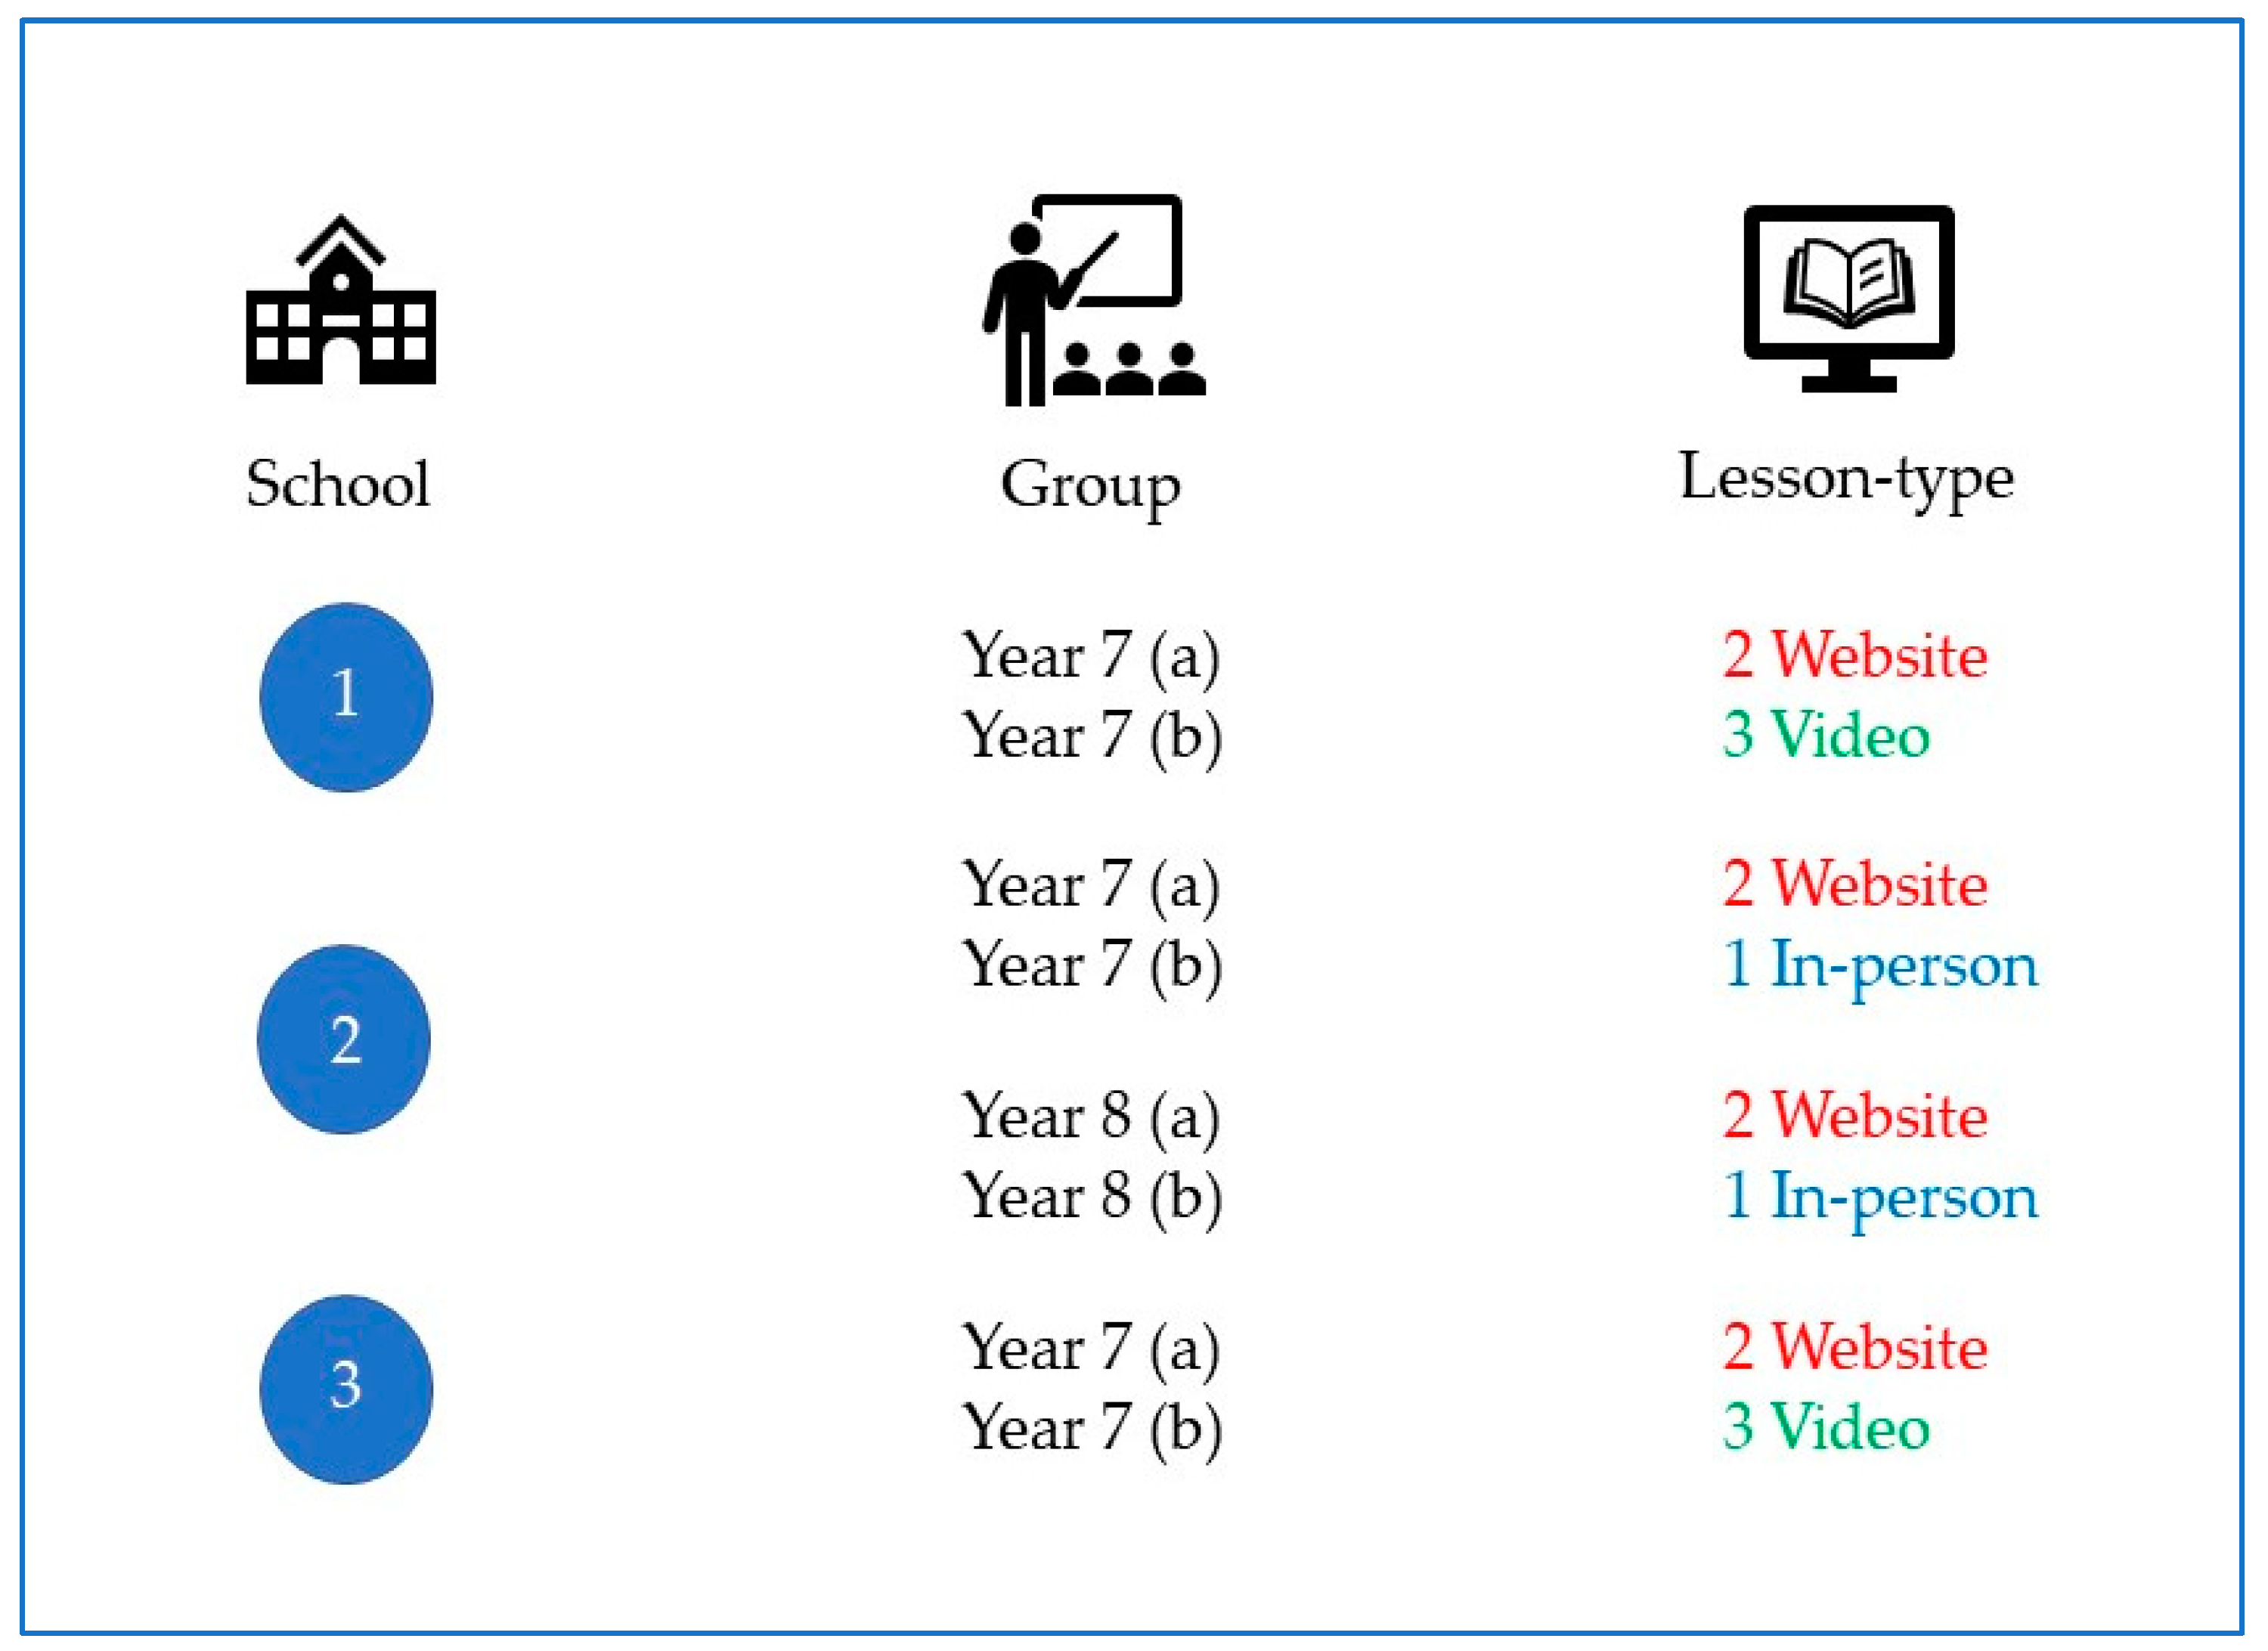
2.1. Site and Study Group
2.2. Procedure
2.3. Questionnaire
2.4. Educational Intervention
2.5. Data Analysis
3. Results
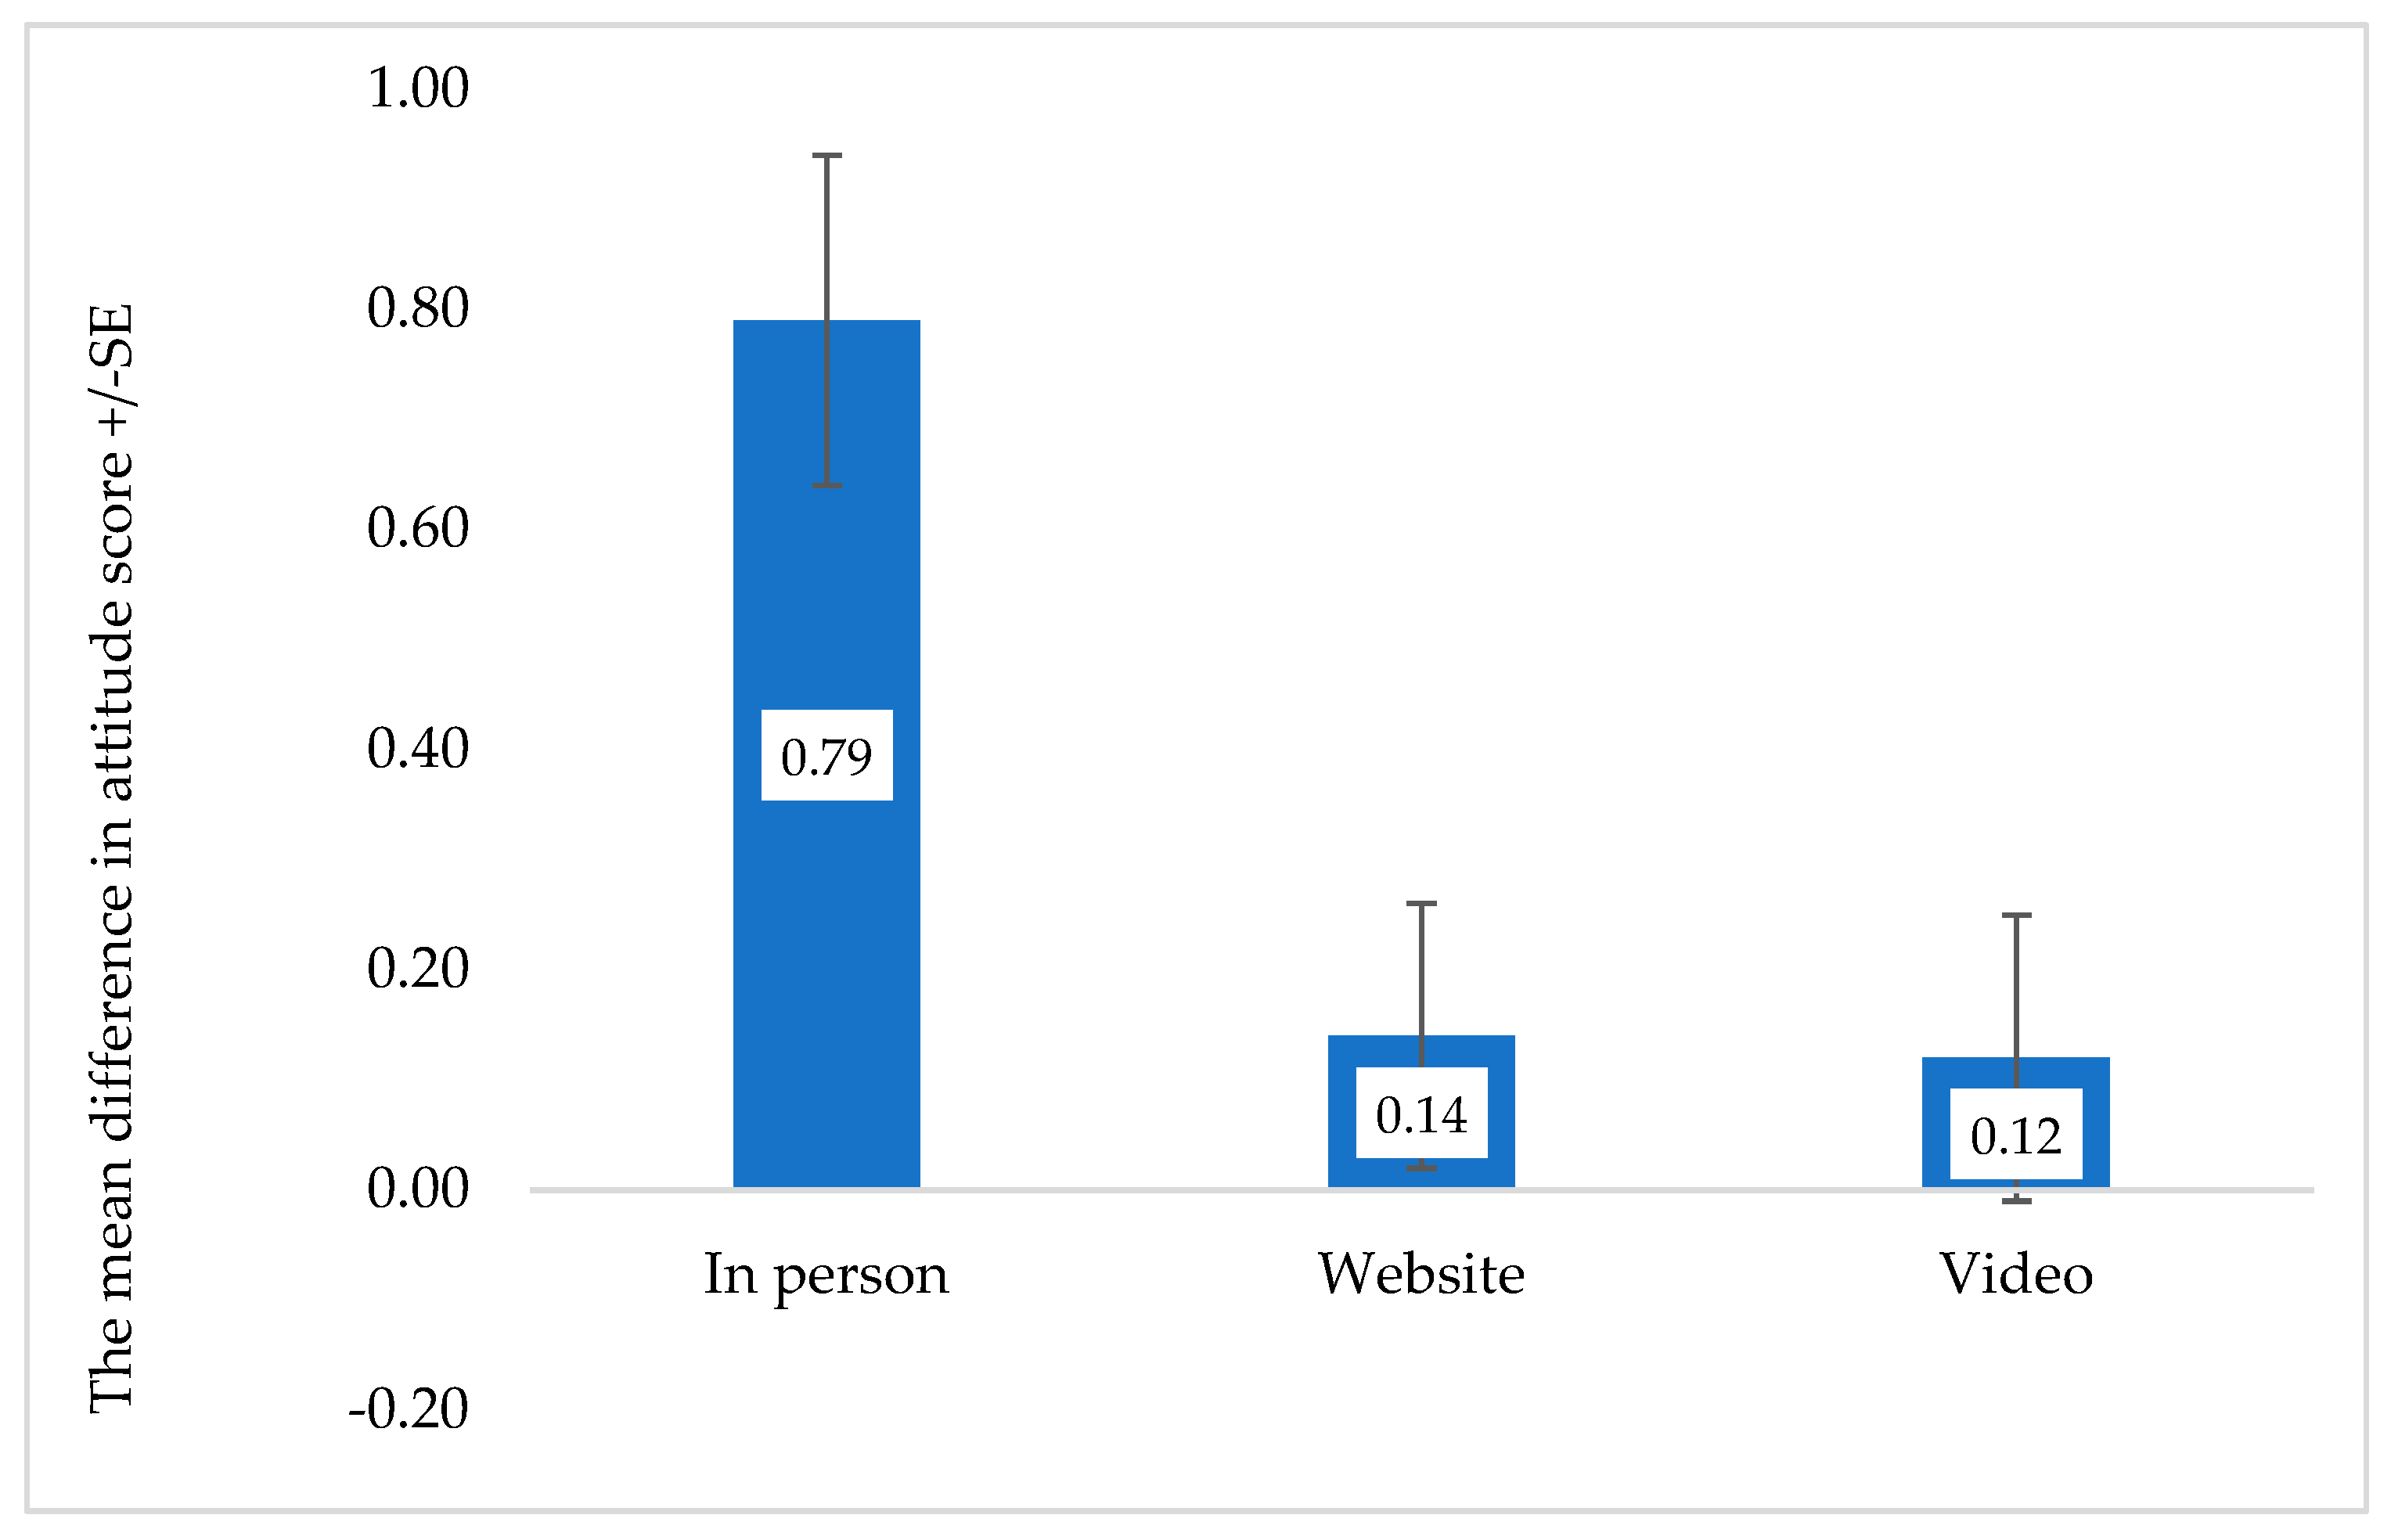
3.1. Attitude
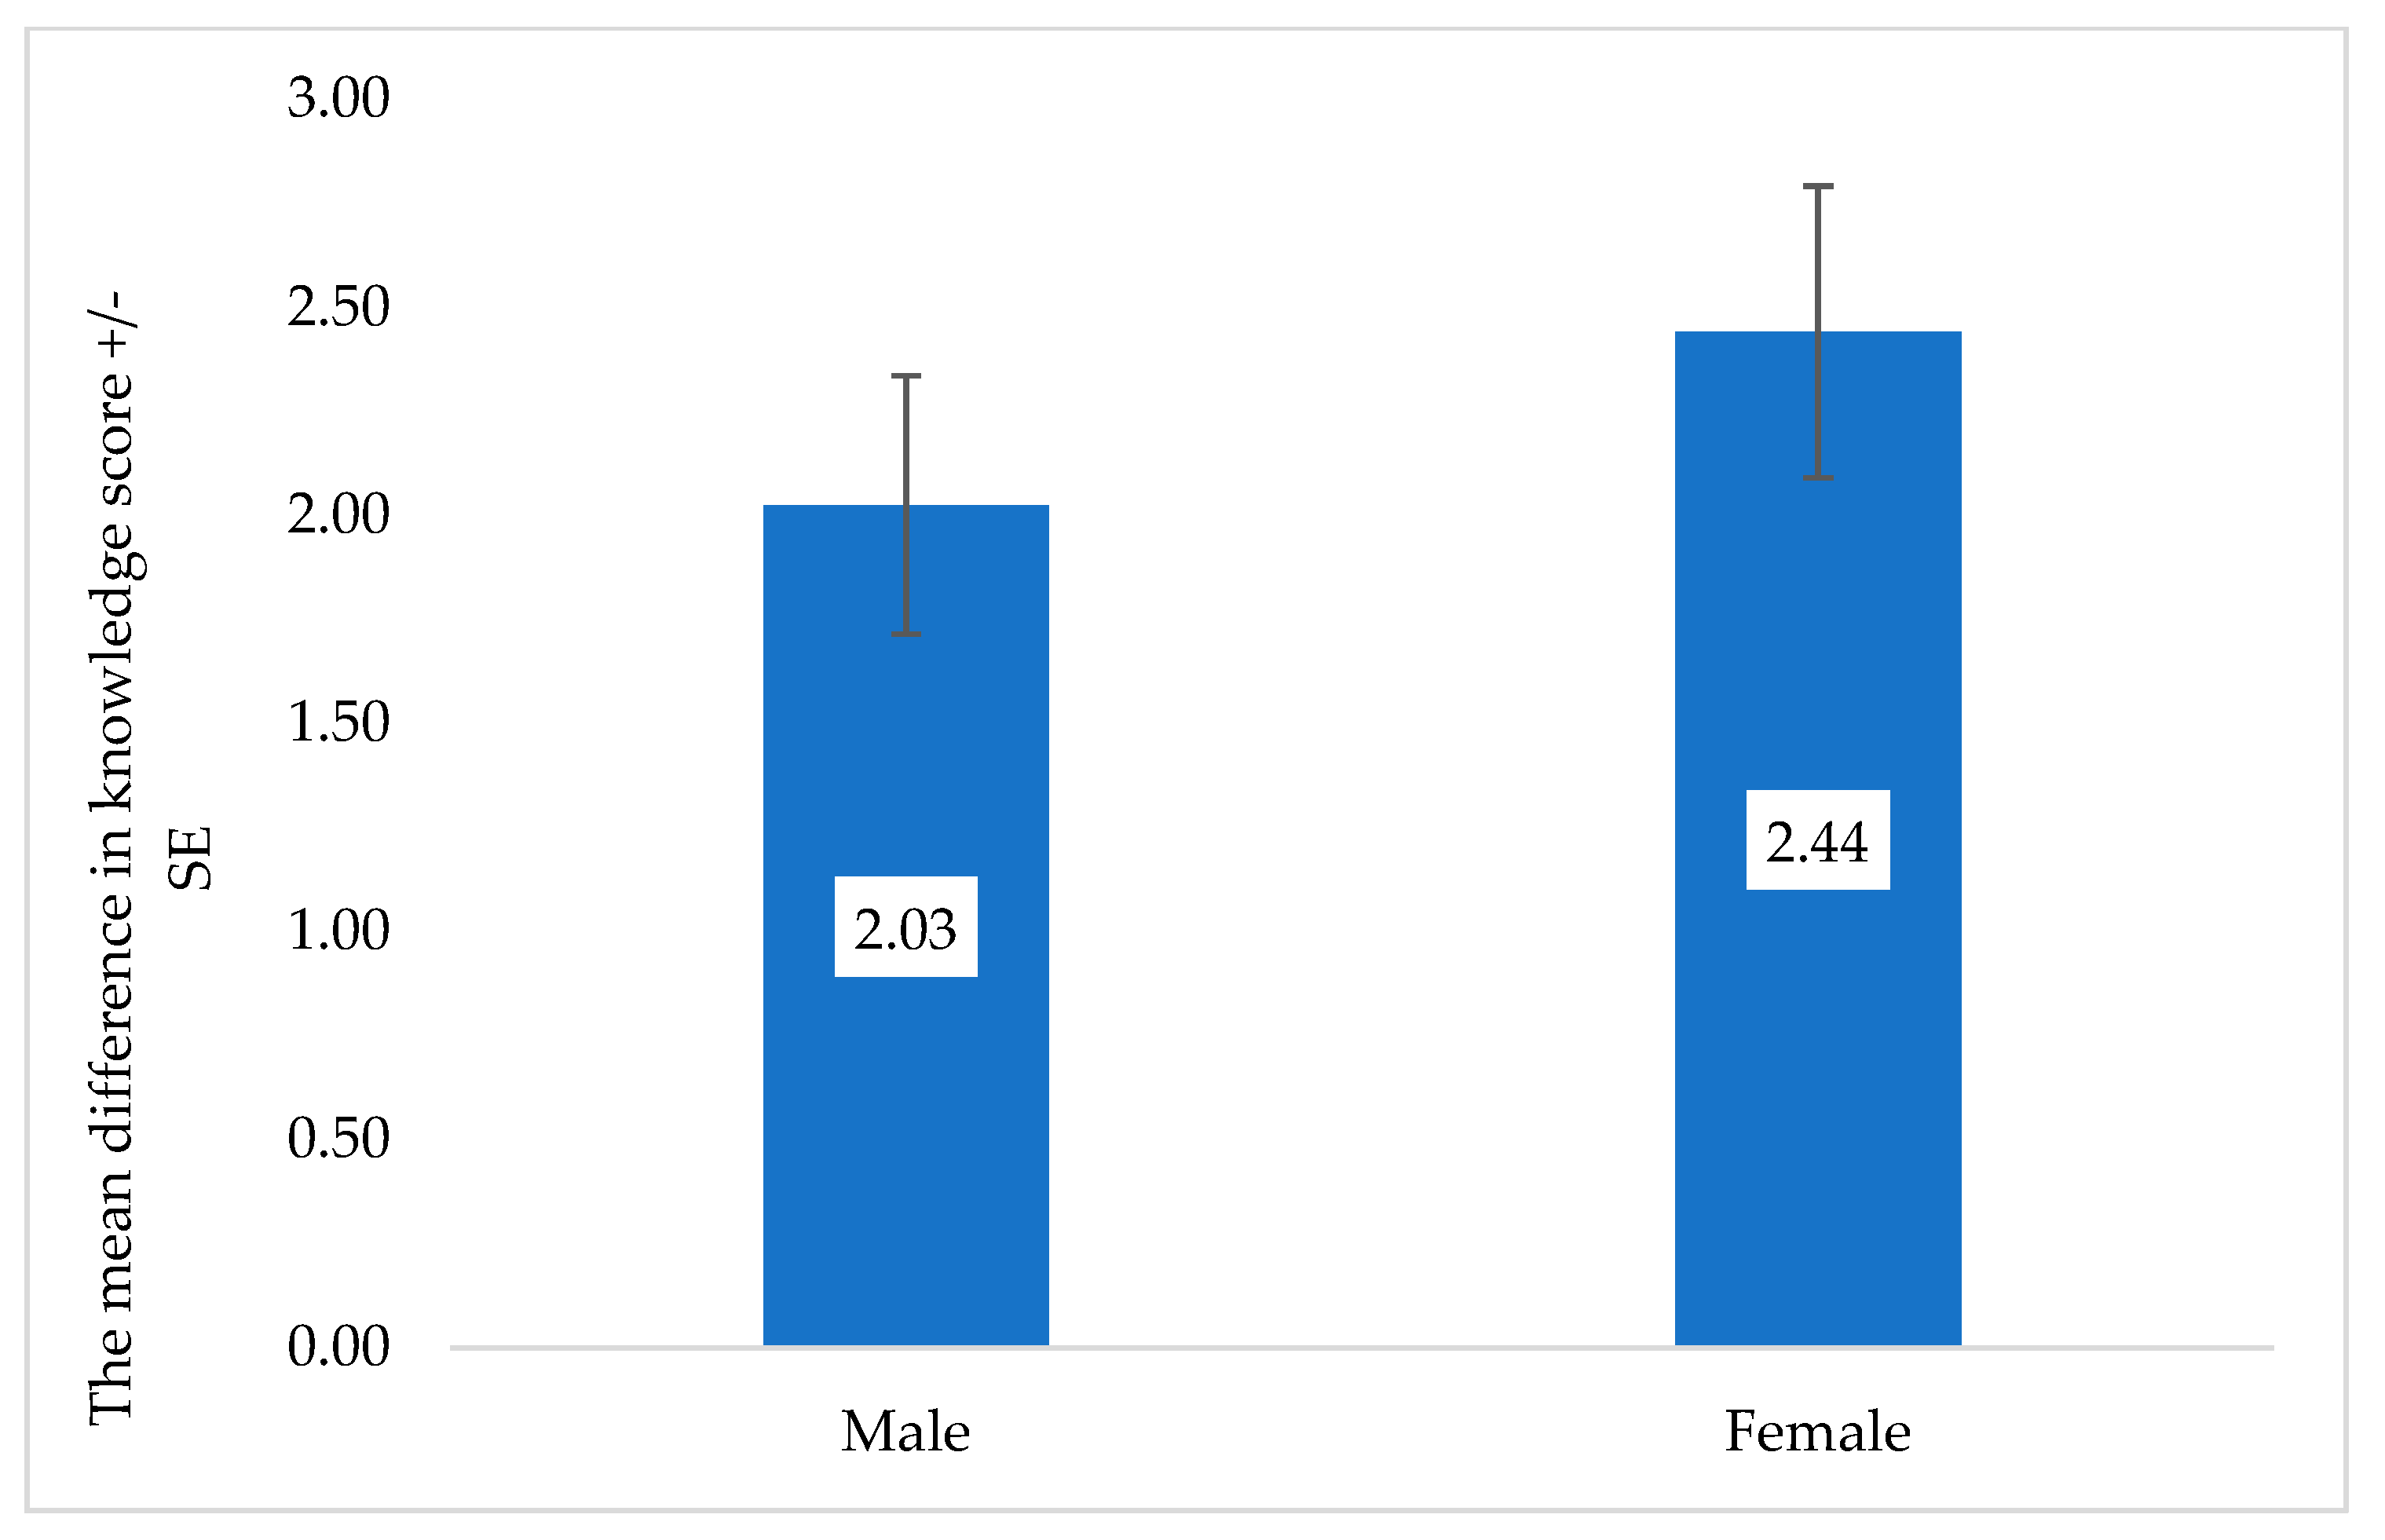
3.2. Knowledge
4. Discussion
5. Conclusions
Author Contributions
Funding
Institutional Review Board Statement
Data Availability Statement
Acknowledgments
Conflicts of Interest
Appendix A. The Questionnaire Administered to All Students
| Student number: _______________ | Gender (please circle): | Girl | Boy |
| What class are you in? Please circle your answer. | |||
| 5th | 6th | ||
| Section 1. | |||
| |||
| *** | |||
| Please read each sentence and circle the answer that relates to you. | |||
| |||
| Agree | Unsure | Disagree | |
| |||
| Agree | Unsure | Disagree | |
| Section 2. | |||
| |||
| Animal: | Food source: | ||
| a. HERBIVORE | MEAT | ||
| b. OMNIVORE | MEAT AND PLANTS | ||
| c. CARNIVORE | PLANTS | ||
| For the next twoquestions, please circle the answer you think is correct. If you are unsure or do not know what any option means, please circle ‘don’t know’. | |||
 | |||
| This animal is a _____________. | |||
| Carnivore | Omnivore | Herbivore | Don’t know |
 | |||
| This animal is a ____________. | |||
| Carnivore | Omnivore | Herbivore | Don’t know |
| |||
| Photo: | Name of Tooth: | ||
| a. |  | MOLAR | |
| b. |  | INCISOR | |
| c. |  | CANINE | |
| |||
 | |||
| The teethcircledare most important for _____________ food. | |||
| Biting | Grinding | Shredding | Don’t know |
| 😊 THANK YOU 😊 | |||
Appendix B. Additional Findings
Appendix B.1

| Question | Pre-Questionnaire | Post-Questionnaire | Difference | ||
|---|---|---|---|---|---|
| Number of students who answered correctly (or scored full marks, in terms of Q5 AND Q8) | % out of overall number of participants (165) | Number of students who answered correctly (or scored full marks, in terms of Q5 AND Q8) | % out of overall number of participants (165) | Difference in number of students answering correctly/scoring full marks from pre- to post-questionnaire (%) | |
| Q4 | 126 | 76.4% | 140 | 84.8% | +14 (+8.5%) |
| Q5 | 91 | 55.2% | 146 | 88.5% | +55 (+33.3%) |
| Q6 | 77 | 46.7% | 130 | 78.8% | +53 (+32.1%) |
| Q7 | 27 | 16.4% | 52 | 31.5% | +25 (+15.2%) |
| Q8 | 71 | 43.0% | 110 | 66.6% | +39 (+23.6%) |
Appendix B.2
| Question | Number (% out of 165) of Students Who Showed Increased Knowledge Scores from Pre- to Post-Questionnaire | Number (% out of 165) of Students Who Showed Decreased Knowledge Scores from Pre- to Post-Questionnaire |
|---|---|---|
| Q4 | 25 (15.2%) | 11 (7.0%) |
| Q5 | 66 (40.0%) | 6 (3.6%) |
| Q6 | 76 (46%) | 10 (6.1%) |
| Q7 | 73 (44.2%) | 36 (21.8%) |
| Q8 | 61 (37.0%) | 20 (12.1%) |
Appendix B.3
| Question | Number (%) of Students Who Did Not Answer or Chose ‘Don’t Know’ in Pre-Questionnaire. | Out of Those Students Who Did Not Answer or Chose Don’t Know, the Number (%) who Attempted to Answer in the Post-Questionnaire. |
|---|---|---|
| Q4 | 0 (0.0%) | N/A |
| Q5 | 39 (23.6%) | 37 (95.0%) |
| Q6 | 52 (31.5%) | 47 (90.4%) |
| Q7 | 7 (4.2%) | 5 (71.4%) |
| Q8 | 21 (12.7%) | 16 (76.1%) |
References
- Davis, J. Young Children, Environmental Education and the Future. Early Child. Educ. J. 1998, 26, 141–155. [Google Scholar] [CrossRef]
- Houghton, J. Global warming. Rep. Prog. Phys. 2005, 68, 1343. [Google Scholar] [CrossRef]
- Thuiller, W. Climate change and the ecologist. Nature 2007, 448, 550–552. [Google Scholar] [CrossRef]
- Hansen, J.; Kharecha, P.; Sato, M.; Epstein, P.; Hearty, P.J.; Hoegh-Guldberg, O.; Parmesan, C.; Rahmstorf, S.; Rockstrom, J.; Rohling, E.J.; et al. The Case for Young People and Nature: A Path to a Healthy, Natural, Prosperous Future; Columbia University: New York, NY, USA, 2011; Available online: http://www.columbia.edu/~jeh1/mailings/2011/20110505_CaseForYoungPeople.pdf (accessed on 10 January 2021).
- Sanson, A.V.; Burke, S.E. Climate change and children: An issue of intergenerational justice. In Children and Peace; Springer: Cham, Switzerland, 2020; pp. 343–362. [Google Scholar]
- Osborne, J.; Dillon, J. Science Education in Europe: Critical Reflections; The Nuffield Foundation: London, UK, 2008; Available online: http://efepereth.wdfiles.com/local--files/science-education/Sci_Ed_in_Europe_Report_Final.pdf (accessed on 16 November 2020).
- Department of Education and Skills (DES). Science in The Primary School 2008: Inspectorate Evaluation Studies; Evaluation Support and Research Unit Inspectorate—Department of Education and Skills: Dublin, Ireland, 2012. Available online: https://assets.gov.ie/25306/c0e9699507af414996fa59f38ac22d2a.pdf (accessed on 13 November 2020).
- Sjøberg, S.; Schreiner, C. The ROSE Project. An Overview and Key Finding; Naturfagsenteret: Oslo, Norway, 2010; pp. 1–31. [Google Scholar]
- Osborne, J.; Simon, S.; Collins, S. Attitudes towards science: A review of the literature and its implications. Int. J. Sci. Educ. 2003, 25, 1049–1079. [Google Scholar] [CrossRef]
- Sjøberg, S.; Schreiner, C. How do learners in different cultures relate to science and technology? Results and perspectives from the project ROSE (the Relevance of Science Education). In Asia-Pacific Forum on Science Learning and Teaching; Department of Science and Environmental Studies, The Education University of Hong Kong: Hong Kong, 2005; Volume 6, pp. 1–17. [Google Scholar]
- Schleicher, A. PISA 2018: Insights and Interpretations. The Organisation for Economic Co-Operation and Development; OECD Publishing: Paris, France, 2019; Available online: https://www.oecd.org/pisa/PISA%202018%20Insights%20and%20Interpretations%20FINAL%20PDF.pdf (accessed on 9 December 2020).
- Department of Education and Skills (DES). Fifty School Reports: What Inspectors Say. Department of Education and Skills: Dublin, Ireland, 2002. Available online: https://assets.gov.ie/25391/af194880df4c466b8f3f3d0f9d807915.pdf (accessed on 14 November 2020).
- Murphy, C.; Neil, P.; Beggs, J. Primary science teacher confidence revisited: Ten years on. Educ. Res. 2007, 49, 415–430. [Google Scholar] [CrossRef]
- Government of Ireland. Primary School Curriculum: Introduction; The Stationary Office: Dublin, Ireland, 1999. Available online: https://www.curriculumonline.ie/getmedia/c4a88a62-7818-4bb2-bb18-4c4ad37bc255/PSEC_Introduction-to-Primary-Curriculum_Eng.pdf (accessed on 1 November 2020).
- Harlen, W. Primary teachers’ understanding in science and its impact in the classroom. Res. Sci. Educ. 1997, 27, 323–337. [Google Scholar] [CrossRef]
- The Office for Standards in Education, Children’s Services and Skills (Ofsted). Maintaining Curiosity: A Survey Into Science Education in Schools; The Office for Standards in Education, Children’s Services and Skills (Ofsted): Manchester, UK, 2013. Available online: https://assets.publishing.service.gov.uk/government/uploads/system/uploads/attachment_data/file/379164/Maintaining_20curiosity_20a_20survey_20into_20science_20education_20in_20schools.pdf (accessed on 15 November 2020).
- Government of Ireland. Primary School Curriculum: Science; The Stationery Office: Dublin, Ireland, 1999. Available online: https://www.curriculumonline.ie/getmedia/346522bd-f9f6-49ce-9676-49b59fdb5505/PSEC03c_Science_Curriculum.pdf (accessed on 1 November 2020).
- Mayer, F.S.; Frantz, C.M. The connectedness to nature scale: A measure of individuals’ feeling in community with nature. J. Environ. Psychol. 2004, 24, 503–515. [Google Scholar] [CrossRef]
- Cheng, J.C.H.; Monroe, M.C. Connection to nature: Children’s affective attitude toward nature. Environ. Behav. 2012, 44, 31–49. [Google Scholar] [CrossRef]
- Counsell, G.; Moon, A.; Littlehales, C.; Brooks, H.; Bridges, E.; Moss, A. Evaluating an in-school zoo education programme: An analysis of attitudes and learning: Evaluation of zoo education. J. Zoo Aquar. Res. 2020, 8, 99–106. [Google Scholar]
- Moss, A.G.; Littlehales, C.; Moon, A.; Smith, C.; Sainsbury, C. Measuring the impact of an in-school zoo education programme. J. Zoo Aquar. Res. 2017, 5, 33–37. [Google Scholar]
- Roe, K.; McConney, A.; Mansfield, C.F. The role of zoos in modern society—A comparison of zoos’ reported priorities and what visitors believe they should be. Anthrozoös 2014, 27, 529–541. [Google Scholar] [CrossRef]
- Jensen, E. Learning about Animals, Science and Conservation at the Zoo: Large-Scale Survey-Based Evaluation of the Educational Impact of the ZSL London Zoo Formal Learning Programme; A report to The Zoological Society of London; The Zoological Society of London: London, UK, 2011; pp. 9–30. [Google Scholar]
- Jensen, E. Evaluating children’s conservation biology learning at the zoo. Conserv. Biol. 2014, 28, 1004–1011. [Google Scholar] [CrossRef] [PubMed]
- Collins, C.; Corkery, I.; McKeown, S.; McSweeney, L.; Flannery, K.; Kennedy, D.; O’Riordan, R. An educational intervention maximizes children’s learning during a zoo or aquarium visit. J. Environ. Educ. 2020, 51, 361–380. [Google Scholar] [CrossRef]
- LoBue, V.; Bloom Pickard, M.; Sherman, K.; Axford, C.; DeLoache, J.S. Young children’s interest in live animals. Br. J. Dev. Psychol. 2013, 31, 57–69. [Google Scholar] [CrossRef] [PubMed]
- Sherwood, K.P., Jr.; Rallis, S.F.; Stone, J. Effects of live animals vs. preserved specimens on student learning. Zoo Biol. 1989, 8, 99–104. [Google Scholar]
- Poliquin, R. The matter and meaning of museum taxidermy. Mus. Soc. 2008, 6, 123–134. [Google Scholar]
- Bunce, L. Dead Ringer? Visitors’ Understanding of Taxidermy as Authentic and Educational Museum Exhibits. Visit. Stud. 2016, 19, 178–192. [Google Scholar] [CrossRef]
- Lindemann-Matthies, P.; Kamer, T. The influence of an interactive educational approach on visitors’ learning in a Swiss zoo. Sci. Educ. 2006, 90, 296–315. [Google Scholar] [CrossRef]
- Somenarain, L.; Akkaraju, S.; Gharbaran, R. Student perceptions and learning outcomes in asynchronous and synchronous online learning environments in a biology course. MERLOT J. Online Learn. Teach. 2010, 6, 353–356. [Google Scholar]
- Nguyen, T. The effectiveness of online learning: Beyond no significant difference and future horizons. MERLOT J. Online Learn. Teach. 2015, 11, 309–319. [Google Scholar]
- Summers, J.J.; Waigandt, A.; Whittaker, T.A. A comparison of student achievement and satisfaction in an online versus a traditional face-to-face statistics class. Innov. High. Educ. 2005, 29, 233–250. [Google Scholar] [CrossRef]
- Baig, M.A. A Critical Study of Effectiveness of Online Learning on Students’ Achievement. I-Manag. J. Educ. Technol. 2011, 7, 28–34. [Google Scholar] [CrossRef]
- Soffer, T.; Nachmias, R. Effectiveness of learning in online academic courses compared with face-to-face courses in higher education. J. Comput. Assist. Learn. 2018, 34, 534–543. [Google Scholar] [CrossRef]
- Amry, A.B. The impact of WhatsApp mobile social learning on the achievement and attitudes of female students compared with face to face learning in the classroom. Eur. Sci. J. 2014, 10, 116–136. [Google Scholar]
- Palvia, S.; Aeron, P.; Gupta, P.; Mahapatra, D.; Parida, R.; Rosner, R.; Sindhi, S. Online education: Worldwide status, challenges, trends, and implications. J. Glob. Inf. Technol. Manag. 2018, 21, 233–241. [Google Scholar] [CrossRef]
- Octaberlina, L.R.; Muslimin, A.I. EFL Students Perspective towards Online Learning Barriers and Alternatives Using Moodle/Google Classroom during COVID-19 Pandemic. Int. J. High. Educ. 2020, 9, 1–9. [Google Scholar] [CrossRef]
- Moss, A.; Jensen, E.; Gusset, M. Evaluating the contribution of zoos and aquariums to Aichi Biodiversity Target 1. Conserv. Biol. 2015, 29, 537–544. [Google Scholar] [CrossRef] [PubMed]
- Heo, M.; Toomey, N. Learning with multimedia: The effects of gender, type of multimedia learning resources, and spatial ability. Comput. Educ. 2020, 146, 103747. [Google Scholar] [CrossRef]
- Zoghi, M.; Kazemi, S.A.; Kalani, A. The effect of gender on language learning. J. Nov. Appl. Sci. 2013, 2, 1124–1128. [Google Scholar]
- Makransky, G.; Wismer, P.; Mayer, R.E. A gender matching effect in learning with pedagogical agents in an immersive virtual reality science simulation. J. Comput. Assist. Learn. 2019, 35, 349–358. [Google Scholar] [CrossRef]
- Birch, L.L.; Marlin, D.W. I don’t like it; I never tried it: Effects of exposure on two-year-old children’s food preferences. Appetite 1982, 3, 353–360. [Google Scholar] [CrossRef] [PubMed]
- Bruner, R.F. Repetition Is the First Principle of All Learning; An Informal Column on Teaching; University of Virginia: Charlottesville, VA, USA, 2001; Available online: https://papers.ssrn.com/sol3/papers.cfm?abstract_id=224340 (accessed on 1 June 2023).
- Bonal, X.; González, S. The impact of lockdown on the learning gap: Family and school divisions in times of crisis. Int. Rev. Educ. 2020, 66, 635–655. [Google Scholar] [CrossRef] [PubMed]
- Citizens Information. Starting School. 2020. Available online: https://www.citizensinformation.ie/en/education/primary_and_post_primary_education/going_to_primary_school/primary_education_life_event.html (accessed on 1 November 2020).
- Irish Primary Teacher. Group Reward Systems. 2017. Available online: https://irishprimaryteacher.ie/group-reward-systems/ (accessed on 20 February 2021).
- Centre for Science in the Public Interest. Constructive Classroom Rewards: Promoting Good Habits While Protecting Children’s Health. N.d. Available online: https://cspinet.org/sites/default/files/attachment/Non-Food%20Rewards_1.pdf (accessed on 1 March 2021).
- Behrendt, M.; Franklin, T. A review of research on school field trips and their value in education. Int. J. Environ. Sci. Educ. 2014, 9, 235–245. [Google Scholar]
- Sandberg, A.; Heden, R. Play’s importance in school. Education 2011, 39, 317–329. [Google Scholar] [CrossRef]
- Hurst, B.; Wallace, R.R.; Nixon, S.B. The impact of social interaction on student learning. Read. Horiz. 2013, 52, 375–398. [Google Scholar]
- Ladd, G.W. Having friends, keeping friends, making friends, and being liked by peers in the classroom: Predictors of children’s early school adjustment? Child Dev. 1990, 61, 1081–1100. [Google Scholar] [CrossRef]
- Goodnow, C. Strengthening the links between educational psychology and the study of social contexts. Educ. Psychol. 1992, 27, 177–196. [Google Scholar] [CrossRef]
- Alqurashi, E. Predicting student satisfaction and perceived learning within online learning environments. Distance Educ. 2019, 40, 133–148. [Google Scholar] [CrossRef]
- Holland, A.A. Effective principles of informal online learning design: A theory-building metasynthesis of qualitative research. Comput. Educ. 2019, 128, 214–226. [Google Scholar] [CrossRef]
- Kershner, R.; Pointon, P. Children’s views of the primary classroom as an environment for working and learning. Res. Educ. 2000, 64, 64–77. [Google Scholar] [CrossRef]
- Birch, S.H.; Ladd, G.W. The teacher-child relationship and children’s early school adjustment. J. Sch. Psychol. 1997, 35, 61–79. [Google Scholar] [CrossRef]
- Carmona-Halty, M.; Schaufeli, W.B.; Salanova, M. Good relationships, good performance: The mediating role of psychological capital–a three-wave study among students. Front. Psychol. 2019, 10, 306. [Google Scholar] [CrossRef] [PubMed]
- Mainhard, T.; Oudman, S.; Hornstra, L.; Bosker, R.J.; Goetz, T. Student emotions in class: The relative importance of teachers and their interpersonal relations with students. Learn. Instr. 2018, 53, 109–119. [Google Scholar] [CrossRef]
- STEM Education Review Group. STEM Education in the Irish School System: A Report on Science, Technology, Engineering and Mathematics (STEM) Education: Analysis and Recommendations; STEM Education Review Group: Dublin, Ireland, 2016; pp. 17–23. Available online: https://www.education.ie/en/publications/education-reports/stem-education-in-the-irish-school-system.pdf (accessed on 24 November 2020).
- Linn, M.C.; Hyde, J.S. Gender, mathematics, and science: Trends and Recommendations. Educ. Res. 1989, 18, 17–27. [Google Scholar] [CrossRef]
- Simpkins, S.D.; Davis-Kean, P.E.; Eccles, J.S. Parents’ socializing behavior and children’s participation in math, science, and computer out-of-school activities. Appl. Dev. Sci. 2005, 9, 14–30. [Google Scholar] [CrossRef]
- Fleming, M.L.; Malone, M.R. The relationship of student characteristics and student performance in science as viewed by meta-analysis research. J. Res. Sci. Teach. 1983, 20, 481–495. [Google Scholar] [CrossRef]
- Sorge, C. What Happens? Relationship of Age and Gender with Science Attitudes from Elementary to Middle School. Sci. Educ. 2007, 16, 33–37. [Google Scholar]
- Sjøberg, S.; Schreiner, C. Science education and youth’s identity construction—Two incompatible projects? In The Re-Emergence of Values in the Science Curriculum; Corrigan, D., Dillon, J., Gunstone, R., Eds.; Sense Publishers: Rotterdam, The Netherlands, 2007; Available online: https://www.roseproject.no/network/countries/norway/eng/nor-schreiner-values2006.pdf (accessed on 10 January 2021).
- Cheryan, S.; Ziegler, S.A.; Montoya, A.K.; Jiang, L. Why are some STEM fields more gender balanced than others? Psychol. Bull. 2017, 143, 1–35. [Google Scholar] [CrossRef]
- Falk, J.H.; Needham, M.D. Factors contributing to adult knowledge of science and technology. J. Res. Sci. Teach. 2013, 50, 431–452. [Google Scholar] [CrossRef]
- Anderson, U.S.; Kelling, A.S.; Pressley-Keough, R.; Bloomsmith, M.A.; Maple, T.L. Enhancing the zoo visitor’s experience by public animal training and oral interpretation at an otter exhibit. Environ. Behav. 2003, 35, 826–841. [Google Scholar] [CrossRef]
- Falk, J.H.; Reinhard, E.M.; Vernon, C.; Bronnenkant, K.; Heimlich, J.E.; Deans, N.L. Why Zoos & Aquariums Matter: Assessing the Impact of a Visit to a Zoo or Aquarium; Association of Zoos & Aquariums: Silver Spring, MA, USA, 2007; p. 24. [Google Scholar]


| Lesson-Type | Description | Participants |
|---|---|---|
| 1: In-person | Examples of carnivore, herbivore and omnivore skull specimens were brought into schools by an external educator and displayed for students to see. Students were given the opportunity to see these specimens up close as animal dentition and skull adaptations for feeding were explained via a ‘face-to-face’ lesson. This lesson took approximately 1 h to complete, including student questions. | 49 |
| 2: Web-based | Animal dentition and skull adaptations for feeding were explained using a specifically designed website. This included definitions and photographs of different types of teeth and the three varying skull examples. Students were guided through this website by an external educator. The lesson took approximately 1 h to complete, including student questions. | 92 |
| 3: Video | Animal dentition and skull adaptations for feeding were explained using examples of carnivore, herbivore and omnivore skull specimens, shown virtually via video call. This lesson was guided by an external educator, and took approximately one hour to complete, including student questions. | 42 |
| Category | Subjects | Number of Times Each Subject Was Chosen (Pre-Questionnaire) |
|---|---|---|
| S.T.E.M | Science | 2 |
| Maths | 16 | |
| Arts | English | 3 |
| Irish | 4 | |
| History | 22 | |
| Geography | 2 | |
| Music | 4 | |
| Art | 32 | |
| Drama | 8 | |
| Other | P.E | 72 |
| Criteria | Indicative of Learning | Non-Indicative of Learning |
|---|---|---|
| 1. | Clear title/classification of animal type (carnivore, omnivore, or herbivore) | May not include a title, labels, descriptions, or a combination of the three. |
| 2. | At least two indications of features corresponding to title/classification, including:
| May include a single label such as ‘molar’, or a single tooth description such as ‘grinding’ but no corresponding information to indicate understanding. |
| 3. | Where there is no clear classification of animal type, drawings may also be considered indicative of learning where clear understanding of types of teeth are highlighted, e.g., position of tooth correctly corresponding to labels and descriptions. | May not clearly show dentition at all. |
| Examples | Case number 130351 Clearly titled ‘carnivore’ with correctly identified corresponding features, including: correct labelling and positioning of all four teeth types. Clear indication of sharp teeth and enlarged canines, though descriptions are not provided to further show understanding of each feature. | Case number 220362 Labelled ‘carnivore’ though no corresponding features are indicated. Teeth are uniformly flat and not labelled individually. Irrelevant labels such as ‘hockey stick’ and ‘scream hole’ are included in place of correct labels and descriptions. |
| Lesson-Type 1 (In-Person) | Lesson-Type 2 (Website) | Lesson-Type 3 (Video) | ||||
|---|---|---|---|---|---|---|
| Pre | Post | Pre | Post | Pre | Post | |
| Question 1 ‘What is your favourite subject in school?’ [3 = S.T.E.M subject (positive response), 2 = Arts subject, 1 = Other (negative response)] | 1.86 | 2.05 | 1.68 | 1.71 | 1.48 | 1.48 |
| (62.0%) | (68.3%) | (56.0%) | (57.0%) | (49.3%) | (49.3%) | |
| Question 2 ‘I enjoy learning about science.’ Agree/Unsure/Disagree | 2.67 | 2.88 | 2.50 | 2.63 | 2.48 | 2.62 |
| (89.0%) | (96.0%) | (83.3%) | (87.6%) | (82.6%) | (87.3%) | |
| Question 3 ‘I enjoy learning about animals.’ Agree/Unsure/Disagree | 2.54 | 2.93 | 2.85 | 2.83 | 2.88 | 2.86 |
| (84.6%) | (97.6%) | (95.0%) | (94.3%) | (96.0%) | (95.3%) | |
| Question | Lesson-Type 1 (In-Person) | Lesson-Type 2 (Website) | Lesson-Type 3 (Video) | |||
|---|---|---|---|---|---|---|
| Pre | Post | Pre | Post | Pre | Post | |
| Question 4 ‘Please draw a line to connect the type of animal to what food source you think they eat. If you do not know, you can take a guess.’ [Highest score = 6 (positive, 100%), 2 points for each correct answer in three sub-questions] | 5.79 | 5.76 | 5.18 | 5.49 | 5.54 | 5.76 |
| (96.5%) | (96.0%) | (86.3%) | (91.5%) | (92.3%) | (96.0%) | |
Question 5  ‘This animal is a __________. Carnivore/Omnivore/Herbivore/Don’t know’ [Correct answer = 2 (100%), incorrect = 1, don’t know/unanswered = 0] | 1.50 | 1.98 | 1.18 | 1.84 | 1.39 | 1.78 |
| (75.0%) | (99.0%) | (59.0%) | (92.0%) | (69.5%) | (89.0%) | |
Question 6  ‘This animal is a __________.’ Carnivore/Omnivore/Herbivore/Don’t know’ [Correct answer = 2 (100%), incorrect = 1, don’t know/unanswered = 0] | 1.40 | 1.83 | 1.06 | 1.68 | 1.07 | 1.76 |
| (70.0%) | (91.5%) | (53.0%) | (84.0%) | (53.5%) | (88.0%) | |
| Question 7 ‘Please draw a line to connect the photo of each tooth to the correct name. If you do not know, you can take a guess.’ [Highest score = 8 (positive, 100%), 2 points for each correct answer in four sub-questions] | 5.48 | 6.38 | 5.09 | 5.77 | 5.41 | 5.58 |
| (68.5%) | (79.8%) | (63.6%) | (72.1%) | (67.6%) | (69.8%) | |
Question 8  ‘The teeth circled are most important for __________ food.’ Biting/Grinding/Shredding/Don’t know [Correct answer = 2 (100%), incorrect = 1, don’t know/unanswered = 0] | 1.48 | 1.79 | 1.18 | 1.48 | 1.37 | 1.66 |
| (74.0%) | (89.5%) | (59.0%) | (74.0%) | (68.5%) | (83.0%) | |
Disclaimer/Publisher’s Note: The statements, opinions and data contained in all publications are solely those of the individual author(s) and contributor(s) and not of MDPI and/or the editor(s). MDPI and/or the editor(s) disclaim responsibility for any injury to people or property resulting from any ideas, methods, instructions or products referred to in the content. |
© 2023 by the authors. Licensee MDPI, Basel, Switzerland. This article is an open access article distributed under the terms and conditions of the Creative Commons Attribution (CC BY) license (https://creativecommons.org/licenses/by/4.0/).
Share and Cite
Byrne, K.; Collins, C.; Bolger, M.K.; Butler, F. Science Education in Primary Students in Ireland: Examining the Use of Zoological Specimens for Learning. J. Zool. Bot. Gard. 2023, 4, 507-526. https://doi.org/10.3390/jzbg4030037
Byrne K, Collins C, Bolger MK, Butler F. Science Education in Primary Students in Ireland: Examining the Use of Zoological Specimens for Learning. Journal of Zoological and Botanical Gardens. 2023; 4(3):507-526. https://doi.org/10.3390/jzbg4030037
Chicago/Turabian StyleByrne, Kayleigh, Courtney Collins, Mary Kate Bolger, and Fidelma Butler. 2023. "Science Education in Primary Students in Ireland: Examining the Use of Zoological Specimens for Learning" Journal of Zoological and Botanical Gardens 4, no. 3: 507-526. https://doi.org/10.3390/jzbg4030037
APA StyleByrne, K., Collins, C., Bolger, M. K., & Butler, F. (2023). Science Education in Primary Students in Ireland: Examining the Use of Zoological Specimens for Learning. Journal of Zoological and Botanical Gardens, 4(3), 507-526. https://doi.org/10.3390/jzbg4030037