Article

Behavior and Habitat Use Remain Diverse and Variable in Modern Zoological Exhibits over the Long-Term: Case Studies in 5 Species of Ursidae

Department of Reproductive and Behavioral Sciences, Saint Louis Zoo, Saint Louis, MO 63110, USA
*
Author to whom correspondence should be addressed.
J. Zool. Bot. Gard. 2021, 2(4), 677-704; https://doi.org/10.3390/jzbg2040049
Submission received: 18 October 2021 / Revised: 21 November 2021 / Accepted: 30 November 2021 / Published: 10 December 2021

Abstract

:
Long-term evaluations of whether modern zoological exhibits help to maintain variation in the behavior of zoo animals are lacking despite the hope that animals avoid falling into monotonous patterns of behavior or boredom. This study evaluated changes in behavior and habitat use over multi-year periods in nine individuals of five bear species at two zoological facilities. Behavioral data gathered over months to years were analyzed graphically for trends in the direction of change. The habitat use dynamics were assessed graphically by looking for trends in the entropy values over time. We found that the activity budgets remained diverse and were dynamic over time, more so in younger compared to older bears. Changes in behavior suggesting positive welfare were observed, while changes that may reflect declining welfare seemed more likely to be due to age or seasonality. The observed behavioral changes suggest that the bears did not become bored with their habitats; there was likely one to several hours of daily variation in behavior, and stereotypy was rare. The diversity in the habitat use decreased over time as the animals settled into patterns of use reflecting preferences for certain areas of their habitats.

1. Introduction

Modern zoological exhibits that reflect the current thinking on the proper way to house animals and meet the accreditation standards of zoological associations often cost millions of dollars, particularly for large mammals. The aspirational goals of such exhibits include providing safe, comfortable, enriching habitats for animals, establishing connections between animals and visitors to promote education and conservation, and to provide recreational experiences for visitors. Understandably, the hope is that these costly exhibits provide the substrate for achieving these various goals for decades and for multiple generations of occupants of the enclosure. Despite these initial large investments, it is relatively rare that exhibits are evaluated over the long-term to see if they are meeting their goals.
In the mid-1980s, Maple & Finlay [1] were perhaps the earliest in advocating for the post-occupancy evaluation (POE) of zoo exhibits, which they defined as the use of systematic methods to determine if a built environment works well for all of its users (animals, visitors, and staff). Kelling & Gaalema [2] expanded the discussion of POE in zoos and noted that formal POE still was not common, rarely considered all user groups, and the results of any similar analyses (e.g., pre-/post-renovation exhibit evaluations) were rarely shared. The assessment of long-term effects, particularly on animal occupants, is missing from these discussions of POE and exhibit evaluations in both presentations and the literature. There is a risk that the immediate or short-term pre-/post-evaluations of exhibits (e.g., [3] and references therein) are only probing the animals’ responses to novelty, do not account for seasonal effects, or draw conclusions about behavior that could reflect neophobia [4], neophilia [5], or curiosity [6]. Admittedly, long-term studies are hard to conduct because they require sustained commitment to research, consistent methodology over time, and ongoing training of staff. In addition, animals are sometimes transferred between zoos, making it difficult to assess the long-term changes in behavior in a single exhibit.
Bears are large, agile, powerful animals that are popular with the public and common in zoos. Bear exhibits are typically expensive to construct due to containment, durability, and aesthetic considerations. In the wild, they are largely solitary animals with diverse diets (except for giant pandas) that range over large areas [7]. In zoos, bears often readily engage with environmental enrichment and participate in training, but they are also spoken of as being ‘high maintenance’ in terms of keeping them occupied and preventing undesirable behaviors. Much has been written about the behavioral management of zoo bears with regard to the impact of environmental enrichment on behavior [8,9,10,11,12]. We know of only one study that has evaluated the changes in zoo bear behavior for periods greater than one year: Bernstein-Kurtycz et al. [13] observed several bear species over a three-year period and found that most behaviors did not change across seasons and years, although some behaviors did change with respect to the ambient temperature.
Our intent in this study is to ask whether animals in zoo exhibits settle into predictable routines in terms of activity budgets or if the allocation of time to various behaviors remains variable and changes over longer time frames than are typically assessed. An animal under human care in a static environment could settle into a relatively invariant pattern of behavior: a certain amount of time at minimum would be spent in rest, obtaining sufficient food, traveling around its habitat, and so on. By analogy, a human in a typical day may spend 8 h sleeping, 8 h working, and 8 h in other activities. While these 8-h periods are mostly fixed, there is daily fluctuation around these values. We wanted to quantify this variation to assess how differently individual bears spent their time from day to day. Related to this, we wanted to know whether the patterns of habitat use remain the same over time or remain variable. We tracked the bears’ use of space over time in order to determine the extent to which they used the available space versus restricted their activities to parts of their exhibits, i.e., developed spatial preferences. We suggest that the animals will develop preferences for portions of their exhibits much as they do in the wild (e.g., ‘core areas’, [14]) and spend more time there, but periodic use of other areas would also be expected.
We used long-term behavior monitoring of nine individuals of five species of bears (Ursidae) at the Saint Louis Zoo and Smithsonian National Zoological Park and Conservation Biology Institute to address these questions. If zoo exhibits and associated husbandry practices are effective in maintaining or increasing the levels of positive behaviors, maintaining or ideally decreasing the levels of negative behaviors, or maintaining variability in behavior over longer periods of time, then the expense of modern zoological exhibit design practices and time invested in enrichment and training programs would be better justified. We also discuss whether changes in the behavior observed over time may reflect changes in welfare, although it is important to note that we are considering behavior change over time and, in some cases, their relative values to one another and not explicitly assessing whether levels of a particular behavior (e.g., 40%) are ‘too high’ or ‘too low’ for good welfare to be experienced.
Given the species, individual, biological, and housing diversity of our sample of nine bears, we present each bear as a case study with limited statistical analysis.

2. Materials and Methods

2.1. Subjects

Our sample includes three Andean bears (Tremarctos ornatus) (an older male and female and later a solitary young male), one sun bear (Helarctos malayanus), two grizzly bears (Ursus arctos), and one polar bear (Ursus maritimus) at the Saint Louis Zoo. The male sun bear was housed with a female sun bear, but she was never reliably visible for behavioral observations and so is not further discussed here. We also included two giant pandas (Ailuropoda melanoleuca) housed at the Smithsonian National Zoological Park that were part of a separate study. Demographic and habitat introduction data, as well as the periods observed for this analysis for each bear, are found in Table 1.
All bears in the study were exposed to typical zoo husbandry routines, which included multiple daily feedings, environmental enrichment (including novel objects, foods, scents), and training programs. Animals were generally on exhibit for the public for seven to nine hours per day. The Saint Louis Zoo bears had access to their outdoor habitats overnight, whereas the giant pandas were secured indoors in the evening. These husbandry practices were highly consistent over time.

2.2. Saint Louis Zoo Bear Habitats

The Andean bear habitat opened in summer 2014 and is 643.8 m2. It contains a cave, shallow stream and pool, a semi-natural climbing structure, grassy areas, and natural plantings. There are two public viewing areas. The sun bear habitat is 335.8m2 and also opened in summer 2014. The habitat contains a cave, shallow stream and shallow pool, grassy areas, plantings, and semi-natural climbing structures. There is one public viewing area. The grizzly bear habitat is 720 m2 and opened in early fall 2017. The habitat contains a shallow stream and swimming pool, grassy areas, rocky cliffs, plantings, and natural logs/deadfall. There are three public viewing areas. The Saint Louis Zoo polar bear habitat is 728.4 m2 and opened in summer 2015. The habitat contains two chilled pools, a sand digging pit, rocky cliffs, and grassy areas, as well as an area where ice is dispensed into the exhibit. There are three public viewing areas. The bears were separated from the public in all viewing areas by glass walls. All habitats contained hilly terrain. See Supplementary Material A for photographs of the habitats.

2.3. Smithsonian National Zoo Giant Panda Habitat

The giant pandas had access to two outdoor habitats (750 m2 and 724 m2) as well as three indoor rooms (46–84 m2), which were also on exhibit. The pandas were generally in the indoor rooms for the first and last hours of observations (see below), and, during hot weather, they had access to an indoor room. Each outdoor exhibit was heavily planted with climbable shade trees and other vegetation and contained an artificially cooled cave, shallow pool, mister or fog system, sand pits, deadfall, and both flat and sloped terrain. Each indoor room contained an artificial rock outcrop that housed a small pool as well as resting areas. Secluded small dens (~12 m2) were attached to each of the rooms as well. While housed together, the pandas generally had access to both outdoor yards. Visitors viewed the giant pandas along one side of the outdoor habitats and through glass along one side of the indoor habitats. See Supplementary Material A for photographs of the habitats.

2.4. Saint Louis Zoo Behavioral Observations

All bears at Saint Louis Zoo were scheduled for daily (Monday–Friday) morning and afternoon live observations. Morning observations started between 09:00 to 10:15 am; afternoon observations between 02:00 to 03:15 pm. Animals were either housed individually or in 1.1 pairs, and data were collected from each focal subject using time interval sampling: behaviors and locations were recorded every minute for one hour. Data were originally written onto paper datasheets, but Pocket Observer (Noldus Information Technology) installed on Samsung Galaxy Tab A 10.1 tablets was used starting in 2016. From 2015 until the end of data collection, the ethogram was the same across all subjects (See Supplementary Material B for ethogram); for the original 2014 observations, a different ethogram with similar but not identical behaviors was used. To account for this discrepancy and different climbing abilities of the bears, behaviors were categorized into five general groups: investigation/foraging, locomotion, rest, stereotypy, and pool use. Stereotypy was not on the ethogram in 2014. Out of sight was also included for times when a subject was in the habitat but not visible or completely absent from the habitat (i.e., in a holding area instead).
Every observation was performed from the public space. For those bears with large habitats or habitats where visibility was compromised due to large numbers of guests, teams of 1–3 observers were used, with each stationed at a different viewing window. Within these teams, each observer recorded their own data and compared it against the others. When observers recorded an animal out of sight, the data from other team members for whom the subject was visible were used. In cases when the bears were visible to multiple observers but data recorded by team members were different, majority consensus was used to aggregate a final data sheet. Observers in 2015 and all subsequent years were tested for reliability before collecting data, but participants in 2014 were unable to test until partway through data collection as we did not have observers recruited and trained when asked to initiate observations. Interobserver reliability was established at 80% for all participants by scoring against a test video.
Due to weather and available staffing, not all data collection sessions were attempted or completed. All sessions with more than 50% of their data points recorded as out of sight were discarded from further analysis. Summary statistics were generated for each week, and any week without at least one morning and one afternoon observation was discarded from further analysis. To balance possible behavioral differences due to time of day, equivalent numbers of morning and afternoon sessions were randomly selected within each week, although the number of specific observations subsampled in this way between weeks varied depending on the least number of morning or afternoon observations for that week.

2.5. National Zoo Behavioral Observations

The giant pandas were observed by volunteers and staff (all reached 85+% reliability with D. Powell) between 08:00–18:00 in two-hour focal animal observations using instantaneous scan sampling of behavior and habitat use at one-minute intervals five days/week. Observations were balanced across time of day and each animal was observed for one focal period each day. Observations were conducted live via a system of 21 surveillance cameras. Data presented here were collected between June 2001 and May 2005. After May 2005, the pandas were housed separately due to a pending birth, and observations of the male ceased on 9 July 2005 due to the birth of a cub and subsequent exclusive focus on the female. The pandas were routinely in the exhibits beginning in late December 2000; thus, our observation window for this study began at approximately six months post-occupancy. Due to being observed using a different method with a different ethogram (See Supplementary Material C for ethogram), the giant panda results are presented separately from those of the other bears and should not be considered directly comparable. We combined solitary object play with investigative behavior for this analysis. Object play has some of the same information gathering possibilities as other exploratory behaviors and thus also likely engages with the ‘seeking’ affective drive in the mammalian brain [15]. Additionally, analyses for the giant pandas are based on trends across average monthly values for behavior, whereas weekly values are used for the other bears.

2.6. Analysis-Levels of Behavior over Time

We assessed changes in behavior over the long-term using the full data sets we had for each bear. These data could not be transformed to fit a normal distribution and were often non-linear. Our approach for each bear was to fit linear trend lines through the data using Microsoft Excel for each behavior group and categorize the trend as increasing or decreasing. All slopes were relatively small (max 0.4% change per week or month) and most (51%) did not exceed 0.07% change per week/month. While we could not assess these for statistical significance, we also did not expect large slopes for a few reasons. First, activity budgets are always composed of more than one behavior and thus changes in any one behavior are likely to be constrained by other behaviors (i.e., animals must eat and rest, so one behavior cannot fully replace others). Second, given the long time periods covered here, changes are likely to be gradual rather than abrupt (e.g., rapidly going to a maximum level or minimum level). Third, our data cover multiple seasons and seasonal fluctuations in behavior are well known in many animals, which would also tend to produce low slope values over time.

2.7. Analysis-Activity Budget Variation over Time

We took the weekly (or monthly for giant pandas) activity budgets and the absolute value of the differences from week-to-week (or month-to-month) for each behavior category and then summed these to get a total “variability” value for the two-week or two-month period. We used absolute values because these better reflect overall fluctuation in behavior. The goal was not to assess increases or decreases in particular behaviors but rather to assess how different behavior was from week-to-week or month-to-month. We plotted these week-to-week or month-to-month variability values for each bear’s total activity budget to see if variability changed over time; i.e., did the activity budget change as a whole? These data were more amenable to linear regression analyses using SigmaStat 4.0 (Inpixion, Palo Alto, CA, USA). Week or month (for giant pandas) was used as the predictor variable.

2.8. Analysis-Habitat Use over Time

We used entropy (e.g., [16,17]) as our index of habitat use over time. This index is well suited to cases where the zones of use differ in size, and a simulation study found that entropy performs comparably to the modified spread of participation index [18], another measure that is also applicable to studies with unequal-sized zones but reliant on an accurate assessment of the size of each zone to generate expected frequencies of use [19]. Because the zones delineated in our observations were often irregular shapes, we could not get accurate estimates of the size of each zone. Entropy is calculated as follows:
H = p i log p   i
where p(i) is the proportion of time the animal spent in the ith area. The index produces a value ranging from zero to one, with one indicating even use of zones and zero indicating use of only one zone. Thus, this index reflects how evenly a habitat is used. It does not reflect habitat use variability per se because a scenario in which one or a few zones are used most of the time whereas others are rarely used represents a situation with high variance in use across zones and would have a low entropy score. A high entropy score represents very even use of zones, which means there is little statistical variance in use across zones.
Initially, the Andean and sun bear habitats were not divided into the same number of zones: In 2014, the Andean bear habitat contained four zones, and the sun bear habitat contained five zones. These areas were redrawn such that all bear habitats from 2015 until the end of the observations all contained six zones. Due to how entropy is calculated, habitats with more zones will have slightly higher entropies; for this reason, the entropies for the older Andean and sun bears were calculated separately in 2014 and 2015. Entropy values for Saint Louis bears are, therefore, comparable to one another from 2015 onwards.
Most of the data for weekly entropy values of Saint Louis bears and the monthly data for the female giant panda failed tests for linearity and many were non-normal. As for the behavioral data, linear trendlines generated by Microsoft Excel were used to characterize the overall trends and directions of the entropy values for each bear over time. Linear regression in SigmaStat 4.0 was used to characterize changes in entropy over time in the male giant panda.
The giant panda facility was divided into four indoor and ten outdoor zones. Because our observations covered time periods wherein the pandas had access to parts of the indoor facility during the morning, evening, and intermittently during the day, we calculated one entropy score that included the entire facility. Entropy was calculated monthly in the giant pandas. We calculated descriptive statistics on entropy index values and used Microsoft Excel trendlines with week (Saint Louis bears) or month of occupancy (giant pandas) as the predictor variable to determine whether entropy increased or decreased over time.

3. Results

We observed the two older Andean bears for 665 h over three June–November periods in the first three years of habitat occupancy starting in week two of occupancy (Table 1). The younger Andean bear was observed 99 h over the June-November period in year one of habitat occupancy starting in week one of occupancy. The male sun bear was observed for 347 h in three June–November periods in the first three years of habitat occupancy starting in week two of occupancy. The grizzly bears were observed for 424 h during the first full year of habitat occupancy starting in week three of occupancy. The male polar bear was observed continuously for 582 h during nearly the first two years of habitat occupancy starting in week one of occupancy. The giant pandas were observed continuously for nearly four years, beginning at week 23 post-occupancy of their habitat (Table 1), totaling approximately 4160 h of observations.

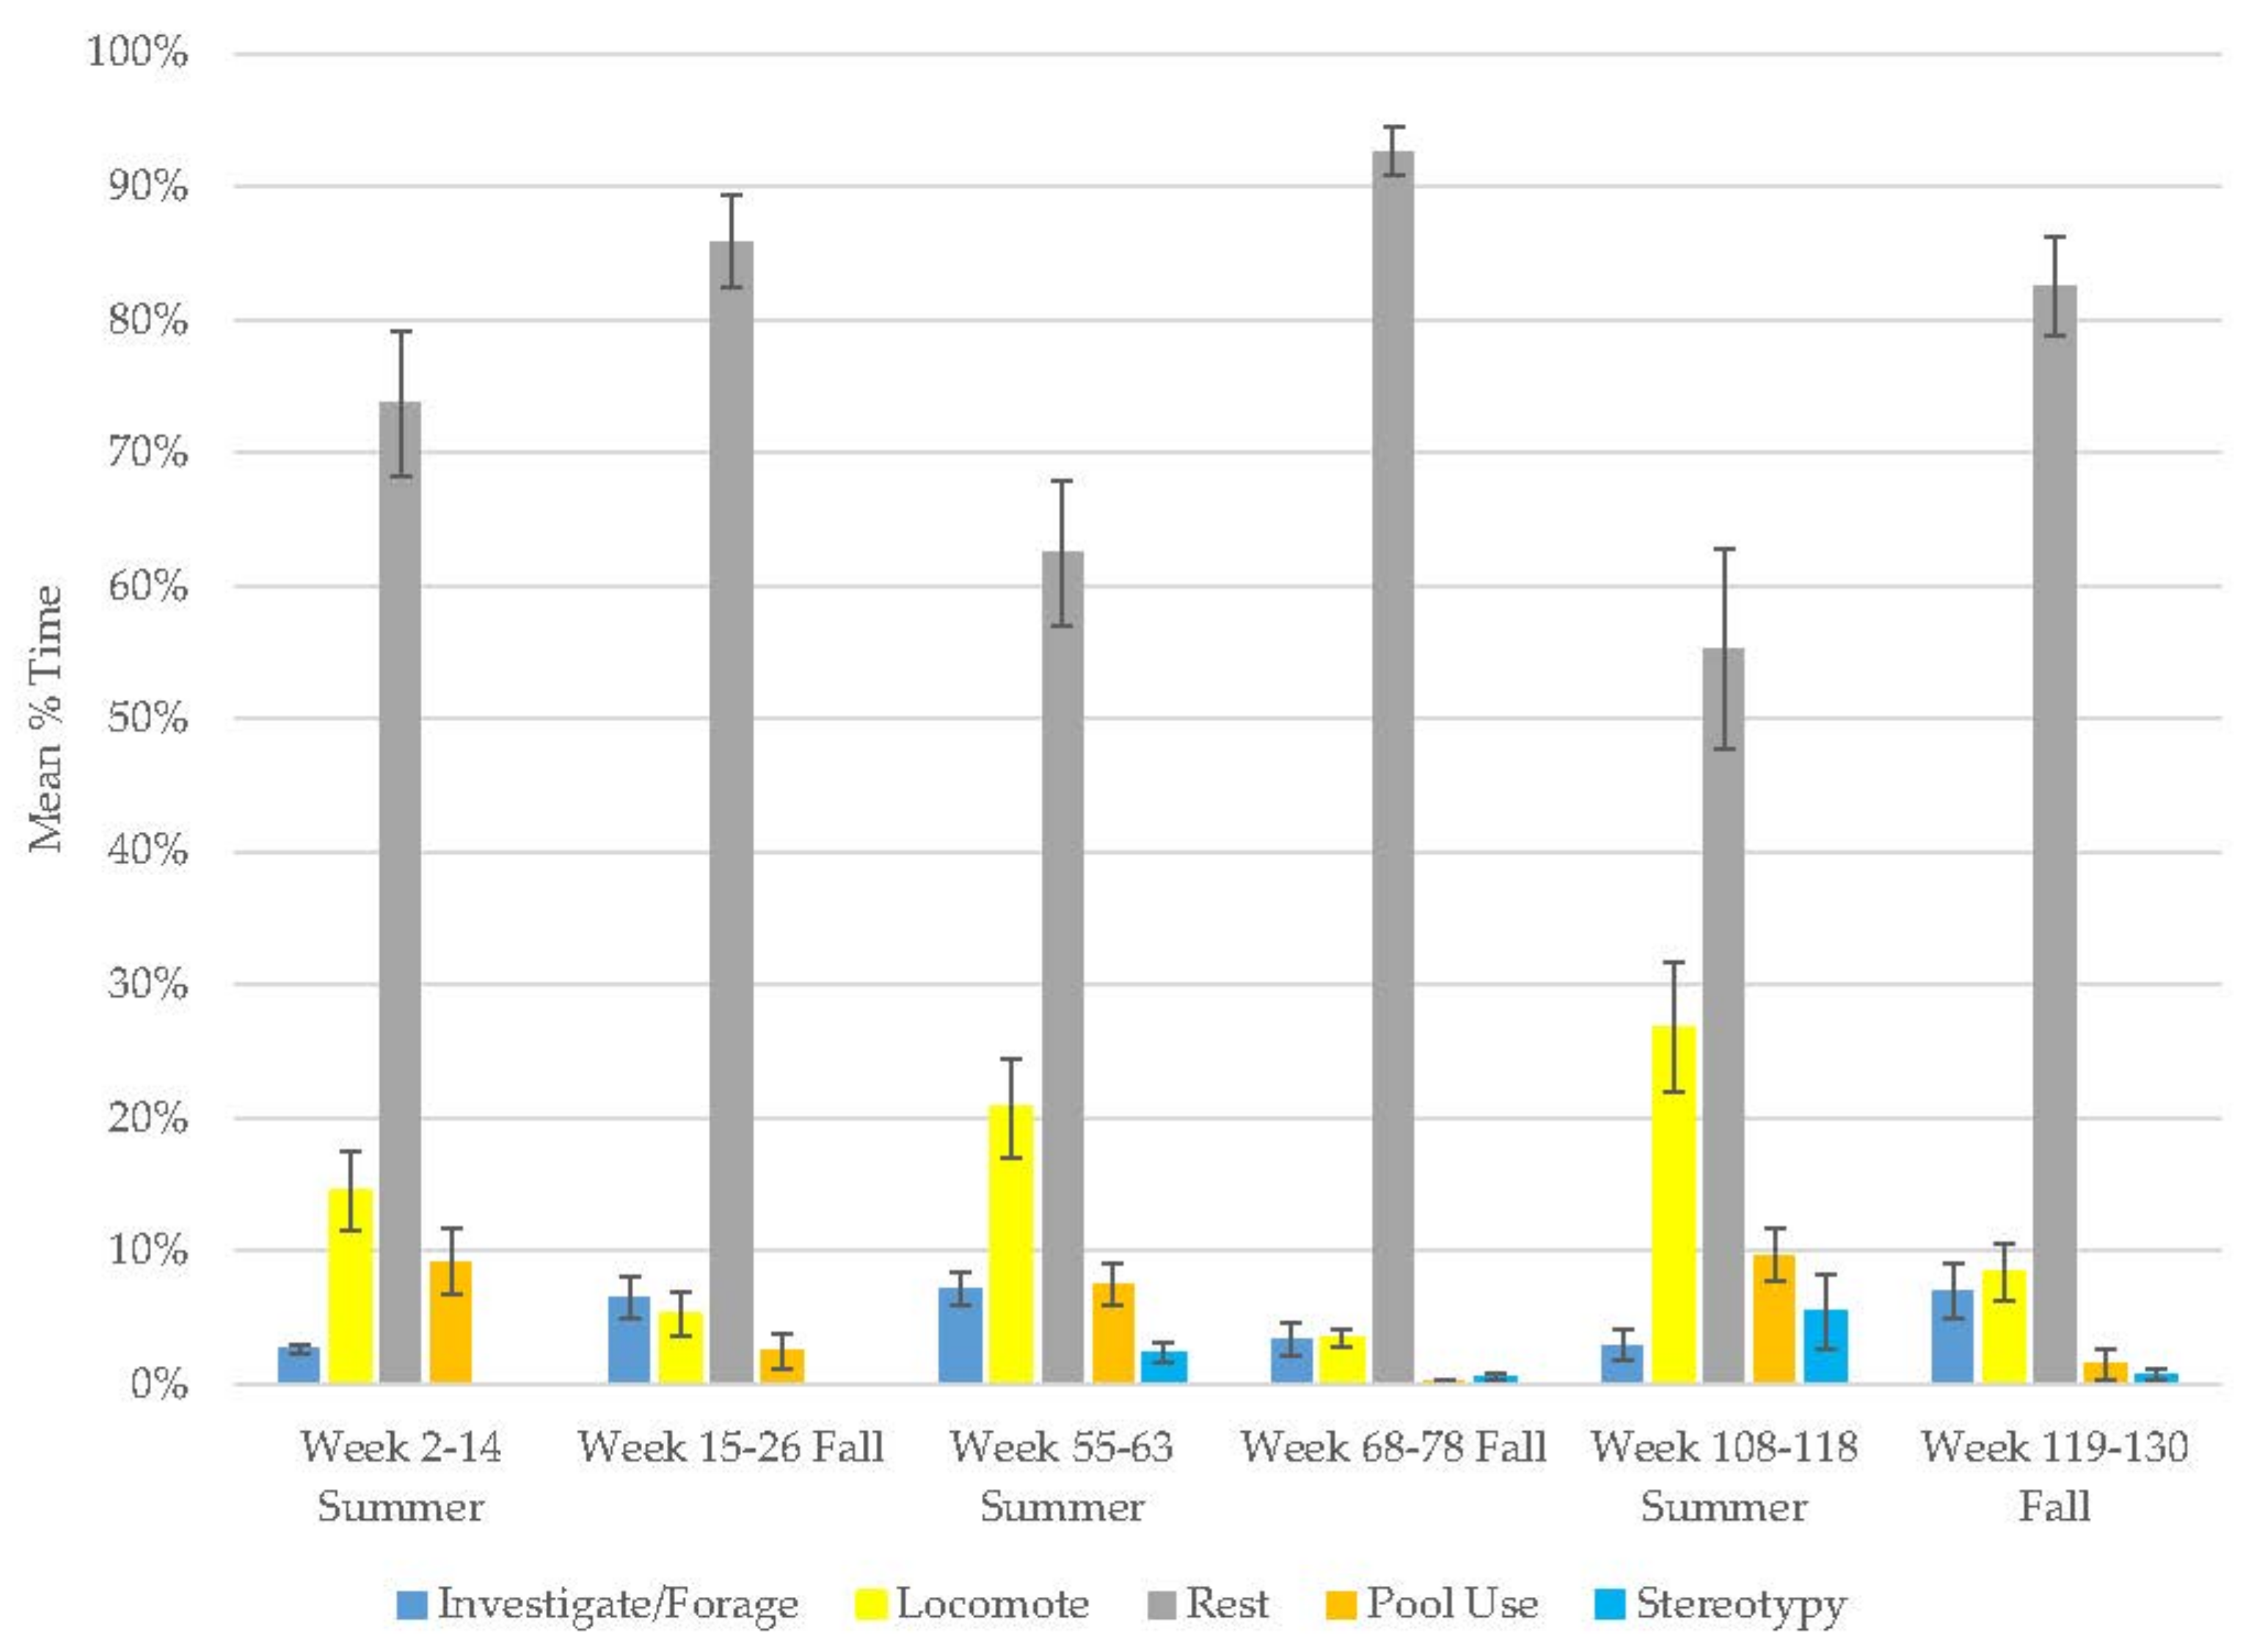
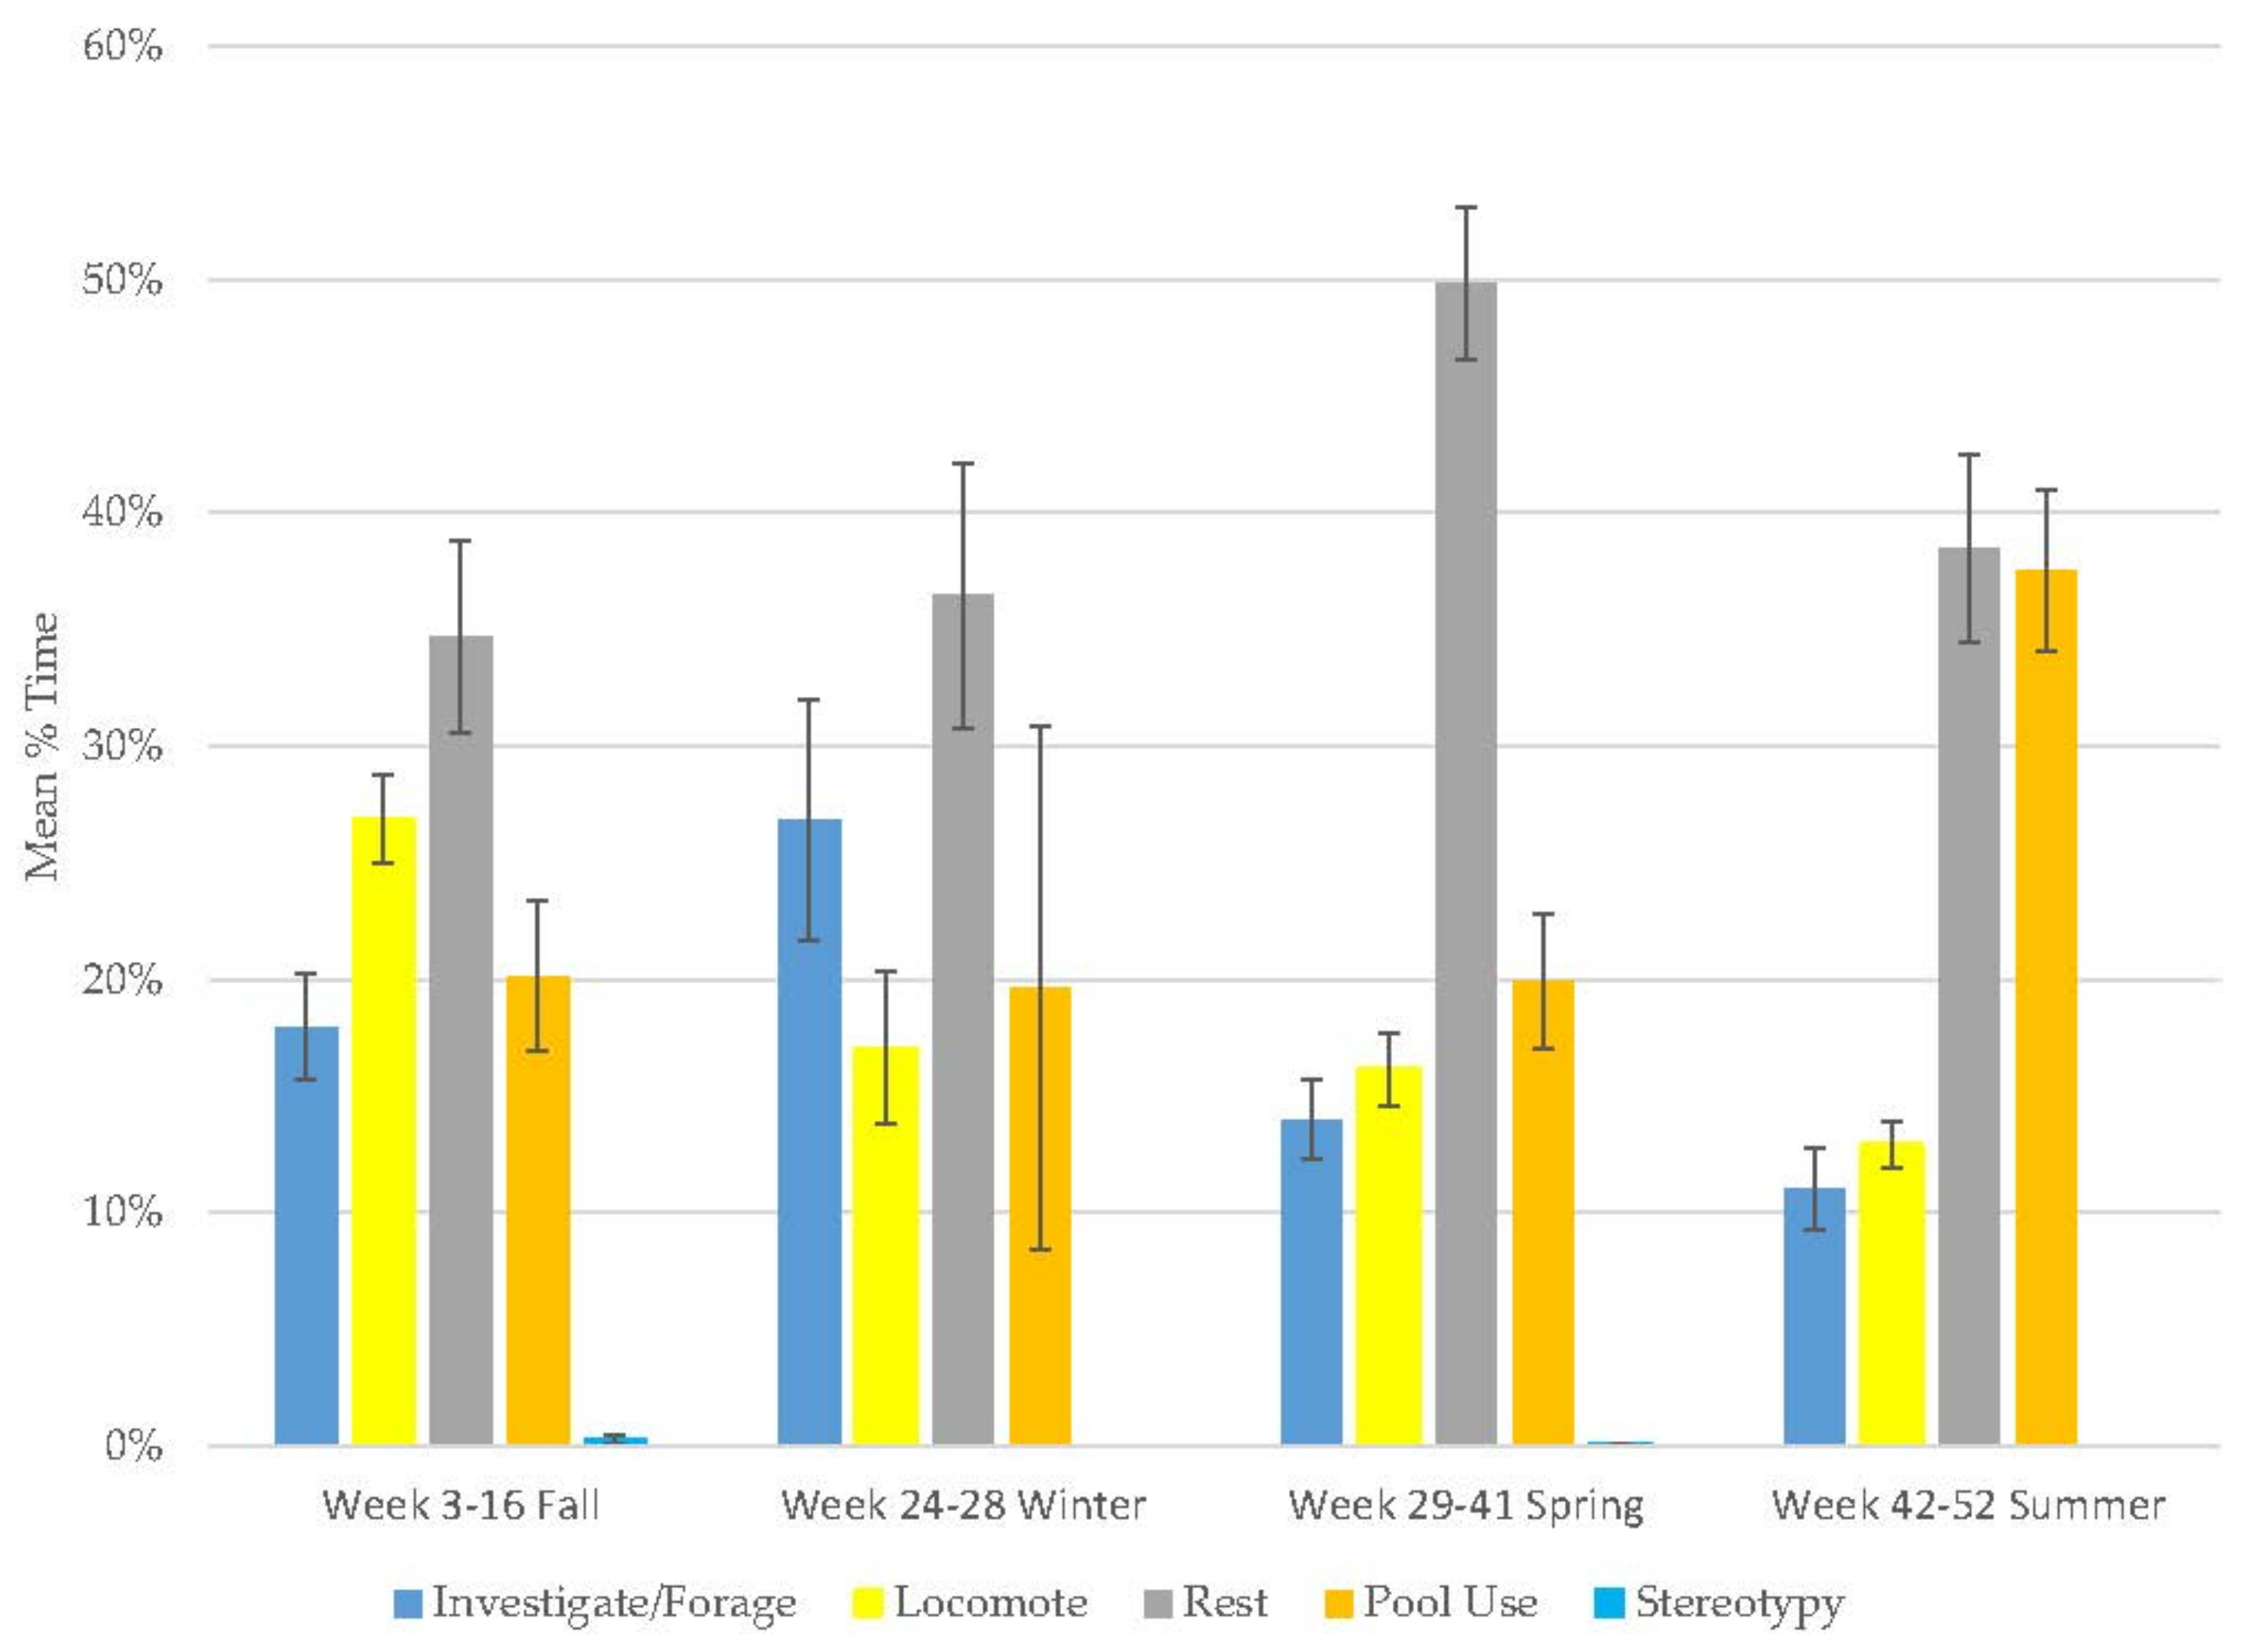
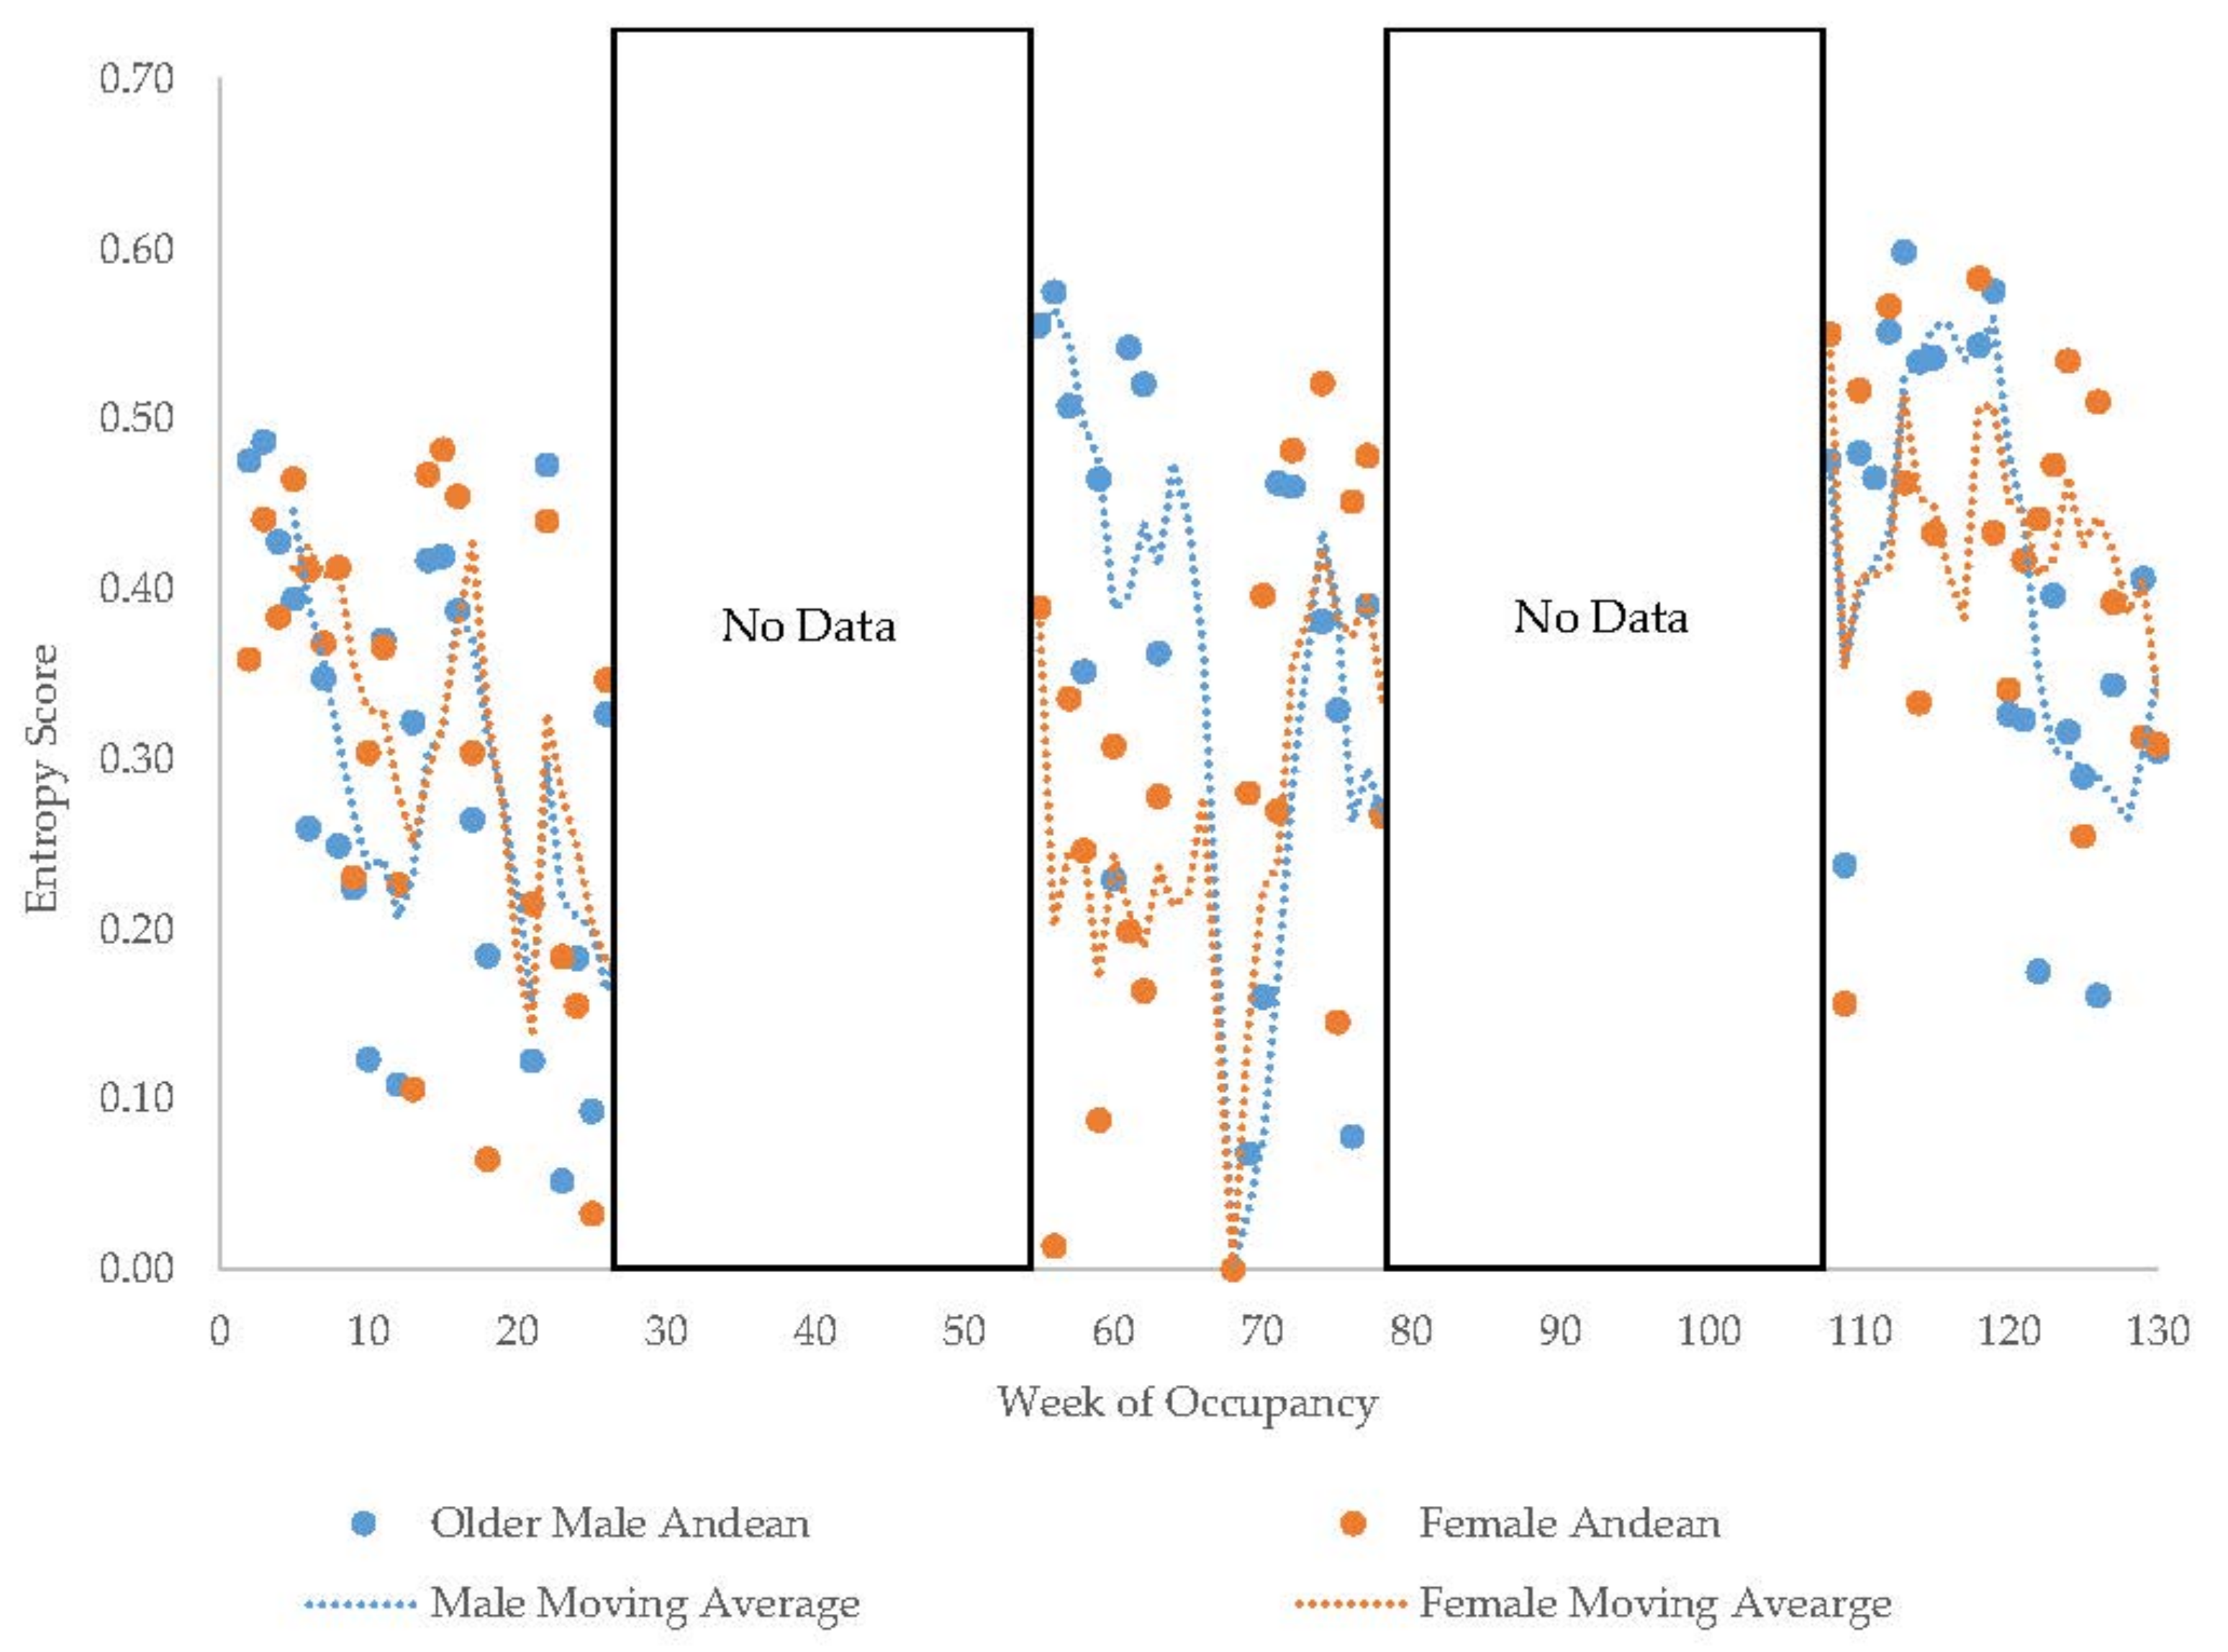
3.1. Old Male Andean Bear

This bear’s locomotion, stereotypy, and investigation/foraging behaviors increased, while resting and pool use decreased (Figure 1, Table 2). Overall, this bear spent a large percentage of his time resting (Table 3), but there was notable variation over time (range: 55–93%) as was the case for locomotion (range: 3–27%). Although there was a small increase in stereotypy over time, this behavior was rare (range: 0.4–5%).

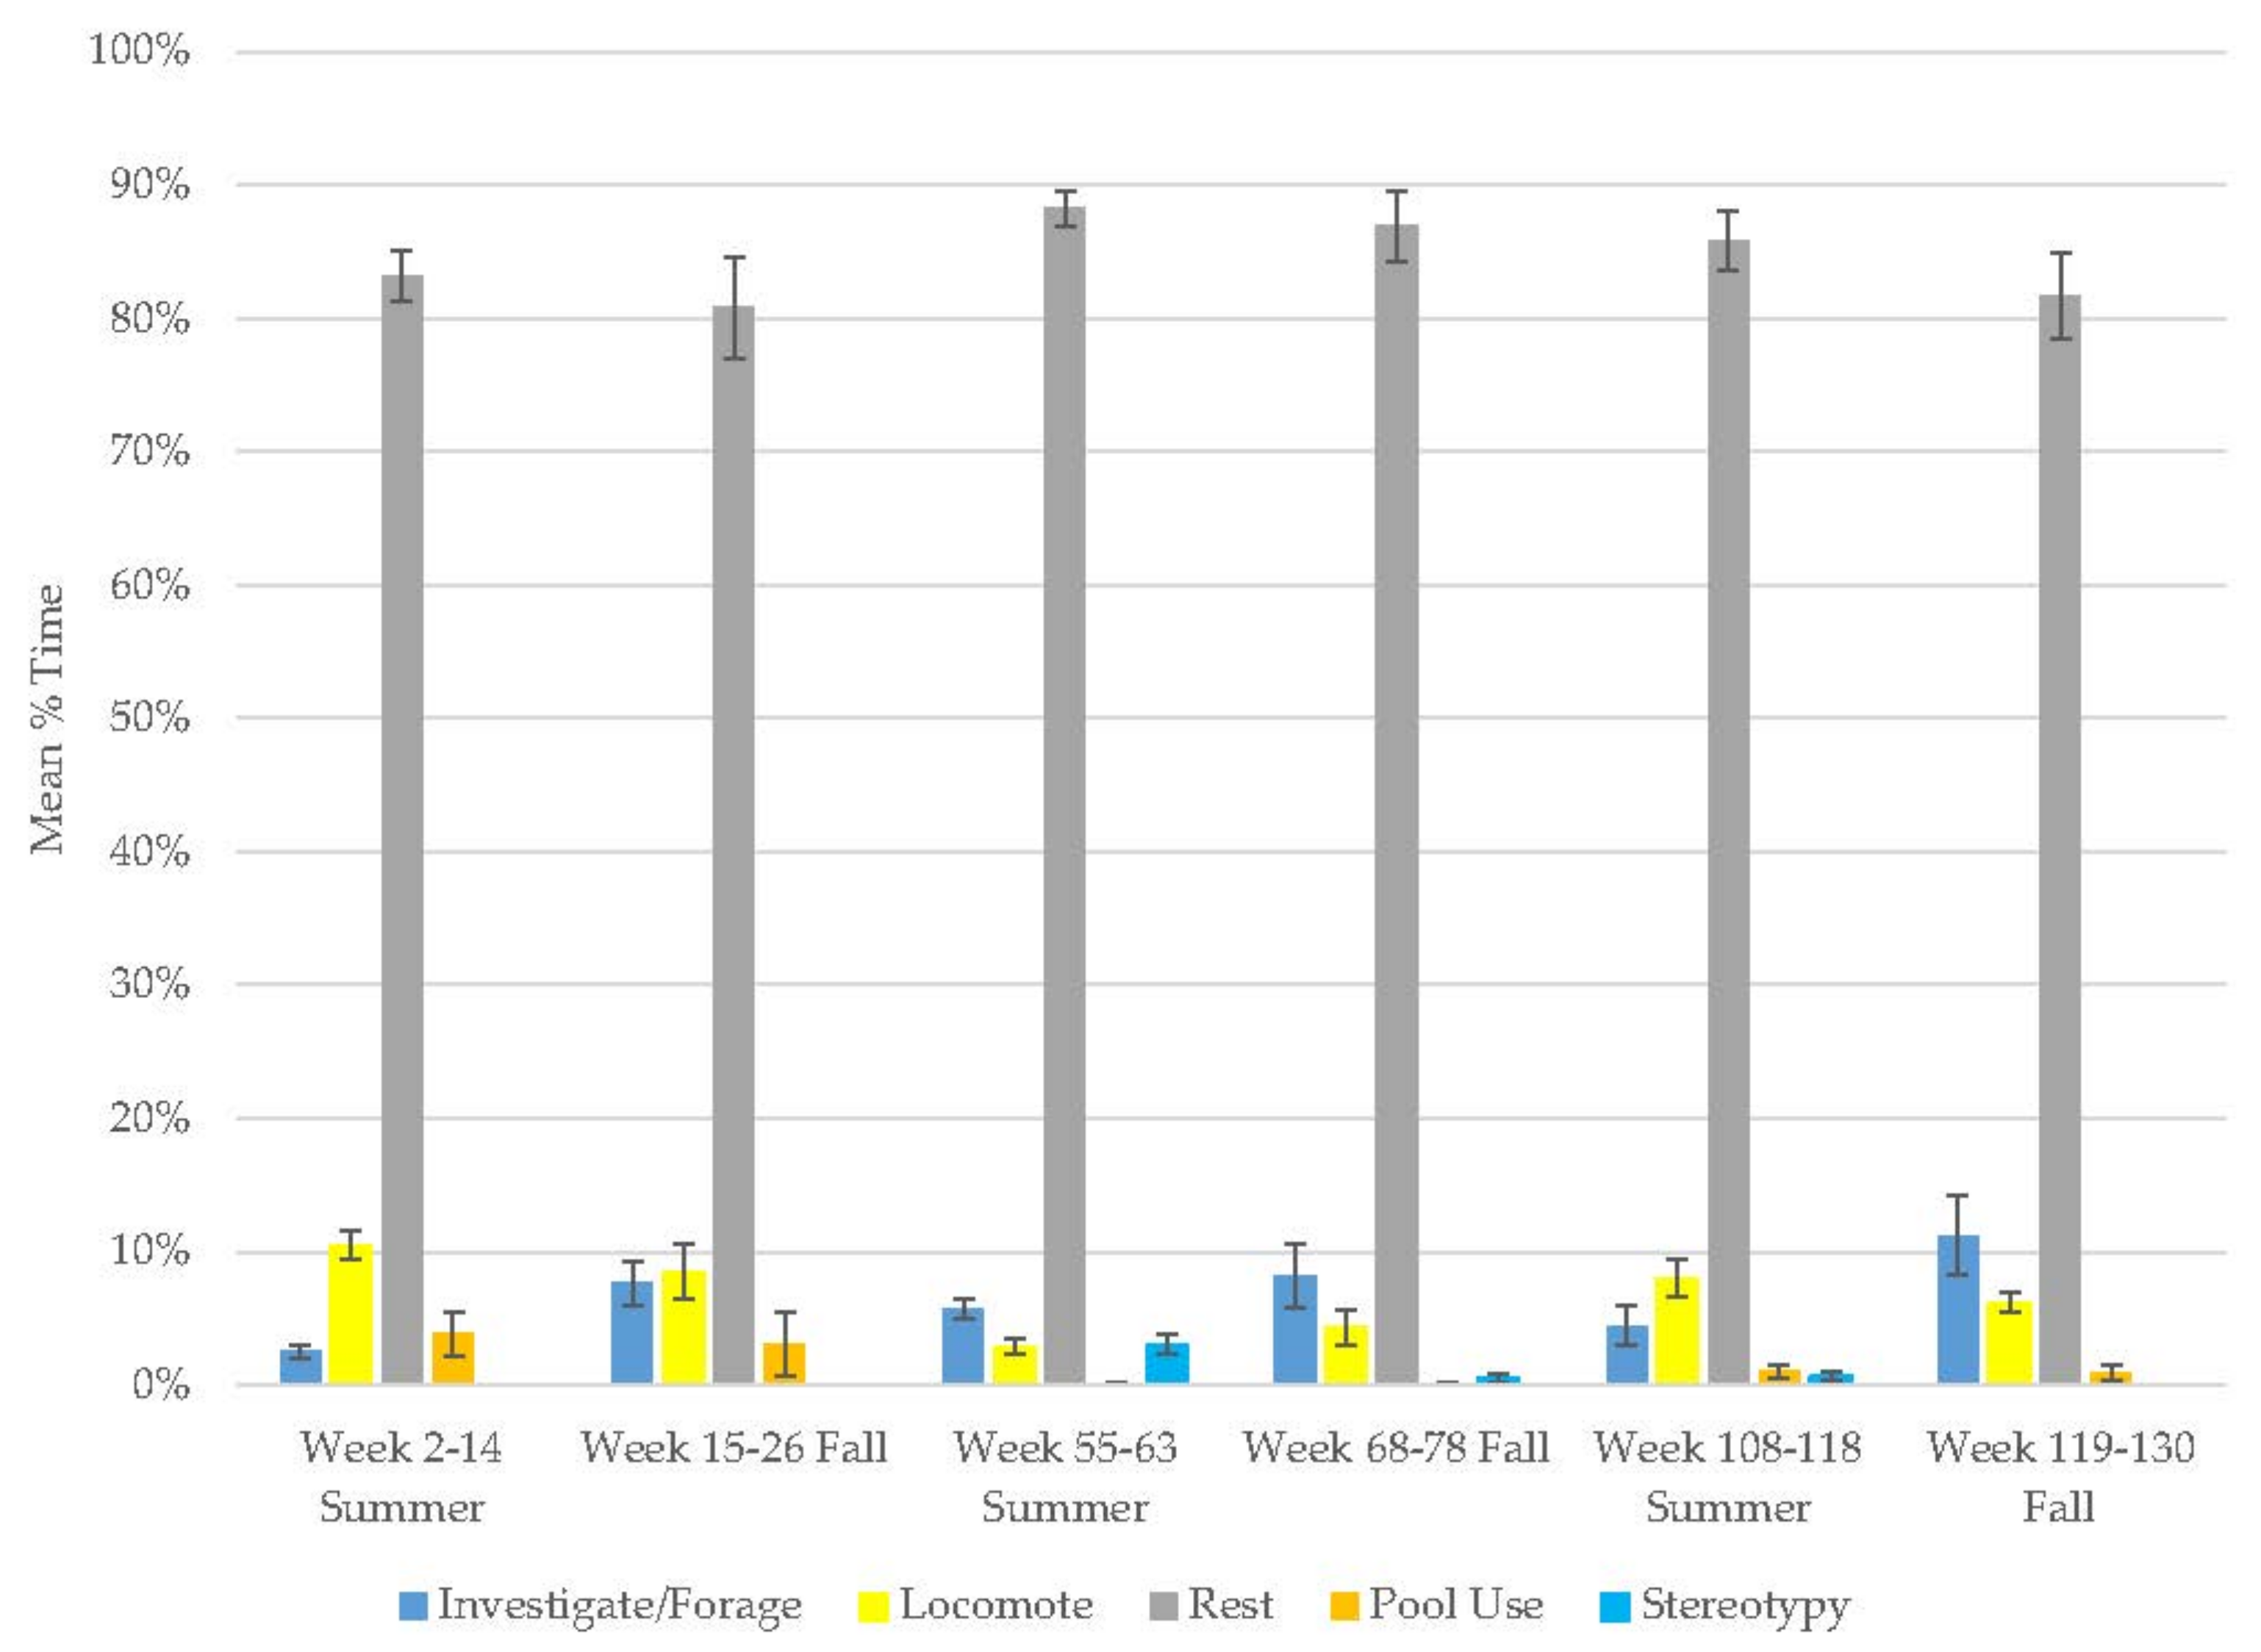
3.2. Old Female Andean Bear

There were increases in resting and investigate/forage and decreases in locomotion, pool use, and stereotypy over time (Figure 2, Table 2). Like the older male with which she was housed, she spent the majority of her time (>80%) resting but showed less variation in this behavior (Table 3). Stereotypy was rare as well (range: 0.5–3%).

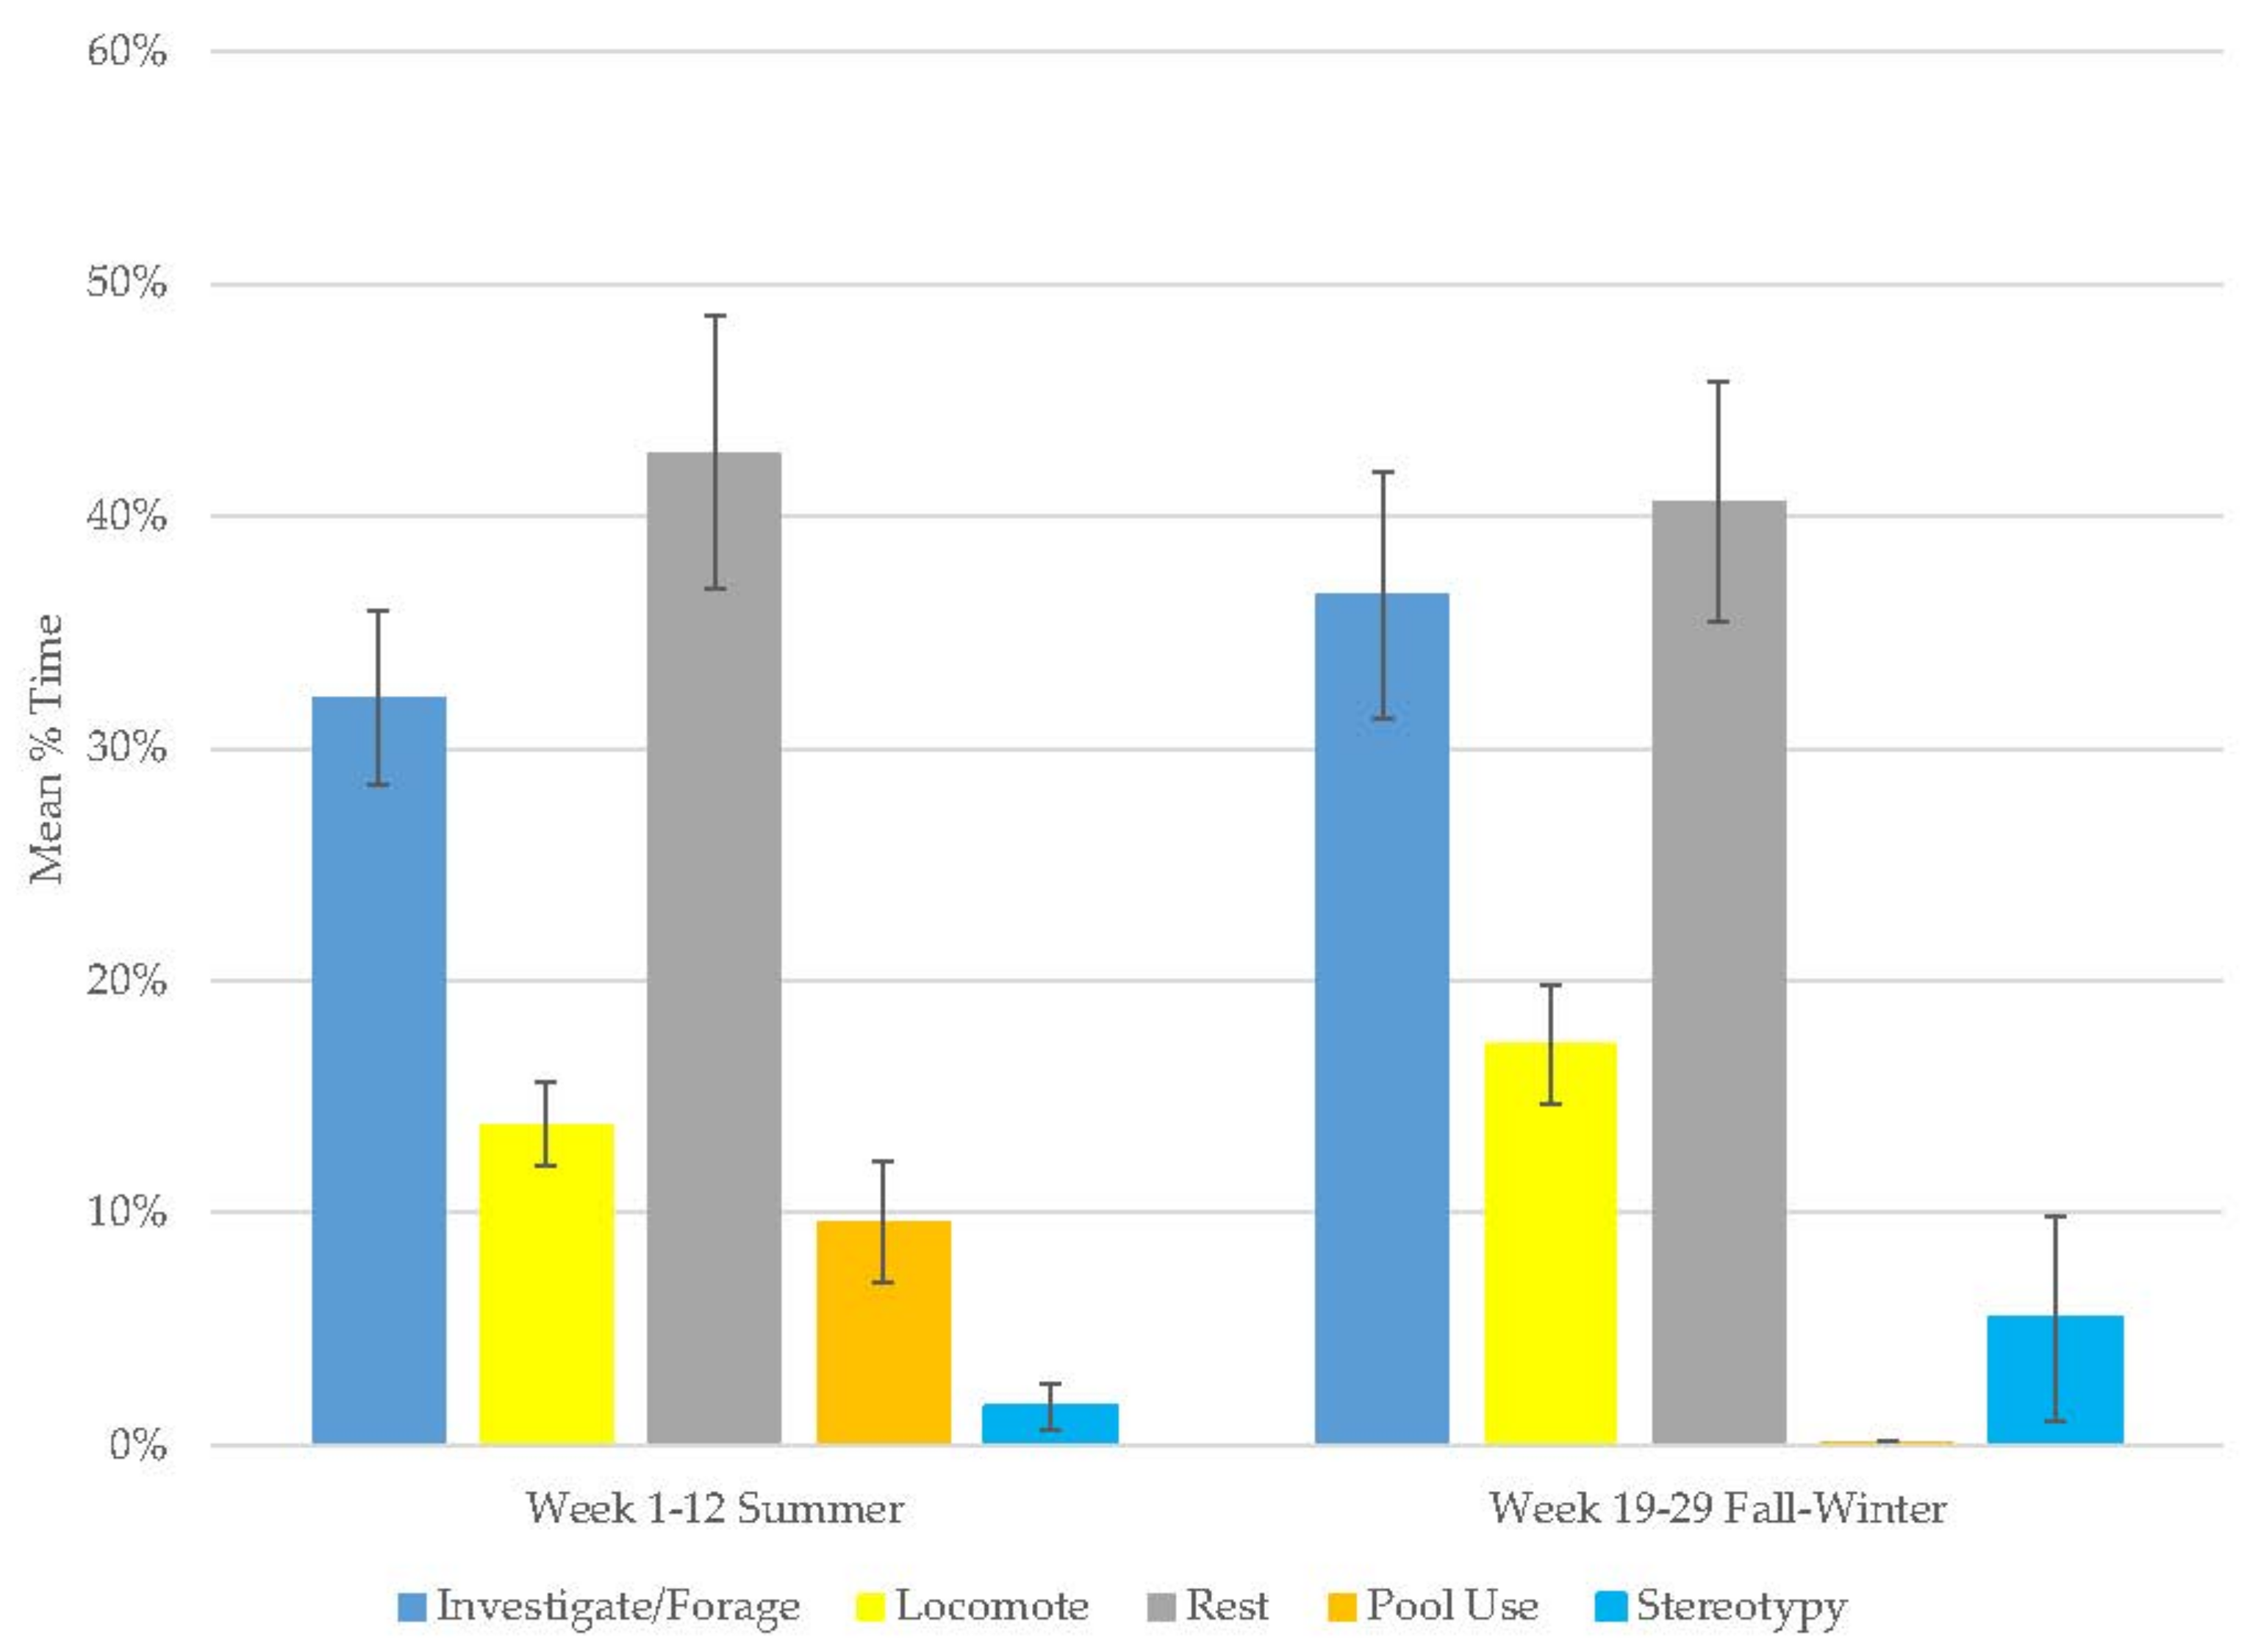
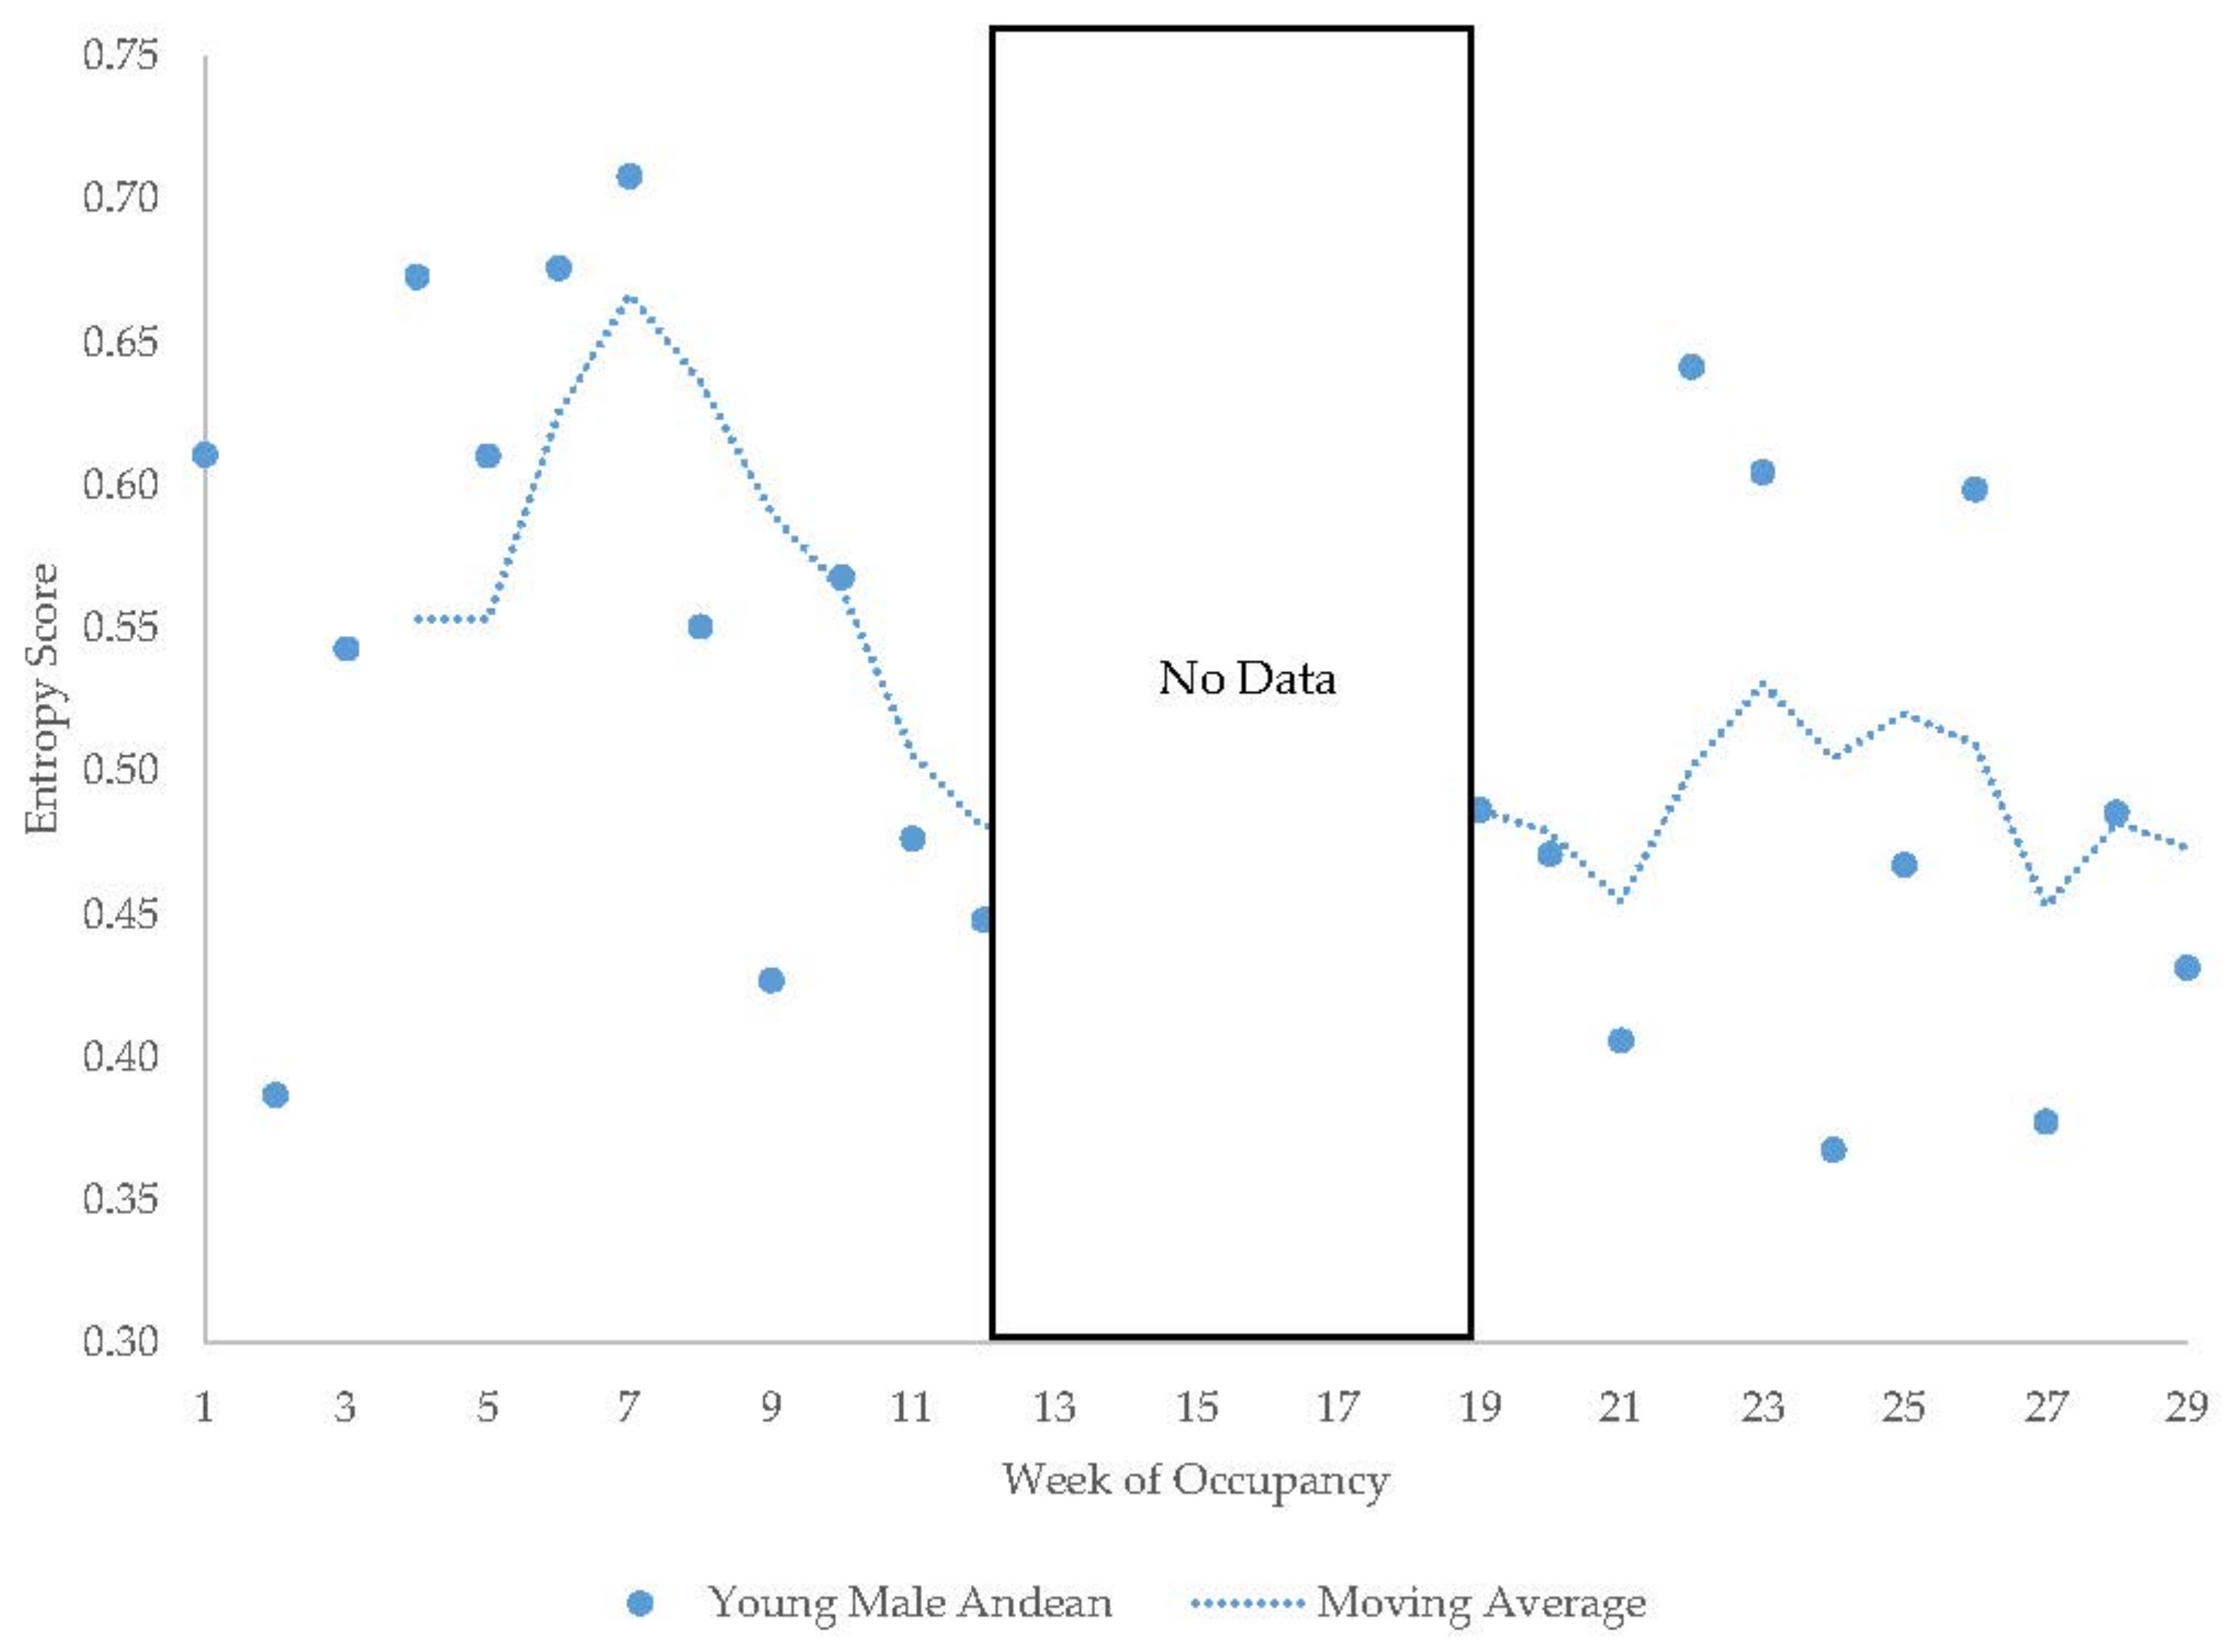
3.3. Young Male Andean Bear
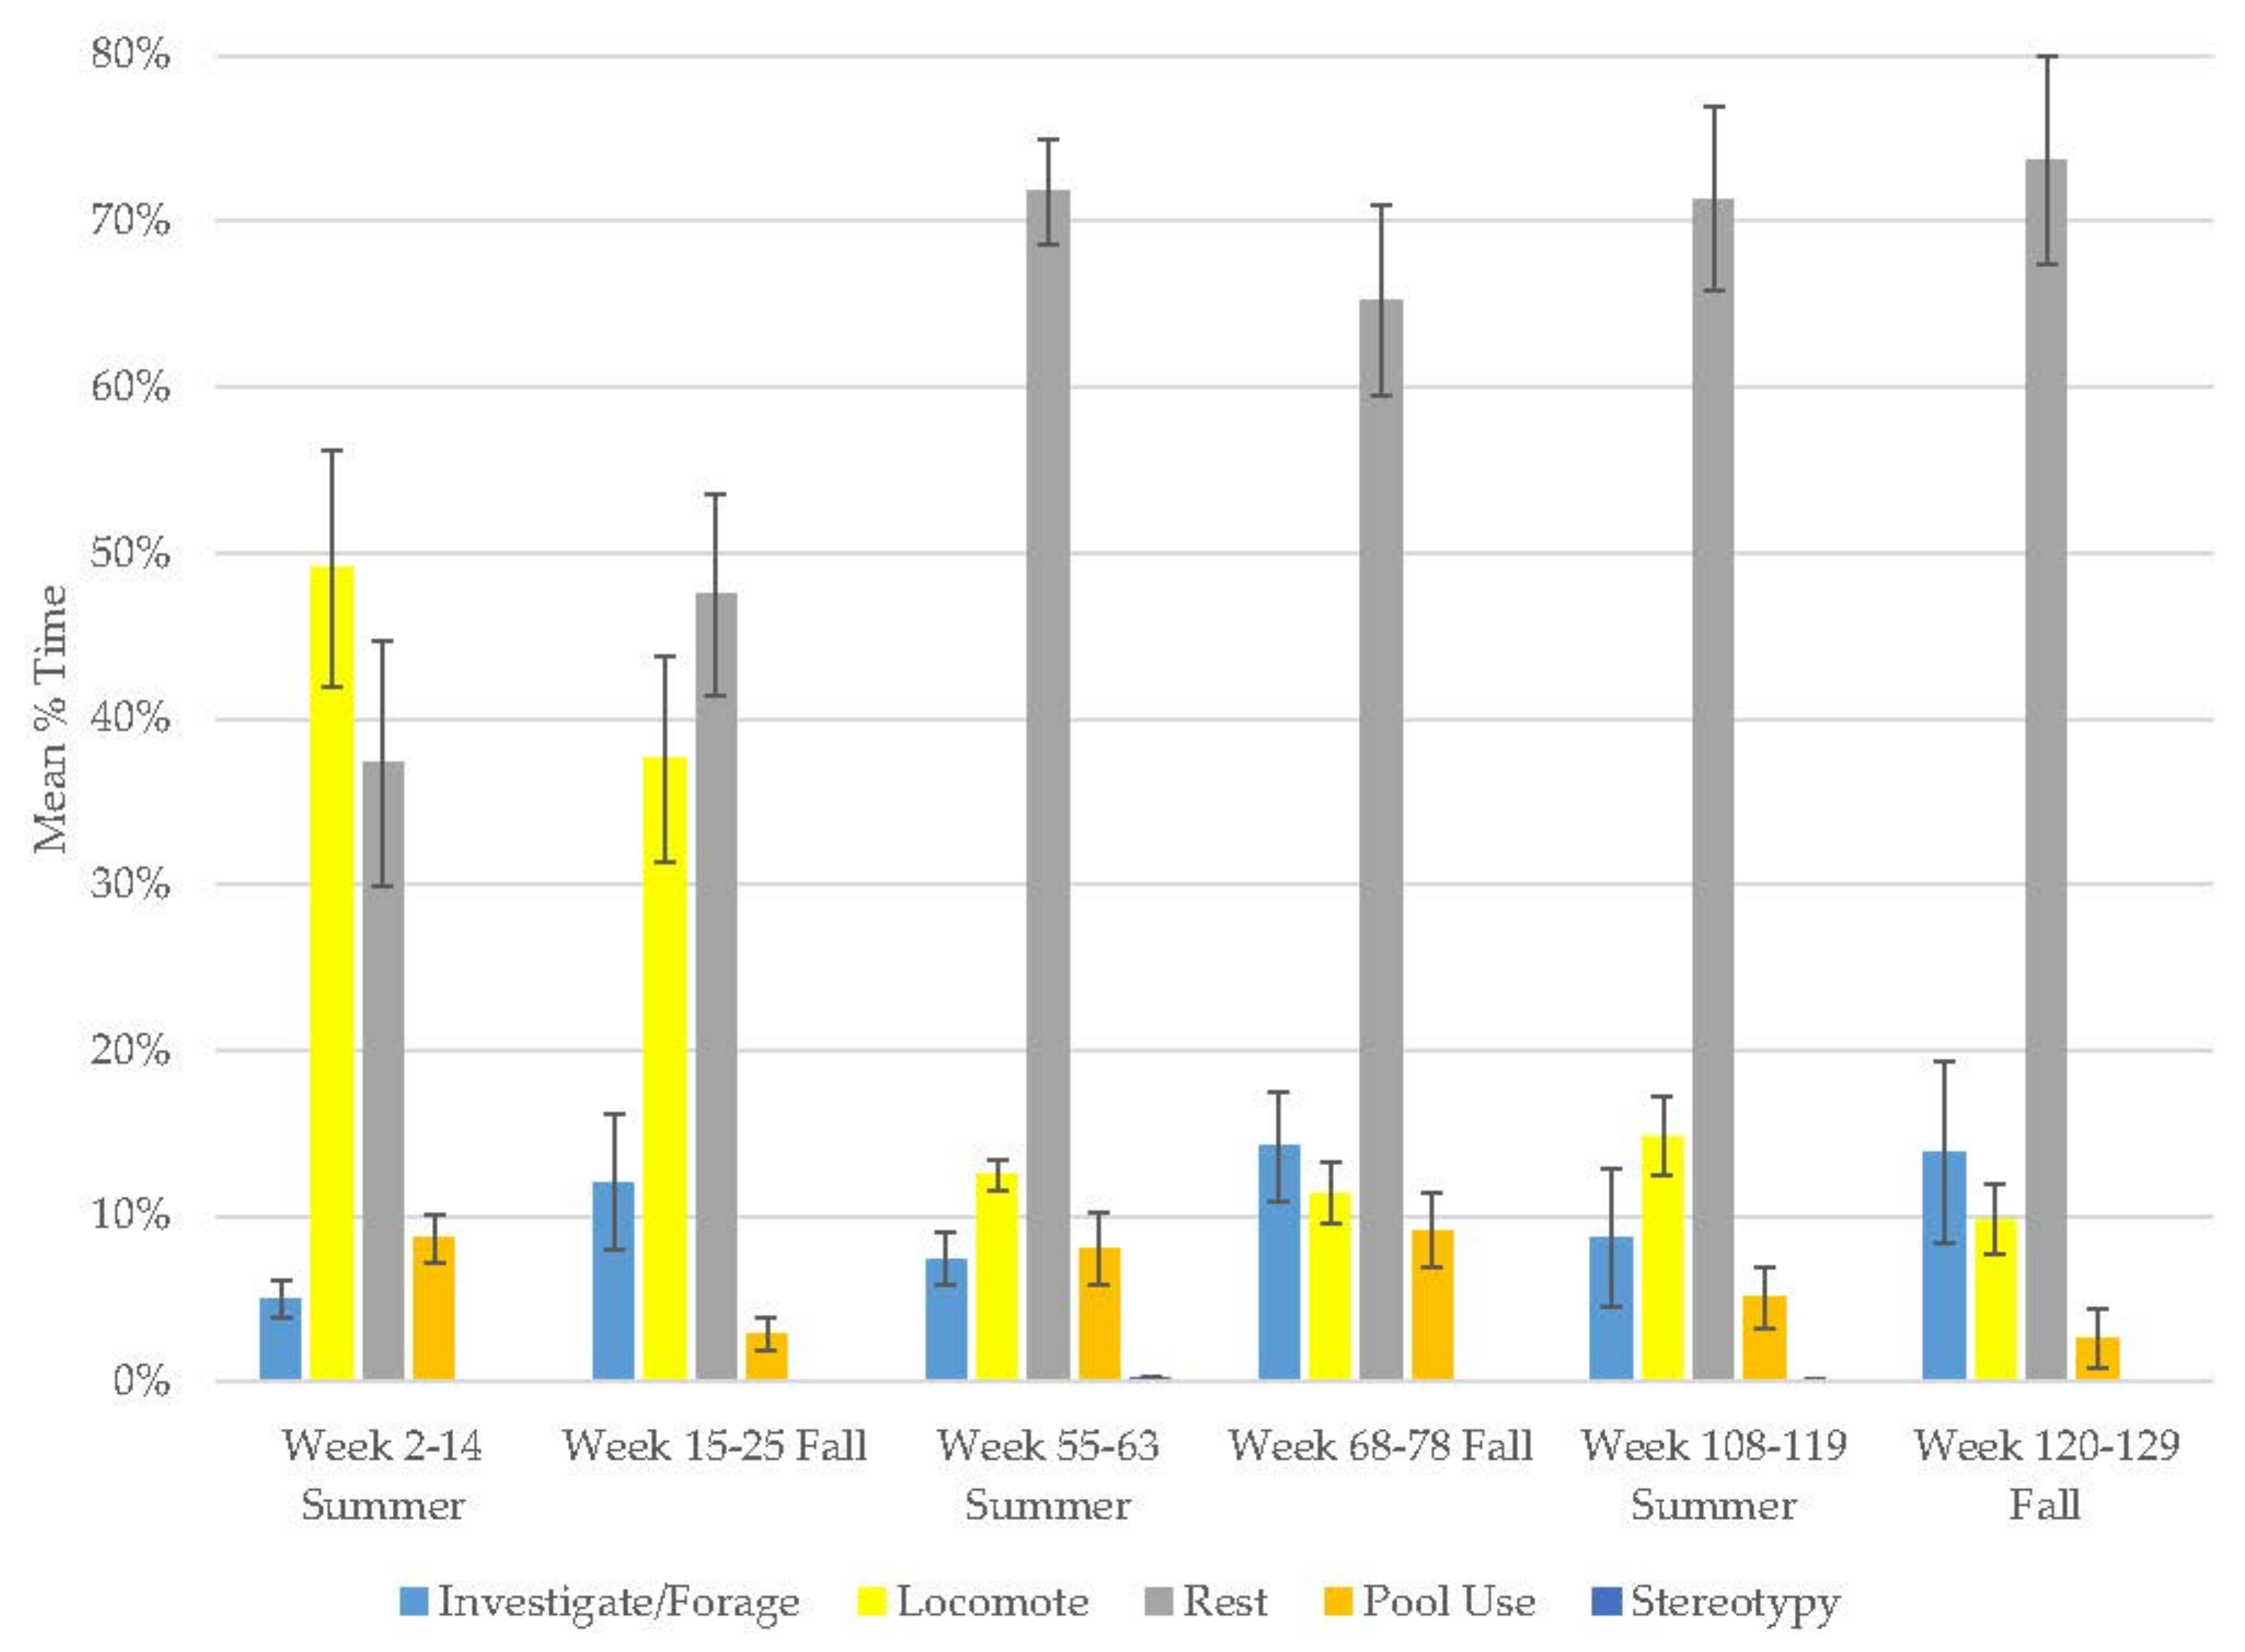
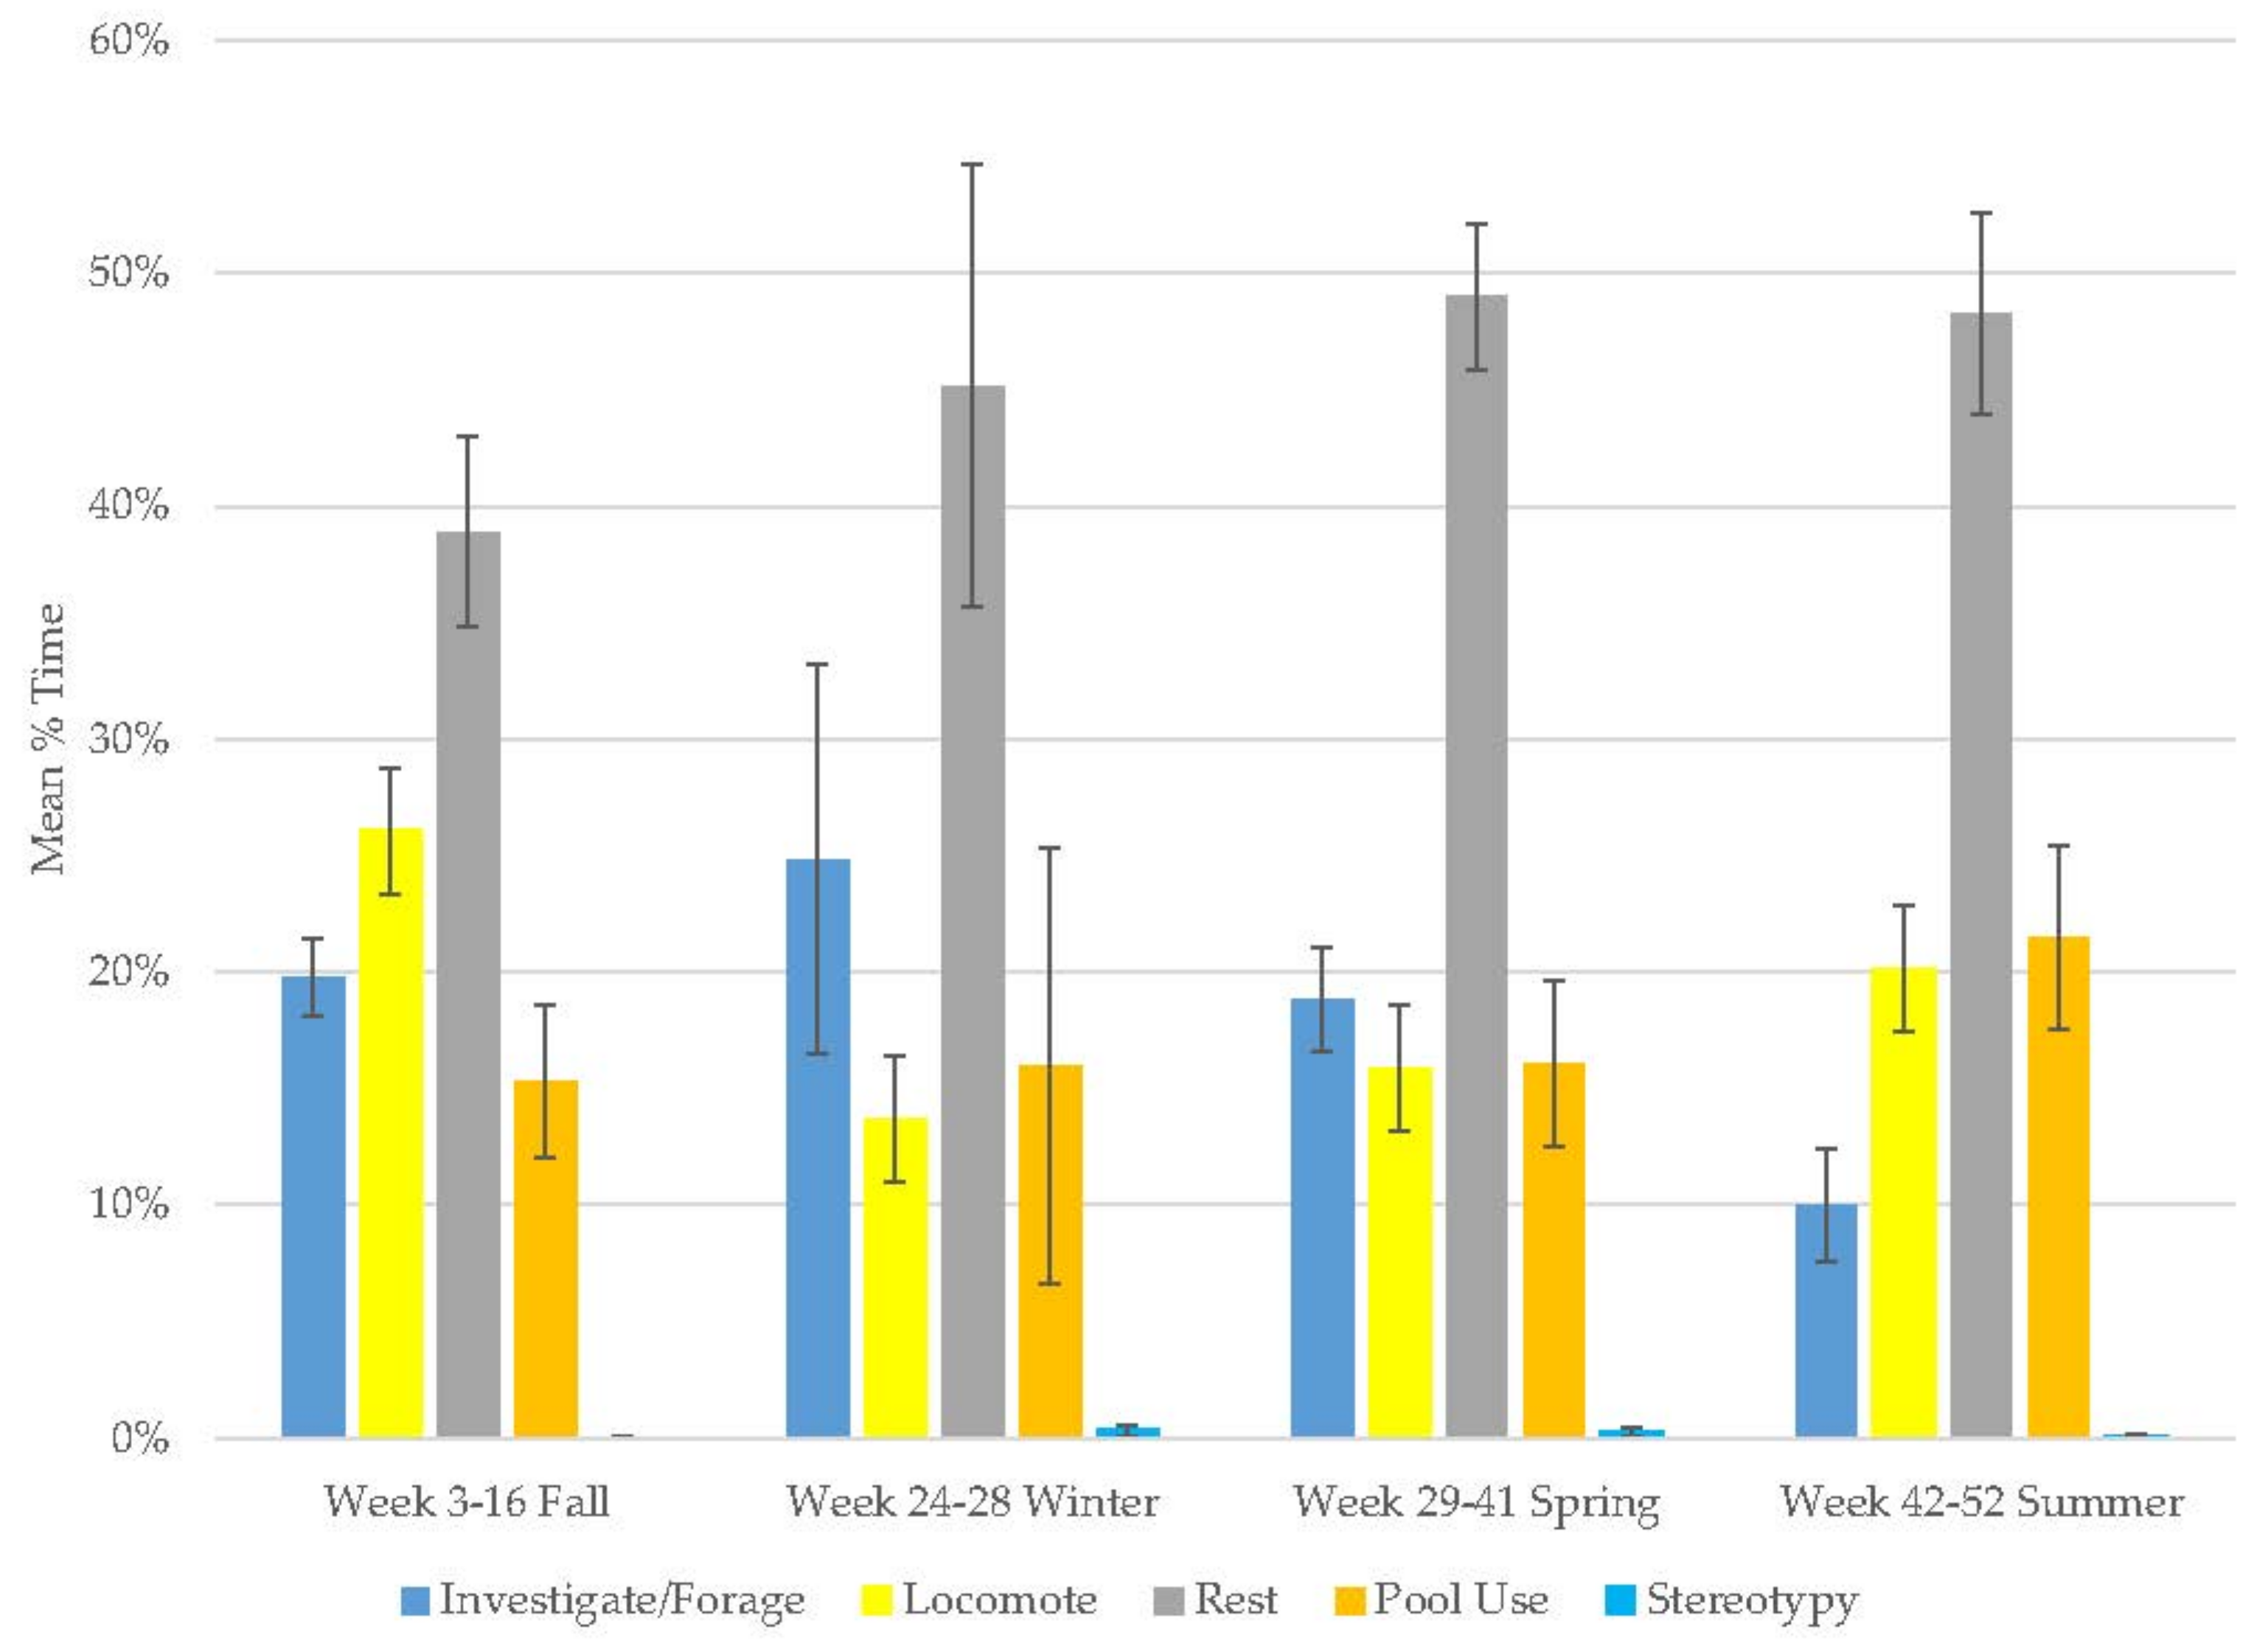
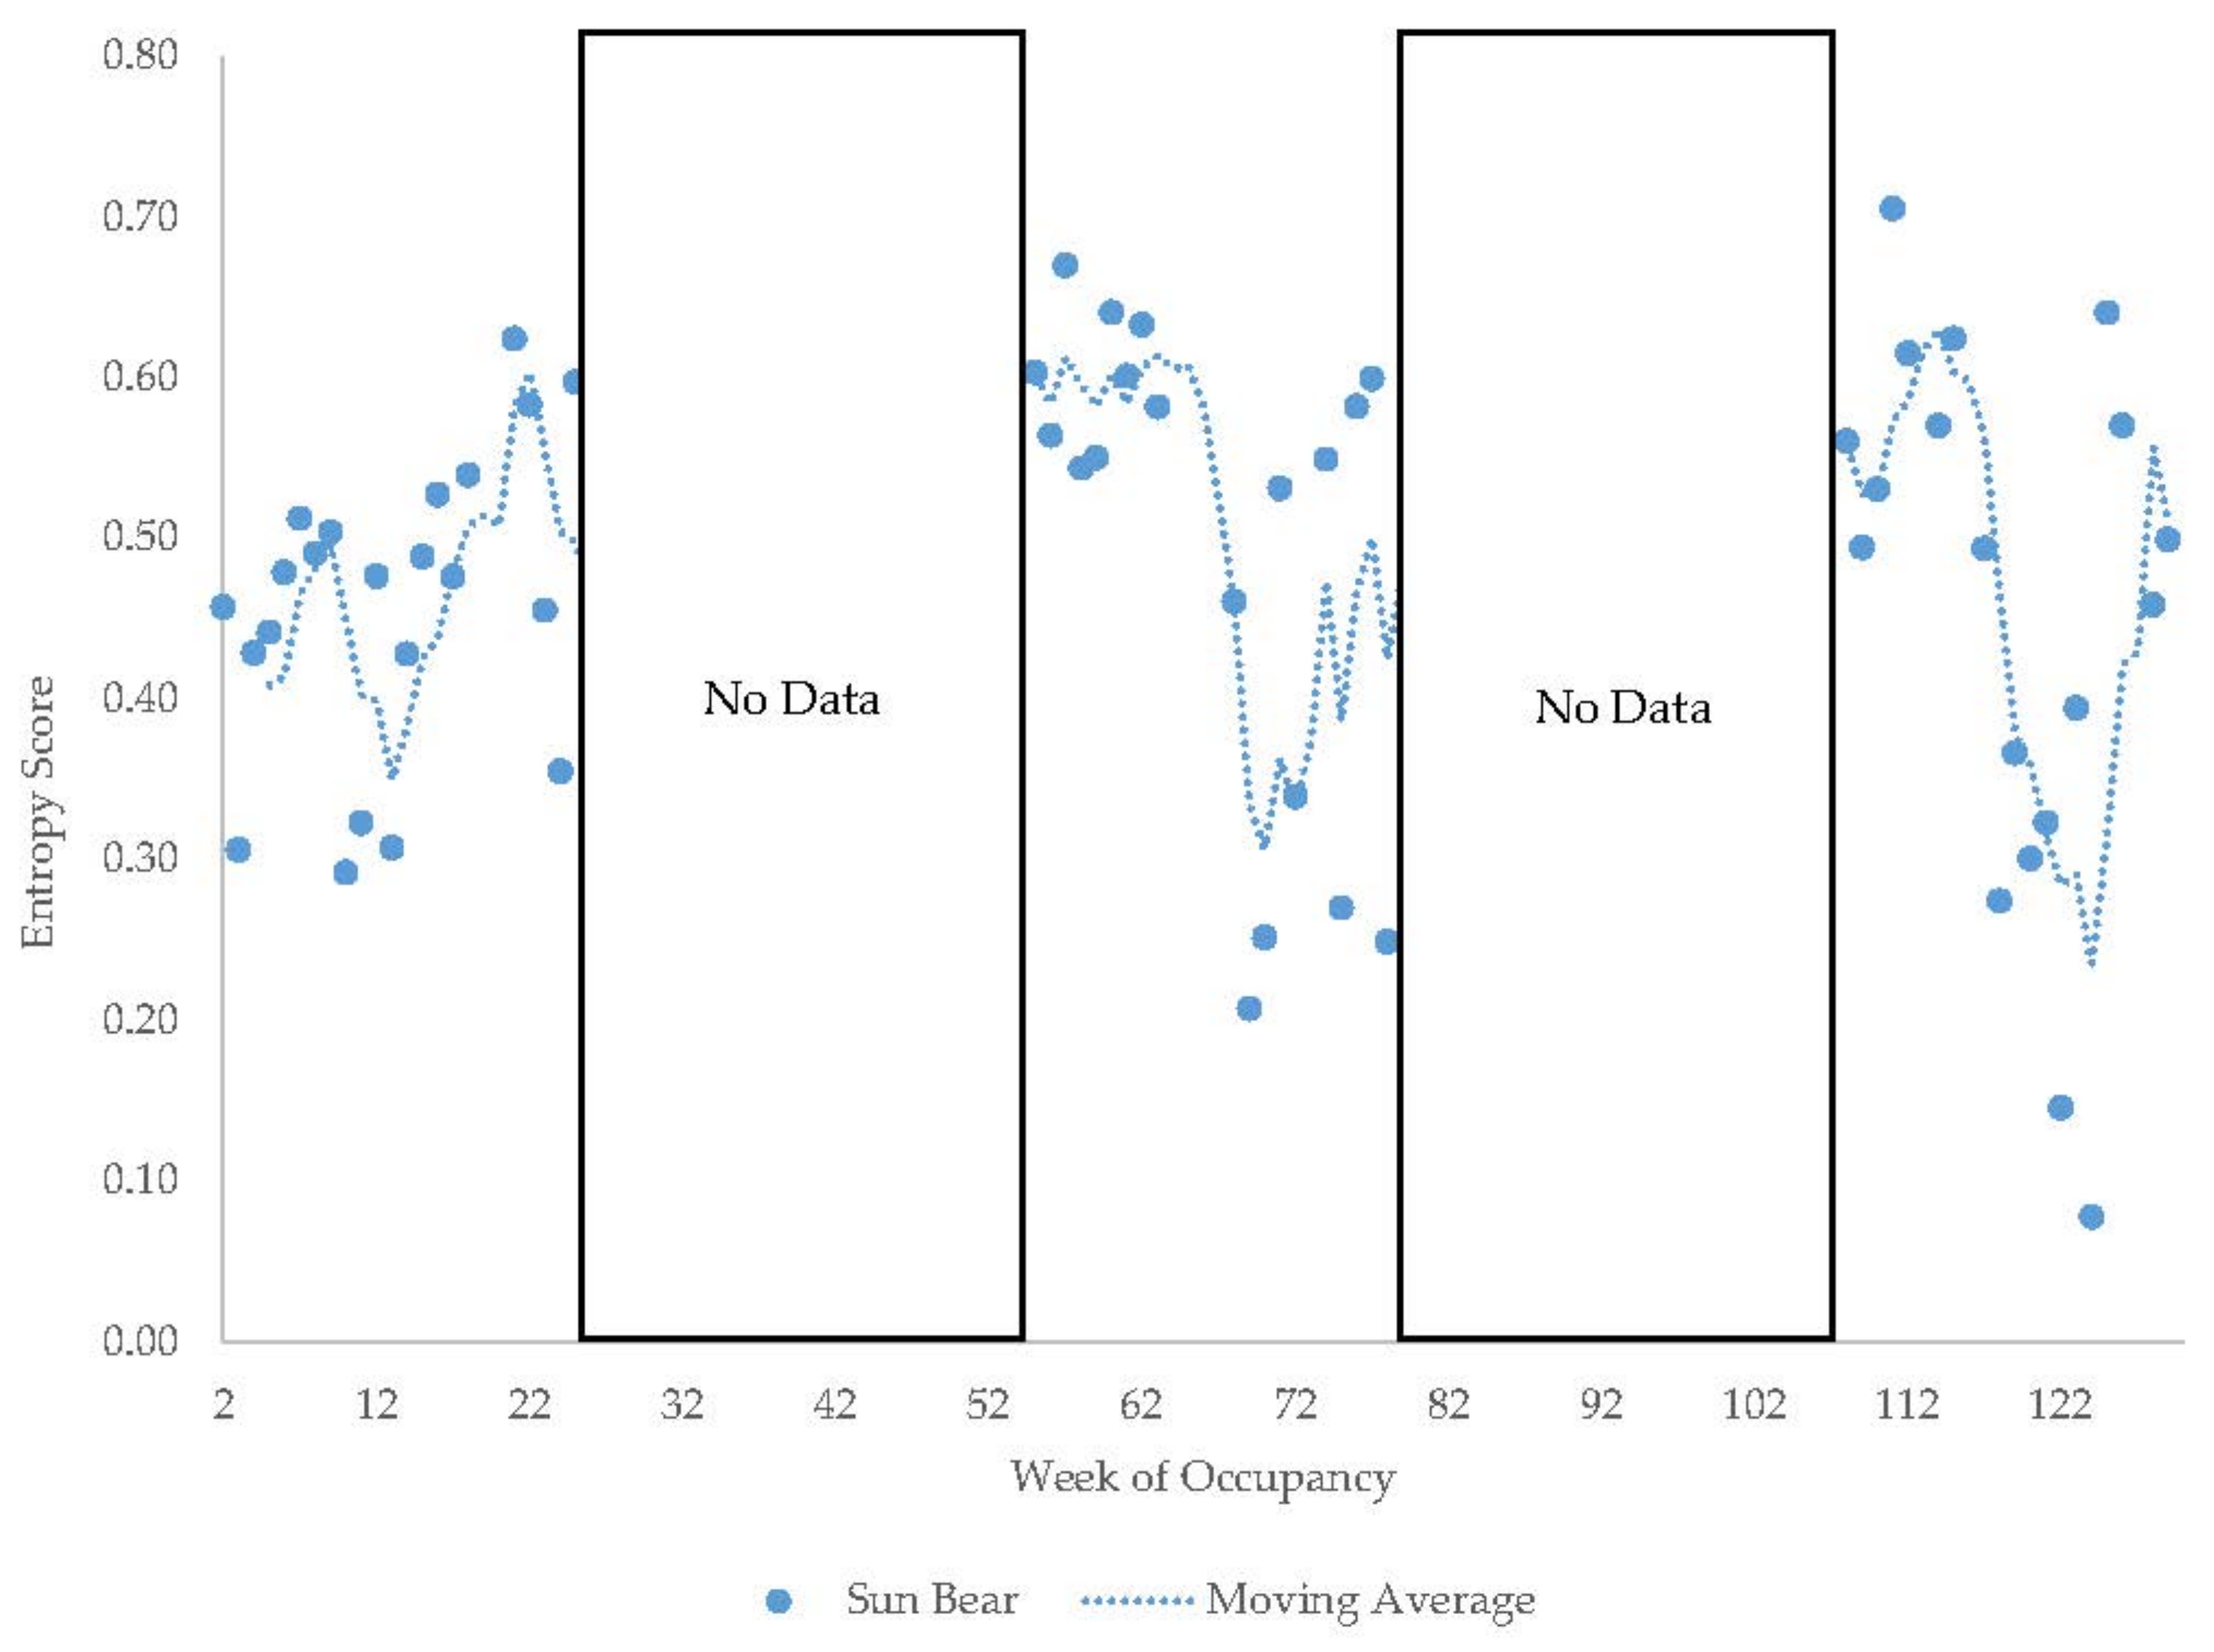
There were increases in investigate/forage, locomotion, and stereotypy and decreases in resting and pool use during observations of this bear (Figure 3, Table 2). Resting (range: 40–43%) and investigate/foraging behaviors (range: 32–37%) were the most common behaviors in this bear’s activity budget (Table 3). Stereotypy was rare (2–6%). Investigate/forage and resting were his most variable behaviors.

3.4. Male Sun Bear

The sun bear demonstrated an increase in resting and investigation/foraging behaviors and decreases in locomotion, pool use, and stereotypy (Figure 4, Table 2). This animal demonstrated more locomotion (range: 38–49% of time) than any other subject initially (Table 3); however, comments in the data reveal that a ‘pacing’ notation was frequently added when locomotion was scored (note added to 35.4% of locomotion scans). However, pacing was not systematically noted by the observers since it was not on the ethogram in 2014, so this ad lib scoring likely represents a minimum percentage of time. Locomotion and stereotypic pacing were separated in the 2015 ethogram, and stereotypy virtually disappeared (averaging less than 0.3% in subsequent years). It seems likely the large amount of time devoted to locomotion in year one was stereotypic pacing to a large extent. Similar to the older Andean bears, resting was the most common behavior (range: 37–74%) in his activity budget but variable (Table 3). Resting and locomotion were his most variable behaviors.

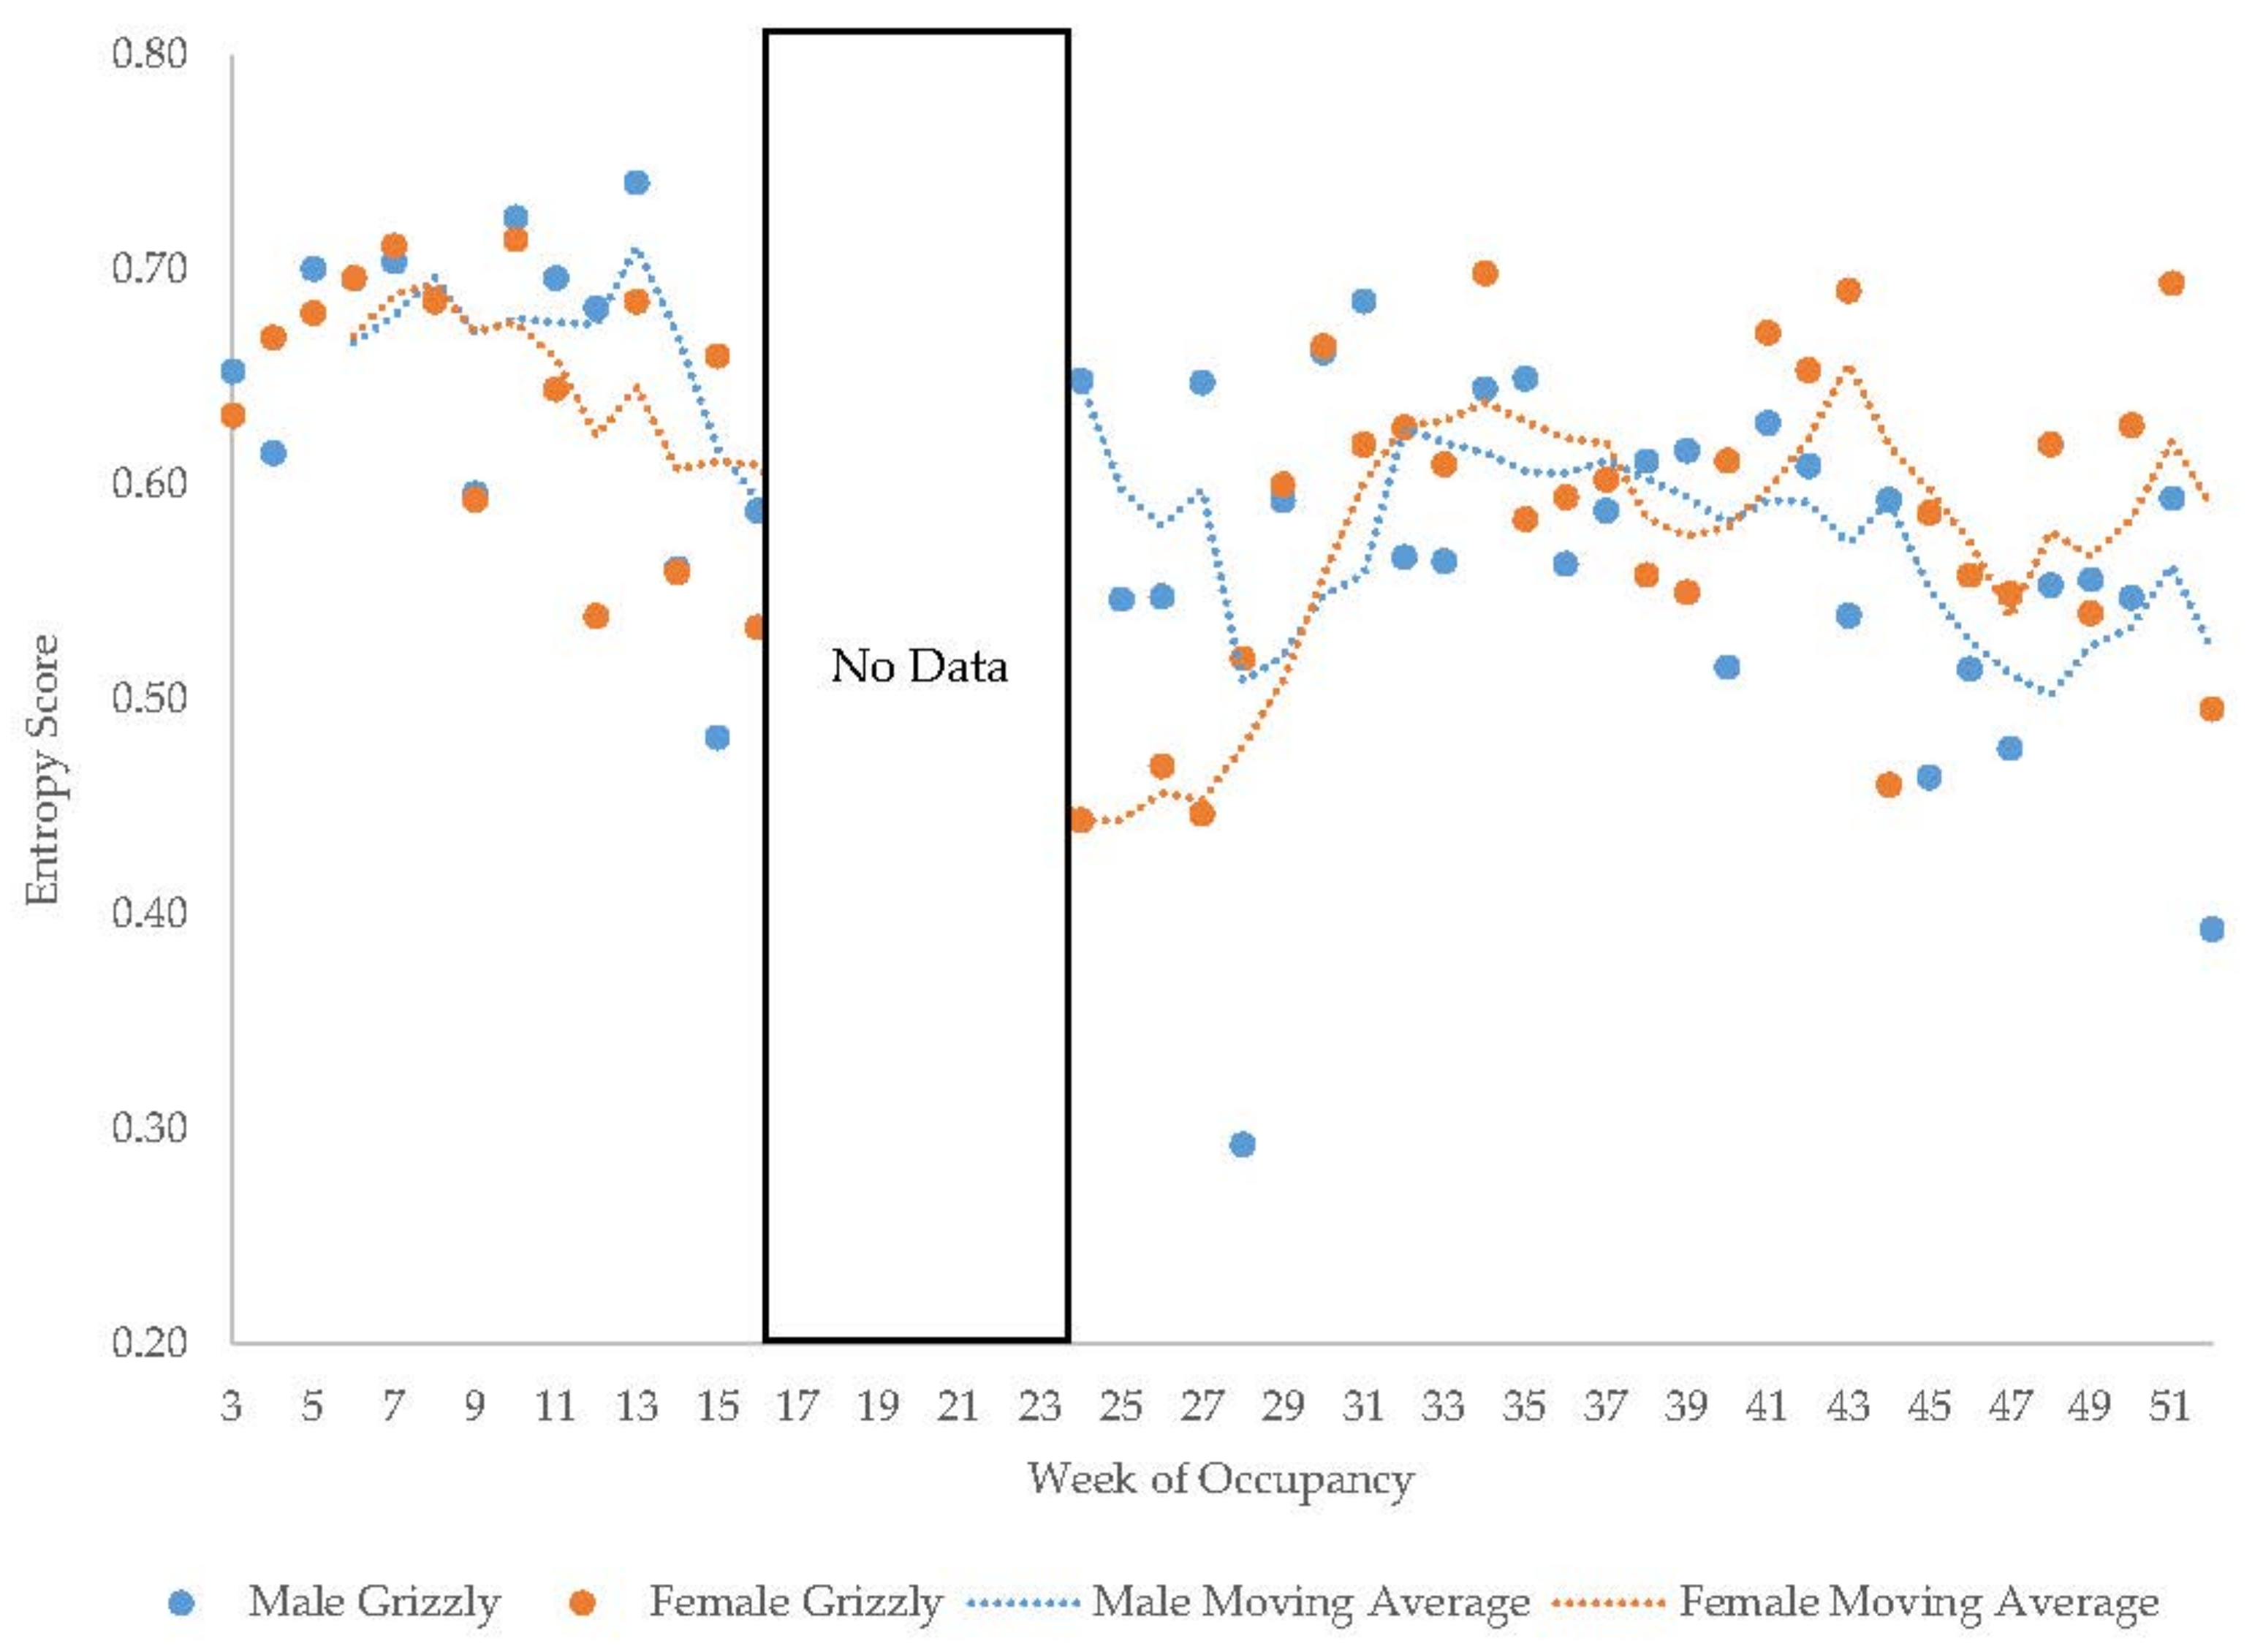
3.5. Male Grizzly Bear

The male demonstrated increases in resting (range: 35–50%) and pool use (range: 20–38%) and decreases in locomotion (range: 13–27%) and stereotypy (Figure 5, Table 2). Investigate/forage (range: 11–26%) behavior peaked in winter and then declined. The majority of this bear’s time was spent in active behaviors (Table 3) and stereotypy was virtually non-existent (0–0.3%). Resting and pool use were his most variable behaviors.
The female grizzly bear demonstrated an increase in resting (range: 39–49%), pool use (range: 15–22%), and stereotypy (range: 0–0.3%), and decreases in locomotion (range: 14–26%) and investigate/forage (range: 10–25%; Figure 6, Table 2). Similar to the male grizzly, her investigate/forage (range: 11–26%) behavior peaked in winter and then declined. She spent the majority of her time in active behaviors and stereotypy was extremely rare (Table 3). Like the male grizzly, resting and pool use were her most variable behaviors.

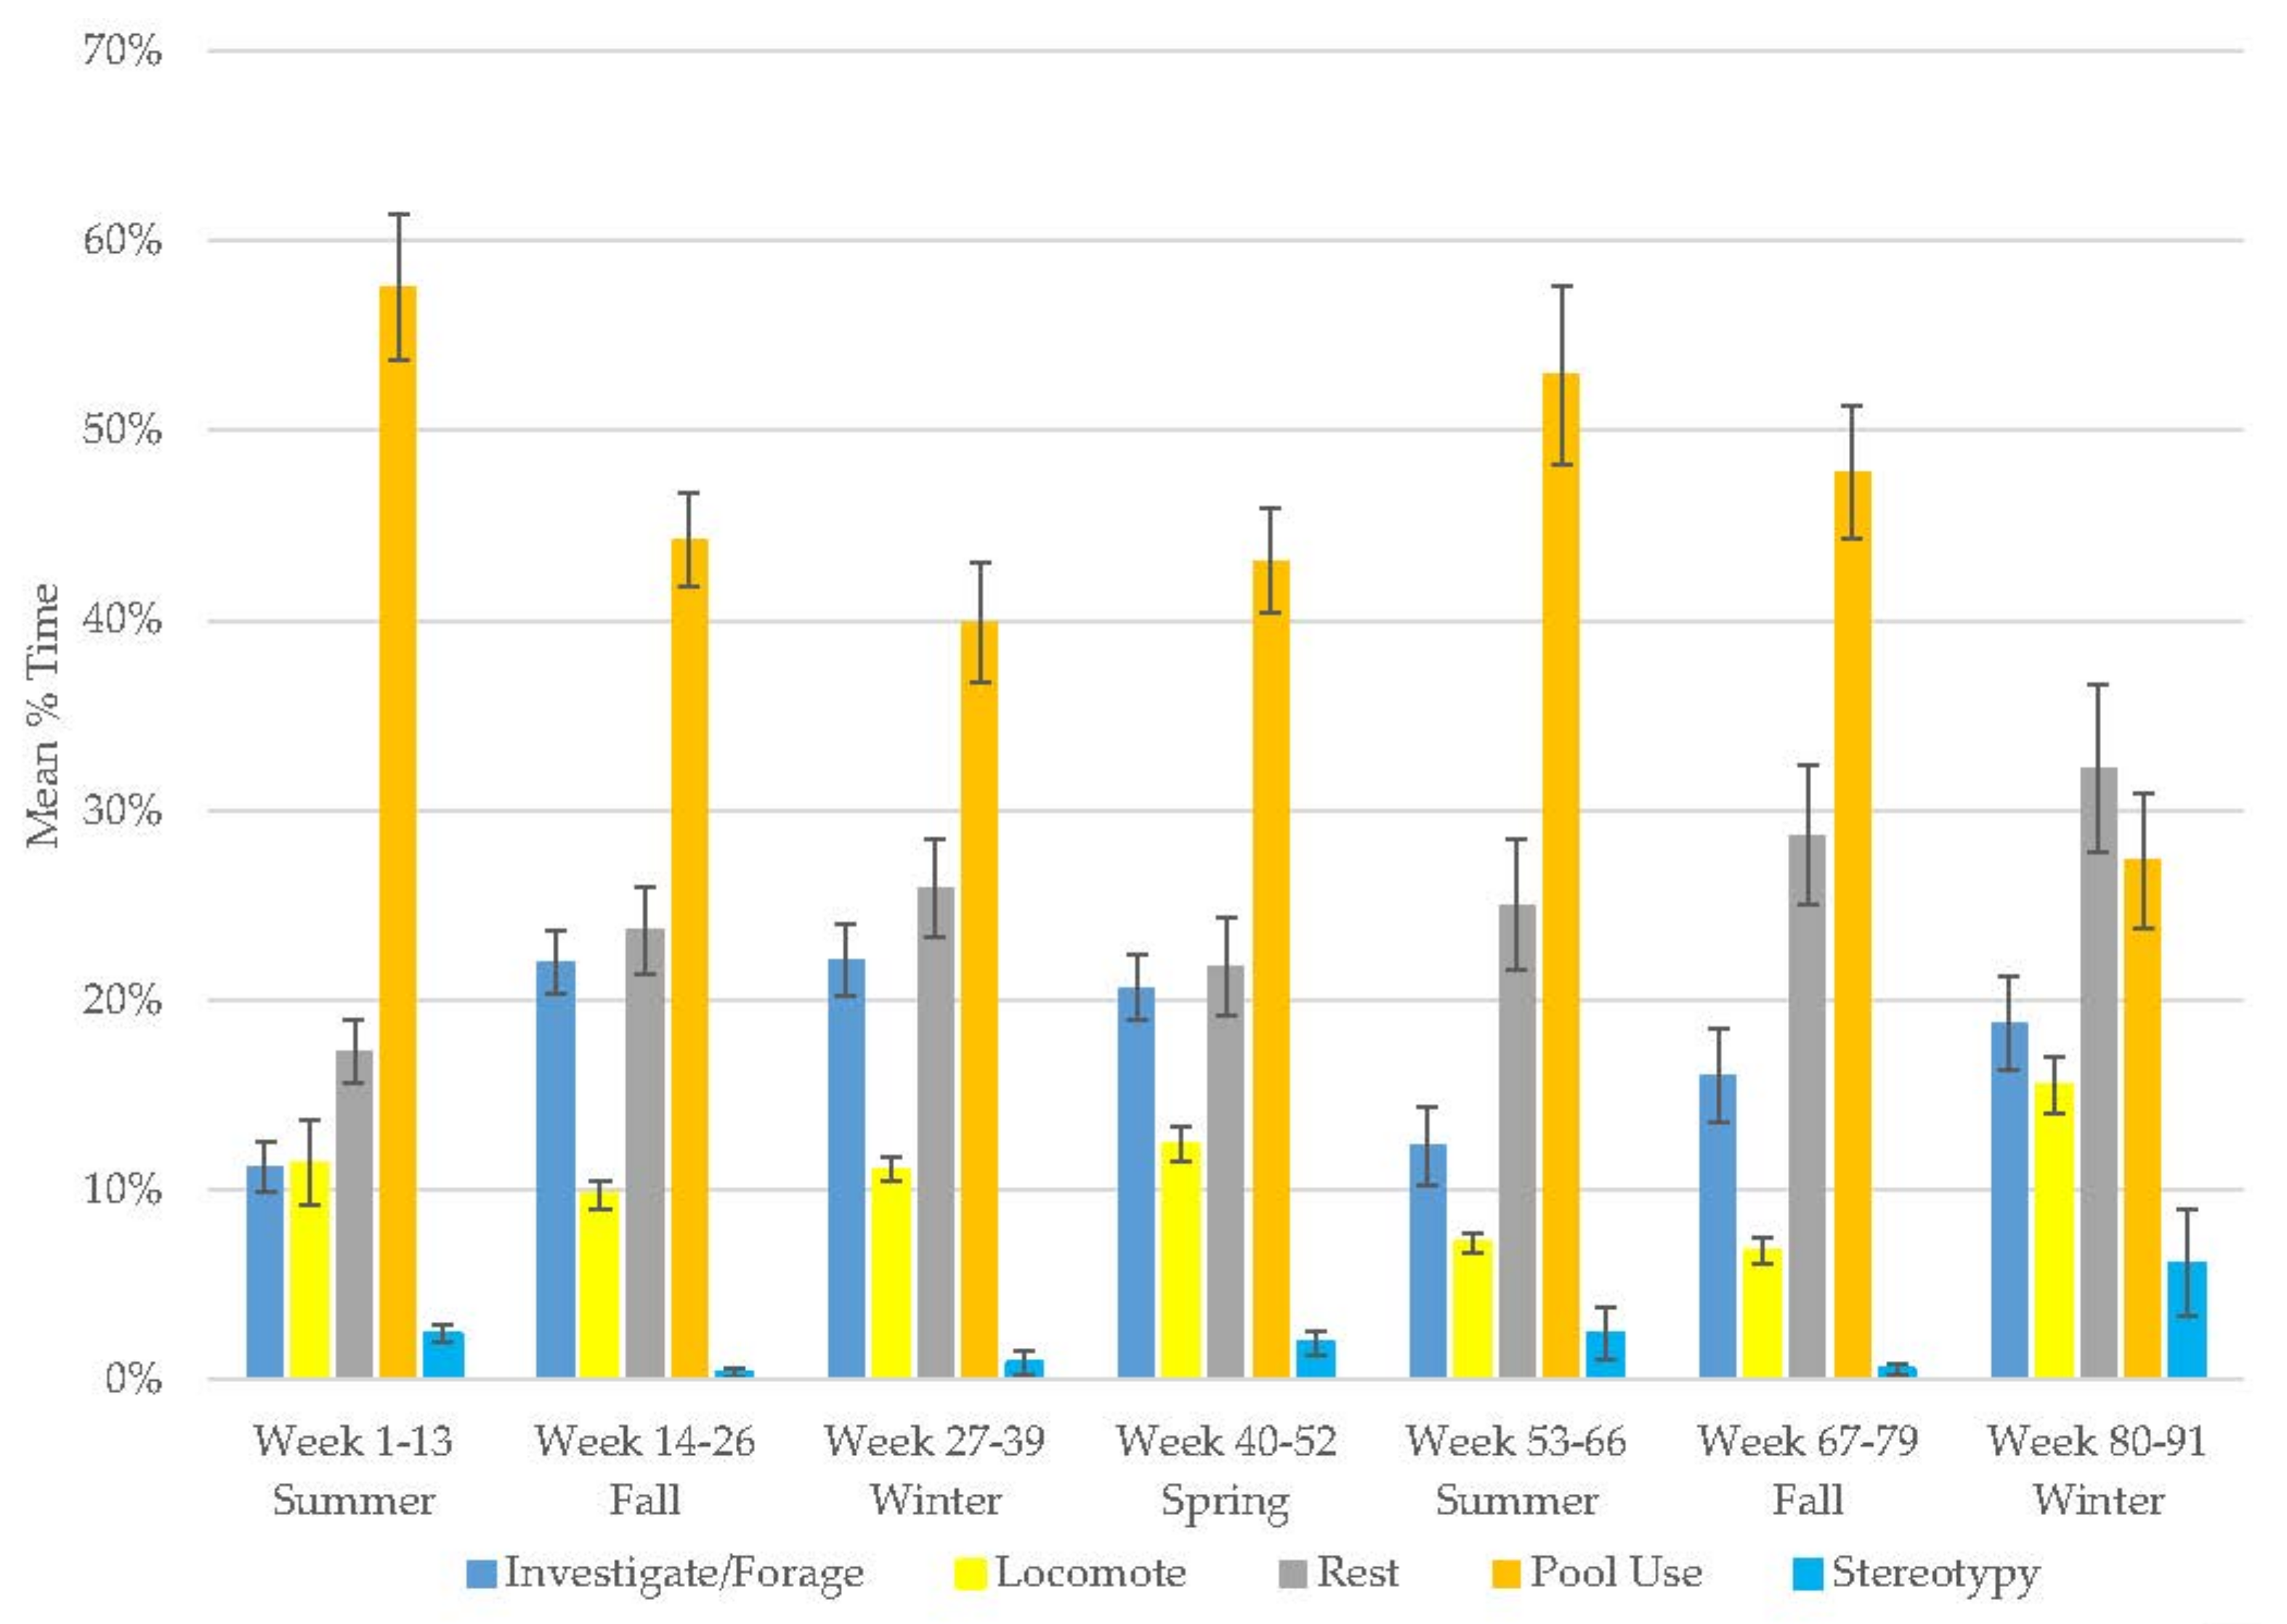
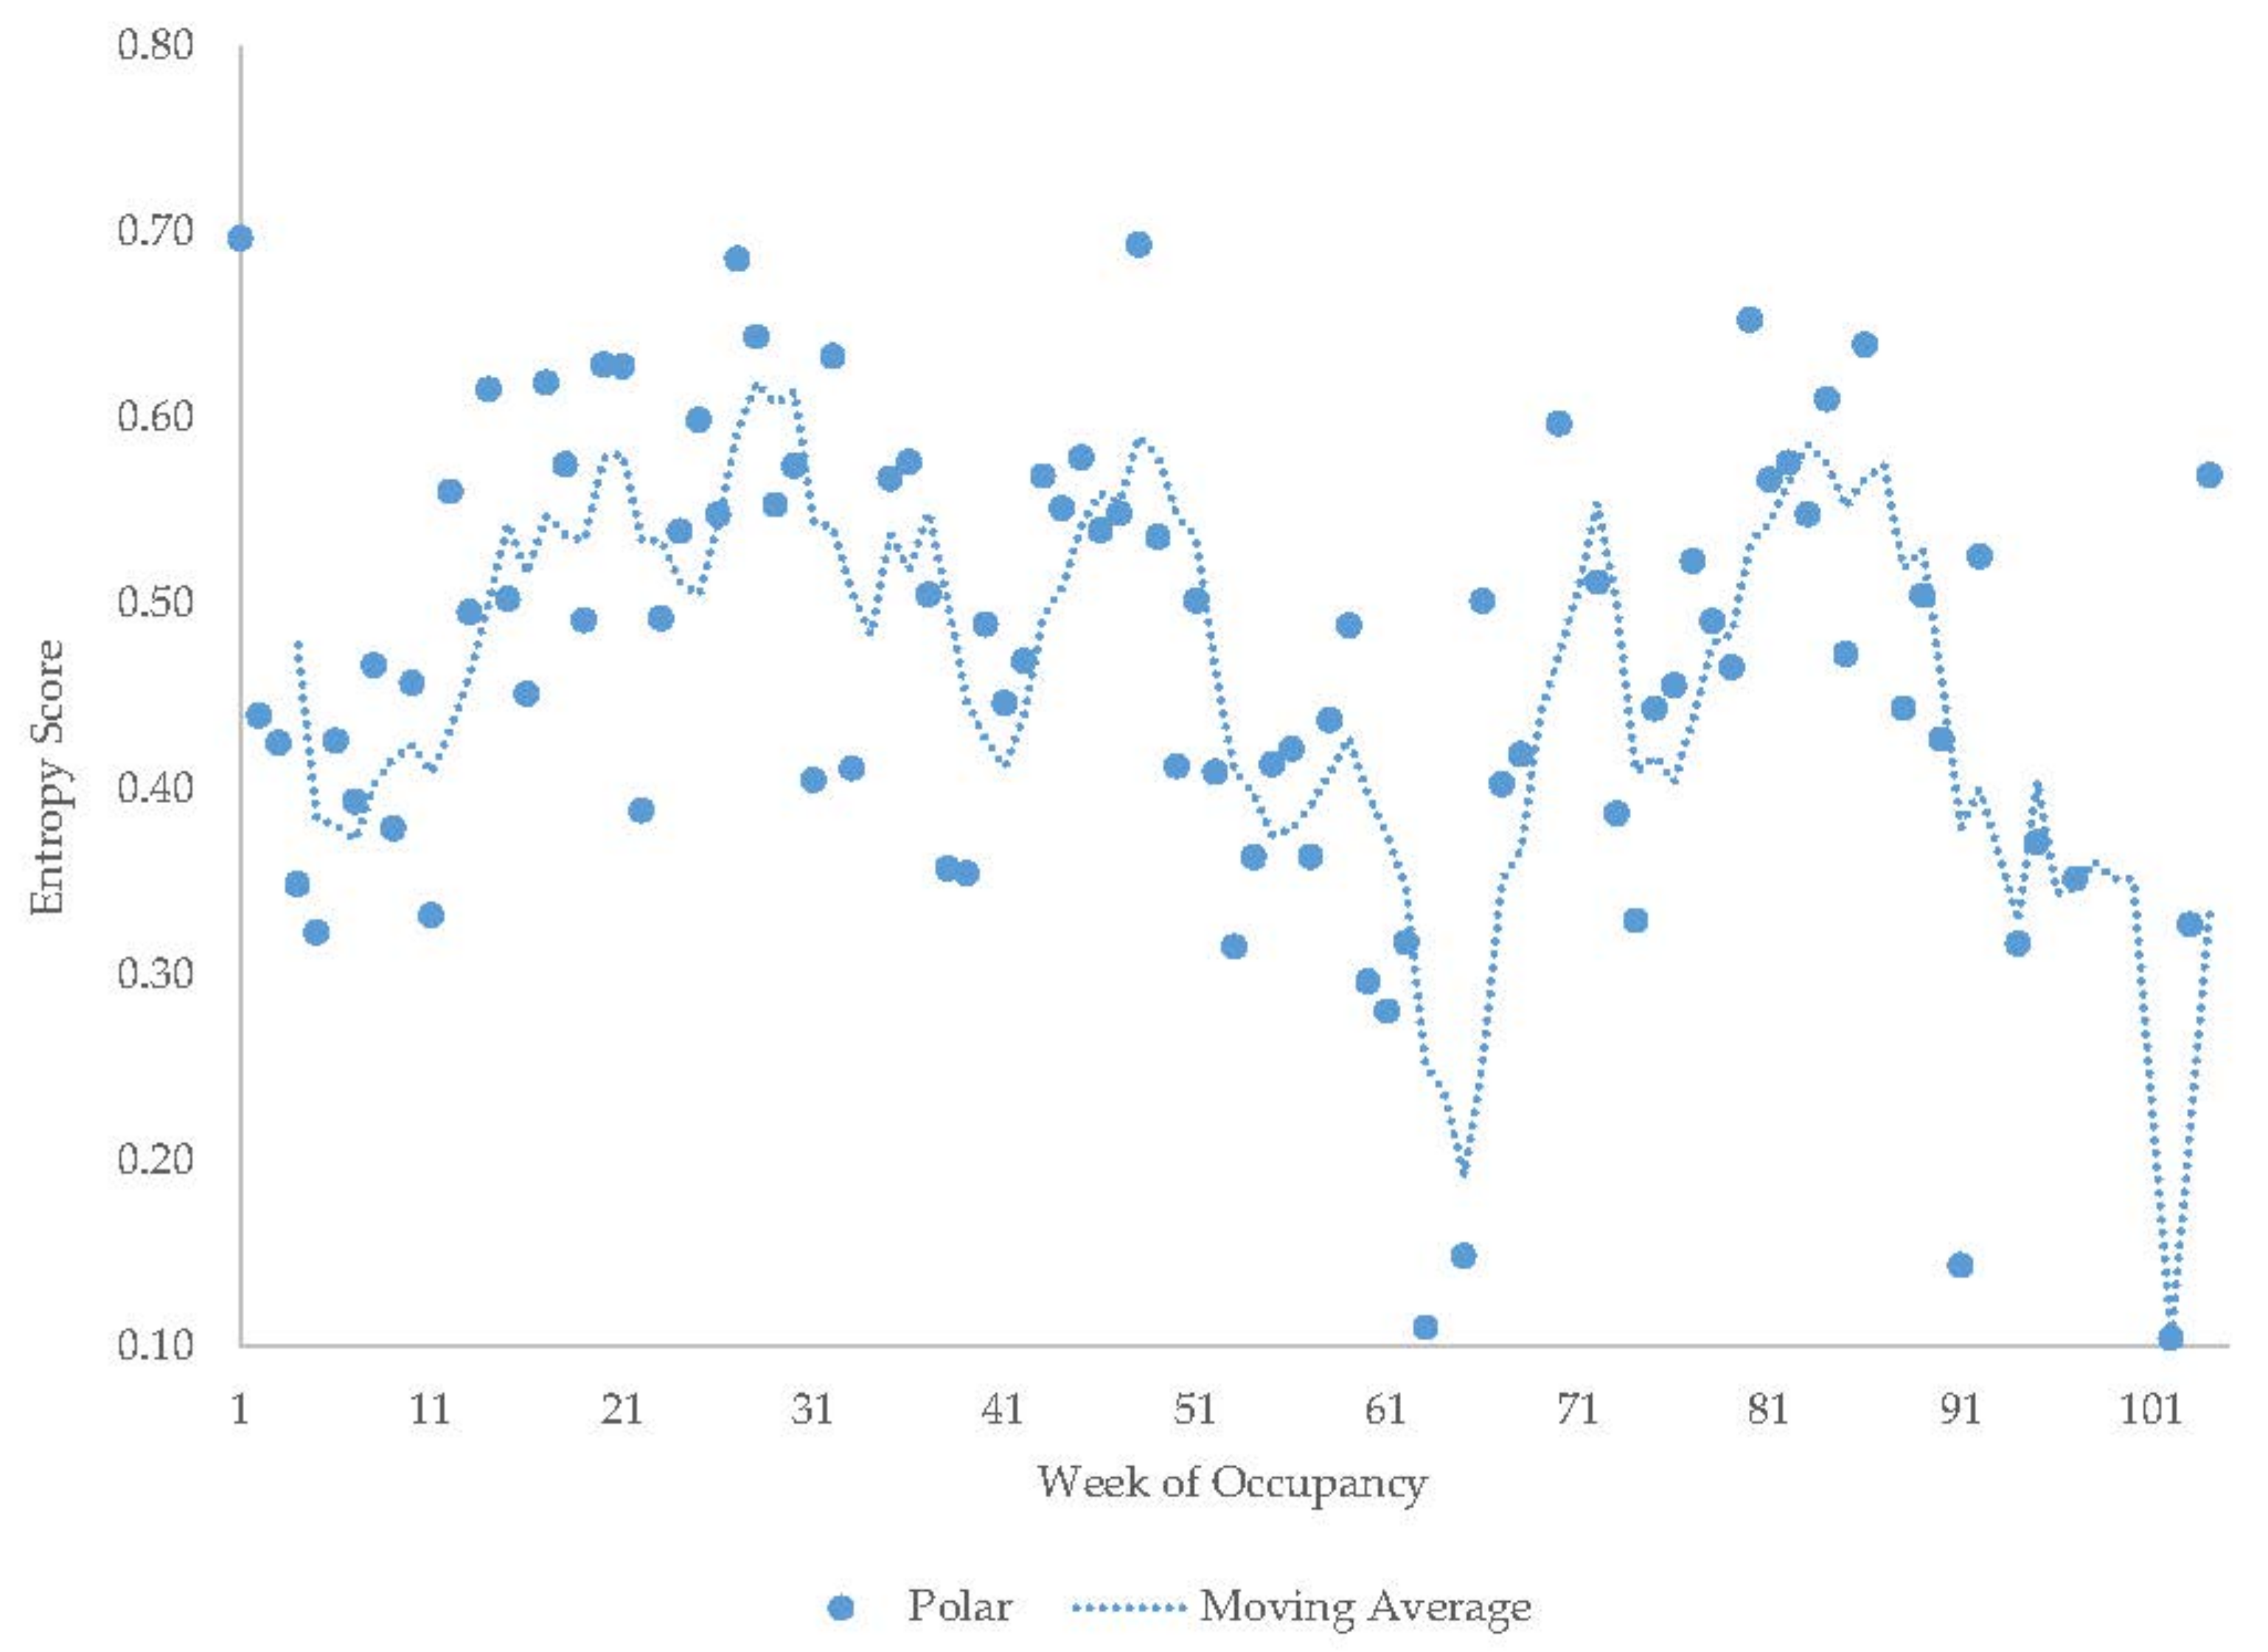
3.6. Male Polar Bear

The polar bear demonstrated increases in resting (range: 17–32%), investigate/forage (range: 11–22%), and stereotypy (range: 0.3–6%) and a decrease in locomotion (range: 7–15%) and pool use (Figure 7, Table 2). Pool use occupied most of the polar bear’s time, followed by resting (Table 3). Stereotypy was rare. Resting and pool use were his most variable behaviors.

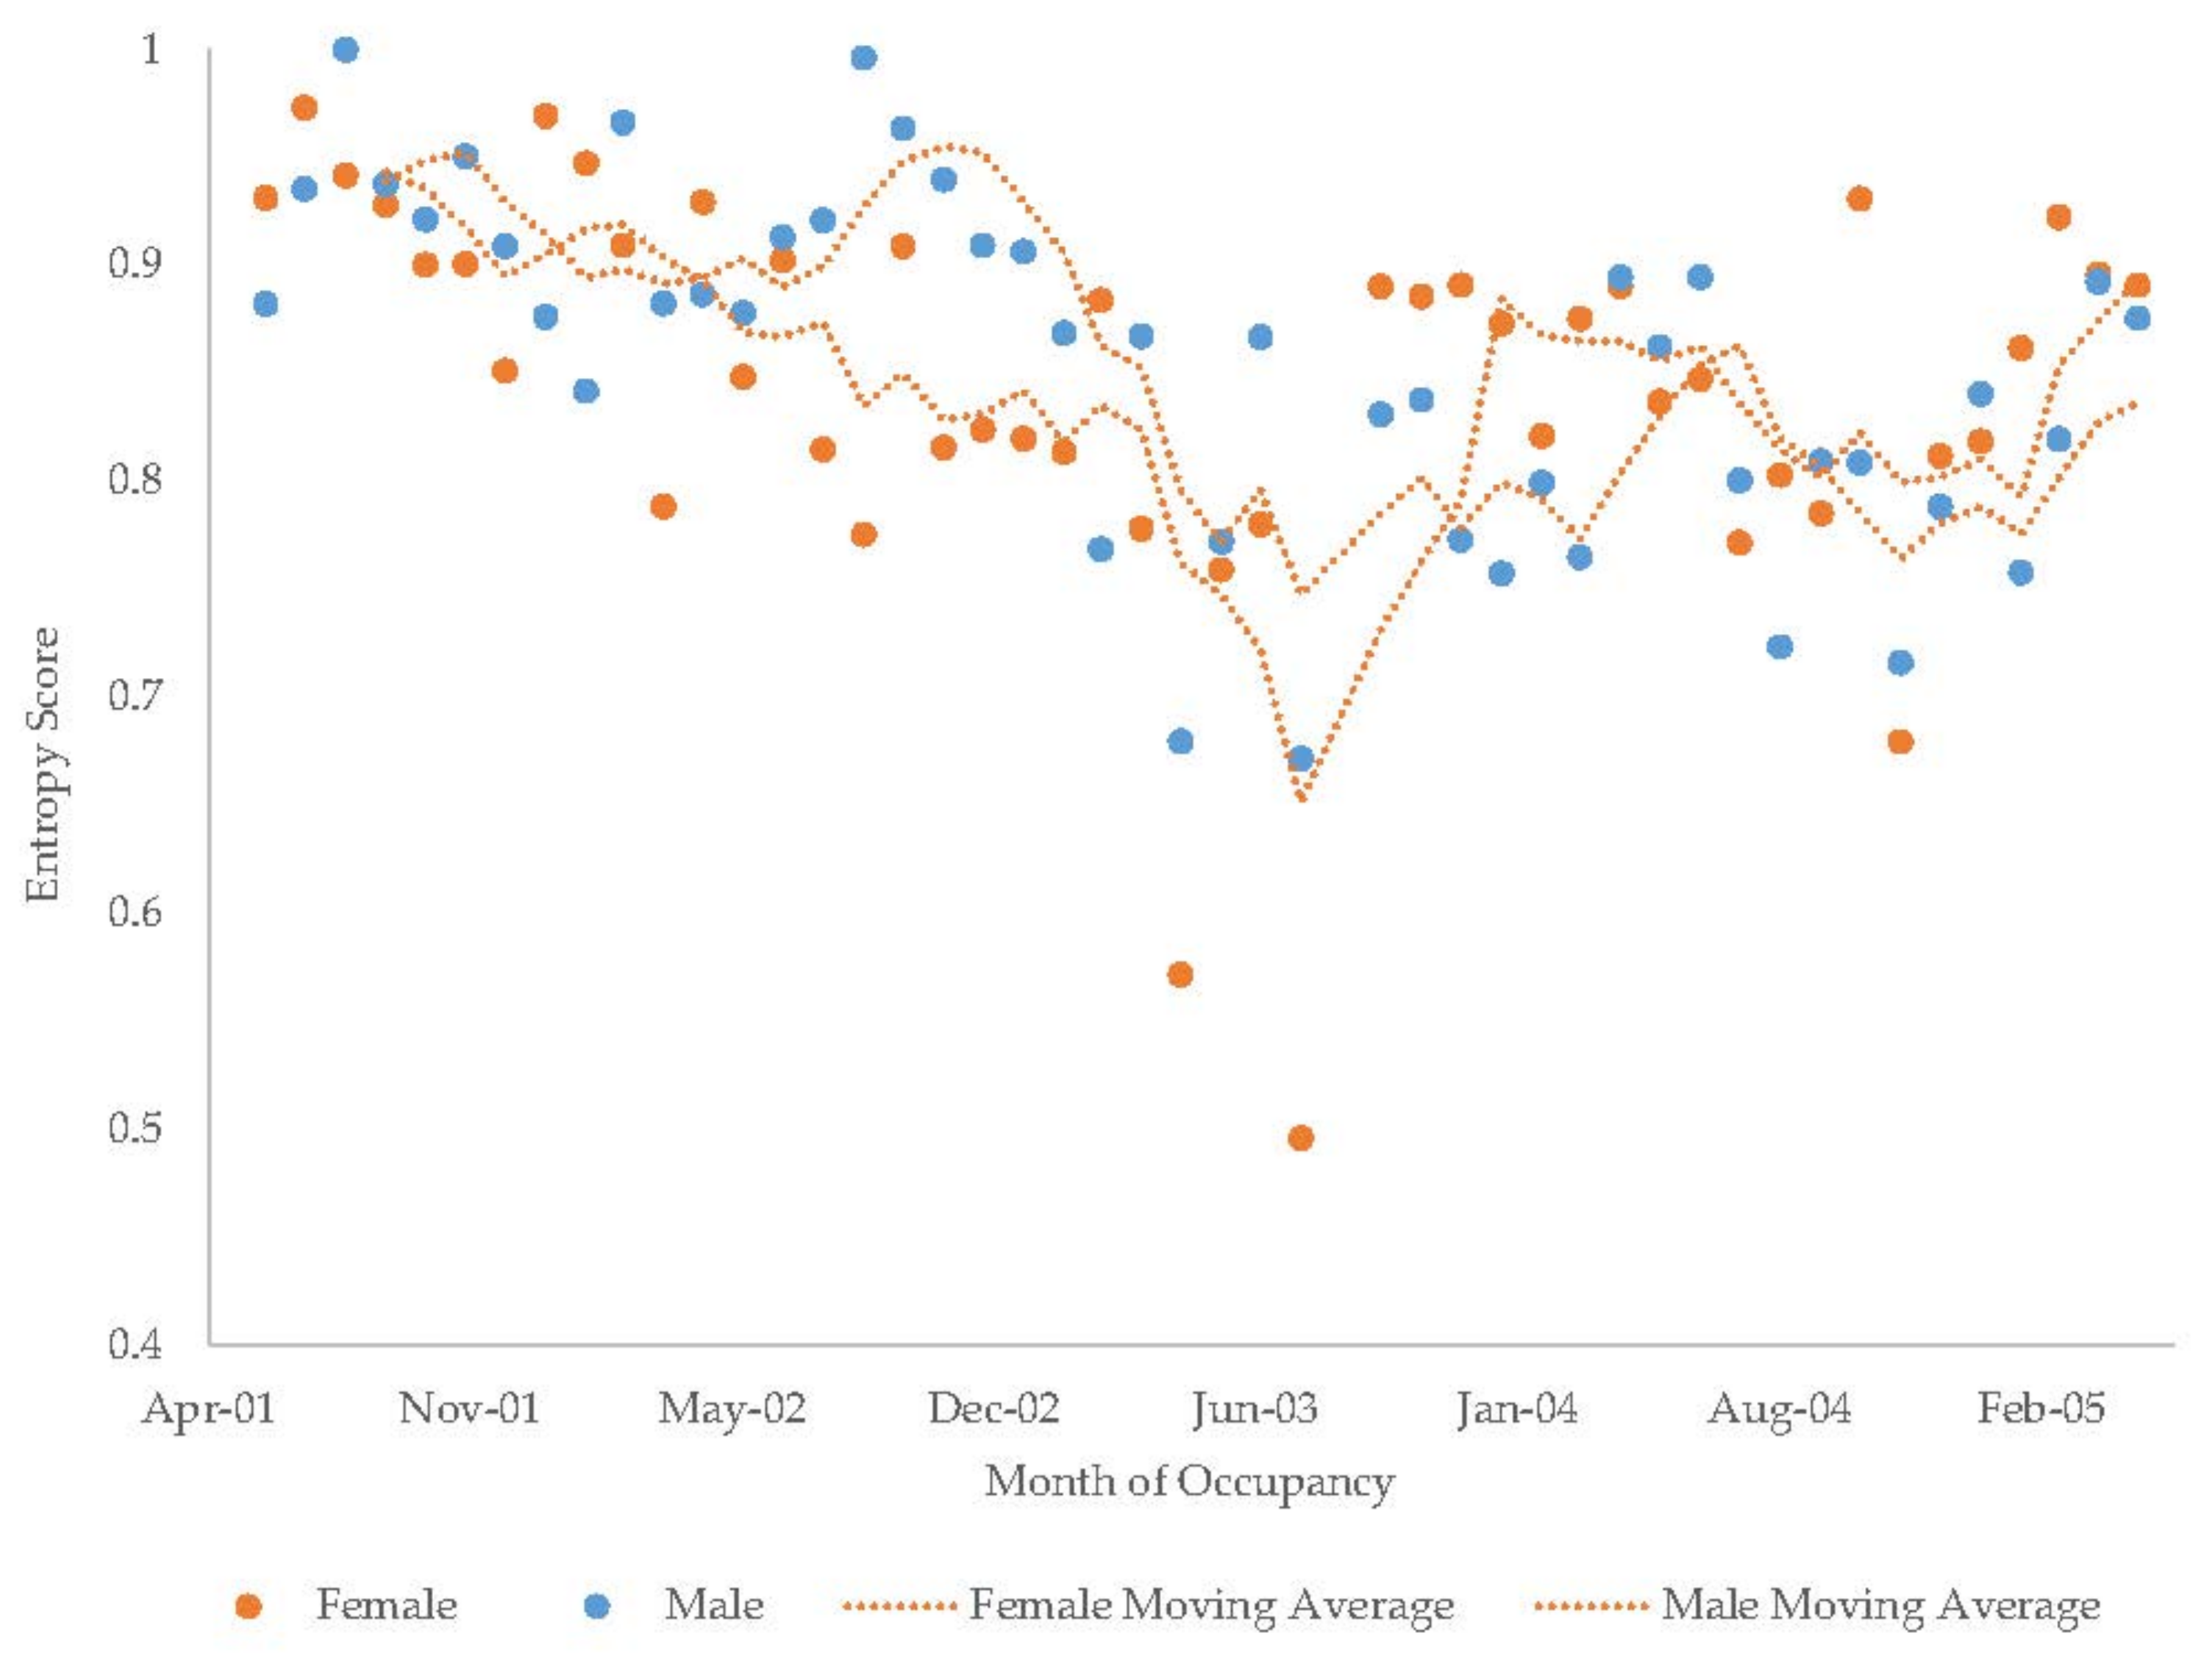
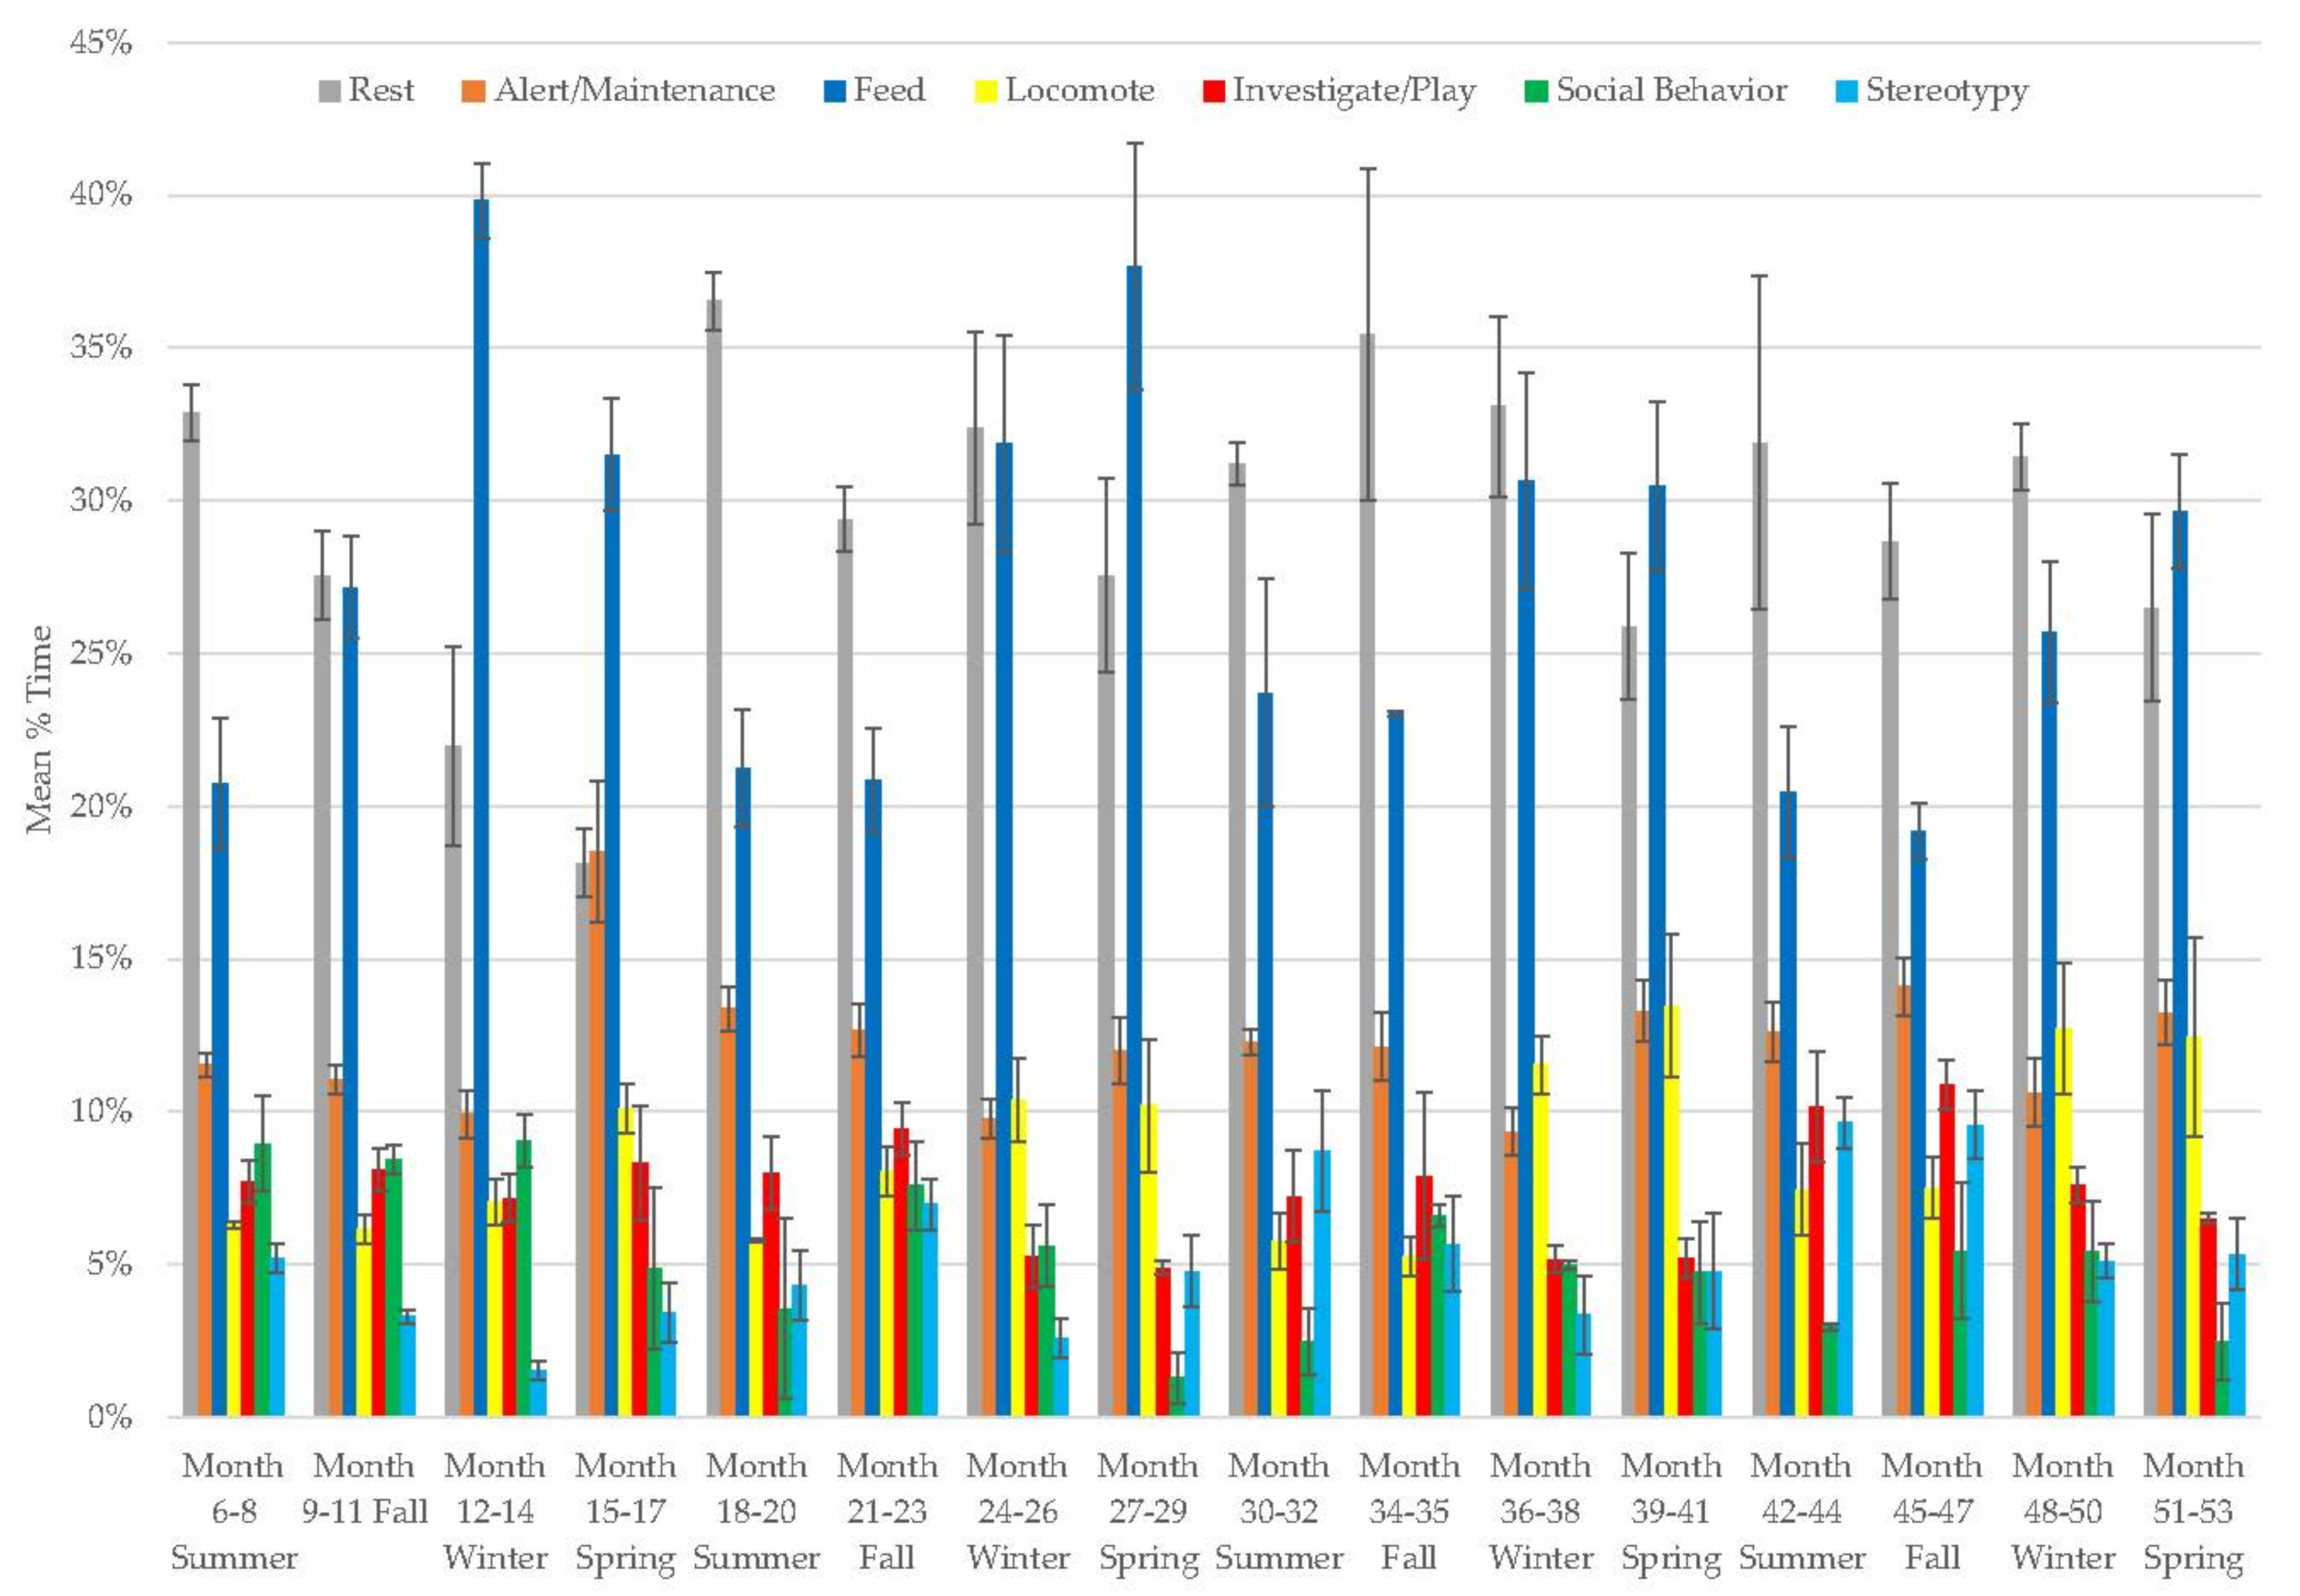
3.7. Male Giant Panda

In the male panda, rest (range: 18–37%), alert and maintenance behavior (9–19%), locomotion (range: 5–14%), and stereotypy (range: 2–10%) each increased over time, while feeding (range: 19–40%), investigation and play (range: 5–11%), and social behavior decreased (range: 1–9%; Figure 8, Table 2). Locomotion and feeding followed a seasonal pattern of being higher in winter and spring. Resting and feeding behaviors were the most variable behaviors in his activity budget (Table 3).

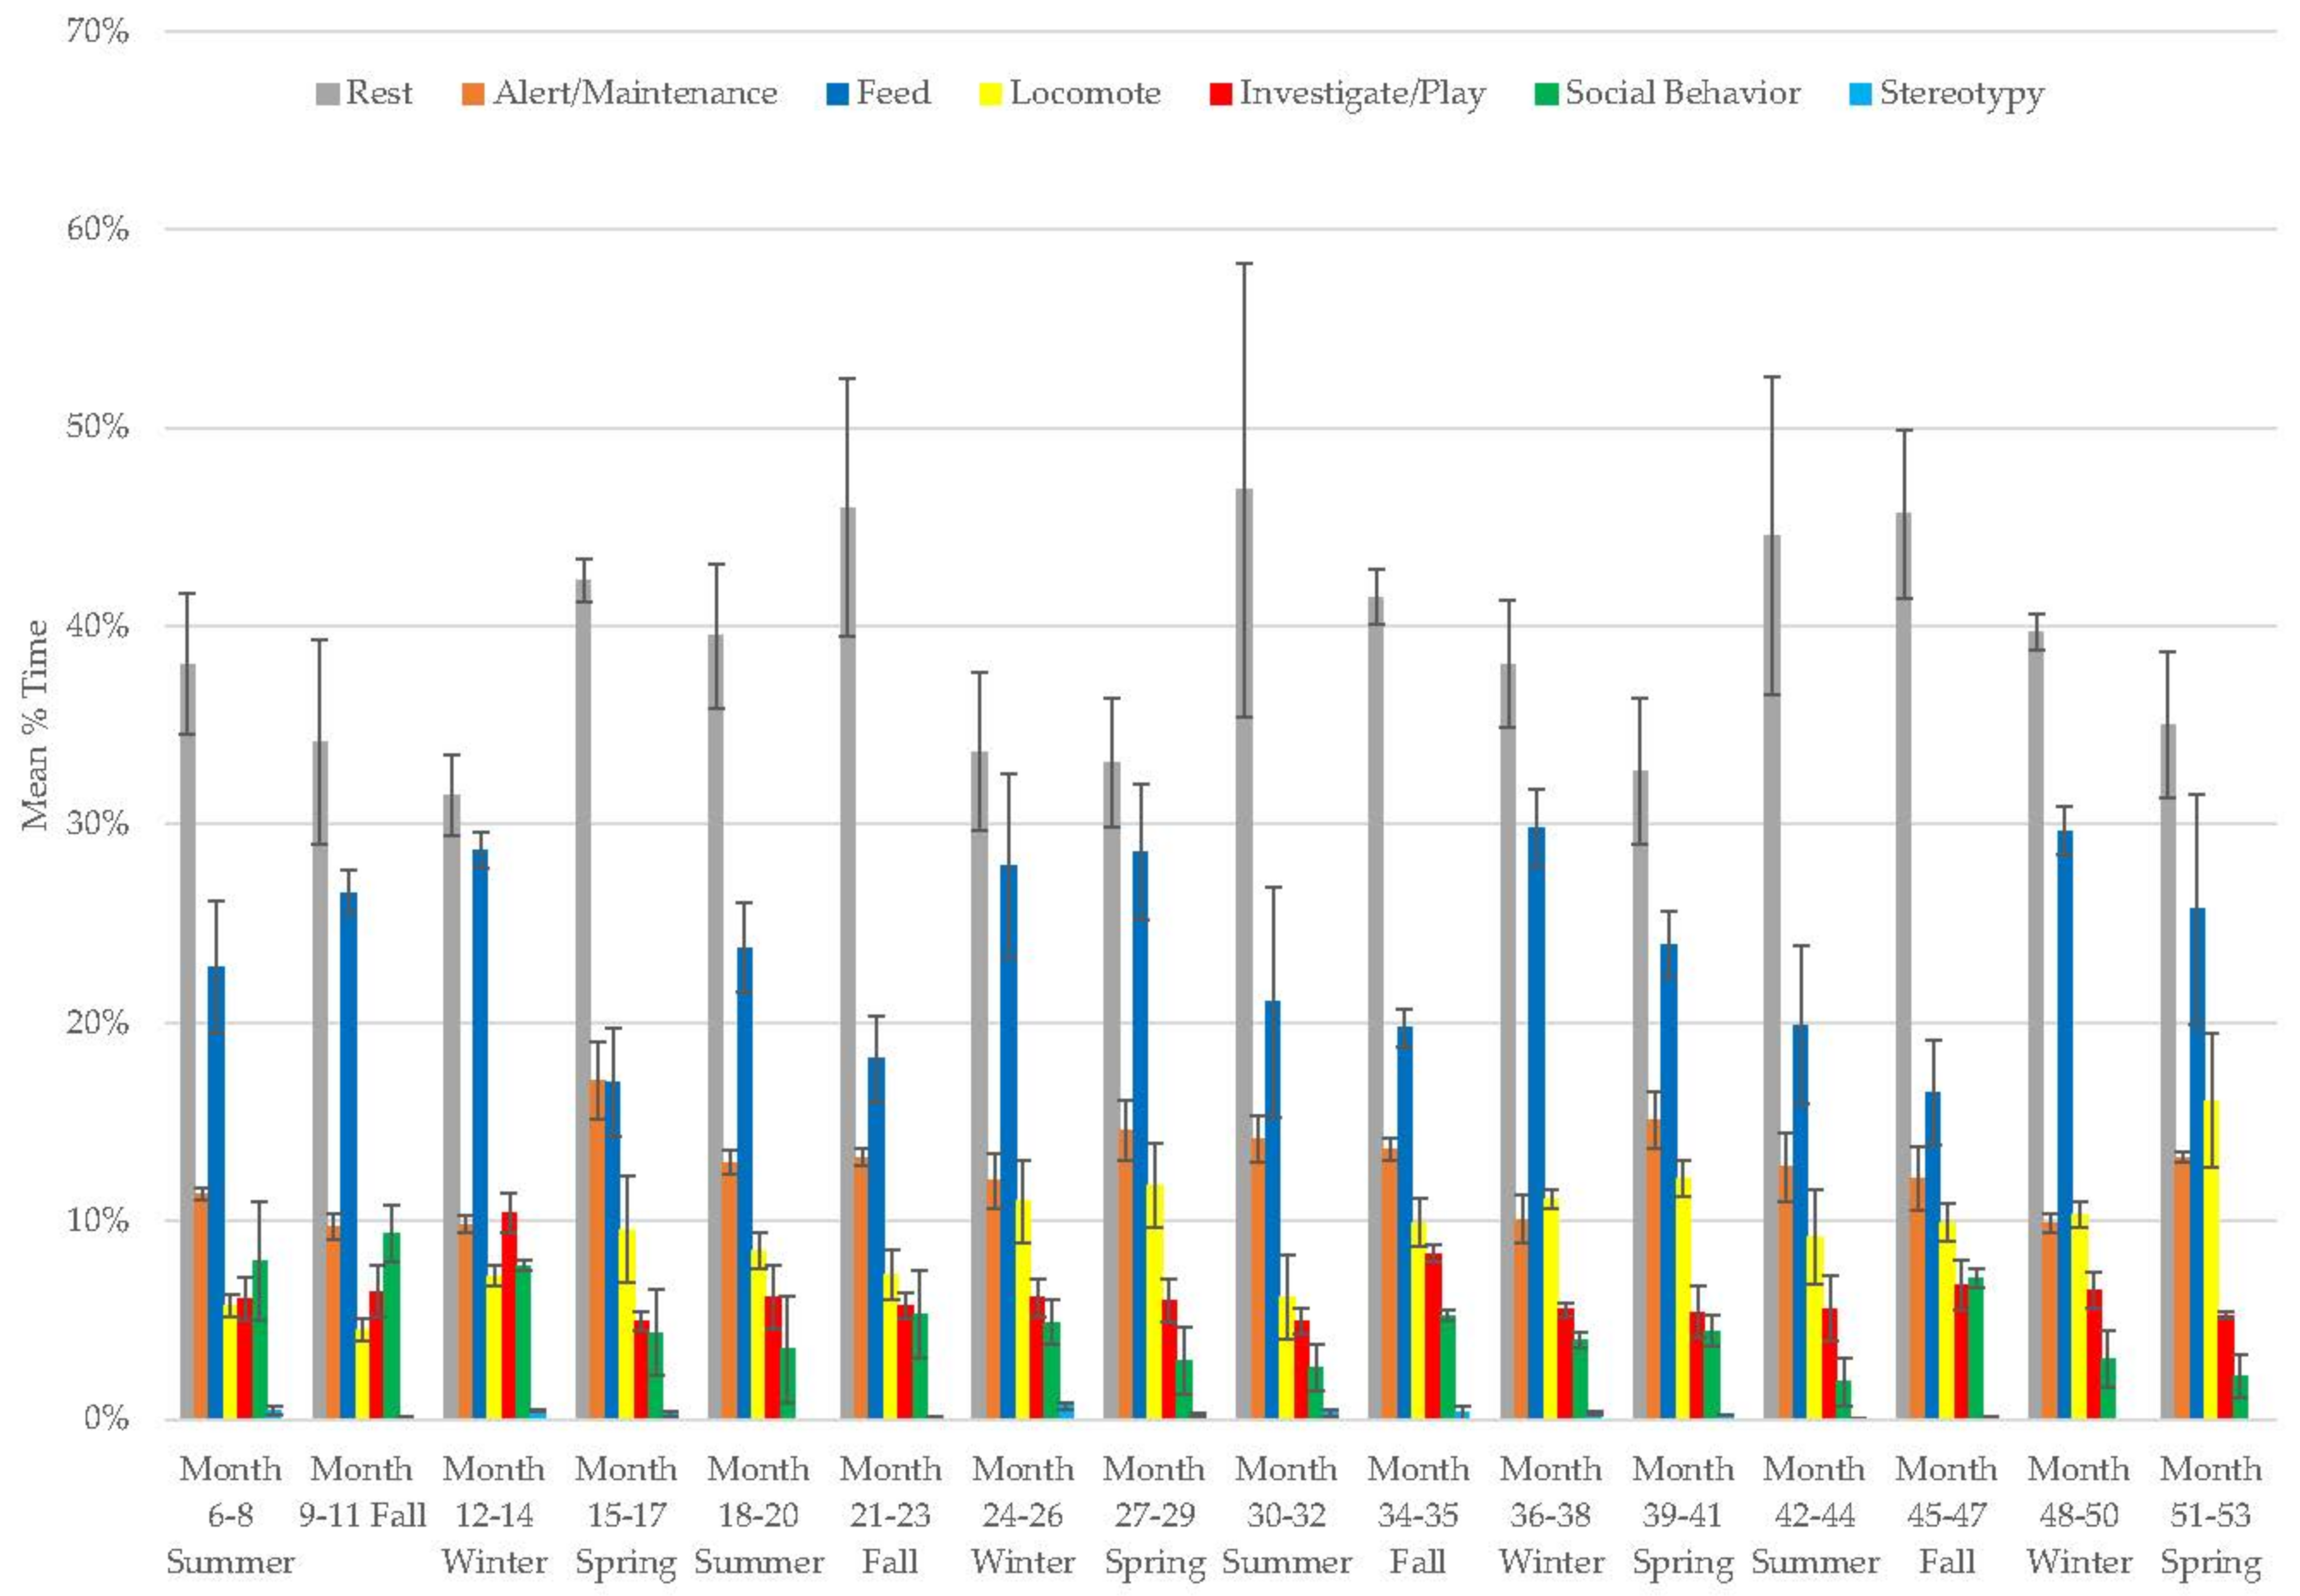
3.8. Female Giant Panda

For the female, resting (range: 31–47%), locomotion (range: 5–16%), alert and maintenance behaviors (10–17%), and feeding (range: 17–30%) increased, while investigation and play (range: 5–10%), social behavior (range: 2–9%), and stereotypy (range: 0–0.7%) decreased over time (Figure 9, Table 2). Resting and feeding (Table 3) were her most variable behaviors. Resting tended to peak in summer, whereas feeding peaked in winter.

3.9. All Bears

Looking across the Saint Louis Zoo bears, resting usually increased over time (five of seven bears) as did investigate/forage (five of seven bears). Locomotion and pool use usually decreased over time (five of seven bears). There was a tendency for stereotypy to increase over time (four of seven bears). There appeared to be no age-related propensity for behaviors to increase or decrease within each behavior (Table 2). The exceptions were that all three older bears (two Andean and one sun bear) showed increases in investigate/forage and decreases in pool use over time. Resting was the behavior that varied most among the Saint Louis bears (Table 3).
When the giant pandas are considered with the other bears where behavioral categories overlapped conceptually, resting usually increased over time (seven of nine bears). Locomotion decreased in two thirds of the bears (six of nine), whereas investigation-related behaviors (five of nine bears) increased in a little more than half of the bears. Stereotypy increased in a little more than half of the bears (five of nine). As was the case when considering the Saint Louis bears only, there appear to be no consistent age-related propensities for behavior to change in a given direction over time, although most bears increased resting over time as they were increasing in age. Resting continued to be the behavior that varied most for most of the bears studied (Table 3). The majority (63%) of these behavior changes over time were very small in magnitude (0–0.07% change per week or month); the other changes were larger (0.11–0.41% change per week or month) but still rather small.
Seasonal changes in behavior were evident in all bears (Table 4). Among the Saint Louis bears, the grizzly and polar bear activity budgets fluctuated the most across seasons, but the other two species (Andean and sun bears) were only observed in two seasons. The male giant panda demonstrated more seasonal fluctuation than the female. The giant panda activity budgets fluctuated less than the grizzly and polar bears but more than the Andean and sun bears. Among the Saint Louis behaviors, resting (mean season-to-season fluctuation: 8%), and pool use (mean season-to-season fluctuation: 7%) showed the most seasonal fluctuation. Locomotion (mean season-to-season fluctuation: 6%), investigation/foraging (mean season-to-season fluctuation: 6%), and stereotypy (mean season-to-season fluctuation: 1%) showed less variation. These percentages equate to 5–35 minutes’ change in the daily average duration of these behaviors across seasons. In the giant pandas, feeding (mean season-to-season fluctuation: 5%) and resting behavior (mean season-to-season fluctuation: 4%) fluctuated the most. Locomotion and alert/maintenance behavior fluctuated at intermediate levels (mean season-to-season fluctuation: 3%), while stereotypy, investigation and play, and social behavior fluctuated the least (mean season-to-season fluctuation: 1%). These percentages equate to 4 to 20 minutes’ change in the daily average duration of these behaviors across seasons.

3.10. Assessing Activity Budget Variation over Time

When we summed the variability values for each behavior to create one value for the entire activity budget for each week or month, those data were more amenable to parametric analyses. Simple linear regression analyses were not significant for any of the Andean bears, the giant pandas, the female grizzly bear, or the sun bear. We could not establish normality through the transformation for the male grizzly’s data. The polar bear had a significant regression after its data were square root-transformed (F1,82 = 11.68, p < 0.001, y = 4.879 + 0.0206 × week, R2 = 12.5%). Thus, for eight of the nine bears, the total variation in the activity budget remained the same over time and increased in one bear.
Across the Saint Louis bears, there was an average of 37.5% variance in the activity budget from week to week. Thus, about two-thirds of their time was predictably allocated to an array of behaviors in our ethogram, while about a third of their time was differentially allocated to behaviors. For the giant pandas, the average month-to-month variation was 22.5%, meaning that a little more than three quarters of their time was predictably allocated to behaviors in the ethogram and approximately one quarter of their time was differentially allocated to behaviors in the ethogram. Across the bears, activity budget variability averaged 34% of the time, meaning that, generally, 66% of the activity budget remains more or less fixed, while 34% fluctuates.
The averages in Figure 10 represent the typical percent of the day that is variable in terms of what behavior occupies that time. For example, in the female Andean bear, there is approximately a 20% per day fluctuation in how she spends her time. Table 5 below converts these figures to average number of hours in a hypothetical 7-h exhibit day that could be variable in terms of what behaviors she was performing. For the female Andean bear, about 5.6 h of her day are devoted to a more-or-less fixed set of behaviors, leaving 1.4 h to vary.

3.11. Habitat Use over Time

Amongst the Saint Louis Zoo bears, the average entropy values were highest for the female and male grizzly bears (0.605 and 0.597, respectively; Table 6) and lowest for the older Andean male and female in 2014 (0.292 and 0.314, respectively). In 2014, the Andean bear habitat contained only four zones, but the older Andean male and female bears still had the lowest average entropy values in 2015 (0.378 and 0.351, respectively) when the number of zones in their habitat (six) was the same as the number of zones in the grizzly habitat. Among the remaining bears, the average entropies descended in order from the young Andean male in 2019 (0.512), to the older male sun bear (0.476 in 2015, 0.459 in 2014), and finally to the polar bear (0.467).
Positive slopes, suggesting increasing evenness of habitat use, were found for only the older sun bear male in 2014 (0.005), the older Andean female in 2015 (0.003), and the older Andean male in 2015 (0.001 × 10⁻¹) (Table 6). All the other slopes were negative, ranging from the polar bear (−0.001) to the female Andean bear in 2014 (−0.009).
The older Andean bears’ entropy scores fluctuated widely within each period they were observed (Figure 11). The young male Andean bear demonstrated more fluctuation in entropy in the first period of data collection compared to the second period (Figure 12) and showed higher entropy in summer than fall. The male sun bear’s entropy scores fluctuated widely within each period he was observed (Figure 13) and there was not much seasonal differentiation in his entropy scores. In the grizzly bears (Figure 14), entropy remained high and generally consistent over time with little seasonal differentiation. The female’s entropy scores fluctuated more than those of the male. The entropy fluctuated widely in the male polar bear during the two years he was observed (Figure 15). Periods of low entropy tended to occur in summer.
The giant pandas’ average entropy values were the highest of the species studied (Table 6). The male giant panda’s monthly entropy index showed a statistically significant but small decrease over time (Index = 0.951 − 0.003x, r2 = 0.336, F1,45 = 22.74). The female giant panda’s entropy values could not be transformed to meet the assumption of normality but her values were also characterized by a small negative slope. Entropy remained high throughout the observation period with little seasonal differentiation (Figure 16).

4. Discussion

4.1. Changes in Behavior over Time

Ideally, resting behavior remains constant or decreases over time with the caveat that decreased resting due to increased stereotypy is not a positive direction to move towards regarding welfare. It is also true that increasing resting could be a sign of advanced age [20,21,22], which is unavoidable, but it could also indicate decreased interest in the environment (“boredom”; [23,24]). Some consistent level of resting is probably necessary for normal physiological and cognitive functions [25], and sleep deprivation can lead to serious problems, including death [26]. In these case studies, we found that most bears demonstrated increases in resting behavior over time. While older bears (the older Andean bears and the sun bear) devoted the largest portions of their time to resting, whether resting decreased or increased over time was not reliably predicted by age; the older Andean bear actually decreased resting behavior over time. While all the bears aged during the study, and thus might be expected to rest more over time, several of the bears were still young during the observations. It is possible that normal developmental decreases in play behavior [27,28,29] and the energetic demands of growth contributed to an increase in the resting behavior over time. However, these younger bears averaged less than 50% of their time resting, so it seems unlikely that they became bored [23,24] or were not stimulated by their environments.
We suggest that increasing levels of locomotion are positive for welfare because it provides exercise and could indirectly reflect choice-making and agency by the animals (e.g., choosing to move towards or away from elements of the environment). Locomotion that is consistent and higher would reflect better welfare than locomotion that is consistent and lower. Locomotion decreased in most of the bears over time and ranged from 9 to 20% of the time in all the bears except for the sun bear, whose locomotion likely was partly composed of stereotypy. This still represents anywhere from 38 to 84 min spent only in travel (i.e., not walking around sniffing the substrate) around the habitats in a seven-hour exhibit day. To us, this period still seems like a significant amount of time. Locomotion and certain kinds of exploration (e.g., traveling around sniffing substrates) are similar behaviors with likely similar caloric expenditure but different motivations. Because the bears in these case studies also devoted significant periods of time to investigatory behaviors, we assert that they were still physically active. Additional efforts could focus on increasing physical activity through the dispersed placement of food items, scent or object enrichments, or high-interest exhibit features in the habitats.
Although the absolute welfare impact on the performance of stereotypy is still not clear in many cases [30,31], stereotypies have generally been assumed to be signs of past or current suboptimal environments. It is thought that these behaviors may surface when the levels of stimulation are low or behavioral drive is somehow thwarted [30]. Thus, we suggest that decreasing levels of stereotypy are positive, and lower levels are better evidence of good welfare than higher levels. Increasing and/or higher levels of stereotypy reflect ongoing compromises in welfare and direct time away from other more positively valenced behaviors. There were mixed results on whether stereotypy increased over time (five of nine bears), but, given that the actual amounts of stereotypy in these animals were very low (averaging 5% or less of their time), it seems reasonable to conclude that these habitats and associated animal care practices did not lead to dramatic increases in stereotypy and were associated with decreases in several cases. There also appeared to be no age difference in the tendency to decrease stereotypy. As mentioned above, the male sun bear was likely devoting significant time to stereotypy, but this behavior was not recorded systematically in the first year of observations (2014). The bear often paced on harder, flat surfaces in 2014, and much effort was put into enrichment and adding additional planting and softer surfaces in the exhibit in year 2. This male was imported from a sanctuary in Asia in 2000 where most of the bears had been confiscated or surrendered as former pets. It is likely that this animal had a traumatic early history that led to his stereotypic behavior [30], and records from the zoo he first arrived at in the United States indicated he had already developed an oral stereotypy. Even though he came to Saint Louis that same year and should have acclimated to the zoo, the transition to a new habitat at the zoo in 2014 was possibly stressful initially and triggered the stereotypic pacing that was recorded as locomotion.
Differences in the ethograms and categories of analysis between the Saint Louis and National Zoo studies warrant discussing other behavioral changes separately. We suggest that increases in investigation and foraging are positive for welfare and that consistent levels of these behaviors are at least neutral in terms of welfare. Panksepp [15] describes the ‘seeking’ system as one of the seven basic emotional affect circuits of the mammalian brain and summarizes literature arguing that this brain center ‘wants’ to learn and wants opportunities to explore the world to gain information about resources critical to survival. Foraging behavior is a type of seeking or investigatory behavior, but the consumption of food obviously has purposes critical for survival beyond simply acquiring information. Consistent but low levels of investigation and foraging are probably not optimal for welfare, whereas consistent but high levels are, although there are limits to how much feeding behavior is actually possible or desirable.
In the Saint Louis bears, investigation and foraging behaviors as a category were less common in the older bears, but these behaviors increased over time in all the bears except for the grizzly bears. It is not clear why it did not increase in the grizzlies but could be related to seasonal differences in observation periods among the bears. Most other bears at Saint Louis were only observed in the summer through fall periods, whereas the grizzlies were observed fall through the following summer. This differing order of observations and associated differences in plant growing seasons, for example, could have influenced the grizzlies’ trend. The polar bear was observed continuously throughout two years but did not show a decrease in investigation and foraging behaviors. The grizzlies were perhaps also more affected by seasonal tendencies to hibernate compared to most other bears. Despite the decrease over time, the grizzlies still averaged 17–18% of their time (71–75 min/exhibit day) in investigation and foraging behaviors, which was second only to the young Andean bear. The giant pandas spent more time feeding than any other bear, except for the younger Andean bear whose feeding and investigation behaviors were considered a single category in our analyses. The feeding behavior decreased over time in the male panda, whereas it increased in the female, but on average occupied 101–113 min of their time during the exhibit day. The giant panda’s strictly herbivorous diet, coupled with a lack of digestive efficiency and high gut passage rate [32], requires they spend significant time each day processing and consuming large quantities of bamboo.
At the Saint Louis Zoo, we recorded the use of the pool as a behavior. The animals’ use of pools is less easy to assign valence because, while using the pool reflects the animals’ interest in accessing a different sensory experience (the sensation of water, cooling or warming depending on the pool) and exerting agency is presumably positive, not using the pool does not necessarily mean reduced welfare. Some species and individuals simply do not typically immerse themselves in water. Moreover, the use of a pool to cool down or to obtain an enrichment object may not occupy a large amount of time. Thus, we would argue that consistent, increasing, and generally more use of pools is more positive for welfare as the animal is exposed to different sensory stimulation and reflects choice-making. Decreases in pool use or low levels are not necessarily an indicator of reduced welfare unless those decreases are associated with increases in stereotypy.
Pool use decreased over time in just over half (four of seven) of the Saint Louis bears, and this reduction occurred in all the older bears and the polar bear. Pool use was comparatively rare in all the older bears as well as the young Andean bear. Perhaps, dietary differences between these species and the northern hemisphere bears are related to differences in the use of water features. Grizzly bears and polar bears regularly enter water to hunt, whereas sun and Andean bears include few items in their diets obtained from water sources [7]. It is also possible that the keepers provided more enrichment in the water sources for the grizzly and polar bears given their natural history, but these objects are generally able to be moved out of the water by the bears if they so choose. The northern hemisphere bears spent large amounts of time in the pools, averaging 71–185 min during the exhibit day.
Play itself is associated with positive emotions and pleasure [33,34,35], although its appearance does not necessarily mean the animal’s overall welfare state is positive [34,36]. Thus, play behavior should remain consistent or increase for positive welfare. In the giant pandas, the categories of social behavior (which included social play) and investigation and solitary play decreased over time. Given their solitary nature as adults [37], we expected social behavior to decrease over time in the giant pandas as they transitioned from juvenile status to adulthood. As mentioned above, play behavior also decreases in mammals as they age. These behavioral categories occupied 21–29 min during a typical exhibit day. Another reason we might expect these kinds of behaviors to decrease in the giant panda is the demand to process large amounts of bamboo daily, as discussed above.
In the giant pandas, we analyzed alert and maintenance behaviors as a single category. We assert that alert and maintenance behaviors should remain constant over time, although alertness should fluctuate with incoming stimuli in the environment. Alertness is an evolved response to both positive and negative stimuli, making the behavior itself difficult to assign welfare valence to without detailed accounting of all the stimuli presented to the animal and when. We believe a certain consistent level of self-maintenance behavior (e.g., grooming the pelage) is necessary to maintain physical health (e.g., [38]), whereas, in some species, increased self-grooming could be a sign of anxiety [39]. Both pandas increased their alert and maintenance behaviors over time, averaging 50–55 min of the exhibit day. As discussed above, animals should be alert and attend to stimuli in their environment as this is an adaptive response. Seeking is also one of the primary affective drives in the mammalian brain [15]. We cannot determine whether the increases in alert and maintenance behavior are attributable to positive or negative stimuli without a detailed accounting of everything the pandas were exposed to over five years. We assert, however, that, at minimum, the pandas were engaged by their surroundings and attended to stimuli as they evolved to do. As others have pointed out, behavior is how animals manage exposure to the environment, and, thus, their behavior should change as the environment changes [40].
All the bears showed evidence of seasonal variation in behavior, which likely contributed to our difficulty in transforming the data for statistical analysis. The amount of seasonal fluctuation varied among individuals, with the young Andean bear showing the least seasonal variation, but this individual was only observed for a single summer-to-fall period. The old female Andean bear also did not show much seasonal variation. She too was only observed summer-to-fall but over three consecutive years. The vast majority of her time was devoted to resting despite the season or year, likely due to her age. One other long-term study of the behavioral changes in multiple bear species [13] did not find statistically significant changes in behavior across seasons. However, they did observe changes in locomotion with temperature, which suggests that it is a more sensitive predictor of behavior than prescribed seasons. Visitor numbers and time of day also impacted other behaviors, such as visibility and foraging. Stereotypy and social behavior were not affected by season or visitors. Only inactive behavior varied across the years. The authors reasoned that the lack of seasonal effect could possibly be due to consistent husbandry practices over time. It is also possible that they did not detect seasonal differences due to significantly fewer hours of observation included in their study. Moreover, the bear habitats in our study were approximately double the size of the habitats in the previous study, except for our sun bear habitat, which was comparable in size. These smaller habitats may have limited the opportunity for seasonal changes in behavior. The degree of exhibit naturalism might also differ across the sites. Seasonal changes in behavior have been documented in other studies of zoo bears [41,42], and seasonal changes in behaviors are well-documented in a number of bear species in the wild (see [7,13] for summaries).

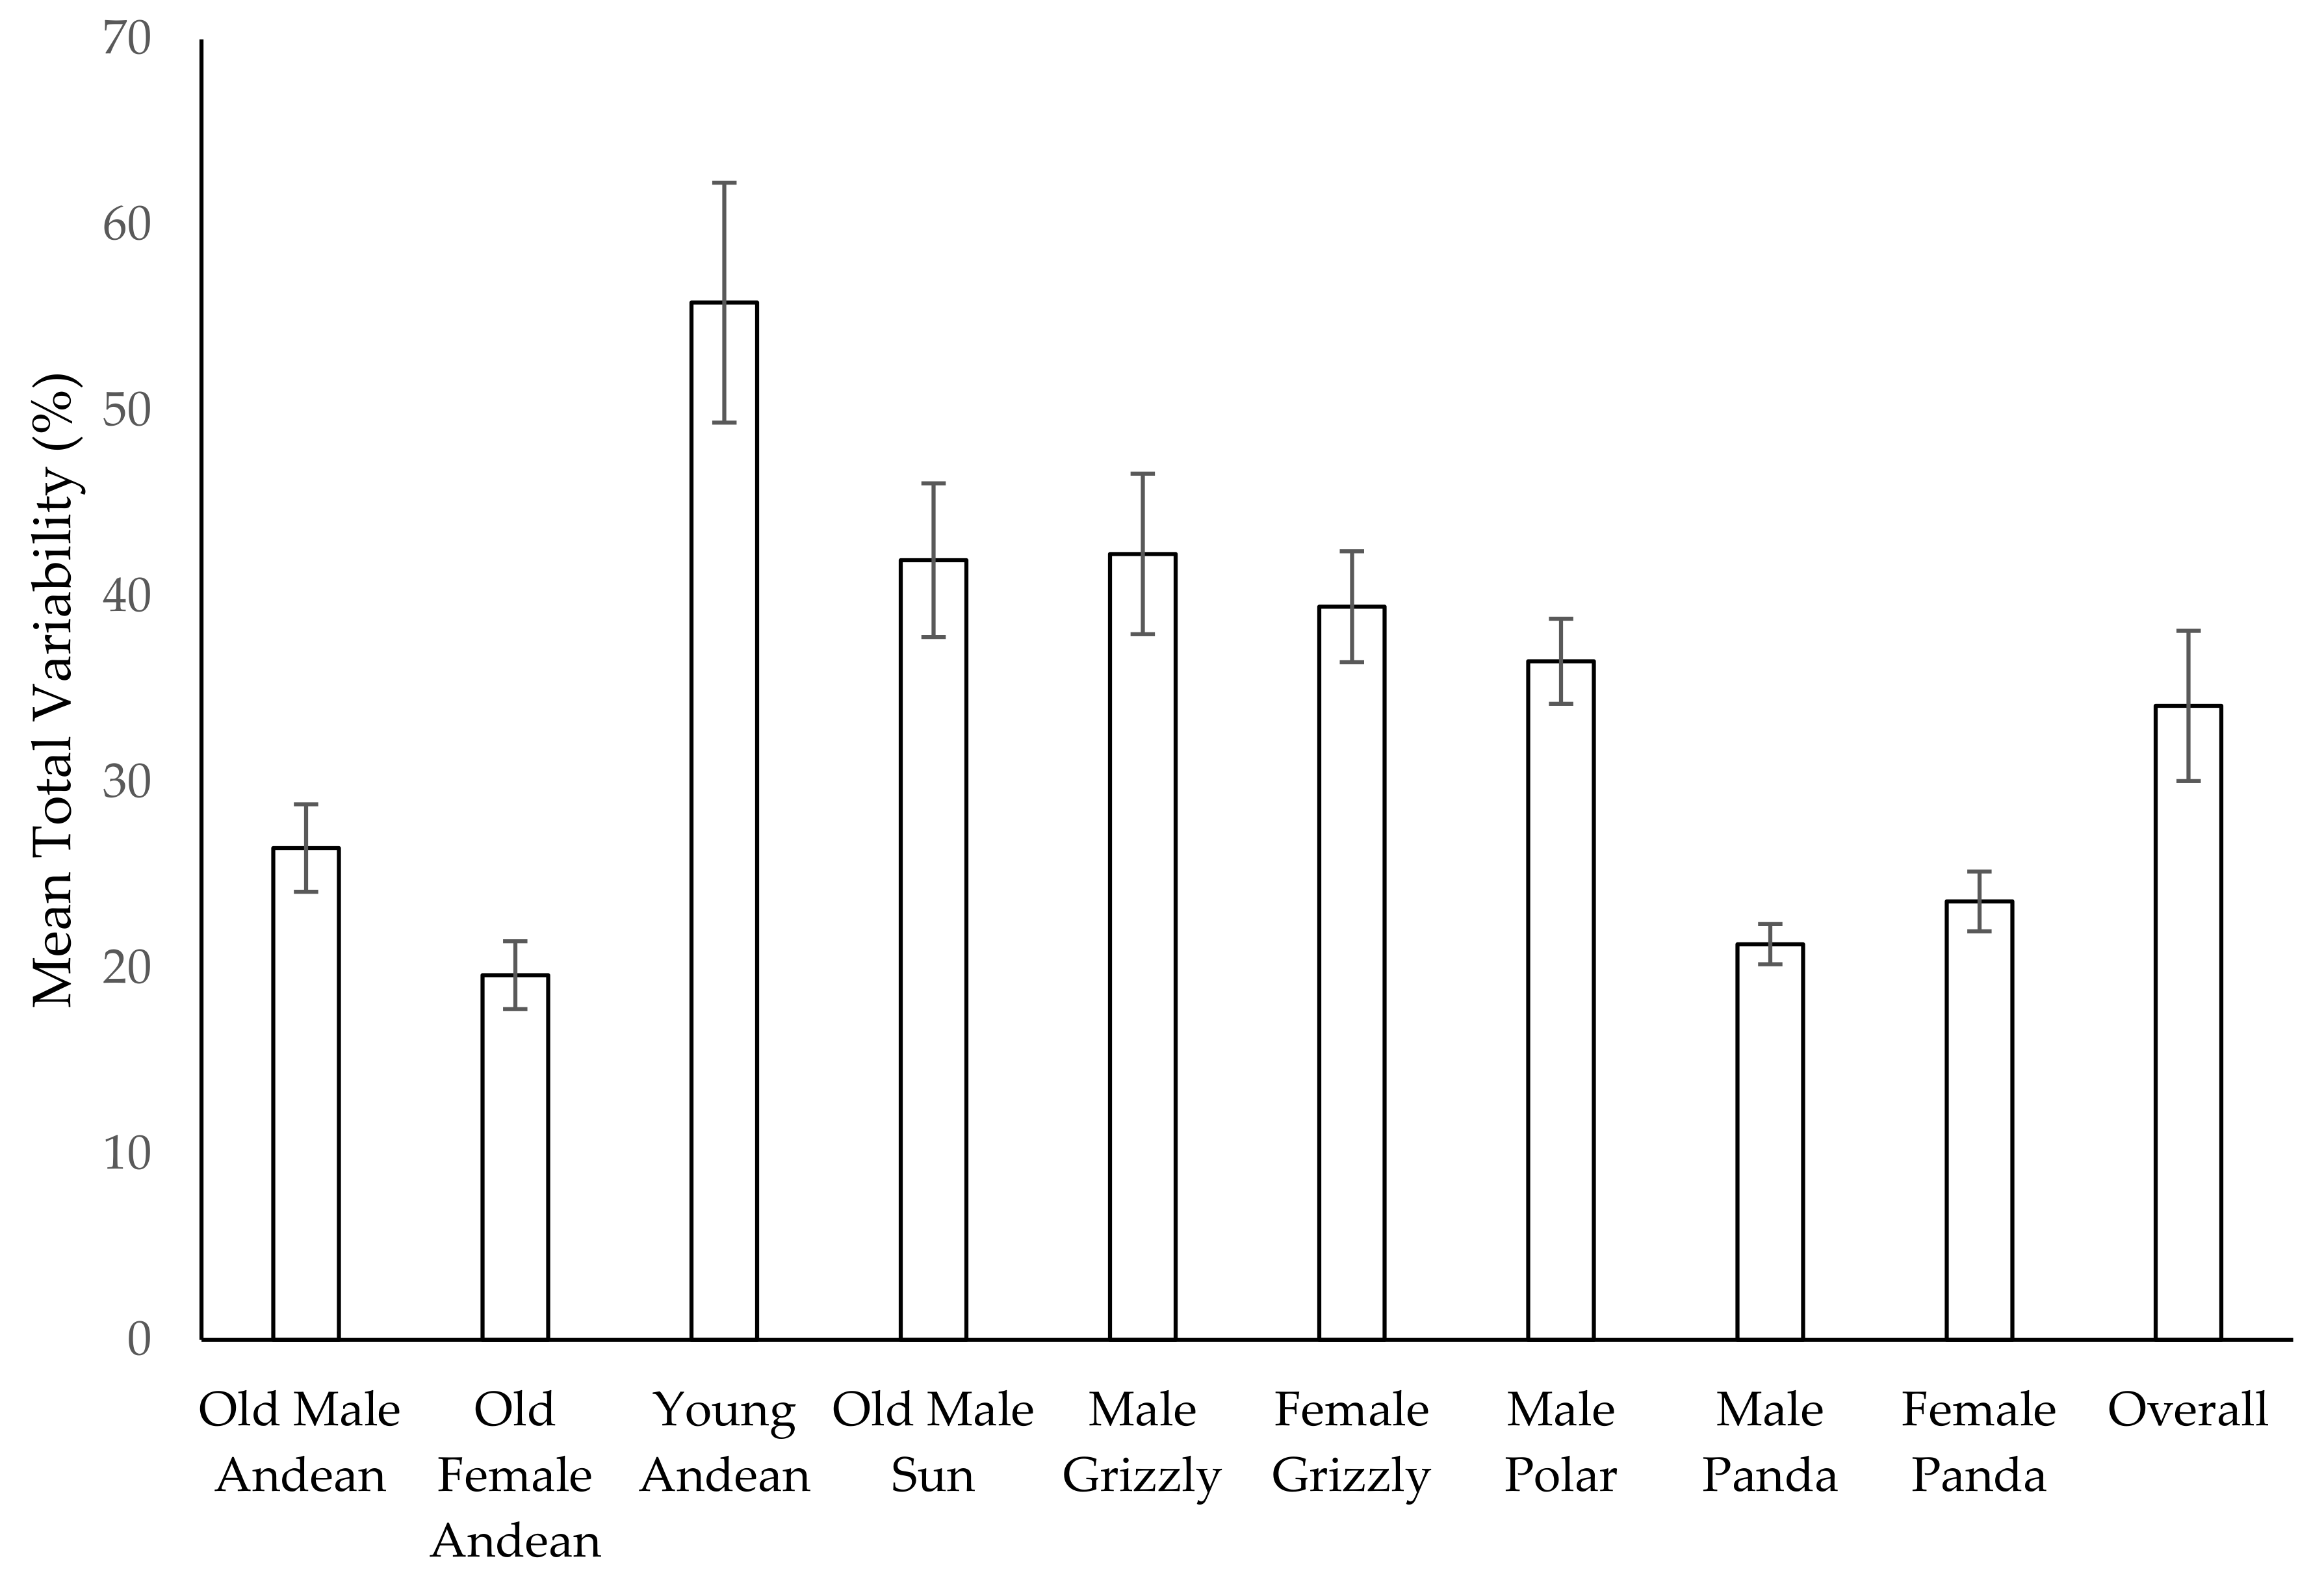
4.2. Activity Budget Variation

We found that the variation in the activity budget remained stable or increased over time. The magnitude of this variation varied widely across the bears (range 19.6–55.8%) with no predictable age effect. Across the bears, the activity budget had an average fluctuation of 34%, which amounted to between two and three hours of fluctuation in time allocation daily (range 1.4–3.9 h). This amount of fluctuation in how the bears spent their time suggests their days avoided a predictable routine with relatively fixed allocation of time to behaviors. Our data demonstrate that all the bears in the study had a diverse behavior repertoire, and the younger bears allocated their time to mostly active behaviors. The older bears were mostly inactive but still devoted time to active behaviors for reasons discussed previously.
In this study, the two ethograms used included 13–18 behaviors that were collapsed into five to seven larger categories for the analysis. Less detailed ethograms are more likely to underestimate variability, so the degree to which our assessments of each day’s activity budgets vary from one another is impacted both by how the animals choose to spend their time and by the construction of the ethogram itself. For example, an ethogram that measures resting and ‘other’ behavior only will generally produce daily activity budgets similar to one another because the animals might rest for similar periods of time throughout the year, and this constrains time spent on ‘other’ behavior. An extremely detailed ethogram would provide an inflated estimate of variability that may not be biologically significant. In practice, an ethogram that measured distinct body postures, vocalizations, scent mark types, and so on would provide large estimates of day-to-day variation that—while true—would not necessarily mean that the animal was differentially allocating its time in a biologically significant way. For example, all the vocalization and scent marking behaviors could simply be the animal’s efforts to advertise its territory. The research question should inform how granular the ethogram is and thus the number of behavioral categories or individual behaviors to assess when variability of activity budgets is of interest. Our interest here was to assess variability in major categories of behaviors, although we collected more detailed behavioral data initially.

4.3. Use of Space

The older bears were more likely to concentrate their activities in a smaller number of zones (low entropy values) than the younger bears. The young polar bear had an average entropy value similar to the older bears, and this was due to his aquatic nature and consequent significant time spent in the pool. Across the dataset, he spent 63% of his time in the zone containing the pools. Generally, the entropy values for the sun bear and younger bears were moderate, suggesting some concentrated areas of high use accompanied by the occasional use of additional areas. This distribution is similar to the habitat use patterns in many territorial mammals, including bears, where the space within the territory is used unevenly, with core areas of use and perhaps seasonal or short-term use of other areas [14]. The giant pandas had the highest scores for entropy, suggesting the most even use of their habitats. Their scores are likely somewhat higher in part due to a much higher number of zones to which they could be assigned during the behavior observations. However, it is also the case that the National Zoo habitats were intentionally designed to have alternative versions of similar resources available in different places [43]. For example, there were two artificially cooled caves in the habitats plus in the air-conditioned indoor areas. There were two separate pools, an area cooled by a misting system, and another area cooled by a fog system. Thus, the pandas had ten different zones for cooling and made use of all of them, increasing their entropy scores. The entropy decreased over time in nine of the twelve cases, meaning that, over time, the bears concentrated more of their activities in fewer areas. Again, this contraction matches the natural patterns of territory use in wild mammals and patterns seen in other carnivores in zoos (e.g., [44]). It likely reflects a settling in process where an initially higher exploration of the full available area is followed later by the expression of preferences for certain areas. However, we also documented wide ranges in the entropy values within the individuals, suggesting that, at least in these bears, the patterns of habitat use fluctuate over time and can vary dramatically, perhaps driven by changes in climate, social dynamics, sexual maturity, or other factors.
Taken together, our results support the assertion that modern zoological exhibits that are naturalistic, structurally complex, and contain multiple resources of interest to the animals support positive behavioral outcomes in the form of diverse and changing behaviors and habitat use in the daily lives of the animals over the long-term. When we saw changes in the behavior dynamics that some could interpret as negative for welfare, e.g., increased resting over time or less even use of space over time, there are alternative hypotheses related to normal behavioral development, aging, and/or species-typical ecology that are equally if not more compelling. Seasonal dynamics also impact changes in behavior. We urge caution when considering changes in behavior to indicate changes in welfare without the careful consideration of covariates of behavior [39] and alternative hypotheses based on natural history. For example, without the explicit consideration of age-related changes in behavior, one might falsely assume that the welfare of older animals is compromised if they rarely engaged in play behavior, were less active, and used less of their available space.
Zoo habitats are sometimes characterized as monotonous (e.g., [45]). While their sizes tend to be invariant, the habitats are subject to changing weather and seasons, which drive physiological and behavioral changes in the animals themselves and in the flora and native fauna that also share the enclosure. In our data, these seasonal fluctuations were apparent, even in animals only observed in two seasons. The social environment may also be dynamic, and cohabiters may cycle through different developmental and reproductive phases that alter behavior. There are also usually changes in the visitor numbers and density that present a fluctuating and changing set of stimuli on daily and seasonal bases [46]. The occupants of nearby habitats also present a dynamic and fluctuating range of stimuli. Finally, the constant work of zookeepers to provide foraging and investigatory opportunities ensure that zoo habitats are not static. This environmental enrichment is a standard practice in modern, accredited zoological facilities and contributes to the variety of not only the experiences encountered by the zoo animals daily but their behavioral responses as well. Thus, we believe characterizations of zoo habitats as ‘static’ are inaccurate, and the data we present provide evidence that the environments of these bears were fluctuating over the long-term and eliciting variability in behavior.
Naturalistic exhibit design has been the prevailing philosophy in modern Western zoos for some time [47], but greater emphasis should be placed on designing opportunities for change in exhibits, whether those changes are introduced by animal care staff or by the environment itself. Much more work needs to be done to evaluate whether modern zoological exhibits continue to support opportunities for variability in behavior and habitat use over time. We advocate for an extension of the time horizon for the post-occupancy evaluation [1] of zoo and aquarium exhibits to ensure animals are experiencing sustained benefits from the design of the habitat. While there are many studies of how exhibit or husbandry modifications affect behavior in the short-term (e.g., [48,49]), these offer little insight into whether such modifications have lasting effects and are justified from a resource perspective. Future long-term assessments of exhibits do not require constant longitudinal observations; rather, intermittent scheduled observation windows that take into account seasonal effects (e.g., 2 weeks of observations each season each year) would be sufficient for tracking the changes in behavior within and across seasons. Because outdoor exhibits offer much in the way of environmental variability, the focus should also expand towards the assessment of indoor exhibits, which may offer less variability over time.

5. Conclusions

Activity budgets in a variety of bear species were generally diverse and showed dynamics in the form of increasing or decreasing levels over long periods of time as well as seasonal fluctuation. Positive changes over time were documented, while changes that might suggest a decline in welfare could be explained by age or other alternative hypotheses related to boredom. Stereotypic behavior was rare in all bears studied.
Observation of bears’ weekly or monthly activity budgets revealed an equivalent of one to four hours of variation on a daily basis.
Diversity in habitat use tended to decrease over time as bears settled into patterns of use reflecting preferences for certain areas that may be associated with key resources (e.g., pools). Older bears used less of the available space than younger bears.

Supplementary Materials

The following are available online at https://www.mdpi.com/article/10.3390/jzbg2040049/s1, Supplementary Material A: Bear Habitat Photographs, Supplementary Material B: Saint Louis Zoo Bear Ethogram, Supplementary Material C: National Zoo Giant Panda Ethogram.

Author Contributions

Conceptualization, methodology, data curation and analysis, writing—original draft preparation, writing—reviewing & editing, D.M.P. and E.B. All authors have read and agreed to the published version of the manuscript.

Funding

David Powell’s giant panda research at the Smithsonian National Zoological Park was supported by the Friends of the National Zoo.

Institutional Review Board Statement

The Institutional Animal Care & Use Committees at the Saint Louis Zoo and Smithsonian National Zoological Park did not review these studies because they were purely observational and non-invasive.

Data Availability Statement

Data collected for this study may be available upon reasonable request from the authors for the Saint Louis Zoo studies or the Smithsonian National Zoological Park for studies there.

Acknowledgments

The authors would like to thank the many interns and volunteers for collecting data over the years for these analyses. Jo Anne Grumm, Lorie Fernandez, and Leanne Miller were particularly useful in facilitating the observations and data management at Smithsonian’s National Zoological Park. Ashley Edes provided helpful comments on an earlier draft of this manuscript.

Conflicts of Interest

The authors declare no conflict of interest.

References

  1. Maple, T.L.; Finlay, T.W. Post-occupancy evaluation in the zoo. Appl. Anim. Beh. Sci. 1987, 18, 5–18. [Google Scholar] [CrossRef]
  2. Kelling, A.S.; Gaalema, D.E. Post-occupancy evaluations in zoological settings. Zoo Biol. 2011, 30, 597–610. [Google Scholar] [CrossRef]
  3. Soriano, A.I.; Ensenyat, C.; Serrat, S.; Maté, C. Introducing a semi-naturalistic exhibit as structural enrichment for two brown bears (Ursus arctos). Does this ensure their captive well-being? J. Appl. Anim. Welf. Sci. 2006, 9, 299–314. [Google Scholar] [CrossRef]
  4. Ogden, J.J.; Finlay, T.W.; Maple, T.L. Gorilla adaptations to naturalistic environments. Zoo Biol. 1990, 9, 107–121. [Google Scholar] [CrossRef]
  5. Cowan, P.E. Neophobia and neophilia: New-object and new-place reactions of three Rattus species. J. Comp. Physiol. Psych. 1977, 91, 63–71. [Google Scholar] [CrossRef]
  6. Glickman, S.W.; Sroges, R.W. Curiosity in zoo animals. Behaviour 1966, 26, 151–188. [Google Scholar] [CrossRef]
  7. Nowak, R.M. Walker’s Mammals of the World; Johns Hopkins University Press: Baltimore, MD, USA, 1999. [Google Scholar]
  8. Carlstead, K.; Seidensticker, J.; Baldwin, R. Environmental enrichment for zoo bears. Zoo Biol. 1991, 10, 3–16. [Google Scholar] [CrossRef]
  9. Forthman, D.L.; Elder, S.D.; Bakeman, R.; Kurkowski, T.W.; Noble, C.C.; Winslow, S.W. Effects of feeding enrichment on behavior of three species of captive bears. Zoo Biol. 1992, 11, 187–196. [Google Scholar] [CrossRef]
  10. Canino, W.; Powell, D.M. Formal behavioral evaluation of enrichment programs on a zookeeper’s schedule: A case study with a polar bear (Ursus maritimus) at the Bronx Zoo. Zoo Biol. 2010, 29, 503–508. [Google Scholar] [CrossRef] [PubMed]
  11. Shepherdson, D.; Lewis, K.D.; Carlstead, K.; Bauman, J.; Perrin, N. Individual and environmental factors associated with stereotypic behavior and fecal glucocorticoid metabolite levels in zoo housed polar bears. Appl. Anim. Beh. Sci. 2013, 147, 268–277. [Google Scholar] [CrossRef]
  12. Soriano, A.I.; Vinyoles, D.; Maté, C. Long-term macroevaluation of environmental enrichment in three Brown bears (Ursus arctos) at Barcelona Zoo. J. Appl. Anim. Welf. Sci. 2016, 19, 49–61. [Google Scholar] [CrossRef] [Green Version]
  13. Bernstein-Kurtycz, L.M.; Koester, D.C.; Snyder, R.J.; Vonk, J.; Willis, M.A.; Lukas, K.E. ‘Bearly’ changing with the seasons: Bears of five species show few behavioral changes across seasons at varying visitor densities. Anim.Behav.Cogn. 2021, 8, 538–557. [Google Scholar] [CrossRef]
  14. Seaman, D.; Powell, R. Identifying Patterns and Intensity of Home Range Use. In Bears: Their Biology and Management; International Association for Bear Research and Management: Bozeman, MT, USA, 1990; Volume 8, pp. 243–249. [Google Scholar] [CrossRef]
  15. Panksepp, J. The basic emotional circuits of mammalian brains: Do animals have affective lives? Neurosci. Biobehav. R. 2011, 35, 1791–1804. [Google Scholar] [CrossRef]
  16. Fernandez, E.J.; Myers, M.; Hawkes, N.C. The effects of live feeding on swimming activity and exhibit use in zoo Humboldt penguins (Spheniscus humboldti). J. Zool. Bot. Gard. 2021, 2, 88–100. [Google Scholar] [CrossRef]
  17. Fernandez, E.J.; Harvey, E. Enclosure use as a measure of behavioural welfare in three zoo-housed African wild dogs (Lycaon pictus). J. Zoo Aquar. Res. 2021, 9, 88–93. [Google Scholar]
  18. Plowman, A.B. A note on a modification of the spread of participation index allowing for unequal zones. Appl. Anim. Behav. Sci. 2003, 83, 331–336. [Google Scholar] [CrossRef]
  19. Brereton, J.E.; Fernandez, E.J. Which index should I use? A comparison of indices for enclosure use studies. Anim. Behav. Cogn. (in press).
  20. Garshelis, D.L.; Pelton, M.R. Activity of black bears in the great smoky mountains national park. J. Mammal. 1980, 61, 8–19. [Google Scholar] [CrossRef]
  21. Kaczensky, P.; Huber, D.; Knauer, F.; Roth, H.; Wagner, A.; Kusak, J. Activity patterns of brown bears (Ursus arctos) in Slovenia and Croatia. J. Zool. 2006, 269, 474–485. [Google Scholar] [CrossRef]
  22. Vickery, S.; Mason, G. Stereotypic behavior in Asiatic black and Malayan sun bears. Zoo Biol. 2004, 23, 409–430. [Google Scholar] [CrossRef]
  23. Burn, C.C. Bestial boredom: A biological perspective on animal boredom and suggestions for its scientific investigation. Anim. Behav. 2017, 130, 141–151. [Google Scholar] [CrossRef] [Green Version]
  24. Wemelsfelder, F. Animal boredom: Understanding the tedium of confined lives. In Mental Health and Well-Being in Animals; McMillan, F.D., Ed.; Blackwell Publishing: Hoboken, NJ, USA, 2005; pp. 77–91. [Google Scholar]
  25. Assefa, S.Z.; Diaz-Abad, M.; Wickwire, E.M.; Scharf, S.M. The functions of sleep. Neuroscience 2015, 2, 155–171. [Google Scholar] [CrossRef]
  26. Everson, C.A.; Bergmann, B.M.; Rechtschaffen, A. Sleep deprivation in the rat: III. Total sleep deprivation. Sleep 1989, 12, 13–21. [Google Scholar] [CrossRef]
  27. Caro, T.M. Predatory behaviour and social play in kittens. Behaviour 1981, 76, 1–24. [Google Scholar] [CrossRef]
  28. Caro, T.M. Sex differences in the termination of social play in cats. Anim. Behav. 1981, 29, 271–279. [Google Scholar] [CrossRef]
  29. Pellis, S.M.; Pellis, V.C. Differential rates of attack, defense, and counterattack during the developmental decrease in play fighting by male and female rats. Dev. Psych. 1990, 23, 215–231. [Google Scholar] [CrossRef] [PubMed]
  30. Mason, G. Stereotypies: A critical review. Anim. Beh. 1991, 41, 1015–1037. [Google Scholar] [CrossRef] [Green Version]
  31. Mason, G.J.; Latham, N.R. Can’t stop, won’t stop; is stereotypy a reliable animal welfare indicator? Anim. Welf. 2004, 13, 557–569. [Google Scholar]
  32. Dierenfeld, E.S.; Hintz, H.F.; Robertson, J.B.; Van Soest, P.J.; Oftedal, O.T. Utilization of bamboo by the giant panda. J. Nutr. 1982, 112, 636–641. [Google Scholar] [CrossRef]
  33. Fraser, D.; Duncan, I.J.H. ‘Pleasures’, ‘Pains’ and animal welfare: Towards a natural history of affect. Anim. Welf. 1998, 7, 383–396. [Google Scholar]
  34. Held, S.D.E.; Špinka, M. Animal play and animal welfare. Anim. Behav. 2011, 81, 891–899. [Google Scholar] [CrossRef]
  35. Trezza, V.; Baarendse, P.J.J.; Vanderschuren, L.J.M.J. The pleasures of play: Pharmacological insights into social reward mechanisms. Trends Pharmacol. Sci. 2010, 31, 463–469. [Google Scholar] [CrossRef] [Green Version]
  36. Yamanashi, Y.; Nogami, E.; Teramoto, M.; Morimura, N.; Hirata, S. Adult-adult social play in captive chimpanzees: Is it indicative of positive welfare? Appl. Anim. Beh. Sci. 2018, 199, 75–83. [Google Scholar] [CrossRef]
  37. Schaller, G.B.; Jinchu, H.; Wenshi, P.; Jing, Z. The giant pandas of Wolong. University of Chicago Press: Chicago, IL, USA, 1985. [Google Scholar]
  38. Akinyi, M.Y.; Tung, J.; Jeneby, M.; Patel, N.B.; Altmann, J.; Alberts, S.C. Role of grooming in reducing tick load in wild baboons (Papio cynocephalus). Anim. Behav. 2013, 85, 559–568. [Google Scholar] [CrossRef] [PubMed] [Green Version]
  39. Troisi, A. Displacement activities as a behavioral measure of stress in nonhuman primates and human subjects. Stress 2009, 5, 47–54. [Google Scholar] [CrossRef]
  40. Watters, J.V.; Krebs, B.L.; Eschmann, C.L. Assessing Animal Welfare with Behavior: Onward with Caution. J. Zool. Bot. Gard. 2021, 2, 75–87. [Google Scholar] [CrossRef]
  41. Fernandez, E.J.; Yoakum, E.; Andrews, N. Seasonal and daily activity of two zoo-housed grizzly bears (Ursus arctos horribilis). J. Zool. Bot. Gard. 2020, 1, 1–12. [Google Scholar] [CrossRef]
  42. Liu, H.; Duan, H.; Wang, C. Effects of ambient environmental factors on the stereotypic behaviors of giant pandas (Ailuropoda melanoleuca). PLoS ONE 2017, 12, e0170167. [Google Scholar] [CrossRef]
  43. Powell, D.M.; Stevens, L.M. Guidelines for the housing and husbandry of the giant panda (Ailuropoda melanoleuca). In Giant Panda Animal Care Manual; Lindburg, D., Wong, S., Eds.; Zoological Society of San Diego: San Diego, CA, USA, 2009; pp. 1–14. [Google Scholar]
  44. Hunter, S.C.; Gusset, M.; Miller, L.J.; Somers, M.J. Space use as an indicator of enclosure appropriateness in African wild dogs (Lycaon pictus). J. Appl. Anim. Welf. Sci. 2014, 17, 98–110. [Google Scholar] [CrossRef]
  45. Mench, J.A.; Kreeger, M.D. Ethical and welfare issues associated with keeping wild mammals in captivity. In Wild Mammals in Captivity: Principles and Techniques; Kleiman, D.G., Allen, M.E., Thompson, K.V., Lumpkin, S., Eds.; University of Chicago Press: Chicago, IL, USA, 1996; pp. 5–15. [Google Scholar]
  46. Perkins, D.R.; Debbage, K.G. Weather and Tourism: Thermal Comfort and Zoological Park Visitor Attendance. Atmosphere 2016, 7, 44. [Google Scholar] [CrossRef] [Green Version]
  47. Hancocks, D. The history and principles of zoo exhibition. In Wild Mammals in Captivity: Principles & Techniques for Zoo Management, 2nd ed.; Kleiman, D.G., Thompson, K.V., Baer, C.K., Eds.; University of Chicago Press: Chicago, IL, USA, 2010; pp. 121–136. [Google Scholar]
  48. Kessel, A.; Brent, L. Space utilization by captive-born baboons (Papio sp.) before and after provision of structural enrichment. Anim. Welf. 1996, 5, 37–44. [Google Scholar]
  49. Little, K.A.; Sommer, V. Change of enclosure in langur monkeys: Implications for the evaluation of environmental enrichment. Zoo Biol. 2002, 21, 549–559. [Google Scholar] [CrossRef]
Figure 1. Mean (±SE) % time allocated to behaviors in relation to season and time of habitat occupancy in the older male Andean bear.
Jzbg 02 00049 g001
Figure 2. Mean (±SE) % time allocated to behaviors in relation to season and time of habitat occupancy in the female Andean bear.
Jzbg 02 00049 g002
Figure 3. Mean (±SE) % time allocated to behaviors in relation to season and time of habitat occupancy in the younger male Andean bear.
Jzbg 02 00049 g003
Figure 4. Mean (±SE) % time allocated to behaviors in relation to season and time of habitat occupancy in the male sun bear.
Jzbg 02 00049 g004
Figure 5. Mean (±SE) % time allocated to behaviors in relation to season and time of habitat occupancy in the male grizzly bear.3.6. Female Grizzly Bear.
Jzbg 02 00049 g005
Figure 6. Mean (±SE) % time allocated to behaviors in relation to season and time of habitat occupancy in the female grizzly bear.
Jzbg 02 00049 g006
Figure 7. Mean (±SE) % time allocated to behaviors in relation to season and time of habitat occupancy in the male polar bear.
Jzbg 02 00049 g007
Figure 8. Mean (±SE) % time allocated to behaviors in relation to season and time of habitat occupancy in the male giant panda.
Jzbg 02 00049 g008
Figure 9. Mean (±SE) % time allocated to behaviors in relation to season and time of habitat occupancy in the female giant panda.
Jzbg 02 00049 g009
Figure 10. Mean (±SE) total percent variability in the activity budgets of each bear in the study and across all bears.
Jzbg 02 00049 g010
Figure 11. Weekly entropy scores in the older Andean bears with a four-week moving average trendline. Entropy scores are not comparable between observation period 1 and periods 2 and 3 due to differing numbers of zones on the habitat maps (see Methods).
Jzbg 02 00049 g011
Figure 12. Weekly entropy scores in the young male Andean bear with a four-week moving average trendline.
Jzbg 02 00049 g012
Figure 13. Weekly entropy scores in the male sun bear with a four-week moving average trendline. Entropy scores are not comparable between observation period 1 and periods 2 and 3 due to differing numbers of zones on the habitat maps (see Methods).
Jzbg 02 00049 g013
Figure 14. Weekly entropy scores in the grizzly bears with a four-week moving average trendline.
Jzbg 02 00049 g014
Figure 15. Weekly entropy scores in the polar bear with a four-week moving average trendline.
Jzbg 02 00049 g015
Figure 16. Monthly entropy scores in the giant pandas with a four-month moving average trendline.
Jzbg 02 00049 g016
Table 1. Demographic information, habitat introduction dates, and occupancy period observed for bears in this study.
SubjectSexBirth
Origin
& Year
Introduced
to Habitat
Age during
Study (Years)
HousingWeeks of
Occupancy
Observed
# Datapoints
in Analysis
Sun BearMaleWild ~1997Summer 201417–20Social2–12960 weeks
Andean BearMaleZoo 1990Summer 201424–27Social2–13062 weeks
Andean BearFemaleZoo 1993Summer 201425–27Social2–13061 weeks
Andean BearMaleZoo 2016Spring 20193Single 1–2923 weeks
Grizzly BearMaleWild 2015Fall 20172–3Social3–5243 weeks
Grizzly BearFemaleWild 2015Fall 20172–3Social3–5242 weeks
Polar BearMaleWild 2013Summer 20155–7Single1–10493 weeks
Giant PandaMaleZoo 1997December 20004–8Social23–20147 months
Giant PandaFemaleZoo 1998December 20003–7Social23–20147 months
Table 2. Direction of behavior change for bears over time. Changes were assessed monthly in giant pandas and weekly in all other bears. These trends were not amenable to statistical testing. All changes were less than 0.41% of time allocated to the behavior per week or month and most were less than 0.07% per week (Saint Louis bears) or month (giant pandas).
SubjectRestLocomotionInvestigate/
Forage
Use PoolStereotypyAlert/
Maintenance
FeedInvestigate/
Play
Social
Old Male Andean BearDecreaseIncreaseIncreaseDecreaseIncrease----
Old Female Andean BearIncreaseDecreaseIncreaseDecreaseDecrease----
Young Male Andean BearDecreaseIncreaseIncreaseDecreaseIncrease----
Male Sun BearIncreaseDecreaseIncreaseDecreaseDecrease----
Male Grizzly BearIncreaseDecreaseDecreaseIncreaseDecrease----
Female Grizzly BearIncreaseDecreaseDecreaseIncreaseIncrease----
Male Polar BearIncreaseDecreaseIncreaseDecreaseIncrease----
Male Giant PandaIncreaseDecrease--IncreaseIncreaseDecreaseDecreaseDecrease
Female Giant PandaIncreaseIncrease--DecreaseIncreaseIncreaseDecreaseDecrease
Table 3. Overall activity budgets (mean % ± SE, SD) for each bear across its full study period.
RestLocomotionInvest./
Forage
Use PoolStereotypyAlert/
Maintenance
Invest./
Feed
PlaySocial
SubjectMean
± SE
SDMean
± SE
SDMean
± SE
SDMean
± SE
SDMean
± SE
SDMean
± SE
SDMean
± SE
SDMean
± SE
SDMean
± SE
SD
Old Male Andean Bear76 ± 2.52013 ± 1.5125 ± 0.655 ± 0.872 ± 0.75
Old Female Andean Bear84 ± 1.197 ± 0.657 ± .862 ± 0.641 ± 0.32
Young Male Andean Bear42 ± 3.81815 ± 1.6734 ± .3.2153 ± 2.2105 ± 1.78
Male Sun Bear60 ± 3.12424 ± 2.82110 ± 1.4116 ± 0.860 ± 0.00
Male Grizzly Bear40 ± 2.21519 ± 1.2816 ± 1.3924 ± 2.3150 ± 0.10
Female Grizzly Bear45 ± 2.21420 ± 1.0717 ± 1.5917 ± 2.0130 ± 0.10
Male Polar Bear25 ± 1.21110 ± 0.5518 ± 0.8844 ± 0.6153 ± 1.65
Male Giant Panda29 ± 0.969 ± 0.53 5 ± 0.4312 ± 0.4327 ± 1.077 ± 0.325 ± 0.53
Female Giant Panda39 ± 1.399 ± 0.54 0 ± 0.0013 ± 0.4324 ± 0.966 ± 0.325 ± 0.53
Table 4. Seasonal changes in behavior in seven bears at Saint Louis Zoo and two giant pandas at Smithsonian’s National Zoological Park. Not all bears were observed in all seasons. Proportions of time spent performing behaviors are shown as means (±SE) that represent averages across years of observation in a given season. The young male Andean bear and grizzly bears were only observed in one year.
SeasonBehaviorOld Male Andean BearOld Female Andean BearYoung Male Andean BearMale Sun BearMale Grizzly BearFemale Grizzly BearMale Polar BearMale Giant PandaFemale Giant Panda
Rest65 ± 0.085 ± 0.042 ± 0.158 ± 0.139 ± 0.048 ± 0.021 ± 0.033 ± 0.042 ± 0.0
Inv./Forage4 ± 0.04 ± 0.033 ± 0.07 ± 0.011 ± 0.010 ± 0.012 ± 0.0
Locomotion20 ± 0.08 ± 0.014 ± 0.028 ± 0.013 ± 0.020 ± 0.09 ± 0.06 ± 0.07 ± 0.0
Pool9 ± 0.02 ± 0.02 ± 0.07 ± 0.038 ± 0.021 ± 0.055 ± 0.0
SummerStereotypy 10 ± 0.00 ± 0.00 ± 0.00 ± 0.02 ± 0.07 ± 0.00 ± 0.0
Alert/Maint 12 ± 0.013 ± 0.0
Feed 22 ± 0.022 ± 0.0
Inv./Play 8 ± 0.06 ± 0.0
Social 7 ± 0.00 ± 0.0
Rest87 ± 0.083 ± 0.044 ± 0.162 ± 0.033 ± 0.037 ± 0.026 ± 0.030 ± 0.042 ± 0.0
Inv./Forage6 ± 0.09 ± 0.038 ± 0.113 ± 0.018 ± 0.020 ± 0.019 ± 0.0
Locomotion6 ± 0.06 ± 0.017 ± 0.019 ± 0.027 ± 0.026 ± 0.08 ± 0.07 ± 0.08 ± 0.0
Pool1 ± 0.01 ± 0.00 ± 0.05 ± 0.021 ± 0.017 ± 0.046 ± 0.0
FallStereotypy1 ± 0.00 ± 0.00 ± 0.00 ± 0.00 ± 0.00 ± 0.00 ± 0.06 ± 0.00 ± 0.0
Alert/Maint 13 ± 0.012 ± 0.0
Feed 23 ± 0.020 ± 0.0
Inv./Play 9 ± 0.07 ± 0.0
Social 6 ± 0.00 ± 0.0
Rest 40 ± 0.048 ± 0.129 ± 0.030 ± 0.036 ± 0.0
Inv./Forage 25 ± 0.024 ± 0.121 ± 0.0
Locomotion 18 ± 0.015 ± 0.013 ± 0.010 ± 0.010 ± 0.0
Pool 17 ± 0.113 ± 0.134 ± 0.0
WinterStereotypy 0 ± 0.00 ± 0.03 ± 0.03 ± 0.00 ± 0.0
Alert/Maint 10 ± 0.010 ± 0.0
Feed 32 ± 0.029 ± 0.0
Inv./Play 6 ± 0.07 ± 0.0
Social 3 ± 0.00 ± 0.0
Rest 50 ± 0.049 ± 0.023 ± 0.025 ± 0.036 ± 0.0
Inv./Forage 14 ± 0.019 ± 0.020 ± 0.0
Locomotion 16 ± 0.016 ± 0.011 ± 0.012 ± 0.012 ± 0.0
Pool 20 ± 0.016 ± 0.040 ± 0.0
SpringStereotypy 0 ± 0.00 ± 0.05 ± 0.05 ± 0.00 ± 0.0
Alert/Maint 14 ± 0.015 ± 0.0
Feed 32 ± 0.024 ± 0.0
Inv./Play 6 ± 0.05 ± 0.0
Social 3 ± 0.00 ± 0.0
Table 5. Based on observed variation over time shown in Figure 10, the number of hours in a 7-h exhibit day that time allocated to various behaviors fluctuated across behavioral categories.
Subject# Hours in a 7-h Day that Fluctuate in Terms of Activity
Old Male Andean Bear1.9
Old Female Andean Bear1.4
Young Male Andean Bear3.9
Male Sun Bear2.9
Male Grizzly Bear3.0
Female Grizzly Bear2.8
Male Polar Bear2.6
Male Giant Panda1.5
Female Giant Panda1.6
All Bears2.4
Table 6. Descriptive characteristics of weekly (Saint Louis bears) and monthly (giant pandas) entropy values with slopes over time. Minimum H values of zero indicate weeks in which subjects were only observed in a single zone.
Species (and Year)# of ZonesMin HMax HRangeAverage HSESlope
Female Andean Bear 201440.030.480.450.310.028−0.009
Female Andean Bear 2015600.580.580.350.0250.003
Male Andean Bear 201440.050.490.440.290.028−0.008
Male Andean Bear 2015600.60.60.380.0250.001 × 10−1
Male Sun Bear 201450.290.620.330.460.020.005
Male Sun Bear 201560.080.710.630.480.026−0.001
Male Polar Bear60.10.70.590.470.013−0.001
Female Grizzly Bear60.440.710.270.610.011−0.001
Male Grizzly Bear60.290.740.450.60.014−0.003
Young Male Andean Bear60.140.710.570.510.025−0.004
Male Giant Panda140.6710.330.850.01−0.003
Female Giant Panda140.50.970.470.850.01−0.002
Publisher’s Note: MDPI stays neutral with regard to jurisdictional claims in published maps and institutional affiliations.

