Article

Exploring the Interface Between Gamma Oscillations and Psychological Resilience: A Multimodal EEG Pilot Study


Brain-Behaviour Research Group, University of New England, Armidale, NSW 2350, Australia
*
Author to whom correspondence should be addressed.
Psychiatry Int. 2026, 7(4), 153; https://doi.org/10.3390/psychiatryint7040153
Submission received: 1 April 2026 / Revised: 5 June 2026 / Accepted: 1 July 2026 / Published: 10 July 2026

Abstract

While psychological resilience (PR) is critical for adaptive stress responses, its neurophysiological substrates remain unclear. Given that gamma activity (30–130 Hz) is implicated in the sensory integration and cognitive control necessary for emotion regulation, this study utilized multimodal EEG and psychometric assessments (N = 100) to evaluate resting-state eyes-open (EO) and eyes-closed (EC) oscillatory dynamics in three experimental stages. Resilience was quantified using the Connor–Davidson Resilience Scale (CDRISC-25). Following a hierarchical signal-discovery protocol, a whole-head survey was conducted to identify sites of interest, providing independent data for hypothesis formation. Following rigorous artifact control (EOG-verified ICA; 90% mean epoch retention) and statistical adjustment for multiple comparisons (Benjamini–Hochberg FDR), a robust spectral cluster was identified at the left frontopolar site (FP1), showing consistent inverse correlations with resilience across 30–50 Hz, 50–70 Hz, and 70–90 Hz sub-bands (all p FDR = 0.043). Crucially, findings were strictly lateralized, with the adjacent FP2 site remaining non-significant. Results highlight a lateralized neurophysiological signature of resilience at the left frontal pole, arguing against diffuse myogenic contamination. Next, source localization (eLORETA) and functional connectivity (Lagged Linear Coherence) were utilized to characterize spatial dynamics. Source analysis revealed noteworthy activity near the left anterior cingulate and medial prefrontal cortex. Furthermore, functional connectivity analysis showed significant coherence correlates across nodes linked with the default mode network (DMN). Notably, the 70–90 Hz sub-band emerged as a consistent correlate across all three experimental stages. Prioritizing statistical parsimony over complex mediation, these preliminary, hypothesis-generating findings suggest that site-dependent and frequency-specific gamma activity may provide neurophysiological insight toward adaptive flexibility. In particular, the 30–90 Hz spectral cluster at the left frontopolar region appears to be associated with the resting-state profile of resilient individuals in complex, as-yet-unspecified ways. These pilot data suggest further investigation is warranted, potentially providing a foundational target for future longitudinal research into the oscillatory signatures of adaptive flexibility.

1. Introduction

Acute and chronic stress exposure can disrupt neurobiological homeostasis, thus increasing vulnerability to poor mental health [1,2,3,4,5]. Psychological resilience (PR) is recognized as the capacity to adapt positively to stress exposure or adversity [6], being considered a key determinant of mental health [7,8,9,10]. Understanding its neurobiological basis is essential for quantifying the adaptive coping skills associated with effective prevention or intervention strategies (resilience), and at the same time mitigating the increasing burden that stress-related psychological disorders place on public health resources.
PR appears to emerge via adaptive mechanisms [11] that prevent negative emotional sequelae following exposure to adversity [9]. These mechanisms, often defined as ‘stress-coping abilities’ [7] (p. 77) or skills [12,13], function as protective factors that assist individual recovery. Research shows that PR may be inversely related to depression [14,15,16], can buffer against various forms of maladaptation [2], and may prevent the development of metabolic [17,18], cognitive or mood disorders [19], as well as the onset of trauma-induced psychopathologies [16,20].
PR is conceptualized as a growth-oriented process governed by emotion regulation, cognitive control, and allostatic flexibility [21,22]. Beyond putative biomarkers of a trait-based construct, these dynamic features suggest that the underpinnings of PR involve flexible feedback systems, including allostatic inference, network flexibility, and neuroplasticity [3,11,19,23]. While PR is highly individualized [21,22], the foundations for this person-centric diversity remain poorly understood. PR may allow individuals to mitigate allostatic overload while yielding hormetic gain, whereby moderate stress facilitates enhanced psychobiological function [22,24]. Although behavioral correlates are well-documented [5,7,25,26,27,28], the specific electrophysiological mechanisms underpinning this beneficial adaptation remain unclear [29,30].

1.1. Neural Oscillations and Functional Integration

Neural oscillations emerge from rhythmic fluctuations in neuronal excitability and inhibition that are thought to facilitate systemic communication [23]. Driven by underlying ionic flux [24], these measurable electroencephalographic (EEG) patterns may sustain the neural integration necessary for complex mental operations [25,26]. Such activity, comprising both periodic and aperiodic components [27], is hypothesized to regulate cognitive states [28]. Specific oscillatory bands are traditionally associated with distinct domains [29], while aberrant dynamics are often indicative of psychopathology, leading to the proposition that optimal rhythmic activity is a prerequisite for psychological health [24,25].

1.2. Gamma Activity and Stress Adaptation

Gamma wave activity is a crucial component of neural processing [27,30,31,32,33,34], yet its role in stress adaptation remains largely unexplored. Gamma dynamics contribute to several functions central to PR, including cognitive control [25,35,36], contextually appropriate perception [37], emotion [38] and stress regulation [39], social affiliation [40,41] and memory selection [42]. Its specific role in PR has been reviewed [29]. However, a complete view is yet to emerge.
Recent work has shown that gamma activity can vary significantly between cognitive states, confounding attempts to determine causal relationships [25,30,43], while at the same time suggesting that gamma-related neural dynamics may be state-dependent, appearing as an emergent property of neural operations [35,44] rather than being indicative of any particular mental state [27]. Increases in gamma band power have been observed in apparently contradictory instances of heightened cognitive processing [25], social bonding [45], increased anxiety [46], major depression [32], and advanced states of relaxation [39]. Decreases in gamma have been linked to both cognitive decline [33] and mental stability [27]. These contradictions require further empirical analysis [43]. Accumulating data suggest that gamma oscillatory dynamics may underscore the brain’s ability to integrate diverse stimuli and select context-appropriate responses under challenge [27,29,47,48,49]; and [34], providing a neurobiological model that could inform upon the psychobiological substrates of PR through mechanisms linked with beneficial adaptation. For synthesized reviews, see [29,49].

1.3. Frequency-Specific Dynamics and Multimodal Integration

Gamma-band oscillations are traditionally categorized as either broadband phenomena (e.g., 30–200 Hz [32]) or discrete sub-bands, with emerging evidence distinguishing between “low” and “high” gamma functions [47,50,51]. This delineation is critical for resilience research, as specific frequencies may index divergent adaptive mechanisms. For instance, while 43 Hz oscillations appear to negatively correlate with individual resilience [52], higher frequencies (70–130 Hz) are thought to facilitate complex cognitive operations and emotional processing [42]. Furthermore, gamma sub-bands (30.5–40.5 Hz) have been proposed as drivers of global connectivity, suggesting that frequency-specific dynamics could assist the brain in maintaining functional integration during periods of high cognitive demand [53].
To address these complexities, this study adopts a multimodal framework that integrates psychometric assessment with scalp-level EEG and source-localization analysis. This approach builds on established methodologies [14,30,54] while introducing novel strategies to characterize the spatial and spectral properties of resilience-related activity. By synthesizing surface-level data with source-localized estimates, our research provides a nuanced understanding of how distinct gamma oscillations could reflect adaptive functioning. The resulting hypothesis-generating framework offers actionable insights for both theoretical models of mental stability and clinical applications in neuromodulation.

2. Materials and Methods

A multimodal analysis was conducted, using data from one psychometric test (CDRISC-25) and one single-session EEG recording to evaluate the relationship between PR and gamma-band oscillatory dynamics at nodal (scalp), regional (source), and network (connectivity) levels.

2.1. Participants

Data were analyzed from 100 healthy volunteers (44 men, 56 women; M = 32.53 years, SD = 14.13, range 18–75) drawn from the New England region of New South Wales, Australia. None reported prior neurological injury, claustrophobia or epilepsy, and participants were asked to refrain from caffeine intake prior to testing. Ethical approval was granted by the University of New England Human Research Ethics Committee (HE14-051). All participants gave written informed consent and were invited to participate in a single-session EEG measurement; therefore, test–retest results were not obtained.

2.2. Instruments

2.2.1. Resilience

The 25-item Connor–Davidson Resilience Scale (CDRISC-25; Connor and Davidson, 2003) [7] was used to assess resilience on a 0–4 Likert scale. The CDRISC-25 shows strong internal consistency (α = 0.89) and test–retest reliability (r = 0.87). Total scores (henceforth CDRT) were used as the primary psychometric variable (M = 67.51; SD = 15.54; α = 0.94), with higher scores indicating greater psychological resilience.

2.2.2. EEG Recording

High-density EEG was recorded using a 40-channel Neuroscan QuikCap with NuAmps amplifier (Compumedics Ltd., Melbourne, Australia) at a 1 kHz sampling rate, with a bandpass DC–250 Hz and a notch filter at 50 Hz to remove mains power interference. Electrodes followed the 10–20 system, with recordings referenced to the average of the A1-A2 earlobe electrodes and subsequently converted to a common average reference offline to minimize localized noise. Impedances were maintained below 10 kΩ.
To ensure rigorous artifact identification, electrooculogram (EOG) data were collected via four dedicated electrodes: two arranged vertically (above and below the left eye) to measure vertical eye movements (VEOG), and two arranged at the outer canthi of the left and right eyes to measure horizontal movements (HEOG). Applying standard convention, 12 electrodes were dedicated to referencing outcomes, and only 24 homologous nodal points were used for the purpose of comparison between site-specific and regional data (FP1, FP2, F3, F4, F7, F8, FT7, FT8, FC3, FC4, T7, T8, TP7, TP8, C3, C4, P3, P4, P7, P8, CP3, CP4, O1, O2). Recording protocols included 3 min blocks for eyes-open (EO) and eyes-closed (EC) resting-state conditions, consistent with experimental comparators [55,56].

2.2.3. Signal Processing and Artifact Rejection

Artifact-free epochs (2 s) were extracted for frequency-domain analysis. Eye movement and muscle artifacts were removed using independent component analysis (ICA) via the Fully Automated Statistical Thresholding for EEG Artifact Rejection pipeline FASTER; [57], utilizing the Infomax algorithm [58] to identify and remove EEG components indicative of common confounders such as eye movements, electrode shift due to subject movement, and facial electromyography (EMG) or high spatial kurtosis (indicative of electrode pop-offs and saccadic spikes). Epochs were then visually inspected for any remaining artifacts, with contaminated data removed. Signal integrity was robust across the cohort: over 90% of epochs were retained as usable for most participants in both EO and EC conditions. The minimum retention floor was 87% for EO and 79% for EC. Absolute gamma power (Power Spectral Density; PSD) was calculated via Fast Fourier Transformation (FFT) across a total gamma band of 30–130 Hz.

2.3. Procedure

Prior to EEG testing, participants read explanatory statements, had the opportunity to ask questions, and gave consent before completing a background questionnaire and the CDRISC-25, and then having an electrode cap fitted.
After a 15 min adaptation phase, an audio-recorded experimental protocol was broadcast for the total test period (continual—6 min) during both EC (Part 1) and EO (Part 2) conditions. Consistency was maintained via replication of the auditory recording, and no other stimuli, including visual, were presented for the duration of the experiment.

2.4. Data Analysis and Source Localization

Data were analyzed using SPSS 30.0 and JASP 0.19.3. To remain consistent with the most recent recommendations for gamma-band analysis [27,43], non-normal EEG distributions were accepted without transformation. Despite a tendency for researchers to transform raw EEG data for statistical investigation, this is not always required [10] and can inadvertently distort key electrophysiological characteristics, particularly within the higher frequency ranges [43]. Pearson’s product-moment correlation (r) is recognized as robust to non-normality in large samples [10]; however, owing to the transient and stochastic properties of gamma oscillations, consideration for non-monotonic measures was made as required, with some non-parametric methods employed for statistical analysis.
To control for the inflated risk of Type I errors associated with multiple comparisons across the 24-node EEG data, the Benjamini–Hochberg False Discovery Rate (FDR) procedure was applied to all nodal correlational analyses to correct for multiple comparisons using JASP 0.19.3. Only exploratory (p < 0.05) or meaningful (r > 0.3) relationships were considered, following Cohen’s [59] definition of a ‘medium’ effect size threshold (i.e., 0.3 to 0.49), then subjected to FDR testing. Results were considered statistically significant only when the FDR-adjusted p-value (p FDR) remained below the (0.05) threshold. In addition, a visual inspection of scatterplots was conducted, as correlation alone may fail to adequately describe relationships in nonmonotonic data [60,61].

2.4.1. Sub-Band and Subgroup Stratification

A “blind” correlational analysis across the total gamma range (30–130 Hz) for all 24 electrodes was first conducted on the total sample (N = 100), testing for any relationship between total gamma power (30–130 Hz) or any of the five sub-bands (30–50 Hz, 50–70 Hz, 70–90 Hz, 90–110 Hz, 110–130 Hz) and CDRTs. Then, the sample was further stratified into high-resilience (HRI, top 20th percentile, n = 20) and low-resilience (LRI, bottom 20th percentile, n = 20) subgroups to provide dichotomous pairs for comparative analyses. Pearson’s correlations (r), MANOVA, and ANOVA were used to detect any significant differences in CDRT scores between men and women, as well as between high- and low-resilience participants (HRI vs. LRI).

2.4.2. eLORETA Source and Network Analysis

Regions of interest (ROIs) and functional lagged linear connectivity (coherence) were determined using exact Low-Resolution Brain Electromagnetic Tomography (eLORETA, 2011) [62]. Source estimates were derived from scalp-level PSD data mapped onto the MNI152 template (6239 voxels). Voxel-level statistical significance was determined via non-parametric permutation testing (5000 permutations), providing inherent correction for multiple comparisons within the source space. Correlations between CDRTs and each gamma sub-band across all brain regions were measured across the entire sample population only (N = 100), then prospective ROIs were determined based on functional-connectivity mapping [62]. Source localization estimates were constructed through the comparison of gamma PSD generated at each electrode site. These produced a high-density map of total brain regions (global) with significant gamma wave activity relative to the CDRT recorded, which were then matched to potential brain sites based on Brodmann’s taxonomy of cytoarchitecture [62]. Owing to the limitations of this study, source-space and network-level analyses were restricted to the whole-group population.

3. Results

3.1. Correlational and Statistical Analyses

The mean resilience score was 67.51 (SD = 15.54). Cronbach’s α for the present sample was 0.94. No significant sex F (1, 98) = 1.442, p = 0.223, or age effects (r = 0.060, p = 0.553), were found for CDRT scores. Similarly, there was no significant correlation between age and CDRTs for the men (r = 0.015, p = 0.921) or women (r = 0.105, p = 0.439). State-level factors (e.g., sleep, immediate caffeine) were handled via protocol, and any underlying trait-level association remained independent of demographic variance.
There were 10 women in the LRI subgroup and 13 women in the HRI. No significant difference was found between the HRI and LRI groups for age F (1, 38) = 0.936, p = 0.512 or gender χ2 (1, 40) = 0.137, p = 0.711. Pearson correlational analysis was performed between absolute gamma power and CDRT for each EEG nodal site (N = 24) across total gamma power and then for each gamma sub-band, first for the entire sample population then for the LRI and HRI subgroups under both EC and EO conditions, with subsequent FDR analysis applied to confirm the significance of exploratory analyses. Results are reported below, with gamma PSD data for all 24 nodes provided as Supplementary Materials.

3.2. Total Sample Analysis

3.2.1. Eyes Closed

The only statistically noteworthy correlation was found between CDRT and absolute gamma power for FP1 (N = 100; r = −0.249, p = 0.013) across the total gamma range, but not for any other EEG sites. This result did not, however, survive FDR correction (FP1 and FP2 across the total gamma range, 48 tests). FP2 is functionally related to FP1, with cerebral asymmetry a known feature of neural processing in some species [54,63], and offers a comparison site with which to both check for artifact contamination and assess lateralization; therefore, comparative results are of interest. No notable correlation between CDRT and total gamma PSD was detected at FP2 (N = 100; r = −0.141, p = 0.163).
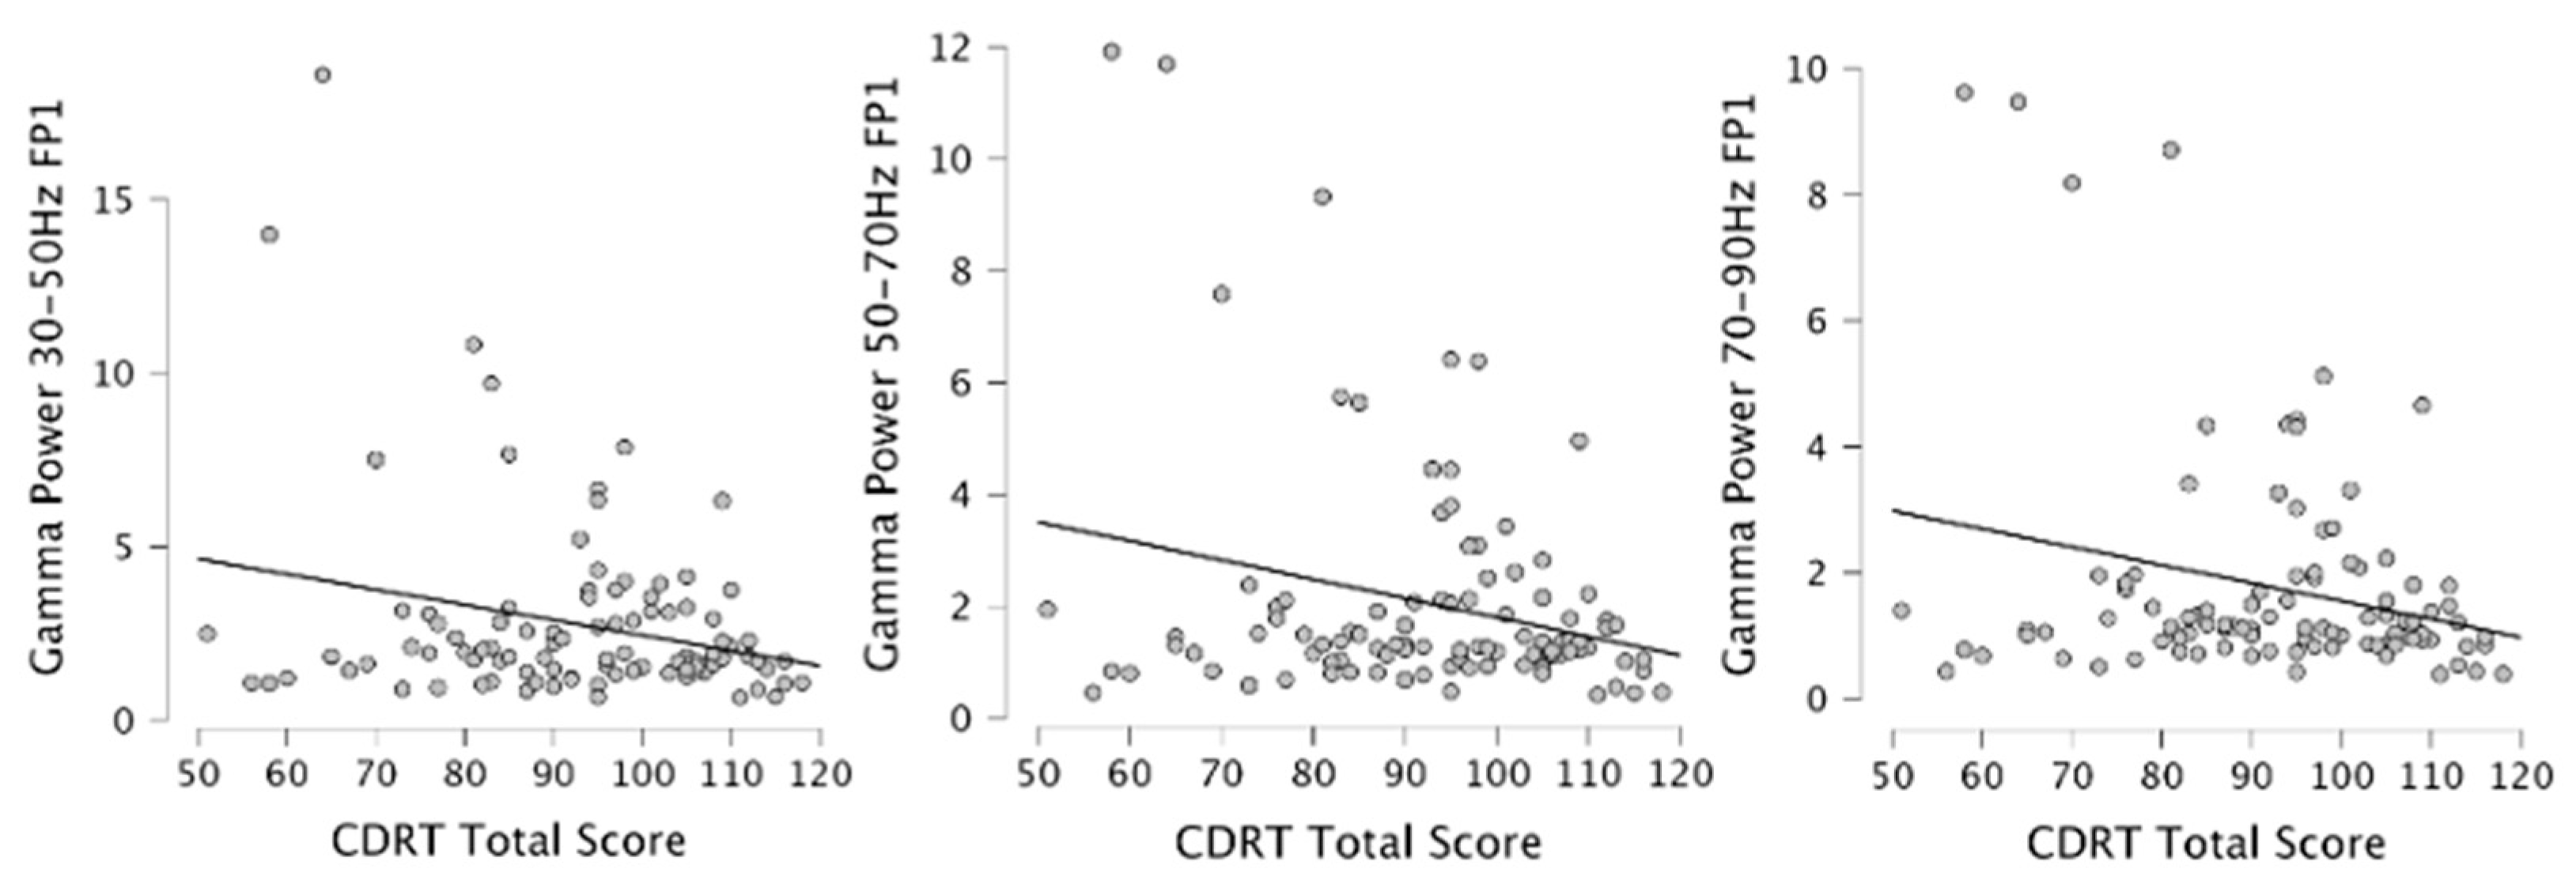
Having identified FP1 as the primary site of interest, a granular sub-band analysis across the frontopolar region (FP1 and its functional counterpart, FP2) was conducted to characterize the spectral profile and test for lateralization. Noteworthy results emerged when gamma PSD sub-bands were analyzed for the total population, as well as the LRI and HRI groups. Correlation analysis for the total sample (N = 100) under EC conditions identified several nominal associations between CDRT and frontal gamma power. Scatterplots further illuminate these characteristics, with consistently sporadic high gamma signals at the lower end of the CDRT scale and tight clustering of lower gamma signals at the high-resilience end (Figure 1).
Next, to account for the risk of Type I errors, a corrected Benjamini–Hochberg procedure, using a step-down rolling minimum constraint, was applied across the frontal region (FP1 and FP2 across five sub-bands, 10 tests). This analysis revealed that the inverse relationship between CDRTs and gamma power at FP1 is robust across the 30–90 Hz range. Specifically, the 50–70 Hz (p FDR = 0.043), 30–50 Hz (p FDR = 0.043), and 70–90 Hz (p FDR = 0.043) sub-bands all maintained statistical significance. Nominal p-values observed at 90–110 Hz did not survive the adjustment and are reported as exploratory trends (see Table 1). Further non-parametric analysis (Spearman’s rho) showed a similar trend and did not contradict parametric findings (see S4). An inverse relationship was detected across all five sub-bands in both parametric and non-parametric tests, providing confidence that the findings represent a genuine neurobiological trend rather than an artifact of isolated outliers. No significant or meaningful correlations between any of the gamma sub-bands and CDRT for FP2 were detected, suggesting ocular artifacts did not impact results while highlighting lateralization.

3.2.2. Eyes Open

No noteworthy correlations between CDRT, total gamma power or sub-bands were found at any EEG sites.

3.3. Sub-Band/Subgroup Analysis: Exploratory Trends

To further characterize neural signatures within a heterogeneous sample, participants were stratified into high-resilience (HRI) and low-resilience (LRI) subgroups. Due to the reduced power inherent in these subgroup cohorts, findings in this section are interpreted as exploratory trends based on nominal significance (p < 0.05) and meaningful effect sizes (r > 0.30). No significance was detected after FDR correction for any sub-band/subgroup matrix.

3.3.1. Eyes Closed

A medium (Pearsons r above 0.3) and negative relationship was found between CDRT and total gamma power at FP1 for the HRI group (r = −0.345, p = 0.137) although this association was not statistically significant. There was no noteworthy correlation between CDRT and total gamma power at FP1 for the LRI group (r = −0.185, p = 0.435). A meaningful and exploratory negative correlation was found between the CDRT and total gamma power at FP2 for the HRI group (r = −0.451, p = 0.046), but not for the LRI group at FP2 (r = −0.047, p = 0.844) (Table 2 and Table 3).
The HRI group had medium-strength negative correlations between resilience levels and gamma power expression at FP1 for the sub-bands 30–50 Hz (r = −0.375; 50–70 Hz, r = −0.383; 70–90 Hz, r = −0.343), but not for the higher gamma sub-bands (90–110 Hz; 110–130 Hz). Results did not survive FDR correction.
In the HRI group, high-frequency gamma (70–90 Hz) at the FP1 and FP2 sites demonstrated large inverse correlation coefficients (r = −0.343 and r = −0.465 respectively). In contrast, the LRI group exhibited no such relationship. This divergence suggests that the spectral signature across 30–90 Hz at FP1 identified in the total sample (N = 100) opens the possibility that different exploratory signatures may exist within the high-resilience cohort that warrant further investigation in larger samples with more diverse variables.

3.3.2. Eyes Open

A medium-strength but non-significant positive relationship was found between CDRT and total gamma power at P7 for the HRI group (r = 0.399, p = 0.082), but not for the LRI subgroup at P7 (r = −0.263, p = 0.262). To explore asymmetry effects, P8 was examined, but no meaningful or significant relationships were found between CDRT and total gamma PSD at P8 for either the HRI (r = −0.061, p = 0.799) or LRI (r = 0.027, p = 0.911) subgroups.
Positive and strong correlations were found at 70–90 Hz, r = 0.416; 90–110 Hz, r = 0.483, 110–130 Hz, r = 0.538), but not for 30–50 Hz (r = −0.176) or 50–70 Hz (r = −0.264) (Table 4); however, these did not survive FDR correction. The only meaningful correlation found for the LRI group was in the 30–50 Hz sub-band (r = −0.304). There was also a change in the direction of the correlation coefficient from the EC to EO condition. There were no significant or meaningful correlations for P8.
Under EO conditions, a clear demarcation emerged between resilience groups at the parietal P7 site. For the HRI subgroup, large positive correlations were observed in the high-frequency gamma range, specifically at 90–110 Hz (r = 0.483, p = 0.031) and 110–130 Hz (r = 0.538, p = 0.014). In contrast, the LRI cohort displayed weak, non-significant correlations at these same parameters. While these posterior associations did not survive group-level FDR adjustment despite the low power, the high effect sizes (r > 0.50) suggest a niche neurophysiological state unique to highly resilient individuals, potentially reflecting enhanced sensory-cognitive integration during active visual states.

3.4. ROI Testing

To supplement analyses, correlations between CDRT and PSD were measured using source localization to better determine the involvement of specific neuronal generators within cortical grey matter. Caution must be taken in interpreting these results without comparative subgroup testing. This aspect of the research provides only introductory experimental data, but findings help to develop a line of enquiry regarding the neural substrates involved.

3.4.1. Whole Brain Eyes Closed

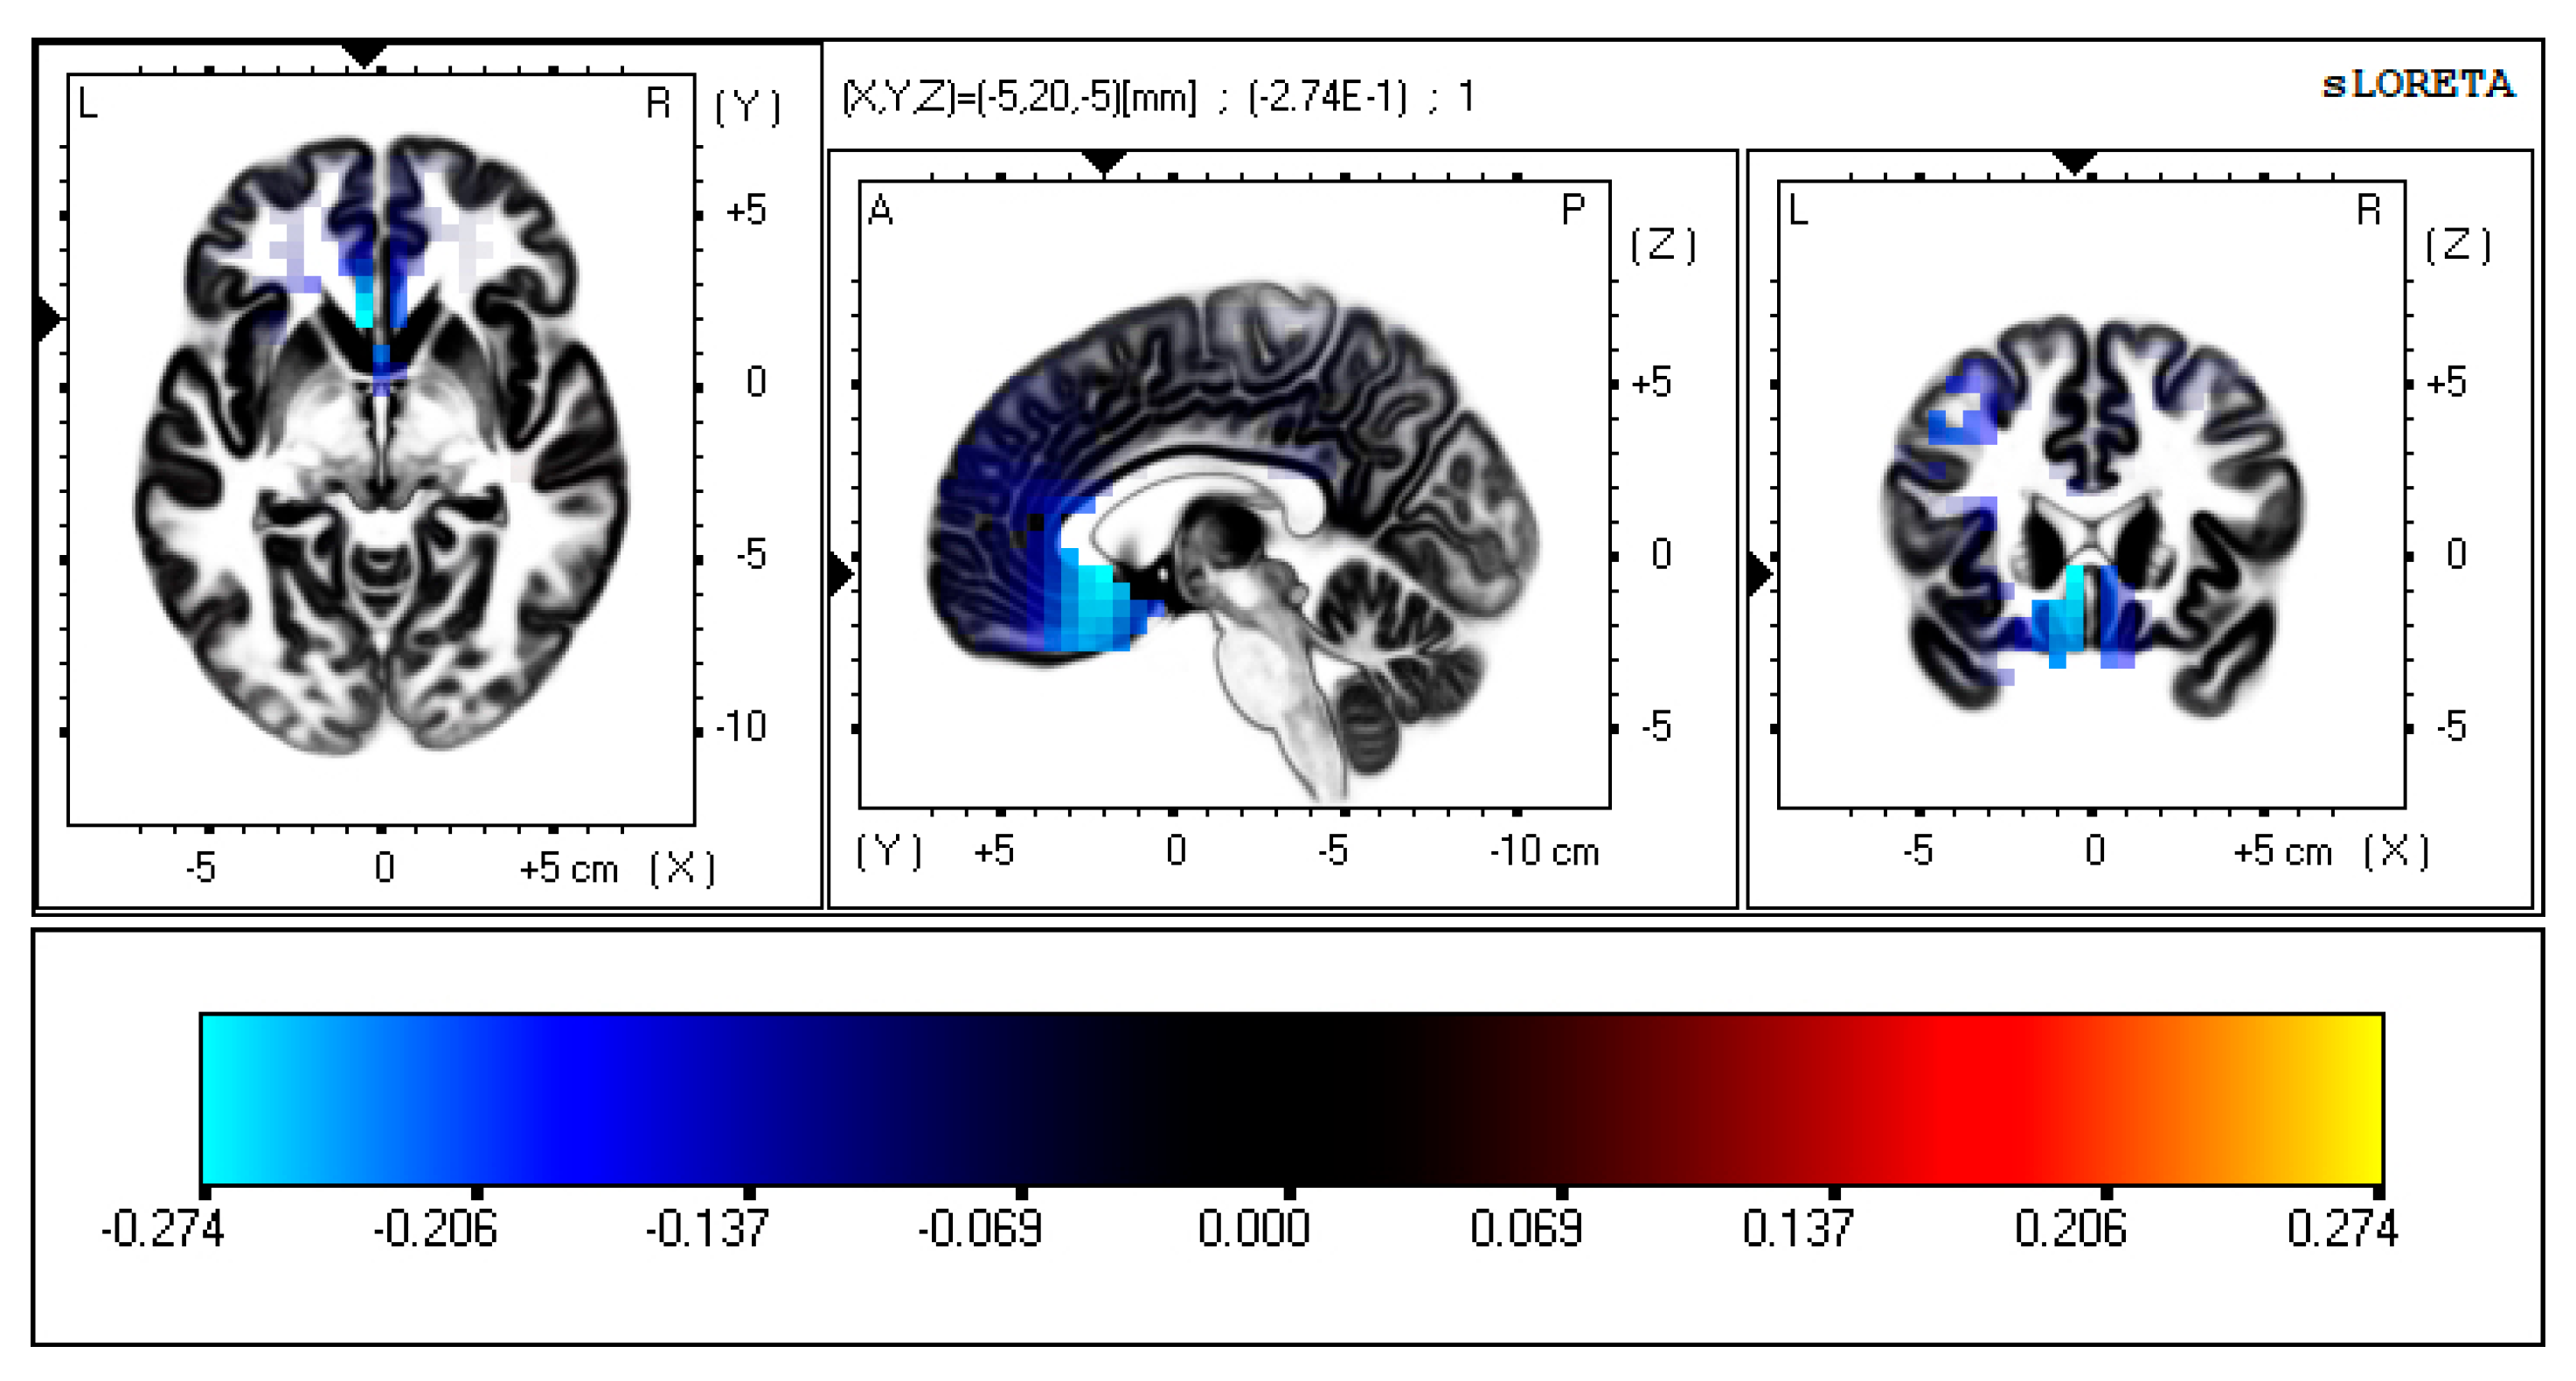
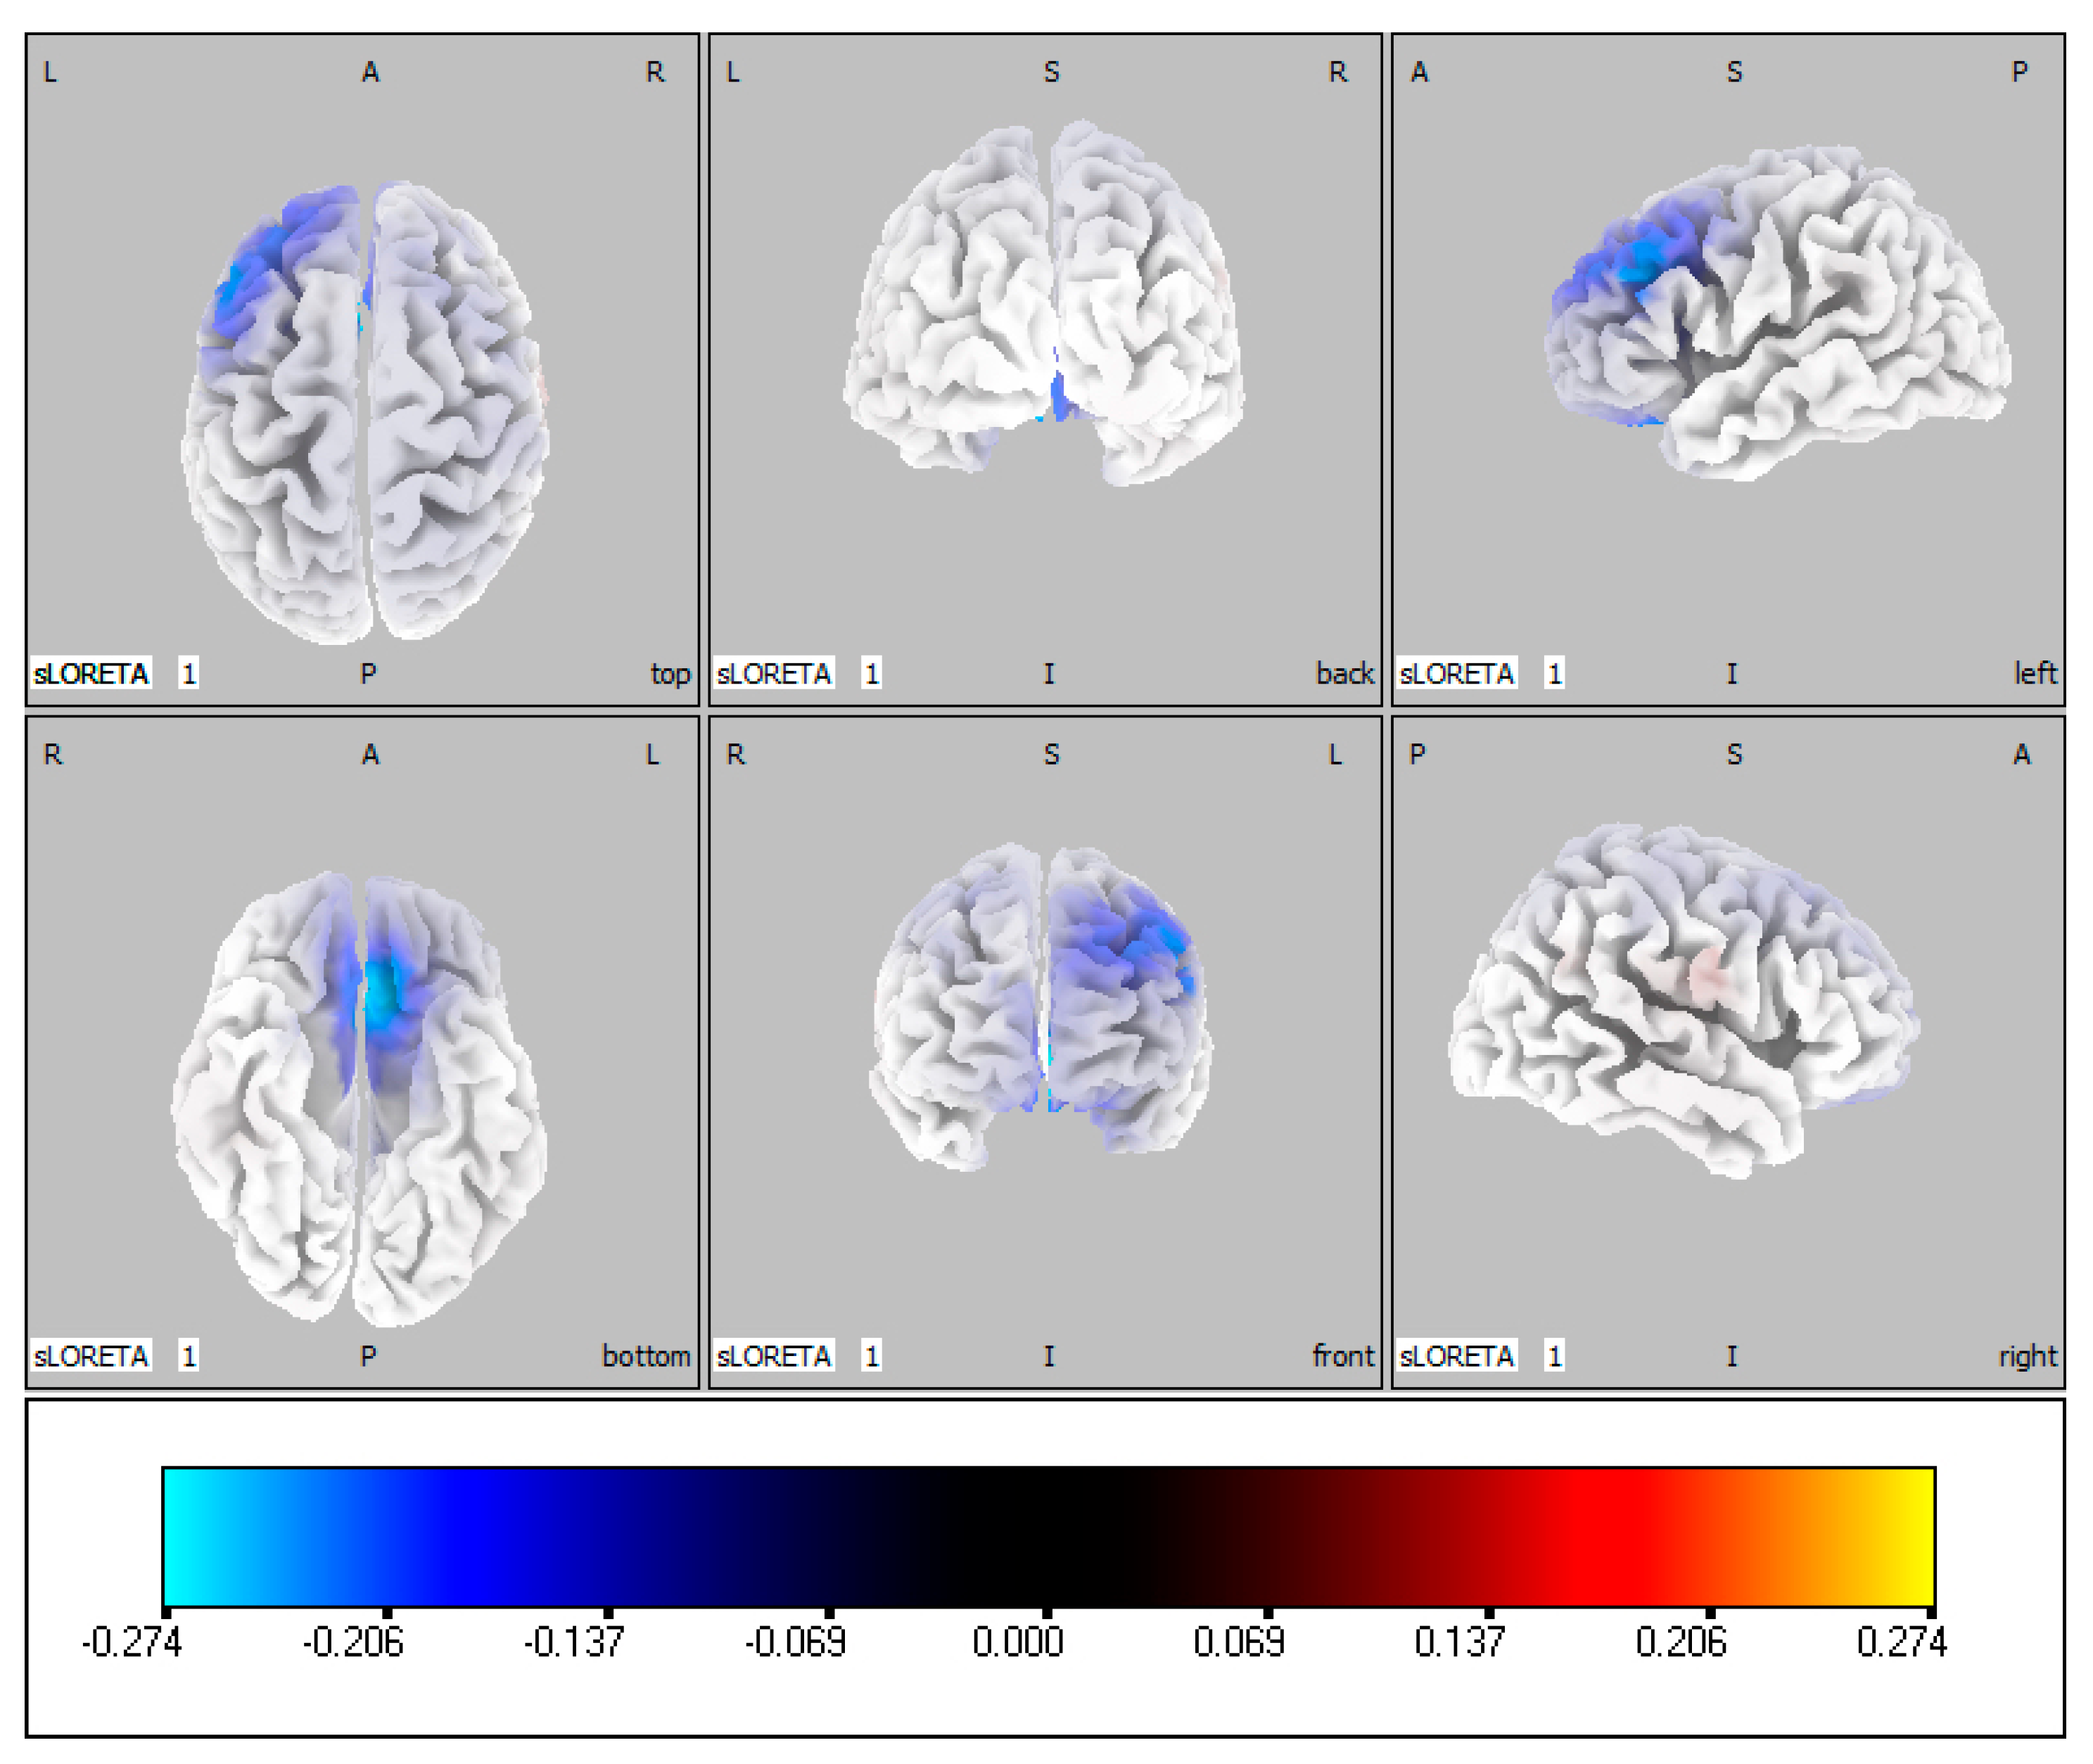
No noteworthy correlations were detected for any of the five gamma sub-bands during whole brain testing. A weak negative correlation (r = −0.274, p = 0.173) was found at 70–90 Hz across the left anterior cingulate (X −5; Y 20; Z −5) (Figure 2) which is thought to be involved in both the default mode and salience networks [64]. However, this result aligns with robust correlational data found within the same frequency band reported above. Source localization imaging provided a clearer view of the neuroanatomical structures involved (Figure 3) with oscillatory activity revealing cerebral locations recruited through gamma wave mechanisms.

3.4.2. Whole Brain Eyes Open

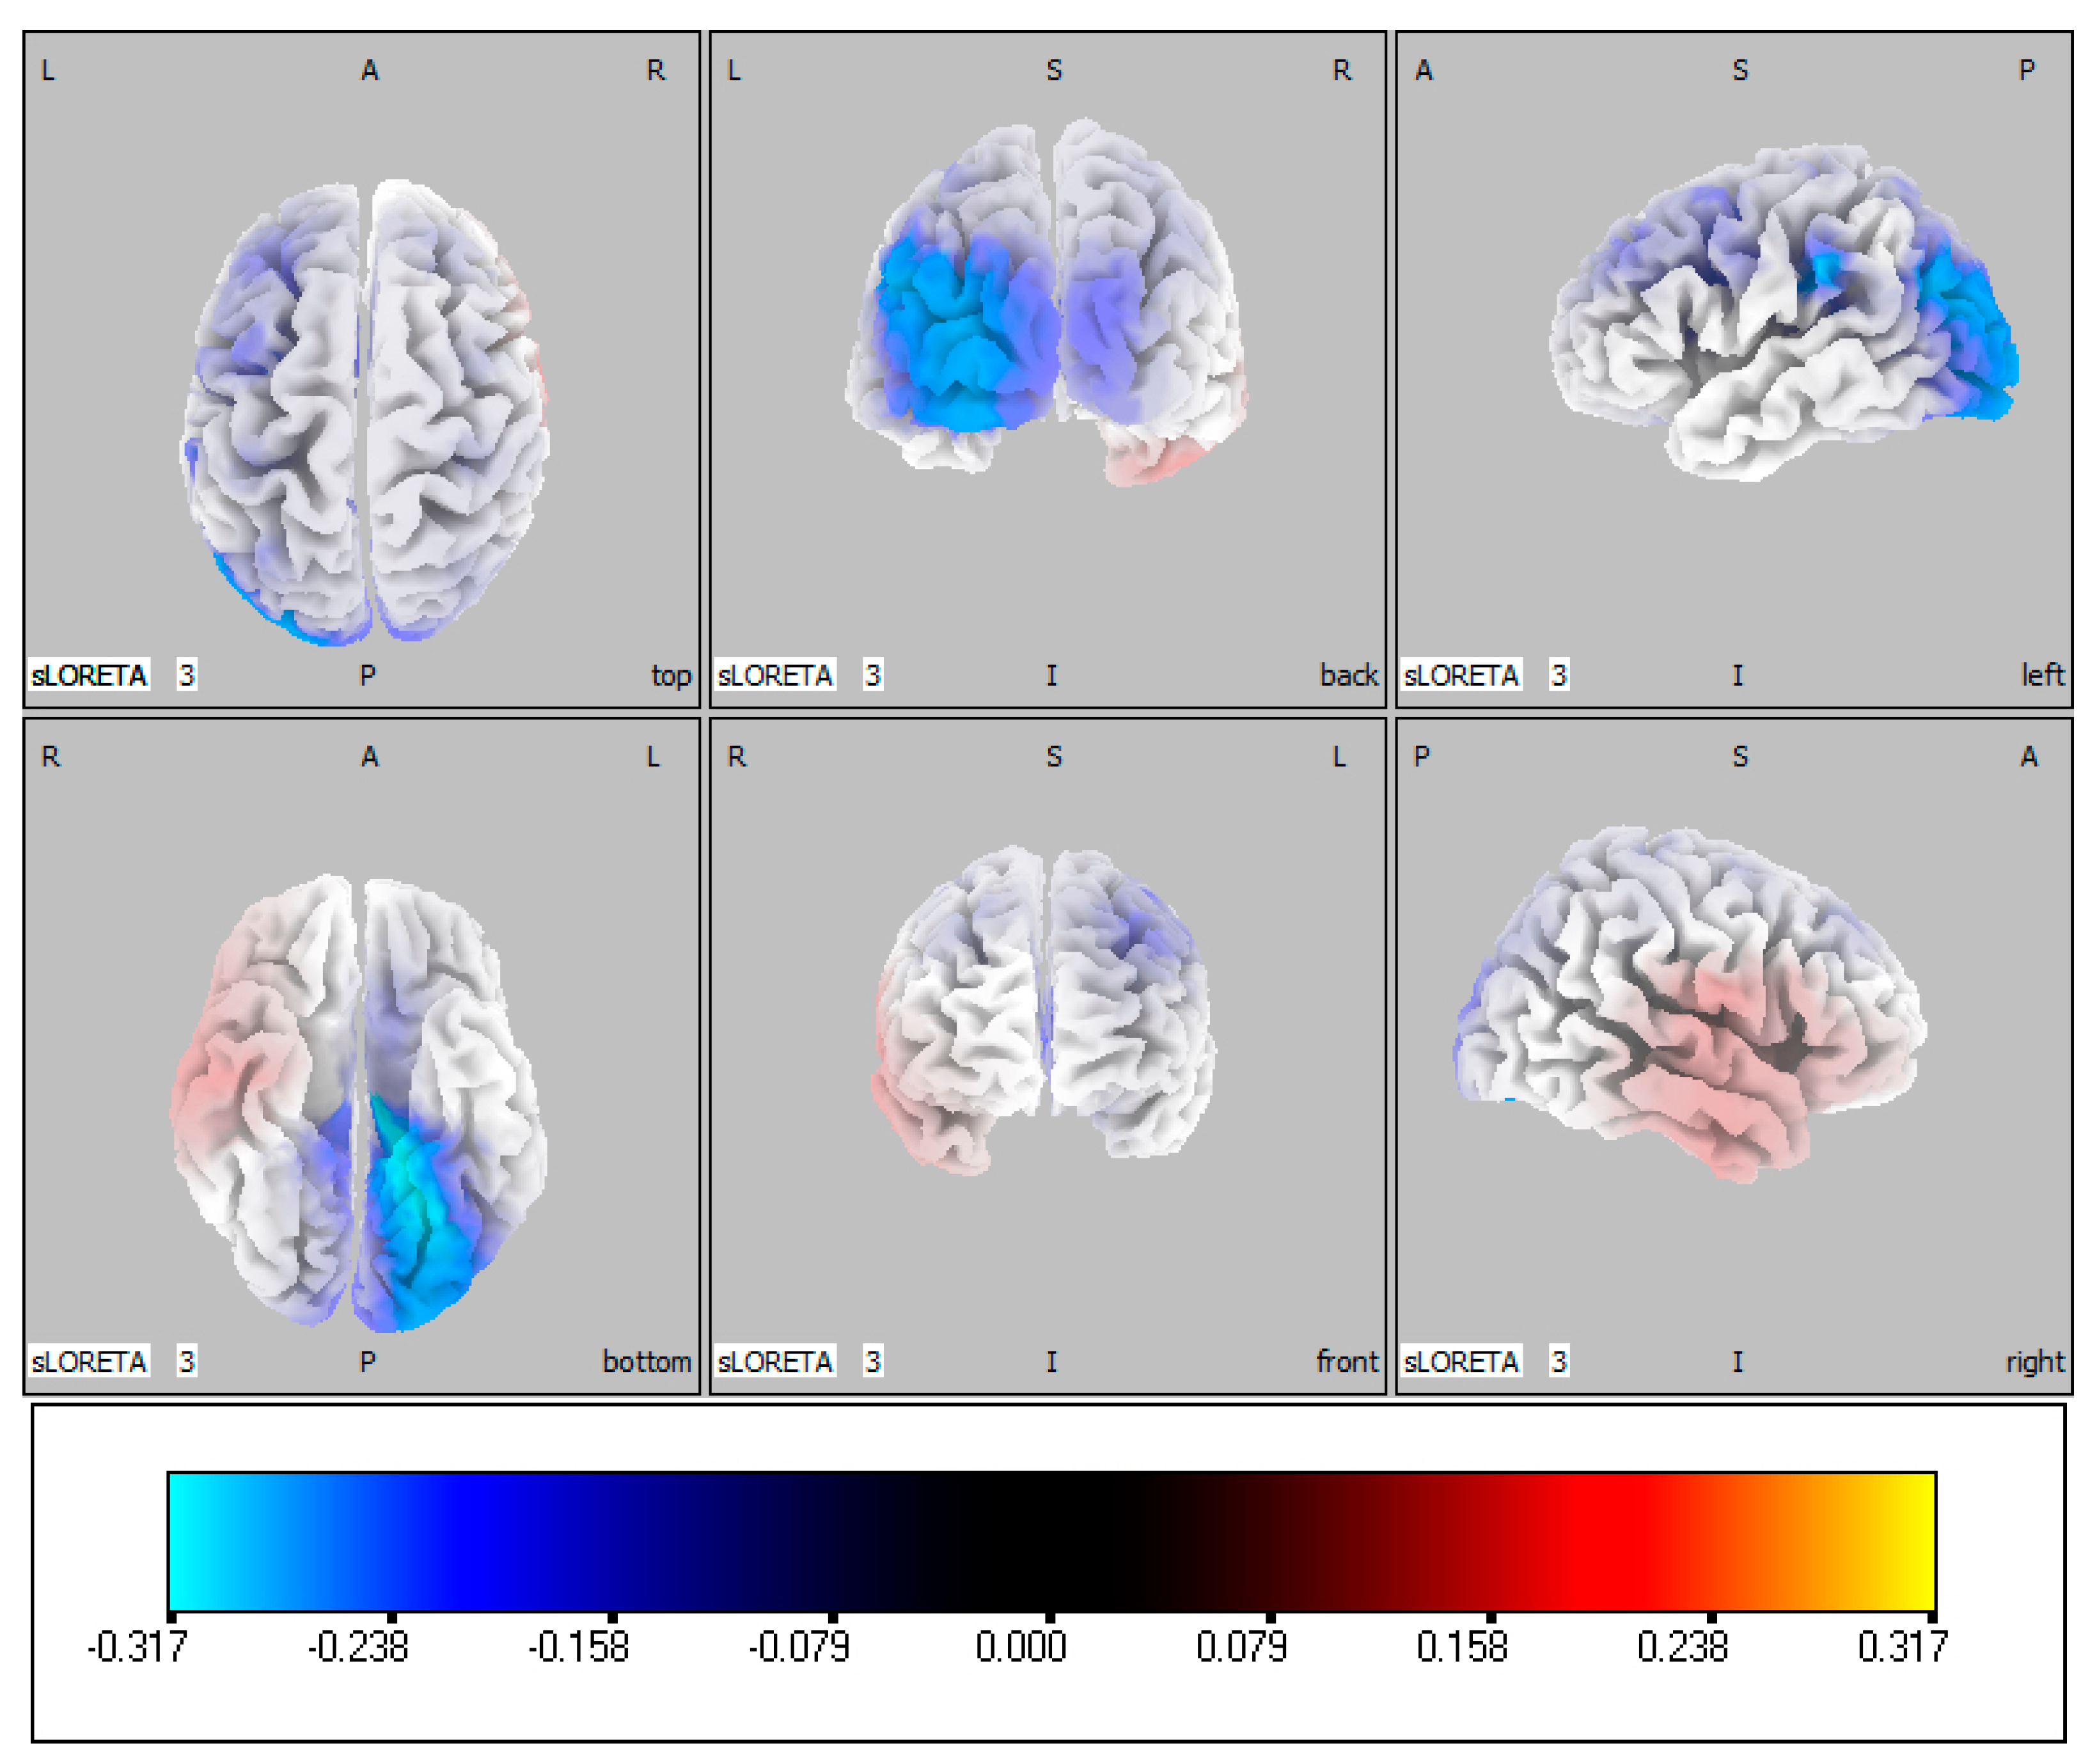
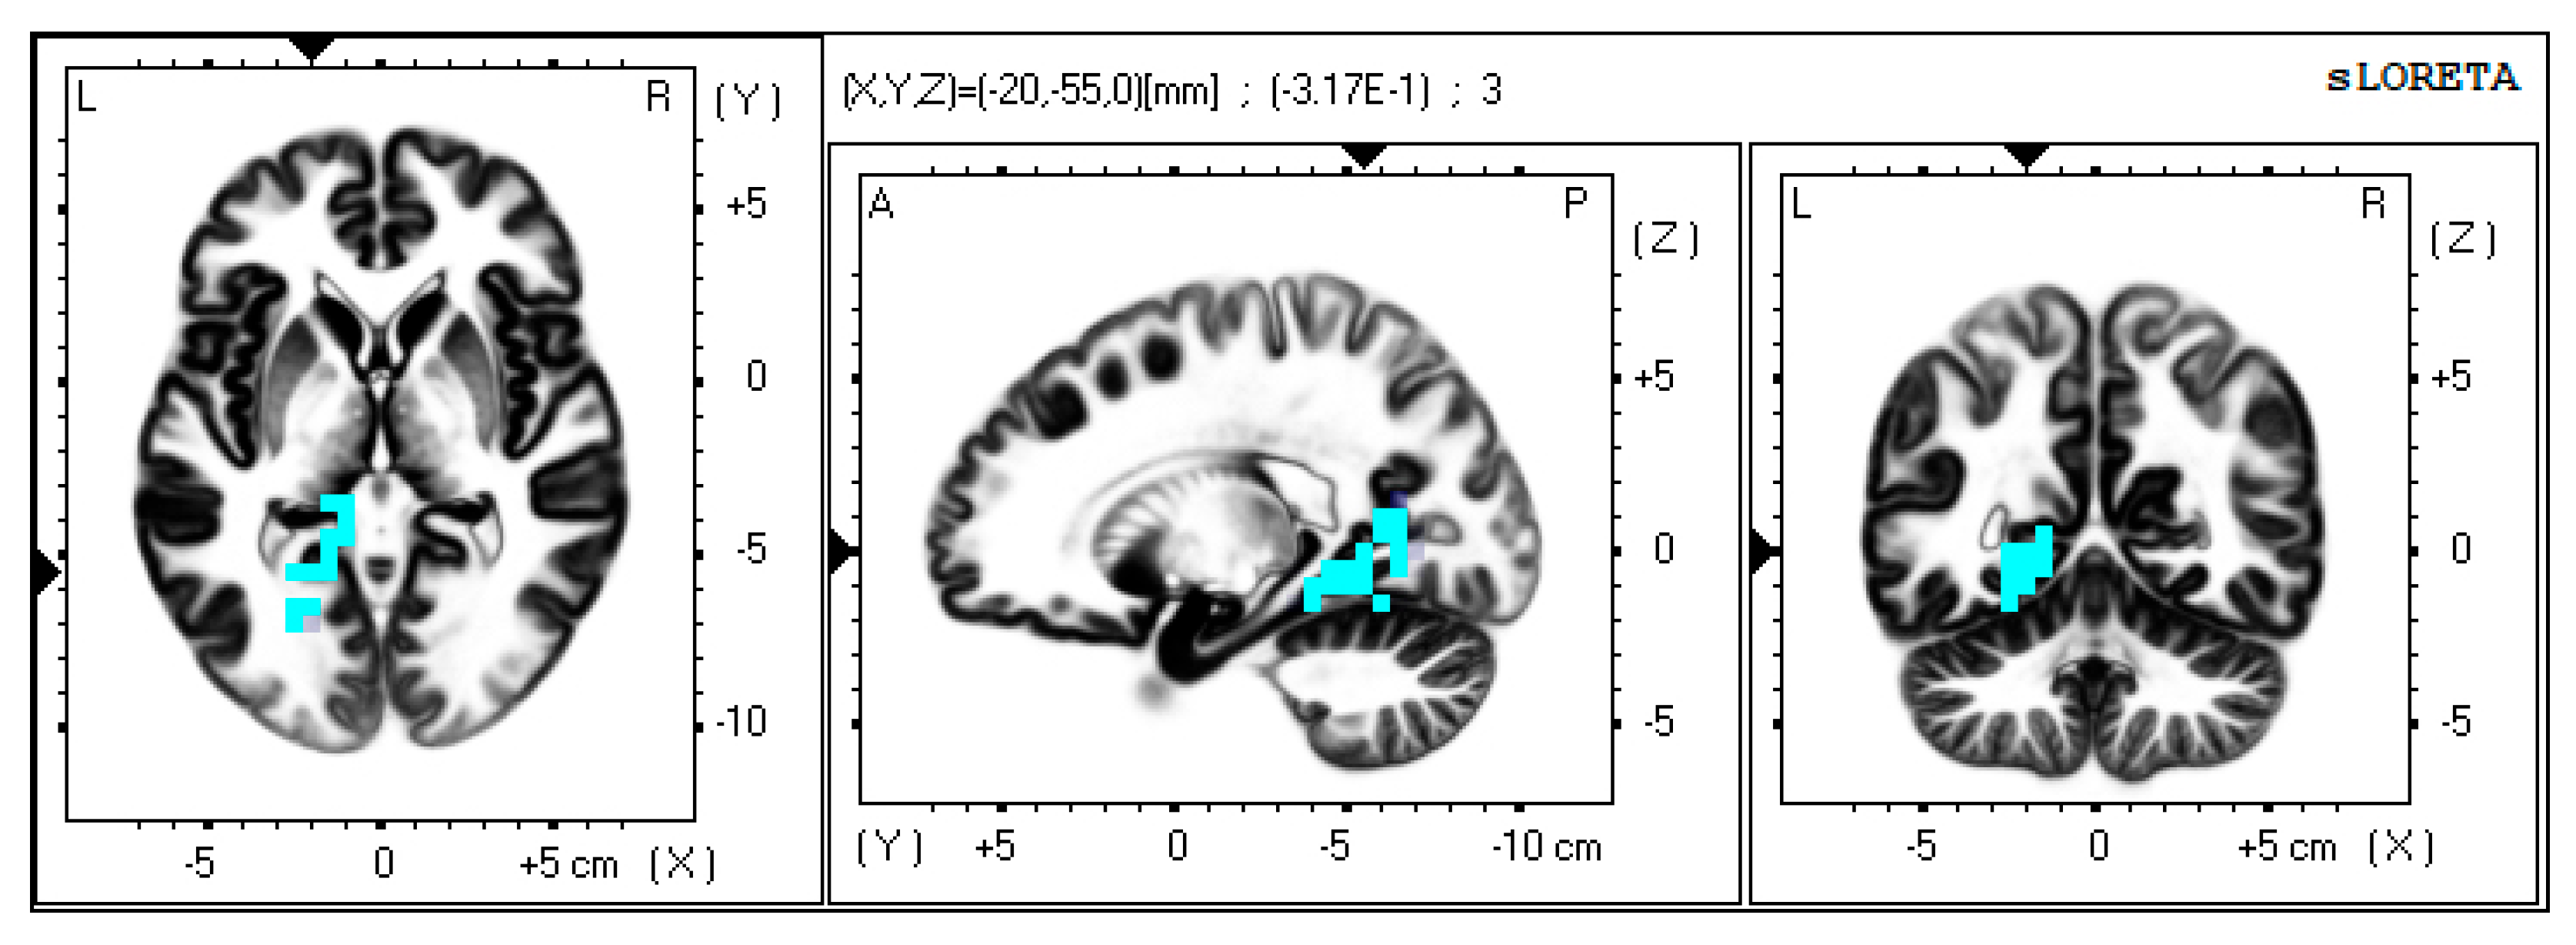
More meaningful results emerged under the EO condition. Similar negative correlations within most gamma sub-bands (30–110 Hz) were detected across multiple brain locations, particularly posterior and parietal sites associated with visual processing (Figure 4). The strongest inverse correlation (r = −0.317, p = 0.054) again appeared within the 70–90 Hz band, emanating from cortical sites at the left lingual and parahippocampal gyri (X −20; Y −55; Z 0) (Figure 5). These structures are known to be involved in spatial memory and visual discrimination [65], synthesizing information regarding location and site-specific context based on visible features. The identification of these ROIs linked to visual processing and memory formation, together with results gleaned under scalp electrode testing, allowed for hypothetical neural network involvement/s to be posited.
In addition, contrasting data that emerged under the different test conditions were noted. These data are consistent with a small but critical difference in terms of input, which occurred during the experimental procedure (eyes open vs. eyes closed). It can be assumed that cortical resources normally devoted to spatial, situational, and visual awareness were employed during EO conditions. Gamma wave activity would be expected to differ between EO and EC. The subsequent detection of a negative correlation between gamma wave PSD, ROIs and CDRT with a change of input suggests that an alteration in neural signaling had occurred. This concurs with theoretical positions that have linked fluctuations in gamma PSD with variations in neural populations [35] owing to cognitive demand, further supporting the relevance of these experimental results.

3.4.3. Network Level Testing

Once the ROIs had been determined, prospective neural networks were hypothesized. Results indicated that cortical sites across frontal, parietal, temporal and occipital regions were correlated with CDRT. It was therefore hypothesized that a meaningful relationship between CDRT and gamma coherence would be found in either the default mode (DMN) or visual processing (VPN) networks, as these networks are associated with multiple cortical structures (especially the prefrontal and parietooccipital cortices) previously highlighted. The DMN involves brain regions most active when at rest, whilst the VPN is engaged during visual cognition and discrimination [62]. A further eLORETA analysis was therefore conducted to determine the correlation between CDRT and gamma wave coherence across these ROIs.
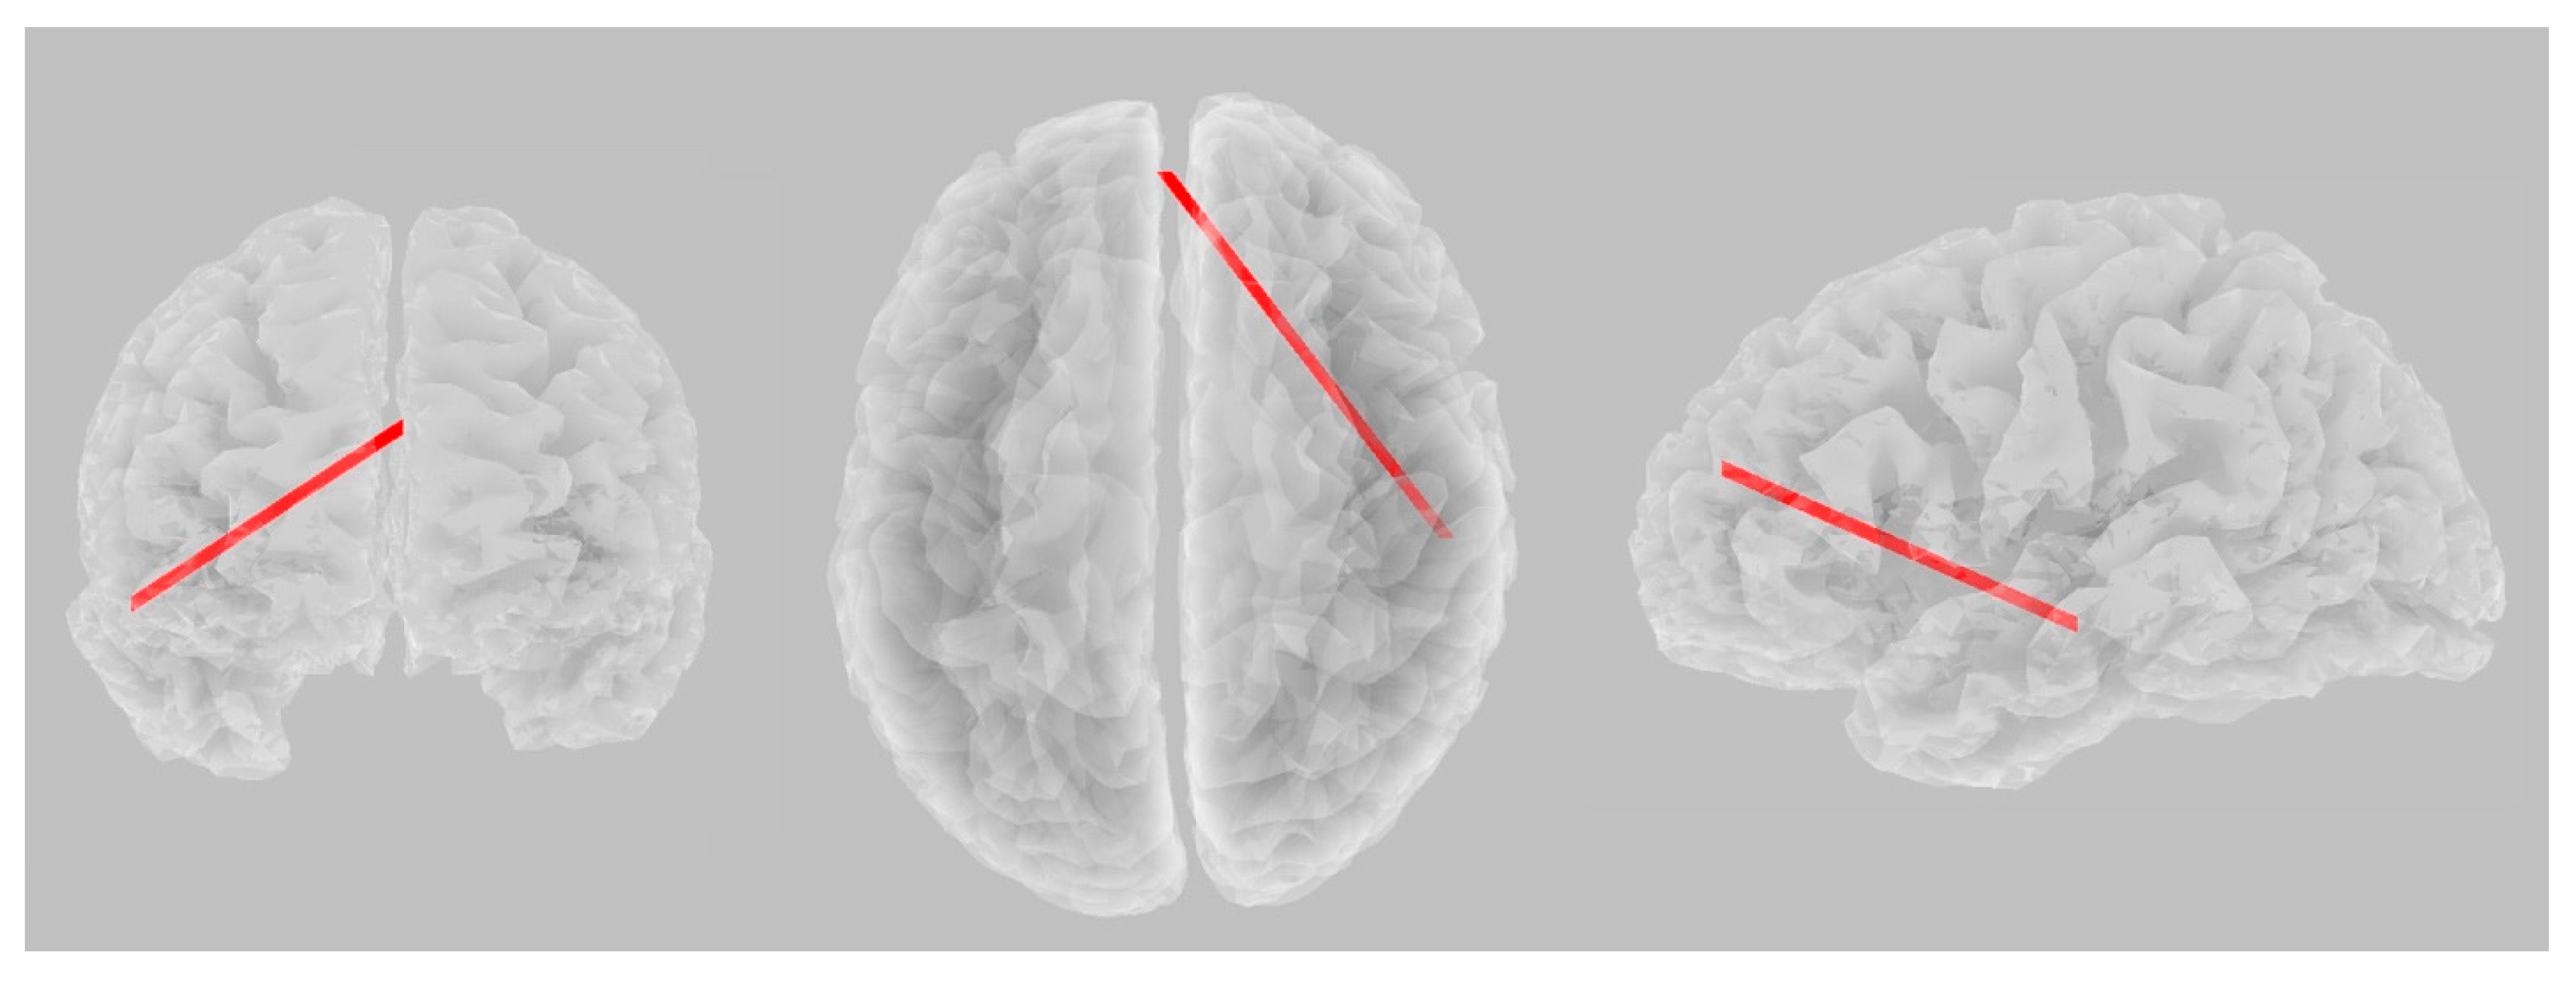
Functional synchronization connectivity was measured against CDRT to determine intra-network source location. A statistically significant positive correlation (r = 0.321, p = 0.019) was found in the 70–90 Hz band under EO conditions across the medial prefrontal cortex and right inferior temporal gyrus (Figure 6). Both sites are known nodes of the DMN [64], indicating that cellular networks associated with the DMN can be correlated with CDRT, such that resilient individuals exhibit frequency-specific (70–90 Hz) coherence patterns across DMN nodes, suggesting that associated neural efficiency may involve a specialized integration of resting-state networks and may therefore contribute to cognitive processing in resilient individuals. Furthermore, the emergence of a significant result in only one sub-band suggests unique characteristics attributable to the 70–90 Hz sub-band that warrant further empirical investigation.

4. Discussion

4.1. Summary of Findings

Our results identify a statistically robust, frequency-specific oscillatory signature across the 30–90 Hz spectrum at the left frontopolar site (FP1), providing data to indicate that meaningful relationships between gamma activity, resting-state EEG and PR are detectable, with effects evident at frontal and parietotemporal scalp sites (FP1, FP2, P7). Correlational indices were greater among highly resilient individuals, suggesting that an exploratory gamma-derived profile of resilience may be achieved. By examining clearly defined dichotomous groups (high versus low resilience), better characterization of resilience-related neural signatures could emerge. These data provide pilot insights for further investigation.
Although not robust to FDR correction, higher levels of resilience were associated with lower frontal gamma activity at rest, especially under EC resting-state conditions, which may eventually inform a clinically relevant psychobiological framework with which to assess adaptive coping mechanisms [66,67] and neural network stability [56]. To ensure statistical rigor, FDR correction was applied to the frontal region as a discrete unit of analysis (FP1 and FP2 across five sub-bands). Under these conservative parameters, the 30–90 Hz band at FP1 returned the only statistically robust correlates of resilience. While nominal associations were observed elsewhere, these did not survive the multiple-comparisons adjustment and are therefore interpreted as exploratory trends.
Furthermore, inverse correlations between CDRT and gamma activity were detected across several brain regions (EO) and found to be positively correlated in terms of coherence with CDRT at a network level. The strength and direction of relationships varied across gamma sub-band frequencies, leading to the preliminary finding that gamma wave activity across certain brain sites and within specific frequency sub-bands may be associated with PR. Significant activity at 70–90 Hz was observed at each experimental step, highlighting the possibility that this frequency range is related to PR in complex and, as yet, unknown ways. These limited outcomes require some comment, as findings highlight this range as a primary putative neurophysiological marker for this pilot sample. Although restricted to just a few of the conditions and EEG sites, these initial results provide a hypothesis-generating platform from which to investigate more precisely how gamma activity is related to PR.
After stringent ocular saccadic peak and EMG control, as well as comparing for confounding output at adjacent frontal nodes, frontopolar gamma activity is interpreted as a putative cortical marker consistent with PFC network excitation–inhibition balance. A defining feature of these data is the robust spectral consistency observed at the left frontopolar site (FP1), where three contiguous sub-bands (30–50 Hz, 50–70 Hz, and 70–90 Hz) demonstrated significant inverse correlations with resilience. In contrast, no significant associations survived correction at the right frontopolar site (FP2). This lateralized effect suggests that psychological resilience may be characterized by a specialized neurophysiological cluster of markers within the left hemisphere’s frontal regulatory circuits. The absence of significant correlations at the homologous FP2 site, despite the robust significance at FP1, serves as both a biological control against diffuse ocular artifacts and a confirmation of the lateralized nature of the resilience signature.
Furthermore, this left-hemisphere lateralization provides an intriguing parallel to the literature on Frontal Alpha Asymmetry (FAA), where left-sided dominance is often associated with approach-related motivation and successful stress adaptation [54]. However, the discovery of a broad-band (30–90 Hz) gamma signature may provide a more granular view of this mechanism. While prior studies have viewed gamma as a global proxy for mental workload, our site-specific results at FP1 suggest that resilience-related neural mechanisms are not a whole-brain phenomenon, but rather a localized property working in conjunction with whole brain or network-wide structures. Results reported elsewhere, while preliminary, have also implicated prefrontal gamma asymmetry as being involved in attentional and value-based selection [68]. This spectral and spatial consistency across the 30–90 Hz range provides compelling data to propose a putative neurophysiological signature of resilience, characterized by an optimized resting state linked with the adaptive flexibility necessary for sustained psychological equilibrium.
The resilience-related activity of 70–90 Hz power is the most statistically robust finding across the current study. The survival of this specific sub-band under conservative FDR correction for frontopolar nodes, while adjacent bands fell to exploratory status, as well as its detection during source-localization analysis, suggests a unique neurobiological role for 70–90 Hz oscillations in terms of ‘adaptive flexibility’. This attenuated baseline power is proposed to either represent a putative neurophysiological marker of resilience or provide the framework for an interpretive hypothesis regarding optimized allostatic economy, potentially allowing for the flexible recruitment of higher-order cognitive resources characteristic of resilient individuals.
Test–retest and longitudinal studies are required to ascertain if results are non-trivial, together with comparison to source-localization data. Further investigation is needed to definitively elucidate any hypothesis-generating relationship between gamma activity and PR. While results are only indicative and include several limitations, further empirical enquiry is warranted.

4.2. Resting State, Eyes Closed

The robust inverse correlation at FP1 within 30–90 Hz suggests that highly resilient individuals exhibit decreased frontopolar gamma power during a resting baseline. The frontopolar cortex is believed to be the neurobiological site of human-specific cognitive processes involving insight, working memory, perception, and social cognition [36,69]. Whilst scalp EEG provides limited spatial resolution, these sites (FP1 and FP2) are typically ascribed to Brodmann areas (BA) 10 [70], 9 [54], 11, 32 and 46 [69,71], receiving electrophysiological inputs from adjacent neural structures. Furthermore, it has been established that gamma oscillations are most likely to emerge from local groups of neuronal assemblies [27,72,73] providing enhanced spatial data. Therefore, gamma wave activity across this region is likely to be associated with adaptive cognitive functions such as higher-order processing [74], planning [75], mood control [76] and decision-making [68]. Decreased gamma power at frontopolar sites could reflect down-regulated cognitive demand, enhanced psychobiological function [77] or efficient resource allocation (adaptive flexibility), among highly resilient individuals [78].
Whereas prior research suggests that decreases in gamma oscillatory amplitude may be indicative of neurodegenerative conditions [33], behavioural disorders [32] or the presence of neural deficiencies [25], here reduced gamma power may highlight neural functions related to PR under resting-state conditions, perhaps indicating beneficial top-down inhibitory control associated with adaptive emotion regulation [11], although these conclusions are speculative. Results align with prior findings linking decreased gamma power to more efficient cognitive resource allocation [27,79] as well as recent work attributing low resilience with decreased decision-level fusion within the workplace [55]. The 70–90 Hz band has been linked to active cognitive workload and sensory integration, such that suppression may reflect enhanced neural efficiency or superior top-down inhibitory control [11,79]. Rather than indicating any deficiency, this attenuated gamma power likely indices an optimized “idling” state, where cortical resources are conserved during rest to allow for rapid recruitment during acute stress (allostatic flexibility).
While potential for artifact- or neurochemical-dependent confounds must be acknowledged, the variations in gamma amplitude observed across sample groups may index processes of selective attention, information transfer, and emotion selection which are consistent with convergent neuroimaging studies reported elsewhere [8,64,80]. Together, these results suggest a potential substrate for flexible adaptation that may be characteristic of PR. This has important potential clinical applications. Frontal gamma oscillations are integral to affective control, combining inputs from limbic and cortical circuits [81]. The observed pattern suggests that individuals with high resilience may engage fewer cortical resources to maintain resting equilibrium, indicating beneficial allostatic regulation. Examining coherence and connectivity patterns through synchronization [82], and cross-frequency coupling [83] may clarify whether gamma suppression reflects network integration or inhibitory gating processes contributing to PR.

4.3. Resting State, Eyes Open

Noteworthy associations were found under EO conditions, with detectable effects at P7 for the HRI subgroup. While these results are underpowered and lack task-based validation, they offer some exploratory insights. P7 has been linked to neural activity across the inferior and superior lateral cortex, mid-temporal gyrus and left BA 19 [70,84,85]. Importantly, these cortical regions connect neural structures known to be involved in visual processing [86], as well as parts of the default mode network [64,85], which are activated when eyes are open but not closed. This input change was also reflected in the direction of the correlation coefficients, with a medium positive correlation at P7 emerging in the HRI subgroup.
While the positive correlations at P7 and the relationships in the lower gamma sub-bands did not survive FDR correction, they provide a valuable hypothesis-generating context. The shift from inverse frontal correlations (EC) to emerging positive posterior trends (EO) reflects a state-dependent characteristic that warrants further investigation. These exploratory indices suggest that the relationship between gamma activity and resilience is likely a dynamic, whole-brain phenomenon that exceeds discrete localized power measurements.

4.4. EEG-Derived Correlates and Levels of Resilience

The incidence of any meaningful relationship was mostly restricted to the HRI subgroup. High resilience was associated with decreased gamma activity at two EEG sites during EC testing, and this correlation became positive when eyes were opened. Findings support data provided elsewhere that suggest HRI participants may demonstrate different and detectable neural characteristics from their LRI counterparts [80,87,88]. These comparator studies defined resilience levels as above or below the mean, whereas the current investigation examined resilience levels based on percentiles of the total score, leading to the association of specific spectral characteristics with the resting-state profile of resilient individuals.

4.5. From EEG Nodes to Neural Networks

Multimodal EEG approaches provide robust frameworks for identifying neurophysiological markers of resilience [5,87,89]. By transitioning from localized scalp recordings to eLORETA-based functional connectivity, this study captured network-wide dynamics extending beyond discrete anatomical structures. Functional connectivity maps generated from FP1, FP2, and P7 seeds revealed associations between gamma-band activity and CDRT scores at frontocortical and parietotemporal regions, particularly the right inferior temporal and left lingual gyri.
Notably, a medium-strength negative correlation (r > 0.3) emerged between the CDRT and total gamma power in the left lingual and parahippocampal structures during EO conditions. While elevated gamma power is usually thought to index a high mental workload, cognitive arousal, or anxiety-driven social interpretation [30,42], the inverse relationship observed here suggests that a more nuanced interpretation is required. Resilience is potentially characterized by non-reactive, efficient cognitive processing, such that decreased gamma activity might be indicative of context-appropriate cognitive control. Though speculative, this reduction in gamma power may reflect the “neural efficiency” associated with mental composure or equanimity [90].
Furthermore, a positive coherence correlation (70–90 Hz) across sites associated with the default mode network (DMN) was detected during EO conditions. This suggests the possibility that resilient individuals exhibit distinct high-frequency organization within resting-state networks, potentially related to top-down emotion regulation and a sense-of-safety [91]. The most compelling aspect of these data is the spatial and spectral consistency of the 70–90 Hz band across all levels of analysis. Even with rigorous statistical corrections, the 70–90 Hz range remained in focus, surviving FDR correction, being identified as the strongest ROI correlation across parahippocampal structures and displaying significant positive coherence across the MPFC and rITG.
This convergence across nodal, source, and network-level analyses, despite the conservative thresholding, advances our hypothesis-generating framework. An alternate but not conflicting hypothesis may be that fluctuations in gamma activity are linked to bi-directional measures of cognitive arousal, such that decreased levels of gamma activity across key neural structures indicate decreased cognitive effort associated with mental rest, while increases in power occur when there is a condition-specific demand. These preliminary findings, though limited in application to hypothesis formation, highlight gamma-band dynamics as putative neurophysiological markers for clinical stability, where attenuated power acts as a proxy for sustained mental calm, cognitive or emotional control, and adaptive network flexibility.

4.6. Findings in 70–90 Hz Range

The functional significance of the 70–90 Hz sub-band is increasingly recognized across high-resolution electrophysiology. While traditional EEG studies often group the entire gamma spectrum, recent reviews advocate for the precise delineation of ‘high gamma’ (~60–100 Hz) as a distinct and individualized neurobiological signal [92]. Crucially, foundational work by Darvas et al. (2010) [92] has demonstrated that high-frequency gamma power can be localized from scalp EEG, providing spatial mapping that may be comparable with intracranial recordings. Furthermore, Gaona et al. (2011) [93] hypothesized that high-gamma oscillations could provide superior anatomical specificity compared to lower- frequency oscillations, a finding that supports the observation of a localized 70–90 Hz signature at the frontopolar FP1 site. By focusing on this specific high-frequency window, data captures a narrow-band oscillatory state that may provide deeper insights into cortical excitation/inhibition (E/I) balance, providing more granular delineation than broader spectral averages [94,95].

4.7. Methodological Challenges in Gamma-Band Analysis: Beyond Spectral Power

Current literature linking gamma oscillations to cognitive processes relies heavily on Power Spectral Density (PSD), an aggregate measure of neural activity that often yields discordant findings. Elevated gamma power is identified across a paradoxical range of states, including high-demand cognitive processing [25], social bonding [45], major depression [32], and advanced relaxation [39], whereas decreased gamma power has been linked to neuropathological decline [33]. Such divergence suggests that spectral power shifts may not represent discrete cognitive events but rather reflect underlying neuromodulatory dynamics, neurochemical interactions, or aperiodic signal features [27,96].
Mechanistically, gamma oscillations emerge from rhythmic neural spiking and synaptic excitatory/inhibitory balances, characterized by low amplitude, synchrony, and stochastic expression [23]. These signals derive from both endogenous (spontaneous) sources and exogenous periodic stimuli capable of triggering frequency-generating mechanisms via entrainment [25,47]. Consequently, the complexity of these signals, including both periodic and aperiodic components, necessitates careful extraction protocols together with a nuanced interpretive approach.
To resolve existing empirical contradictions, research should include granular sub-band delineation and the comparison of global PSD with single-trace recordings, source-localization and multimodal data in an effort to capture stochastic neural dynamics [27]. Furthermore, analytical frameworks able to embrace the inherent variability of gamma signaling are required, treating outlier electrophysiological events as anticipated phenomena rather than statistical noise [47]. Such methodological rigor is essential for establishing gamma activity as a reliable neurophysiological marker in clinical psychiatry.

4.8. Limitations and Future Directions

Following similar EEG-based studies [14,54,97], this research made several novel contributions. First, preliminary data for the role of gamma oscillations in resilience were provided, with a focus on robust correlational indices between scalp recordings, source-localization and psychometric data. Second, distinct neural profiles in high resilience individuals were suggested, perhaps indicating that gamma activity may serve as a putative neurophysiological marker for adaptive functioning. Most notably, a compelling signal in the 70–90 Hz range was detected.
Several limitations must be acknowledged when interpreting these pilot data. First, the cross-sectional design precludes any inferences regarding the causality of the observed relationships; it remains unclear whether attenuated frontopolar gamma power is a prerequisite for or a consequence of the development of psychological resilience. Second, while our total sample was adequately powered for nodal analysis, our subgroup comparisons are inherently underpowered and can only provide insights toward further investigation. Consequently, the large effect sizes observed at the P7 site are reported as exploratory trends to guide future hypothesis generation.
Third, although we utilized a rigorous artifact control pipeline—including EOG-verified ICA and the FASTER algorithm—high-frequency gamma oscillations (70–130 Hz) remain inherently vulnerable to contamination from myogenic signals and microsaccades. While our comparison of FP1 and FP2 suggests a localized neurobiological signal, future studies should consider incorporating simultaneous EMG or gaze-tracking for enhanced signal isolation. Finally, as these data were collected during a resting-state baseline, they may not fully capture the dynamic oscillatory shifts associated with acute stress exposure or active cognitive-behavioral regulation.
Nonetheless, the current study provides a baseline for further investigation of the role that gamma oscillations play as potential neurophysiological markers of PR as well as targets for neurotherapeutic interventions. To date, decreased gamma oscillations have been generally associated with neural dysfunction across most contexts and populations. Additional longitudinal and mechanistically focused studies are required to profile a consistent set of neural characteristics that define high versus low levels of resilience. Comparing CDRT and other psychometric measures with narrow-band gamma frequencies and biometric data could provide a more detailed understanding of how gamma characteristics relate to mental health, with efforts made to measure HRI as a stand-alone population to determine if any characteristic gamma profile does exist. This, in turn, could support clinical efforts to prevent psychological maladaptation or identify effective coping strategies through the provision of quantitative markers of intervention efficacy. In addition, objective biomarkers are required to link allostatic measures with contextually derived adaptive cognitive responses, and future research should decompose gamma signals into their constituent aperiodic components to further refine any person-centric hypothesis.
The definition of high and low resilience in this study was based on a self-reported scale, which has the potential for bias [11]. In addition, results were derived from a single timepoint, which may confound data by failing to reflect variations due to circumstance [2]. More reliable results are likely to emerge through a broader temporal analysis, including efforts to determine whether results can be replicated in another sample cohort, or within the same sample over time. Combining additional metrics, such as a clinician interview or biometric data, is likely to improve validity. Other measures of resilience and well-being [97] may also be included to provide a more complete view of what constitutes mental health [11]. Furthermore, this sample included volunteers from one geographical and cultural environment so that results may in some ways be localized, perhaps reflecting unknown gamma-related characteristics due to population idiosyncrasies. Nevertheless, these limitations do not diminish the need for more detailed empirical analysis to maximize generalisability.
This multimodal EEG pilot study identifies a frequency-specific oscillatory signature in the 30–90 Hz band as a putative neurophysiological marker of psychological resilience. Following stringent FDR correction, the frontopolar FP1 site emerged as a statistically robust anchor, suggesting that highly resilient individuals may maintain an optimized “neural efficiency”, perhaps indicative of allostatic economy during a resting-state baseline. Findings demonstrate that lower frontopolar power in this specific sub-band, complemented by frequency-matched coherence across DMN nodes could be involved with the adaptive flexibility necessary for psychological equilibrium. While the posterior associations observed during EO conditions require further validation in larger task-based cohorts, the spectral consistency of the 70–90 Hz band across nodal, source, and network levels provides a compelling framework for future research. Collectively, these data suggest that targeting high-frequency neural integration may offer a novel pathway for assessing and potentially enhancing human resilience in the face of psychological adversity.

5. Conclusions

As Connor and Davidson [7] recognized, healthy neural function is fundamental for resilience and emerges from situational adaptation. The ability to maintain or regain mental stability despite adversity is considered a dynamic construct that may depend upon context-dependent psychophysiological mechanisms operating within a suite of modulatory responses. Appropriate measures able to capture these transient features are required to investigate the biological foundations of mental health. If, as is suspected, gamma rhythms do modulate allostasis, cognitive and emotion regulation, then their (dys)function must impact PR and related psychological functions.

Supplementary Materials

The following supporting information can be downloaded at: https://www.mdpi.com/article/10.3390/psychiatryint7040153/s1, Supplementary Material (S1) Correlational Data Eyes Closed Total Gamma Range (30–130 Hz) and sub-band analysis with p FDR Correction (N = 100), Supplementary Material (S2) Correlational Data Eyes Open Total Gamma Range (30–130 Hz) and sub-band analysis with p FDR Correction (N = 100), Supplementary Material (S3) Variance based on Age and Gender, Supplementary Material (S4) Correlational Comparisons at FP1 Frequencies of Interest, Supplementary Material (S5) Comparative Scatter Plots for FP1, Supplementary Material (S6) Mean Gamma Band Power at Each Electrode.

Author Contributions

Conceptualization, D.R.; investigation, D.R.; writing—original draft preparation, D.R. and C.S.; writing—review and editing, D.R., C.S. and I.E. All authors have read and agreed to the published version of the manuscript.

Funding

This research received no external funding.

Institutional Review Board Statement

The study was conducted in accordance with the Declaration of Helsinki, and approved by the University of New England Human Research Ethics Committee (protocol code: HE14-051 and date of approval: 24 March 2014).

Informed Consent Statement

Informed consent was obtained from all subjects involved in the study.

Data Availability Statement

The data presented in this study are available on request from the corresponding author. The data are not publicly available due to ethical/privacy issues.

Conflicts of Interest

The authors declare no conflicts of interest.

References

  1. Babić, R.; Babić, M.; Rastović, P.; Ćurlin, M.; Šimić, J.; Mandić, K.; Pavlović, K. Resilience in health and illness. Psychiatr. Danub. 2020, 32, 226–232. [Google Scholar] [PubMed]
  2. Bhatnagar, S. Rethinking stress resilience. Trends Neurosci. 2021, 44, 936–945. [Google Scholar] [CrossRef] [Scilit] [PubMed]
  3. Cathomas, F.; Murrough, J.W.; Nestler, E.J.; Han, M.-H.; Russo, S.J. Neurobiology of Resilience: Interface Between Mind and Body. Biol. Psychiatry 2019, 86, 410–420. [Google Scholar] [CrossRef] [Scilit] [PubMed]
  4. Tai, A.P.L.; Leung, M.-K.; Geng, X.; Lau, W.K.W. Conceptualizing psychological resilience through resting-state functional MRI in a mentally healthy population: A systematic review. Front. Behav. Neurosci. 2023, 17, 1175064. [Google Scholar] [CrossRef] [Scilit] [PubMed]
  5. Vanhollebeke, G.; De Smet, S.; De Raedt, R.; Baeken, C.; van Mierlo, P.; Vanderhasselt, M.-A. The neural correlates of psychosocial stress: A systematic review and meta-analysis of spectral analysis EEG studies. Neurobiol. Stress 2022, 18, 100452. [Google Scholar] [CrossRef] [Scilit] [PubMed]
  6. Windle, G. What is resilience? A review and concept analysis. Rev. Clin. Gerontol. 2011, 21, 152–169. [Google Scholar] [CrossRef] [Scilit]
  7. Connor, K.M.; Davidson, J.R.T. Development of a new resilience scale: The Connor-Davidson Resilience Scale (CD-RISC). Depress. Anxiety 2003, 18, 76–82. [Google Scholar] [CrossRef] [Scilit] [PubMed]
  8. Kong, F.; Ma, X.; You, X.; Xiang, Y. The resilient brain: Psychological resilience mediates the effect of amplitude of low-frequency fluctuations in orbitofrontal cortex on subjective well-being in young healthy adults. Soc. Cogn. Affect. Neurosci. 2018, 13, 755–763. [Google Scholar] [CrossRef] [Scilit] [PubMed]
  9. Russo, S.J.; Murrough, J.W.; Han, M.-H.; Charney, D.S.; Nestler, E.J. Neurobiology of resilience. Nat. Neurosci. 2012, 15, 1475–1484. [Google Scholar] [CrossRef] [Scilit] [PubMed]
  10. Sharpley, C.F.; Arnold, W.M.; Evans, I.D.; Bitsika, V.; Jesulola, E.; Agnew, L.L. Studies of EEG Asymmetry and Depression: To Normalise or Not? Symmetry 2023, 15, 1689. [Google Scholar] [CrossRef] [Scilit]
  11. Waugh, C.E.; Sali, A.W. Resilience as the Ability to Maintain Well-Being: An Allostatic Active Inference Model. J. Intell. 2023, 11, 158. [Google Scholar] [CrossRef] [Scilit] [PubMed]
  12. Booth, J.W.; Neill, J.T. Coping strategies and the development of psychological resilience. J. Outdoor Environ. Educ. 2017, 20, 47–54. [Google Scholar] [CrossRef] [Scilit]
  13. Dahl, C.J.; Wilson-Mendenhall, C.D.; Davidson, R.J. The plasticity of well-being: A training-based framework for the cultivation of human flourishing. Proc. Natl. Acad. Sci. USA 2020, 117, 32197–32206. [Google Scholar] [CrossRef] [Scilit] [PubMed]
  14. Evans, I.D.; Sharpley, C.F.; Bitsika, V.; Vessey, K.A.; Jesulola, E.; Agnew, L.L. Functional Network Connectivity for Components of Depression-Related Psychological Fragility. Brain Sci. 2024, 14, 845. [Google Scholar] [CrossRef] [Scilit] [PubMed]
  15. Laird, K.T.; Krause, B.; Funes, C.; Lavretsky, H. Psychobiological factors of resilience and depression in late life. Transl. Psychiatry 2019, 9, 88. [Google Scholar] [CrossRef] [Scilit] [PubMed]
  16. Song, S.; Yang, X.; Yang, H.; Zhou, P.; Ma, H.; Teng, C.; Chen, H.; Ou, H.; Li, J.; Mathews, C.A.; et al. Psychological Resilience as a Protective Factor for Depression and Anxiety Among the Public During the Outbreak of COVID-19. Front. Psychol. 2021, 11, 618509. [Google Scholar] [CrossRef] [Scilit] [PubMed]
  17. Nishimi, K.M.; Koenen, K.C.; Coull, B.A.; Chen, R.; Kubzansk, L.D. Psychological resilience predicting cardiometabolic conditions in adulthood in the Midlife in the United States Study. Proc. Natl. Acad. Sci. USA 2021, 118, e2102619118. [Google Scholar] [CrossRef] [Scilit] [PubMed]
  18. Zheng, N.; Zhuang, M.; Zhu, Y.; Wang, Y.; Ye, M.; Zhang, Y.; Zhan, Y. Association between psychological resilience and body mass index in a community-based population: A cross-sectional study. Obes. Sci. Pract. 2024, 10, e761. [Google Scholar] [CrossRef] [Scilit] [PubMed]
  19. Adochiei, I.-R.; Paraschiv, R.; Petroiu, G.; Sultana, A.; Duta, S.; Adochiei, F.C.; Petroiu, G.G.; Magjarević, R.; Costin, H.-N. Exploring EEG Patterns as Indicators of Stress: A Comprehensive Study. In IFMBE Proceedings; Springer: Cham, Switzerland, 2024; Volume 110, pp. 358–369. [Google Scholar]
  20. Glazebrook, A.J.; Shakespeare-Finch, J.; Andrew, B.; van der Meer, J. Posttraumatic growth EEG neuromarkers: Translational neural comparisons with resilience and PTSD in trauma-exposed healthy adults. Eur. J. Psychotraumatol. 2023, 14, 2272477. [Google Scholar] [CrossRef] [Scilit] [PubMed]
  21. Hermans, E.J.; Hendler, T.; Kalisch, R. Building Resilience: The Stress Response as a Driving Force for Neuroplasticity and Adaptation. Biol. Psychiatry 2025, 97, 330–338. [Google Scholar] [CrossRef] [Scilit] [PubMed]
  22. Kalisch, R.; Russo, S.J.; Müller, M.B. Neurobiology and systems biology of stress resilience. Physiol. Rev. 2024, 104, 1205–1263. [Google Scholar] [CrossRef] [Scilit] [PubMed]
  23. Sohal, V.S. How Close Are We to Understanding What (if Anything) γ Oscillations Do in Cortical Circuits? J. Neurosci. 2016, 36, 10489–10495. [Google Scholar] [CrossRef] [Scilit] [PubMed]
  24. Buzsáki, G.; Wang, X.-J. Mechanisms of gamma oscillations. Annu. Rev. Neurosci. 2012, 35, 203–225. [Google Scholar] [CrossRef] [Scilit] [PubMed]
  25. Basar, E. A review of gamma oscillations in healthy subjects and in cognitive impairment. Int. J. Psychophysiol. 2013, 90, 99–117. [Google Scholar] [CrossRef] [Scilit] [PubMed]
  26. da Silva, F.L.; Lemieux, L.; Mulert, C. EEG: Origin and Measurement; Springer International Publishing: Cham, Switzerland, 2022; pp. 23–48. [Google Scholar]
  27. Fernandez-Ruiz, A.; Sirota, A.; Lopes-dos-Santos, V.; Dupret, D. Over and above frequency: Gamma oscillations as units of neural circuit operations. Neuron 2023, 111, 936–953. [Google Scholar] [CrossRef] [Scilit] [PubMed]
  28. Ünsal, E.; Duygun, R.; Yemeniciler, İ.; Bingöl, E.; Ceran, Ö.; Güntekin, B. From Infancy to Childhood: A Comprehensive Review of Event- and Task-Related Brain Oscillations. Brain Sci. 2024, 14, 837. [Google Scholar] [CrossRef] [Scilit] [PubMed]
  29. Rocks, D.L.; Sharpley, C.F.; Bitsika, V.; Vessey, K.A.; Odierna, G.L.; Watson, C.B. Gamma and Psychological Resilience: Where to Now? Brain Sci. 2025, 15, 957. [Google Scholar] [CrossRef] [Scilit] [PubMed]
  30. Bitsika, V.; Sharpley, C.F.; Evans, I.D.; Watson, C.B.; Williams, R.J.; Vessey, K.A. Low-Level Social Demand Is Associated with Anxiety-Related Gamma Wave Responses in Autistic Male Youth. Brain Sci. 2025, 15, 40. [Google Scholar] [PubMed]
  31. Deng, Q.; Wu, C.; Parker, E.; Zhu, J.; Liu, T.C.-Y.; Duan, R.; Yang, L. Mystery of gamma wave stimulation in brain disorders. Mol. Neurodegener. 2024, 19, 96. [Google Scholar] [CrossRef] [Scilit] [PubMed]
  32. Fitzgerald, P.J.; Watson, B.O. Gamma oscillations as a biomarker for major depression: An emerging topic. Transl. Psychiatry 2018, 8, 177. [Google Scholar] [CrossRef] [Scilit] [PubMed]
  33. Guan, A.; Wang, S.; Huang, A.; Qiu, C.; Li, Y.; Li, X.; Wang, J.; Wang, Q.; Deng, B. The role of gamma oscillations in central nervous system diseases: Mechanism and treatment. Front. Cell. Neurosci. 2022, 16, 962957. [Google Scholar] [CrossRef] [Scilit] [PubMed]
  34. Weiss, E.; Kann, M.; Wang, Q. Neuromodulation of Neural Oscillations in Health and Disease. Biology 2023, 12, 371. [Google Scholar] [CrossRef] [Scilit] [PubMed]
  35. Fries, P. Rhythms for Cognition: Communication through Coherence. Neuron 2015, 88, 220–235. [Google Scholar] [CrossRef] [Scilit] [PubMed]
  36. Voytek, B.; Kayser, A.S.; Badre, D.; Fegen, D.; Chang, E.F.; Crone, N.E.; Parvizi, J.; Knight, R.T.; D’Esposito, M. Oscillatory dynamics coordinating human frontal networks in support of goal maintenance. Nat. Neurosci. 2015, 18, 1318–1324. [Google Scholar] [CrossRef] [Scilit] [PubMed]
  37. Cabral-Calderin, Y.; Wilke, M. Probing the Link Between Perception and Oscillations: Lessons from Transcranial Alternating Current Stimulation. Neuroscientist 2020, 26, 57–73. [Google Scholar] [CrossRef] [Scilit] [PubMed]
  38. Dai, Z.-P.; Wen, Q.; Wu, P.; Zhang, Y.-N.; Fang, C.-L.; Dai, M.-Y.; Zhou, H.-L.; Wang, H.; Tang, H.; Zhang, S.-Q.; et al. γ neuromodulations: Unraveling biomarkers for neurological and psychiatric disorders. Mil. Med. Res. 2025, 12, 32. [Google Scholar] [CrossRef] [Scilit] [PubMed]
  39. Lee, K.C.; Gao, J.; Leung, H.K.; Wu, B.W.Y.; Roberts, A.; Thach, T.-Q.; Sik, H.H. Modulating Consciousness through Awareness Training Program and Its Impacts on Psychological Stress and Age-Related Gamma Waves. Brain Sci. 2024, 14, 91. [Google Scholar] [CrossRef] [Scilit] [PubMed]
  40. Feldman, R. What is resilience: An affiliative neuroscience approach. World Psychiatry 2020, 19, 132–150. [Google Scholar] [CrossRef] [Scilit] [PubMed]
  41. Kinreich, S.; Djalovski, A.; Kraus, L.; Louzoun, Y.; Feldman, R. Brain-to-Brain Synchrony during Naturalistic Social Interactions. Sci. Rep. 2017, 7, 17060. [Google Scholar] [CrossRef] [Scilit] [PubMed]
  42. Kucewicz, M.T.; Berry, B.M.; Kremen, V.; Brinkmann, B.H.; Sperling, M.R.; Jobst, B.C.; Gross, R.E.; Lega, B.; Sheth, S.A.; Stein, J.M.; et al. Dissecting gamma frequency activity during human memory processing. Brain 2017, 140, 1337–1350. [Google Scholar] [CrossRef] [Scilit] [PubMed]
  43. Hudson, M.R.; Jones, N.C. Deciphering the code: Identifying true gamma neural oscillations. Exp. Neurol. 2022, 357, 114205. [Google Scholar] [CrossRef] [Scilit] [PubMed]
  44. Ray, S.; Ni, A.M.; Maunsell, J.H.R. Strength of Gamma Rhythm Depends on Normalization. PLoS Biol. 2013, 11, e1001477. [Google Scholar] [CrossRef] [Scilit] [PubMed]
  45. Pratt, M.; Zeev-Wolf, M.; Goldstein, A.; Feldman, R. Exposure to early and persistent maternal depression impairs the neural basis of attachment in preadolescence. Prog. Neuro-Psychopharmacol. Biol. Psychiatry 2019, 93, 21–30. [Google Scholar] [CrossRef] [Scilit] [PubMed]
  46. Bitsika, V.; Sharpley, C.F.; Bell, R. The buffering effect of resilience upon stress, anxiety and depression in parents of a child with an autism spectrum disorder. J. Dev. Phys. Disabil. 2013, 25, 533–543. [Google Scholar] [CrossRef] [Scilit]
  47. Ichim, A.M.; Barzan, H.; Moca, V.V.; Nagy-Dabacan, A.; Ciuparu, A.; Hapca, A.; Vervaeke, K.; Muresan, R.C. The gamma rhythm as a guardian of brain health. eLife 2024, 13, e100238. [Google Scholar] [CrossRef] [Scilit] [PubMed]
  48. Nahar, L.; Delacroix, B.M.; Nam, H.W. The Role of Parvalbumin Interneurons in Neurotransmitter Balance and Neurological Disease. Front. Psychiatry 2021, 12, 679960. [Google Scholar] [CrossRef] [Scilit] [PubMed]
  49. Rocks, D.L.; Sharpley, C.F.; Bitsika, V.; Odierna, G.L. What Are Gamma Waves (And How Are They Relevant to Clinical Psychiatry)? Appl. Sci. 2025, 15, 12668. [Google Scholar] [CrossRef] [Scilit]
  50. Longo, A.R.; Bolognini, N.; Zapparoli, L. Shaping gamma oscillations through sensory stimulation: A systematic review in healthy adults. Biol. Psychol. 2026, 204, 109211. [Google Scholar] [CrossRef] [Scilit] [PubMed]
  51. Xiao, S.; Youssef, N.; Zhang, Q.; Lin, X.; Qiu, Z.; Liu, W.; Meng, X.; Yu, M. High gamma EEG responses to emotional stimuli in virtual reality: Insights from local activation and distributed characteristics. Front. Hum. Neurosci. 2025, 19, 1623331. [Google Scholar] [CrossRef] [Scilit] [PubMed]
  52. Watanabe, N.; Yoshida, S.; Keerativittayayut, R.; Takeda, M. Neural signatures of human psychological resilience driven by acute stress. bioRxiv 2024. bioRxiv:2024.03.24.586503. [Google Scholar] [CrossRef] [Scilit]
  53. Duc, N.T.; Lee, B. Decoding Brain Dynamics in Speech Perception Based on EEG Microstates Decomposed by Multivariate Gaussian Hidden Markov Model. IEEE Access 2020, 8, 146770–146784. [Google Scholar] [CrossRef] [Scilit]
  54. Sharpley, C.F.; Evans, I.D.; Bitsika, V.; Arnold, W.M.; Jesulola, E.; Agnew, L.L. Frontal Alpha Asymmetry Argues for the Heterogeneity of Psychological Resilience. Brain Sci. 2023, 13, 1354. [Google Scholar] [CrossRef] [Scilit] [PubMed]
  55. Abu Hasan, R.; Tang, T.B.; Saiful Bahri Yusoff, M.; Saad Azhar Ali, S. Electroencephalography-Based Recognition of Low Mental Resilience Using Multi-Condition Decision-Level Fusion Approach. IEEE J. Transl. Eng. Health Med. 2025, 13, 387–401. [Google Scholar] [CrossRef] [Scilit]
  56. KeunhoYoo, K.; Xiu, B.; Nader, G.; Graff, A.; Gerretsen, P.; Zomorrodi, R.; De Luca, V. Power spectral analysis of resting-state EEG to monitor psychological resilience to stress. Psychiatry Res. Commun. 2024, 4, 100175. [Google Scholar] [CrossRef] [Scilit]
  57. Paban, V.; Modolo, J.; Mheich, A.; Hassan, M. Psychological resilience correlates with EEG source-space brain network flexibility. Netw. Neurosci. 2019, 3, 539–550. [Google Scholar] [CrossRef] [Scilit] [PubMed]
  58. Nolan, H.; Whelan, R.; Reilly, R.B. FASTER: Fully automated statistical thresholding for EEG artifact rejection. J. Neurosci. Methods 2010, 192, 152–162. [Google Scholar] [CrossRef] [Scilit] [PubMed]
  59. Lee, T.W.; Girolami, M.; Sejnowski, T.J. Independent Component Analysis Using an Extended Infomax Algorithm for Mixed Subgaussian and Supergaussian Sources. Neural Comput. 1999, 11, 417–441. [Google Scholar] [CrossRef] [Scilit] [PubMed]
  60. Cohen, J. Statistical Power Analysis for the Behavioral Sciences, 2nd ed.; L. Erlbaum Associates: Hillsdale, NJ, USA, 1988. [Google Scholar]
  61. Schober, P.; Boer, C.; Schwarte, L.A. Correlation coefficients: Appropriate use and interpretation. Anesth. Analg. 2018, 126, 1763–1768. [Google Scholar] [CrossRef] [Scilit] [PubMed]
  62. Pascual-Marqui, R.D.; Lehmann, D.; Koukkou, M.; Kochi, K.; Anderer, P.; Saletu, B.; Tanaka, H.; Hirata, K.; John, E.R.; Prichep, L.; et al. Assessing interactions in the brain with exact low-resolution electromagnetic tomography. Philos. Trans. R. Soc. A Math. Phys. Eng. Sci. 2011, 369, 3768–3784. [Google Scholar] [CrossRef] [Scilit] [PubMed]
  63. Raichle, M.E. The Restless Brain. Brain Connect. 2011, 1, 3–12. [Google Scholar] [CrossRef] [Scilit] [PubMed]
  64. Chen, Y.-C.; Arnatkevičiūtė, A.; McTavish, E.; Pang, J.C.; Chopra, S.; Suo, C.; Fornito, A.; Aquino, K.M. The individuality of shape asymmetries of the human cerebral cortex. eLife 2022, 11, e75056. [Google Scholar] [CrossRef] [Scilit] [PubMed]
  65. Long, Y.; Chen, C.; Deng, M.; Huang, X.; Tan, W.; Zhang, L.; Fan, Z.; Liu, Z. Psychological resilience negatively correlates with resting-state brain network flexibility in young healthy adults: A dynamic functional magnetic resonance imaging study. Ann. Transl. Med. 2019, 7, 809. [Google Scholar] [CrossRef] [Scilit] [PubMed]
  66. Sulpizio, V.; Committeri, G.; Lambrey, S.; Berthoz, A.; Galati, G. Selective role of lingual/parahippocampal gyrus and retrosplenial complex in spatial memory across viewpoint changes relative to the environmental reference frame. Behav. Brain Res. 2013, 242, 62–75. [Google Scholar] [CrossRef] [Scilit] [PubMed]
  67. Creel, W.T.; Hartman, R.E. EEG entropy modulation as a biomarker of emotion regulation and resilience. IBRO Neurosci. Rep. 2025, 19, 947–954. [Google Scholar] [CrossRef] [Scilit] [PubMed]
  68. Pascual-Leone, A.; Bartres-Faz, D. Human Brain Resilience: A Call to Action. Ann. Neurol. 2021, 90, 336–349. [Google Scholar] [CrossRef] [Scilit] [PubMed]
  69. Ramsøy, T.Z.; Skov, M.; Christensen, M.K.; Stahlhut, C. Frontal Brain Asymmetry and Willingness to Pay. Front. Neurosci. 2018, 12, 138. [Google Scholar] [CrossRef] [Scilit] [PubMed]
  70. Bludau, S.; Eickhoff, S.B.; Mohlberg, H.; Caspers, S.; Laird, A.R.; Fox, P.T.; Schleicher, A.; Zilles, K.; Amunts, K. Cytoarchitecture, probability maps and functions of the human frontal pole. NeuroImage 2014, 93, 260–275. [Google Scholar] [CrossRef] [Scilit] [PubMed]
  71. Scrivener, C.L.; Reader, A.T. Variability of EEG electrode positions and their underlying brain regions: Visualizing gel artifacts from a simultaneous EEG-fMRI dataset. Brain Behav. 2022, 12, e2476. [Google Scholar] [CrossRef] [Scilit] [PubMed]
  72. Lazar, S.W.; Kerr, C.E.; Wasserman, R.H.; Gray, J.R.; Greve, D.N.; Treadway, M.T.; McGarvey, M.; Quinn, B.T.; Dusek, J.A.; Benson, H.; et al. Meditation experience is associated with increased cortical thickness. Neuroreport 2005, 16, 1893–1897. [Google Scholar] [CrossRef] [Scilit] [PubMed]
  73. Jensen, O.; Colgin, L.L. Cross-frequency coupling between neuronal oscillations. Trends Cogn. Sci. 2007, 11, 267–269. [Google Scholar] [CrossRef] [Scilit] [PubMed]
  74. Canolty, R.T.; Knight, R.T. The functional role of cross-frequency coupling. Trends Cogn. Sci. 2010, 14, 506–515. [Google Scholar] [CrossRef] [Scilit] [PubMed]
  75. Al-Ezzi, A.; Kamel, N.; Faye, I.; Gunaseli, E. Review of EEG, ERP, and Brain Connectivity Estimators as Predictive Biomarkers of Social Anxiety Disorder. Front. Psychol. 2020, 11, 730. [Google Scholar] [CrossRef] [Scilit] [PubMed]
  76. Damiani, D.; Nascimento, A.M.; Pereira, L.K. Cortical Brain Functions—The Brodmann Legacy in the 21st Century. Arq. Bras. Neurocir. 2020, 39, 261–270. [Google Scholar] [CrossRef] [Scilit]
  77. Palmiero, M.; Piccardi, L. Frontal EEG Asymmetry of Mood: A Mini-Review. Front. Behav. Neurosci. 2017, 11, 224. [Google Scholar] [CrossRef] [Scilit] [PubMed]
  78. Takayanagi, Y.; Onaka, T. Roles of Oxytocin in Stress Responses, Allostasis and Resilience. Int. J. Mol. Sci. 2021, 23, 150. [Google Scholar] [CrossRef] [Scilit] [PubMed]
  79. Murty, D.; Manikandan, K.; Kumar, W.S.; Ramesh, R.G.; Purokayastha, S.; Javali, M.; Rao, N.P.; Ray, S. Gamma oscillations weaken with age in healthy elderly in human EEG. Neuroimage 2020, 215, 116826. [Google Scholar] [CrossRef] [Scilit] [PubMed]
  80. Miyagi, T.; Oishi, N.; Kobayashi, K.; Ueno, T.; Yoshimura, S.; Murai, T.; Fujiwara, H. Psychological resilience is correlated with dynamic changes in functional connectivity within the default mode network during a cognitive task. Sci. Rep. 2020, 10, 17760. [Google Scholar] [CrossRef] [Scilit] [PubMed]
  81. Canolty, R.T.; Edwards, E.; Dalal, S.S.; Soltani, M.; Nagarajan, S.S.; Kirsch, H.E.; Berger, M.S.; Barbaro, N.M.; Knight, R.T. High gamma power is phase-locked to theta oscillations in human neocortex. Science 2006, 313, 1626–1628. [Google Scholar] [CrossRef] [Scilit] [PubMed]
  82. Fries, P. Neuronal Gamma-Band Synchronization as a Fundamental Process in Cortical Computation. Annu. Rev. Neurosci. 2009, 32, 209–224. [Google Scholar] [CrossRef] [Scilit] [PubMed]
  83. Salimpour, Y.; Anderson, W.S. Cross-Frequency Coupling Based Neuromodulation for Treating Neurological Disorders. Front. Neurosci. 2019, 13, 125. [Google Scholar] [CrossRef] [Scilit] [PubMed]
  84. Rojas, G.M.; Alvarez, C.; Montoya, C.E.; De La Iglesia-Vayá, M.; Cisternas, J.E.; Gálvez, M. Study of Resting-State Functional Connectivity Networks Using EEG Electrodes Position As Seed. Front. Neurosci. 2018, 12, 235. [Google Scholar] [CrossRef] [Scilit] [PubMed]
  85. Amunts, K.; Malikovic, A.; Mohlberg, H.; Schormann, T.; Zilles, K. Brodmann’s Areas 17 and 18 Brought into Stereotaxic Space—Where and How Variable? NeuroImage 2000, 11, 66–84. [Google Scholar] [CrossRef] [Scilit] [PubMed]
  86. Ding, X.; Fang, H.; Liu, Y.; Zheng, L.; Zhu, X.; Duan, H.; Wu, J. Neurocognitive correlates of psychological resilience: Event-related potential studies. J. Affect. Disord. 2022, 312, 100–106. [Google Scholar] [CrossRef] [Scilit] [PubMed]
  87. Gupta, S.; Reddy, J. EEG Signatures of Resilience Across Individuals With High and Low Anxiety. NeuroRegulation 2025, 12, 12–28. [Google Scholar] [CrossRef] [Scilit]
  88. Hasan, R.A.; Ali, S.S.A.; Tang, T.B.; Yusoff, M.S.B.; Porkumaran, K.; Mohd Nor, N.; Prabakar, S.; Kannan, R.; Ibrahim, R. Finding the EEG Footprint of Stress Resilience. In Lecture Notes in Electrical Engineering; Springer Nature: Singapore, 2022; pp. 807–816. [Google Scholar]
  89. Braboszcz, C.; Cahn, B.R.; Levy, J.; Fernandez, M.; Delorme, A. Increased Gamma Brainwave Amplitude Compared to Control in Three Different Meditation Traditions. PLoS ONE 2017, 12, e0170647. [Google Scholar] [CrossRef] [Scilit] [PubMed]
  90. Buzsáki, G.; Schomburg, E.W. What does gamma coherence tell us about inter-regional neural communication? Nat. Neurosci. 2015, 18, 484–489. [Google Scholar] [CrossRef] [Scilit] [PubMed]
  91. Mockevičius, A.; Šveistytė, K.; Griškova-Bulanova, I. Individual/Peak Gamma Frequency: What Do We Know? Brain Sci. 2023, 13, 792. [Google Scholar] [CrossRef] [Scilit] [PubMed]
  92. Darvas, F.; Scherer, R.; Ojemann, J.G.; Rao, R.P.; Miller, K.J.; Sorensen, L.B. High gamma mapping using EEG. Neuroimage 2010, 49, 930–938. [Google Scholar] [CrossRef] [Scilit] [PubMed]
  93. Gaona, C.M.; Sharma, M.; Freudenburg, Z.V.; Breshears, J.D.; Bundy, D.T.; Roland, J.; Barbour, D.L.; Schalk, G.; Leuthardt, E.C. Nonuniform high-gamma (60–500 Hz) power changes dissociate cognitive task and anatomy in human cortex. J. Neurosci. 2011, 31, 2091–2100. [Google Scholar] [CrossRef] [Scilit] [PubMed]
  94. De Pieri, M.; Sabe, M.; Rochas, V.; Poglia, G.; Bartolomei, J.; Kirschner, M.; Kaiser, S. Resting-state EEG and MEG gamma frequencies in schizophrenia: A systematic review and exploratory power-spectrum metanalysis. Schizophrenia 2025, 11, 48. [Google Scholar] [CrossRef] [Scilit] [PubMed]
  95. Golaszewski, S.; Frey, V.; Thomschewski, A.; Sebastianelli, L.; Versace, V.; Saltuari, L.; Trinka, E.; Nardone, R. Neural mechanisms underlying the Rubber Hand Illusion: A systematic review of related neurophysiological studies. Brain Behav. 2021, 11, e02124. [Google Scholar] [CrossRef] [Scilit] [PubMed]
  96. Jesulola, E.; Sharpley, C.F.; Agnew, L.L. The effects of gender and depression severity on the association between alpha asymmetry and depression across four brain regions. Behav. Brain Res. 2017, 321, 232–239. [Google Scholar] [CrossRef] [Scilit] [PubMed]
  97. Montalto, A.; Park, H.R.P.; Williams, L.M.; Korgaonkar, M.S.; Chilver, M.R.; Jamshidi, J.; Schofield, P.R.; Gatt, J.M. Negative association between anterior insula activation and resilience during sustained attention: An fMRI twin study. Psychol. Med. 2023, 53, 3187–3199. [Google Scholar] [CrossRef] [Scilit] [PubMed]
Figure 1. Scatter plots–CDRT and Gamma 30–90 Hz. Note: Scatter plots showing gamma characteristics related to CDRT scores between 30 and 90 Hz. Clustering and focalization of gamma signal is evident as CDRT increases.
Psychiatryint 07 00153 g001
Figure 2. Source localization for gamma frequency at 70–90 Hz eyes closed. Note: Maximal negative correlation appears in left anterior cingulate of the prefrontal cortex (X −5, Y 20, Z −5). Measurements are made in voxels (volume elements in 5 × 5 × 5 mm units).
Psychiatryint 07 00153 g002
Figure 3. Source localization activity between 30 and 130 Hz eyes closed (6 Views). Note. Some weak correlation with low significance between gamma wave activity and CDRT. Blue colored areas represent voxels with a statistical negative difference in current density. A = Anterior, P = Posterior, S = Superior (Top), I = Inferior (Bottom).
Psychiatryint 07 00153 g003
Figure 4. Global gamma activity between 30 and 130 Hz Eyes Open (6 Views). Note. Greater correlation and significance are detected across more ROIs, reflecting input change from EC to EO. Neural regions associated with visual processing are most active with greater r value.
Psychiatryint 07 00153 g004
Figure 5. Source localization for gamma frequency at 70–90 Hz, EO. Note. Voxels highlighted in blue met the significance threshold (p < 0.05). Maximal negative correlation appears in left lingual and parahippocampal gyri (X −20; Y −55; Z 0).
Psychiatryint 07 00153 g005
Figure 6. Network connectivity within the 70–90 Hz range across MPFC and rITG (Eyes Open). Note. View from front, top and right cortical positions. MPFC = medial prefrontal cortex, rITG = right inferior temporal gyrus. Red line indicates correlation between ROI associated with a known neural network (DMN).
Psychiatryint 07 00153 g006
Table 1. Correlational coefficients and significance for CDRT and frontal gamma power at FP1/FP2, (total sample, N = 100) featuring FDR correction.
Sub-BandPearson’s rpp FDR
FP1 30–50 Hz0.2510.0120.043 *
FP2 30–50 Hz−0.1470.1430.238
FP1 50–70 Hz−0.2530.0110.043 *
FP2 50–70 Hz−0.1420.1580.226
FP1 70–90 Hz−0.2480.0130.043 *
FP2 70–90 Hz−0.1360.1760.220
FP1 90–110 Hz−0.2290.0220.055
FP2 90–110 Hz−0.1250.2140.238
FP1 110–130 Hz−0.1860.0630.126
FP2 110–130 Hz−0.0950.3490.349
* highlights significant results.
Table 2. Correlational coefficients and significance for CDRT and gamma power at FP1 for HRI subgroup.
Sub-BandPearson’s rp
30–50 Hz−0.3750.103
50–70 Hz−0.3830.095
70–90 Hz−0.3430.138
90–110 Hz−0.2830.227
110–130 Hz−0.2420.303
Table 3. Correlational coefficients and significance for CDRT and gamma power at FP2 for HRI subgroup.
Sub-BandPearson’s rp
30–50 Hz0.3780.100
50–70 Hz−0.4730.035
70–90 Hz−0.4650.039
90–110 Hz−0.4330.056
110–130 Hz−0.3750.104
Table 4. Correlational coefficients and significance for CDRT and gamma power at P7 for HRI subgroup.
Sub-BandPearson’s rp
30–50 Hz0.1760.459
50–70 Hz0.2640.261
70–90 Hz0.4160.068
90–110 Hz0.4830.031
110–130 Hz0.5380.014
Disclaimer/Publisher’s Note: The statements, opinions and data contained in all publications are solely those of the individual author(s) and contributor(s) and not of MDPI and/or the editor(s). MDPI and/or the editor(s) disclaim responsibility for any injury to people or property resulting from any ideas, methods, instructions or products referred to in the content.