Article

Media Consumption and Voting Stability in Australia’s Aboriginal and Torres Strait Islander Voice to Parliament Referendum


1
School of Communication, Media and Journalism, Adelaide University, Adelaide, SA 5005, Australia
2
School of Medicine and Psychology, Australian National University, Canberra, ACT 2601, Australia
3
School of Psychology, Murdoch University, Perth, WA 6150, Australia
4
School of Psychology, The University of Queensland, Brisbane, QLD 4072, Australia
5
College of Human Sciences and Culture, Flinders University, Adelaide, SA 5042, Australia
*
Author to whom correspondence should be addressed.
Journal. Media 2026, 7(3), 157; https://doi.org/10.3390/journalmedia7030157
Submission received: 24 April 2026 / Revised: 29 June 2026 / Accepted: 24 July 2026 / Published: 1 August 2026

Abstract

This study of media consumption in relation to voting decisions during the Australian 2023 Aboriginal and Torres Strait Islander Voice to Parliament referendum contributes to a complex field of research interested in how media shapes and influences voting behaviour. Through a two-wave panel survey of 1525 voters a month before and directly after the referendum, this study found clear differences between voters who were stable—those who had made up their mind a month before they voted, and voters who were unstable—those who had uncertain views. Stable voters were found to selectively expose themselves to media that aligned with their voting intentions and to consume more types of media overall. Conversely, unstable voters did not selectively expose themselves to media and consumed fewer types of media than stable voters. These findings demonstrate that the relationship between media consumption and democratic processes is complex. Media can have a positive influence on engagement and can present a range of views to help voters make informed decisions. But media can also contribute to disengagement from democratic processes, which has concerning implications for the health of democracy.

1. Introduction

Western news media is idealised as democratically valuable during elections and referenda because it notionally disseminates useful and diverse information about candidates, values, policies and propositions to inform voters so they can make decisions in their best interests (Coleman & Blumler, 2012; Dahl, 1998; Young, 2011). In the liberal pluralist tradition, this democratic role requires journalists to strive for objective, independent and balanced political coverage without advantaging particular perspectives, candidates or parties (Schudson & Anderson, 2009; Young, 2011). Yet, due to the digitisation and fragmentation of media, including the rise of social media, scholars suggest news media is increasingly moving away from this ideal and is instead presenting partisan-biased news, which audiences select because they prefer information aligning with their political views (Stroud, 2011). Such ideas give rise to many fields of academic inquiry at the intersection of media and democratic behaviour, including questions about the types of media utilized, consumption levels during democratic contests, and what influence this has on voters’ decisions.
The present research contributes to this field through analysis of the relationship between media use and voting decisions during the Australian 2023 Aboriginal and Torres Strait Islander Voice to Parliament (the Voice) referendum. The Voice referendum, sponsored by the centre-left Labor Party government, asked the Australian public to decide if an Aboriginal and Torres Strait Islander advisory body should be enshrined in the constitution as a practical form of recognition for Indigenous peoples. The advisory body would provide advice to the government to address the structural inequality between Indigenous and non-Indigenous Australians that has persisted since the British colonisation of Australia (Davis, 2023; Behrendt, 2003).
When studying the relationship between media consumption and democratic decisions, it can be hard to ascertain if people choose media based on how well it aligns with how they plan to vote or if the media they consume shapes or even changes how they vote. In reality, of course, both effects can happen at the same time. The Voice referendum offers an interesting case to explore this complexity. Firstly, since voting is compulsory in elections and referenda in Australia, whether engaged or not in the referendum campaign, the public ultimately had to participate (Hill, 2002). Additionally, most studies of media use during democratic contests focus on elections, yet Zumofen et al. (2024) suggest media behaviour during referenda should receive more attention because referendum voting is potentially less entrenched in partisanship, and therefore citizens’ information-seeking behaviours are of greater importance.
Voting intentions about the Voice did indeed fluctuate, and thus large numbers of voters had unstable views and even changed their minds throughout the campaign. This fluctuation is evident in polling, which found that the year before the referendum, 65% of Australians supported the Voice (Evershed & Nicholas, 2023). This popularity steadily declined, particularly after the right-wing Opposition—the Liberal and National Coalition—opposed the Voice proposal, joining the No campaign characterising the Voice as divisive (Son et al., 2026). The Voice was eventually defeated, with 60% of Australians opposing the referendum (Evershed & Nicholas, 2023).
Australia also offers an interesting context for the study of media influence on democracy, because in a highly concentrated industry (Dwyer et al., 2021), there are limited news media choices available, and most major outlets are centrist to right-leaning. In terms of print journalism, Rupert Murdoch’s right-wing News Corp Australia owns 60% of print media (Gaber & Tiffen, 2018; Murdock et al., 2024) and several popular online news sites (Dwyer & Wilding, 2023). Murdoch also owns right-wing broadcast outlet Sky News Australia, which is the fourth most consumed offline news channel in Australia (Park et al., 2025, p. 78) and also has a large social media audience (Copland et al., 2025). While News Corp Australia is well known for their right-wing partisanship, there is little analysis of the partisanship of Australia’s non-Murdoch commercial outlets (Esau et al., 2025). Regarding popular commercial television news, Channel 7 is the most consumed outlet, and Channel 9 is third most consumed (Park et al., 2025, p. 78). Both outlets are more likely to be consumed by right-leaning audiences than left-leaning audiences (Park et al., 2025, p. 139). According to Ad Fontes Media ratings, these outlets’ online news websites skew from centrist to right-leaning (Ad Fontes Media, 2025). Amongst the major commercial radio outlets, the eighth most popular offline outlets are, collectively, FM radio stations (Park et al., 2025, p. 78), which tend to be entertainment- rather than news-focused (Griffen-Foley & Lindgren, 2024). Commercial AM radio stations collectively are the fifteenth most popular offline outlets (Park et al., 2025, p. 78), with talk radio stations like popular 2 GB skewed towards right-wing partisanship (Ward, 2015).
Conversely, left-wing partisans have fewer popular left-leaning media options available across all types of media. Amongst the 22 most popular online news sites in Australia, only The Guardian is a progressive or left-wing outlet (Park et al., 2025, p. 78). The public broadcaster, the Australian Broadcasting Corporation (ABC), with its popular broadcast channel, local and national radio stations, and highly consumed online news site, is also more popular amongst left-wing than right-wing audiences (Park et al., 2025, p. 139). News Corp outlets regularly criticise the ABC for left-wing bias, which is suggested to be a way to delegitimise the national broadcaster as a News Corp competitor (Fielding et al., 2025). The ABC should not, however, be considered a partisan outlet, because it is legislated to provide comprehensive, independent and neutral news across its online, radio and television platforms (Ricketson & Mullins, 2022). As such, although scholars argue the media has little influence on voting decisions because audiences self-select the partisan news they agree with (Bennett & Iyengar, 2008; Stroud, 2011), Australia’s concentrated news media landscape makes self-selection possible for right-wing partisans but less so for left-wing voters.
Additionally, there is some evidence that news reporting and social media about the Voice was influential in voting decisions. Regarding news media, Esau et al. (2025) analysed 354 Voice news reports from 26 outlets and found that, rather than host a debate about the need for and merits of Indigenous reconciliation, news coverage fitted a horse-race theme that pitted Labor and Coalition elites against each other in a polarising debate. They suggest this polarising coverage likely exacerbated the public’s perception of the No campaign’s claims that the Voice was divisive (Esau et al., 2025). Fielding et al. (2025) also quantitatively analysed over 1400 News Corp news and commentary pieces about the Voice and found, consistent with News Corp’s partisanship, that where Voice arguments were presented, 68% supported the No proposition. Fielding et al. (2025) proposed that News Corp acted as conservative advocates in concert with the No campaign by actively opposing the Voice. Son et al. (2026) also argued that News Corp’s deliberate characterisation of the Voice as “divisive” influenced other media to frame it the same way.
Alongside mainstream news media, the unmediated sphere of social media was also an important source of information for voters during the Voice referendum. Phillips et al. (2024) analysed over three million pieces of Voice content from mainstream and social media published in 2023 in the lead-up to the Voice referendum in October. They found that the Yes campaign used many different messages to promote the benefits of the Voice and that the No campaign was more focused on three key themes, including the cost of the proposal, the idea that the Voice created division and was racist, and framing of the Voice as a risky constitutional proposition (Phillips et al., 2024). Analysis of content about the Voice on social media platform X also demonstrated that the No campaign characterised the Voice as lacking detail and as a divisive proposition (Graham, 2026).
The No campaign’s characterisation of the Voice as “divisive” was a particularly important consideration for No voters. Accent Research’s survey of voters (2023) asked respondents their reasons for voting and found 82% of No voters believed the Voice “will divide Australia”. This survey also found differing views about discrimination amongst different media audiences. Viewers of Murdoch media’s Sky News and The Australian, daily tabloid newspapers (which are mostly Murdoch-owned), free-to-air commercial television, commercial radio, and YouTube were less likely to believe Indigenous Australians face discrimination and thus were more likely to vote No (Accent Research, 2023). Conversely, Yes voters who read newspapers that were not Murdoch owned, including the left-leaning The Guardian, centrist Sydney Morning Herald and The Age, and the ABC, were more likely to believe that Indigenous Australians face discrimination and, in turn, were more likely to vote Yes (Accent Research, 2023).
The public form views about issues like discrimination and the Voice from a range of experiences throughout their lives, including their media consumption. The present study is interested in the association between voting behaviour and media use, while accepting that correlational research cannot methodologically establish causality or account for unknown influences on the patterns of media and voting identified (Knobloch-Westerwick, 2014). In doing so, the present research avoids simplistic “hypodermic needle” conceptualisations, which view media as absolutely and directly influential on behaviour (Esser, 2008), while also not assuming that, via processes of self-selection, media usage has minimal effect (Bennett & Iyengar, 2008). Through a longitudinal two-wave panel analysis of 1525 voters, this paper contributes important insights by demonstrating that there were clear partisan patterns of media use amongst Australians during the Voice referendum and that these patterns applied predominantly to stable voters—those who made a firm vote choice a month before they voted. These patterns were not found amongst unstable, less-certain voters, who were also found to use fewer types of media overall. These findings have important implications for understanding the positive and negative influences media can have on democratic processes like elections and referenda as well as beginning to unpack the roles of media in trajectories of preference stability and change.

2. Literature Review

The question of media’s influence on electoral outcomes is central to a large field of research interested in how news audiences select media and the influence of these choices on their voting behaviour. Media effects research is a complex and contested area of study, with several theories offering different and sometimes conflicting interpretations of audience behaviour. The present research builds on the literature concerning audiences selectively exposing themselves to like-minded news media, the influence of political engagement and voter certainty on media consumption, and theories about why voters disengage from news media altogether.

2.1. Media Selective Exposure and Reinforcement of Existing Views

As far back as the 1960s, Klapper (1960) argued that the media merely reinforces existing beliefs. Many scholars agree that today’s fragmented, partisan news media does not provide audiences with an appropriate diversity of views to use in opinion formation but rather reinforces existing views. This argument, often referred to as the minimalist influence thesis (MIT), is offered by Bennett and Iyengar (2008, p. 724), who contend that due to the internet’s fragmentation of media channels and content, news audiences can select news with which they agree, and thus media messages are unlikely to do “anything other than reinforce prior predispositions”. This field thus suggests news media has little influence on democratic decision making and, in turn, little influence on democratic outcomes.
Other researchers argue that even if media messages do nothing other than reinforce existing views, such reinforcement is itself an important democratic effect (Gavin, 2018; Stroud, 2011). Stroud (2011) suggests that the reinforcement of views intensifies existing opinions, motivates political participation, and alters perceptions of issue valence. Gavin also argues that a small number of voters not changing their mind through their media consumption reinforcing their views can influence the outcome of an election (Gavin, 2018). In line with this argument, Levendusky’s study of media effects found that repeated exposure to like-minded partisan news media makes already extreme partisans even more extreme and certain in their views (Levendusky, 2024). Furthermore, Gavin (2018) also proposes that the reinforcement of views on issues that the public may not have direct, personal experience with, such as climate change, benefit fraud, and immigration, is particularly influential because without personal experience, viewers are more reliant on their news consumption when forming opinions.
Studies regularly find that news audiences indeed do select partisan outlets that align with their political views (Muise et al., 2022; Peterson et al., 2021; Stroud, 2008, 2011; Van der Meer et al., 2020). Audience motives for self-selecting partisan-biased news media include consuming information that aligns with and strengthens existing views, aligning media consumption with a (sometimes public) expression of their identity, and habitual consumption of news sources that have in the past consistently confirmed their views (Hart et al., 2020; Knobloch-Westerwick & Meng, 2011; Van der Meer et al., 2020). Selective exposure has been found to occur across different channels, including talk radio, cable news, and online news sites, and to a lesser extent newspapers; newspapers are less available and thus are more difficult to self-select (Stroud, 2008, 2011). In the US context, research has shown conservative or right-wing voters prefer conservative news like Fox News while avoiding left-wing and centrist outlets like CNN and the New York Times, and vice versa for left-wing or liberal audiences (Iyengar & Hahn, 2009; Peterson et al., 2021).
Selective exposure studies in the context of elections have also found audience political opinions tend to align with the partisan views of the news media they have selected (Prior, 2013). For example, Smith and Searles (2014) found Fox News viewers were more likely to have negative views of Democratic candidate Barack Obama during the 2008 US election, and MSNBC viewers to have negative views of Republican candidate John McCain. Levendusky (2013) similarly found Fox News and MSNBC attacks on their political opposition lead their audiences to perceive the opposition more negatively and to be less trustworthy and less open to bipartisanship. However, whether these views are formed by news media consumption, media consumption is led by these views, or both effects occur simultaneously is difficult to ascertain (Prior, 2013).
Building on selective exposure studies, the “reinforcing spirals framework” suggests that news media choices reinforce existing beliefs, which perpetuates selective exposure in line with these beliefs, which further strengthens those beliefs (Slater, 2007, 2015). Feldman et al. (2014) demonstrate the relevance of this framework to the interplay of news consumption and climate change beliefs. Across two waves of surveys, they found conservative news audiences were less likely to believe in or support policies to address climate change as compared to viewers of non-conservative media. These audiences’ media choices for the first wave and second wave were found to be influenced by their views, which was theorised to further entrench and polarise climate beliefs (Feldman et al., 2014). Carmichael and Brulle (2018) also found that consumption of partisan print, radio and web-based news had significant alignment with audiences’ acceptance or not of anthropogenic climate change, with conservative news media audiences half as likely to accept the science as liberal media audiences. In this research, news media consumption was found to have a significant effect beyond political party identification, age, education and income.
It is important to note, however, that alongside preferences for partisan-aligned news, balanced news is also valued by news consumers (Dilliplane, 2011; Garrett & Stroud, 2014; Knobloch-Westerwick & Meng, 2009). As such, where partisan selective exposure occurs amongst some news consumers, there are also news audiences who consume a diversity of news sources (Ksiazek et al., 2019). Zumofen et al.’s (2024) study of media use during a Swedish referendum over energy policy found that when offered balanced or only like-minded views, the majority of participants chose the balanced options. This study found those voters most sure about their decision before the referendum campaign were more likely to choose balanced sources rather than one-sided sources, potentially because those most sure are more politically engaged and thus more interested in understanding the range of arguments. However, at the mid-point of the referendum campaign, those with strongest views were more likely to choose like-minded news, but only by a narrow margin (Zumofen et al., 2024).

2.2. News Media Consumption and Political Engagement

Audience engagement in politics is also suggested to influence news media consumption, because those most engaged in politics—those most partisan—are more likely to selectively expose themselves to like-minded media (Feldman et al., 2013; Knobloch-Westerwick, 2014; Prior, 2013; Stroud, 2011; Weeks et al., 2017). Conversely, audiences who are less politically engaged are suggested to be less likely to selectively expose themselves to news media, potentially because they have less firm political views to direct their choices (Stroud, 2008). At the same time, partisan selective exposure is also theorised to contribute to greater political participation (Dilliplane, 2011; Knobloch-Westerwick, 2014; Van der Meer et al., 2020). The relationship between political interest and engagement in political news media is thus described as causal and reciprocal because politically interested people seek out political media, which reinforces their interest in politics (Strömbäck & Shehata, 2010) and their propensity to vote (Ksiazek et al., 2019). Selective exposure is thus considered in some ways to be democratically problematic by limiting audience consumption of diverse views but also democratically valuable in encouraging participation.
Studies have also identified differences in news media consumption amongst decided (those with fixed voting intentions) and undecided voters (who are often referred to as swing voters). For instance, Ha et al. (2013) found politically decided voters sought out news media for information, whereas totally undecided voters remained disengaged. A study based on the 2019 Israeli election campaign found decided voters were more critical than undecideds about media coverage and showed more doubt in the accuracy of election news, but they still consumed more news from a greater diversity of sources than undecideds (Samuel-Azran et al., 2022). Undecideds were also more likely to judge misinformation shared on social media as credible than decideds, leading Samuel-Azran et al. (2022) to conclude undecideds were less informed and less critical than decided voters. Likewise, a study of a New Orleans election found highly partisan decideds were more likely to seek out voting information than undecideds, but this information was used less for decision-making (because their decisions were made) than for reinforcement and surveillance of the political contest (Kitchens et al., 2003).
Voters less certain about their voting decisions have also been found to take longer to make a decision when they are exposed to cross-cutting news media (Matthes, 2012). Matthes (2012) acknowledges that this delayed decision making might be democratically valuable if cross-cutting media informs a slower, more deliberative decision. Or, less positively, slower decision-making might arise because these audiences are confused about the conflicting views and find decision-making difficult. Knobloch-Westerwick and Meng (2009) also found less certain voters were more open to counter-attitudinal news than more certain voters, suggesting this might be because they are seeking to solidify their views. These studies agree with research that suggests that audiences who contrast themselves more against others with different political views—a factor of social comparison but also potentially a sign of higher political engagement—tend to have stronger confirmation bias in selecting news media that conforms with their existing views (Knobloch-Westerwick et al., 2020; Van der Meer et al., 2020).

2.3. Disengaging from News Media

Amongst studies of news choices, it is also important to consider the option to disengage from news media altogether. Arceneaux et al. (2013) point out that the proliferation of media options has provided partisans greater opportunity to not just selectively expose themselves to news but also disengage completely. Their study found that exposure to partisan cable television did indeed polarise audiences by reinforcing their views and making them resistant to opposing arguments. However, they suggest that although partisan news could potentially polarise mass audiences, it is unlikely to, because when participants were given the option of watching either partisan news or an entertainment program, most viewers chose entertainment options (Arceneaux et al., 2013). Likewise, Feldman et al. (2013) suggests that studies that force a choice between partisan news options without an option to disengage from news media altogether, over-estimate the level of selective exposure by almost 12%.
The media malaise theory helps to explain why voters may be turned off by political news. This theory posits that news media exposure can increase cynicism and disengagement in politics, with television historically found to have such an effect (Ha et al., 2013). In recent years, media malaise theories have been tied to concerns about news negativity and news avoidance. For instance, Boukes and Vliegenthart (2017) found that audiences exposed to hard news about topics like politics, the economy, and crime, had worse mental wellbeing than audiences exposed to soft news such as lifestyle and entertainment, which is argued to be because hard news is more negative and disempowering. Hard news’ negativity bias is also regularly attributed to news avoidance trends, with long-term intentional news avoidance raising concerns that citizens will be ill-equipped to make democratic decisions in their best interests (Skovsgaard & Andersen, 2020). Furthermore, tying to Arceneaux et al.’s (2013) study, which found audiences would prefer to watch entertainment media than polarising cable news programs, 37% of Australians surveyed suggest they avoid news because it is “untrustworthy or biased” (Park et al., 2025, p. 11). Media avoidance is also linked to disengagement from politics; in the US context, Ksiazek et al. (2019) found those most likely to avoid news are also least likely to vote. At the same time, studies find that public service television news—non-partisan and balanced media—increases democratically positive outcomes such as political knowledge, efficacy, participation, trust in news, and news engagement, where commercial television has negative effects (Aarts & Semetko, 2003; Chan & Yi, 2024). As such, Curran et al. (2014) encourage researchers to accept that some news media may be democratically productive in encouraging more political engagement, where other media may be turning people off politics.
In summary, although no one theory or methodological approach can entirely explain the complex dynamic between media use and democratic decisions, each study contributes insights that help interpret the subtle yet powerful ways that news media consumption influences voting behaviour and, in turn, contributes to democratic outcomes.

3. Method

This research is part of a longitudinal survey examining psychological and intergroup processes surrounding the Voice referendum. A total of 2467 Australian adults, after exclusions,1 participated via an online commercial panel, the Online Research Unit (ORU).
At Time 1 (3–13 September 2023), the sample was 51.5% female and 48.2% male (<1% non-binary or preferred not to say) and aged between 18 and 93 years old (M = 54.81, SD = 16.85). Consistent with the distribution of the Australian population, participants were mostly from Eastern states and territories (78.1%) and living in capital cities and suburbs (69.2%). Most participants identified as non-Indigenous (98.6%). The sample reported mostly centrist political views (40.6%), followed by left-wing (33.5%) then right-wing (25.9%) views. Over half of the sample (58.6%) had a bachelor’s degree or higher. The sample is thus more likely to be university educated than the Australian population, where 34% in 2025 had a bachelor’s degree or higher (ABS, 2026).
A sub-set of participants who completed the survey at Time 1 (n = 2467) participated at Times 2 (2–15 October 2023, prior to the vote, n = 1482) and 3 (22–30 October 2023, after the vote n = 1409). At Time 1, participants were asked about their position in relation to the Voice, and between 5 and 6 weeks later at Time 3, they were asked about their actual vote in the referendum as well as their media consumption, with 1525 participating across these two waves.
To assess media consumption, participants were first asked where they obtained information about the Voice. They could indicate whether they used newspapers (either online or print), television, radio or social media platforms. Based on these selections, participants were then shown follow-up questions asking which specific outlets they consumed, where multiple options could be selected. These items included a short list of options of major and widely consumed national and state based Australian news organisations for each type of media (e.g., The Australian, The Daily Telegraph, The Sydney Morning Herald for newspapers). To capture as many different media organisations as possible, participants were also given open-ended options to enter additional outlets that were not included in the pre-defined choices. This approach allowed the capture of both structured responses from closed categories and the full range of media sources identified through open-ended entries. The questions about voting intentions asked at Time 1 are available via OSF at https://osf.io/3q7j2/files/osfstorage/6a3c950ca8c95e63b3dfdfee (accessed on 23 July 2026) and questions asked at Time 3, including voting outcomes and media use, are available at https://osf.io/3q7j2/files/osfstorage/6a375d91c6be10b07e1667c4 (accessed on 23 July 2026).

Analytical Approaches

First, participants were classified as stable or unstable voters based on whether their reported voting intention changed between Time 1 (their self-reported positioning on the Voice) and Time 3 (their self-reported actual vote). Those who consistently selected “Yes” or “No” were coded as stable voters (n = 1175, 77%), while those who changed position or began as “unknown” were coded as unstable voters (n = 350, 23%). Unstable voters were found to have a similar average ideological self-placement to stable voters (on a scale from 1–7, left to right, stable M = 3.90, unstable M = 3.91).
Second, based on participants’ answers to the media consumption questions, newspaper consumption was categorised into Murdoch-only, non-Murdoch-only, mixed, and none. Television consumption was categorised into public-only, commercial-only, mixed, and none. Radio consumption was categorised into public-only,2 commercial-only, mixed, and none. Social media use was dichotomised as users and non-users. Each variable was coded as 1 if respondents reported consuming that category of media and 0 otherwise. Missing values were treated as 0 to capture the absence of reported use. The coding of each media outlet is available via OSF at https://osf.io/3q7j2/files/osfstorage/6a3b585c2b79b2d5b2b0daa6 (accessed on 23 July 2026).
Third, frequency distributions and cross-tabulations were generated to examine associations between media consumption and voting behaviour. Percentages were calculated based on number of participants to assess relative differences across groups. Chi-squared testing was performed to analyse the strength or weakness of data correlations. Visualisations were produced using bar charts showing proportions of voting categories for each media type and subgroup.
Fourth, patterns were interpreted considering existing theories and concepts identified in the literature, to draw conclusions about the association between media usage and voting intention for Yes and No voters and for those whose views were stable or unstable.

4. Discussion

This research contributes to the complex and often contradictory literature exploring the relationship between media consumption and democratic behaviour through analysis of the media consumption choices and voting behaviour during the Australian Voice referendum. This referendum provides an interesting case study because Australia’s compulsory voting system requires voters to participate in the democratic process, whether engaged in the debate or not. As a national referendum, a democratic contest of the sort that has occurred only 44 times in Australia’s history (AHRC, 2023), the Voice could also be considered one of the big stories that does not fit Bennett and Iyengar’s (2008) minimal influence thesis, because it saturates media and thus has an influence on inattentive voters. Furthermore, Australia’s concentrated news media landscape leaves limited opportunity to self-select only attitude-consistent media, particularly for left-wing voters. Lastly, due to the Australian public’s low knowledge about Aboriginal and Torres Strait Islander history and culture (Nelson, 2022), Australian voters can be considered to be highly dependent on media for understanding the arguments for and against the Voice constitutional change (Gavin, 2018; Zumofen et al., 2024). The results of this study therefore provide useful real-world insights by highlighting discernible patterns in news media selection during the Voice referendum. Two distinct trajectories of voting preference have been identified, each associated with distinct news media consumption patterns. Selective exposure is observed in line with voting preferences for stable voters. At the same time, unstable voters do not selectively expose themselves to news media that aligns with their voting behaviour and use fewer types of media overall.

4.1. Stable Voting, Selective Exposure and Reinforcement of Existing Beliefs

This study found that Australian voters during the Voice referendum sought out information from traditional news sources including television (70%) and print or online newspapers (47%), more so than social media (33%). About one quarter of respondents used radio news (24%). As per Table 1, approximately 19% of voters consumed only Murdoch’s News Corp newspapers, 19% consumed only non-Murdoch newspapers, and 9% consumed a mixture of both, suggesting some level of polarisation between Murdoch and non-Murdoch news audiences. A similar divide was identified between audiences who consumed only public television news, including the ABC and Special Broadcasting Service (SBS) (19%) and those who consumed only commercial television (25%), with 27% using a mixture of public and commercial television. Radio listeners were similarly split between public ABC radio (13%) and commercial radio only (8%).
When this media usage is mapped onto voting choices, there is evidence that voters selected their news media in line with their existing voting intentions. However, although this media and voting behaviour appears to correspond with the whole sample of voters, closer analysis reveals that it is only stable voters—those who had chosen how they would vote at Time 1 and voted this way in the referendum—whose news media usage correlates with their voting choice. Most survey respondents were stable voters, with 32% a stable Yes, 45% a stable No and 77% stable overall (n = 1175). Twenty-three percent were unstable (n = 350), with 2% moving from Yes to No (n = 29), 5% from No to Yes (n = 82), 8% from unsure to Yes (n = 115), and 8% from unsure to No (n = 124). Amongst stable voters, 59% were No voters (n = 688) and 41% Yes (n = 487).
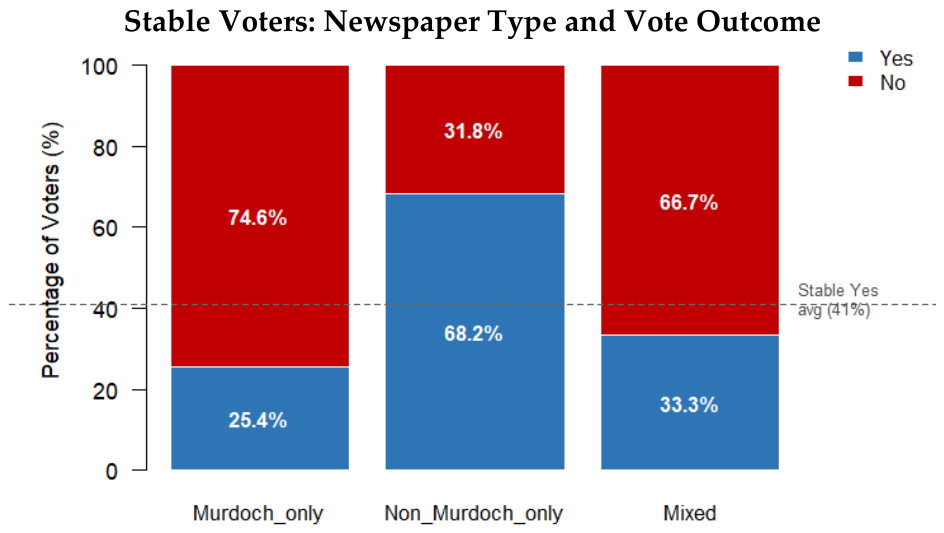
The analysis of stable voters demonstrated clear patterns of selective exposure aligning with voting preferences. Regarding online and offline newspaper consumption by stable voters (Figure 1), 74.6% (n = 173) of those who only consumed Murdoch news were No voters. Amongst stable voters, 66.7% (n = 74) who consumed a mix of Murdoch and non-Murdoch news were No voters. On the other hand, 68.2% (n = 159) of non-Murdoch-only consumers were stable Yes voters. A Chi-squared test result of 93.02, p < 0.001 (where a lower p-value demonstrates a closer correlation), shows that among stable voters, there is a strong association between the types of newspaper outlets they consumed and their stable vote.
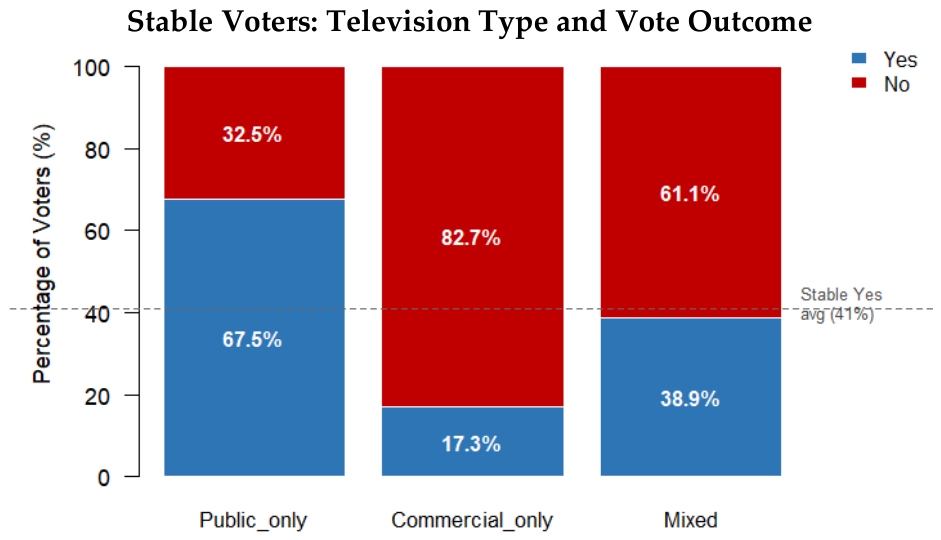
A similar pattern occurs with television (Figure 2). Those viewing only commercial television news comprised 82.7% No voters (n = 235). Those with a mix of commercial and public television news were close to the percentage of total stable voters—61.1% No (n = 193) as compared to the total average of 59%. Conversely, those who viewed only public television news comprised 67.5% Yes voters (n = 160). A Chi-squared test result of 136.46, p < 0.001, demonstrates a strong association between the type of television news outlets the participants consumed and their stable vote. Those who consumed commercial television only had a significantly greater chance of voting No than those who consumed public television only, mixed commercial and public, or even those who did not use television news as a source of Voice information.
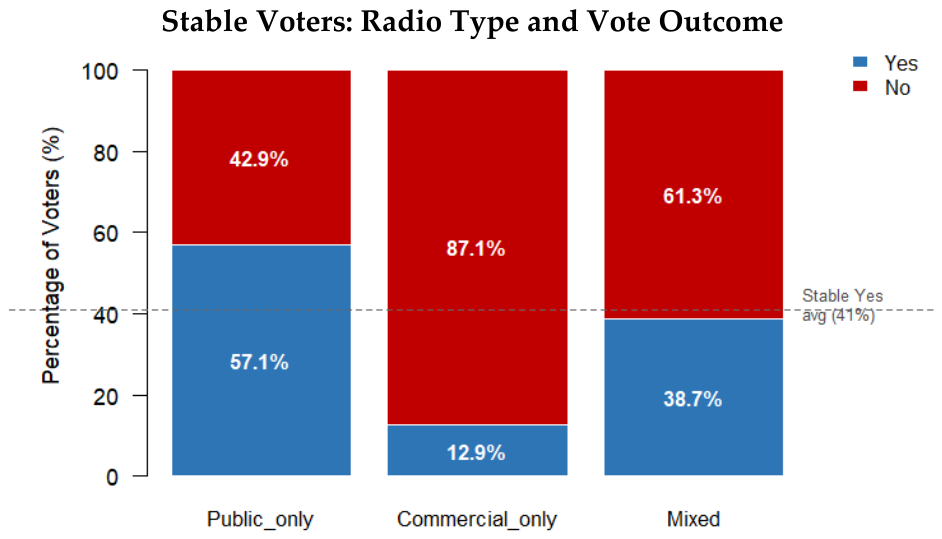
The same pattern is found in radio usage amongst stable voters (Figure 3). Those who only sought commercial radio news were 87.1% No voters (n = 88). A mix of commercial and public radio were closer to the total average of stable voters, with 61.3% No (n = 19). On the other hand, those only seeking ABC radio news were 57% Yes voters (n = 89). The Chi-squared result for these relationships is 50.05, p < 0.001 and thus there is a significant association between the type of radio channel consumed and voting outcomes for stable voters. Those who consumed only commercial radio news had a significantly greater chance to vote No than those who consumed public channels only, mixed channels or even those who did not source information from radio.
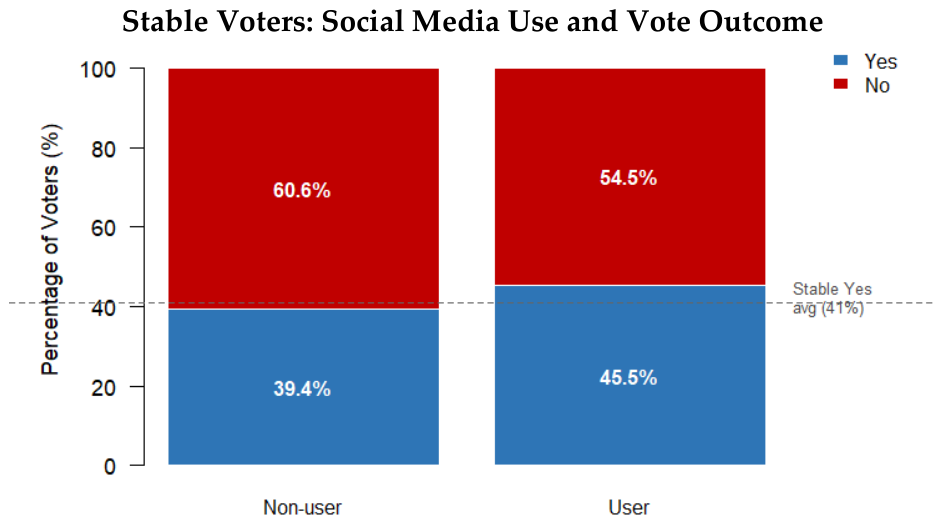
Regarding social media users, there was not a noteworthy relationship between different voting behaviour, with 45.5% of social media users being stable Yes voters (n = 182), as compared to 41% in the total population (Chi-square = 4.11, p = 0.043, demonstrating a weak relationship) (Figure 4). Since this study did not ask respondents which types of content they sought on social media due to the diverse content available, a limitation of this study is that conclusions cannot be drawn about which social media content interplays with voting decisions. This is potentially a fruitful line of inquiry for future research. It should be noted, however, that the 2025 Australian Digital News Report found that traditional or mainstream news receives the most attention on social media platforms (Park et al., 2025, p. 98). Thus, the news produced by traditional outlets, which is consumed in print, television and radio formats, is also being consumed on social media, alongside information produced by non-traditional news outlets, influencers and creators, politicians and activists, and ordinary social media users (Park et al., 2025, p. 98).
These findings could be interpreted as showing symmetrical, polarised patterns of selective exposure amongst Yes and No voters. No voters were more likely to consume Murdoch and commercial print, radio and television news. Yes voters were more likely to consume non-Murdoch print and online media (including ABC online news content) as well as public broadcaster television and radio. This finding aligns with a wealth of other research that shows news audiences selectively expose themselves to news that aligns with their existing political views (Muise et al., 2022; Peterson et al., 2021; Stroud, 2008, 2011; Van der Meer et al., 2020).
However, although News Corp is partisan news (Fielding et al., 2025), other major commercial television and radio news outlets also skew rightwards (Ad Fontes Media, 2025; Ward, 2015), and both mainstream and social media content contributed to the collective media coverage that presented the Voice in a polarising and divisive style (Esau et al., 2025; Graham, 2026; Phillips et al., 2024), the ABC is not partisan in the same way. The ABC is legislated to produce neutral news that contains diverse perspectives and is held accountable in doing so (Australian Broadcasting Corporation, 2023; Ricketson & Mullins, 2022). The ABC’s own Election Review Committee found the public broadcaster “included diverse voices and opinions” in their referendum coverage (Australian Broadcasting Corporation, 2023). Although audiences do selectively expose themselves to news media that aligns with their existing views, studies have shown audiences also choose news that includes a diversity of perspectives when it is available (Dilliplane, 2011; Garrett & Stroud, 2014; Holbert et al., 2010; Knobloch-Westerwick & Meng, 2009; Zumofen et al., 2024). Furthermore, 49 respondents identified that they consumed left-leaning outlet The Guardian, with 84% (n = 41) of these respondents stable Yes voters. Thus, while Yes voters may have selected other major left-wing partisan media outlets, including major television and radio outlets if available to them, they nevertheless were most likely to choose ABC news, which includes a diversity of perspectives. As such, Voice media consumption does not neatly reflect symmetrical partisan selective exposure and polarisation; rather, No voters turned to more partisan content, and Yes voters to more balanced, neutral news.
Nevertheless, whether public and balanced, or commercial and imbalanced, the amplification of elite conflict by all types of media may have reproduced polarised narratives, including negative and emotional claims about opposing sides. This news coverage presented the Voice as a divisive concept in line with the No campaign’s claims (Esau et al., 2025; Fielding et al., 2025; Son et al., 2026). Indeed, Fielding et al. (2025) found that one of the strategies of News Corp’s conservative advocacy against the Voice was to attack Yes advocates. Other studies demonstrate that partisan media audiences have more negative views of their opposition (Levendusky, 2013; Smith & Searles, 2014). Social media content was similarly polarised, with No campaign messaging emphasising the accusation that the Voice was “divisive” (Graham, 2026; Phillips et al., 2024). Esau et al. (2025) suggest the polarising Voice news media dynamic may have intensified audiences’ attachment to their own side and opposition to the other’s. This divisive horse-race style of news coverage may also have driven audiences into more self-selecting and polarised media use; stable Yes voters turned away from media they perceived to be biased against Yes, and No voters turned away from media they perceived to be biased against No, an observation regularly platformed by News Corp (Fielding et al., 2025). As per the idea, selective exposure is driven not just by confirmation bias but also identity expression (Hart et al., 2020); this finding raises interesting questions about how media choices may be influenced by voters selecting news media that aligns with their pre-existing political views and preferences and also reinforced by an aversion to what is framed as negative media about their side.
The potential for reinforcement of selective exposure and, in turn, news media polarisation amongst different types of voters through a process of both exposure to consonant media and avoidance of discordant media aligns with the reinforcing spirals framework (Carmichael & Brulle, 2018; Feldman et al., 2014; Slater, 2007, 2015). Such news media consumption habits have been suggested to strengthen existing attitudes, leaving people less open to changing their mind (Levendusky, 2024). As per Gavin’s (2018) challenge to the minimal influence theory, the reinforcement of existing views is an important democratic effect; when voters are less open to changing their mind no matter what information they access, this can influence the result of an election. This is particularly true in a context like Australia, where compulsory voting means voters cannot opt out altogether. While we cannot rule out that participants may have changed their views or their media coverage during the Voice campaign prior to the survey, we can confirm that within the time frame of the survey, stable voting patterns were associated with more differentiated partisan news media consumption.
Gavin’s (2018) suggestion that the public are more dependent on news media coverage about issues unrelated to their personal experience is also relevant to the Voice referendum. In 2022, only 45% of Australians had good knowledge of Indigenous histories, and 33% of Indigenous cultures (Nelson, 2022). Thus, it could be assumed that many Australians are unaware of the drivers and consequences of structural inequality the Voice aimed to help address. Arguments such as Klapper’s (1960) and Bennett and Iyengar’s (2008), which suggest media have little effect beyond reinforcement of views, also tend not to explain how news media use interacts with voters’ initial formation of policy views. In the present data, the Voice referendum represented a voting issue for which the Australian public had never been asked to make a decision before. It can, however, be assumed that in making their decision, voters were informed by their existing views on other related issues, such as their views about whether Indigenous Australians are discriminated against (Accent Research, 2023), and these views may have been influenced by their historic consumption of news media.

4.2. Unstable Voters and Disengagement from Media

Where stable voters were found to have distinct patterns of news media usage aligning with their voting behaviours, unstable voters—the 23% who had unknown voting intention at Time 1 or switched from one side to the other—did not exhibit recognisable patterns of selective exposure in line with their voting. This study thus offers useful insights to help understand how uncertain voters have less predictable media habits than those who are more decided about their voting intentions. Less-certain voters are often deemed to be most democratically important because they switch or swing as the campaign unfolds and ultimately decide the outcome of close contests. Although it may seem positive that this group is not selectively exposing themselves to news media, but are instead consuming a diverse range of media seemingly unaligned with their voting behaviours, this study also finds that unstable voters use fewer types of media overall as compared to stable voters, which could have troubling ramifications for their democratic knowledge.
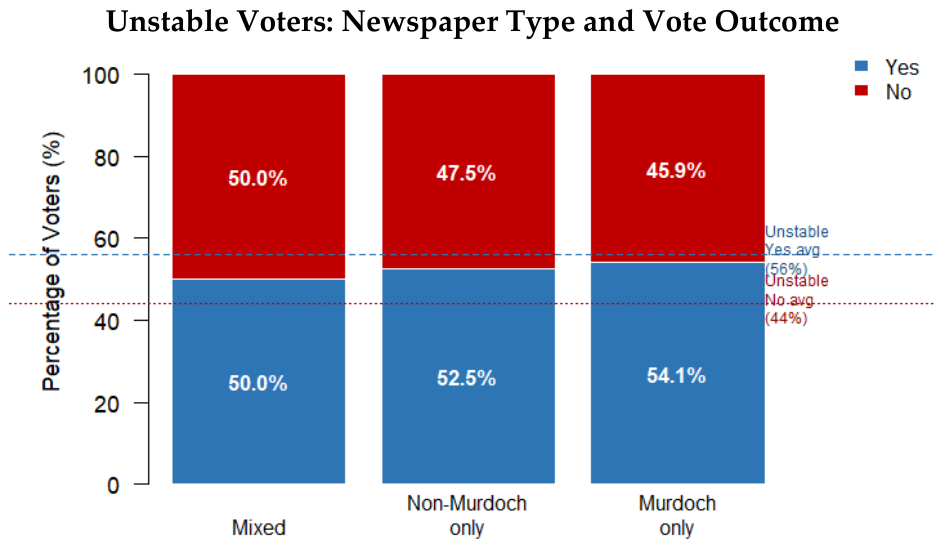
Figure 5 compares unstable voters’ newspaper choices to unstable voters overall (44% (n = 153) No voters and 56% (n = 197) Yes voters). Unlike stable voters, the group of unstable voters most likely to vote No used a mix of Murdoch and non-Murdoch news (50%, n = 12), followed by those who only consumed non-Murdoch media (47.5%, n = 28), with Murdoch-only audiences the least likely to move to No (45.9%, n = 28). A Chi-squared result of 0.12, p = 0.943, demonstrates that among non-stable voters, there is no association between the type of media they consumed and their vote preference, noting the small sample sizes.
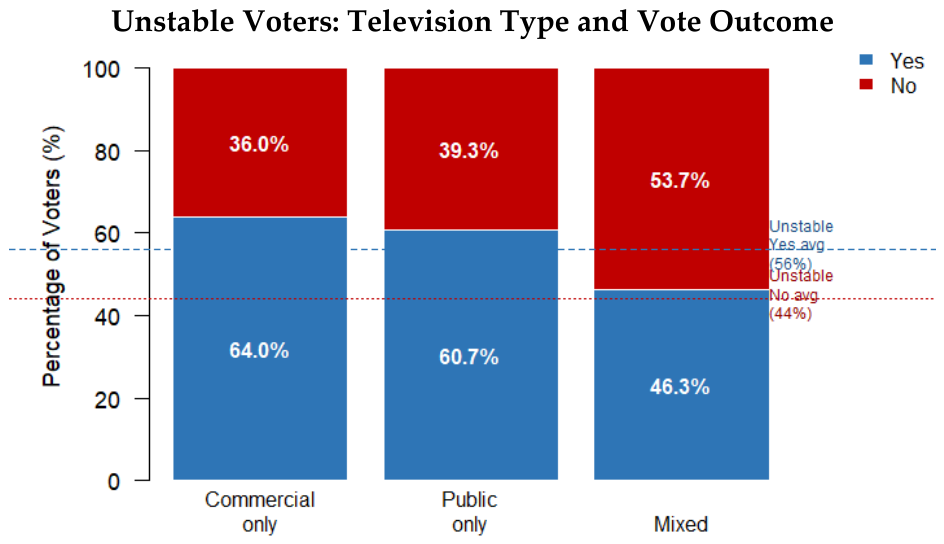
The same lack of patterned media usage is evident in unstable voters’ television choices when compared to the 44% of unstable voters voting No (Figure 6). Contradicting the trend amongst stable voters, unstable public television voters had a higher percentage of No voters (39.3%, n = 22) than unstable commercial television viewers (36%, n = 27). The most likely No voters amongst unstable television audiences were those consuming a mix of public and commercial television (53.7%, n = 51). This lack of pattern is evidenced in Chi-squared analysis, with the result of 6.06, p = 0.048, revealing a weak association between the type of television channels the participants consumed and their vote preference. However, unlike stable voters, the difference is not between commercial and public channels; rather, television viewers who consumed a mixture of commercial and public channels were more likely to vote No compared to commercial only and public only.
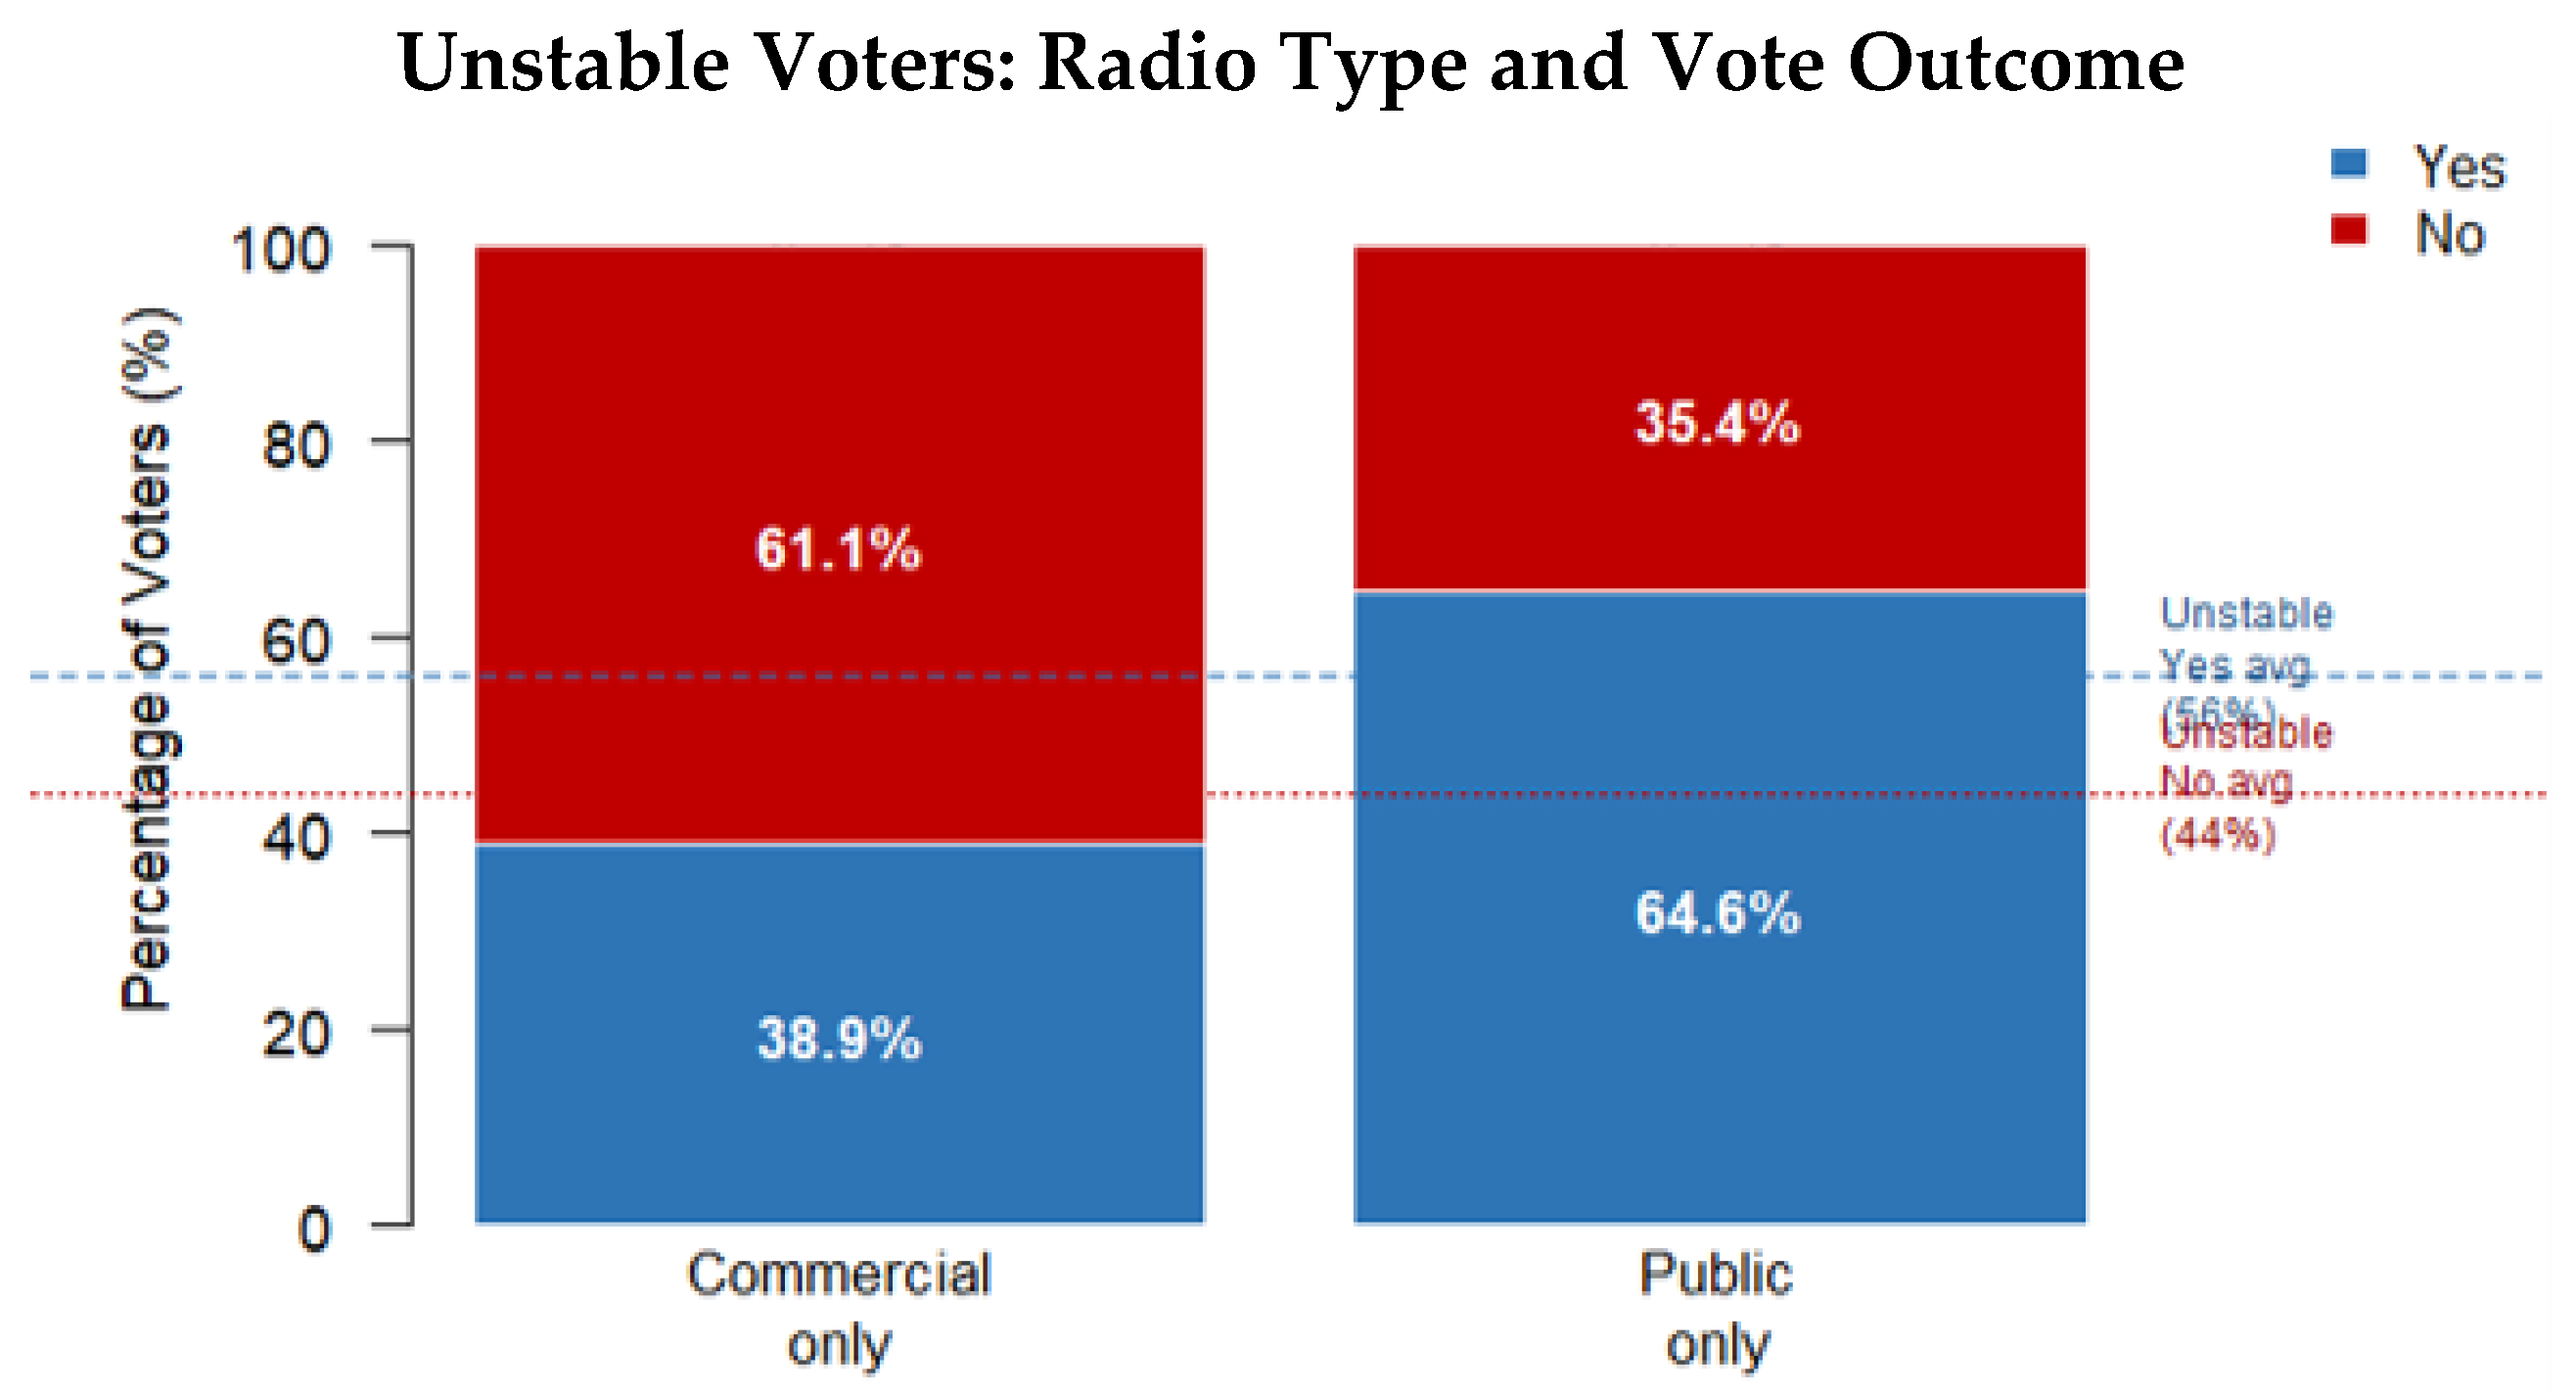
Amongst unstable radio listeners, public radio listeners were more likely to vote Yes (64.6%, n = 31), with commercial radio listeners split evenly between Yes and No (Figure 7). This lack of correlation between voting and media usage is demonstrated by a Chi-square analysis result of 3.54, p = 0.060 (p > 0.05). Thus, amongst unstable voters, there is no association between the type of radio channels the participants consumed and their Voice vote.
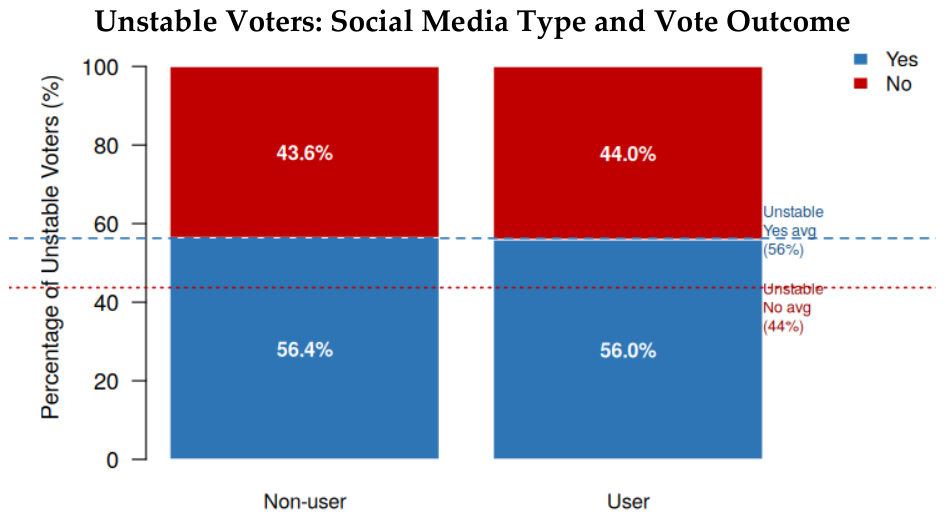
Finally, there was no difference identified in social media usage between those using social media and all unstable voters (Figure 8, both approximately 44% No; social media user No voters, n = 48). The Chi-square result of 0.01, p = 0.935, reveals this lack of a relationship.
The lack of pattern of voting decisions aligning with news media usage amongst unstable voters fits with the idea that less politically engaged people are less likely to selectively expose themselves to like-minded news media (Stroud, 2008). Although, notionally, it is positive for democracy that unstable voters use more diverse sources of news media than stable voters, potentially because they are looking for information to make their decision (Knobloch-Westerwick & Meng, 2009), research also suggests that selective exposure motivates participation in politics (Dilliplane, 2011; Knobloch-Westerwick, 2014). From this perspective, when audiences are not self-selecting they are potentially reducing their participation in political processes. Additionally, access to cross-cutting perspectives has been proposed to delay voting decisions, either through confusion or contradictory information making their decision harder (Matthes, 2012). Media patterns for unstable voters thus can be interpreted as more beneficial (if more informed) or less beneficial (if less engaged) for democracies.
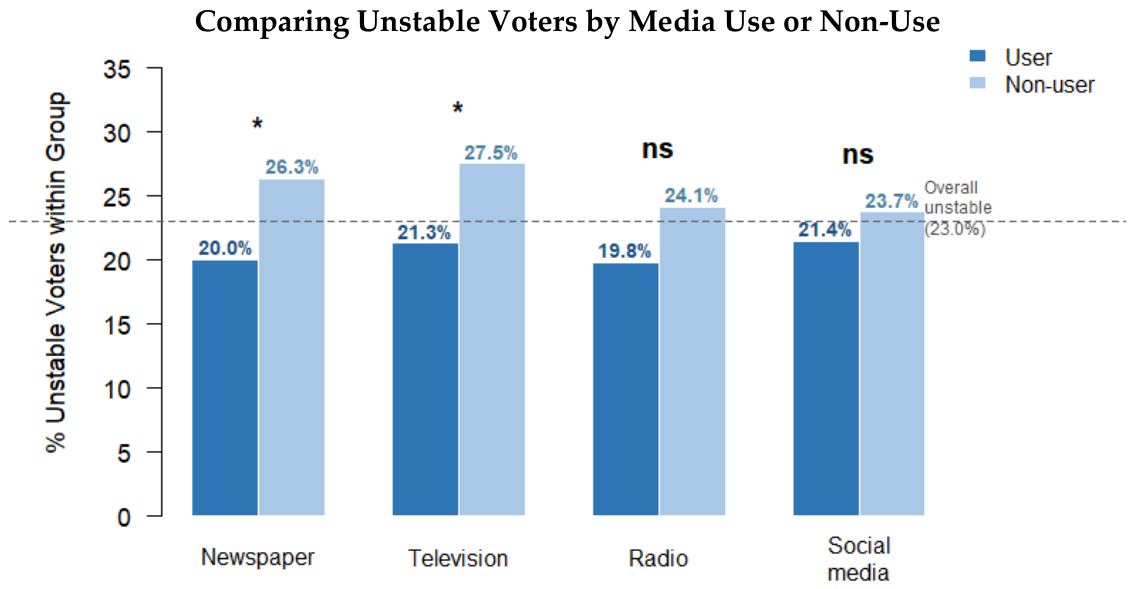
Taken together, the democratic impact of unstable voters’ media consumption here is argued to be less positive when coupled with the finding that this cohort was found to use fewer types of media overall as compared to stable voters. As Figure 9 shows, the four categories of respondents who selected that they were non-users of newspaper, television, radio and social media are disproportionately more likely to be unstable voters as compared to stable voters. The relationship between unstable voters and non-users of newspaper and television is found to be particularly significant, with a Chi-square result of 7.67, p = 0.006, for non-use of newspapers and Chi-square = 6.71, p = 0.009, for non-use of television.
Another way to view this finding is by comparing the number of media types used amongst stable and unstable voters (Table 2). This analysis demonstrates that 43% of unstable voters used two, three or four types of media, compared to 58% of stable voters who used two, three or four media types. Additionally, 47% of unstable voters used only one type of media.
Although it might seem rational that in a democratic system with compulsory voting, unstable users would be more likely than stable voters to seek out information about the Voice from different types of media to help make up their minds, unstable voters are suggested to be less engaged in the democratic process and thus less likely to actively seek out information. This finding fits with studies finding political media exposure contributes to greater political participation (Ha et al., 2013; Strömbäck & Shehata, 2010). The relationship between the non-use of newspapers, television and, to a lesser extent, radio news and unstable voters also agrees with Strömbäck et al.’s (2013) study, which found that interest in politics increased engagement with all types of media, with this correlation particularly strong for print and online morning newspapers (less so for tabloids), television news, and public service radio. These results also align with Ksiazek et al.’s (2019) study, which found that those who use less media are less likely to vote; those with less political participation are also suggested to use fewer types of media to inform their decision. Additionally, although it seems counterintuitive that stable voters consumed more types of media about the Voice, considering their minds were made up, this finding fits with other studies that found that partisan voters who have made their decision continue to follow news media coverage to reinforce their existing views and to observe the contest (Kitchens et al., 2003).
It should be noted that unstable voters included a mixture of those who changed their position (n = 110, 7%) and those who were undecided at Time 1 (n = 239, 16%), with differences between these cohorts difficult to ascertain with small sample sizes. Thus, amongst the different types of unstable voters, there may also be differences in engagement that are not captured here. For instance, Ha et al. (2013) found partially decided voters engaged in social and online media, whereas totally undecided voters were disengaged. Furthermore, Samuel-Azran et al.’s (2022) finding that decided voters were more critical of media coverage, but nonetheless consumed more of it than undecided voters, adds weight to the idea that undecided voters are less invested in the process. As such, where the divisive, polarising coverage of the Voice referendum is proposed to have helped push stable voters into a reinforcing spiral, so too may it have deterred less-engaged unstable voters from consuming media about the Voice. From this perspective, the present finding of unstable voters using fewer types of media could be a case of media malaise, where media increases cynicism and disengagement from politics (Ha et al., 2013), with news avoidance linked with news negativity, disempowerment (Boukes & Vliegenthart, 2017; Skovsgaard & Andersen, 2020), concerns about trustworthiness and bias (Park et al., 2025), and commercial media having a more negative effect than public service media (Aarts & Semetko, 2003).
That unstable voters used fewer types of media about the Voice also fits with other studies that have found that rather than selectively choosing partisan news, audiences would prefer to tune out altogether and watch entertainment media (Arceneaux et al., 2013; Feldman et al., 2014). Synthesising these ideas, it is possible the divisive, polarising nature of Voice media coverage was associated with those without firm voting views opting out of the political debate and disengaging with the process. Although voters cannot opt out of voting altogether in the Australian system, they can opt out of news media coverage, leaving themselves less informed when casting their vote. Furthermore, in the majority of democracies, those turned off by the tenor of the political debate can opt out altogether, which is not a positive outcome for individual citizens and the collective health of democracy.

4.3. Strengths and Limitations

The strength of this research lies in its longitudinal measurement of voting intentions at two points in a democratic contest, in comparison to types of media consumption. Future studies could strengthen this approach through more regular surveys about voting intentions as well as media usage across a democratic cycle rather than only surveying media usage after voting is complete. Furthermore, where this study measured only which types of media and outlets Voice voters used, other studies could gather more detailed data about media consumption habits, such as how regularly voters use different types of media and for how long. Additionally, although surveys of media consumption have been criticised as over-estimating levels of selective exposure, potentially due to failure to recall media usage in detail (Prior, 2013), by asking respondents which media they used to source information about the Voice, conclusions can be drawn about which types of media and which media organisations are most valued and trusted by Australian audiences during democratic contests, with these judgements of source credibility argued to have a large influence on which media audiences are indeed exposed to, whether selectively, routinely or incidentally (Heiss & Matthes, 2019; Van der Meer et al., 2020). That is, audiences are suggested to prefer some media sources over others, and these sources are those they are both more likely to consume and more likely to choose amongst survey options, including as an expression of their self-identity (Hart et al., 2020).

5. Conclusions

News media’s idealised role in a democracy is as facilitator of diverse and balanced information to help voters deliberate effectively. The model voter is assumed to be one that does not make up their mind during democratic contests until they have weighed diverse and balanced information sourced from news media. This study demonstrates that not only are these ideals not reflected in practice, they are also difficult to empirically analyse because of the diverse array of complex variables at play regarding democratic decisions, audience preference for diverse formats and types of media, and the influence of this media on decision-making. Coupled with this complexity are conflicting ideas in the field about the extent of self-selection and polarisation, the influence of self-selection and its potential to reinforce existing views, whether any media has the potential to reinforce or change people’s minds, and where historic media exposure has shaped contemporary decisions.
This study contributes insights to help understand how different types of news media are used by voters during democratic contests through finding that stable and unstable voters during the Voice referendum exhibited potentially positive democratic attributes and problematic ones. Stable voters who had made up their mind early in the referendum campaign were found to seek out more types of media overall, which is argued to be a positive sign of democratic engagement.
Regarding their levels of selective exposure, which is viewed in scholarship as democratically mixed due to its reinforcement of existing views but also a motivator of political engagement, Yes and No voters were not found to have the same experience. Due to the complexity of Australia’s concentrated media system, Yes voters were more likely to be exposed to diverse and balanced views about the Voice via the public broadcaster. No voters were more likely exposed to News Corp’s pro-No partisan coverage and more polarising and sensationalist commercial media content, where major outlets also lean to the right. This coverage potentially made their No choices more concrete and extreme and less open to Yes arguments as the campaign unfolded (Gavin, 2018; Levendusky, 2024).
Although it could be argued that news media coverage and social media contestation during the referendum mirrored the conflict-driven nature of the referendum itself, News Corp’s advocacy coverage has also been argued to have emphasised the No campaign’s claims of the divisive nature of the Voice (Fielding et al., 2025), which influenced other media coverage and, in turn, the political and public agenda (Son et al., 2026). It is possible that the polarising coverage may also have contributed to greater selective exposure amongst stable voters, who turned towards sources more positive about their side and away from sources more negative. This may have resulted in stable voters being less open to changing their minds and, particularly for No voters, less likely to be exposed to Yes arguments, a result that is not positive for democratic deliberation.
The democratic consequence of media choices amongst unstable voters is also mixed. Unstable voters did not have clear patterns of selective exposure aligning with their ultimate voting decisions, which could have exposed them to more diverse views. Yet, this 23% of voters was also found to use fewer types of media overall as compared to stable voters. The lower engagement in different types of media is proposed to reflect this cohort’s lesser engagement with the referendum process, which may have resulted in lesser interest in news media and led to less information-seeking to inform their decisions. The pattern is consistent with a media malaise effect (Ha et al., 2013), whereby voters would prefer to turn off news rather than selectively expose themselves (Arceneaux et al., 2013). In the present data, the divisive, polarising media coverage about the Voice potentially led to news avoidance rather than information seeking among some respondents, contributing to a disengagement from the democratic process. In non-mandatory democracies, many unstable voters who do not have firm views on questions such as a referendum are likely to not only disengage from media but to not vote at all, which is a negative democratic outcome. Even in the context of the Australian compulsory voting system, it is not considered democratically beneficial for voters to make their decisions without informing themselves of competing arguments, particularly on an issue for which they have no lived experience, such as Indigenous peoples’ experience of colonisation, discrimination and structural inequality.

Author Contributions

Conceptualization, V.F., W.L., S.W. and S.S.; methodology, W.L., S.W. and J.D.A.; software, W.L., S.W. and J.D.A.; validation, W.L., S.W. and J.D.A.; formal analysis, W.L., S.W. and J.D.A.; investigation, W.L., S.W. and J.D.A.; resources, W.L., S.W. and J.D.A.; data curation, V.F. and S.W.; writing—original draft preparation, V.F. and S.W.; writing—review and editing, V.F., S.S., S.W., W.L., J.D.A. and E.A.H.; visualization, S.W. and V.F.; supervision, W.L.; project administration, W.L.; funding acquisition, W.L. All authors have read and agreed to the published version of the manuscript.

Funding

This research was funded by the Australian Research Council Discovery Project DP220101566.

Institutional Review Board Statement

The study was conducted in accordance with the Australian National Statement on Ethical Conduct in Human Research (2023), and approved by the University of Queensland Human Research Ethics Committee B (project number 2023/HE001189, approved on 10 September 2025).

Informed Consent Statement

Informed consent was obtained from all subjects involved in the study.

Data Availability Statement

The data presented in this study are available on request from the corresponding author due to restrictions from the University of Queensland Human Research Ethics Committee.

Conflicts of Interest

The authors declare no conflicts of interest.

Notes

1
Participants were excluded if they did not complete the survey, completed it in under five minutes (interpreted as insufficient engagement), were flagged by Qualtrics as bots or duplicate respondents, failed one or more attention-check items, or did not provide consent for their data to be used.
2
Non-commercial community and not-for-profit radio stations were coded as “public” to differentiate them from commercial stations.

References

  1. Aarts, K., & Semetko, H. A. (2003). The divided electorate: Media use and political involvement. The Journal of Politics, 65(3), 759–784. [Google Scholar] [CrossRef]
  2. ABS. (2026). Education and work, Australia. Australian Bureau of Statistics. Available online: https://www.abs.gov.au/statistics/people/education/education-and-work-australia/latest-release#qualifications-held (accessed on 19 June 2026).
  3. Accent Research. (2023). An octopus group accent research report, understanding voter behaviour at the voice referendum: A first look. Available online: https://www.accent-research.com/voice (accessed on 20 November 2025).
  4. Ad Fontes Media. (2025). Interactive media bias chart. Ad Fontes Media. Available online: https://app.adfontesmedia.com/chart/interactive (accessed on 19 June 2026).
  5. AHRC. (2023). Referendums and constitutional change. Australian Human Rights Commission. Available online: https://humanrights.gov.au/know-your-rights/rights-of-individuals/aboriginal-and-torres-strait-islander-peoples-rights/articles-aboriginal-and-torres-strait-islander-peoples/referendums-and-constitutional-change (accessed on 22 January 2025).
  6. Arceneaux, K., Johnson, M., & Cryderman, J. (2013). Communication, persuasion, and the conditioning value of selective exposure: Like minds may unite and divide but they mostly tune out. Political Communication, 30(2), 213–231. [Google Scholar] [CrossRef]
  7. Australian Broadcasting Corporation. (2023). Australian broadcasting corporation 2023 voice to parliament referendum report of the chair, referendum coverage review committee. Australian Broadcasting Corporation. [Google Scholar]
  8. Behrendt, L. (2003). Achieving social justice: Indigenous rights and Australia’s future. Federation Press. [Google Scholar]
  9. Bennett, W. L., & Iyengar, S. (2008). A new era of minimal effects? The changing foundations of political communication. Journal of Communication, 58, 707–731. [Google Scholar] [CrossRef]
  10. Boukes, M., & Vliegenthart, R. (2017). News consumption and its unpleasant side effect: Studying the effect of hard and soft news exposure on mental well-being over time. Journal of Media Psychology, 29(3), 137–147. [Google Scholar] [CrossRef]
  11. Carmichael, J. T., & Brulle, R. J. (2018). Media use and climate change concern. International Journal of Media & Cultural Politics, 14(2), 243–253. [Google Scholar] [CrossRef] [PubMed]
  12. Chan, M., & Yi, J. (2024). Examining how public service media shapes citizens’ news media attitudes and news avoidance: A cross-national comparative analysis. International Journal of Communication, 18, 21. [Google Scholar] [CrossRef]
  13. Coleman, S., & Blumler, J. (2012). The internet and citizenship: Democratic opportunity or more of the same? In H. A. Semetko, & M. Scammell (Eds.), The SAGE handbook of political communication. Sage Publications. [Google Scholar]
  14. Copland, S., Bruns, A., & Graham, T. (2025). Sky News Australia as network propaganda: How a niche cable channel became an international right-wing propaganda machine. Media International Australia. [Google Scholar] [CrossRef]
  15. Curran, J., Coen, S., Soroka, S., Aalberg, T., Hayashi, K., Hichy, Z., Iyengar, S., Jones, P., Mazzoleni, G., & Papathanassopoulos, S. (2014). Reconsidering ‘virtuous circle’ and ‘media malaise’ theories of the media: An 11-nation study. Journalism, 15(7), 815–833. [Google Scholar] [CrossRef]
  16. Dahl, R. A. (1998). On democracy. Yale University Press. [Google Scholar]
  17. Davis, M. (2023). Voice of reason: On recognition and renewal: Quarterly essay 90 (Vol. 90). Quarterly Essay. [Google Scholar]
  18. Dilliplane, S. (2011). All the news you want to hear: The impact of partisan news exposure on political participation. Public Opinion Quarterly, 75(2), 287–316. [Google Scholar] [CrossRef]
  19. Dwyer, T., & Wilding, D. (2023). Media pluralism and online news: The consequences of automated curation for society. Intellect. [Google Scholar]
  20. Dwyer, T., Wilding, D., & Koskie, T. (2021). Australia: Media concentration and deteriorating conditions for investigative journalism. In J. Trappel, & T. Tomaz (Eds.), The Media for democracy monitor 2021: How leading news media survive digital transformation (Vol. 1, pp. 59–94). Nordicom, University of Gothenburg. [Google Scholar]
  21. Esau, K., Bruns, A., Riedlinger, M., Vilkins, S., Vodden, L., & Myint, T. Z. (2025). Division, not reconciliation: Mapping news media polarisation during Australia’s indigenous voice to parliament referendum. Media International Australia, 197(1), 7–34. [Google Scholar] [CrossRef]
  22. Esser, F. (2008). History of media effects. In W. Donsbach (Ed.), The international encyclopedia of communication (pp. 2891–2896). Wiley Publishing. [Google Scholar]
  23. Evershed, N., & Nicholas, J. (2023). Voice referendum 2023 poll tracker: Latest results of opinion polling on support for yes and no campaign. The Guardian. Available online: https://www.theguardian.com/news/datablog/ng-interactive/2023/oct/13/indigenous-voice-to-parliament-referendum-2023-poll-results-polling-latest-opinion-polls-yes-no-campaign-newspoll-essential-yougov-news-by-state-australia (accessed on 20 November 2025).
  24. Feldman, L., Myers, T. A., Hmielowski, J. D., & Leiserowitz, A. (2014). The mutual reinforcement of media selectivity and effects: Testing the reinforcing spirals framework in the context of global warming. Journal of Communication, 64(4), 590–611. [Google Scholar] [CrossRef]
  25. Feldman, L., Stroud, N. J., Bimber, B., & Wojcieszak, M. (2013). Assessing selective exposure in experiments: The implications of different methodological choices. Communication Methods and Measures, 7(3–4), 172–194. [Google Scholar] [CrossRef]
  26. Fielding, V., Son, C., Boucaut, R., & Beare, A. H. (2025). News corp Australia’s conservative advocacy against the indigenous voice to parliament. International Journal of Communication, 19, 21. [Google Scholar]
  27. Gaber, I., & Tiffen, R. (2018). Politics and the media in Australia and the United Kingdom: Parallels and contrasts. Media International Australia, 167(1), 27–40. [Google Scholar] [CrossRef]
  28. Garrett, R. K., & Stroud, N. J. (2014). Partisan paths to exposure diversity: Differences in pro-and counterattitudinal news consumption. Journal of Communication, 64(4), 680–701. [Google Scholar] [CrossRef]
  29. Gavin, N. T. (2018). Media definitely do matter: Brexit, immigration, climate change and beyond. The British Journal of Politics and International Relations, 20(4), 827–845. [Google Scholar] [CrossRef]
  30. Graham, T. (2026). Exploring a post-truth referendum: Australia’s voice to parliament and the management of attention on social media. Media International Australia, 198(1), 152–175. [Google Scholar]
  31. Griffen-Foley, B., & Lindgren, M. (2024). Radio. In B. Griffen-Foley (Ed.), The media and communications in Australia (5th ed., pp. 133–145). Routledge. [Google Scholar]
  32. Ha, L. S., Wang, F., Fang, L., Yang, C., Hu, X., Yang, L., Yang, F., Xu, Y., & Morin, D. (2013). Political efficacy and the use of local and national news media among undecided voters in a swing state: A study of general population voters and first-time college student voters. Electronic News, 7(4), 204–222. [Google Scholar] [CrossRef]
  33. Hart, W., Richardson, K., Tortoriello, G. K., & Earl, A. (2020). ‘You are what you read:’ Is selective exposure a way people tell us who they are? British Journal of Psychology, 111(3), 417–442. [Google Scholar] [PubMed]
  34. Heiss, R., & Matthes, J. (2019). Does incidental exposure on social media equalize or reinforce participatory gaps? Evidence from a panel study. New Media & Society, 21(11–12), 2463–2482. [Google Scholar] [CrossRef]
  35. Hill, L. (2002). On the reasonableness of compelling citizens to ‘vote’: The Australian case. Political Studies, 50(1), 80–101. [Google Scholar] [CrossRef]
  36. Holbert, R. L., Garrett, R. K., & Gleason, L. S. (2010). A new era of minimal effects? A response to Bennett and Iyengar. Journal of Communication, 60(1), 15–34. [Google Scholar] [CrossRef]
  37. Iyengar, S., & Hahn, K. S. (2009). Red media, blue media: Evidence of ideological selectivity in media use. Journal of Communication, 59(1), 19–39. [Google Scholar] [CrossRef]
  38. Kitchens, J. T., Powell, L., & Williams, G. (2003). Information, please? Information seeking, mass media, and the undecided voter. Communication Research Reports, 20(1), 73–80. [Google Scholar] [CrossRef]
  39. Klapper, J. T. (1960). The effects of mass communication. The Free. [Google Scholar]
  40. Knobloch-Westerwick, S. (2014). Choice and preference in media use: Advances in selective exposure theory and research. Routledge. [Google Scholar]
  41. Knobloch-Westerwick, S., & Meng, J. (2009). Looking the other way: Selective exposure to attitude-consistent and counterattitudinal political information. Communication Research, 36(3), 426–448. [Google Scholar]
  42. Knobloch-Westerwick, S., & Meng, J. (2011). Reinforcement of the political self through selective exposure to political messages. Journal of Communication, 61(2), 349–368. [Google Scholar] [CrossRef]
  43. Knobloch-Westerwick, S., Mothes, C., & Polavin, N. (2020). Confirmation bias, ingroup bias, and negativity bias in selective exposure to political information. Communication Research, 47(1), 104–124. [Google Scholar] [CrossRef]
  44. Ksiazek, T. B., Kim, S. J., & Malthouse, E. C. (2019). Television news repertoires, exposure diversity, and voting behavior in the 2016 US election. Journalism & Mass Communication Quarterly, 96(4), 1120–1144. [Google Scholar] [CrossRef]
  45. Levendusky, M. (2013). Partisan media exposure and attitudes toward the opposition. Political Communication, 30(4), 565–581. [Google Scholar] [CrossRef]
  46. Levendusky, M. (2024). How partisan media polarize America. University of Chicago Press. [Google Scholar]
  47. Matthes, J. (2012). Exposure to counterattitudinal news coverage and the timing of voting decisions. Communication Research, 39(2), 147–169. [Google Scholar] [CrossRef]
  48. Muise, D., Hosseinmardi, H., Howland, B., Mobius, M., Rothschild, D., & Watts, D. J. (2022). Quantifying partisan news diets in Web and TV audiences. Science Advances, 8(28), eabn0083. [Google Scholar] [CrossRef] [PubMed]
  49. Murdock, G., Brevini, B., & Ward, M. (2024). News corp: Empire of influence. Routledge. [Google Scholar]
  50. Nelson, D. (2022). Australian reconciliation barometer 2022 full research report. Reconciliation Australia. [Google Scholar]
  51. Park, S., Fisher, C., McGuinness, K., Lee, J., Fujita, M., Haw, A., McCallum, K., & Nardi, G. (2025). Digital news report: Australia 2025. News and Media Research Centre, University of Canberra. [Google Scholar]
  52. Peterson, E., Goel, S., & Iyengar, S. (2021). Partisan selective exposure in online news consumption: Evidence from the 2016 presidential campaign. Political Science Research and Methods, 9(2), 242–258. [Google Scholar] [CrossRef]
  53. Phillips, J., Carson, A., & Jackman, S. (2024). Issue agenda-setting in the voice to parliament referendum: Using big data to explain voice discourse on traditional and social media. Australian Journal of Political Science, 59(3), 344–359. [Google Scholar] [CrossRef]
  54. Prior, M. (2013). Media and political polarization. Annual Review of Political Science, 16(1), 101–127. [Google Scholar] [CrossRef]
  55. Ricketson, M., & Mullins, P. (2022). Who needs the ABC?: Why taking it for granted is no longer an option. Scribe Publications Pty Limited. [Google Scholar]
  56. Samuel-Azran, T., Yarchi, M., & Hayat, T. (2022). Less critical and less informed: Undecided voters’ media (dis) engagement during Israel’s April 2019 elections. Information, Communication & Society, 25(12), 1752–1768. [Google Scholar] [CrossRef]
  57. Schudson, M., & Anderson, C. (2009). Objectivity, professionalism, and truth seeking in journalism. In K. Wahl-Jorgensen, & T. Hanitzsch (Eds.), The handbook of journalism studies (pp. 108–121). Routledge. [Google Scholar]
  58. Skovsgaard, M., & Andersen, K. (2020). Conceptualizing news avoidance: Towards a shared understanding of different causes and potential solutions. Journalism Studies, 21(4), 459–476. [Google Scholar] [CrossRef]
  59. Slater, M. D. (2007). Reinforcing spirals: The mutual influence of media selectivity and media effects and their impact on individual behavior and social identity. Communication Theory, 17(3), 281–303. [Google Scholar] [CrossRef]
  60. Slater, M. D. (2015). Reinforcing spirals model: Conceptualizing the relationship between media content exposure and the development and maintenance of attitudes. Media Psychology, 18(3), 370–395. [Google Scholar] [CrossRef] [PubMed]
  61. Smith, G., & Searles, K. (2014). Who let the (attack) dogs out? New evidence for partisan media effects. Public Opinion Quarterly, 78(1), 71–99. [Google Scholar] [CrossRef]
  62. Son, C., Fielding, V., Beare, A., & Boucaut, R. (2026). An agenda feedback wheel: News corp’s coverage of the marcia langton ‘racism’ controversy. Journalism and Media, 7(1), 4. [Google Scholar] [CrossRef]
  63. Stroud, N. J. (2008). Media use and political predispositions: Revisiting the concept of selective exposure. Political Behavior, 30(3), 341–366. [Google Scholar] [CrossRef]
  64. Stroud, N. J. (2011). Niche news: The politics of news choice. Oxford University Press. [Google Scholar]
  65. Strömbäck, J., Djerf-Pierre, M., & Shehata, A. (2013). The dynamics of political interest and news media consumption: A longitudinal perspective. International Journal of Public Opinion Research, 25(4), 414–435. [Google Scholar] [CrossRef]
  66. Strömbäck, J., & Shehata, A. (2010). Media malaise or a virtuous circle? Exploring the causal relationships between news media exposure, political news attention and political interest. European Journal of Political Research, 49(5), 575–597. [Google Scholar] [CrossRef]
  67. Van der Meer, T. G. L. A., Hameleers, M., & Kroon, A. C. (2020). Crafting our own biased media diets: The effects of confirmation, source, and negativity bias on selective attendance to online news. Mass Communication and Society, 23(6), 937–967. [Google Scholar] [CrossRef]
  68. Ward, I. (2015). Tea party imitators? The campaign against the carbon tax, the media and a new uncivil politics. Australian Journal of Political Science, 50(2), 225–240. [Google Scholar] [CrossRef]
  69. Weeks, B. E., Lane, D. S., Kim, D. H., Lee, S. S., & Kwak, N. (2017). Incidental exposure, selective exposure, and political information sharing: Integrating online exposure patterns and expression on social media. Journal of Computer-Mediated Communication, 22(6), 363–379. [Google Scholar] [CrossRef]
  70. Young, S. A. (2011). How Australia decides: Election reporting and the media. Cambridge University Press. [Google Scholar]
  71. Zumofen, G., Stadelmann-Steffen, I., & Bühlmann, M. (2024). No, it is not all about selective exposure: Information selection strategies in referendums. Political Behavior, 46(3), 1771–1790. [Google Scholar] [CrossRef]
Figure 1. Newspaper readers (print and online) by voting behaviour, stable voters only (N = 576). Dashed line = total stable Yes% (41%).
Journalmedia 07 00157 g001
Figure 2. Television audiences by voting behaviour, stable voters only (N = 837). Dashed line = total stable Yes% (41%).
Journalmedia 07 00157 g002
Figure 3. Radio listeners by voting behaviour, stable voters only (N = 288). Dashed line = total stable Yes% (41%).
Journalmedia 07 00157 g003
Figure 4. Social media users by voting behaviour, stable voters only (N = 1175). Dashed line = total stable Yes% (41%).
Journalmedia 07 00157 g004
Figure 5. Newspaper readers by voting behaviour, unstable voters only, N = 144. Dashed lines = unstable voter averages (44% No, 56% Yes).
Journalmedia 07 00157 g005
Figure 6. Television audiences by voting behaviour, unstable voters only, N = 226. Dashed lines = unstable voter averages (44% No, 56% Yes).
Journalmedia 07 00157 g006
Figure 7. Radio audiences by voting behaviour, unstable voters only, N = 66. Dashed lines = unstable voter averages (44% No, 56% Yes). Note, mixed public and commercial excluded due to small sample size (n = 5).
Journalmedia 07 00157 g007
Figure 8. Social media audiences by voting behaviour, unstable voters only, N = 350. Dashed lines = unstable voter averages (44% No, 56% Yes). Note, mixed public and commercial excluded due to small sample size (n = 5).
Journalmedia 07 00157 g008
Figure 9. Use of media by stable and unstable voters, Dashed line = overall % unstable (23%). * denotes significant, ns denotes not significant.
Journalmedia 07 00157 g009
Table 1. News sources from which voters obtained information about Voice referendum.
Print or Online NewspapersNumberPercentage
Murdoch only29319%
Non-Murdoch only29219%
Mix of Murdoch and Non-Murdoch1359%
Total newspapers72047%
Television
Public TV only29319%
Commercial TV only35924%
Mix of Public and Commercial TV41127%
Total television106370%
Radio
Public Radio only20413%
Commercial Radio only1198%
Mix of Public and Commercial Radio362%
Total radio35924%
Social media
Social media user50933%
Total respondents1525
Table 2. Comparing number of type of media used by stable versus unstable voters.
Number of Media TypesStable (n)Stable (%)Unstable (n)Unstable (%)Total (N)
Four635%206%83
Three21418%4413%258
Two40034%8725%487
One40735%16447%571
No media918%3510%126
TOTAL1175100%350100%1525
Disclaimer/Publisher’s Note: The statements, opinions and data contained in all publications are solely those of the individual author(s) and contributor(s) and not of MDPI and/or the editor(s). MDPI and/or the editor(s) disclaim responsibility for any injury to people or property resulting from any ideas, methods, instructions or products referred to in the content.