Next Article in Journal
3D-Simulation of Wood Stacks to Analyze the Influence of Log Properties on Stack Volume
Previous Article in Journal
Comparative Morphology of the Leaf Epidermis in Four Species of Meliaceae L. Family
 
 
Please note that, as of 4 December 2024, Environmental Sciences Proceedings has been renamed to Environmental and Earth Sciences Proceedings and is now published here.
Proceeding Paper

Structural Diversity of Tree Stems of Elephant Camp Natural Forest in Omo Forest Reserve †

by
Oladele Fisayo Falade
* and
Janet Ugochukwu Iheke
Department of Forest Production and Products, University of Ibadan, Ibadan 200284, Nigeria
*
Author to whom correspondence should be addressed.
Presented at the 1st International Electronic Conference on Forests—Forests for a Better Future: Sustainability, Innovation, Interdisciplinarity, 15–30 November 2020; Available online: https://iecf2020.sciforum.net.
Environ. Sci. Proc. 2021, 3(1), 75; https://doi.org/10.3390/IECF2020-08087
Published: 13 November 2020

Abstract

:
Tree size diversity is an indicator of biodiversity values of a forest. Microsite conditions of a forest determine the survival and growth of trees. However, the contribution of variable habitats to tree size hierarchy and segregation is poorly understood. Tree size variation in a population is caused by different competition mechanisms. Therefore, the size distribution and spatial pattern of trees can identify the process governing resource utilisation in the forest. The objective of the study was to investigate the tree stem structural diversity in the Elephant Camp natural forest in the Omo Forest Reserve. Three and four 0.09 ha sample plots were established in Riparian (RF) and Old-growth forests (OF) in the Elephant Camp natural forest, respectively. The tree stems (Dbh ≥ 5cm) were identified to the species level and enumerated within each plot, and the stem density was computed. The diameter at breast height (Dbh) was measured with diameter tape. Species diversity was assessed using Shannon–Weiner (H’) and Simpson indices (1-D’), while size inequality was assessed using the Gini coefficient (GC), coefficient of variation (CV), H’ and I-D’. The performance of single two- and three-parameter Weibull models was evaluated using Kolmogorov–Smirnov (K-S) chi-square (χ2), root-mean-square error (RMSE), bias and the coefficient of determination (R2). Data were analysed using descriptive statistics. A total of 27 and 24 tree species were identified in RF and OF, respectively. The stem density of RF was significantly higher than that of OF. The values of species diversity (H’, 1-D’) and evenness (E’) were higher in OF than in RF, while richness (Margalef and number of species) was higher in RF than in OF. The Dbh was 38.30 ± 21.4 and 42.87 ± 19.2 cm in Riparian and Old-growth forests, respectively. Size-density distributions of both forests were positively skewed and expressed exponential pattern. The forest types of the Elephant Camp natural forest comprise the same size-density frequency shape but a different proportion of tree sizes and structural diversities.

1. Introduction

The structure of plant populations in a forest can be described by ages, sizes and forms of individual plants [1]. However, it is better to classify a plant by size because the fecundity and survival of plants are often related to plant size than age [1]. The diameter and height indicate the stem size. Therefore, diameter and height distributions are effective tools to describe the forest structure. The diameter is easy to measure and closely related to the height [2] and other tree attributes [3] of forest trees. Conversely, the structural diversity of a forest indicates the degree of variation in stem diameter and height and the spatial distribution [4]. Attributes of stem diameters provide detailed information about the stand [3,5]) and suggest underlying mechanisms controlling regeneration and mortality [6]. Hence, tree size diversity can be used as an indicator for commercial [7] and biodiversity values [1]. However, the contribution of water gradients to tree size and segregation is limited. Knowledge of the effect of a variable habitat is critical for understanding the factors controlling the forest structure. Tree size variation in a population is caused by different mechanisms. Moreover, understanding of competition among plant stems for periodic supplied resource is limited. The size distribution and spatial pattern of trees can identify the process governing resource utilisation in the forest. Therefore, the tree species and size diversity of two adjacent forest areas with different water regimes were investigated. The objective of the study was to investigate tree stem structural diversity of Riparian and Old-growth forests in the Elephant Camp natural forest.

2. Materials and Methods

2.1. The Study Area

The study was conducted in the elephant forest reserve in the Omo Forest Reserve. The Omo Forest Reserve is located between latitude 06°51′00″ N and 06°91′00″ N and longitude 04°22′48″ E and 04°32′48″ E at an altitude of 150 m above sea level (asl) in the Ijebu area of Ogun State in Southwest Nigeria [8]. It is one of the remaining protected forests in Southwest Nigeria. The Elephant Camp national forest covers approximately 55,000 ha (Figure 1).
A preliminary survey was conducted to observe the general physiognomy of the forest reserve, and it was observed that the forest was heterogenous based on its water regime. Therefore, the Elephant Camp natural forest was divided into two parts based on its water regime. A part of the forest with close proximity to the river course was referred to as Riparian forest, and the other part that was relatively far from the river course was referred to as Old-growth forest.

2.2. Demarcation of Sample Plots and Method of Data Collection

Four and three (30 m × 30 m) sample plots were established in the Riparian and Old-growth forests, respectively, using a hand compass and cloth tape. The corners of each sample plot were marked with a wooden peg and the boundary with red twine. Tree stems with ≥5 cm diameter at breast height (dbh) were identified at the species level and enumerated in sample plots. Flora of west tropical African [9] and woody plants of West Africa forests [10] were used for the identification of the plant species composition on the field with the assistance of taxonomists and authenticated with the collection of reference samples available in the herbarium of the Forestry Research Institute of Nigeria.
The forest structure of riparian and old-growth forests was estimated using tree species and size diversity indices and the tree diameter distribution. The species diversity indices were Shannon–Weiner and Simpson and Margalef indices [11].
The Shannon–Wiener species diversity index is expressed as Equation (1):
Environsciproc 03 00075 i001
Where ln is the natural logarithm and Pi is the percentage of individual trees represented by species i and is estimated by:
Environsciproc 03 00075 i002
where ni is the number of individuals of the ith species and Ni is the total number of individuals.
The Simpson species diversity index is expressed as Equation (2):
Environsciproc 03 00075 i003
where ni is the number of individuals of the ith species and N is the total number of individuals.
The Margalef index of species richness (Ma) is expressed as Equation (3):
M a = ( S 1 ) l n N
where S is the total number of species in the community, N is the total number individual trees, and ln is the natural logarithm.

2.3. Stem Diameter Distribution

The stem diameter of trees in Riparian and Old-growth forests was categorised into size classes of 3 cm dbh width, starting from the smallest to the largest. A histogram of the dbh classes was produced, and single two- and three-parameter Weibull distributions [12] were used for fitting size–density distributions of Riparian and Old-growth forests. The two- and three-parameter Weibull functions are expressed as Equations (4) and (5), respectively:
f x = c b ( x b ) c 1 exp ( ( x b ) c )
f x = c b ( x a b ) c 1 exp ( ( x a b ) c )
where x is the tree diameter and a, b and c are the location, scale and shape parameters of the distribution, respectively. In addition, a = 0 in the two-parameter Weibull function.

2.4. Data Analysis

Tree species diversity was calculated using Shannon–Weiner and Simpson indices. The number of tree species present and the Margalef index represented tree species richness. The important value index (IVI) was calculated for the tree species following the standard method [13,14]. The degree of size inequality of the diameter distribution of Riparian and Old-growth forests was characterised using the Gini coefficient (GC) [15], coefficient of variation (CV), dissimilarity coefficient, and Shannon–Weiner (H’), Simpson diversity and Margalef indices [5]. The size–density distribution of Riparian and Old-growth forests was fitted with single two- and three-parameter Weibull models, and parameter estimation of the Weibull models was performed using maximum likelihood estimate (MLE) technique because studies have shown that the MLE technique is superior to other parameter estimation methods [16]. In addition, the performance of single two- and three-parameter Weibull models was evaluated using goodness-of-fit tests such as Kolmogorov–Smirnov (K-S), Anderson–Darling (A-D), root-mean-square error (RMSE), bias and coefficient of determination (R2). The Gini coefficient (G) is expressed as Equation (6):
Environsciproc 03 00075 i004
where i = 1, n and j = 1, and χi and χj are the sizes of ith and jth plant, respectively.
G ranges from 0 (all individuals equal) to a theoretical maximum of 1.

3. Results

3.1. Tree Species Diversity Attributes of Riparian and Old-Growth Forests

A total of 27 and 24 tree species were identified in the Riparian and Old-growth forests, respectively (Table 1).
Milicia excelsa had the highest important value index (41.0%), followed by Terminali superba (27.0%) and Cordia millenii (26.0%) in the Riparian forest. In addition, Irvigia garbonensis had the highest important value index (36.0%), followed by Khaya ivorensis (30.0%) and Baphia nitida (23.0%), in the Old-growth forest. Therefore, these six tree species are ecologically important and the most widely distributed tree species in the Elephant Camp natural forest in the Omo Forest Reserve. Milicia excelsa, Terminali superba and Khaya ivorensis are pioneer species and belong to the upper canopy, while Cordia millenii belong to the lower canopy (Table 1).
The Riparian forest contained more tree stems per hectare (338.89 ± 9.80 stems/ha) compared to the Old-growth forest (296.30 ± 8.92 stems/ha). The Shannon–Weiner and Simpson indices were higher in the Old-growth forest than in the Riparian forest (Table 2). However, evenness and equitability indices of tree species were higher in the Riparian forest than in the Old-growth forest (Table 2). A comparison of Riparian and Old-growth forests at the species level using the Sorensen similarity index showed high (74.50%) similarity with nine tree species shared by the two forests.

3.2. Diameter Distribution of the Tree Stems

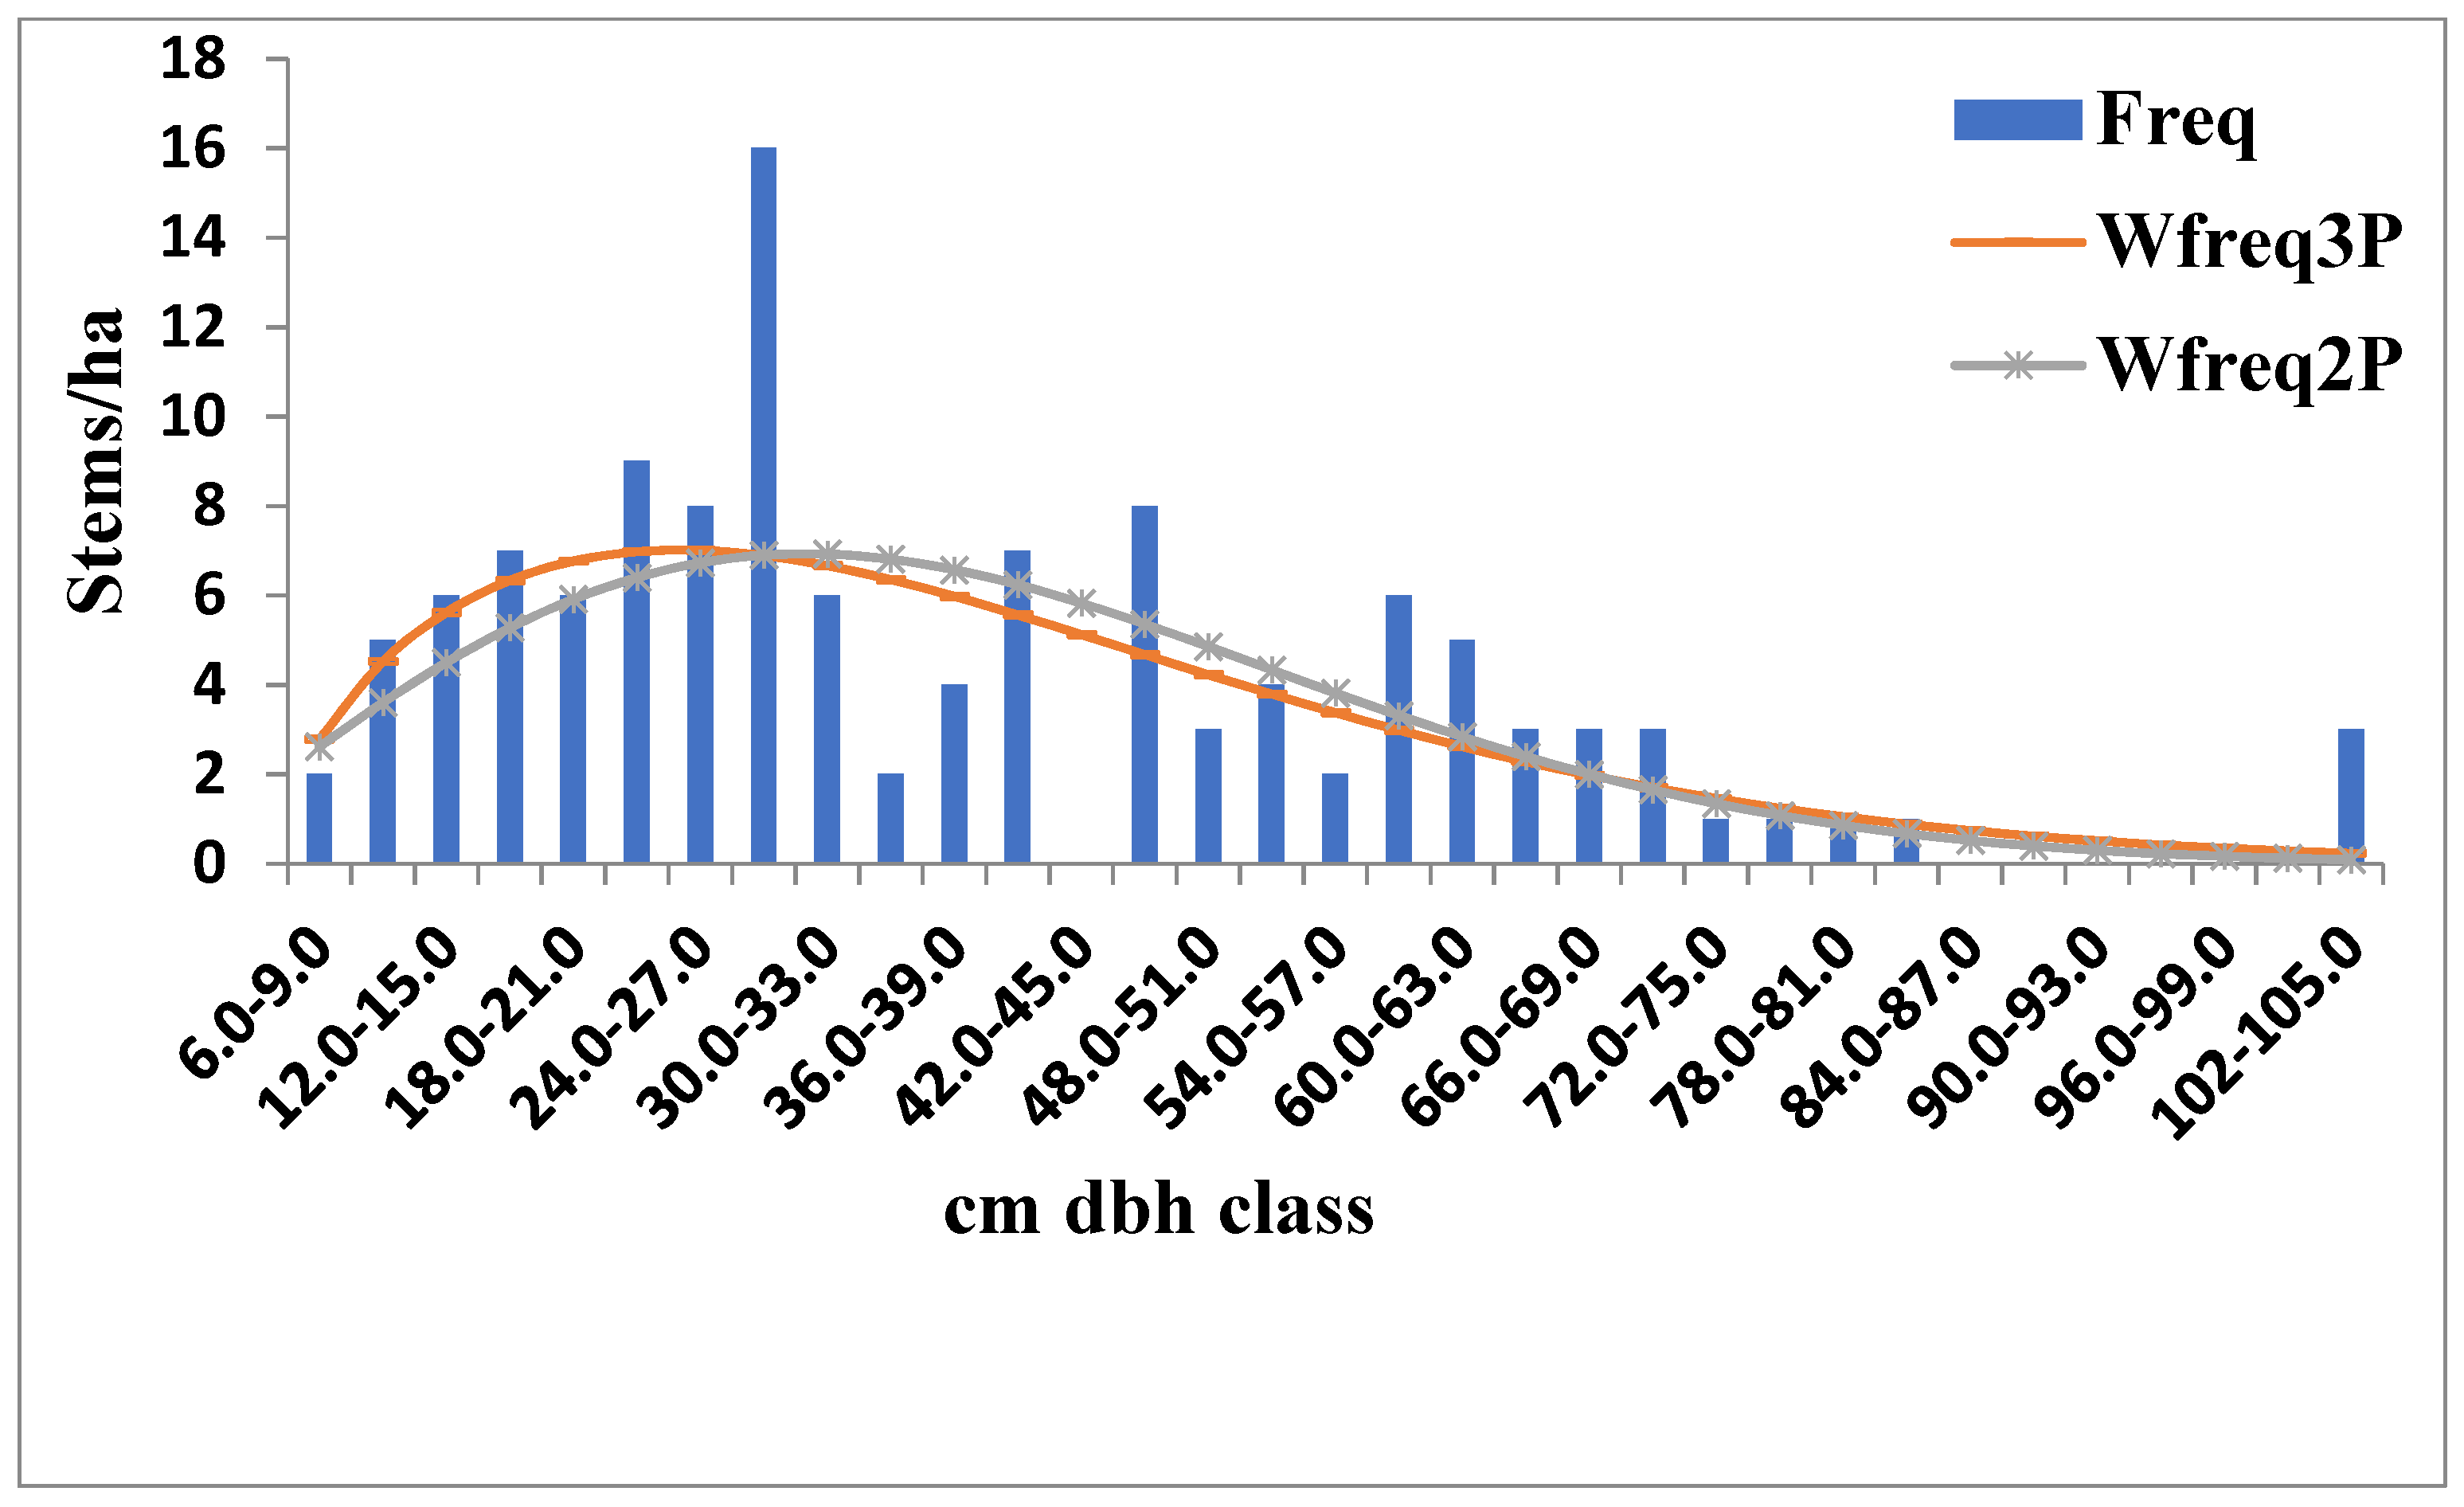
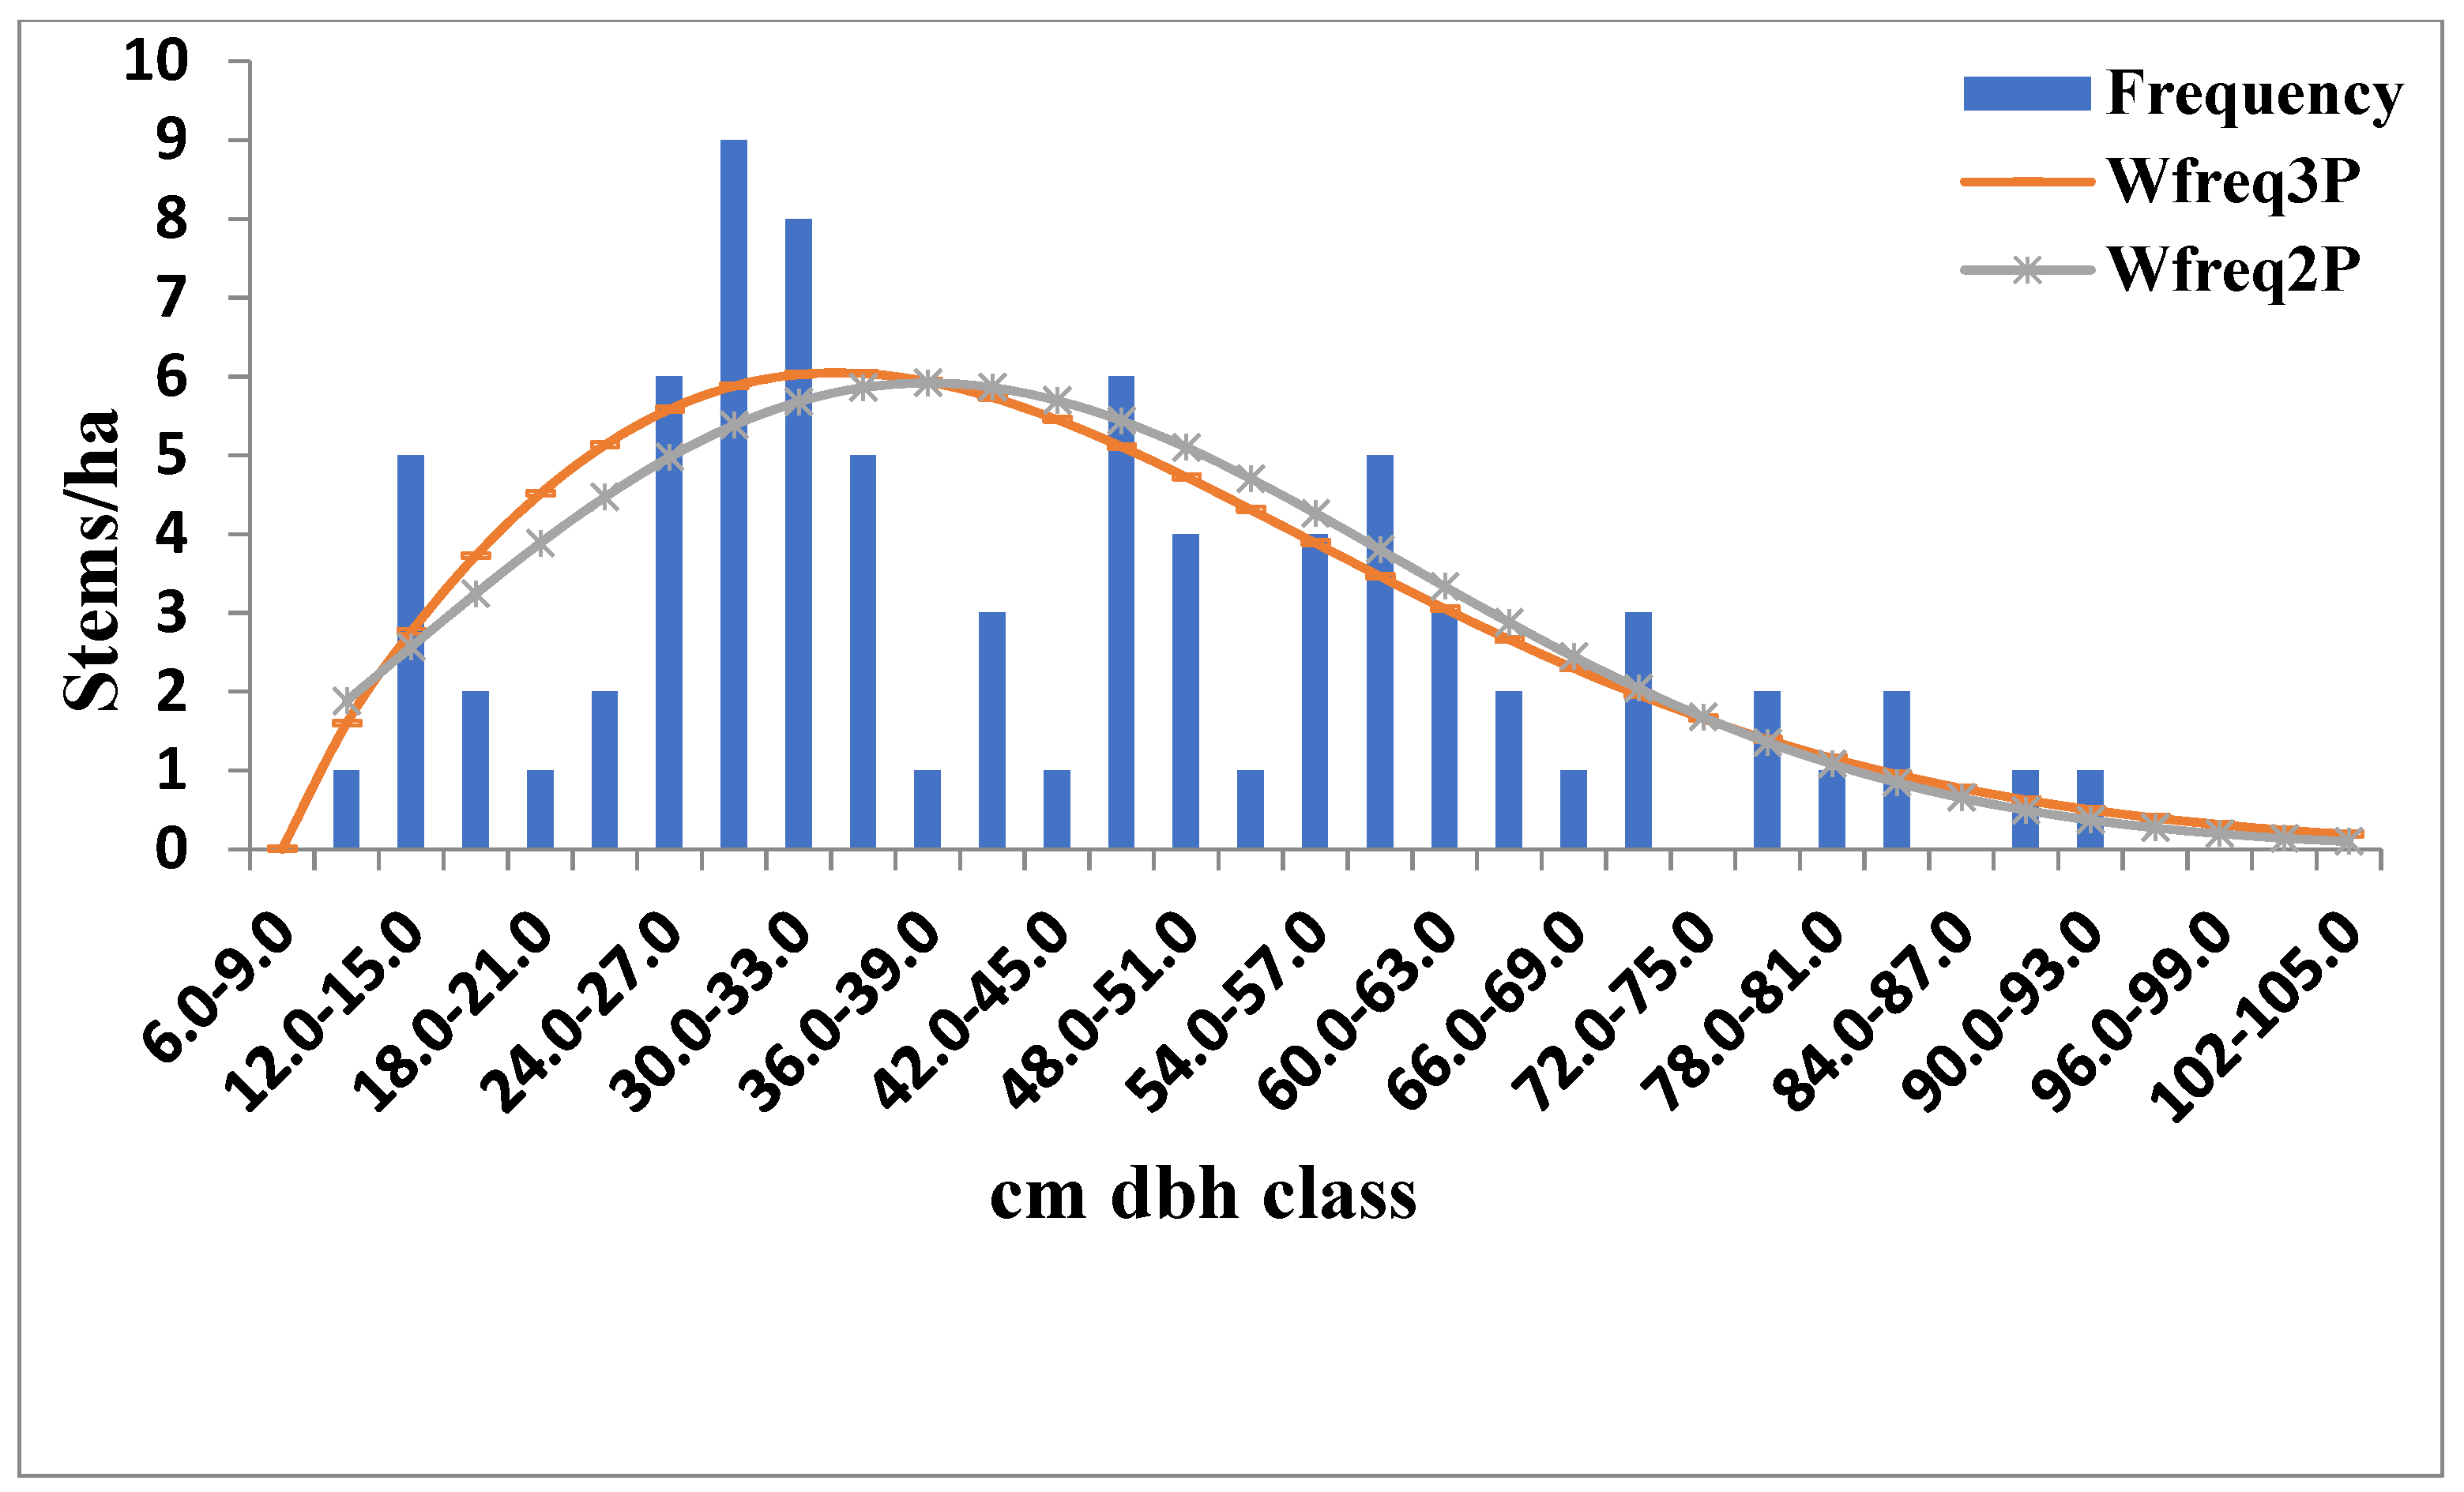
The mean diameter of the Old-growth forest (42.87 ± 18.90 cm dbh) was significantly higher than the Riparian forest (38.30 ± 21.35 cm dbh) (Table 3). The size–density distribution of the Old-growth forest ranged from 9.65 to 90.63 cm dbh, while the Riparian forest had extended distribution ranging from 6.43 to 104.96 cm dbh. The diameter distribution of Riparian and Old-growth forests were positively skewed. The values of skewness and kurtosis of the Riparian forest (skewness = 0.90, kurtosis = 0.65) were higher than the Old-growth forest (skewness = 0.49, kurtosis = 0.53). However, both had the highest peak in the size class 27.9–30.0cm dbh.
The Gini coefficient (GC) ([15]), coefficient of variation (CV) and dissimilarity coefficient (DC) measure plant size inequality in a population [5]. The coefficient of variation (CV) and dissimilarity coefficient of the Riparian forest were relatively higher compared to the Old-growth forest, and the dissimilarity coefficient followed the same pattern (Table 4). However, the value of the Gini coefficient of the diameter distribution of the Old-growth forest (0.91) was higher compared to the Riparian forest (0.82) (Table 4). The values of size diversity (Shannon–Weiner, H’; Simpson, 1-D’; and evenness, E’) were higher in the Riparian forest compared to the Old-growth forest, while richness (Margalef and tree richness) was higher in the Riparian forest than in the Old-growth forest (Table 4).
The values of Kolmogorov–Smirnov (K-S) and Anderson–Darling (A-D) test criteria for the goodness of fit showed no significant difference between the single three-parameter Weibull function and the size–density distribution of Riparian and Old-growth forests (Figure 2 and Figure 3). Therefore, the single three-parameter Weibull distribution provided a good approximation than the single two-parameter Weibull distribution for the diameter distribution of Riparian and Old-growth forests. In addition, the values of model selection criteria (root-mean-square error (RMSE), bias and coefficient of determination (R2)) of the single three-parameter Weibull model that fit the size–density distribution of the Old-growth forest were much less than those of the Riparian forest. The three-parameter Weibull model provided a better approximation of the diameter distribution of the Old-growth forest than the Riparian forest. Therefore, data properties and forest type affect the fit of the diameter distribution. The two size–density distributions were not significantly different from the single three-parameter Weibull distribution, as shown by Kolmogorov–Smirnov (K-S), Anderson–Darling (A-D), root-mean-square error (RMSE), bias and voefficient of determination (R2) tests (Table 5).

4. Discussion

4.1. Tree Species Diversity and Richness

A total of 42 tree species were identified in the Riparian forest (27 tree species) and the Old-growth forest (24 tree species) in the Elephant Camp natural forest. However, both forests had nine tree species in common. The present study showed that the Riparian forest contained more tree species than the Old-growth forest, and the Riparian forest also had higher tree species diversity indices than the Old-growth forest. Most diversity indices combine measurements of evenness and richness. Therefore, tree species in the Old-growth forest had almost an equal proportion of stems than the Riparian forest. The availability of water at most times of the year probably created conducive micro-sites for the growth and survival of most tree species in the Riparian forest, while induced disturbance in the Old-growth forest probably created an enormous space for the growth of individual stems [17]. The similarity index was used to measure the similarity of tree species in the two forests. Applying the benchmark threshold given in [18], the two forests can be considered to be of the same vegetation type due to the high degree of similarity (≥50%) by the Sorensen index. Of the 42 tree species identified in the Elephant Camp natural forest in the Omo Forest Reserve, Milicia excelsa, Terminali superba, Khaya ivorensis, Cordia millenii, Irvigia garbonensis and Baphia nitida are widely distributed and ecologically important for biodiversity conservation, while the infrequent and sparse species require proper protection and regeneration.

4.2. Size–Density Distribution of the Elephant Camp Natural Forest

The mean tree density of the Riparian forest was significantly higher than the Old-growth forest. The Gini coefficient (GC) [15] and coefficient of variation (CV) can be used to measure tree size diversity [5]. A high Gini coefficient (GC) in the Old-growth forest indicated higher structural diversity and stability in the Old-growth forest. The result showed that the Riparian forest and the Old-growth forest exhibited stem size inequality and structural diversity and stability, respectively. Therefore, stem size diversity may not indicate structural diversity and stability. Structural diversity and stability indicate a capacity to endure difficult environmental and biologically stressful conditions [19]. The CV increases with an increase in stem density [20]. Conversely, the presence of large stems was a distinctive feature that was noticeably lacking in the Old-growth forest. This implied that the Old-growth forest has experienced exogenous or endogenous disturbances. Tree size diversity is an indicator of the biodiversity values of a forest.
The mean stem diameter of the Old-growth forest (42.87 ± 18.90 cm) was significantly higher than the Riparian forest (38.30 ± 21.35 cm). Therefore, the high mean diameter of the Old-growth forest resulted from few mid-size stems (38 ≤ dbh ≤ 81 cm), because the Riparian forest had an extended diameter distribution with a few of the largest trees. The size–density distribution of the two forests expressed an irregular exponential distribution. The shape of the two size-density distributions was not different from each other, as shown by goodness-of-fit tests, but with different values of skewness and kurtosis. This is probably because both forest types experienced the same environmental conditions except a different water regime. However, Toledo et al. [21] stated that a similar size–density distribution could be shaped by different mechanisms. Therefore, the size–density distribution of trees of the two forests was hypothetically similar but may be shaped by different processes. The Riparian forest had an extended irregular exponential distribution of ≤104.96 cm dbh, with a high density of small-size trees (5.0–39 cm dbh), while the size–density distribution of the Old-growth forest truncated at ≤90.63 cm dbh, with a high density of mid-size trees (39 ≤ dbh ≤ 60 cm dbh). The result of high values of skewness and kurtosis of the size distribution in the Riparian forest may be caused by the high density of small-size trees (5.0–40 cm dbh). Therefore, the Riparian forest had a sufficient density of small-size trees (5.0–40 cm dbh) to replace mid-size trees, while the Old-growth forest has sufficient mid-size trees (39 ≤ dbh ≤ 60 cm dbh) to replace adult trees. Therefore, the Elephant Camp natural forest shows good growth and adequate self-replacement of adult tree species. The high stem density of mid-size trees (39 ≤ dbh ≤ 60 cm dbh) may cause a low density of small-size trees (5.0–40 cm dbh) in the Old-growth forest because high tree diversity decreases light interception through the structural complexity of the canopy [22].
The best result of approximation for the positively skewed exponential distribution of Riparian and Old-growth forests was obtained with the single three-parameter Weibull distribution based on the result of goodness-of-fit tests (Kolmogorov–Smirnov (K-S), Anderson–Darling (A-D), root-mean-square error (RMSE), bias and coefficient of determination (R2)). Moreover, the single three-parameter Weibull model provided a better approximation of the size-density distribution of the Old-growth forest compared to the Riparian forest. Therefore, data properties and forest type affected the fit of the size-density distribution. An exponential pattern is expected when individual mortality and growth are independent of tree size [23]. It shows that tree growth and mortality are related to random events in both forest types. The Riparian forest contained a high density of small-size stems (6.0 ≤ dbh ≤ 39.0 cm dbh), while the Old-growth forest contained a high density of mid-size stems (39.0 ≤ dbh ≤ 60.0 cm dbh). Therefore, the Riparian forest represents reproductive success and survival of the tree stems, while the Old-growth forest represents a rapidly growing population with high reproductive capacity.

5. Conclusions

The Riparian forest and the Old-growth forest exhibited stem size inequality and structural diversity and stability, respectively. The size–density distribution of trees in the two forests was hypothetically similar but may be shaped by water gradients. The Riparian forest had a sufficient density of small-size trees to replace mid-size trees, while the Old-growth forest had sufficient mid-size trees to replace adult trees. The Riparian forest represents reproductive success and survival of tree stems, while the Old-growth forest represents a rapidly growing population with high reproductive capacity. The single three-parameter Weibull function proved to be suitable for effective conservation and management of plant resources in the Elephant Camp natural forest. The Elephant Camp natural forest shows good growth and adequate self-replacement of adult tree species. Data properties and forest type affect the fit of the size-density distribution. The protection of the study area is required for conservation of its plant resources and biodiversity components.

Conflicts of Interest

There is no conflict of interest on this article.

References

  1. Shaltout, K.H.; Sheded, M.G.; Salem, A.H. Population structure of common shrubs and trees in Wadi Aliaqi Biosphere Reserve, South-East Egypt. Feddes Repert. 2009, 120, 343–354. [Google Scholar] [CrossRef]
  2. Loetsch, F.; Zohrer, F.; Haller, K.E. Forest Inventory 2; BLV-verlagsgesellschaft: Munique, Germany, 1973. [Google Scholar]
  3. Podoga, P.; Ochai, W.; Orzel, S. Performance of karnel estimator and Johnson SB function for modeling diameter distribution of Black Alder (Alnus glutinosa (L.). Gaertn.) stands. Forests 2020, 11, 634. [Google Scholar] [CrossRef]
  4. Pach, M.; Podlaski, R. Tree diameter structural diversity in Central European forests with Abies alba and Fagus sylvatica: Managed versus unmanaged forest stands. Ecol. Res. 2014, 30, 367–384. [Google Scholar] [CrossRef]
  5. Weiner, J.; Solbrig, O.T. The meaning and measurement of size hierarchies in plant populations. Oecologia 1984, 61, 334–336. [Google Scholar] [CrossRef] [PubMed]
  6. Alessandrini, A.; Biondi, F.; Di Filippo, A.; Zianco, E.; Piovesan, G. Tree size distribution at increasing spatial scales converges to the rotated sigmoid curve in two old-growth beech stands of the Italin Apennines. For. Ecol. Manag. 2011, 262, 1950–1962. [Google Scholar] [CrossRef]
  7. Mendez-Alonzo, R.; Hernandez-Trejo, H.; Lopez-Portillo, J. Salinity constrains size inequality and allometry in two contrasting Mangrove habitats in the Gulf of Mexico. J. Trop. Ecol. 2012, 28, 171–179. [Google Scholar] [CrossRef]
  8. Ojo, L.O. The fate of a tropical rainforest in Nigeria: Abeku sector of Omo Forest Reserve (PDF). Glob. Nest Int. J. 2004, 6, 116–130. [Google Scholar]
  9. Hutchinson, J.; Datziel, J.M.; Keay, R.W.J.; Hepper, F.N. Folora of West Tropical Africa; Royal Botanical Gardens, Kew: London, UK, 2014; Volume 1 Part 2, 330p. [Google Scholar]
  10. Hawthorne, W.; Jongkind, C. Woody Lants of Western African Forests; Kew Publishing, Royal Botanical Gardens, Kew: London, UK, 2006; 1023p. [Google Scholar]
  11. Peet, R.K. Relative diversity indices. Ecology 1975, 56, 496–498. [Google Scholar] [CrossRef]
  12. Bailey, R.L.; Dell, T.T. Quantifying diameter distributions with the weibull function. For. Sci. 1973, 19, 97–104. [Google Scholar]
  13. Gilliam, F.S.; Turrill, N.L.; Adams, M.B. Herbaceous layer and overstory species in clear-cut and mature Central Appalachian Hardwood Forests. Ecol. Appl. 1995, 5, 947–955. [Google Scholar] [CrossRef]
  14. Houchanou, T.D.; Assogbadjo, A.E.; KaKau, R.G.; Kyndt, T.; Houinato, M.; Sinsin, B. How far a protected area contributes to conserve habitat species composition and population structure of endangered African tree species (Benin, West Africa). Ecol. Complex. 2013, 13, 60–68. [Google Scholar] [CrossRef]
  15. Weiner, J.; Thomas, S.C. Size variability and competition in plant monocultures. Oikos 1986, 47, 211–222. [Google Scholar] [CrossRef]
  16. Zhang, I.; Packard, K.C.; Liu, C. A comparisons of estimation methods for fitting Weibull and Johnson’s SB distriutions to mixed spruce-fir stands in northeastern North Americ. Can. J. For. Res. 2003, 33, 1340–1347. [Google Scholar] [CrossRef]
  17. Sharma, K.P.; Bhatta, S.P.; Lamsal, S.K. Species diversity and regeneration status of community-managed hill sal (Shorea robusta) forest in central Nepal. Curr. Sci. 2020, 119, 83–92. [Google Scholar] [CrossRef]
  18. Bradley, A.F.; Crow, G.F. The flora and vegetation of Timber Island, Lake Winnipesaukee, New Hampshire, U.S.A. Rhodora 2010, 112, 156–190. [Google Scholar] [CrossRef]
  19. Chivulescu, S.; Ciceu, A.; Leca, S.; Apostol, B.; Popescu, O.; Badea, O. Development phases and structural characterististics of the Penteleu-Viforata virgin forest in the Curvature Carpathians. iForest 2020, 13, 389–395. [Google Scholar] [CrossRef]
  20. Liu, J.; Burkhart, H.E. Dynamics of size-variable distribution parameters in juvenile loblolly pine (Pinus taeda L.) stands. For. Ecol. Manag. 1993, 58, 321–347. [Google Scholar] [CrossRef]
  21. Toledo, J.J.; Magnusson, W.E.; Castilho, C.V. Competition, exogenous disturbance and senescence shape tree size distribution in tropical evidence from tree mode of death in Central Amazonia. J. Veg. Sci. 2013, 24, 651–663. [Google Scholar] [CrossRef]
  22. Rissanen, K.; Martin-Gay, M.; Riopel-Bouvier, A.; Paquette, A. Light interception in experimental forests affected by tree diversity and structural complexity of dominant canopy. Agric. For. Meterol. 2019, 278, 107655. [Google Scholar] [CrossRef]
  23. Muller-Landau, H.C.; Condit, R.; Harms, K.E.; Marks, C.O.; Thomas, S.C.; Bunyavejchewin, S.; Chuyong, G.; Co, L.; Davies, S.; Foster, R.; et al. Comparing tropical forest tree size distributions with the predictions of metabolic ecology and equilibrium models. Ecol. Lett. 2006, 9, 589–602. [Google Scholar] [CrossRef] [PubMed]
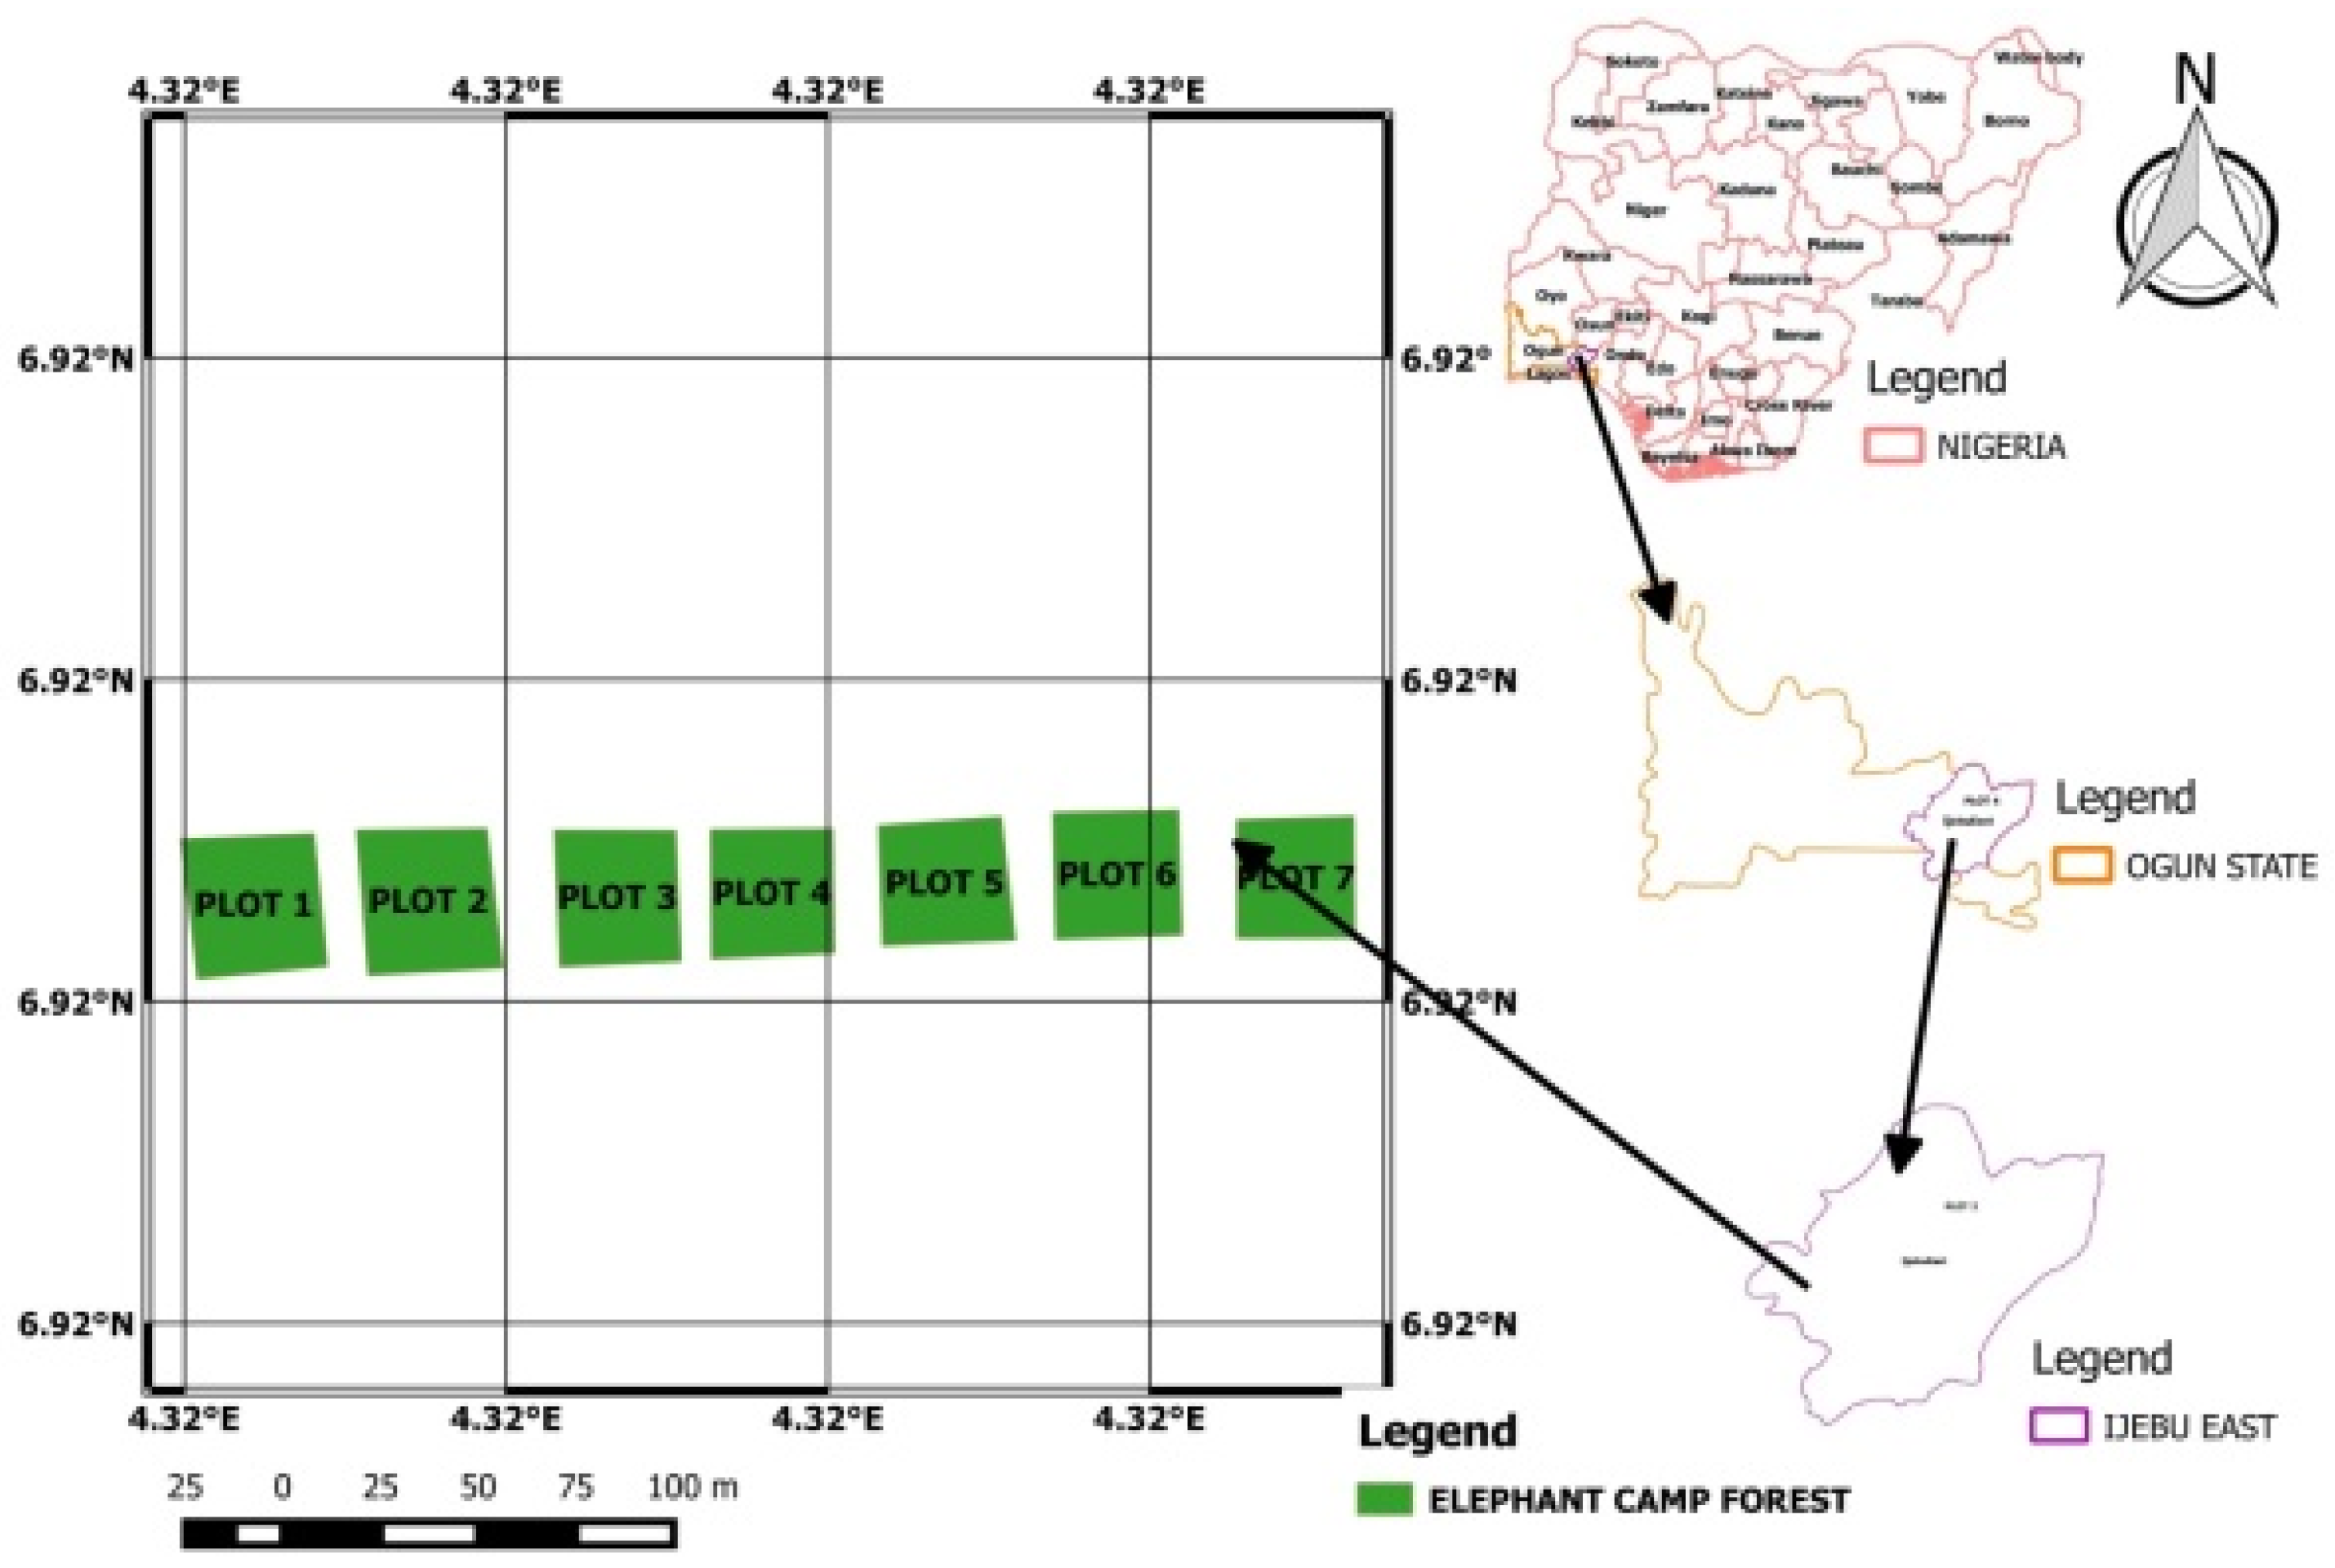
Figure 1. Map of the Elephant Camp natural forest in the Omo Forest Reserve.
Environsciproc 03 00075 g001
Figure 2. Observed and expected diameter distributions of the Riparian forest in the Elephant Camp natural forest in the Omo Forest Reserve.
Environsciproc 03 00075 g002
Figure 3. Observed and expected dbh distributions of the old-growth forest in the Elephant Camp natural forest in the Omo Forest Reserve.
Environsciproc 03 00075 g003
Table 1. Tree species distribution in Riparian and Old-growth forests.
Riparian ForestOld-Growth Forest
SpeciesStems/haIVISpeciesStems/haIVI
Funtumia elastica3.01.97Cynnometra megalophylla4.01.24
Baphia nitida3.02.00Entandrophragma utile4.02.80
Ficus thonningii3.02.04Antiaris africana4.03.22
Detarium macrocarpum3.02.17Musanga cecropioides4.03.37
Celtis integrifolia3.02.63Hunteria umbellata7.05.87
Macaranga barteri3.02.63Dracaena fragrans7.06.59
Musanga cacropioides3.02.76Uapaca guinensis7.07.74
Hunteria umbellata6.03.36Albizia glaberima7.08.22
Pterigota macrocarpa5.03.46Pterigota macrocarpa11.08.31
Okoubaka aubrevillei6.03.59Ceiba petandra7.08.76
Ficus exaspirata6.04.75Milicia excelsa7.09.40
Nauclea diderrichii6.05.01Ficus exasprata15.09.76
Stylochiton hypogaeus8.05.08Strombosia pustulata11.010.52
Khaya ivorensis6.05.16Nauclea diderrichii11.010.72
Pycnanthus angolensis11.06.98Cordia millenii11.011.66
Entandrophragma utile11.07.14Funtumia elastica15.011.85
Antiaris africa8.07.42Sida acuta15.012.09
Sida acuta11.08.31Alstonia boonei11.016.34
Pausinystalia johimbe17.012.95Terminalia superba15.017.04
Ceiba petandra17.020.71Ficus thonningii19.020.43
Ficu capensis25.021.67Gossypium arboreu19.020.94
Irvingia gabonensis28.022.03Baphia nitida29.020.35
Albizia glaberima28.025.03Khaya ivorensis26.030.19
Dracaena fragrans33.025.19Irvingia garbonesis37.036.73
Cordia millenii28.026.93
Terminalia superba33.027.86
Milicia excelsa28.041.07
IVI: important value index.
Table 2. Indices of tree species diversity in riparian and old-growth forests in the Elephant Camp natural forest.
Diversity IndicesRiparian ForestOld-Growth Forest
Tree species richness2724
Shannon–Weiner diversity index2.9632.98
Simpson diversity index0.9370.939
Margalef index5.4125.249
Evenness index (H/S)0.7170.82
Equitability index0.8990.937
Sorensen similarity index75.0%
Stem density (stem/ha)338.89 ± 9.80296.30 ± 8.92
Table 3. Descriptive statistics of stem diameter of riparian and old-growth forests in the Elephant Camp national forest.
ForestN/haMean ± Std (cm)Minimum (cm)Maximum (cm)SkewnessKurtosis
Riparian338.038.30 ± 21.356.42104.960.8950.646
Old growth296.042.87 ± 18.909.6590.630.4850.527
Std: standard deviation; stand density (N/ha).
Table 4. Indices of diameter diversity in riparian and old-growth forests in the Elephant Camp national forest.
Diversity IndicesRiparian ForestOld-Growth Forest
Shannon–Weiner (H’)3.0383.007
Simpson (1-D’)0.9420.940
Margalef index5.2045.705
Evenness (e^H’/S)0.8020.778
Equitability_J0.9320.923
Gini coefficient0.8250.915
Coefficient of variation (CV)0.5570.44
Dissimilarity coefficient0.5570.466
Table 5. Statistics of diameter distributions of riparian and old-growth forests in the Elephant Camp national forest.
ForestDistributionsAβγK-SA-DRMSEBiasR2
Riparian2-parameter Weibull-2.03742.4340.0990.9912.4741.6100.5064
3-parameter Weibull5.5081.56536.4720.0730.4632.3591.5510.4603
Old growth2-parameter Weibull-2.32447.7770.0890.6151.9361.4140.6651
3-parameter Weibull7.4521.83139.8130.0750.5111.9101.3860.6474
K-S: Kolmogorov–Smirnov; A-D: Anderson–Darling; RMSE: root-mean-square error; R2 coefficient of determination.
Publisher’s Note: MDPI stays neutral with regard to jurisdictional claims in published maps and institutional affiliations.