Next Article in Journal
Effect of Dust Events on Photovoltaics Electricity Production in the European and North African Regions
Previous Article in Journal
A Machine Learning Approach for Rainfall Nowcasting Using Numerical Model and Observational Data
 
 
Please note that, as of 4 December 2024, Environmental Sciences Proceedings has been renamed to Environmental and Earth Sciences Proceedings and is now published here.
Proceeding Paper

On the Northward Shift of Agro-Climatic Zones in Europe under Different Climate Change Scenarios †

by
Dimitris Akritidis
1,2,
Aristeidis K. Georgoulias
1,
Roxanne S. Lorilla
3,
Charalampos Kontoes
3,
Andrej Ceglar
4,
Andrea Toreti
5,
Alkiviadis Kalisoras
1 and
Prodromos Zanis
1,*
1
Department of Meteorology and Climatology, School of Geology, Aristotle University of Thessaloniki, 54124 Thessaloniki, Greece
2
Atmospheric Chemistry Department, Max Planck Institute for Chemistry, 55128 Mainz, Germany
3
Operational Unit BEYOND Center for EO Research and Satellite Remote Sensing, IAASARS, National Observatory of Athens, 11523 Athens, Greece
4
Climate Change Centre, European Central Bank, 60314 Frankfurt, Germany
5
European Commission, Joint Research Centre, 21027 Ispra, Italy
*
Author to whom correspondence should be addressed.
Presented at the 16th International Conference on Meteorology, Climatology and Atmospheric Physics—COMECAP 2023, Athens, Greece, 25–29 September 2023.
Environ. Sci. Proc. 2023, 26(1), 20; https://doi.org/10.3390/environsciproc2023026020
Published: 23 August 2023

Abstract

:
We investigate future changes of agro-climatic zones over Europe under two different IPCC Representative Concentration Pathways (RCP4.5 and RCP8.5) based on an ensemble of 11 bias-corrected regional climate model simulations covering the period 1981–2100. Eight distinct agro-climatic zones were identified by applying the k-means clustering method for the reference period 1981–2010 on two temperature-related parameters: the growing season length and the active temperature sum. Our results point towards a strong northward shift of the agro-climatic zones, especially under RCP8.5, towards the end of the century. A significant shift of the agro-climatic zones is also projected for RCP4.5 in the near-future and the end-of-the-century periods for large areas in Europe.

1. Introduction

Agriculture is one of the most climate- and weather-dependent socio-economic sectors since most of the agriculture productivity and quality are directly dependent on different meteorological and climatic factors [1]. The most important abiotic factor affecting the phenological growth of plant species is temperature, as the additive thermal time characterizes the physiological development of plants throughout their life cycle [2]. Despite thermal requirement differences among the various plant species, the observed increased temperature has contributed significantly to the earlier emergence of phenophases of common plant species, including aromatic plants, agricultural crops, fruit trees, and forests [3], with important consequences for plant health and biodiversity. Previous studies have shown that the agricultural crop cycle has been significantly reduced in recent decades due to increasing temperatures [4]. Furthermore, the observed warming in the recent past has also favored the northward shift of crop species to areas that were previously constrained by either too short a growing season length or by unattainable thermal requirements to complete the crop growth cycle [4].
Future projected global warming and regional climate change will likely cause a further northward expansion of crops adapted to warmer climates but also diminish suitability in the areas affected by increasingly higher temperatures and more frequent droughts [5,6].
Ceglar et al. [6], using a set of five high-resolution regional climate model simulations under the high-end emission scenario (RCP8.5) in the 21st century, found that a major part of Europe will be affected by northward climate zone migration at a 2 °C global warming level (compared to the preindustrial period). In this context, several regions of the Mediterranean may lose climate suitability to grow specific crops in favor of northern European regions. This indicator-based assessment suggested that the potential advantages of the lengthening of the thermal growing season in Northern and Eastern Europe are often outbalanced by the risk of late frost (at least in the first half of the century) and increased risk of early spring and summer heat waves [6].
Within the framework of the MICROSERVICES project (https://microservices.ethz.ch/ (accessed on 1 June 2021)), which aims at improving the capacity to predict the cascading effects of climate change on microbial diversity, crop–microbiome interactions, and agricultural ecosystem functions, we investigated future changes of agro-climatic zones over Europe under two different IPCC Representative Concentration Pathways (RCP4.5 and RCP8.5). The present study is an extension of the work by Ceglar et al. [6] with the implementation of additional regional climate model simulations. Specifically, we analyzed 11 bias-corrected EURO-CORDEX regional climate model simulations covering the period 1981–2100 under RCP4.5 and RCP8.5. Furthermore, the methodology was applied for specific time periods in the future (2031–2060 and 2071–2100) for both RCP4.5 and RCP8.5 instead of the time-varying 2 °C global warming level approach under RCP8.5 adopted by Ceglar et al. [6].

2. Data and Methodology

The identification of climatically distinct ecoregions across Europe included the estimation of agro-climatic zones using future climate projections (http://jeodpp.jrc.ec.europa.eu/ftp/jrc-opendata/LISCOAST/10011/LATEST/ (accessed on 1 April 2021)) retrieved from a set of high-resolution, bias-corrected EURO-CORDEX (https://www.euro-cordex.net/ (accessed on 1 April 2021)) regional climate model simulations [7]. More specifically, eleven model combinations were selected from various EURO-CORDEX regional climate models driven by simulations with several global circulation models used in the Coupled Model Intercomparison Project Phase 5 (CMIP5) framework (Table 1). Each model combination includes three high-spatial-resolution (~0.11 degree) regional climate model simulations for (a) the historical period 1981–2010, (b) the future period 2011–2100 following the RCP4.5 scenario, and (c) the future period 2011–2100 following the RCP8.5 scenario. RCP8.5 is a high-end scenario without any future environmental and climate change policies applied with GHG concentrations continuously increasing to reach a radiative forcing of 8.5 W m−2 at the end of 21st century [8]. It should be noted that high-end scenarios (such as RCP8.5) can be very useful to explore the full range of risks of climate change; however, the rapid development of renewable energy technologies and emerging climate policy have made them considerably less likely [9]. RCP4.5 is a moderately cost-efficient mitigation scenario designed to reach the radiative forcing target of 4.5 W m−2, with GHG concentrations starting to decrease after 2040 [10].
The identification of agro-climatic zones was carried out following the methodology applied by Ceglar et al. [6]. The assessment of agro-climatic zones was based on two parameters that describe the climate potential of agricultural production systems—the Growing Season Length (GSL) and the Active Temperature Sum (ATS). GSL is calculated as the sum of days between the first time in the year when for at least six consecutive days the mean daily surface temperature is greater than 5 °C and the first time for at least six consecutive days the mean daily surface temperature is less than 5 °C, which represents the length of the growing season. The ATS is calculated as the sum of the daily surface temperatures above the 0 °C threshold during the growing season.
The categorization of each grid point into agro-climatic zones was implemented by applying the k-means clustering method with Lloyd’s algorithm [11] to the GSL and ATS data. More specifically, k data points are initially selected at random as central clusters. Then, all data points, based on their distance from the central clusters, are classified to the cluster from which they have the shortest distance. The process of recalculating the central clusters and re-entering the points into the new clusters is repeated until all the points remain in the same cluster. The number of central clusters chosen was k = 8 based on the findings of Ceglar et al. [6], where the optimal number of central clusters using observational data was found to be eight (8) as it explained the majority of the data variability.
The annual GSL and ATS data were averaged over the historical period 1981–2010; then, they were normalized by subtracting the mean and dividing it by the standard deviation. The k-means method was applied to the resulting normalized GSL and ATS data, and each grid point (a pair of normalized GSL and ATS values corresponds to a grid point) was categorized into one of the eight central clusters—agro-climatic zones (Table 2). The categorization/naming of the eight agro-climatic zones was based on that of Ceglar et al. [6]. Figure 1a shows the GSL–ATS scatter plot of the grid points corresponding to each cluster—the agro-climatic zone and the corresponding central clusters—for the ensemble of the 11 regional climate model simulations for the historical period 1981–2010.
The assessment of agro-climatic zones over Europe was performed for the future periods 2031–2060 and 2071–2100 for the scenarios RCP4.5 and RCP8.5. The future GSL and ATS data were normalized based on the historical reference period 1981–2010. Then, the future normalized GSL and ATS data were categorized into one of the clusters that were calculated for the historical reference period 1981–2010 based on their distance from them.

3. Results

Figure 1b shows the spatial distribution of the agro-climatic zones over the European region for the historical reference period 1981–2010. Southern Europe is characterized by the Mediterranean (MED), the South maritime (SMA), and the North maritime (NMA) agro-climatic zones, which exhibit a generally complex spatial distribution and seem to follow natural features and barriers, such as mountain range systems. In Eastern Europe, the distribution of agro-climatic zones is more homogeneous, with the Pannonian (PAN), Continental (CON), Nemoral (NEM), and Boreal South (BOS) agro-climatic zones following a distinct gradient based on the regions’ latitude. Lastly, in Western Europe, the dominant agro-climatic zones are SMA, NMA, CON, and NEM. These results are in agreement with the results of Ceglar et al. [6], on whose methodology the present analysis was based.
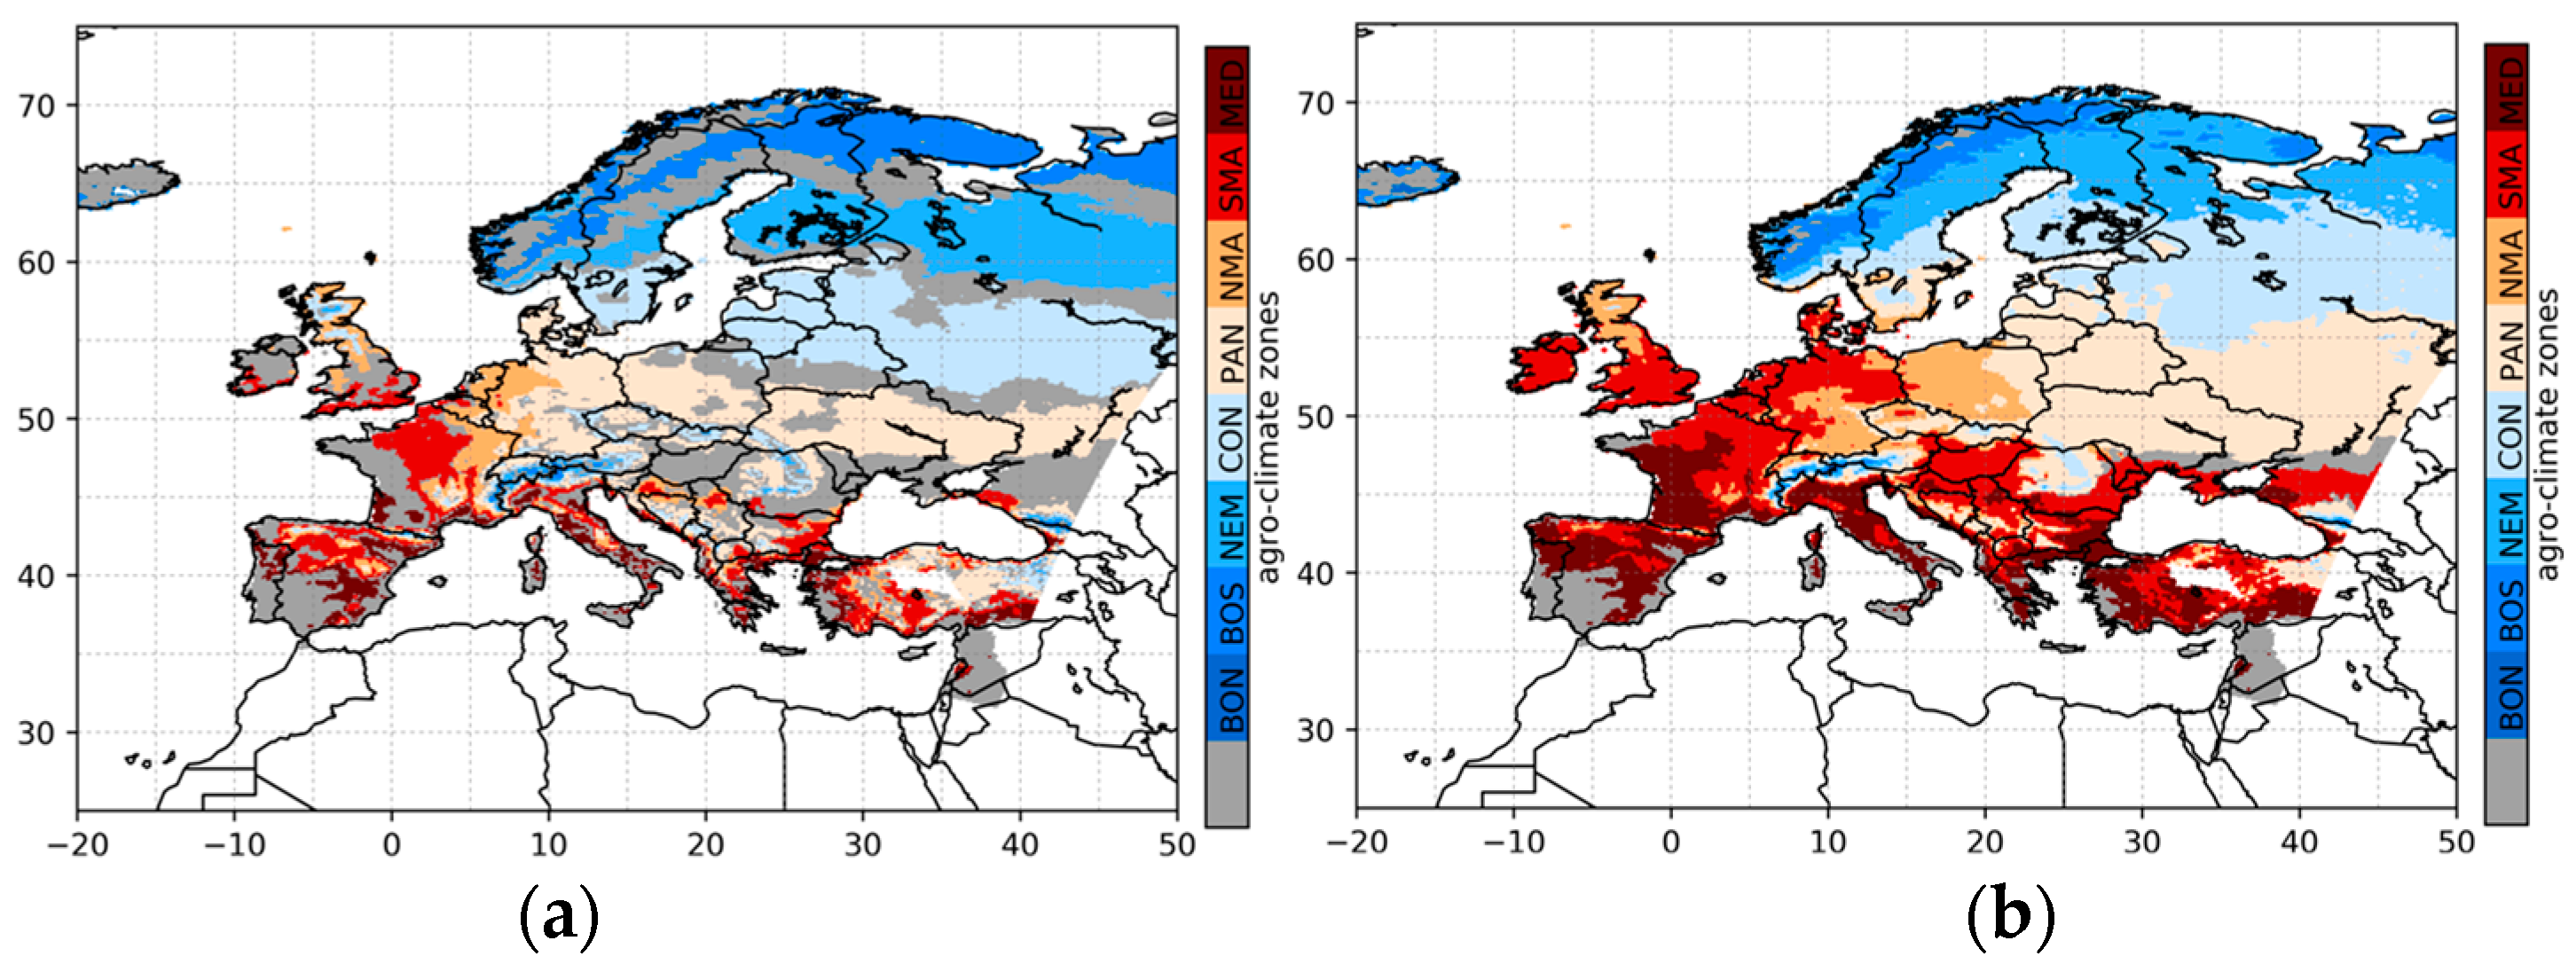
The future projection of the agro-climatic zones over Europe for the RCP4.5 emission scenario and for the periods 2031–2060 and 2071–2100 is shown in Figure 2a,b, respectively. For the near-future period 2031–2060, several European regions are estimated to experience a considerable migration of agro-climatic zones towards the north with respect to the reference period 1981–2010. This northward shifting signal becomes regionally extended over larger parts of Europe towards the end of 21st century (2071–2100), in agreement with the relatively increasing warming levels during the 21st century for RCP4.5.
Figure 3a,b show the future projections of the agro-climatic zones for the RCP8.5 scenario for the periods 2031–2060 and 2071–2100, respectively. For the near-future period 2031–2060, large parts of Europe will experience a considerable migration of agro-climatic zones towards the north with respect to the reference period 1981–2010. The results for the period 2031–2060 for RCP8.5 are similar to those of the RCP4.5 scenario for the period 2071–2100. For the period 2071–2100, a change in agro-climatic zones is projected for almost all parts of Europe with a more pronounced northward zone migration. This is related to the stronger warming trends during the 21st century for RCP8.5 compared with RCP4.5, which, in turn, is linked to the characteristics of the RCP8.5 having higher GHG emissions in addition to the absence of mitigating climate policies. Our results are in line with Ceglar et al. [6], who studied the migration of agro-climatic zones over Europe under the 2 °C warming level utilizing a subset of the simulations used in this study.

4. Conclusions

An ensemble of 11 bias-corrected EURO-CORDEX regional climate model simulations covering the period 1981–2100 was used in our study to assess the impact of global warming on agro-climate zone migration in Europe under the high-end emission scenario RCP8.5 and the moderate mitigation scenario (RCP4.5). Eight distinct agro-climatic zones were identified by applying the k-means clustering method for the reference period 1981–2010 on two temperature-related parameters: GSL and ATS. The agro-climatic zone patterns over Europe for the near-future period 2031–2060 and the end-of-the-century period 2071–2100 were compared against those of the reference period. Our results point towards a strong northward shift of the agro-climatic zones, especially under the high-end emission scenario RCP8.5 towards the end of the century. For the moderate mitigation scenario RCP4.5, a significant shift of the agro-climatic zones is also projected for the near-future and the end-of-the-century periods for extended areas in Europe. The rate of climate zone migration depends on the chosen emission scenario, as the trends in surface warming reflect the transient nature of the scenarios.

Author Contributions

Conceptualization, D.A. and P.Z.; methodology, D.A., A.T. and A.C.; software, D.A. and A.K.G.; formal analysis, D.A. and A.K.G.; investigation, D.A., A.K.G., A.K. and P.Z.; data curation, D.A., A.K.G. and A.K.; writing—original draft preparation, D.A. and P.Z.; writing—review and editing, D.A., A.K.G., R.S.L., C.K., A.C., A.T., A.K. and P.Z.; visualization, D.A. and A.K.G.; project administration, C.K. and R.S.L. All authors have read and agreed to the published version of the manuscript.

Funding

This research was supported by the MICROSERVICES project funded by the General Secretariat for Research and Innovation (GSRI, Greece) under the Action ERANETs 2021A [Call ID: 037KE—A/A MIS 4888] (Project Number: T12ERA5-00075) and through the 2019–2020 BiodivERsA joint call for research proposals [BiodivClim ERA-Net COFUND programme].

Institutional Review Board Statement

Not applicable.

Informed Consent Statement

Not applicable.

Data Availability Statement

The high-resolution, bias-corrected regional climate model simulations used for the analysis were accessed on 1 April 2021 from http://jeodpp.jrc.ec.europa.eu/ftp/jrc-opendata/LISCOAST/10011/LATEST/ and retrieved from EURO-CORDEX (https://www.euro-cordex.net/). The EURO-CORDEX simulations are publicly available via https://esgf-data.dkrz.de/search/cordex-dkrz/ (accessed on 1 April 2021).

Acknowledgments

The authors acknowledge the European Commission’s Joint Research Centre (JRC, https://joint-research-centre.ec.europa.eu/ (accessed on 1 April 2021)) for making the bias-corrected EURO-CORDEX data publicly available. The authors acknowledge the World Climate Research Programme’s Working Group on Regional Climate, and the Working Group on Coupled Modelling, former coordinating body of CORDEX and responsible panel for CMIP5. Special thanks are expressed to the climate modeling groups (listed in Table 1) for producing and making available their model output.

Conflicts of Interest

The authors declare no conflict of interest.

References

  1. Mavromatis, T.; Georgoulias, A.K.; Akritidis, D.; Melas, D.; Zanis, P. Spatiotemporal Evolution of Seasonal Crop-Specific Climatic Indices under Climate Change in Greece based on EURO-CORDEX RCM Simulations. Sustainability 2022, 14, 17048. [Google Scholar] [CrossRef]
  2. Trudgill, D.; Honek, A.; Li, D.; Straalen, N.M. Thermal time—Concepts and utility. Ann. Appl. Biol. 2005, 146, 1–14. [Google Scholar] [CrossRef]
  3. Schleip, C.; Sparks, T.H.; Estrella, N.; Menzel, A. Spatial variation in onset dates and trends in phenology across Europe. Clim. Res. 2009, 39, 249–260. [Google Scholar] [CrossRef]
  4. Olesen, J.E.; Niemeyer, S.; Ceglar, A.; Roggero, P.P.; Lehtonen, H.; Schonhart, M.; Kipling, R. Climate change impacts on environmental systems. Agriculture 2017, 1, 223–243. [Google Scholar] [CrossRef]
  5. King, M.; Altdorff, D.; Li, P.; Galagedara, L.; Holden, J.; Unc, A. Northward shift of the agricultural climate zone under 21st-century global climate change. Sci. Rep. 2018, 8, 7904. [Google Scholar] [CrossRef] [PubMed]
  6. Ceglar, A.; Zampieri, M.; Toreti, A.; Dentener, F. Observed northward migration of agro-climate zones in Europe will further accelerate under climate change. Earth’s Future 2019, 7, 1088–1101. [Google Scholar] [CrossRef]
  7. Dosio, A. Projections of climate change indices of temperature and precipitation from an ensemble of bias-adjusted high-resolution EURO-CORDEX regional climate models. J. Geophys. Res. Atmos. 2016, 121, 5488–5511. [Google Scholar] [CrossRef]
  8. Riahi, K.; Rao, S.; Krey, V.; Cho, C.; Chirkov, V.; Fischer, G.; Kindermann, G.; Nakicenovic, N.; Rafaj, P. RCP 8.5—A scenario of comparatively high greenhouse gas emissions. Clim. Change 2011, 109, 33–57. [Google Scholar] [CrossRef]
  9. Hausfather, Z.; Peters, G.P. Emissions—The “business as usual” story is misleading. Nature 2020, 577, 618–620. [Google Scholar] [CrossRef] [PubMed]
  10. Thomson, A.M.; Calvin, K.V.; Smith, S.J.; Kyle, G.P.; Volke, A.; Patel, P.; Delgado-Arias, S.; Bond-Lamberty, B.; Wise, M.A.; Clarke, L.E.; et al. RCP4.5: A pathway for stabilization of radiative forcing by 2100. Clim. Change 2011, 109, 77–94. [Google Scholar] [CrossRef]
  11. Lloyd, S. Least squares quantization in PCM. IEEE Trans. Inf. Theory 1982, 28, 129–137. [Google Scholar] [CrossRef]
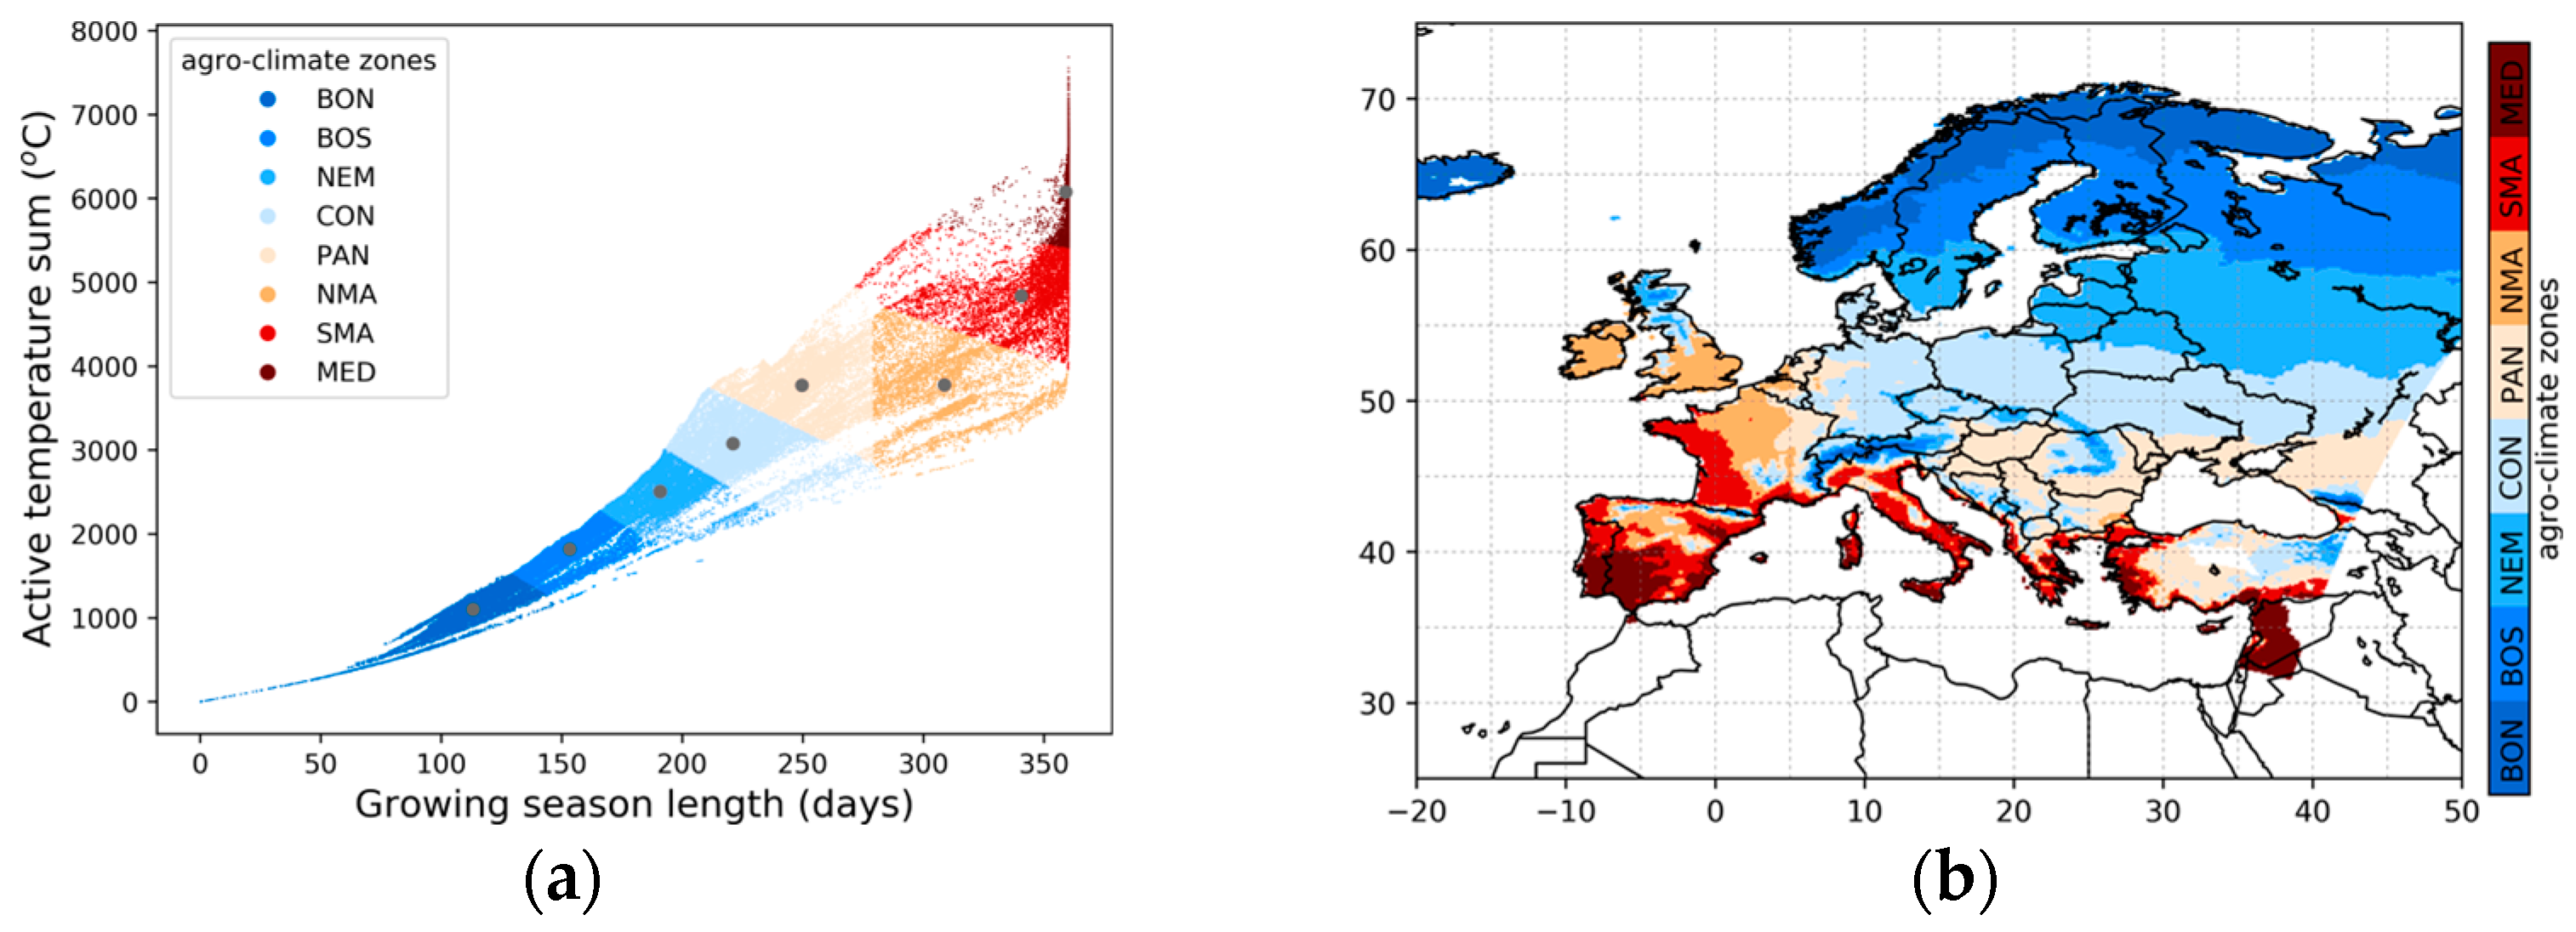
Figure 1. (a) GSL–ATS scatter plot of the grid points corresponding to each agro-climatic zone (colored dots) and the corresponding central clusters (grey dots) for the ensemble of the 11 regional climate simulations for the historical period 1981–2010. (b) Agro-climatic zones for Europe based on GSL and ATS obtained from the ensemble median of the 11 regional climate model simulations during the historical period 1981–2010.
Environsciproc 26 00020 g001
Figure 2. (a) Agro-climatic zones for the future RCP4.5 emissions scenario for the period 2031–2060. (b) Agro-climatic zones for the future RCP4.5 emissions scenario for the period 2071–2100. Only areas where the agro-climatic zone category has changed compared with the historical reference period 1981–2010 are shown (colored areas), while gray color denotes the areas where the agro-climatic zones have not changed.
Environsciproc 26 00020 g002
Figure 3. (a) Agro-climatic zones for the future RCP8.5 emissions scenario for the period 2031–2060. (b) Agro-climatic zones for the future RCP8.5 emissions scenario for the period 2071–2100. Only areas where the agro-climatic zone category has changed compared to the historical reference period 1981–2010 are shown (colored areas), while gray color denotes the areas where the agro-climate zones have not changed.
Environsciproc 26 00020 g003
Table 1. Regional Climate models retrieved from EURO-CORDEX.
EURO-CORDEX RCMCMIP5 GCMVariant Label
CLMcom-CCLM4-8-17CNRM-CERFACS-CNRM-CM5r1i1p1
CLMcom-CCLM4-8-17ICHEC-EC-EARTHr12i1p1
CLMcom-CCLM4-8-17MPI-M-MPI-ESM-LRr1i1p1
DMI-HIRHAM5ICHEC-EC-EARTHr3i1p1
IPSL-INERIS-WRF331FIPSL-IPSL-CM5A-MRr1i1p1
KNMI-RACMO22EICHEC-EC-EARTHr1i1p1
SMHI-RCA4CNRM-CERFACS-CNRM-CM5r1i1p1
MHI-RCA4ICHEC-EC-EARTHr12i1p1
SMHI-RCA4IPSL-IPSL-CM5A-MRr1i1p1
SMHI-RCA4MOHC-HadGEM2-ESr1i1p1
SMHI-RCA4MPI-M-MPI-ESM-LRr1i1p1
Table 2. Central clusters (agro-climatic zones) for the ensemble of the 11 regional climate simulations for the historical period 1981–2010.
ClusterGSL (Days)ATS (°C)Agro-Climatic ZoneAgro-Climatic Zone
Acronym
1113.21104.2Boreal NorthBON
2153.31822.8Boreal SouthBOS
3190.92508.8NemoralNEM
4220.93078.7ContinentalCON
5249.53771.8PannonianPAN
6308.73778.8North maritime NMA
7340.64840.4South maritimeSMA
8359.16077.3MediterraneanMED
Disclaimer/Publisher’s Note: The statements, opinions and data contained in all publications are solely those of the individual author(s) and contributor(s) and not of MDPI and/or the editor(s). MDPI and/or the editor(s) disclaim responsibility for any injury to people or property resulting from any ideas, methods, instructions or products referred to in the content.