Proceeding Paper

Effect of Dust Events on Photovoltaics Electricity Production in the European and North African Regions †

by
Davender Sethi
1,2 and
Panagiotis G. Kosmopoulos
3,*
1
Academy of Science and Innovative Research (AcSIR), Ghaziabad 201002, India
2
Department of Civil Engineering, Indian Institute of Technology, Kanpur 208016, India
3
Institute for Environmental Research and Sustainable Development, National Observatory of Athens (IERSD/NOA), 15236 Athens, Greece
*
Author to whom correspondence should be addressed.
Presented at the 16th International Conference on Meteorology, Climatology and Atmospheric Physics—COMECAP 2023, Athens, Greece, 25–29 September 2023.
Environ. Sci. Proc. 2023, 26(1), 8; https://doi.org/10.3390/environsciproc2023026008
Published: 23 August 2023

Abstract

:
The effect of two dust events on solar energy has been studied in Europe and North Africa. For analysis, total aerosol and dust optical depth (AOD) in conjunction with solar irradiation and energy data were utilized from Copernicus Atmosphere Monitoring Service (CAMS). The AOD reached ~2.8 and ~1.7 during the dust events (16–19 April 2021 and 15–18 March 2022), respectively. Both events originated in North Africa, reaching the northern parts of Europe and the Black Sea. The energy production of solar photovoltaics in the affected regions was reduced by almost 18–36 GWh, followed by an estimated financial loss of close to 4 million euros.

1. Introduction

Dust is generated from natural and anthropogenic sources, which are generally localized. Moreover, it can travel large distances from its source and, thus, affect the region and atmosphere to a large extent [1]. Dust can affect surface solar radiation (SSR) due to its direct radiative effects [2]. The direct radiative effect of dust poses a significant challenge for renewable deployment, especially solar energy [1]. Solar energy has substantial potential to be harnessed, especially in the European and North African regions [3]. The IEA report forecasted an increase in Photovoltaics (PV) capacity during 2020–2025 in North Africa, the Middle East, and Europe [3].
Generally, in the region, the downwelling solar radiation is affected mainly by clouds, but the impact of the aerosols is also significant even in cloud-free conditions [4,5]. Mainly during the spring and summer seasons, in dry conditions, dust outbreaks occur over the European and North African regions [1]. The dust outbreaks produce a high aerosol load in the atmosphere, affecting the solar ration flux from a few days to a week, thus producing PV power losses [6]. Earlier studies have accessed the PV production losses during the dust episode in terms of losses; global horizontal irradiance (GHI) attenuation focuses only on small regions or countries [1,2,6]. The present study proposed a novel technique, in which we estimated PV production losses for a reference 1 kWp nominal power system of each site of the affected country and then extrapolated to the total PV capacity production losses estimation in GWp for the affected region. The technique was utilized to assess two dust storm episodes during spring (16–19 April 2021 and 15–18 March 2022). To study the impact of aerosols, especially dust, on solar radiation, data on aerosol optical properties have been used, such as total AOD and AOD due to the dust (AOD Dust), along with SSR components GHI and clear sky GHI. The study mainly addresses the following scientific objectives regarding the affected regions.
-
Quantifying the impact of total aerosol and dust on SSR in the affected regions.
-
Estimating the Financial loss in the energy output of the PV plants located over the entire affected region.

2. Site, Materials, and Methods

For the present study, a total of 12 representative sites were selected in the affected region to assess the aerosol’s impact on the SSR. Data collocation was also performed in order to match the aerosol and SSR data to the PV locations across the studied region. For the 2021 event during 16–19 April, the locations of Tripoli (Libya), Athens (Greece), Heraklion (Crete, southern Greece), Izmir (west Turkey), Cairo (Egypt), and Sochi (Russia) were chosen as these sites lie in the pathway of dust events. For the 2022 event during the period 15–18 March, the selected sites in the path of the dust event were Tripoli (Libya), Cagliari (Sardinia Island of Italy), Barcelona (Spain), Hamburg (Germany), Copenhagen (Denmark), and Lyon (France). To study aerosol impact, the AOD and AOD Dust at 500 nm were taken from the CAMS, available at 0.4 × 0.4-degree resolution over the region. The CAMS reanalysis data are available for the entire globe from 2004 to two days ago. The data are available at the temporal resolution of 1 min to 1 month. The radiation data is based on the Heliosat-4 method from Meteosat satellite images [7].
Further information about the method can be found in research article [8]. The Clear Sky GHI and GHI data have been taken from the CAMS radiation service website (https://www.soda-pro.com/web-services/radiation/cams-radiation-service, accessed on 10 November 2022). The energy production and losses from PV were estimated for all locations per kWp. For estimates of the daily energy production (DEP) under normal conditions for specific latitude and longitude under Sarah2 database with silicon crystal technology for 1 kWp, we used an installed PV system using the PV geographical information system (GIS) tool (https://re.jrc.ec.europa.eu/pvg_tools/en/, accessed on 5 March 2023), further estimating the DEP and losses per GWp of the affected regions. The EP under the dust effect is estimated by simulating the CAMS AOD to GHI using a radiative transfer model, and further PVGIS tool is used to convert GHI to PV/EP production and then extrapolate for the whole PV capacity [1].
At last, the financial losses (FL) were assessed over the affected region during dust periods using the method discussed in the research paper [1,5]. Financial loss (FL) is the operational and maintenance daily cost in euros of the total installed PV system capacity, which is estimated to be close to 7 GW over the affected region (https://www.solarpowereurope.org/, accessed on 5 March 2023) [9]. FL was calculated for the total PV capacity of each city/region using the following Equation (1)
FL = (DEPwithout dust − DEPwith dust) × feed-in tariff
DEPwithout dust is the maximum daily energy production in kWh when the atmosphere is clean, i.e., when total AOD is zero, DEPwith dust is the actual daily energy production in kWh in high aerosol load conditions. Here, we have assumed a PV efficiency of 12% for 80% spatial coverage for silicon polycrystalline-based PV materials over the region [1,5]. Thus, the change in DEP is calculated based on the PV efficiency and GHI flux under normal and high aerosol load conditions. Finally, the difference in the DEP is multiplied by the feeding tariff, which is used here in the range of 0.03 to 0.3 EUR per kWh for the affected regions [10]. The feed-in tariff is the government-guaranteed price (above market price) to renewable energy producers in proportion to their production, thereby using more renewable energy sources in public. The main assumptions of the proposed method have to do (a) with the reliability of the CAMS aerosol levels and its spatiotemporal distribution, (b) with the aerosol effect per each specific PV since we assumed a normalization per country based on the real PV capacity and production under normal conditions (i.e., without dust effect), and (c) with the PV production in general since it is related to differential efficiency, technology, tilt, and location installed which introduce additional uncertainties.

3. Results

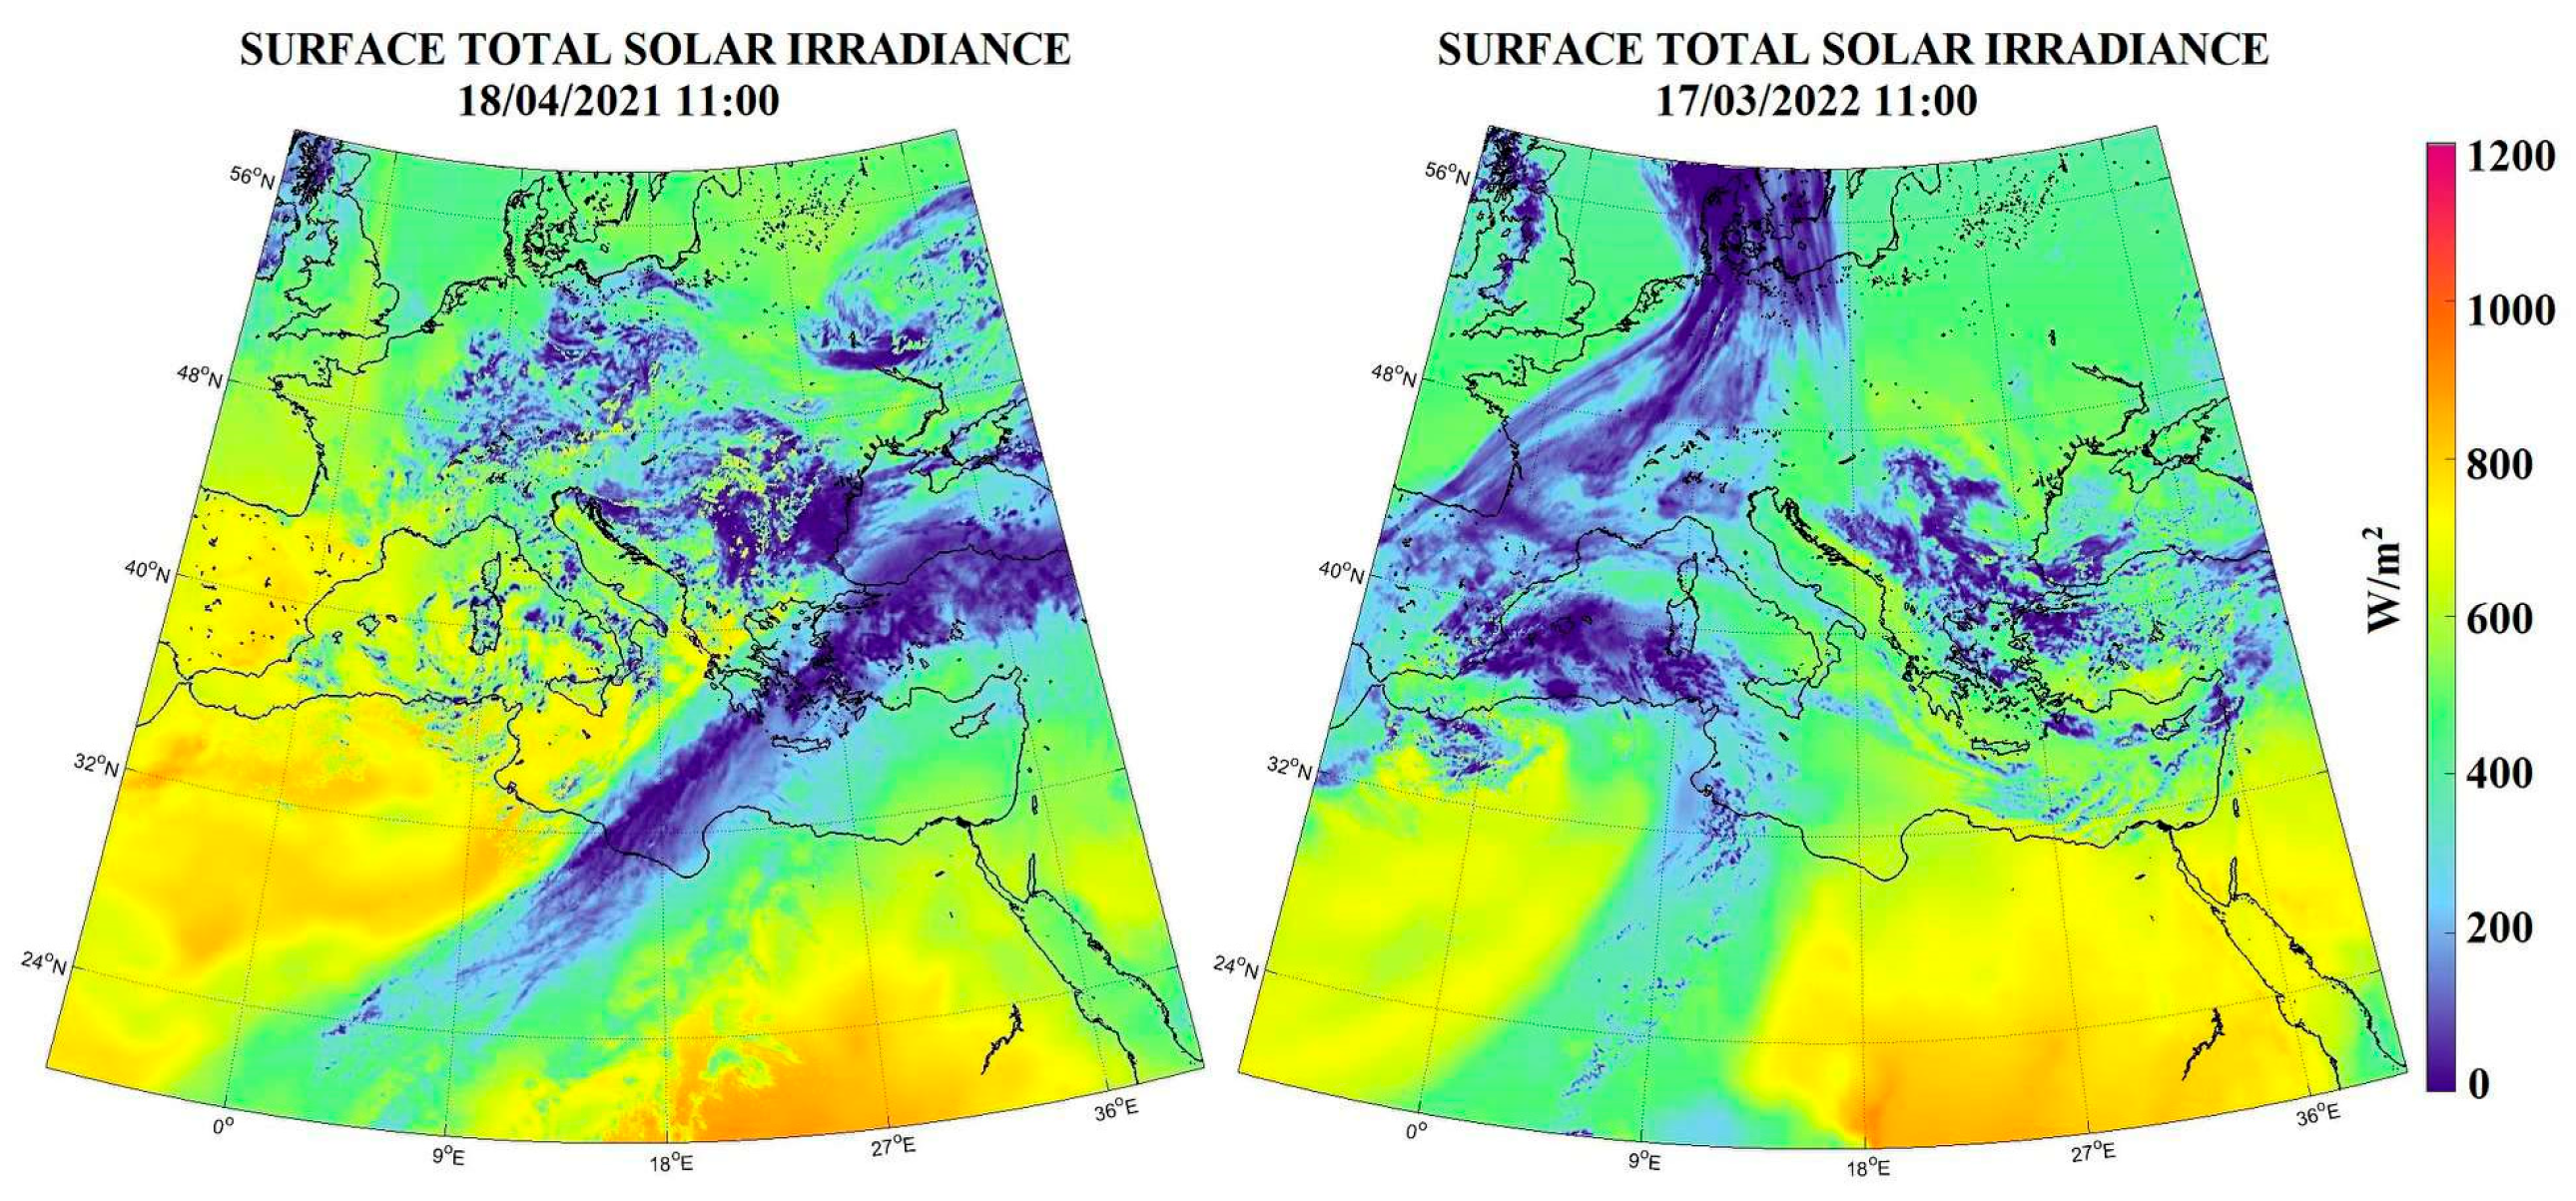
3.1. Dust Storm Identification and AOD Variations

This section describes the identification of the dust storm event-affected regions using solar radiation mapping and changes in the aerosol optical properties and their impact on GHI. Using the operational surface total solar irradiance mapping image, as shown in Figure 1, we have observed the spatial outbreaks of the two dust storms over the North African region during the springs of 2021 and 2022, respectively. Figure 1 (left panel) depicts that the first dust event affected Eastern Mediterranean countries with total surface radiation varying from 10 to 200 Wm−2 on 18 April 2021 at 11:00 h. The right panel of Figure 1 shows the second dust event that affected the Western Europe region with surface total solar irradiance varying from 10 to 400 Wm−2 on 17 March 2022 at 11:00 h. Both dust storm originated from the North African region, which mainly has a vast desert area.
During the initial phase of dust incursion during event 1, the total AOD and AOD Dust increase to ~1 over Tripoli (Figure 2a). Further, the total AOD (AOD Dust) reaches maximum ~2.8 (~0.8) with route of dust with total AOD (AOD dust) varies over Izmir ~0.18–2.8 (0.01–0.8), Heraklion ~0.08–2.12 (0.01–0.8), Sochi ~0.27–2.12 (0.02–0.38), and Cairo ~0.2–0.75 (0.06–0.24), respectively (Figure 2a). The rise in the total AOD and AOD dust infers the dust pathway over the Mediterranean region. However, the intensity of the initial phase second dust storm was less intense, where total AOD (AOD Dust) reached ~1.71 (~0.43) over Tripoli (Figure 2b). During the middle phase, the total AOD (AOD Dust) peaked over Copenhagen at ~0.4 (0.07), Hamburg at ~0.46 (0.15), Lyon at ~1.71 (~1.12), and Tripoli at ~1.71 (1.16), respectively. Moreover, during the last phase, over Barcelona ~1.0 (~0.6) (Figure 2b); thus, the rise in AOD shows the dust track during the dust event 2.

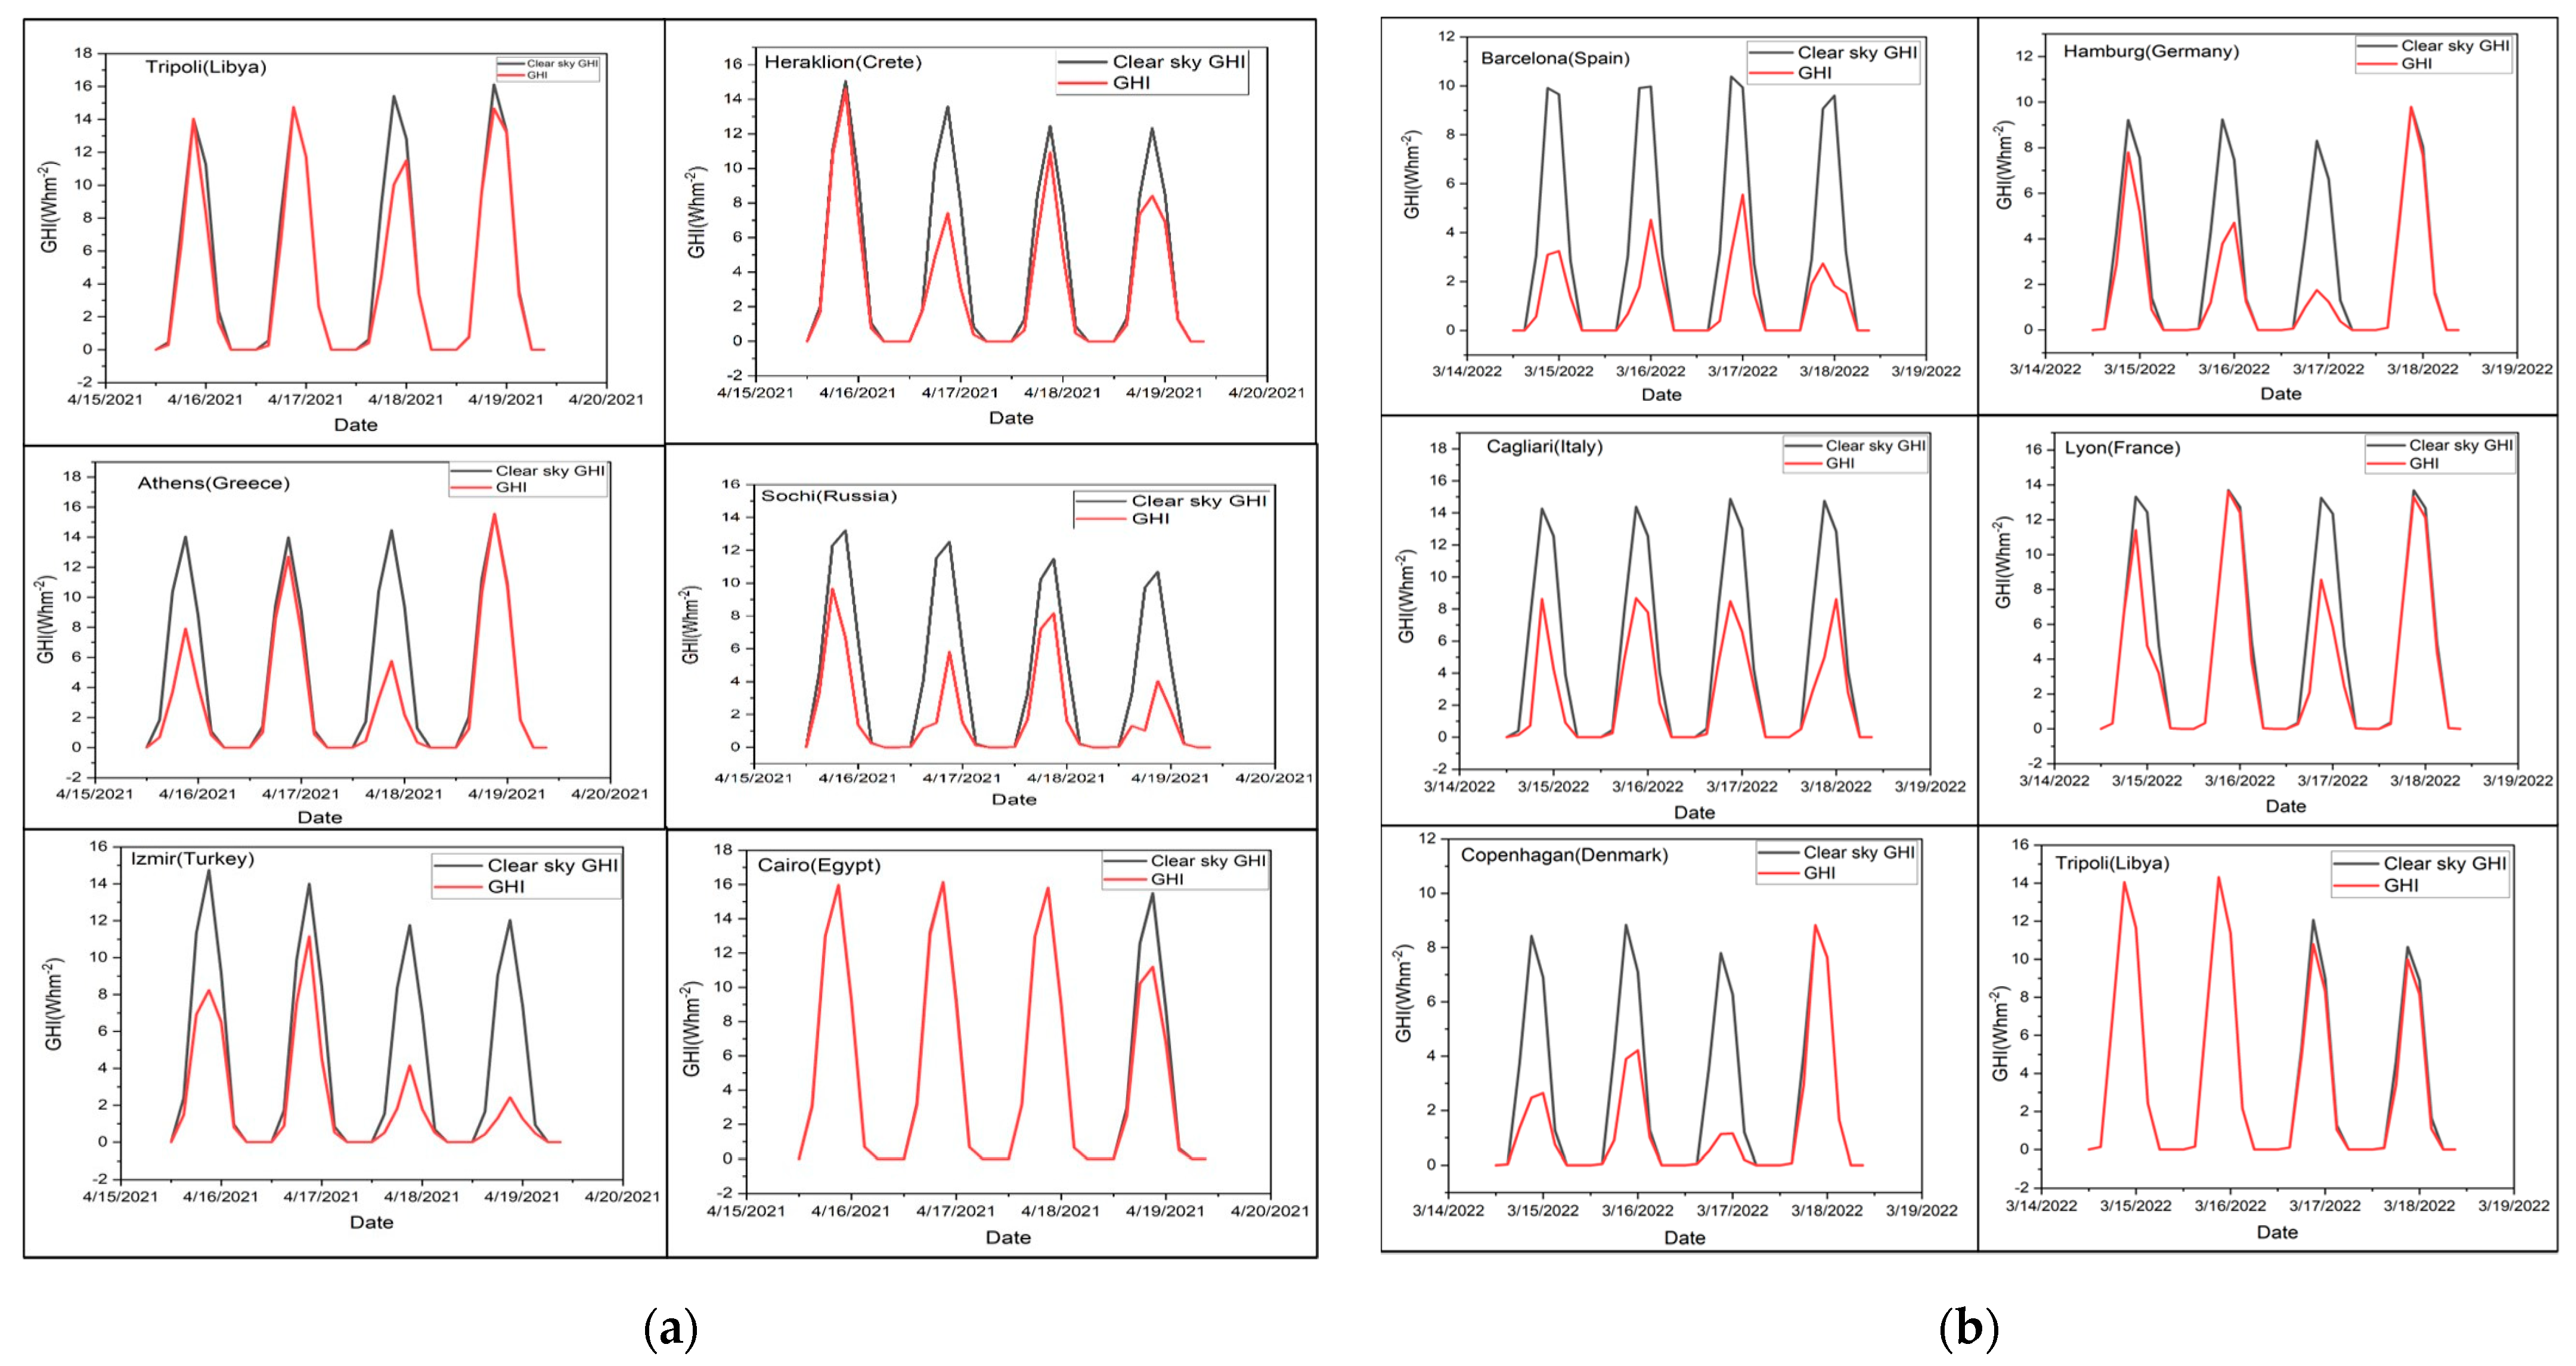
3.2. Solar Radiation Variation

Figure 3a shows the daily clear sky GHI and GHI over all the sites. The mean clear sky GHI during event 1, i.e., without dust over Tripoli, was 8.91 ± 5.45kWh m−2, Athens was 8.47 ± 5.11 kWh m−2, Izmir was 7.07 ± 3.18 kWh m−2, Heraklion was 7.66 ± 4.81 kWh m−2, Sochi was 7.13 ± 3.60 kWh m−2, and Cairo was 9.50 ± 5.64 kWh m−2, respectively (Figure 3a,b). The mean GHI, i.e., with aerosol load conditions over Tripoli, was 7.80 ± 2.48 kWh m−2, Athens was 5.63 ± 2.05 kWh m−2, Izmir was 3.57 ± 2.43 kWh m−2, Heraklion was 5.7 ± 4.3 kWh m−2, Sochi was 3.21 ± 1.77 kWh m−2, and Cairo was 9.0 ± 2.25 kWh m−2.
The computed GHI attenuation varies from 6 to 50.4% during the dust event 1. During the second dust event, mean clear sky GHI with aerosol loading over Tripoli was 7.6 ± 4.73 kWh m−2, Cagliari was 9.0 ± 15.7 kWh m−2, Barcelona was 6.40 ± 3.86 kWh m−2, Hamburg was 5.62 ± 1.28 kWh m−2, Copenhagen was 5.21 ± 1.11 kWh m−2, and Leyon was 8.32 ± 4.91 kWh m−2 (Figure 3b). The mean GHI during dust storm over Tripoli was 7.40 ± 4.78 kWh m−2, Cagliari was 4.60 ± 2.19 kWh m−2, Barcelona was 2.25 ± 0.02 kWh m−2, Hamburg was 3.52 ± 1.28 kWh m−2, Copenhagen was 2.60 ± 1.11 kWh m−2, and Lyon was 6.55 ± 4.78 kWh m−2. The reduced GHI values indicate the attenuation of the radiation during the dust storm shows an aerosol’s direct effect. The GHI attenuation varies from 4.8–64.9% during dust event 2. The dust storm in the present study was too intense as the GHI attenuation range of 40–50%, less than the present study over the Mediterranean region [6].

3.3. Estimated Solar Radiation and Financial PV Production Loss

For each station, during dust events 1 and 2, the average GHI loss per day in % was depicted for each site in Table 1 and Table 2, respectively. The first dust storm affected Eastern Mediterranean countries with a mean GHI attenuation of ~25–53%, reaching the Black Sea. The second dust event affected Western Europe with a mean GHI attenuation of ~4–64%. The GHI loss was determined by subtracting the daily mean GHI under high aerosol load from the GHI under normal conditions (without a dust storm) extracted from the PVGIS tool for the specific sites.
The total combined EP losses vary between 4 and 11 GWh for an estimated total PV capacity of ~2.2 GW over Eastern Mediterranean and 14–25 GWh for an estimated total PV capacity of ~4.8 GW over the Western European region during dust event 2 (Figure 4a,b) [9]. Figure 4a depicts the drop in EP from 10 to 60%, owning to FL is in the range of 40 –720 K euros over the eastern Mediterranean. However, Figure 4b shows the drop in EP from 10 to 40% leading to FL in the range of ~ 180–1210 K euros over Western Europe. The losses in energy production led to an estimated overall economic loss of EUR 1.12 million and EUR 2.81 million during the first and the second dust episodes, respectively, affecting almost 13% (7 GW) of installed solar capacity across the affected regions [9,10]. The accuracy of the estimated PV production as compared to the real values was previously studied in various papers, indicating the level of uncertainty under realistic conditions [5,11].

4. Conclusions

The intensity of the events was extremely high, with total AOD reaching 1.2–2.7 more than 2000 km from the dust sources. A significant reduction in daily mean GHI for the seven GW PV system capacity was observed. The total production was quantified under normal conditions and during the dust event resulting in 44% losses in mean EP and FL of ~EUR 3.93 million. The EP loss led to a significant economic loss during both dust events; however, losses over the Western European region were massive compared to the Mediterranean region. The limitations of the proposed approach deal with the non-operational setup of the observations and calculations performed to act as an early warning system for renewable energy security and grid stability under forthcoming dust events. The next step of this study will be the operational implementation and to compare the dust effect quantification separately for each one of the PV plants with the current first estimations.

Author Contributions

Conceptualization, P.G.K.; methodology, P.G.K.; software, P.G.K.; validation, D.S. and P.G.K.; formal analysis, P.G.K.; investigation, D.S.; resources, P.G.K.; data curation, D.S and P.G.K.; writing—original draft preparation, D.S.; writing—review and editing, P.G.K.; visualization, P.G.K. and D.S.; All authors have read and agreed to the published version of the manuscript.

Funding

This research received no external funding.

Institutional Review Board Statement

Not applicable.

Informed Consent Statement

Not applicable.

Data Availability Statement

Data can be available upon request from the corresponding author.

Conflicts of Interest

The authors declare no conflict of interest.

References

  1. Kosmopoulos, P.G.; Kazadzis, S.; El-Askary, H.; Taylor, M.; Gkikas, A.; Proestakis, E.; Kontoes, C.; El-Khayat, M.M. Earth-Observation-Based Estimation and Forecasting of Particulate Matter Impact on Solar Energy in Egypt. Remote Sens. 2018, 10, 1870. [Google Scholar] [CrossRef]
  2. Masoom, A.; Kosmopoulos, P.; Bansal, A.; Gkikas, A.; Proestakis, E.; Kazadzis, S.; Amiridis, V. Forecasting Dust Impact on Solar Energy Using Remote Sensing and Modeling Techniques. Sol. Energy 2021, 228, 317–332. [Google Scholar] [CrossRef]
  3. IEA. Renewables 2020, IEA, Paris. 2020. Available online: https://www.iea.org/reports/renewables-2020 (accessed on 10 November 2022).
  4. Aicardi, D.; Musé, P.; Alonso-Suárez, R. A Comparison of Satellite Cloud Motion Vectors Techniques to Forecast Intra-Day Hourly Solar Global Horizontal Irradiation. Sol. Energy 2022, 233, 46–60. [Google Scholar] [CrossRef]
  5. Masoom, A.; Kosmopoulos, P.; Kashyap, Y.; Kumar, S.; Bansal, A. Rooftop Photovoltaic Energy Production Management in India Using Earth-Observation Data and Modeling Techniques. Remote Sens. 2020, 12, 1921. [Google Scholar] [CrossRef]
  6. Kosmopoulos, P.G.; Kazadzis, S.; Taylor, M.; Athanasopoulou, E.; Speyer, O.; Raptis, P.I.; Marinou, E.; Proestakis, E.; Solomos, S.; Gerasopoulos, E.; et al. Dust Impact on Surface Solar Irradiance Assessed with Model Simulations, Satellite Observations and Ground-Based Measurements. Atmos. Meas. Tech. 2017, 10, 2435–2453. [Google Scholar] [CrossRef]
  7. Schroedter-Homscheidt, M.; Azam, F.; Betcke, J.; Hanrieder, N.; Lefèvre, M.; Saboret, L. Surface Solar Irradiation Retrieval from MSG/SEVIRI Based on APOLLO Next Generation and HELIOSAT-4 Methods. Energy Meteorol. 2022, 31, 455–476. [Google Scholar] [CrossRef]
  8. Gschwind, B.; Wald, L.; Blanc, P.; Schroedter-homscheidt, M.; Arola, A. Improving the McClear Model Estimating the Downwelling Solar Radiation at Ground Level in Cloud-Free Conditions. Energy Meteorol. 2019, 28, 147–163. [Google Scholar] [CrossRef]
  9. IRENA. Renewable Capacity Statistics 2023; IRENA: Abu Dhabi, United Arab Emirates, 2023. [Google Scholar]
  10. REN21. Renewables 2023 Global Status Report Collection, Renewables in Energy Supply; REN21 Secretariat: Paris, France, 2023; ISBN 978-3-948393-08-3. [Google Scholar]
  11. Kumar, A.; Kosmopoulos, P.; Kashyap, Y.; Gautam, R. Rooftop Photovoltaic Energy Production Estimations in India Using Remotely Sensed Data and Methods. Remote Sens. 2023, 15, 3051. [Google Scholar] [CrossRef]
Figure 1. Operational solar irradiation mapping in Europe and North Africa during the extreme dust events that affected Eastern Mediterranean counties (left plot) and Western Europe countries (right plot) (source: http://solea.gr/solar-irradiance-monitoring/, accessed on 9 September 2022).
Environsciproc 26 00008 g001
Figure 2. Total Aerosol optical depth (AOD) and Aerosol optical depth due to dust (AOD DU) at 500 nm during the events; (a) AOD variation over Tripoli, Athens, Izmir, Heraklion, Sochi, and Cairo during dust event 1(i.e., 16–19 April 2021). (b) AOD variation over Barcelona, Cagliari, Copenhagen, Hamburg, Lyon, and Tripoli during dust event 2 (i.e., 15–18 March 2022).
Environsciproc 26 00008 g002
Figure 3. (a) Clear sky global horizontal irradiation (Clear sky GHI) and Global horizontal irradiation (GHI) variation during the events over Tripoli, Athens, Izmir, Heraklion, Sochi, and Cairo during dust event 1(i.e., 16–19 April 2021). (b) Clear sky GHI and GHI over Barcelona, Cagliari, Copenhagen, Hamburg, Lyon, and Tripoli during dust event 2 (i.e., 15–18 March 2022).
Environsciproc 26 00008 g003
Figure 4. Financial analysis of solar plant’s energy production; (a) with a nominal capacity of 2.2 GW in the Eastern Mediterranean during the dust event 1 (16–19 April 2021), (b) with a nominal capacity of 4.8 GW over Western Europe during event 2 (15–18 March 2022).
Environsciproc 26 00008 g004
Table 1. Daily mean GHI reduction city-wise during dust event 1.
SitesGHI DustGHI NormalGHI Loss
Tripoli (32.8° N, 13.2° E, Libya)4.30 *5.20 *17.18%
Athens (37.9° N, 23.7° E, Greece)3.114.9837.18%
Izmir (38.4° N, 27.1° E, West Turkey)1.974.8058.83%
Heraklion (35.3° N, 25.1° E, Crete, southern Greece)3.144.8134.54%
Sochi (43.60° N, 39.7° E, Russia)1.843.8652.20%
Cairo (30.1° N, 31.2° E, Egypt)4.895.5111.08%
* GHI values are in (kWh m−2).
Table 2. Daily mean GHI reduction city-wise during dust event 2.
SitesGHI DustGHI NormalGHI Loss
Tripoli (32.8° N, 13.2° E, Libya)3.70 *4.91 *26.62%
Cagliari (39.2° N,9.1° E, Italy)2.543.6630.48%
Barcelona (41.3° N, 2.1° E, Spain)1.124.2973.82%
Hamburg (53.5° N, 9.9°E, Germany)1.752.6333.38%
Copenhagen (55.7° N, 12.5° E, Denmark)1.292.9355.71%
* GHI values are in (kWh m−2).
Disclaimer/Publisher’s Note: The statements, opinions and data contained in all publications are solely those of the individual author(s) and contributor(s) and not of MDPI and/or the editor(s). MDPI and/or the editor(s) disclaim responsibility for any injury to people or property resulting from any ideas, methods, instructions or products referred to in the content.

