Article

Characterization of Fluid Flow and Heat Transfer Patterns in the Seulawah Agam Volcanic Geothermal System Using Integrated Geophysical and Geochemical Data

1
Graduate School of Mathematics and Applied Sciences, Universitas Syiah Kuala, Banda Aceh 23111, Indonesia
2
Energy and Mineral Resources Agency of Aceh Province, Banda Aceh 23114, Indonesia
3
Tsunami and Disaster Mitigation Research Center (TDMRC), Universitas Syiah Kuala, Banda Aceh 23111, Indonesia
4
Earth Resources Exploration Research Group, Faculty of Mining and Petroleum Engineering, Bandung Institute of Technology, Bandung 40132, Indonesia
*
Author to whom correspondence should be addressed.
Earth 2026, 7(1), 30; https://doi.org/10.3390/earth7010030
Submission received: 2 January 2026 / Revised: 7 February 2026 / Accepted: 10 February 2026 / Published: 16 February 2026

Abstract

The Seulawah Agam volcano, located in Aceh, hosts one of Indonesia’s largest unexploited geothermal resources that is included in the Indonesian Green Energy Program. Previous studies of the Seulawah geothermal system (SGS) have used partial data and methods without developing a comprehensive conceptual model of the reservoir and its fluid flow and heat transfer patterns. This study aims to characterize the groundwater flow and heat transfer patterns of the SGS through numerical modeling based on integrated geological, geophysical, and geochemical data. Numerical modeling was conducted along two representative transects: Ie Seum, Ie Jue, and Kawah van Heutsz manifestations. MODFLOW 6 was used to model groundwater flow and heat transfer using a new conceptual model derived from magnetotelluric data, chemical composition and physical properties of the fluid, isotopic data, and mineragraphic data. The low resistivity anomalies are closely related to fluid discharges beneath the Ie Seum and Ie Jue areas. The depth of the Ie Seum reservoir is around 1.0–2.5 km, with estimated temperatures of 120–242 °C, while the depth of the Ie Jue and Kawah van Heutsz reservoirs is between 0.8 and 2.5 km, with estimated temperatures of 150–316 °C. The modeling suggests that the Ie Seum and the Ie Jue–Kawah van Heutsz systems represent regional groundwater and intermediate-local flow regimes, respectively. It is suggested that drilling be conducted around the local Ie Jue hydrothermal system, which is more economical given the shallower reservoir and higher temperature.

1. Introduction

The Seulawah Agam volcano contains the largest geothermal resource in Aceh Province, Northern Sumatra, located approximately 45 km from the densely populated city of Banda Aceh (Figure 1). This resource is significant for meeting the region’s substantial green energy needs. However, the Seulawah Agam geothermal resource remains undeveloped and requires further detailed study before drilling and power plant development. The geothermal prospects of Seulawah Agam have been studied since the early 1990s as a potential geothermal energy source by Pertamina UEP Sumbagut (now PT. Pertamina Geothermal Energy). Studies included a geological survey in 1993, a geophysical survey in 1994, and a hydrogeological survey in 1995. The report indicates the Seulawah geothermal system has a potential of over 320 MW, enough to electrify half of Aceh Province.
The Seulawah Agam geothermal system is characterized by the Seulimeum fault [1,2], several surrounding minor faults, and the Seulawah Agam volcanic complex. These minor faults and the volcanic system strongly influence the hydrothermal circulation [3,4]. The right-lateral Seulimeum fault extends from the Tangse region and trends northeast–southwest along the southwestern flank of the Seulawah Agam volcano. This major strike-slip fault cuts through the Lamteuba volcanic rock unit and continues into the Quaternary Seulawah Agam volcanic edifice. This pattern shows persistent tectonic deformation and ongoing fault activity during the late Quaternary. The study of interactions between fault zones and volcanic systems around the Seulawah Agam geothermal is important to investigate, as faults play a role as fluid pathways, while volcanic systems provide the magmatic heat source.
The Seulawah geothermal system is evidenced by the hot fluid manifestations at the Ie Seum, Ie Ju, and the Kawah van Huetzs (Figure 1). Using MT data, Marwan et al. [5] suggested that the depth of the reservoir is at 2 km, while the heat sources lie on the northern side, centered on the Heutsz crater area, and the southern side in the Cempaga crater area. Using 1D TEM data, Marwan et al. [6] imaged the structure of the Seulawah volcano down to 500 m. Additionally, hydrogeochemical evolution and composition play a crucial role in determining the reservoir of the Seulawah Agam geothermal system [7,8]. In support of this, geochemical analysis by Idroes et al. [9] reveals a high temperature geothermal system in the northern Seulawah area, with an average reservoir temperature of about 259 °C, indicating significant potential for power generation. Although previous studies have been conducted using different methods, the interpretation of the hydrothermal system was based on separate analyses.
Marwan et al. [5] analyzed the Seulawah geothermal system exclusively with resistivity data, whereas Marwan et al. [6] were unable to characterize the reservoir due to a maximum penetration depth of 500 m. In contrast, Idroes et al. [10] focused solely on geochemical data, omitting geophysical information from their interpretation. The most effective approach to characterizing the geothermal reservoir structure and properties is to integrate geophysical, geological, geochemical, and isotopic data [11]. Before advancing geothermal development, particularly when selecting sites and determining drilling depth, a company should assess the reservoir’s structure, fluid origin, subsurface fluid flow, and heat transfer mechanisms within the hydrothermal system.
Numerical modeling has been used to improve understanding of fluid and heat flow in geothermal systems, as well as the natural evolution of fault zones [5,12,13]. This method is especially important for analyzing how volcanic activity contributes to heat sources, while fault zones serve as conduits for fluid flow. In various regions, numerical modeling serves as a formal tool to identify upflow, recharge, and mixing zones, which are essential for selecting drilling sites and assessing reservoir sustainability [14,15,16]. For instance, Zeng et al. [17] applied numerical modeling to estimate water circulation and optimize heat production from hot dry rock geothermal systems. Furthermore, numerical simulation was also employed during geothermal production to maximize power generation and promote sustainable resource utilization [18].
In this study, a novel conceptual model of the Seulawah geothermal system is proposed by integrating geological, geophysical, geochemical, and isotopic data. Based on this improved conceptual framework, numerical modeling is applied to characterize hydrothermal fluid flow and heat transfer patterns within the Seulawah geothermal system, representing a previously unexplored approach. This comprehensive understanding of the hydrothermal system is expected to facilitate the optimal utilization of Seulawah geothermal resources.

2. Tectonic Setting and Geology of Seulawah Agam

The Seulawah Agam geothermal resource is situated near Banda Aceh, the most populous city in northern Sumatra. This region is characterized by the tectonic convergence of the Indian and Eurasian plates, which results in the Sumatra subduction zone, as indicated by the trench line on the inset map in Figure 1. Subduction of the Indian plate beneath the Eurasian plate induces partial melting and magma generation. The ascending magma forms a magmatic arc above Sumatra [19], establishing a correlation between the Sumatra magmatic arc line and the Sumatra trench.
The oblique motion of the Indian plate relative to the Sumatra subduction trench leads to the development of the Sumatra fault along a weak magmatic arc (see inset in Figure 1). Previous studies suggest that these fault lines may be associated with volcanoes [20]. Nevertheless, several volcanoes in northern Sumatra are not directly aligned with the Sumatra fault. For instance, the Bur Ni Telong and Seulawah Agam volcanoes are situated slightly north of the Sumatran fault line and are accompanied by active faults. The Bur Ni Telong volcano is associated with the Lampangan fault [2], whereas the Seulawah Agam volcano is linked to the Seulimeum fault [21].
Both volcanoes possess significant geothermal resources; however, the Seulawah Agam geothermal resource has received more extensive study due to its proximity to the densely populated city of Banda Aceh. The stratovolcano Seulawah Agam began to form during the Pliocene–Pleistocene epoch, approximately 2.5 to 2.0 million years ago, with its formation initiated by the Lamteuba volcanic phase that dominated the northern region [22]. Volcanic activity persisted until around 1.25 million years ago, when eruptions produced the Qpal unit in the Ie Seum area. The most recent volcanic phase, known as the Seulawah Agam phase, likely commenced around 1.18 million years ago and resulted in the development of the present-day volcanic complex. A modified surface geological map, adapted from Bennett et al. [22], illustrates the spatial distribution of lithological formations, geothermal manifestations, and fault structures surrounding the Seulawah Agam volcano (Figure 1). The lithology is among parameters that considered in the numerical modeling.
Lam Teuba volcanic rocks formed from eruptions or magma outflow through long cracks, especially near the dacitic rock zone by Ie Seum hot springs. The Seulawah Agam phase volcanic rocks resulted from central eruptions. This unit is divided into several subunits, indicating differences in eruption timing, shifts in eruption centers, and changes in magmatic properties [12].
The Seulawah Agam andesite lava unit (Qlsa) comprises andesite lava spread across the western to southwestern slopes of Mount Seulawah Agam. This lava is one of the younger volcanic products and may be linked to the late eruption, temporally overlying earlier units such as the Lamteuba andesitic tuff. The Kawah van Heutsz (KVH) crater is identified as a feature related to late-stage volcanic activity. The Lamteuba (Qpal) andesitic tuff unit trends southeast-northwest, locally lying beneath the Seulawah Agam andesite lava unit. In the Ie Seum area, this rock shows intense spherulitization, silicification, and propylitization. This unit is considered the last product of the major Mount Lam Teuba eruption as volcanic energy waned, before the caldera collapse that formed the overlying pyroclastic andesite breccia unit.
The Breccia Alluvium Unit (Qhlb) occurs in the northwest volcanic complex, mostly in low-relief areas and valleys. Its outcrops include tuffaceous sand, tuffaceous clay, tuff, and alluvial conglomerate. These deposits are products of the Krueng Raya River fluvial system and related alluvial fan formation. The Tuffaceous sandstone unit (Qhlt) comprises tuffaceous sandstone and layers of tuffaceous clay, deposited through erosion and transport of volcanic material from nearby, later settling in a lake environment, possibly a crater lake.
The Lamteuba andesite breccia unit (Qpjl) consists of pyroclastic andesite breccia from flows. In turn, blocks of dacite and andesite lava overlie this unit, while Qpjl itself rests on earlier volcanic products, such as the Lamteuba andesitic tuff (Qpal), and is locally overlain by alluvial and tuffaceous units. Because of its wide lateral distribution, Bennett et al. [22] interpreted Qpjl as the result of a significant Lam Teuba eruption. This eruption likely caused the volcano to collapse, forming a large caldera that is still subsiding (cauldron subsidence). Notably, the Qhlb, Qhlt, Qpal, and Qpjl units are genetically related as part of the volcanic sequence, and they currently form an aquifer system with groundwater flowing through their highly permeable intergranular spaces.
The carbonate sandstone–claystone unit (Tuktp) lies in the southeast and forms structural hills. It consists of carbonate sandstone, mudstone, carbonate claystone, sandy limestone, and conglomerate. The Tuktp unit is the basement rock for volcanic units (Qpjl, Qpal, Qhlb, Qhlt, and Qlsa). It supports the volcanic and hydrothermal system and acts as the reservoir rock for geothermal energy.
The geothermal system of Seulawah Agam volcano features three hydrothermal manifestations: Ie Seum, Kawah van Heutsz, and Ie Jue. Ie Seum is located along the Seulimeum fault, which is a major right-lateral fault. This fault extends from Tangse at 95.95 °E to the ocean at 97.70 °E, passing through Seulawah volcano and Weh Island. Kawah van Heutsz and Ie Jue geothermal manifestations are not on the Seulimeum fault but may be along minor faults or cracks [12]. Ie Jue is situated on the southwestern slope of the Seulawah Agam volcano, and its fluids could move through minor faults. The Kawah van Heutsz geothermal manifestation is close to the Kawah van Heutsz crater, marked by fumaroles and steaming ground.

3. Materials and Methods

3.1. Workflow of Data Analysis and Modeling

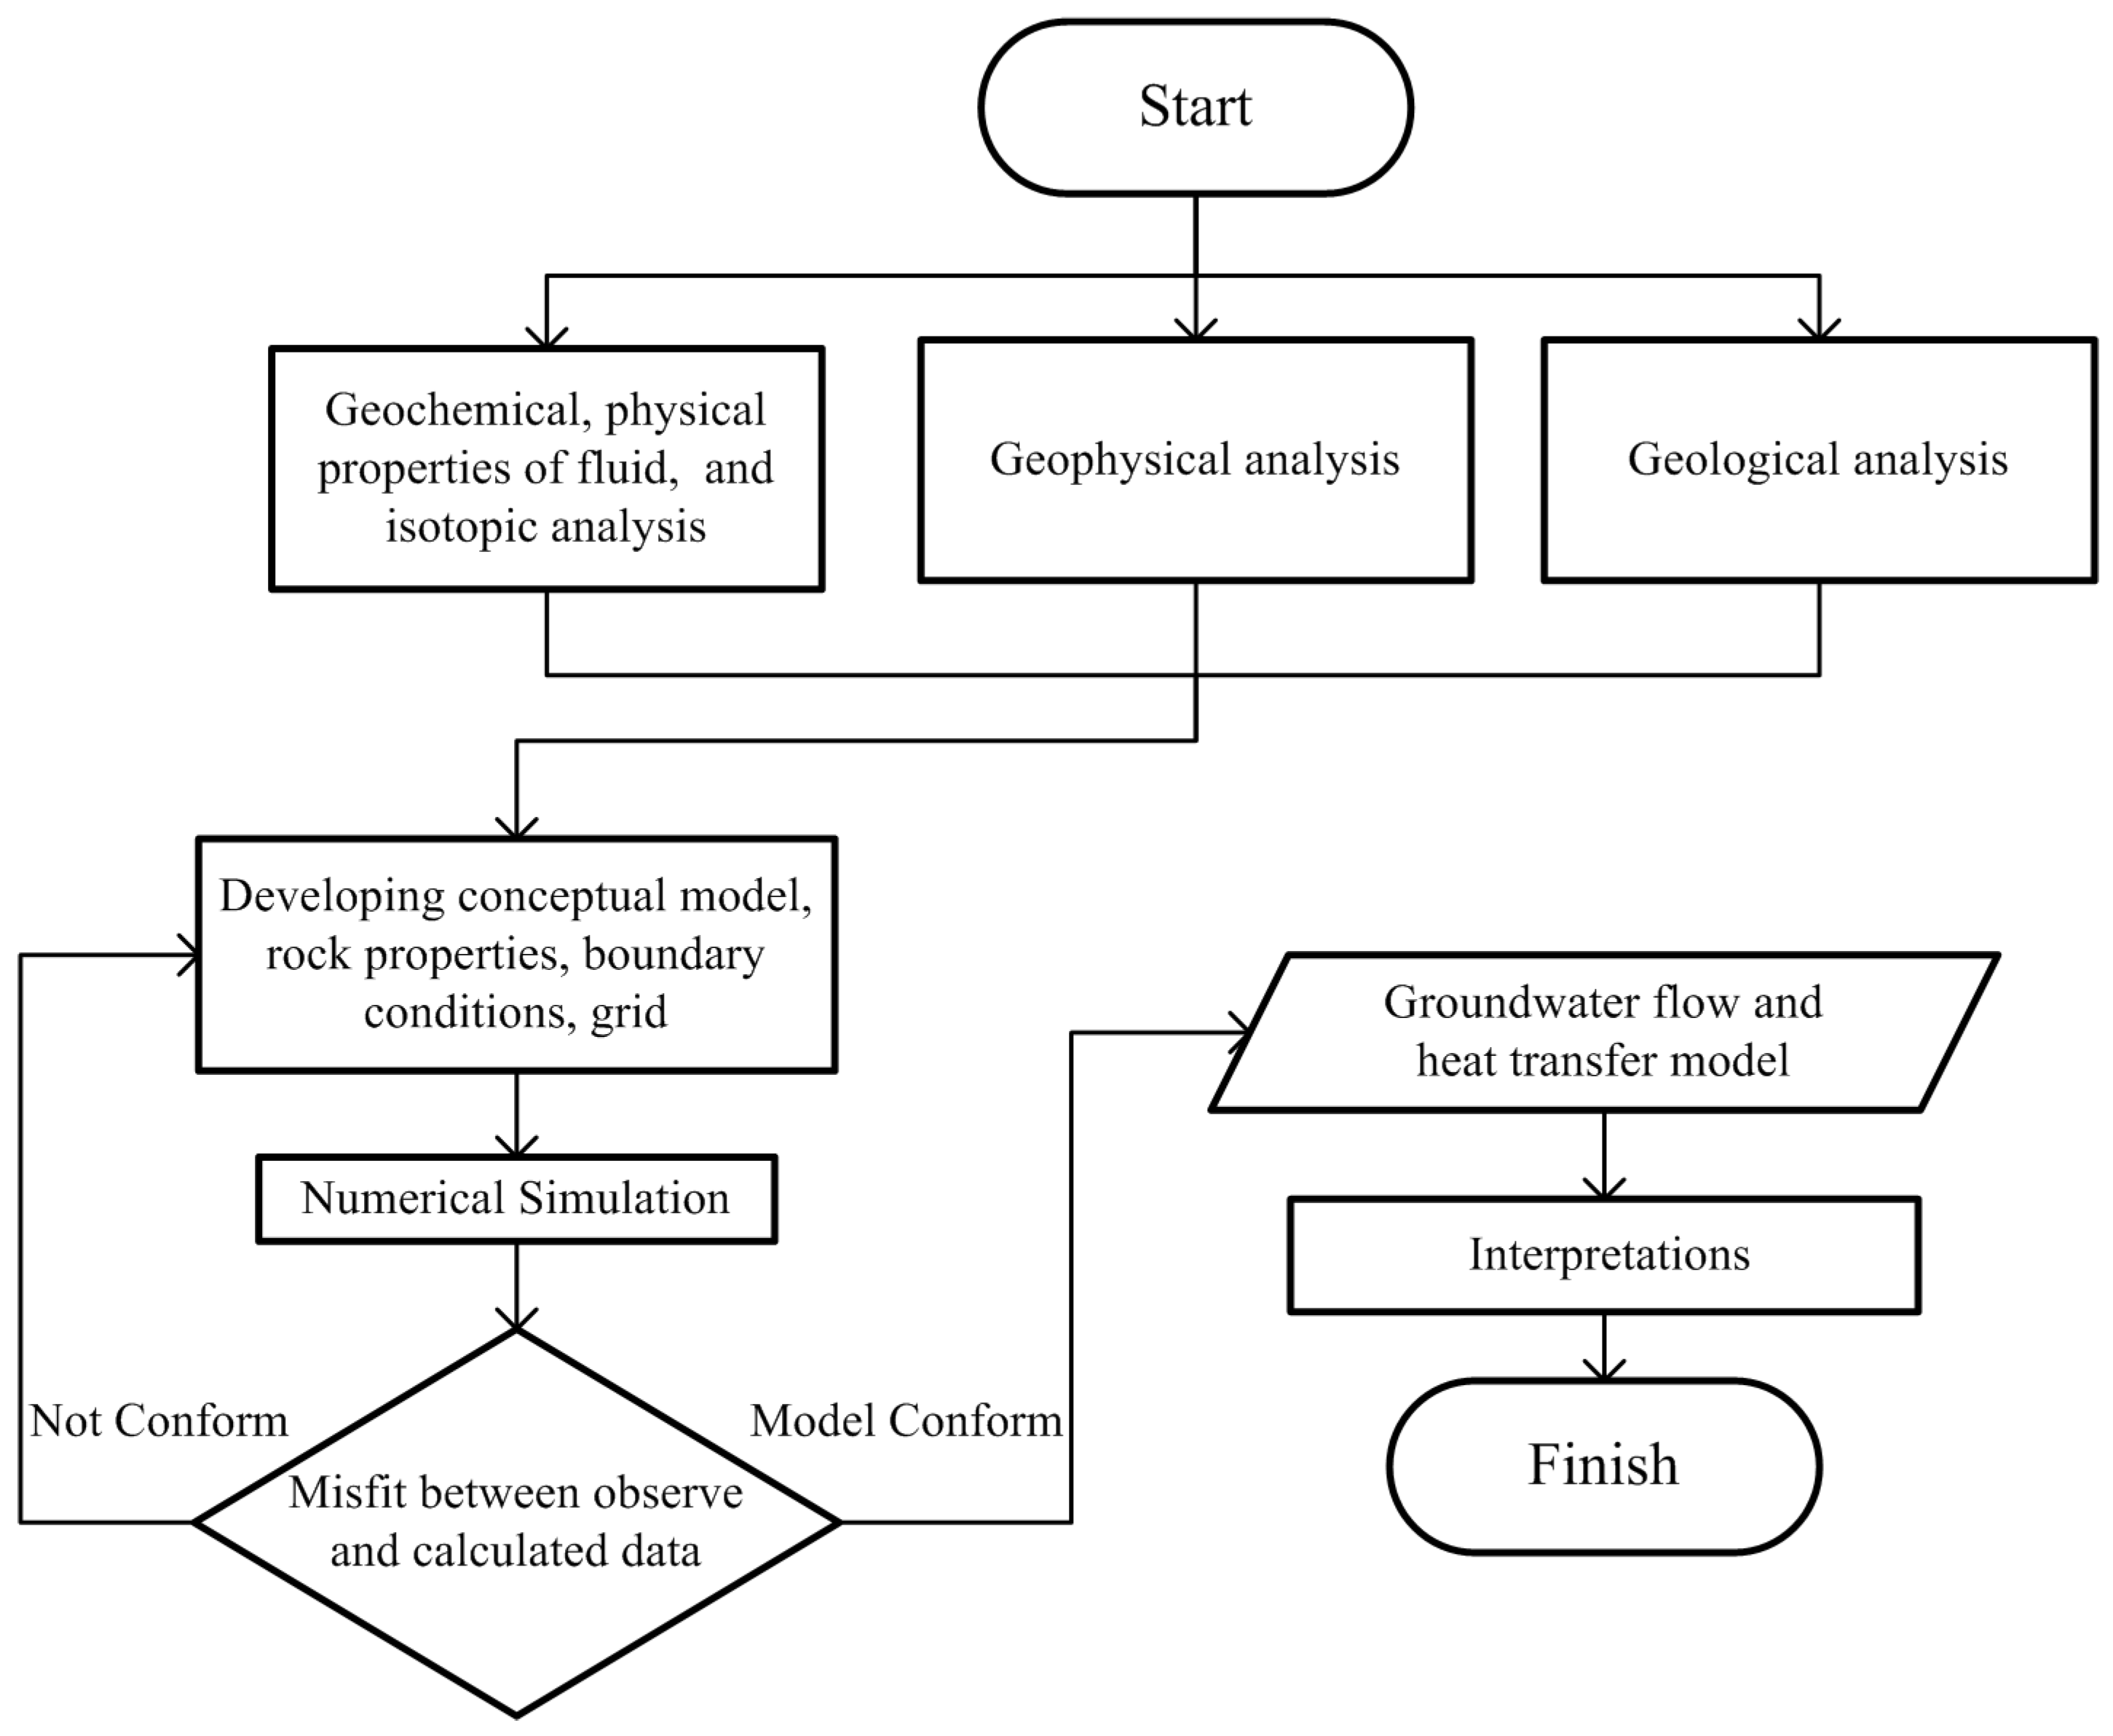
A schematic workflow of the study is shown in Figure 2. The geological, geophysical, and geochemical datasets were analyzed in an integrated manner to define the initial and boundary conditions for developing the conceptual model and numerical simulation of the Seulawah Agam geothermal system. The workflow begins with magnetotelluric (MT) resistivity analysis, which was interpreted to classify subsurface zones based on resistivity contrasts. These interpretations were integrated with geological analyses, including stratigraphic classification, to constrain lithological boundaries and validate resistivity-based layer interpretations. Major faults were defined from the existing tectonic setting, and fracture zones were delineated by identifying resistivity discontinuities and were incorporated into the model as outflow zones. Subsequently, analyses of fluid chemical composition and rock thin sections were conducted to characterize fluid types and hydrothermal alteration. Field measurements of fluid physical parameters were used to estimate reservoir temperatures and define initial thermal conditions. Isotopic analyses were applied to infer the elevation of meteoric recharge sources within the geothermal system.
The combination of analysis formed the conceptual model and 2D numerical simulation. The geothermal system was defined in a grid to reflect the resistivity-derived stratification and lithological framework, including the hydraulic and thermal properties assigned. During the simulation stage, groundwater flow is computed first to obtain the hydraulic head distribution and flow vectors, which are subsequently used as inputs for the heat transport simulation. Heat transport is simulated by considering conductive heat transfer from the heat source and convective fluid flow within the reservoir. The resulting groundwater flow and heat transfer are evaluated to ensure numerical stability and consistency with the conceptual model.

3.2. Magnetotelluric (MT) Experiment and Analysis

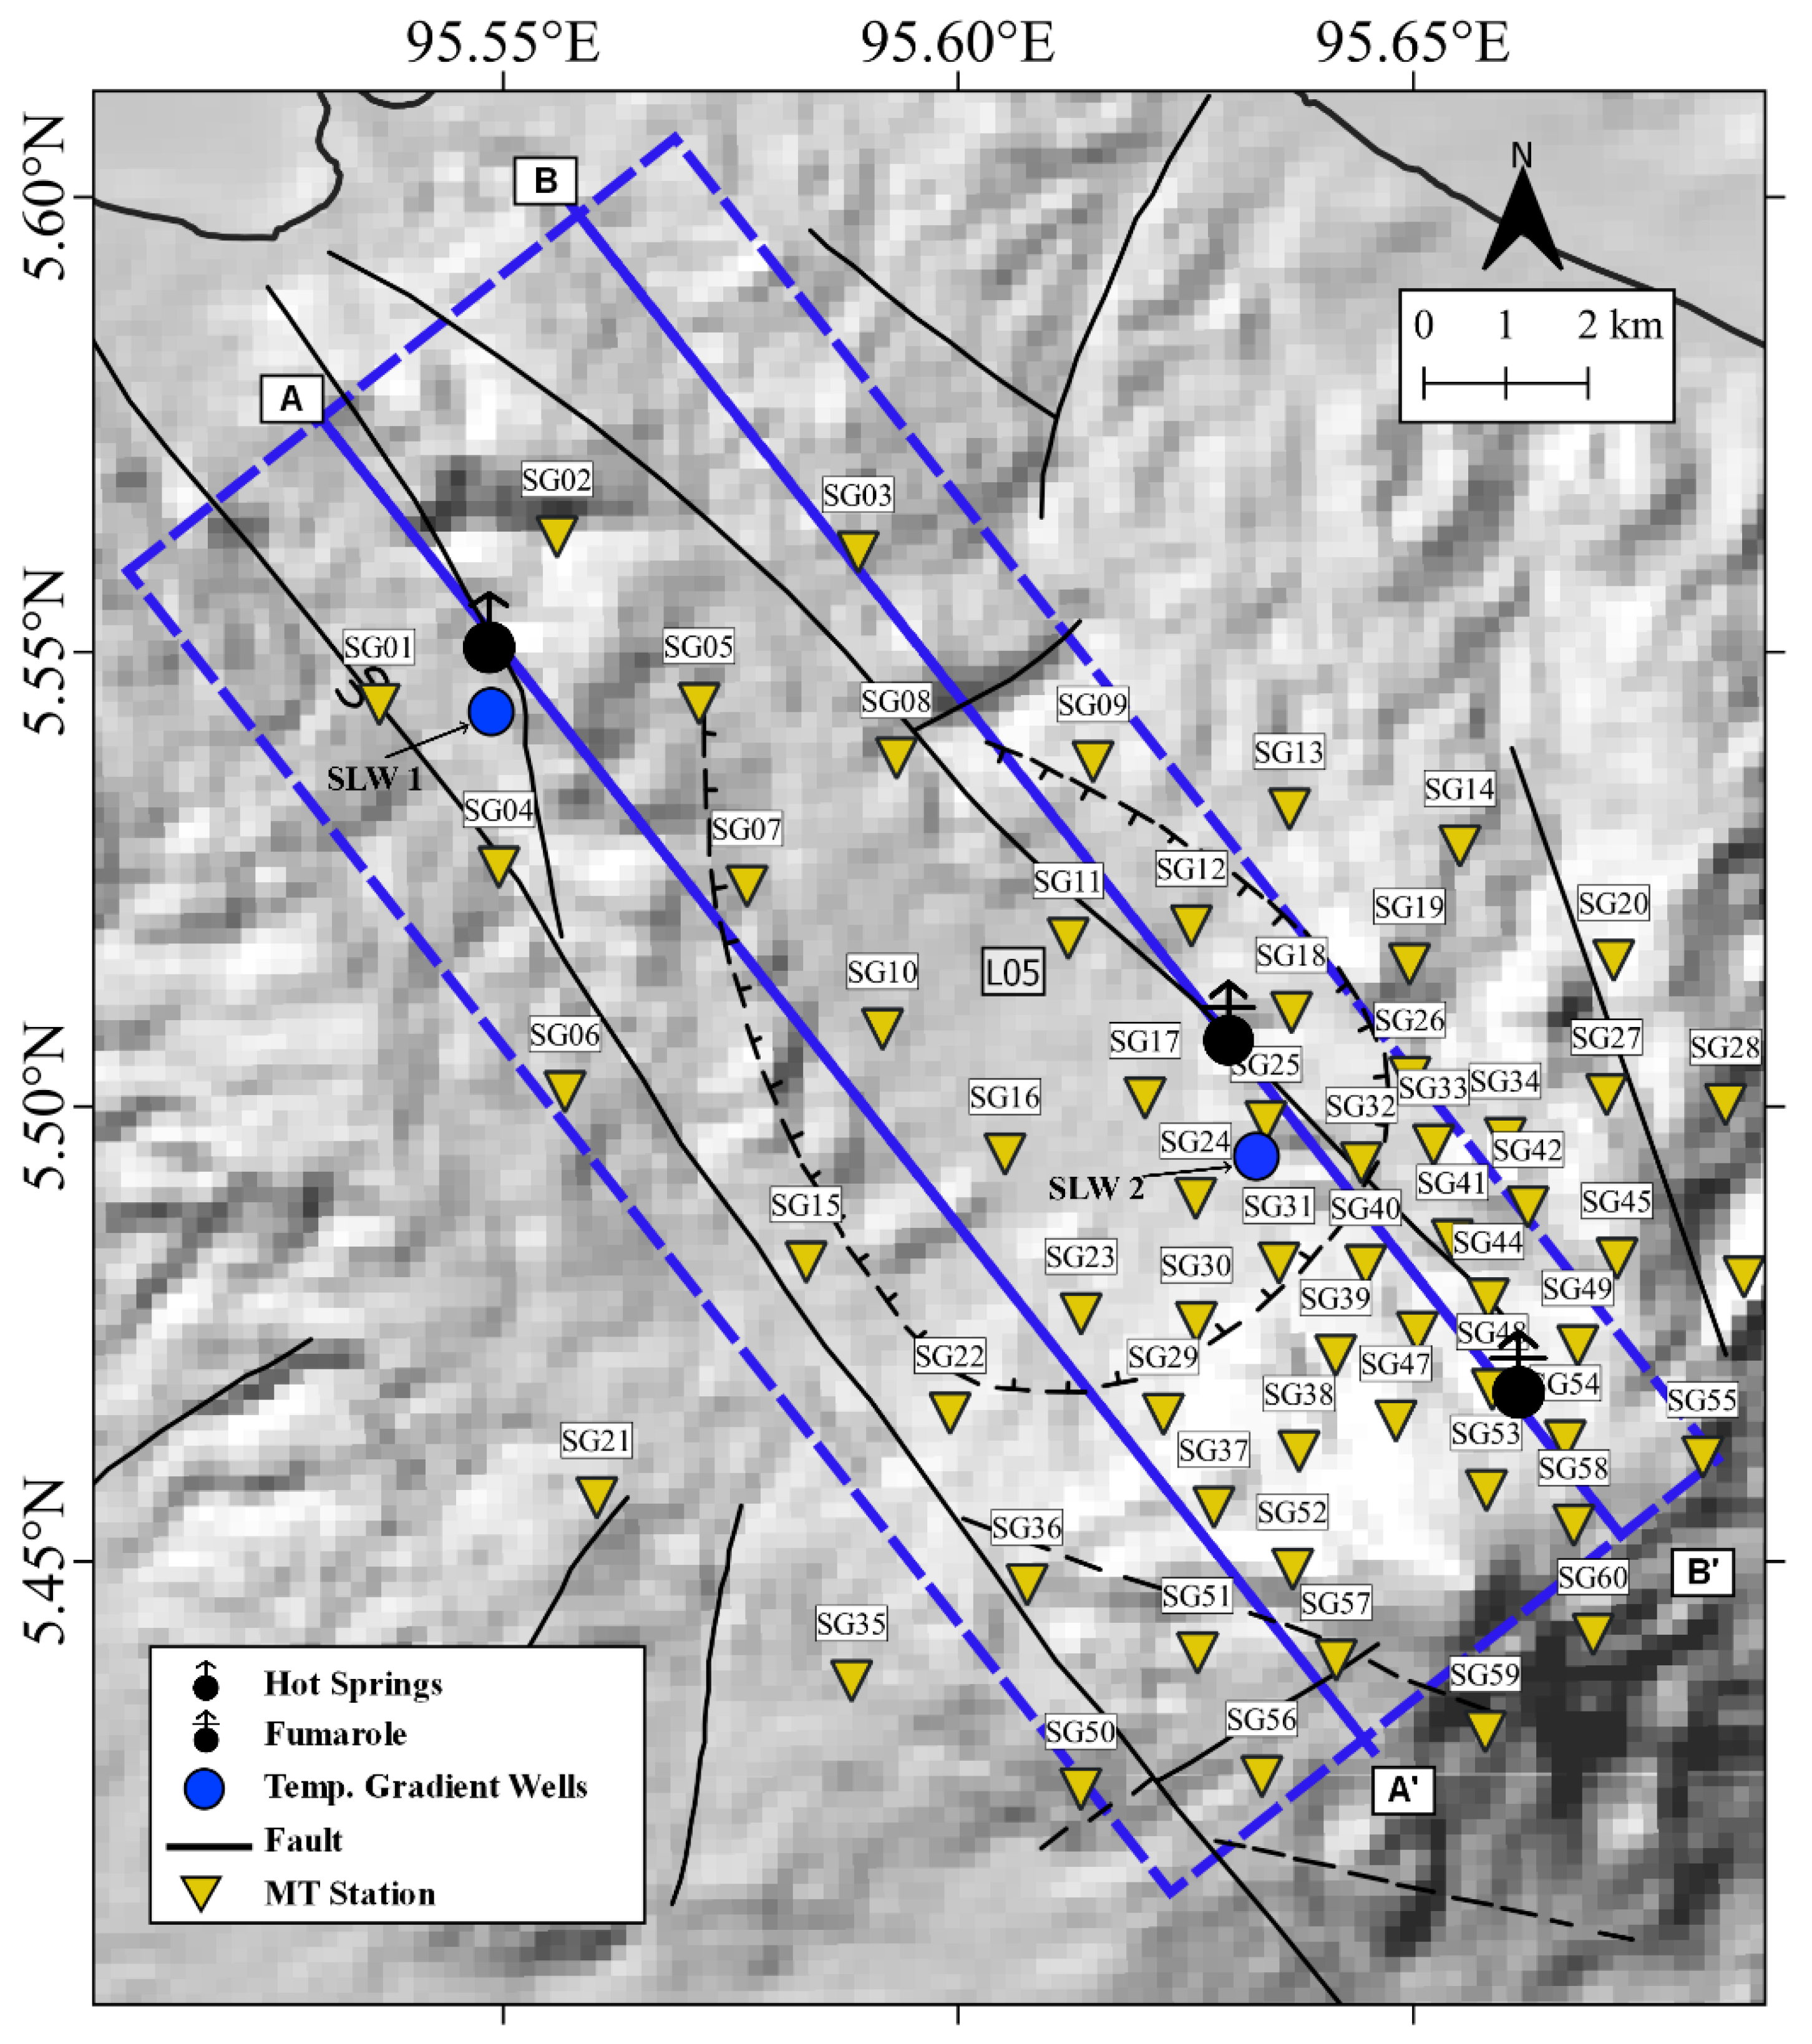
The magnetotelluric (MT) survey used 60 stations with a Phoenix MTU-5 instrument, operating from 1 to 10 kHz. Stations were spaced approximately 1.0 km apart in the x-direction and 0.5 km in the y-direction. The survey covered Seulawah Agam volcano and hot springs and crossed the Seulimeum and local faults across a 207 km2 area (dashed blue line), focusing on the Seulawah geothermal system (SGS), as shown in Figure 3. The A–A’ cross section runs nearly parallel to the Seulimeum fault (SE-NW) and perpendicular to local features, aiming to define resistivity from the volcano to the Ie Seum hot springs. The B–B’ cross section describes resistivity from the volcano to Kawah van Heutsz and Ie Jue.
The MT data were analyzed using two main open-source tools. Mtpy is a Python toolkit for magnetotelluric (MT) phase tensor analysis and data processing [23]. Occam2D is a 2D smoothness-constrained inversion software [24] that models project data with high lateral continuity. Its optimization for smooth results helps avoid overinterpreting data. The algorithm uses a roughness factor to control model complexity.

3.3. Geochemical and Isotopic Data Analysis

The hydrochemical characteristics of hot springs, such as primary ion composition (the amounts of main dissolved ions, such as sodium and chloride), trace elements (minor naturally occurring elements in water), and water isotope composition (the ratio of stable isotopes such as oxygen-18 to oxygen-16), were utilized to explain the genesis (origin), water source, and subsurface geological conditions. Conservative constituents (elements or compounds that do not react easily and thus remain largely unchanged in the water) provide information about their sources and the fluids’ sources. This is because they only form soluble minerals, and their supply to geothermal fluids is too limited to reach saturation with any minerals. These chemical insights lay the groundwork for understanding the thermal behavior and reservoir characteristics of geothermal systems in the study area.
Information on the thermal features of the Seulawah geothermal system is necessary to control and validate the initial model. Table 1 shows the field measurements of the physical properties (such as temperature, pH, and conductivity) of the Ie Seum, Ie Jue, and Kawah van Heutsz manifestations. Geothermometers, which are calculation methods or formulas, estimate geothermal reservoir temperatures using the chemical composition of surface hot water. This method relies on the solubility or concentration ratio of specific ions (for example, silica or sodium and potassium ions) in hot water, which can be correlated to the temperature of the deeper reservoir. Others have applied this technique in similar contexts. Only the Ie Seum hot spring provides a water fluid type suitable for geothermometer calculation because it has a chloride water type (water in which chloride ions are the dominant anion).
The surface features of the Seulawah prospect area consist of several fumaroles, steam vents, and hot springs. In this study, the three geothermal manifestations under consideration are Ie Seum, Ie Jue, and Kawah van Heutsz, located at elevations of 75 m, 280 m, and 750 m, respectively, with varying recharge elevations. To analyze these manifestations, we first calculated their recharge elevations using the local meteoric water lines (LMWLs) equation. Specifically, the altitude effect of δD and δO18 can be used to calculate recharge elevations. Between the two, due to the effect of oxygen diffusion, the δD values of geothermal waters are considered more robust for this purpose [7]. In geothermal studies, the D/H ratio observed at geothermal fields is used to infer the local groundwater derived from rainwater infiltration, while the O18/O16 ratio is used to investigate water and rock interactions [25]. Therefore, to carry out this analysis, it is necessary first to determine the local meteoric lines. This step is essential in establishing the elevation of fluid recharge in geothermal reservoirs. Finally, the O18 (‰) and D (‰) isotope data for the Seulawah Agam manifestation are presented in Table 2.

3.4. Numerical Approach

3.4.1. Groundwater Flow Simulation

The Seulawah Agam volcano geothermal system was simulated using MODFLOW 6 from the U.S. Geological Survey [26]. The simulation was operated using Flopy, an open-source Pythonpackage for constructing, running, and post-processing groundwater flow (GWF) models [27]. Flopy supports the creation and definition of structured and unstructured grids. In this context, groundwater flow simulation applies Darcy’s law, which is represented by Equation (1) below:
q = K h = K x x 0 0 K z z
where q is the specific discharge vector (m/day), representing fluid flow. The parameter K stands for hydraulic conductivity, which quantifies how easily water moves through a material (m/day). Kxx represents the horizontal hydraulic conductivity, while Kzz represents the vertical hydraulic conductivity. We assume that the hydraulic conductivity is isotropic so that the hydraulic properties of the porous medium are uniform in all directions. The ability of the rock to transmit fluid is considered identical in both the horizontal (x) and vertical (z) directions, so that Kxx is equal to Kzz. The hydraulic conductivity values were determined from petrophysical analysis and align with typical rock permeability values for various lithologies, as classified by the U.S. Bureau of Reclamation (USBR) [28]. The value h stands for the height of water in the system, and ∇h shows how this height changes from place to place. For a small area, Darcy’s Law gives a mathematical equation that shows how the water height is spread out, as shown below:
x K x x h x + z K z z h z + Q s = S s h t
where Q s is the volumetric flux per unit volume representing sources and sinks of water. A negative Qs indicates flow out of the groundwater system, while a positive Qs (Q’) signifies flow into the system (1/day). SS denotes the specific storage of the porous material (1/m), and t is time. The velocity was calculated from the flux per cell area in m/day.
The groundwater flow (GWF) model in MODFLOW 6 provides several packages. The following were applied in this study. The Discretization (DIS) and Time Discretization (TDIS) packages define the spatial grid using layers, rows, columns, and time steps. The Iterative Model Solution (IMS) package solves both linear and nonlinear equations. The Node-Property Flow (NPF) package calculates hydraulic conductance between adjacent cells. It also manages cell wetting and drying and computes groundwater flow across cell boundaries. The recharge (RCH) package simulates recharge to the groundwater system, typically from precipitation that infiltrates and percolates into the aquifer. The Constant Head Boundary (CHD) package assigns fixed head values to cells throughout the simulation period. This package is applied particularly at discharge locations. The model was then extended to transient conditions. This allowed evaluation of temporal variations in groundwater flow driven by changes in recharge and heat distribution. Model outputs, including hydraulic head and cell flow rates, are managed using the Output Control (OC) package.

3.4.2. Semi-Coupling Groundwater Flow–Heat Transfer

The second stage involves an external, one-way groundwater-heat transfer simulation using the Semi-Coupling Groundwater Flow-Heat Transfer equation. Stored parameters from the groundwater flow simulation are then used in the steady-state heat transfer simulation [29]. The steady-state simulation depends on flow velocities in each cell v x and v z and geological properties, based on the following finite difference equation:
K e 2 n ρ w c w v · T = ρ c T t ,   if   T t = 0 ( S t e a d y   s t a t e )
and in 2D:
K e ρ c 2 T x 2 + 2 T z 2 n ρ w c w ρ c v x 2 T x 2 + v z 2 T z 2 = T t
K e ρ c 2 T x 2 + 2 T z 2 n ρ w c w ρ c K x H x T x K z H z T z = T t
where ρ is the density of the material, c is the specific heat capacity of the medium, K e is the thermal conductivity, n is the porosity, ρ w is the density of water, c w is the specific heat capacity of water, v x , v z are the fluid velocity components in the x and z directions, T is the temperature, and t is the time.

3.5. Numerical Simulation Process and Parameters

3.5.1. Gridding System

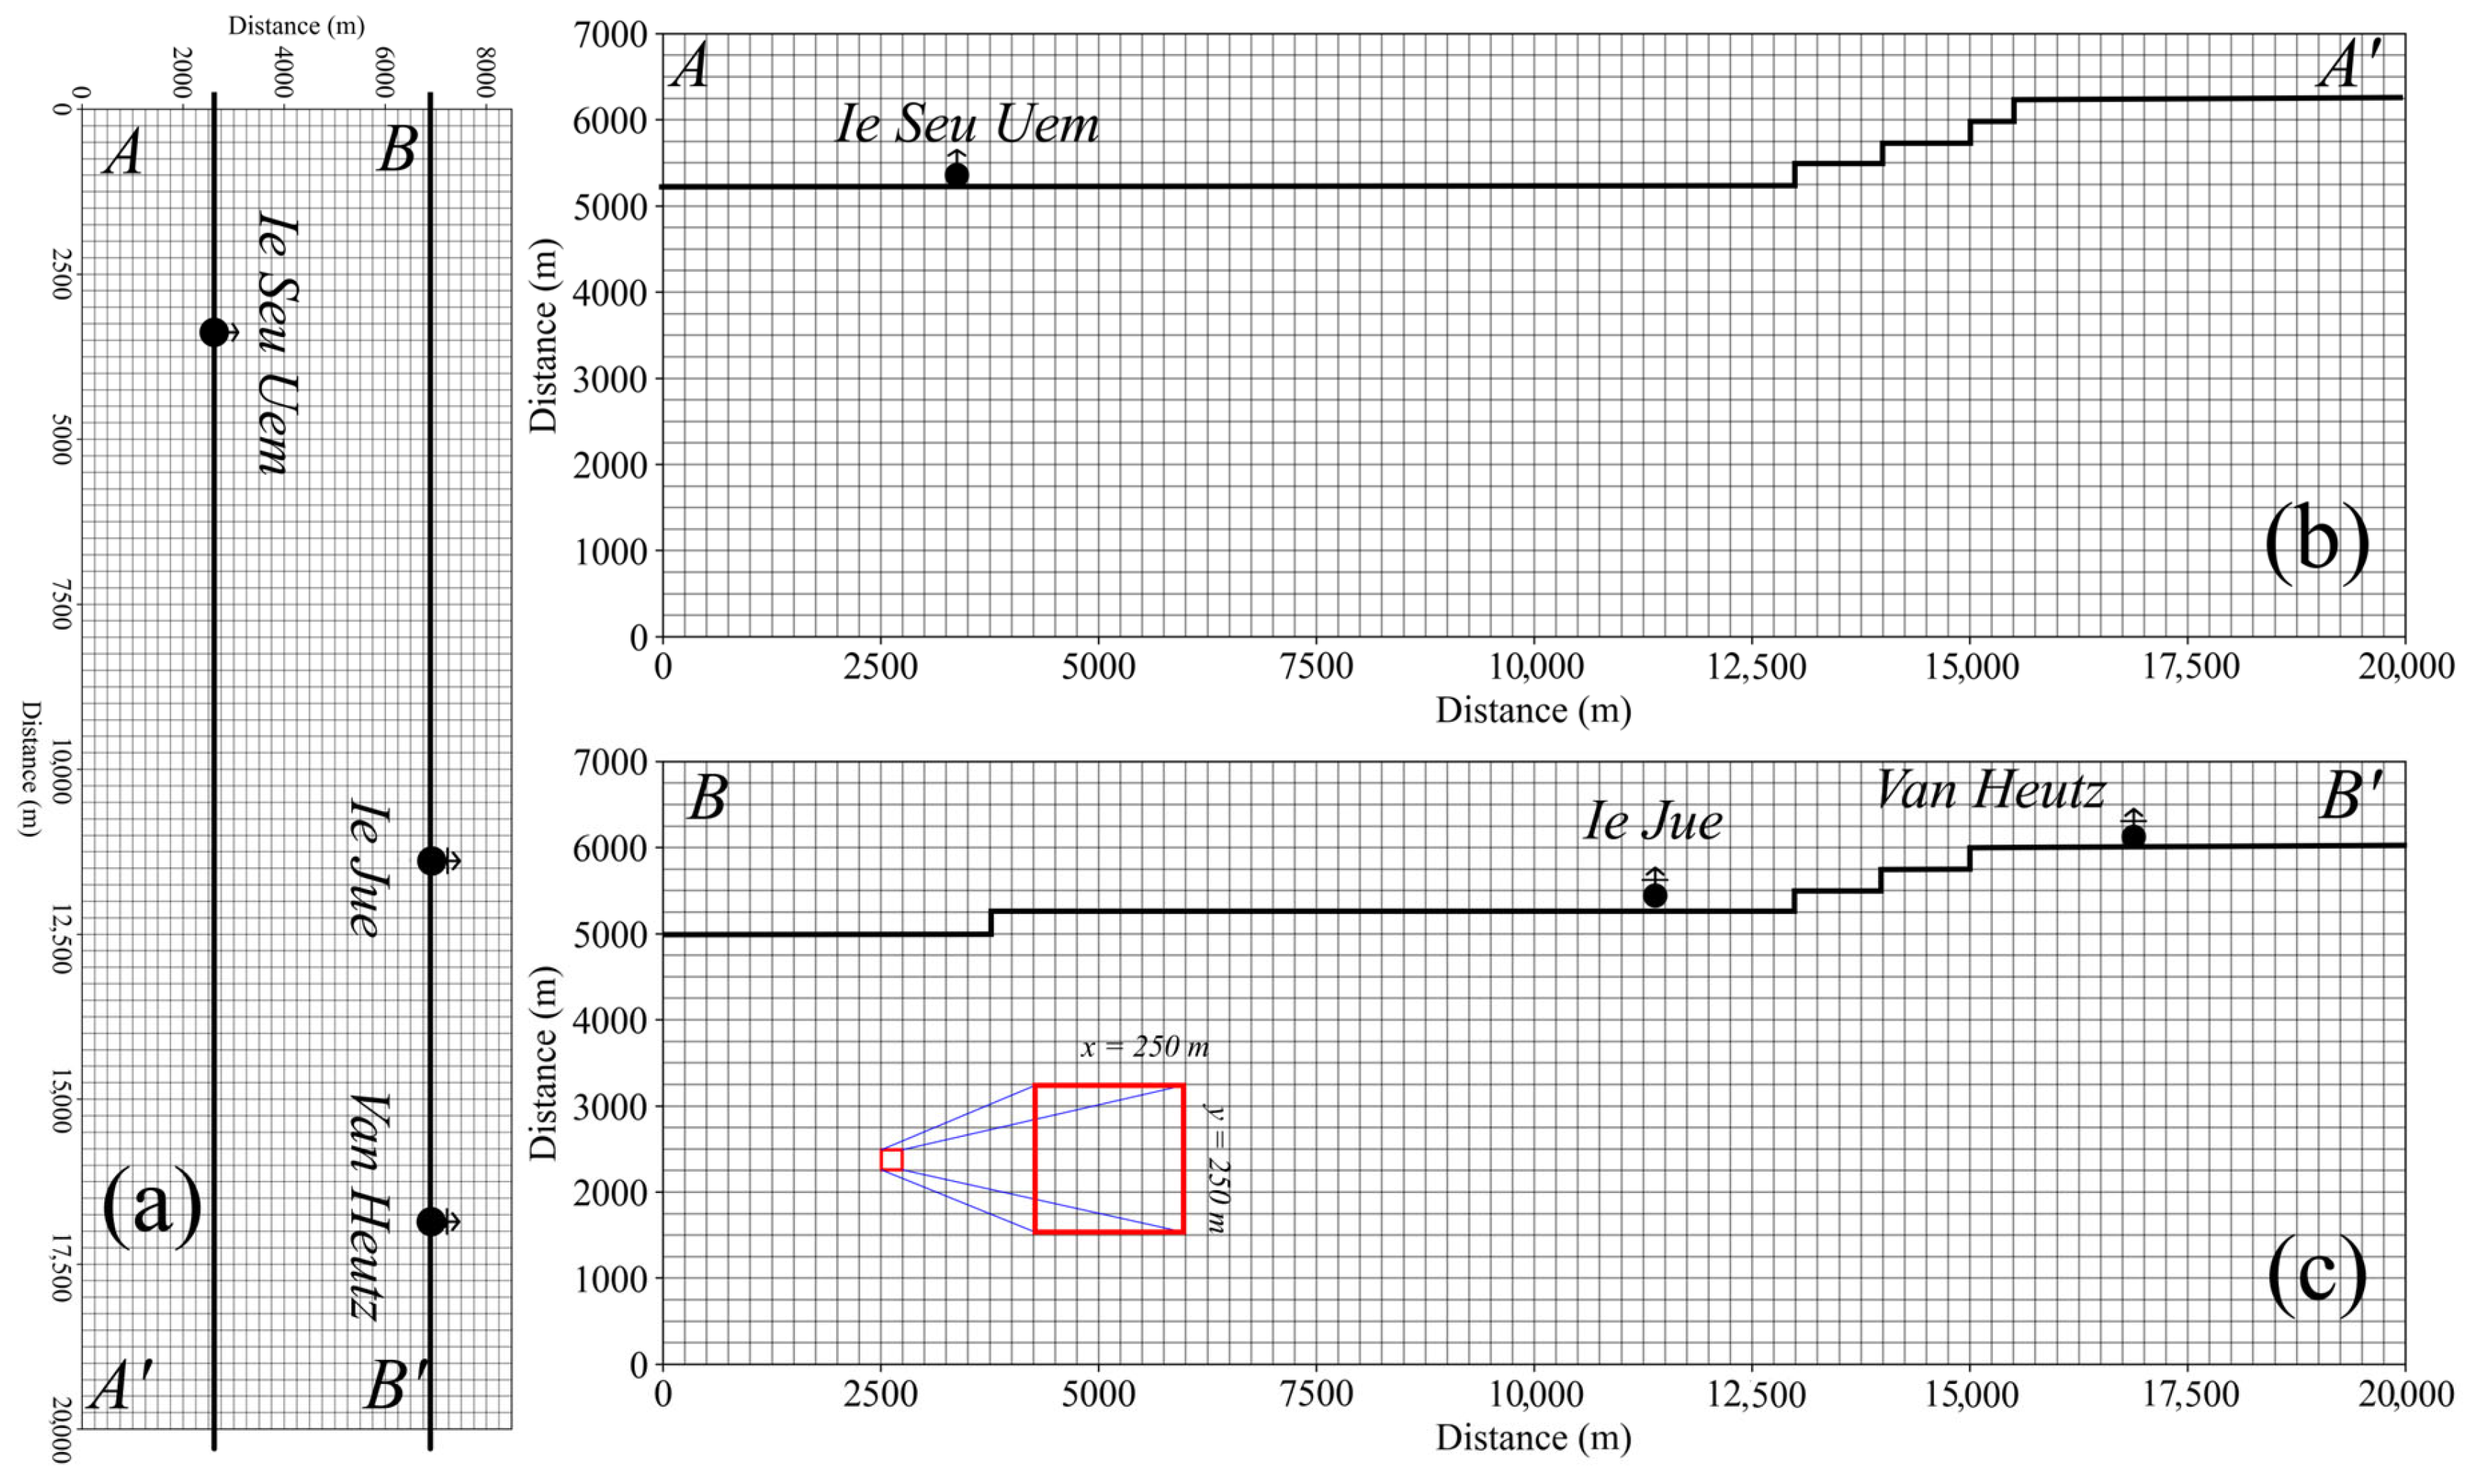
The properties of rock and the applied boundary conditions were defined using geological and geophysical data [21,22]. The boundary conditions were implemented in a structured 2D grid measuring 20 km in length and 7 km in depth. On the surface, the grid consisted of 80 columns and 34 rows, while each cross section comprised 80 columns and 28 rows. Each cell of the grid measured 250 × 250 m2. This grid covered the Seulawah Agam volcano, including the Ie Seum, Ie Jue, and Kawah van Heutsz, Ie Jue, Figure 4 illustrates the computational mesh grid of the numerical modeling.
Cross section A–A’ (Figure 4b) was selected to represent the regional fluid flow system, which extends from the water infiltration location at the Seulawah Agam volcano to Ie Seum over approximately 10–18 km. The regional system is characterized by deeper flow paths that traverse multiple lithological units and result in distinct manifestation types. In contrast, cross section B–B’ (Figure 4c) represents the local fluid flow system, extending from the Seulawah Agam volcano infiltration area toward Kawah van Heutsz (~2 km) and Ie Jue (~9 km). The local system features shallower fluid pathways, limited lithological variation, and distinct, localized manifestations. The distinction between these systems is thus based on the extent, depth, lithologies traversed by the fluids, and characteristics of each manifestation type. Following grid construction, the numerical domain was populated with rock properties according to the geological, geophysical, and geochemical interpretations. Each grid cell was assigned hydraulic conductivity and thermal properties. Distinct property values were applied to the cap rock, reservoir, and heat source layers, while fault zones were represented as high permeability pathways to account for enhanced fluid flow. The rock properties are shown in Table 3.

3.5.2. Simulation Process

The simulation was performed using Flopy, a Python tool for generating MODFLOW 6 programs. The groundwater flow model included recharge as inflow and discharge as outflow, without involving heat distribution [23,24]. Initially, rainwater in the recharge area seeps into the ground and flows underground to the discharge area following the natural hydraulic gradient. As the model assumes steady-state conditions (∂h/∂t = 0), flow does not change over time, and storage elements such as the storage coefficient (Ss) are not actively used.
The simulation determines subsurface flow patterns, hydraulic gradient direction, and cell head values in response to specified recharge and boundary discharge. The resulting flow velocity is then used externally in Python to perform a one-way groundwater–heat transfer simulation, applying the Semi-Coupling Groundwater Flow–Heat Transfer equation. This approach examines how flow velocity affects heat distribution. The main limitation is the lack of two-way coupling, where temperature changes would also affect fluid density and viscosity, thus influencing flow.

4. Results

4.1. Rock Conductivity Model

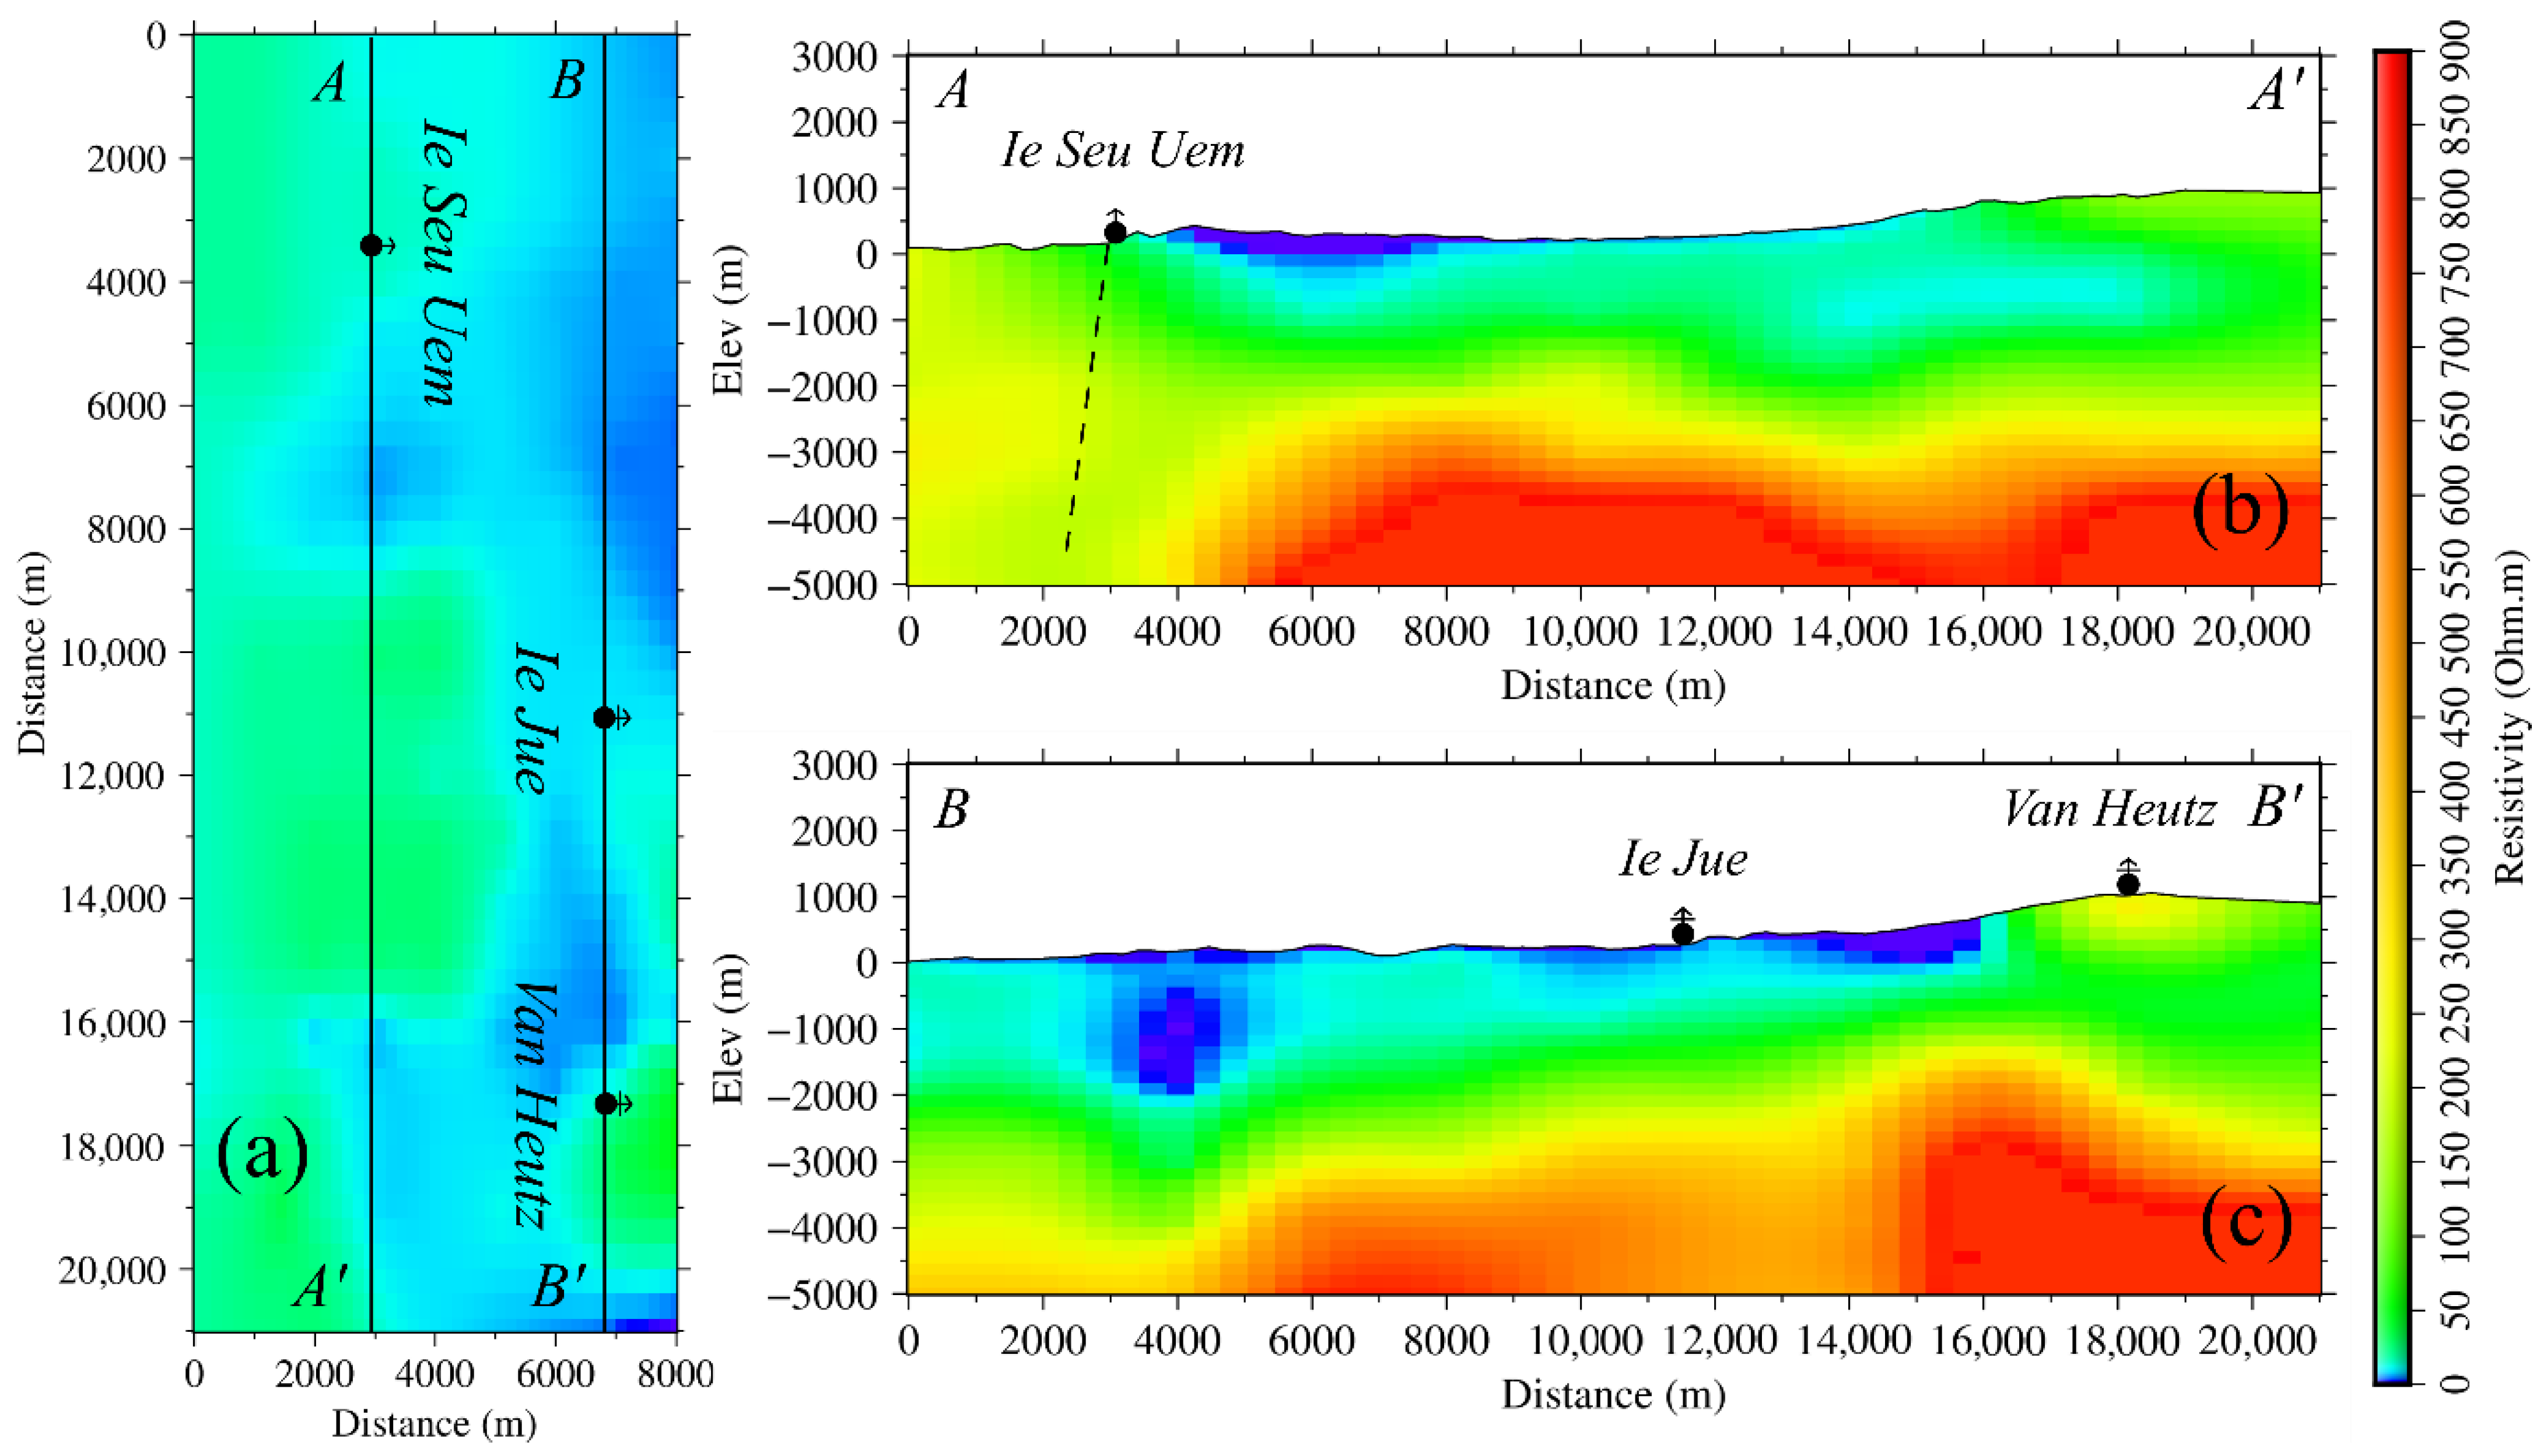
The conceptual model was derived based on the resistivity model inverted from MT data. Figure 5 shows the results of the resistivity models at a depth of 0 m (Figure 5a) and resistivity profiles along A–A’ and B–B’ cross sections. The resistivity value of the first layer, called the surface layer, is less than 20 Ohm.m with a thickness of up to 2 km, which is associated with the Qhlb, Qpal, and Qhlt rock units. These three units contain tuff and clay that bind water, making them conductive. This surface zone is classified as a cap rock zone, where it acts as a low permeability layer and as a barrier to heat distribution to the surface.
Cross sections A–A’ and B–B’ show that the resistivity distribution below the surface zone is a reservoir zone at a depth of between 2.0–2.5 km and a resistivity value of >20 Ohm.m–350 Ohm.m. This zone is identified as Qpjl and Tuktp units, which are rocks that form geothermal reservoirs with moderate to high permeability. The lowest layer with resistivity >350 Ohm.m is identified as a heat source with low permeability.
The A–A’ resistivity profile demonstrates that zones of high conductivity, indicative of fluid-rich rock, are not situated directly beneath the Ie Seum hydrothermal manifestation. Rather, the hydrothermal source appears to be located further southeast, with fluids transported via the Seulimeum fault and discharged at Ie Seum. The B–B’ resistivity profile reveals that shallow high conductivity beneath the Ie Jue manifestation suggests fluid discharge associated with a minor fault system, as also indicated by Marwan et al. [5]. In contrast, the Kawah van Heutsz Crater does not appear to be connected to any major or minor fault, as no high conductivity anomaly is observed beneath the crater. These resistivity data and the inferred fluid discharge system serve as the basis for the initial conceptual model of fluid flow.

4.2. Geochemical Analysis Results

4.2.1. Chemical Composition of Manifestation Fluid

The Ie Seum hot spring, situated at 75 m above sea level, exhibits a dominant chloride (Cl) concentration of 2577 ppm. This chemical profile indicates a fluid facies and suggests that the discharged fluid originates from a regional source with prolonged interaction with subsurface rocks. In contrast, the Ie Jue steaming ground and Kawah van Heutsz fumarole, located at 380 and 750 m, respectively, display dominant sulfate (SO42−) anions, with concentrations of 981 ppm and 3127 ppm. The detection of hydrogen sulfide gas (H2S) further corroborates these geochemical characteristics.
The bromine concentration at Ie Seum is 7.49 ppm, significantly below the 60 ppm threshold, which indicates an absence of influence from marine sediments. The Cl/B ratio of approximately 69 is characteristic of deep fluid sources and is indicative of an outflow zone. The chemical composition of the fluids is detailed in Table 4.
High Na2+/Ca2+ or Na/Mg ratios at Ie Seum (Table 4) indicate minimal dilution by shallow groundwater, suggesting the fluid originates from the reservoir. In contrast, lower ratios at Ie Jue and Kawah van Heutsz (KVH) suggest mixing with shallow groundwater at these sites. Low pH values in KVH fluids result from sulfate ions produced above the water table by the oxidation of H2S gas.
The chemical composition of the fluids shows a significant difference in the concentration of the major anion SO42− at the Ie Jue location. Idroes et al. [10] reported higher sulfate concentrations than those measured in 2007 (see Table 4), though both datasets classify the fluid as sulfate water (Ca2+ SO42−). Variation in SO42− concentrations results from differences in sampling conditions. Idroes et al. [10] collected samples during the rainy season, when groundwater levels were higher. In contrast, the 2007 samples were taken in the dry season and contained more suspended material. These conditions influenced the measured concentrations of dissolved ions. Similar conditions with increased suspended material were observed in 2024 and in the physical fluid measurements of Idroes et al. [10], as evidenced by differences in TDS and pH.
According to Giggenbach et al. [30], the highest measured fluid temperature is 241.9 °C (Table 5). The gas geothermometer method [31], using the CH4/CO2 ratio, indicates a gas temperature of 316.7 °C for the Ie Jue manifestation (Table 5).
The redox potential (Eh) values at Ie Seum and Ie Jue (Table 1) demonstrate positive redox potentials, indicating oxidizing conditions. At Ie Seum, the Total Dissolved Solids (TDSs) and Electrical Conductivity (EC) are 7490 ppm and 7410 µS/cm, respectively, whereas at Ie Jue, the TDS and EC are 272 ppm and 275 µS/cm, respectively. These results suggest that the fluid at Ie Seum originates from a regional recharge source and has experienced extended interaction with surrounding rocks. In contrast, the fluid at Ie Jue is derived from shallow local groundwater with a shorter duration of fluid–rock contact. The pH value at Ie Seum, indicative of a chloride-type groundwater facies, exceeds the pH values observed at Ie Jue and van Heutsz.
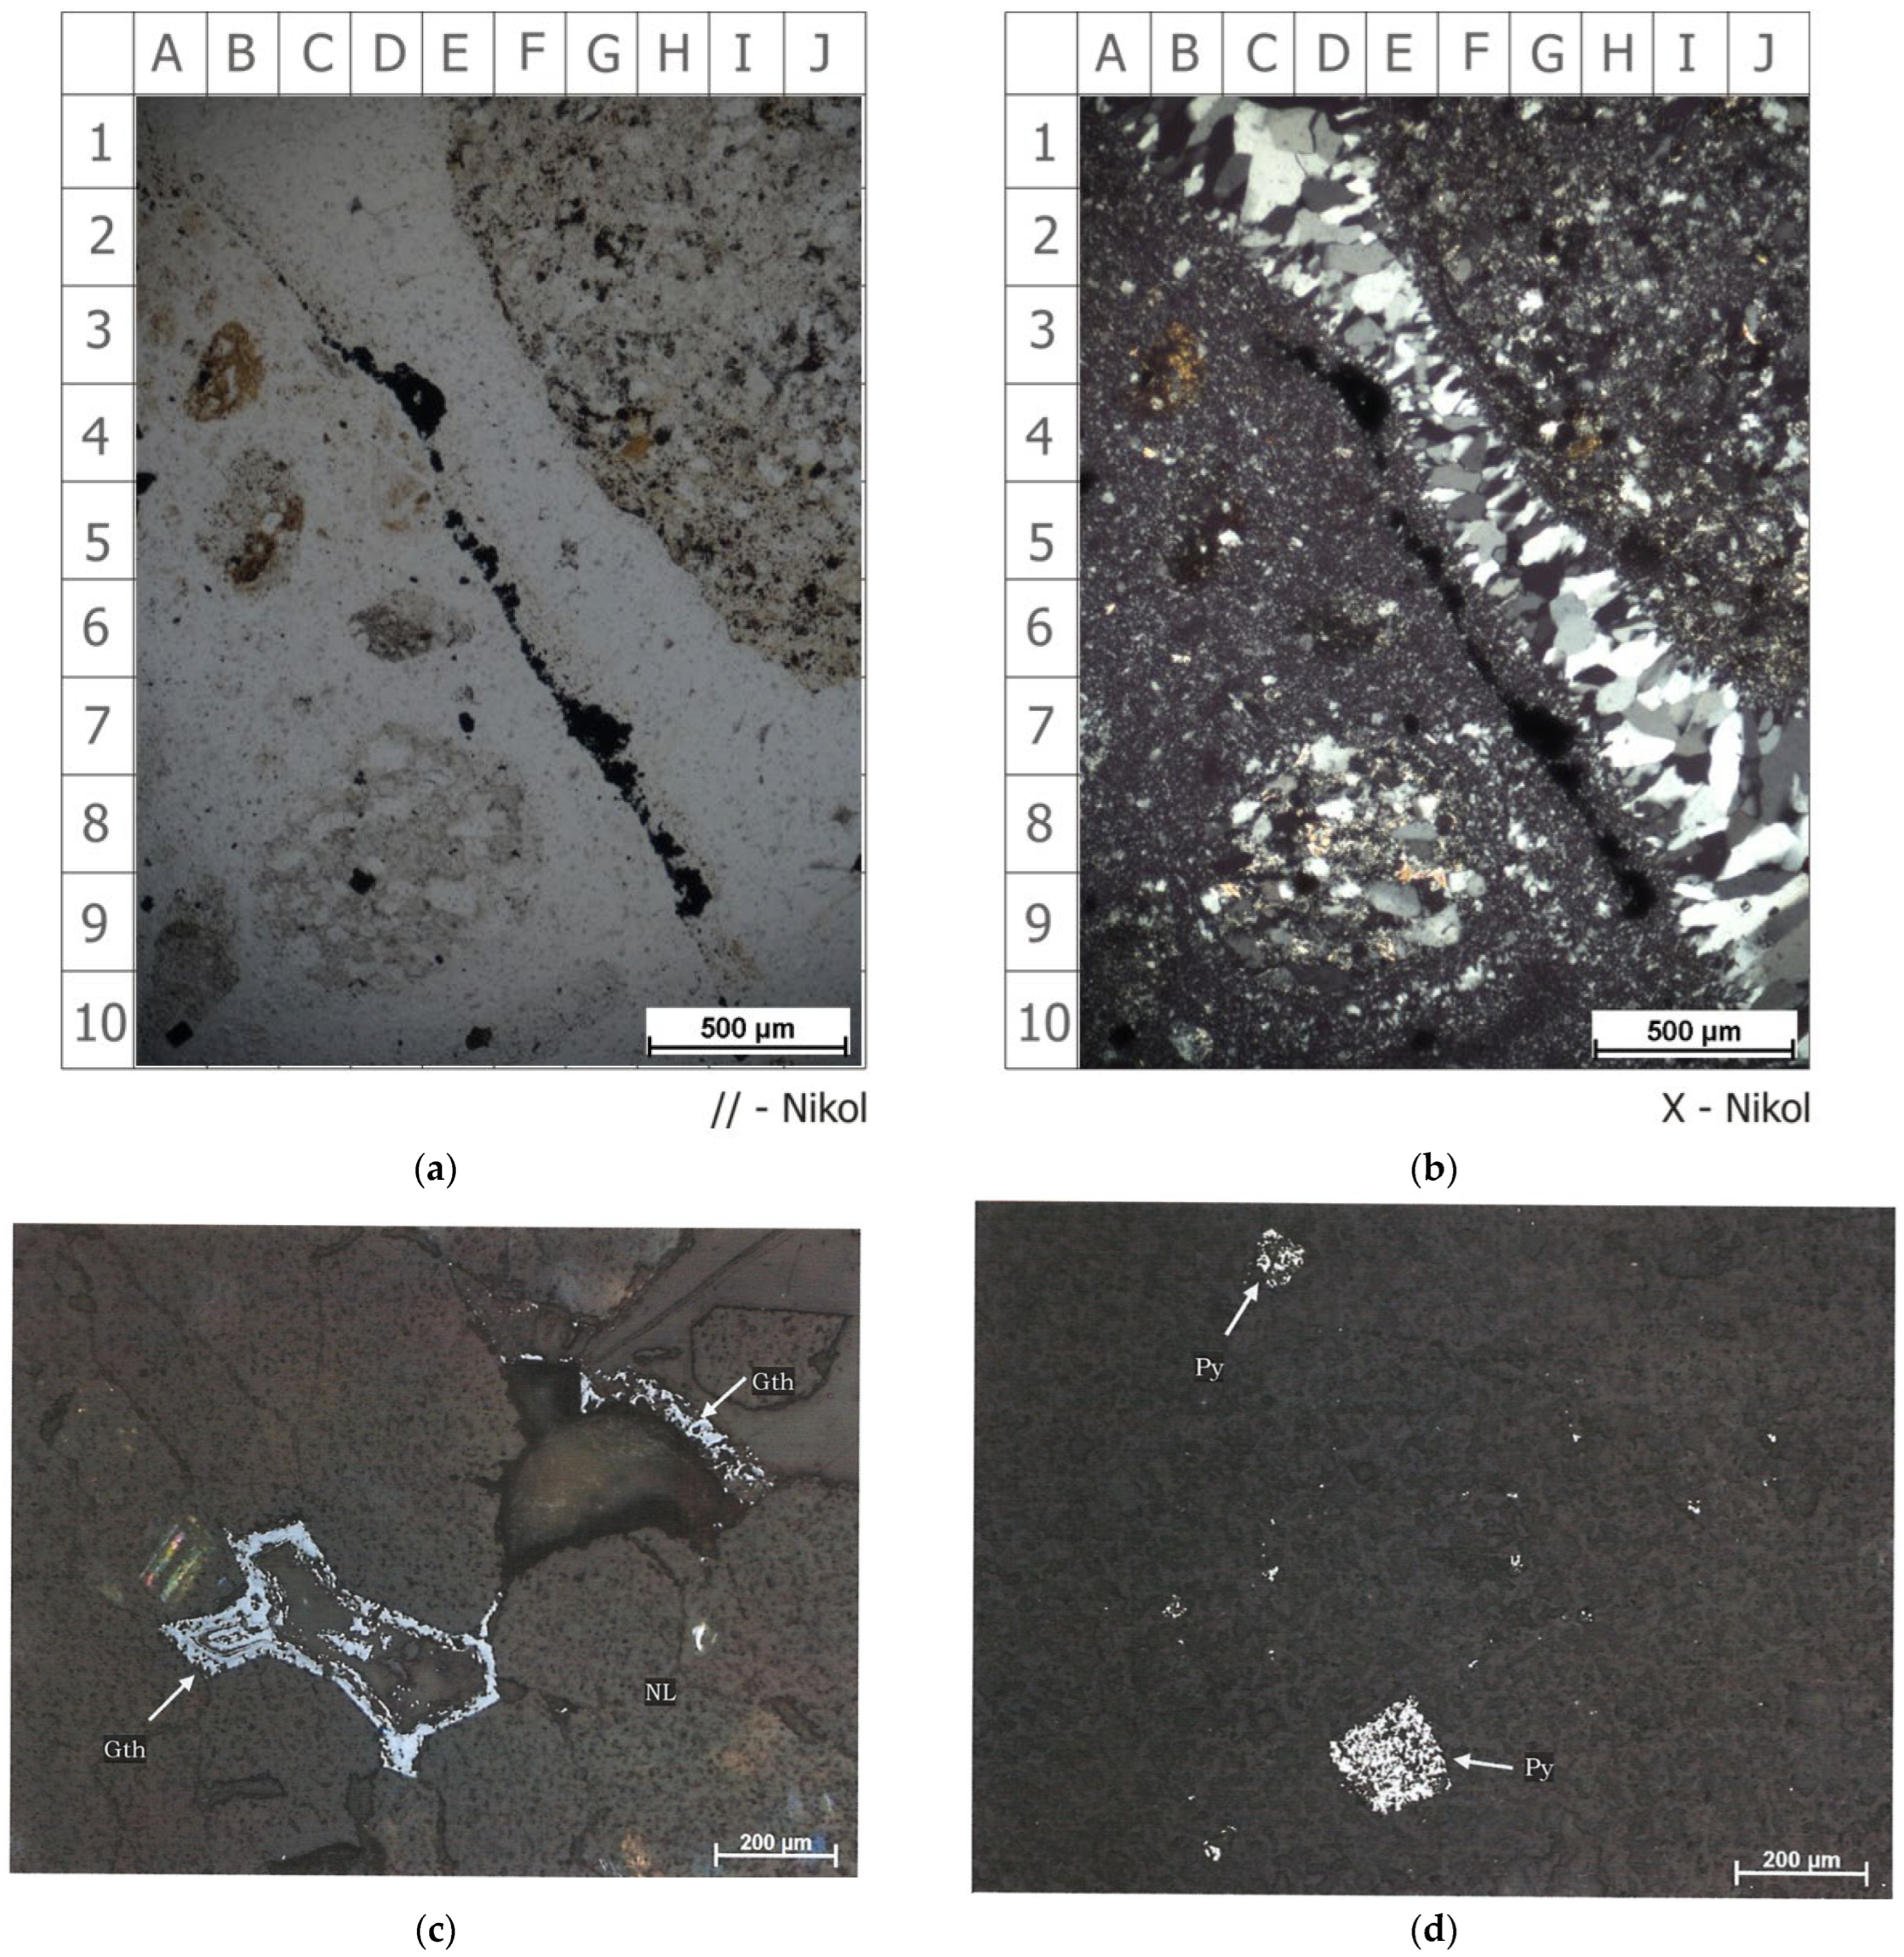
Thin section analysis of the tuff breccia (Figure 6a,b) reveals lithic and crystal fragments embedded within a matrix of clay minerals and fine-grained quartz produced by alteration processes. The rock displays silicification and brecciation, evidenced by abundant secondary quartz in the groundmass that replaces existing fragments and forms fragmentation textures with broader quartz vein boundaries. The sample collected from the Ie Seum hot spring site is identified as a silicified and brecciated tuff breccia belonging to the Qhlb Formation (Figure 6).
The thin section reveals quartz–opaque mineral veins (A1–E1 to I10–J7) intersecting the strongly silicified tuff breccia. Brownish lithic fragments are suspended within a lighter groundmass, attributed to fine silica or quartz (left photo). The tuff breccia (Figure 6a,b) appears deformed by faulting, as evidenced by fragmentation and numerous quartz veins developed along fractures resulting from fault activity. These observations indicate that the Ie Seum fluid likely emerges through a minor fracture associated with the Seulimeum fault.
The results of mineragraphic analysis shown in Figure 6c,d detect the presence of pyrite (FeS2) and goethite (FeO (OH)). Pyrite appears as pale, cream-colored grains with high relief, isotropic optical properties, and grain sizes ranging from 0.01 to 1.3 mm, occurring as single grains with an abundance of less than 0.1%. Goethite appears gray with medium relief, anisotropic properties, and deep brown reflections; it exhibits a colloform texture with grain sizes of 0.02 to 0.6 mm and an abundance of less than 0.1%.
Laboratory analysis indicates that the Ie Seum fluid contains a high concentration of arsenic (As), measured at 5.478 ppm (Table 4). The dissolution and alteration of arsenic-rich minerals, including arsenian pyrite (FeAsxS2−x), may release arsenic into groundwater, which can subsequently result in the precipitation of secondary iron oxide hydroxide minerals such as goethite (FeO (OH)), as illustrated in Figure 6c.
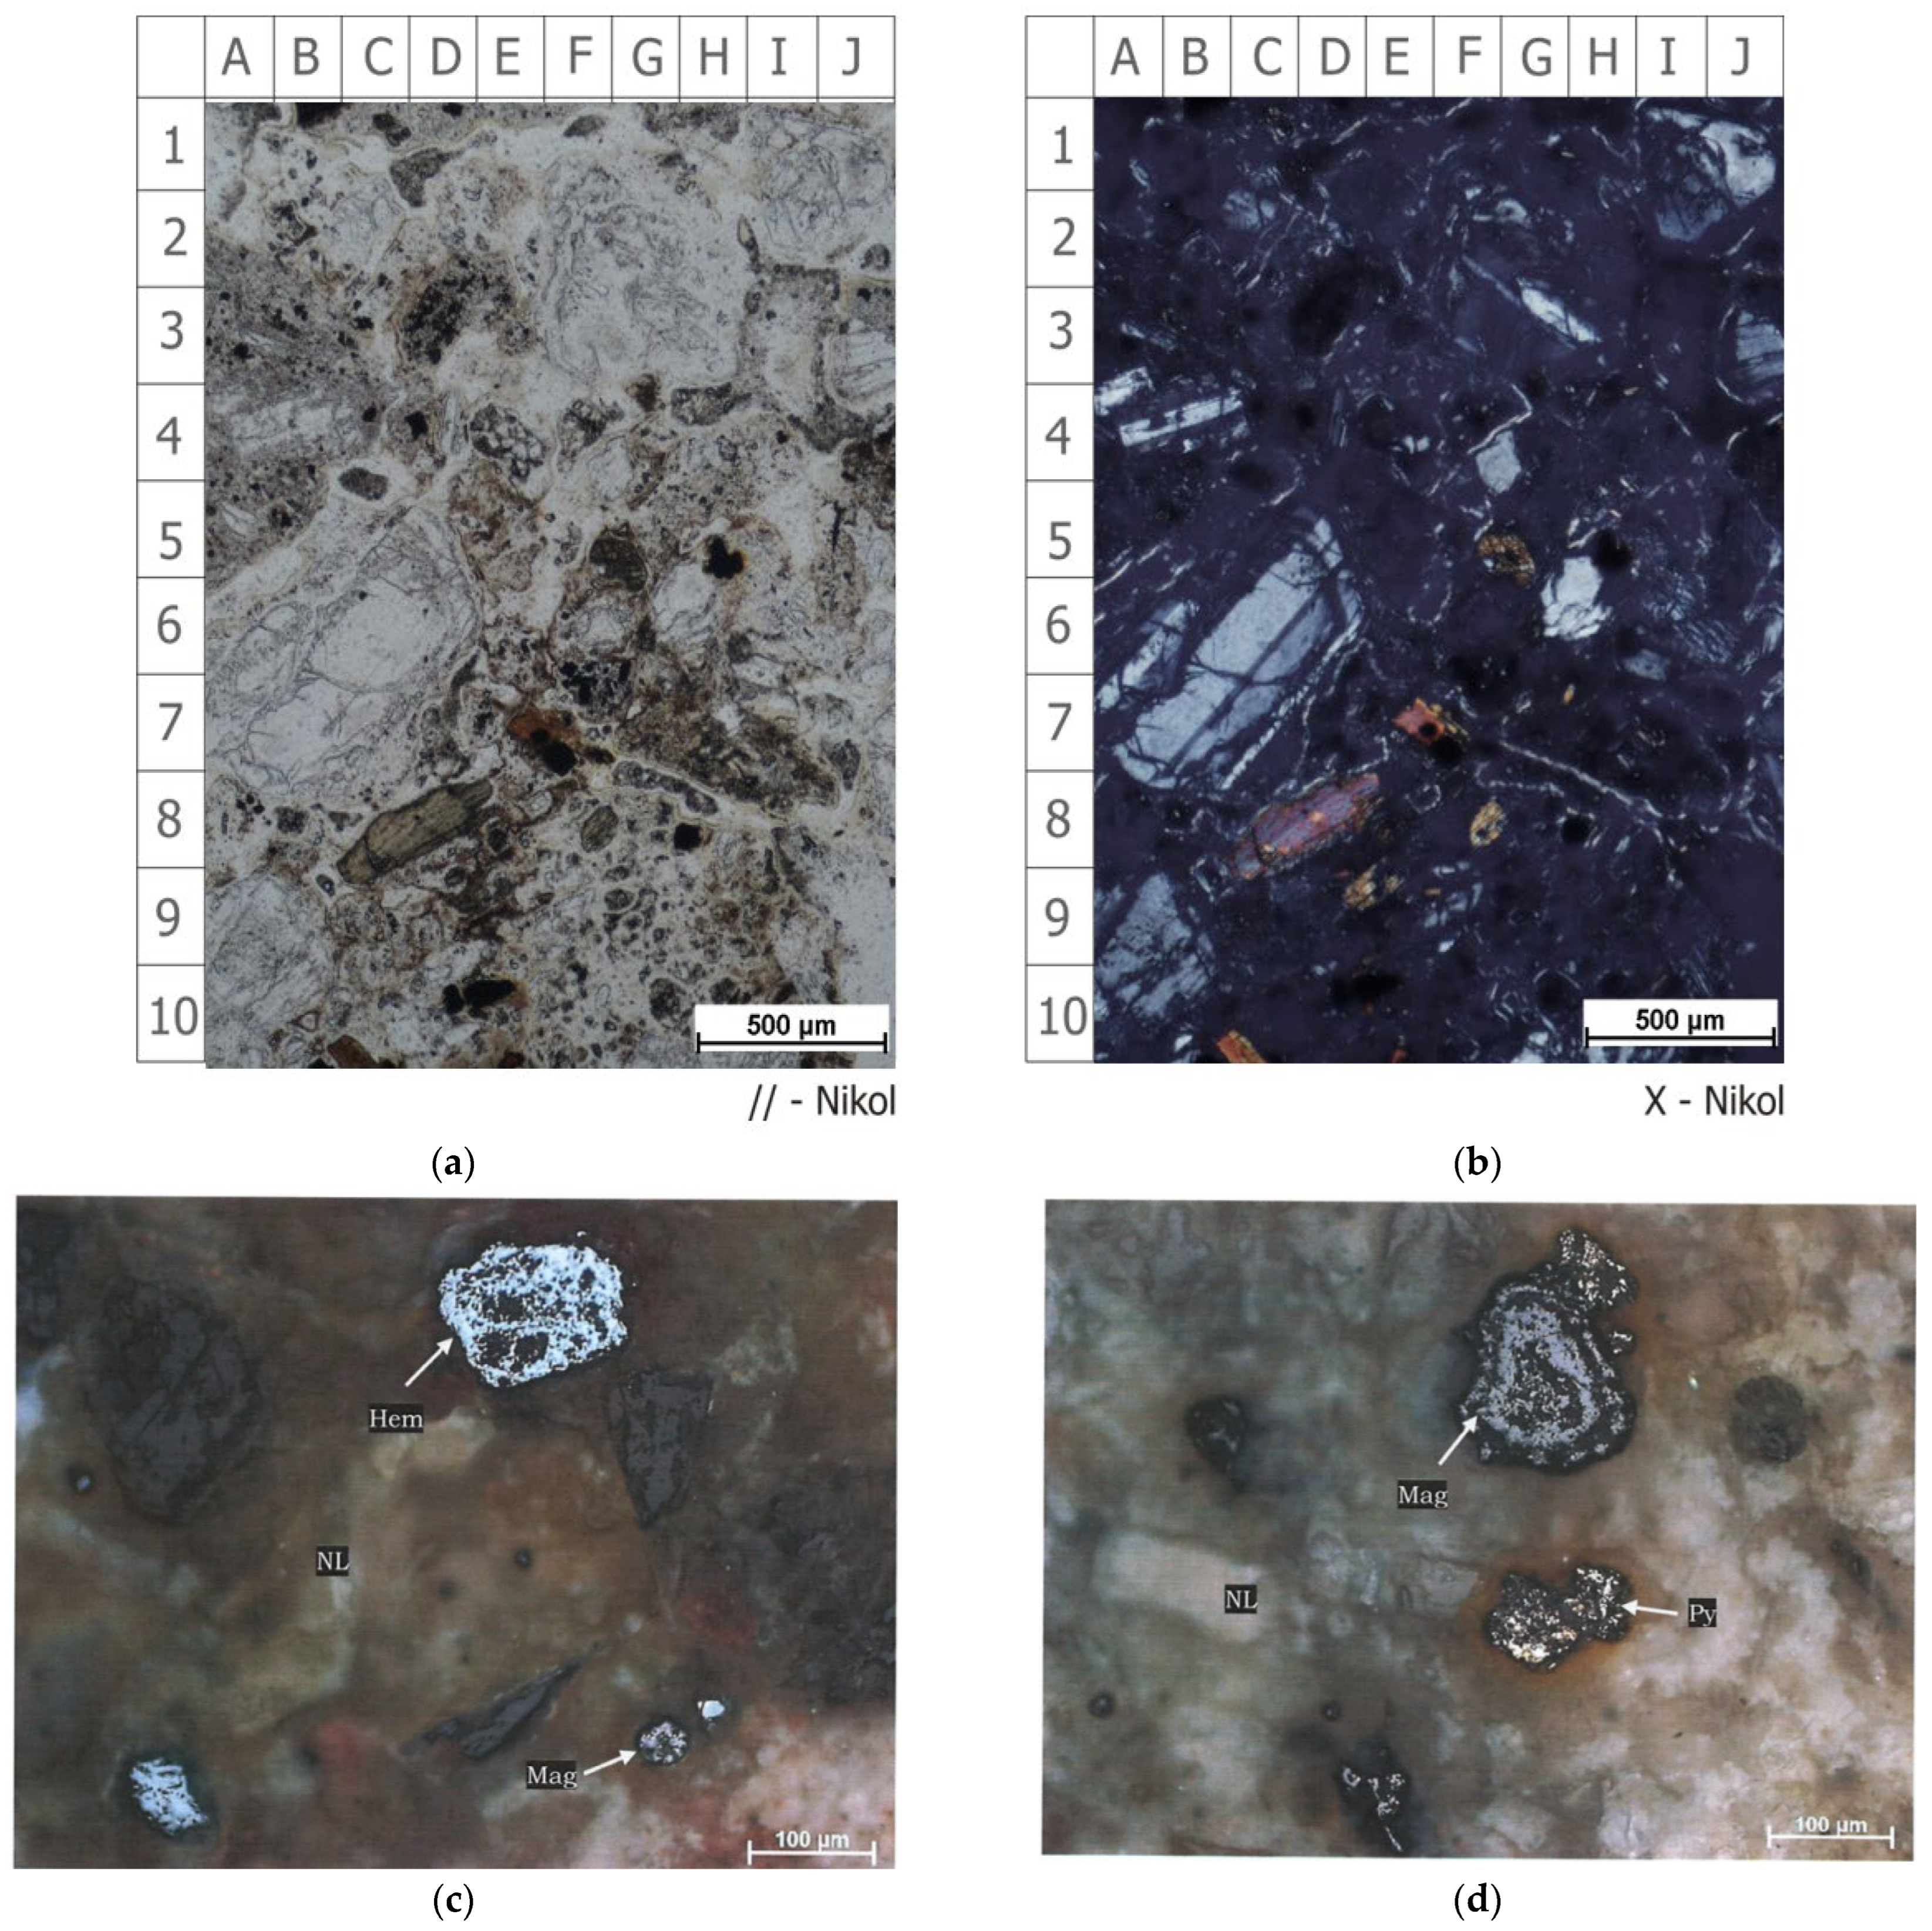
The thin section of the lapilli tuff sample from the Ie Jue region (Figure 7a,b) exhibits a clastic texture. The sample is composed primarily of lithic and crystal fragments embedded within a volcanic matrix or groundmass. Grain sizes range from less than 0.5 mm to 8 mm, corresponding to ash and lapilli size fractions. Lithic fragments are predominant, most of which are volcanic rocks, including andesitic fragments with porphyritic texture (A2–A5; J3–J4; E4–E6; etc.) and possibly tuff fragments (E5; F7–G7; G7–J8; etc.). The majority of lithic fragments have undergone alteration to clay minerals and opaque minerals.
Microscopic analysis of rock sections as shown in Figure 7c,d obtained from the geothermal area shows the presence of metal minerals such as magnetite (Fe3O4), hematite (Fe2O3), and pyrite (FeS2) in minor amounts (<0.1%). Magnetite is present as single grains measuring 0.04–0.35 mm, grayish brown in color with high relief and isotropic properties. Hematite is observed with anisotropic grains of 0.05–0.4 mm, indicated by light gray and reddish color, while the size of pyrite is 0.03–0.07 mm. Secondary minerals such as magnetite, hematite, and pyrite precipitate readily from solution when extensive boiling occurs. Accordingly, magnetite, hematite, and pyrite in hydrothermally altered rocks are indicative of extensive boiling [32].

4.2.2. Recharge Area Elevation Based on Isotope Data

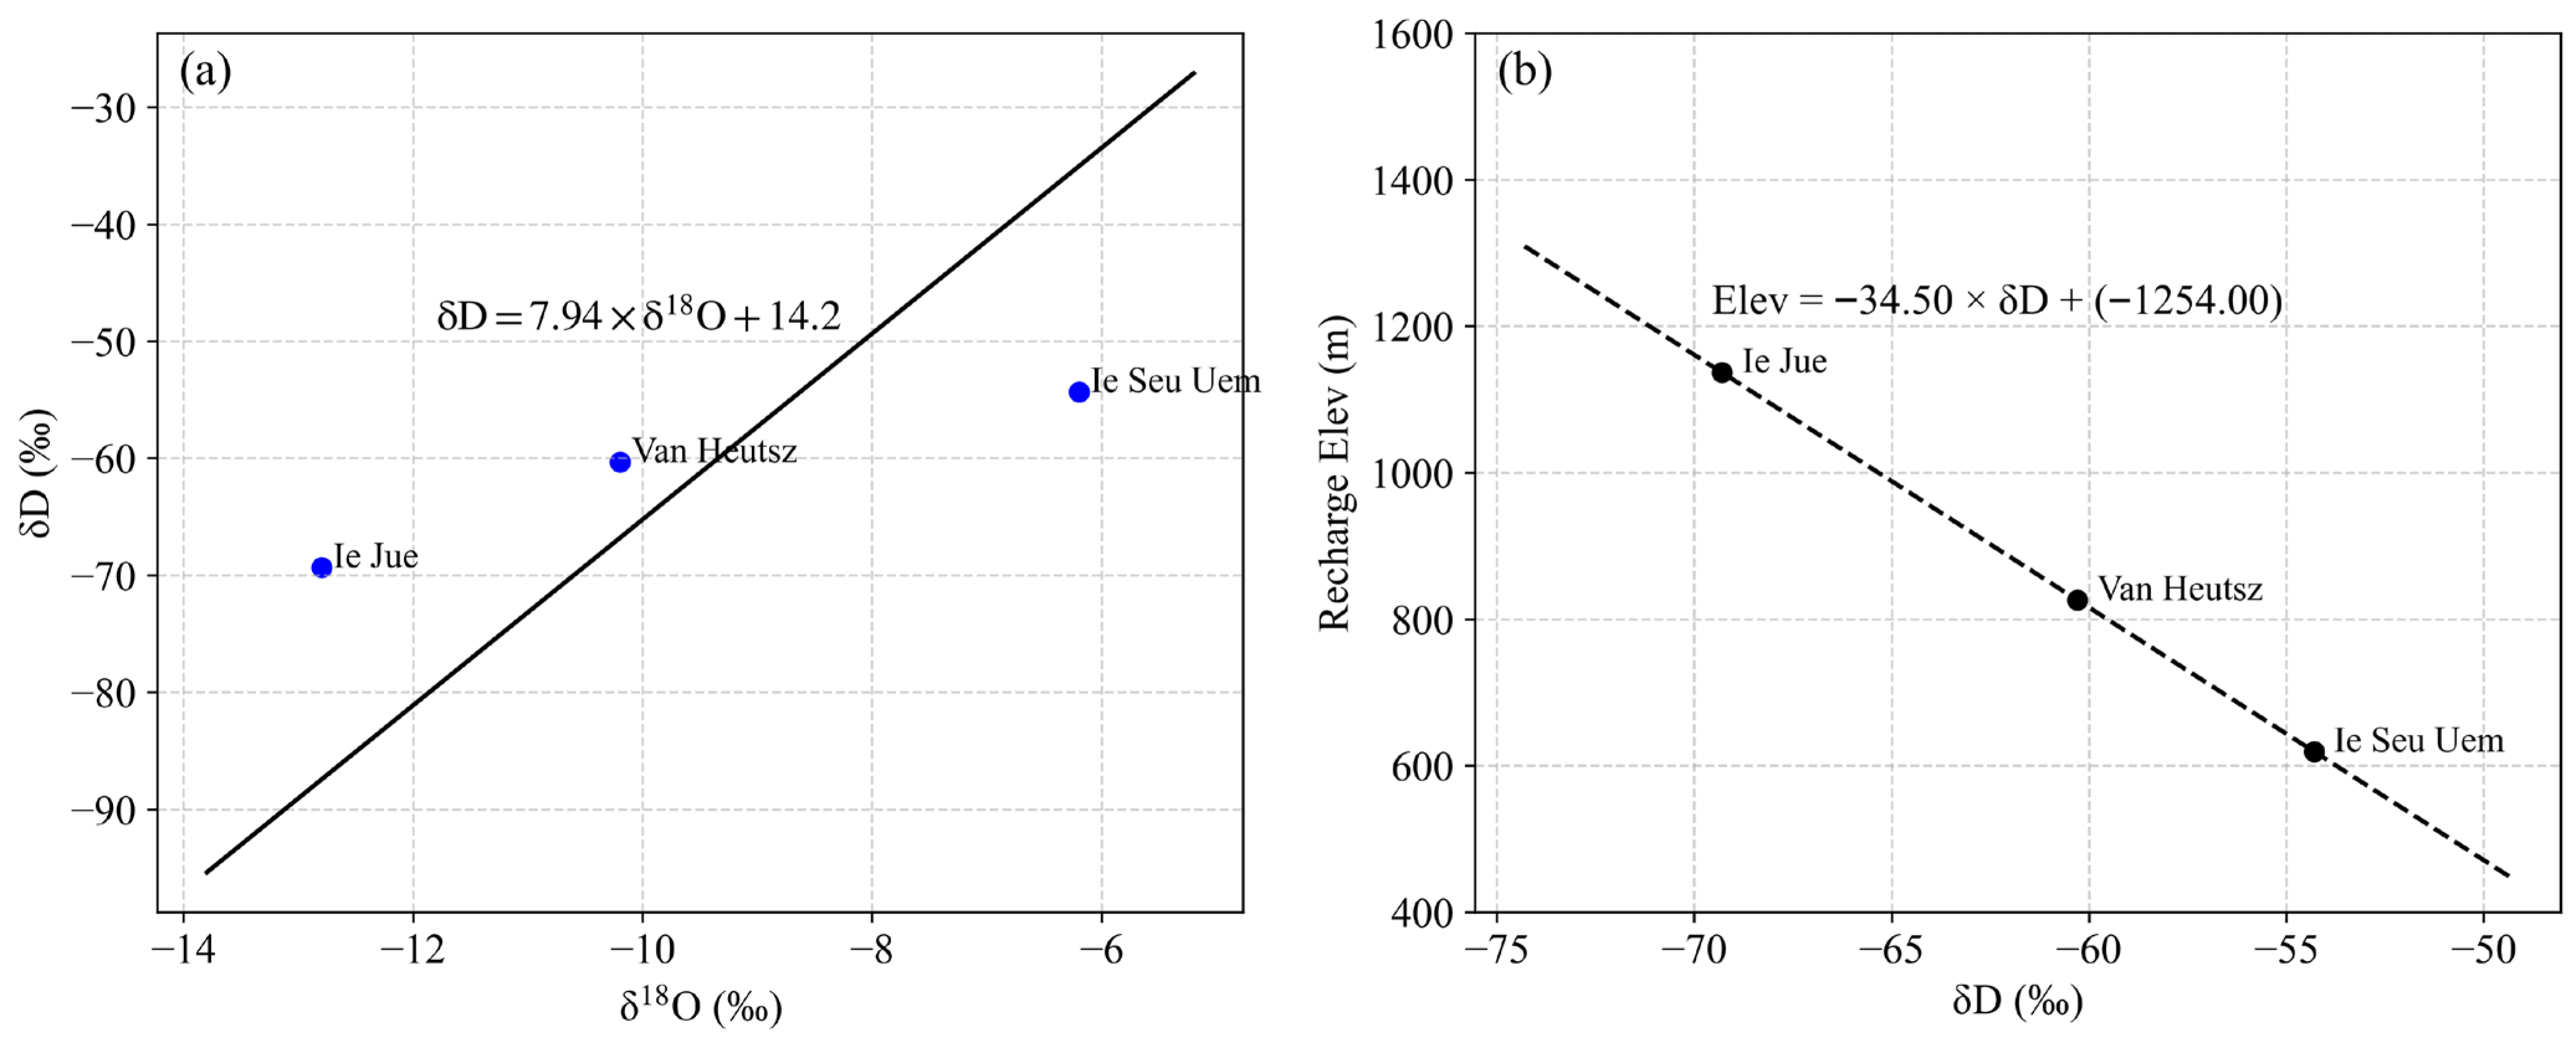
The correlations of isotopic composition and hydrological processes occurring in the Seulawah geothermal area are shown in Figure 8.
The O18 and D isotope composition of the Ie Seum hot spring deviates horizontally from the meteorite line, and its slope is close to 0 (Figure 8). This isotopic composition indicates that the Ie Seum hot spring originates from deep fluids with an O18 shift of 2.5‰. This value reflects the occurrence of water-rock interaction at high temperatures and is also caused by fluid circulation over relatively long distances. The manifestations of Ie Jue and Kawah van Heutsz are close to the meteoric line, indicating that the hot springs are not deep fluids and have been mixed with groundwater and surface water. Using the Seulawah Agam volcano dataset provided by Pertamina, isotope data from hot and cold spring locations were analyzed with reference to the previously established local meteoric water line, as shown in Equation (6):
δ D = 7.94   δ O 18 + 14.2
and the equation for the elevation of Seulawah Agam recharge is shown in Equation (7):
H   =   34.5   δ D   1254
with elevation H in meters. This local meteorite line is a recharge point for deuterium (D) and oxygen (O18) isotope compositions from various altitudes. The isotope depletion of δD = −1.84‰ occurs for every 100 m increase in altitude.
Geothermal fluid at the Ie Seum site is discharged at an elevation of 75 m, while the regional meteoric water source (recharge zone) originates from a higher elevation of more than 600 m (Table 6). This confirms the existence of underground water flow from high to low areas. At the Ie Jue site, the discharge elevation is 380 m, while the recharge elevation reaches 1136.85 m. Meanwhile, at Kawah van Heutsz, hot fluids emerge at an elevation of 750 m with a recharge zone estimated to be around 826.35 m. The relatively close elevation distance indicates the existence of a local hydrogeological system. At Ie Jue, the fluid source originates from the high topography around the volcano’s summit, which allows meteoric water to penetrate deeper through highly permeable fault zones. In contrast, Kawah van Heutsz most likely receives fluid supply from a more local system, with infiltration at lower elevations along local fault lines.

5. Discussion

5.1. The New Conceptual Model of the Seulawah Agam Geothermal System

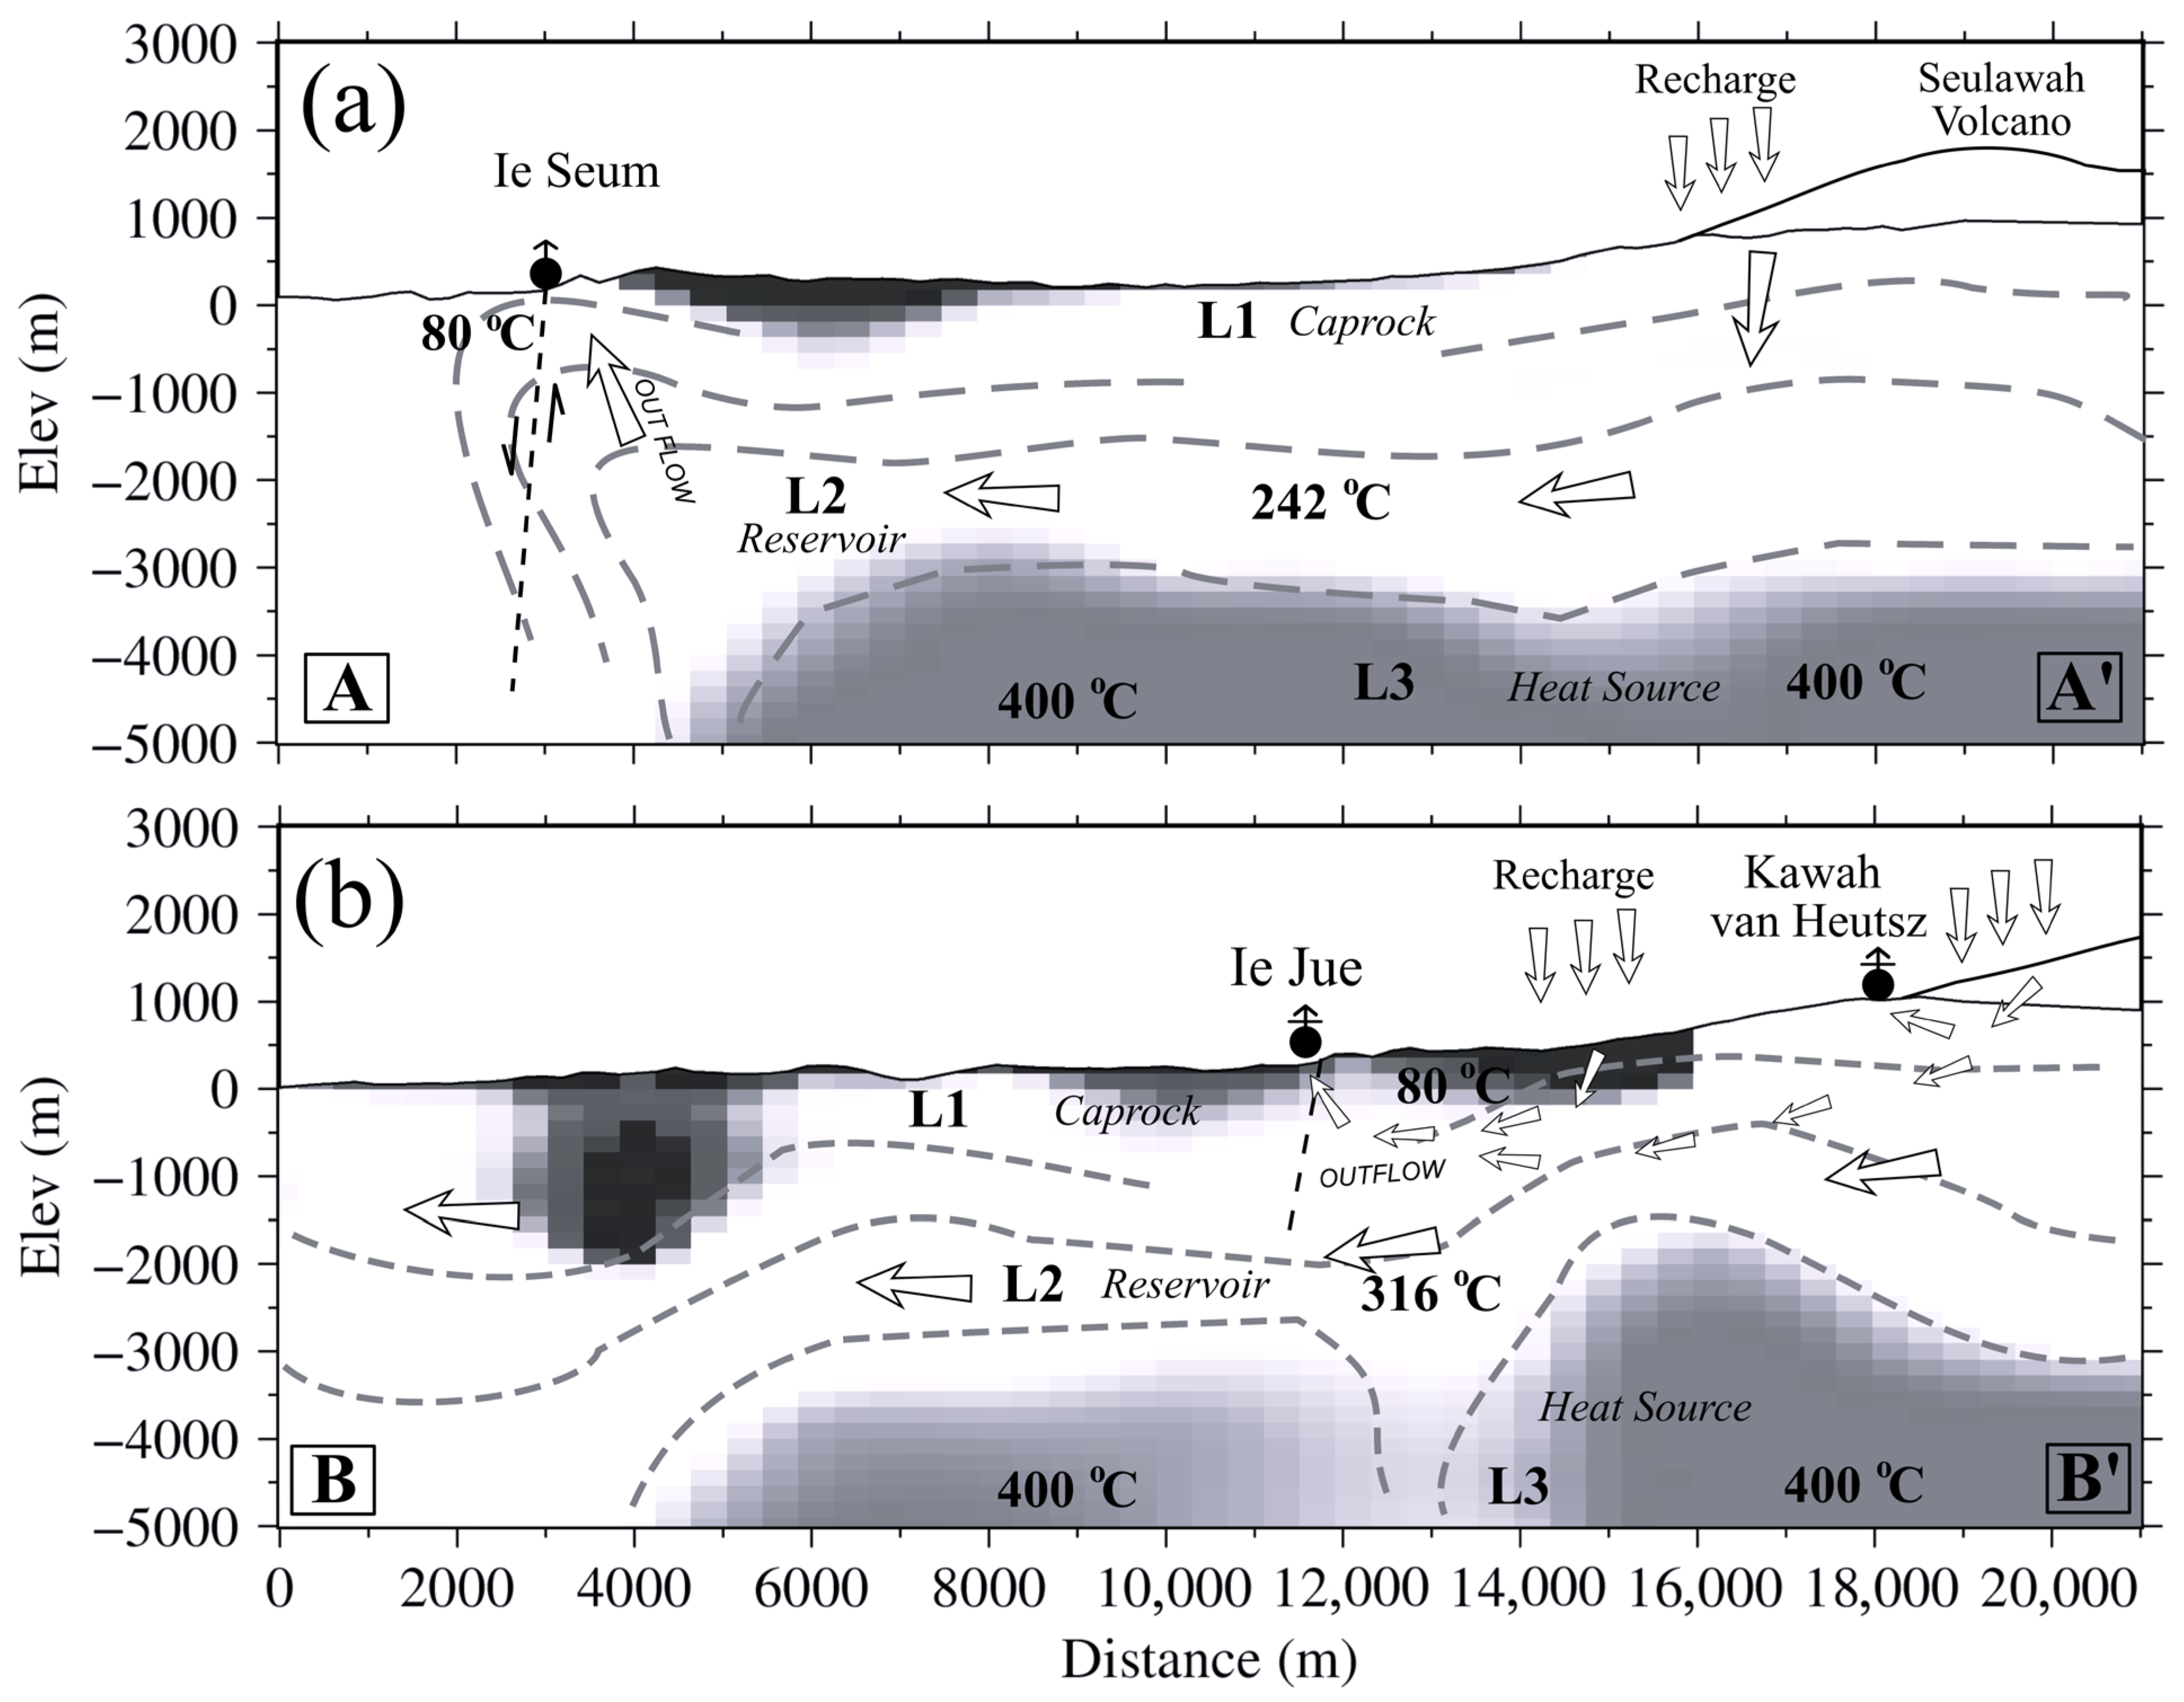
Figure 9 shows the new conceptual model of the Seulawah geothermal system along Profile A–A’ (covering the Ie Seum manifestation) and B–B’ (including the Ie Jue and Kawah van Huetsz manifestations) cros sections. The model is novel as it has considered tectonics and lithology, the resistivity data, and geochemical and isotopic data. The structure beneath both cross sections consists of three layers of models divided into L1, representing the low permeability cap rock; L2, indicating the reservoir layer; and L3, corresponding to the heat source.
In the Ie Seum region (Figure 9a, Profile A–A’), a low-permeability cap rock overlies the reservoir and restricts upward fluid movement. However, fluid ascends to the surface through the Seulimeum fault, resulting in the Ie Seum hydrothermal manifestation, which is characterized by a very low resistivity zone. The cap rock layer is composed of Lamteuba dacitic-andesitic tuff, tuffaceous sandstone, and Tanoh Cempaga hornblende dacite lava. The Ie Seum reservoir (L2 layer) lies at a depth of 1.0–3.0 km, with temperatures ranging from 120 to 242 °C, also noted by Idroes et al. [10]. The heat source (L3 layer) is not directly beneath the Ie Seum manifestation but is located further southeast at about 3.0 km depth, with an estimated temperature of 400 °C.
The Ie Jue and Kawah van Heutsz geothermal systems (Figure 9b, Profile B–B’) differ slightly from Ie Seum. Their reservoir layers are found at depths of 0.8 to 2.5 km, with temperatures up to 316 °C. We propose that a minor fault influences fluid flow in the Ie Jue system, as noted by Marwan et al. [5]. In contrast, the Kawah van Heutsz system is characterized by a fumarole and shows no evidence of a minor fault. The heat source for Ie Jue is at a depth of 3 km, while for Kawah van Heutsz it is shallower at 0.8 km, with a temperature of 400 °C.
Marwan et al. [5] imaged the geothermal system’s layering without estimating layer temperatures, while Idroes et al. [10] estimated temperatures without imaging reservoir layers. Our new conceptual model integrates both resistivity and geochemical data to provide both layer structure and temperature estimates. We also determined the heat source depth and temperature, which previous studies did not address, and refined the location and geometry of the fault system beneath the Ie Seum and Ie Jue manifestations.

5.2. Groundwater Flow Pattern and Heat Transfer Mechanisms

Numerical modeling was employed to evaluate groundwater flow and heat transfer within the Seulawah Agam geothermal system using boundary conditions derived from the conceptual model. The two-dimensional simulations incorporate a combination of measured and estimated geophysical, geological, and geochemical data, allowing assessment of the dominant hydrothermal circulation patterns under realistic subsurface conditions. A uniform average recharge rate of 0.0083 m/day was applied across all modeled scenarios to isolate the influence of geological structure and permeability contrasts on fluid flow and thermal distribution. The modeling results indicate that, despite identical recharge conditions, variations in subsurface properties lead to distinct groundwater flow regimes and heat transfer behavior, highlighting the primary control of geological heterogeneity over hydrothermal circulation within the system.
The Seulawah geothermal conceptual model distinguishes two dominant groundwater flow regimes: a deep regional flow system associated with the Ie Seum site (Figure 9a) and shallow intermediate-local flow systems developed in the Ie Jue and Kawah van Heutsz sites (Figure 9b). The regional system is characterized by long flow paths (~10–18 km), deep circulation, and gradual heating, whereas the intermediate-local systems exhibit shorter circulation paths (3–7 km) and structurally controlled, rapid upflow. The conceptual model shows that the geothermal fluid moves from southeast to northwest through the major Seulimeum fault.
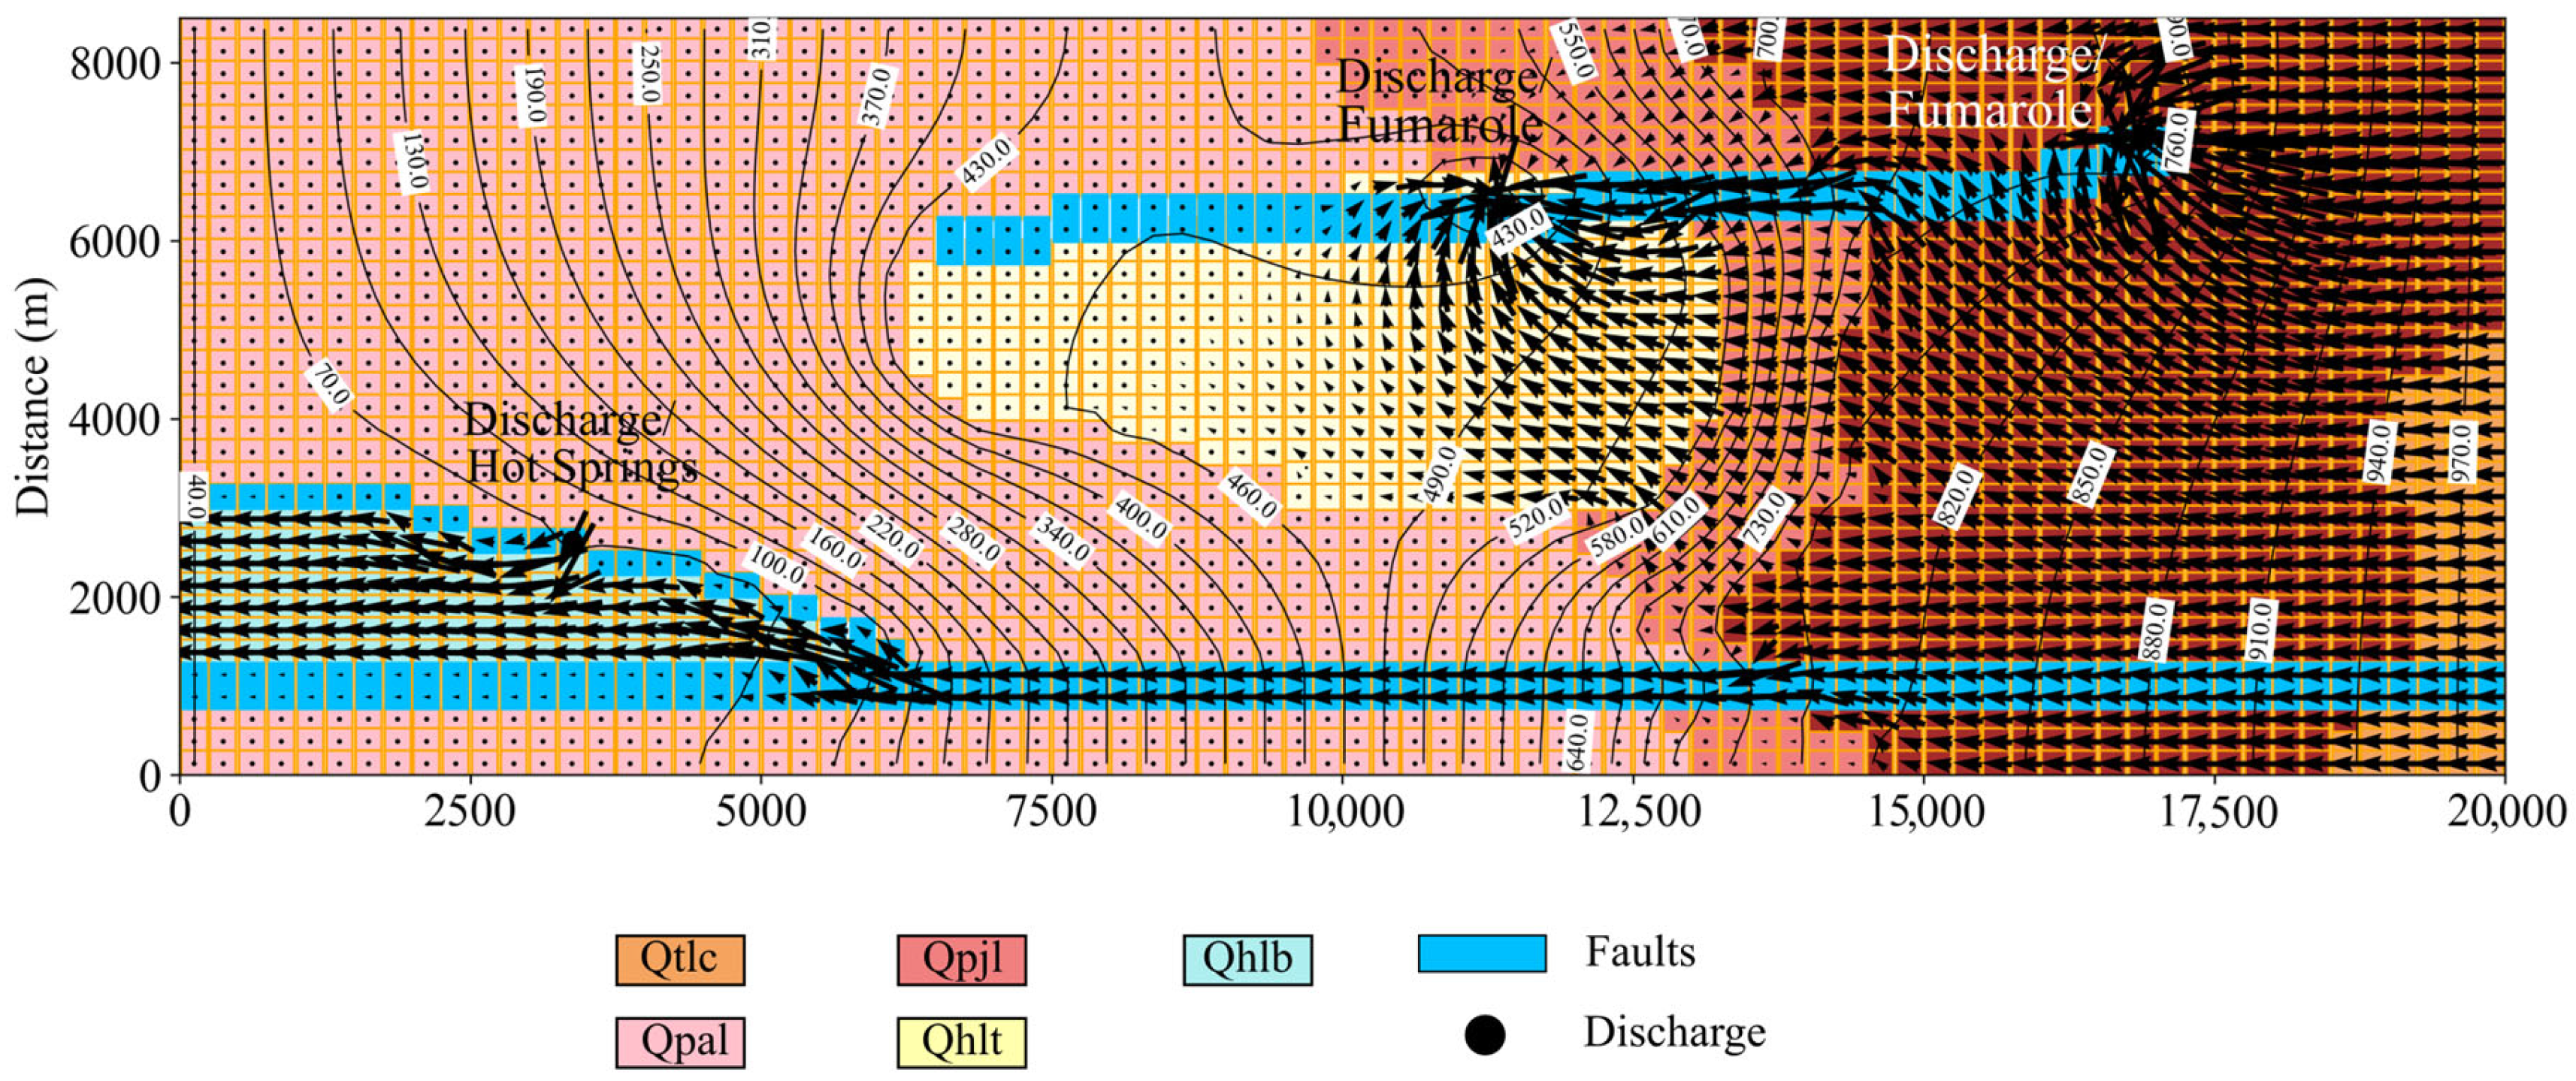
In this numerical model, groundwater flow is not affected by thermal effects (Figure 10) and is primarily controlled by hydraulic head gradients and variations in hydraulic conductivity. Water from the recharge area, located at distances of 15,000 to 20,000 m from the origin of the gridding system (see Figure 10), infiltrates downward and emerges in discharge zones. In this model, no surface heat gradient is calculated because the surface temperature is set equal to the ambient air temperature (~25 °C). Elevated temperatures are assigned only at geothermal manifestation sites.
Surface water migrates following the topographic gradient and geological structure of the Seulawah Agam volcano region, as indicated by black arrows in Figure 10. Modeled fluid flow originates in recharge areas and is channeled along fault zones toward discharge areas at the Ie Seum, Ie Jue, and Kawah van Heutsz geothermal sites. Fluids move along the Seulimeum fault and related minor faults, while low-permeability zones act as hydraulic barriers, restricting fluid movement. Lateral variations in hydraulic conductivity along the Seulimeum and minor fault zones, as well as lithological boundaries, result in changes in flow direction and intensity.
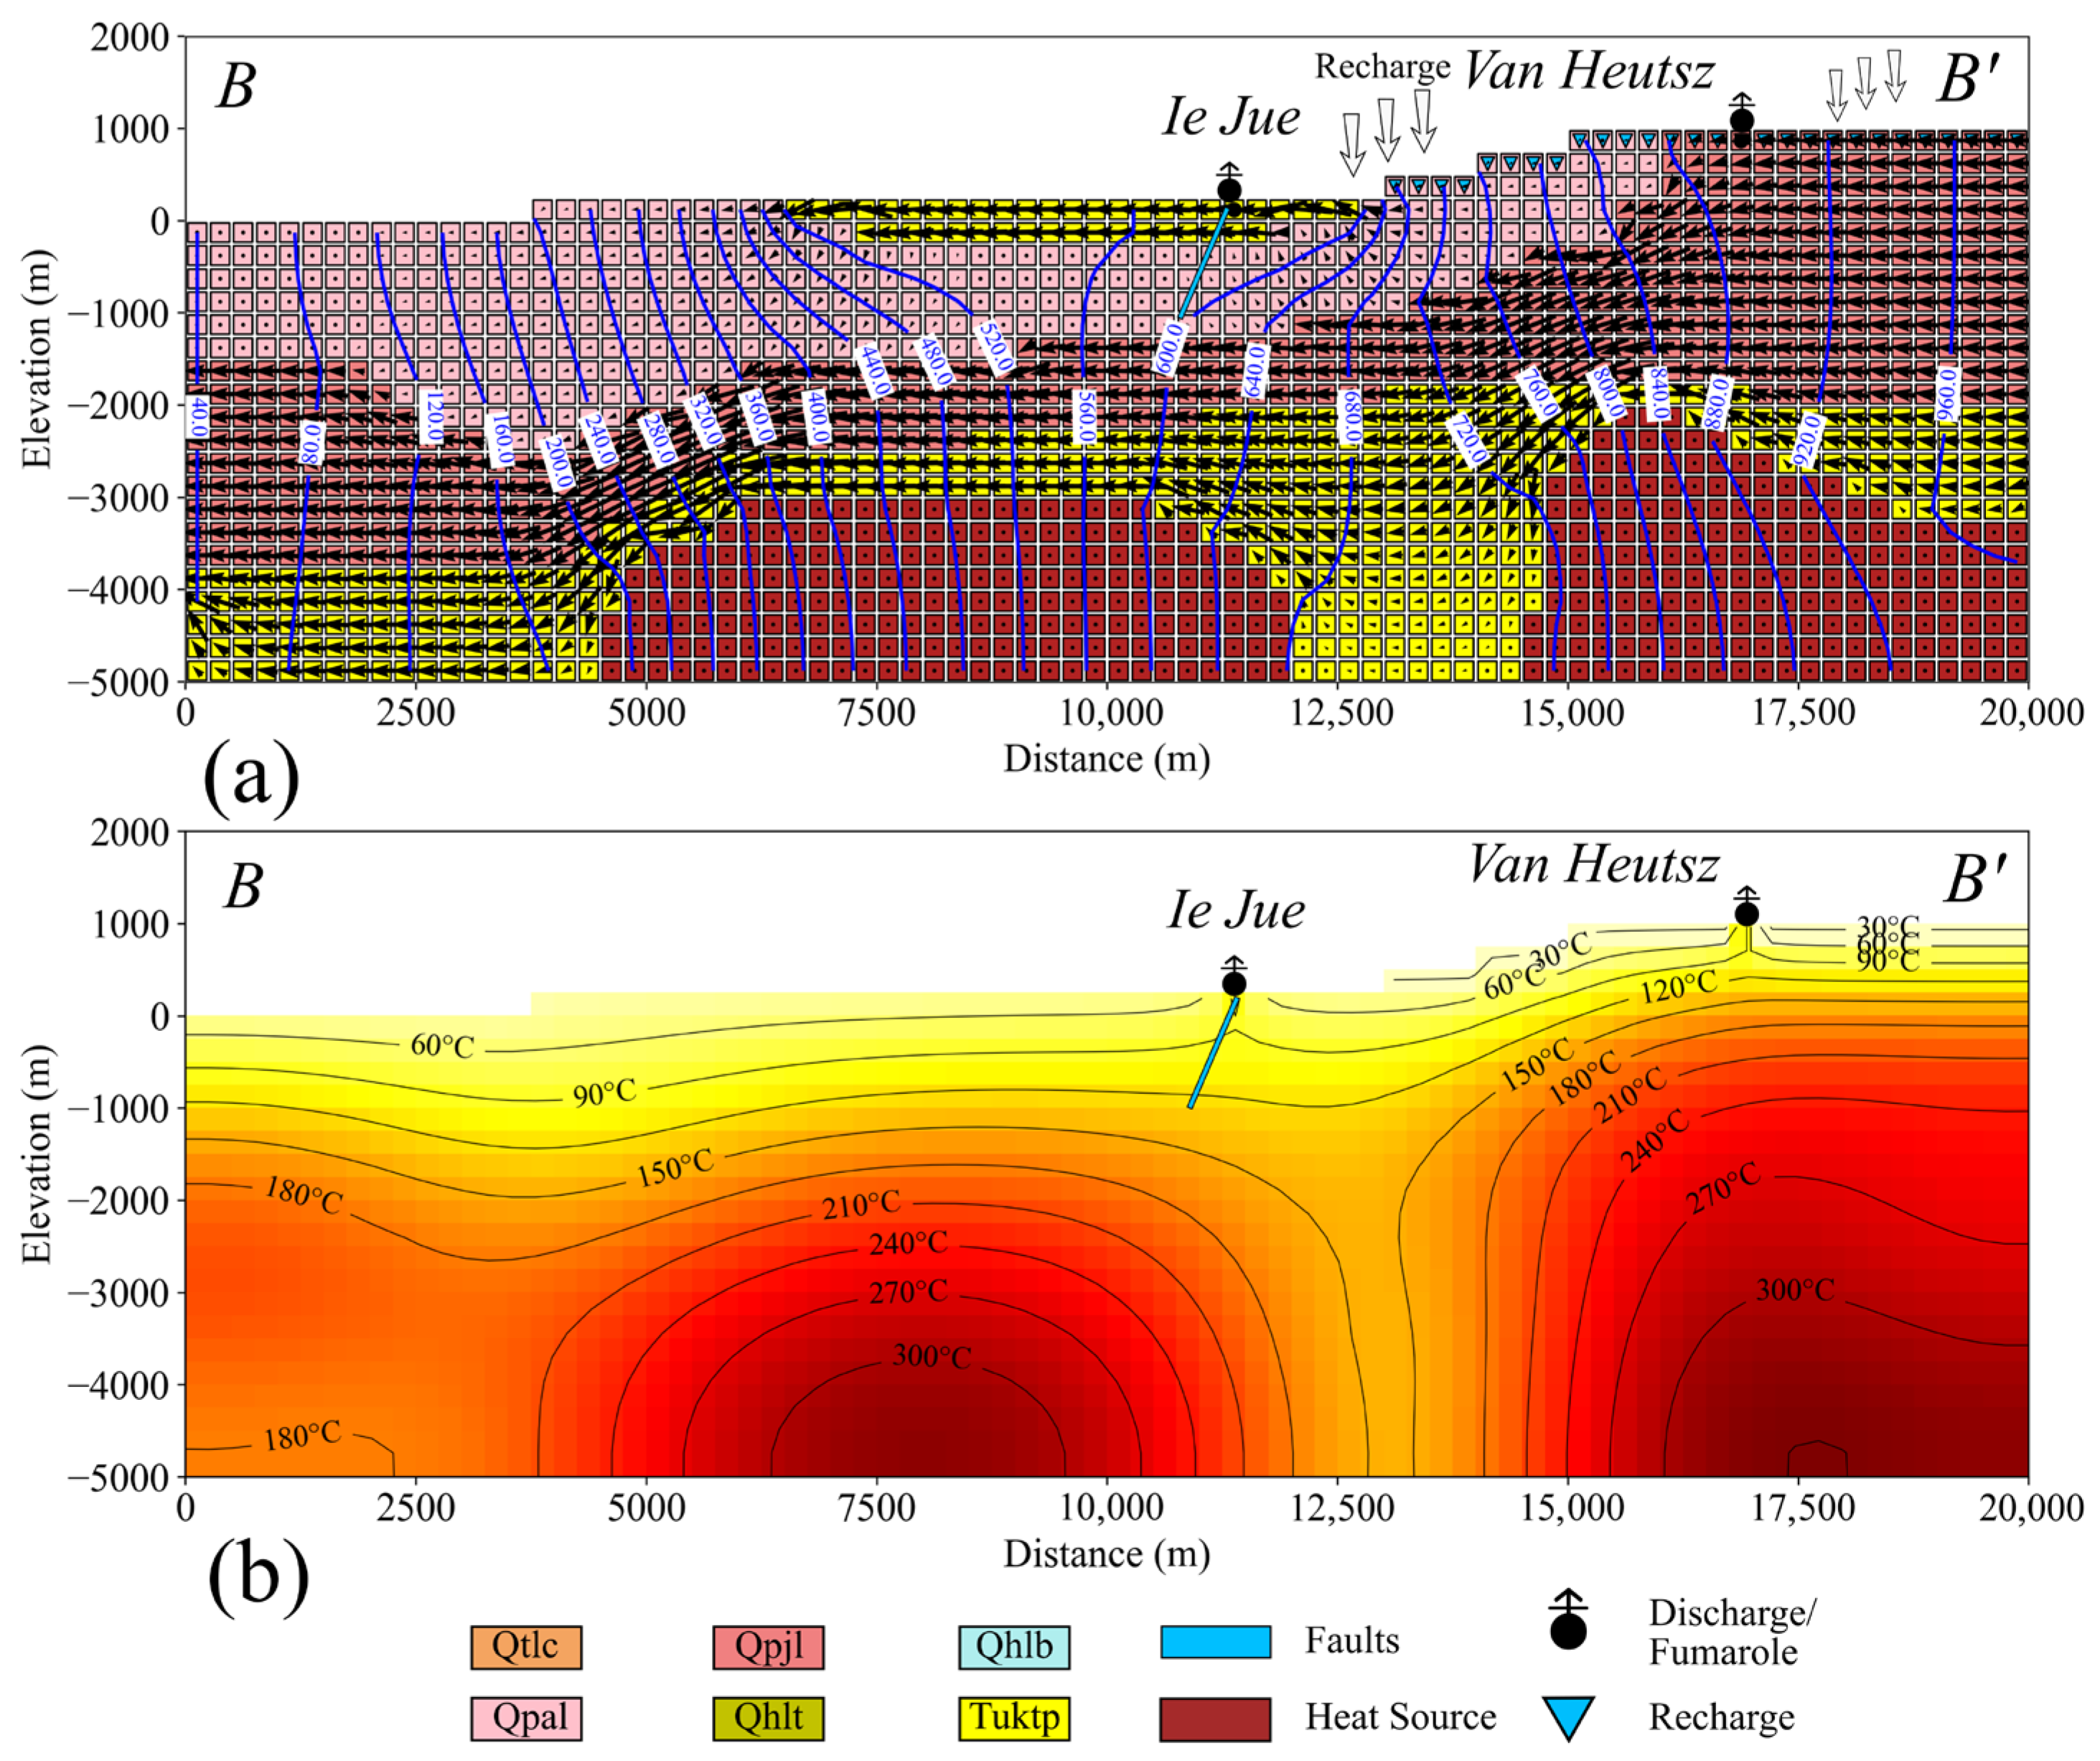
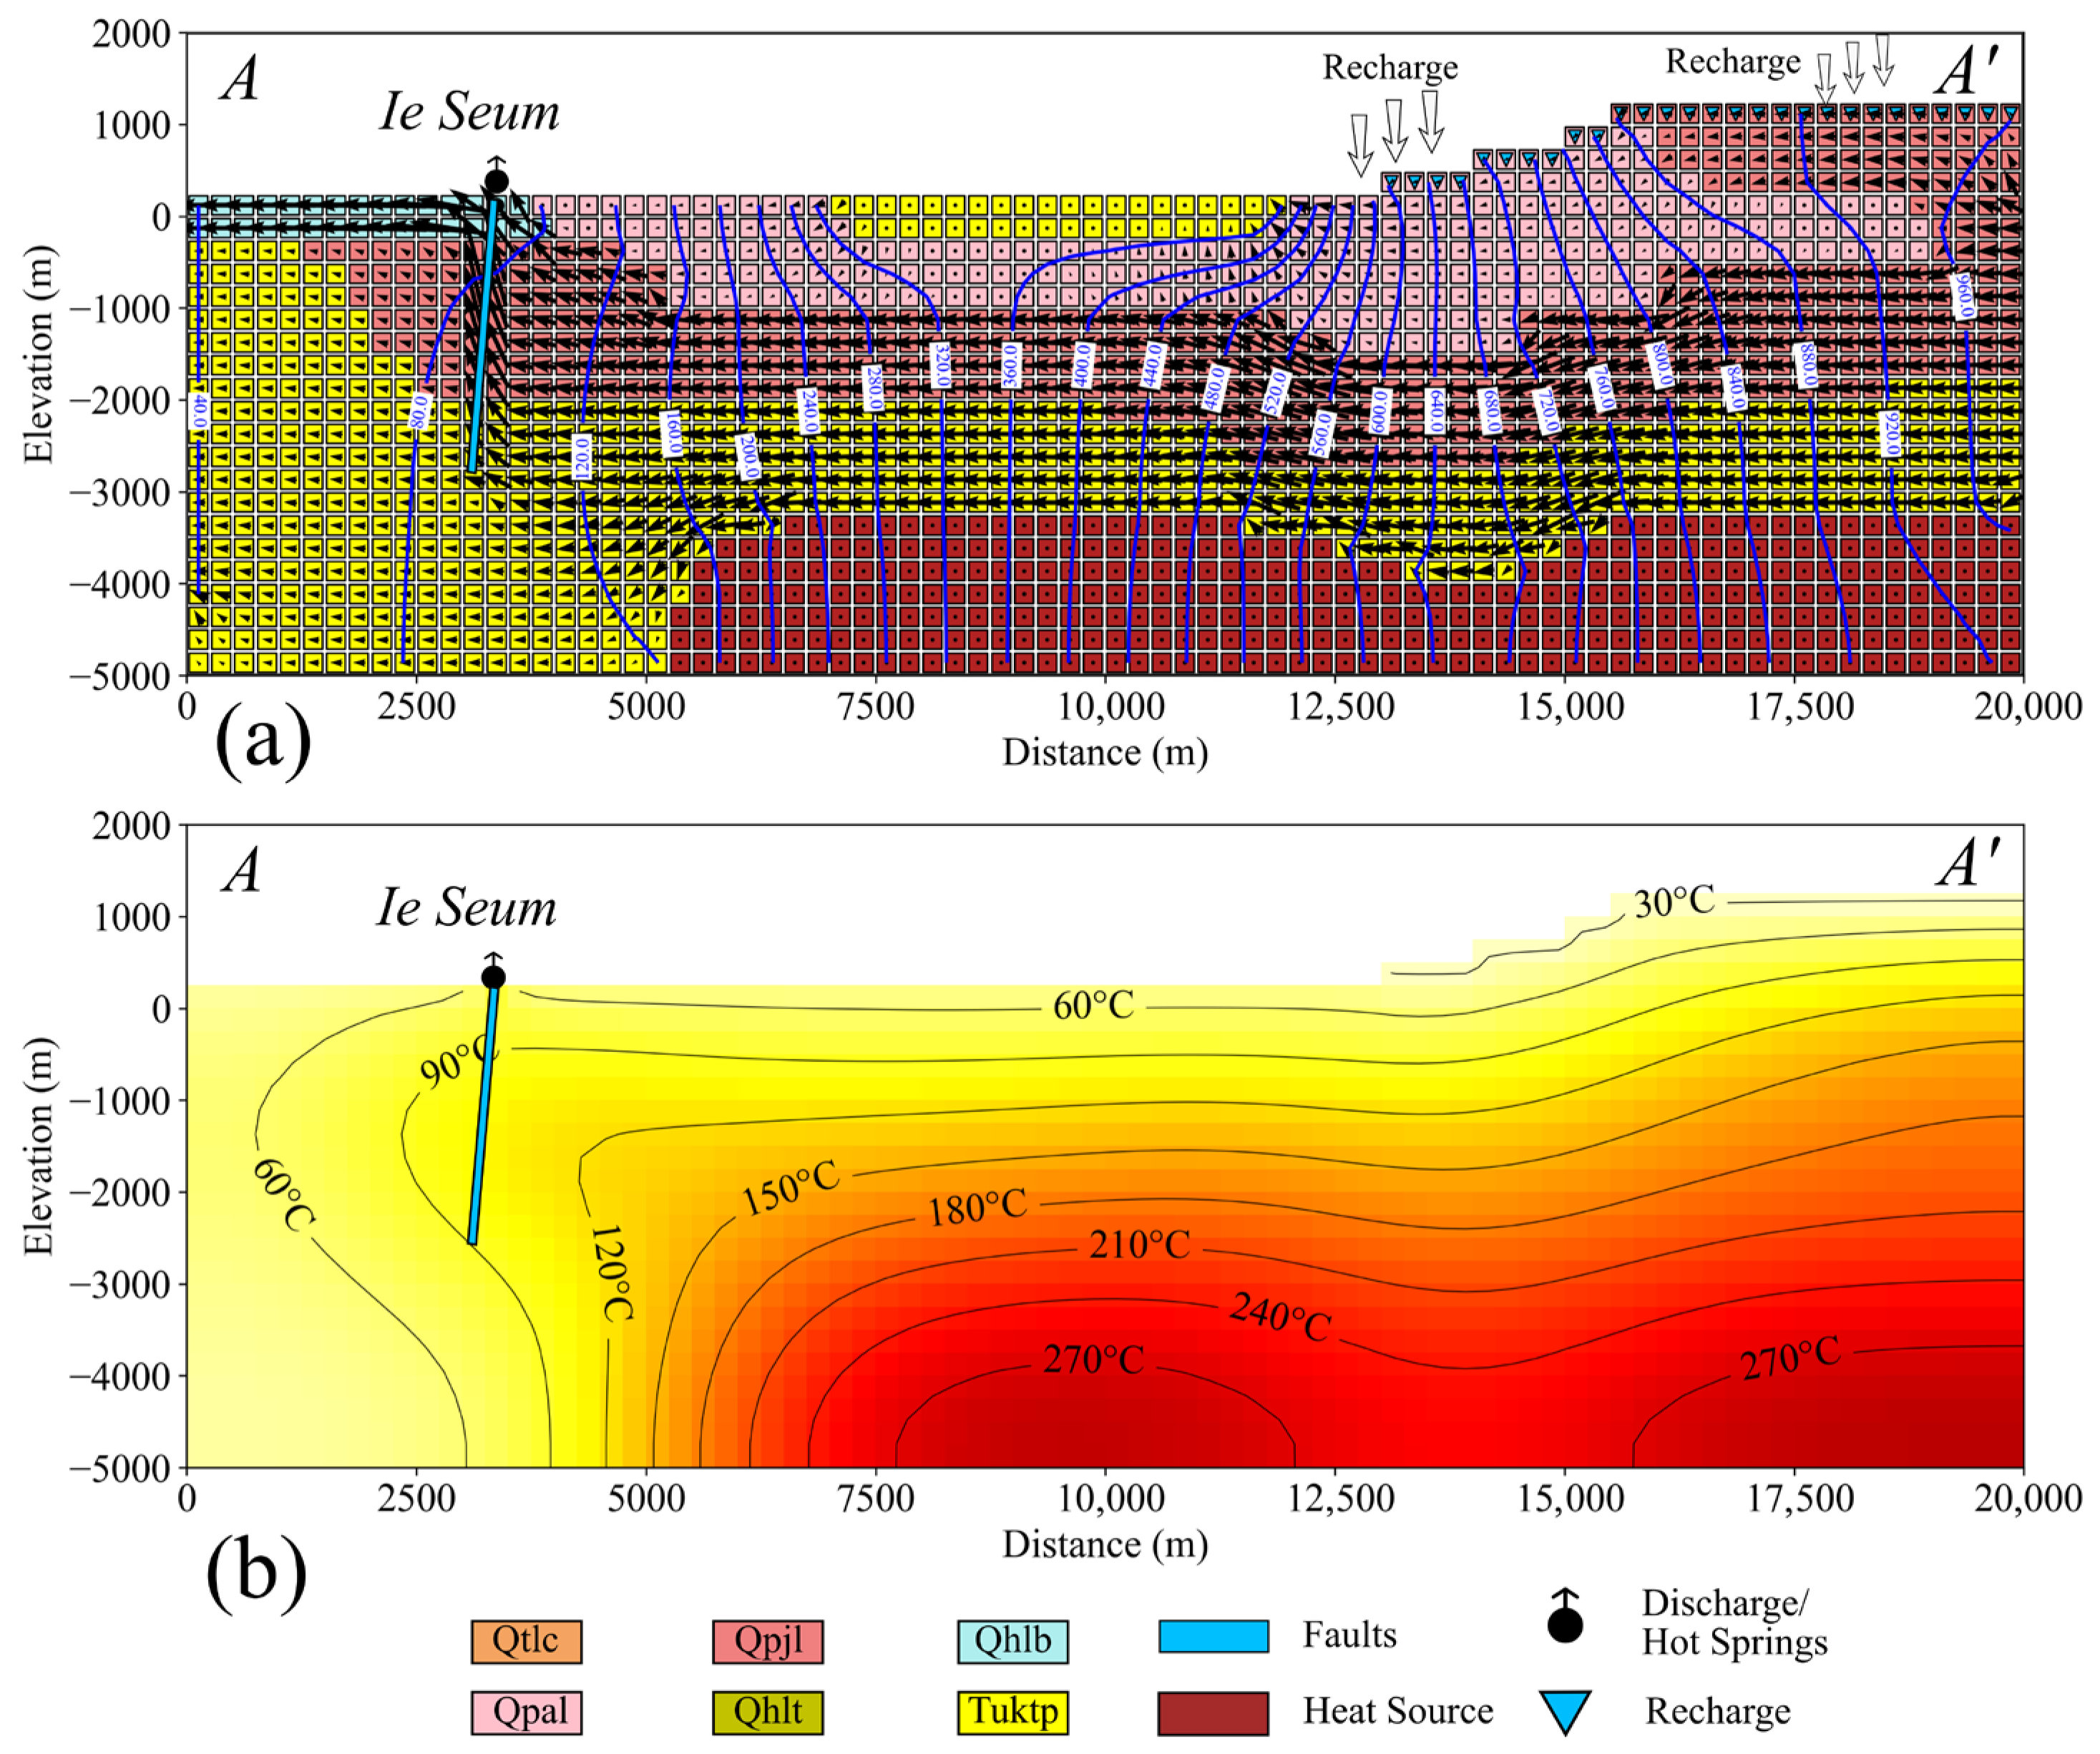
Figure 11 and Figure 12 illustrate groundwater flow and heat transfer at the Ie Seum and Ie Jue sites. Fluid movement and heat transfer are controlled by tectonic setting and geology, as shown in Profiles A–A’ (Figure 11) and B–B’ (Figure 12). The A–A′ cross section (Figure 11a) indicates that groundwater in the Ie Seum area originates from elevations of 600 to 1200 m above sea level, about 20,000 m from the site. The fluid infiltrates the Seulawah Agam Andesite Lava, then descends into a permeable zone at depths of −1.5 to −3.0 km within the Lamteuba andesite breccia unit (Qpal). It is heated by a 120–242 °C reservoir at depths of 1.0–3 km (Figure 11b) and rises through the Seulimeum fault. The cap rock at depths of −1.5 to 0 km limits upward flow to the surface in the surrounding area.
At a depth of 3.0 km, heat at 400 °C (Figure 11b) is transferred to the reservoir layer. Conductive heat moves from the source to the reservoir base, while mixed convection within the reservoir produces temperatures between 120 and 242 °C. Simulated groundwater flow velocities, which transfer heat by convection, range from 0.15 to 0.3 m/day. Higher velocities in the reservoir layer indicate greater permeability. Accelerated convective flow along the Seulimeum fault demonstrates that this structure acts as a preferential pathway for vertical fluid migration from depth to the surface in the Ie Seum area. In this region, fluid has traveled over 10 km, defining the regional deep fluid Ie Seum hydrothermal system.
Cross section B–B’ (Figure 12a,b) illustrates groundwater movement in the Ie Jue and Kawah van Heutsz areas. At Ie Jue, intermediate-local groundwater emerges as steaming ground, while at Kawah van Heutsz, it appears as a fumarole, as confirmed by chemical analysis. Water from the recharge zones of the Lamteuba andesite breccia unit (Qpal) and Qpjl rock layers flows downhill to the reservoir, where it is heated and circulates at depths of 0.2 to 1.0 km. Heated water rises through minor fractures at both sites, and hot springs are supplied by shallow groundwater. The shallower heat source results in higher temperatures at Ie Jue and Kawah van Heutsz (150–316 °C) than at Ie Seum (120–242 °C). Ie Jue and Kawah van Heutsz are considered local hydrothermal systems because fluid circulation is limited to the area and does not extend beyond the region through major faults.

5.3. Validation of the Numerical Simulation and Limitation

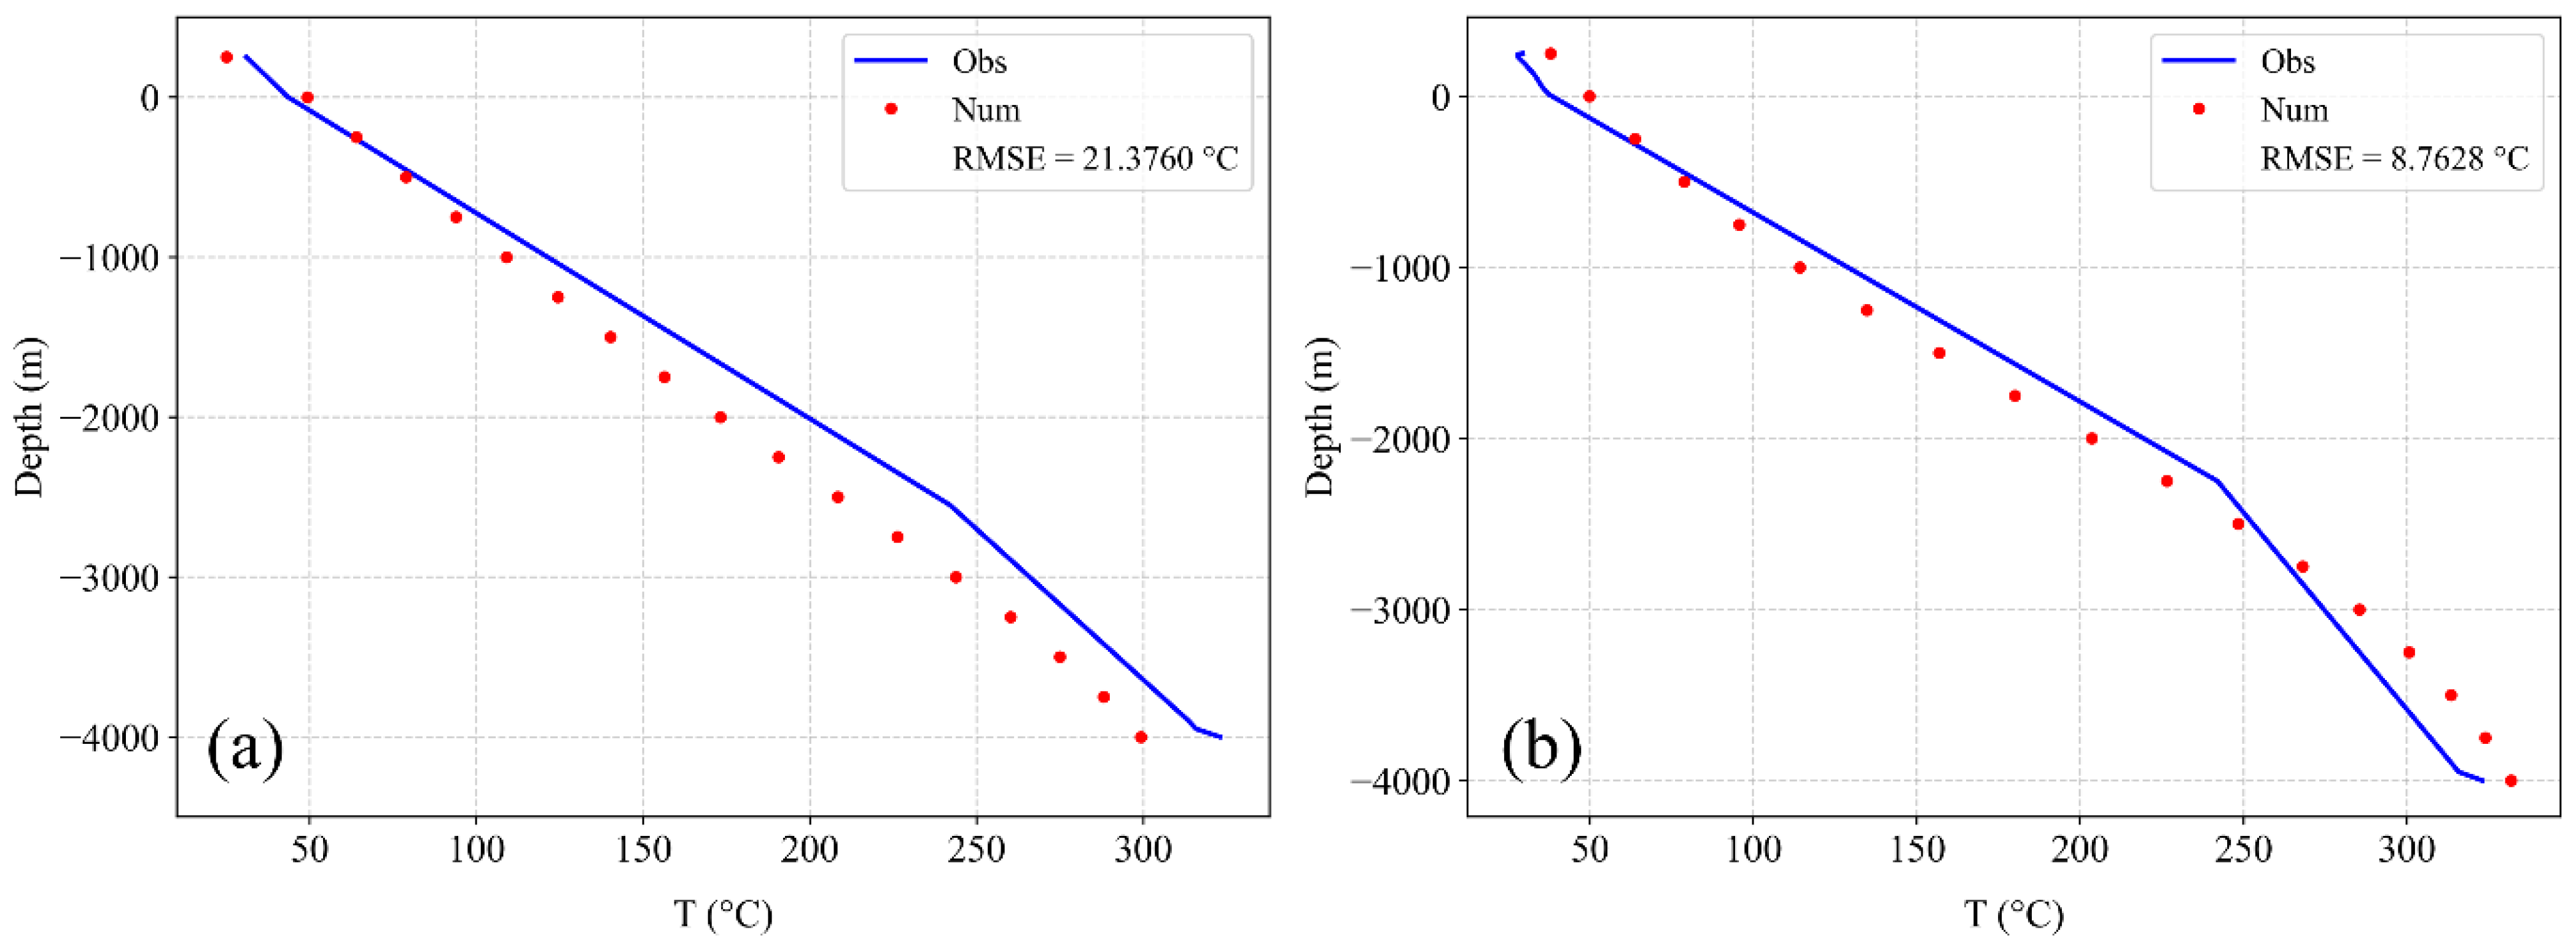
Model validation involves comparing numerical simulation results with field observations to ensure the model accurately represents the geothermal system’s thermal characteristics. Temperature profiles from the SLW-1 and SLW-2 observation wells served as reference datasets. Figure 13 presents a comparison between observed (blue lines) and simulated (red dots) results.
Simulated surface temperatures range from 70 to 90 °C in Ie Seum and 80 to 100 °C in Ie Jue, closely matching observed values of 83.7 °C and 96.1 °C. At reservoir depths of approximately 1.0 to 3.0 km, modeled temperatures of 120 to 242 °C for Ie Seum and 150 to 316 °C for Ie Jue are consistent with geochemical estimates of 241.9 °C and 316.7 °C. The margin of error, measured by RMSE, ranges from 8.76 °C (~3.63% at the surface) to 21.37 °C (~6.76% at reservoir depth), which is acceptable for regional-scale geothermal modeling.
Single-phase modeling (e.g., Domenico, [29]; Ingebritsen, [33]; Sorey, [34]) was employed in this study, as it is appropriate for liquid-dominated hydrothermal systems such as the Seulawah Agam geothermal resource. This approach assumes that phase changes from liquid to gas are negligible or highly localized and not dominant.
With this assumption, heat energy alters only the temperature of fluid and rock, without affecting pressure or density. In practice, however, temperature increases can induce phase changes from liquid to vapor, leading to variations in density, pressure, and heat transfer patterns [35]. Neglecting phase changes may result in overestimation of subsurface temperatures, underestimation of pressures, and altered fluid flow patterns in simulations.
Numerical modeling could be improved by implementing two-phase modeling as proposed by Pruess. [36] and Kipp et al. [37], which would incorporate additional parameters such as pressure, viscosity, and density to simulate localized changes in fluid flow. The modeled temperature data using MODFLOW6 correspond with observed values, as presented in Figure 13. This result indicates that single-phase modeling, as applied in this study, is suitable for analyzing general fluid flow patterns in the regional, liquid-dominated Seulawah geothermal system.

6. Conclusions

This study presents a comprehensive conceptual model of the Seulawah Agam geothermal system, outlining its fluid flow and heat transfer patterns. These findings are essential for site-drilling assessments and the development of sustainable geothermal power plants. Integrated geological, geophysical, and geochemical analyses have enhanced the understanding of layer thickness and temperature within the system. The Ie Seum reservoir is located at depths of 1.0–2.5 km with estimated temperatures of 120–242 °C. The Ie Jue and Kawah van Heutsz reservoirs are found at depths of 0.8–2.5 km, with temperatures of 150–316 °C. Fluid flow modeling indicates that Ie Seum represents regional deep groundwater, with the Seulimum fault serving as the main fluid pathway. The Ie Jue and Kawah van Heutsz sites form a local hydrothermal system in which fluids are heated by a shallower reservoir, resulting in higher temperatures. The fluid flow pattern indicates that the Ie Jue area is a promising drilling site, as fluid circulation is confined to this zone. The numerical model accurately simulates fluid flow and heat transfer in the Seulawah geothermal system, consistent with observational data. Further refinement is possible with a fully coupled thermo-hydraulic model, but this approach requires additional data on temperature-dependent fluid density and viscosity, which are currently limited for the study area.

Author Contributions

Conceptualization, D.B.D. and A.A.; methodology, D.B.D.; software, A.A.; validation, D.B.D., A.A. and L.E.W.; formal analysis, D.B.D.; investigation, D.B.D. and A.A.; resources, D.B.D.; data curation, D.B.D. and A.A.; writing—original draft preparation, D.B.D. and A.A.; writing—review and editing, R.I., U.M., S.R. and L.E.W.; visualization, D.B.D. and A.A.; supervision, U.M., R.I. and L.E.W.; project administration, D.B.D. and A.A.; funding acquisition, no funding received. All authors have read and agreed to the published version of the manuscript.

Funding

This research received no external funding.

Data Availability Statement

The original contributions presented in this study are included in the article. Further inquiries can be directed to the corresponding author.

Acknowledgments

The authors are grateful to PT. Pertamina Geothermal Energy for providing some of the geophysical raw data and isotope data in the Seulawah Agam region used in this study. This data was very helpful in the process of establishing initial conditions, conceptual models, and validating results.

Conflicts of Interest

The authors declare that they have no conflict of interest.

Abbreviations

The following abbreviations are used in this manuscript:
RMSERoot mean square error
SGSSeulawah geothermal system
KVHKawah van Heutsz
MTMagnetotellurics

References

  1. Muksin, U.; Arifullah, A.; Simanjuntak, A.V.; Asra, N.; Muzli, M.; Wei, S.; Gunawan, E.; Okubo, M. Secondary fault system in Northern Sumatra, evidenced by recent seismicity and geomorphic structure. J. Asian Earth Sci. 2023, 245, 105557. [Google Scholar] [CrossRef]
  2. Muksin, U.; Bauer, K.; Muzli, M.; Ryberg, T.; Nurdin, I.; Masturiyono, M.; Weber, M. AcehSeis project provides insights into the detailed seismicity distribution and relation to fault structures in Central Aceh, Northern Sumatra. J. Asian Earth Sci. 2019, 171, 20–27. [Google Scholar] [CrossRef]
  3. Muksin, U.; Bauer, K.; Haberland, C. Seismic Vp and Vp/Vs structure of the geothermal area around Tarutung (North Sumatra, Indonesia) derived from local earthquake tomography. J. Volcanol. Geotherm. Res 2013, 260, 27–42. [Google Scholar] [CrossRef]
  4. Muksin, U.; Haberland, C.; Nukman, M.; Bauer, K.; Weber, M. Detailed fault structure of the Tarutung Pull-Apart Basin in Sumatra, Indonesia, derived from local earthquake data. J. Asian Earth Sci. 2014, 96, 123–131. [Google Scholar] [CrossRef]
  5. Marwan, M.; Yanis, M.; Nugraha, G.S.; Zainal, M.; Arahman, N.; Idroes, R.; Dharma, D.B.; Saputra, D.; Gunawan, P. Mapping of fault and hydrothermal system beneath the seulawah volcano inferred from a magnetotellurics structure. Energies 2021, 14, 6091. [Google Scholar] [CrossRef]
  6. Marwan, M.; Yanis, M.; Abdullah, F.; Adhari, M.R.; Nugraha, G.; Paembonan, A.Y.; Idroes, R.; Yusuf, M.; Dharma, D.B.; Muzakir, M.; et al. Characterization of a geothermal system in the shallow structure of Seulawah volcano, Indonesia, using transient electromagnetic methods. Int. J. Renew. Energy Dev. 2025, 14, 473–484. [Google Scholar] [CrossRef]
  7. Li, X.; Huang, X.; Liao, X.; Zhang, Y. Hydrogeochemical characteristics and conceptual model of the geothermal waters in the Xianshuihe fault zone, Southwestern China. Int. J. Environ. Res. Public Health 2020, 17, 500. [Google Scholar] [CrossRef]
  8. Syah, B.Y.C.S.S.; Itoi, R.; Taguchi, S.; Saibi, H.; Yamashiro, R. Hydrogeochemical and isotope characterization of geothermal waters from the Cidanau geothermal field, West Java, Indonesia. Geothermics 2019, 78, 62–69. [Google Scholar] [CrossRef]
  9. Idroes, R.; Yusuf, M.; Alatas, M.; Lala, A.; Suhendra, R.; Idroes, G. Geochemistry of Sulphate spring in the Ie Jue geothermal areas at Aceh Besar district, Indonesia. Proc. IOP Conf. Ser. Mater. Sci. Eng. 2019, 523, 012012. [Google Scholar] [CrossRef]
  10. Idroes, R.; Yusuf, M.; Saiful, S.; Alatas, M.; Subhan, S.; Lala, A.; Muslem, M.; Suhendra, R.; Idroes, G.M.; Marwan, M.J.E. Geochemistry exploration and geothermometry application in the North zone of Seulawah Agam, Aceh Besar district, Indonesia. Energies 2019, 12, 4442. [Google Scholar] [CrossRef]
  11. Liu, Z.; Ye, G.; Wang, H.; Dong, H.; Xu, B.; Zhu, H. Geophysics and Geochemistry Reveal the Formation Mechanism of the Kahui Geothermal Field in Western Sichuan, China. Minerals 2025, 15, 339. [Google Scholar] [CrossRef]
  12. Yulianto, F.; Suwarsono; Sofan, P. The Utilization of Remotely Sensed Data to Analyze the Estimated Volume of Pyroclastic Deposits and Morphological Changes Caused by the 2010–2015 Eruption of Sinabung Volcano, North Sumatra, Indonesia. Pure Appl. Geophys. 2016, 173, 2711–2725. [Google Scholar] [CrossRef]
  13. Taillefer, A.; Truche, L.; Audin, L.; Donzé, F.V.; Tisserand, D.; Denti, S.; Manrique Llerena, N.; Masías Alvarez, P.J.; Braucher, R.; Zerathe, S.; et al. Characterization of Southern Peru Hydrothermal Systems: New Perspectives for Geothermal Exploration Along the Andean Forearc. Geochem. Geophys. Geosystems 2024, 25, e2023GC011344. [Google Scholar] [CrossRef]
  14. Torresan, F.; Piccinini, L.; Cacace, M.; Pola, M.; Zampieri, D.; Fabbri, P. Numerical modeling as a tool for evaluating the renewability of geothermal resources: The case study of the Euganean Geothermal System (NE Italy). Environ. Geochem. Health 2022, 44, 2135–2162. [Google Scholar] [CrossRef]
  15. Seyedrahimi-Niaraq, M.; Ardejani, F.D.; Noorollahi, Y.; Porkhial, S.; Itoi, R.; Nasrabadi, S.J.J.G. A three-dimensional numerical model to simulate Iranian NW Sabalan geothermal system. Geothermics 2019, 77, 42–61. [Google Scholar] [CrossRef]
  16. Diersch, H.-J.; Kolditz, O. Coupled groundwater flow and transport: 2. Thermohaline and 3D convection systems. Adv. Water Resour. 1998, 21, 401–425. [Google Scholar] [CrossRef]
  17. Zeng, Y.-C.; Su, Z.; Wu, N.-Y. Numerical simulation of heat production potential from hot dry rock by water circulating through two horizontal wells at Desert Peak geothermal field. Energy 2013, 56, 92–107. [Google Scholar] [CrossRef]
  18. Blöcher, M.G.; Zimmermann, G.; Moeck, I.; Brandt, W.; Hassanzadegan, A.; Magri, F. 3D numerical modeling of hydrothermal processes during the lifetime of a deep geothermal reservoir. Geofluids 2010, 10, 406–421. [Google Scholar] [CrossRef]
  19. Huang, X.; Tong, P. New insight into the velocity and anisotropy structures of the subduction zone in northern Sumatra. Tectonophysics 2024, 892, 230534. [Google Scholar] [CrossRef]
  20. Bellier, O.; Sébrier, M. Relationship between tectonism and volcanism along the Great Sumatran Fault Zone deduced by spot image analyses. Tectonophysics 1994, 233, 215–231. [Google Scholar] [CrossRef]
  21. Muksin, U.; Irwandi; Rusydy, I.; Muzli; Erbas, K.; Marwan; Asrillah; Muzakir; Ismail, N. Investigation of Aceh Segment and Seulimeum Fault by using seismological data; A preliminary result. J. Phys. Conf. Ser. 2018, 1011, 012031. [Google Scholar] [CrossRef]
  22. Bennett, J.D.; Pusat Penelitian dan Pengembangan Geologi (Indonesia). Peta Geologi Lembar BandaAceh, Sumatra, Geologic Map of the BandaAceh Quadrangle, Sumatra; Geological Research and Development Centre: Bandung, Indonesia, 1980. [Google Scholar]
  23. Krieger, L.; Peacock, J.R. MTpy: A Python toolbox for magnetotellurics. Comput. Geosci. 2014, 72, 167–175. [Google Scholar] [CrossRef]
  24. deGroot-Hedlin, C.; Constable, S. Occam’s inversion to generate smooth, two-dimensional models from magnetotelluric data. Geophysics 1990, 55, 1613–1624. [Google Scholar] [CrossRef]
  25. Dotsika, E.; Dalampakis, P.; Spyridonos, E.; Diamantopoulos, G.; Karalis, P.; Tassi, M.; Raco, B.; Arvanitis, A.; Kolios, N.; Michelot, J. Chemical and isotopic characterization of the thermal fluids emerging along the North–Northeastern Greece. Sci. Rep. 2021, 11, 16291. [Google Scholar] [CrossRef]
  26. Langevin, C.D.; Hughes, J.D.; Banta, E.R.; Niswonger, R.G.; Panday, S.; Provost, A.M. Documentation for the MODFLOW 6 Groundwater Flow Model; U.S. Geological Survey (USGS): Reston, VA, USA, 2017.
  27. Bakker, M.; Post, V.; Langevin, C.D.; Hughes, J.D.; White, J.T.; Starn, J.; Fienen, M.N. Scripting MODFLOW model development using Python and FloPy. Groundwater 2016, 54, 733–739. [Google Scholar] [CrossRef] [PubMed]
  28. U.S. Bureau of Reclamation. Ground Water Manual: A Water Resources Technical Publication; U.S. Bureau of Reclamation: Washington, DC, USA, 1995; p. 716.
  29. Domenico, P.A.; Schwartz, F.W. Physical and Chemical Hydrogeology; John Wiley & Sons: Hoboken, NJ, USA, 1997. [Google Scholar]
  30. Giggenbach, W. Chemical techniques in geothermal exploration. In Application of Geochemistry in Geothermal Reservoir Development; UNITAR/UNDP Centre on Small Energy Resources: Rome, Italy, 1991; pp. 119–144. [Google Scholar]
  31. Giggenbach, W.F. Geothermal solute equilibria. derivation of Na-K-Mg-Ca geoindicators. Geochim. Cosmochim. Acta 1988, 52, 2749–2765. [Google Scholar] [CrossRef]
  32. Arnórsson, S. Isotopic and Chemical Techniques in Geothermal Exploration, Development and Use: Sampling Methods, Data Handling, Interpretation; International Atomic Energy Agency: Vienna, Austria, 2000. [Google Scholar]
  33. Ingebritsen, S.E.; Sanford, W.E.; Neuzil, C.E. Groundwater in Geologic Processes; Cambridge University Press: Cambridge, UK, 2006. [Google Scholar]
  34. Sorey, M.L. Numerical Modeling of Liquid Geothermal Systems; U.S. Government Printing Office: Washington, DC, USA, 1978.
  35. Codeço, M.S.; Weis, P.; Andersen, C. Numerical Modeling of Structurally Controlled Ore Formation in Magmatic-Hydrothermal Systems. Geochem. Geophys. Geosystems 2022, 23, e2021GC010302. [Google Scholar] [CrossRef]
  36. Pruess, K. Modeling of geothermal reservoirs: Fundamental processes, computer simulation and field applications. Geothermics 1990, 19, 3–15. [Google Scholar] [CrossRef]
  37. Kipp, K.L.; Hsieh, P.A.; Charlton, S.R. Guide to the Revised Ground-Water Flow and Heat Transport Simulator: HYDROTHERM—Version 3; U.S. Department of the Interior, U.S. Geological Survey: Reston, VA, USA, 2008.
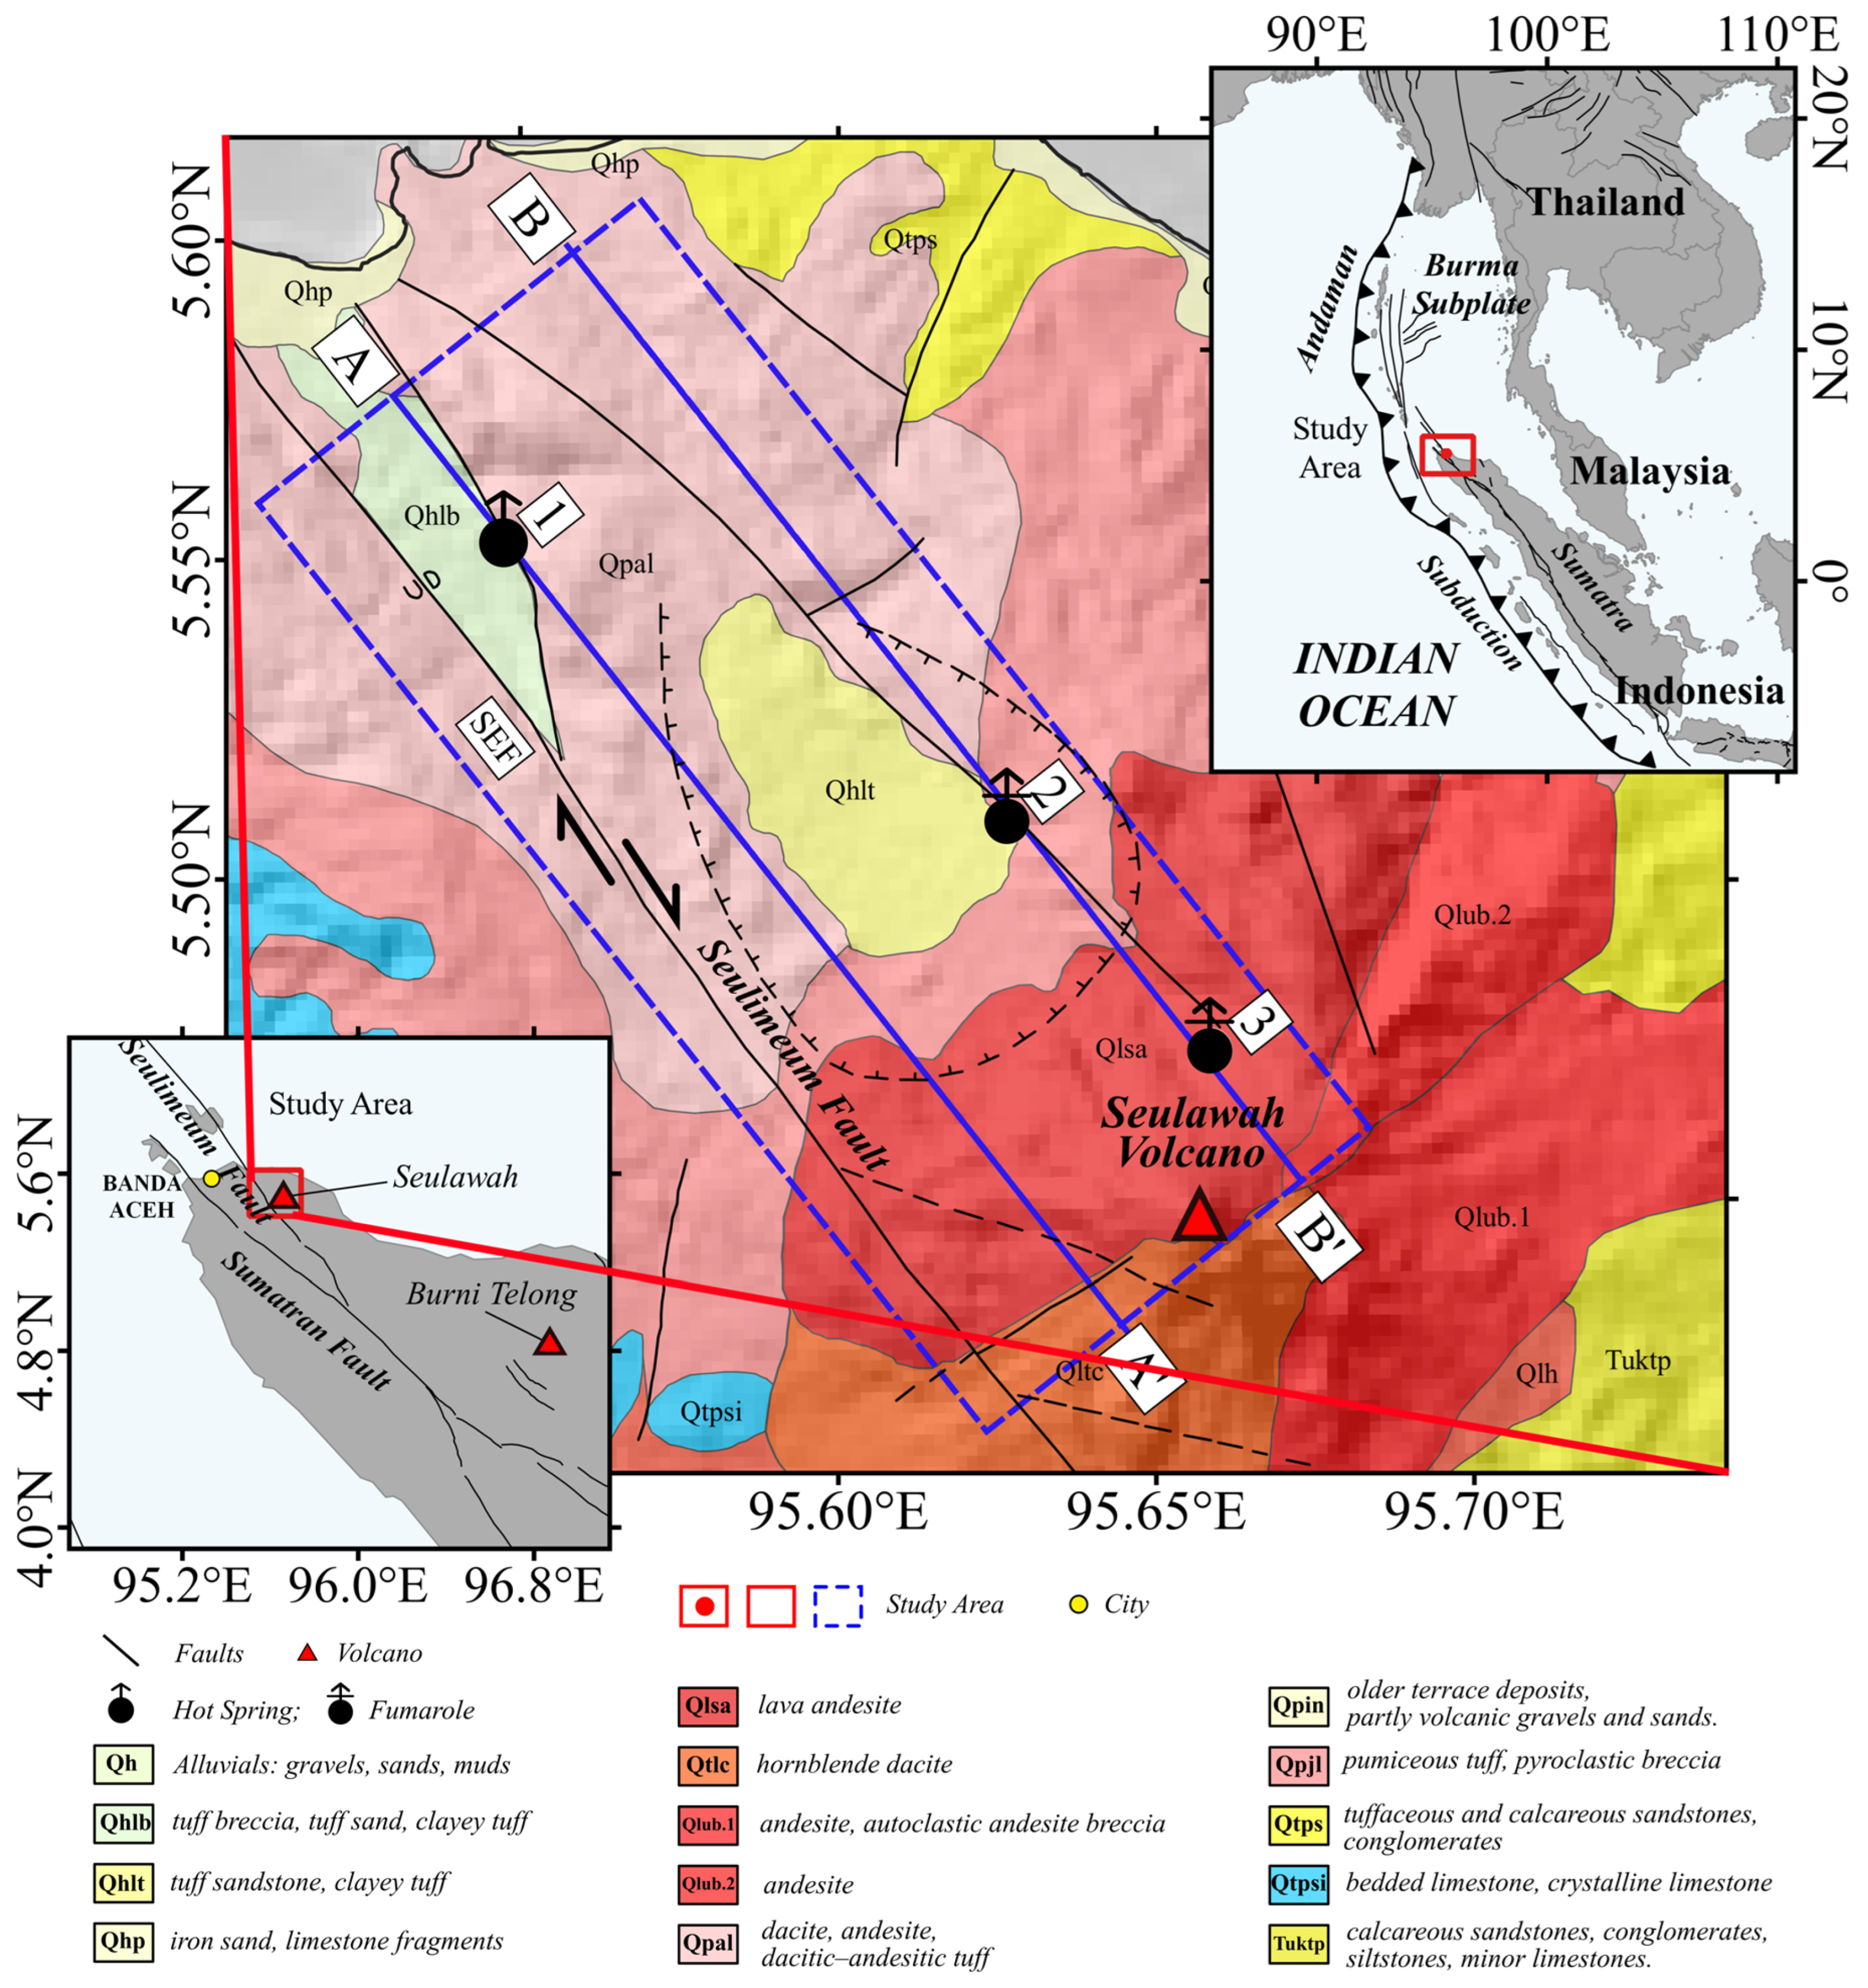
Figure 1. Geological map of the northern Seulawah Agam area as well as geoelectrical and magnetotelluric observation sites. The blue rectangle marks the study area with cross sections A–A′ and B–B′. The black dashed line indicates the Seulimeum fault, a northwest–southeast dextral strike-slip fault, while thin black lines represent local faults. Geological symbols: [1] Ie Seum geothermal manifestation, [2] Ie Jue fumarole, [3] Kawah van Heutsz fumarole. The blue dashed line represents the boundary of the modeling area while the red lines represent the study area boundary, as shown in the upper-right and lower-left inset map.
Earth 07 00030 g001
Figure 2. Flowchart illustrating the workflow for developing the conceptual model and numerical Seulawah geothermal system model.
Earth 07 00030 g002
Figure 3. The station distribution of the magnetotelluric survey is indicated by the yellow triangles. The dashed blue lines show the boundary of the numerical modelling area, and the bold blue lines are the profiles across lines A–A’ and B–B’.
Earth 07 00030 g003
Figure 4. The computational structured grid setup used to model the Seulawah Agam geothermal system (SGS) area in a 2D plan with both profiles: (a) plan view of the model, (b) regional cross section of A–A’, (c) local cross section of B–B’.
Earth 07 00030 g004
Figure 5. Results of the magnetotelluric (MT) inversion: (a) resistivity map at zero depth showing lateral variations in subsurface resistivity associated with geological and hydrothermal features, and resistivity cross sections along (b) A–A’ and (c) B–B’, highlighting low resistivity zones interpreted as cap rocks and higher-resistivity zones corresponding to the geothermal reservoir and deeper heat source.
Earth 07 00030 g005
Figure 6. (a,b) thin sections of tuff breccia; (c,d) mineragraphic analysis of the tuff breccia sample from the Ie Seum location, Py = pyrite, Gth = goethite, NL = non-metallic minerals.
Earth 07 00030 g006
Figure 7. (a,b) thin section of pyroclastic rock of lapilli tuff sample from the Ie Jue location; (c,d) photomicrographs of polished sections SMPL-07a and SMPL-07b. Abbreviations: Mag = magnetite; Hem = hematite; NL = non-metallic minerals.
Earth 07 00030 g007
Figure 8. Correlations of isotopic composition and hydrological processes in the geothermal area: (a) δO18 vs. δD plot illustrating fluid origin and mixing processes; (b) recharge elevation inferred from stable isotope data.
Earth 07 00030 g008
Figure 9. Conceptual model of the Seulawah geothermal system derived from resistivity model, tectonic, lithology, geochemical, and isotopic data along cross sections (a) Ie Seum (A–A’), and (b) Kawah van Heutsz and Ie Jue. The depth profile is divided into three main layers: L1 represents the low-permeability cap rock; L2 corresponds to the geothermal reservoir, with temperatures of approximately 242 °C beneath the Ie Seum area along cross section A–A’ and about 316 °C within the reservoir beneath the Ie Jue and Kawah van Heutsz areas along cross section B–B’; L3 denotes the heat source.
Earth 07 00030 g009
Figure 10. Groundwater flow model without thermal conditions at the surface. This baseline simulation illustrates the natural hydraulic gradient, recharge and discharge zones, and dominant flow paths (black arrow) in the study area prior to the incorporation of heat transfer processes. The recharge zone is located at a distance of 15,000–20,000 m. The arrow size indicates differences in fluid flow velocity.
Earth 07 00030 g010
Figure 11. Groundwater flow model at the Ie Seum location. (a) Groundwater flow (black arrow) without thermal conditions and corresponding head contours (blue line). The color indicates geological types; (b) thermal distribution illustrating subsurface temperature variation, with red color indicating higher temperatures.
Earth 07 00030 g011
Figure 12. Groundwater flow model at the Ie Jue and Kawah van Heutsz location. (a) Groundwater flow (black arrow) without thermal conditions and corresponding head contours (blue line). The color indicates geological types; (b) thermal distribution illustrating subsurface temperature variation, with red color indicating higher temperatures.
Earth 07 00030 g012
Figure 13. Comparison of temperature profiles from field observations (blue line) at SLW 1 and SLW 2 and numerical simulation results (red dots).
Earth 07 00030 g013
Table 1. Physical parameter measurements of geothermal manifestations, including temperature (T), pH, and conductivity.
PropertiesIdroes et al. [10]
(2019)
Measurements
(Jan 2024)
Ie SeumIe JueKVHIe SeumIe JueKVH
EC (µS/cm)Not measuredNot measuredNot measured7410275Not measured
Eh (mV)24.676.24Not measured43.240.2
T (C)86.0298.6276.683.796.1
TDS (ppm)1558530.24.857490272
pH6.665.931.576.5526.678
Table 2. Isotope data of Seulawah volcano.
LocationO18 (‰)D (‰)
Ie Seum−6.2−54.3
Ie Jue−12.8−69.3
van Heutsz−10.2−60.3
Table 3. Geological unit and physical properties parameters assigned to the program.
Geological FormationSymbolKx and Kz (m/day)T (°C)Information
Lamteuba dacitic-andesitic tuff unit: dacite, andesite, dacitic-andesitic tuffQpal10−125–60, except for the hot path of manifestationLow permeability (cap rock)
Tuffaceous sandstone units: tuffaceous sandstone, clayey tuff, bituminousQhlt10
Tanoh Cempaga hornblende dacite lava unit: hornblende daciteQltc102
Lamteuba andesite breccia unit: pumisan tuff pyroclastic brecciaQpjl100Ie Seum= 242
Ie Jue = 316
Reservoir
Seulawah Agam andesite lava unit: andesiteQlsa10
Calcareous sandstoneTuktp10−1
Seulimeum fault–Ie SeumF10 Fault
Discharge–Ie SeumQhlt–Qhlb102Ie Seum: 83.7
Ie Jue: 96.1
Water springs
RechargeRch-25Infiltration
Heat sourceHsNo water flow400High temperature
Table 4. Chemical composition of geothermal fluid samples based on laboratory analysis.
PropertiesIdroes et al. [10]Measurements
(2007)
Ie SeumIe JueKVHIe SeumIe JueKVH
Ca2+ (ppm)234.835.56180.86224167Not measured
Mg2+ (ppm)10.845.0113.499.5916.3
Na+ (ppm)1948.811.7134.11150519.5
K+ (ppm)219.2612.108.7412212.8
B (ppm)29.100.02-37.35-
HCO3 (ppm)104.990.54-98.1-
Cl (ppm)2713.263.3412.3825772.18
SO42− (ppm)182.4611.713127242981
NO3 (ppm)---0.1400.02
F (ppm)---0.80573.0
Br (ppm)---7.4910
SiO2 (ppm)15.2824.2190.05116-
As (ppm)---54781792
Table 5. Predicted temperature of reservoir.
Location Na/K Geothermometer
[31] (°C)
Gas Geothermometer
[30] (°C)
Ie Seum241.9NA
Ie JueNA316.7
van HeutszNANA
Table 6. Results of recharge elevation calculation.
LocationElev Discharge (m)Elev Recharge (m)
Ie Seum75619.35
Ie Jue3801136.85
Kawah van Heutsz750826.35
Disclaimer/Publisher’s Note: The statements, opinions and data contained in all publications are solely those of the individual author(s) and contributor(s) and not of MDPI and/or the editor(s). MDPI and/or the editor(s) disclaim responsibility for any injury to people or property resulting from any ideas, methods, instructions or products referred to in the content.