Article

Assessing Durum Wheat Productivity in a Mediterranean Area Under Climate Change Using AquaCrop

1
Department of Civil and Environmental Engineering and Architecture, University of Cagliari, 09123 Cagliari, CA, Italy
2
CRS4–Centro di Ricerca, Sviluppo e Studi Superiori in Sardegna, 09050 Pula, CA, Italy
*
Author to whom correspondence should be addressed.
Earth 2026, 7(1), 27; https://doi.org/10.3390/earth7010027
Submission received: 7 January 2026 / Revised: 4 February 2026 / Accepted: 8 February 2026 / Published: 11 February 2026

Abstract

Agricultural heritage is a cultural pillar of the Mediterranean region, where durum wheat plays a central role in traditional landscapes and food systems. Projected climate change is expected to alter crop productivity and place additional pressure on water resources. This study assesses future variability in durum wheat productivity and related implications for water resource management in Sardinia, Italy, where durum wheat is a major rainfed C3 crop. The AquaCrop-OpenSource model was calibrated to local conditions and applied to simulate historical (1950–2023) and near-future (2024–2050) scenarios using projections from seven climate models. Results indicate a modest increase in average yields under future conditions, accompanied by a higher frequency of crop failures. Elevated atmospheric CO2 concentrations emerge as the primary driver of yield increases, while changes in precipitation represent the main limiting factor. The role of aid irrigation as an adaptation strategy to stabilize yields and enhance productivity was evaluated. Scenario analysis shows that aid irrigation aimed at preventing crop failure remains sustainable in the near future, requiring approximately 14–17% of current agricultural water use in Sardinia. In contrast, irrigation used to maximize productivity would increase water demand by more than 40%, intensifying competition for water resources.

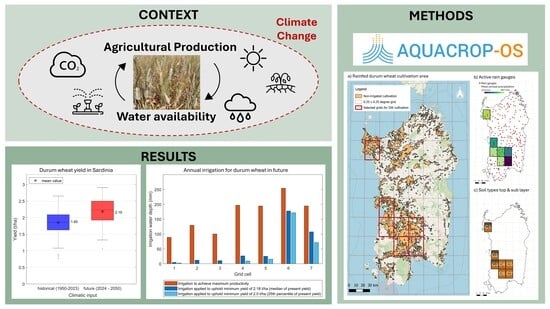
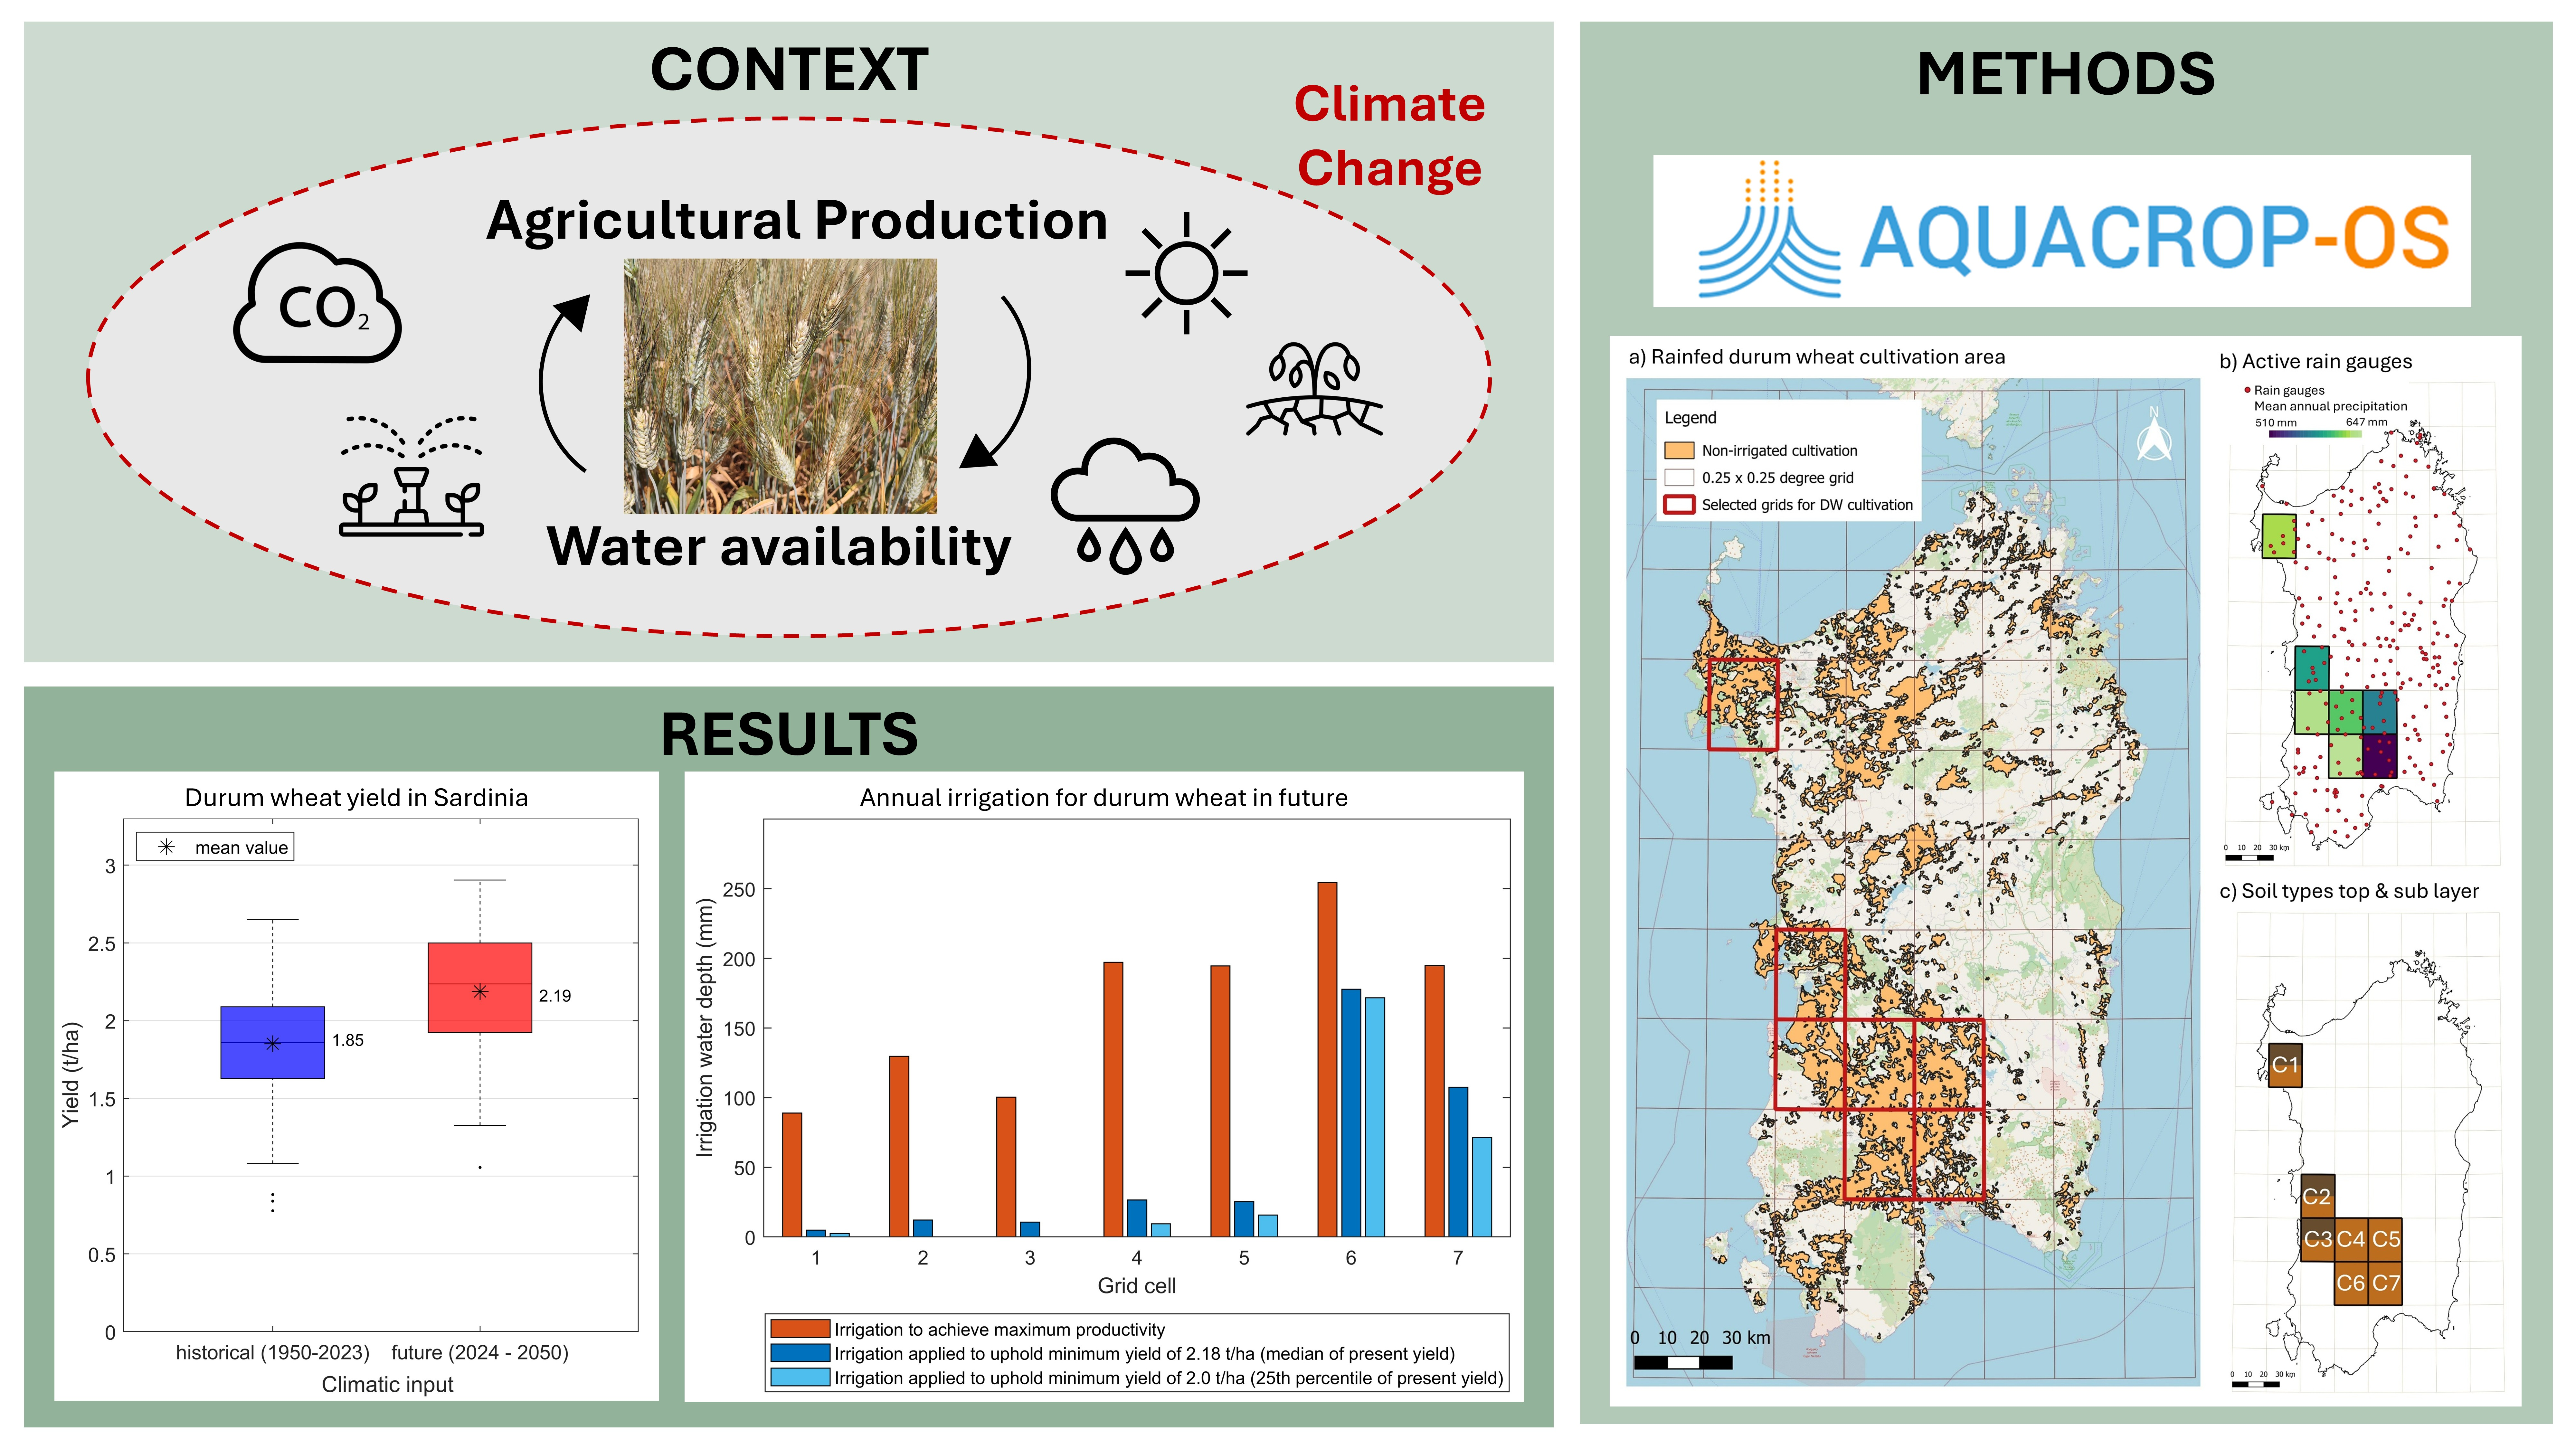
Graphical Abstract

1. Introduction

The Mediterranean region, renowned for its rich agricultural traditions, has long been shaped by the presence of wheat fields that not only contribute to food production but also define the region’s visual and ecological character. The golden expanses of grain are deeply interwoven with the history, customs, and livelihoods of local communities, making their preservation an issue of both economic and cultural significance. These agricultural landscapes can be classified as agricultural heritage systems or landscapes, wherein ecological integrity and economic prosperity are intertwined with cultural heritage, recreational value and esthetic significance [1,2]. Among the key crops contributing to this heritage is durum wheat, one of the major C3 crops in the Mediterranean region, standing out thanks to its high protein content and firm texture [3,4]. Additionally, its cultivation holds cultural and social importance [5] as it is often used for the preparation of traditional foods. In Italy durum wheat is popular for the production of pasta, whereas in North Africa and West Asia it serves as key ingredient for traditional dishes with bulgur, couscous and different types of flat breads [6,7]. In comparison to other crops, durum offers a relatively high tolerance to drought conditions, making it a favorable crop in semi-arid environments [8]. Accordingly, it is predominantly cultivated in the Mediterranean region and in North America, especially in Canada [9]. Moreover, durum wheat productivity is influenced by multiple drivers and constraints, including climatic conditions, biotic stressors and agricultural practices. Their effects are not only dependent on the intensity of the stressor, but also on the duration as well as the timing of its occurrence [10]. Predicted future changes in climatic conditions, such as altered precipitation patterns, extreme temperatures and increased atmospheric CO2 levels [11], will affect durum directly in terms of physiology and function, as well as indirectly through weeds, insect pests and diseases [9]. Some changes might even exert a positive impact the crop’s productivity, such as enhanced CO2 concentrations, with the potential to counterbalance negative effects of intensified stressors, such as droughts [12,13]. The overall effects of climate change on durum wheat yields might vary significantly depending on the region. Predictions derived from scientific studies indicate a wide range of potential outcomes, with projections reaching from a high increase in productivity to an almost complete decline [14,15,16]. At the same time, a shift in suitable areas for durum wheat cultivation is anticipated, with a clear tendency towards the north [17]. While understanding the global trend is beneficial, it is equally essential to analyze future local conditions to enable local farmers and policy makers to adapt accordingly. This would allow the possibility of continuing to grow wheat while guaranteeing the current level of productivity, and at the same time offering the possibility of preserving a landscape, which constitutes a legacy from past centuries.
Currently, durum wheat is predominantly cultivated under rainfed conditions [3,4]. Although irrigation can significantly enhance crop productivity by reducing crop exposure to water stress, its expansion is often constrained by local conditions [18] and creates further competition over water resources [19]. Despite this, the implementation of irrigation strategies might be an effective measure to mitigate yield losses and stabilize durum wheat productivity in climate change scenarios [20]. This interconnectedness and interdependence between water resources and food production is recognized in the concept of the “Water-Food” Nexus, which highlights the need to consider these linkages to manage trade-offs and synergies for an efficient and sustainable resource management [21]. Through the lens of the Water-Food Nexus it is possible to evaluate how additional water requirements for irrigation could impact local water resources and identify potential competition with other sectors.
In this framework, this study aims to investigate the impact of climate change on durum wheat productivity in Sardinia, Italy, a prominent region for durum wheat cultivation [22,23], which makes an ideal case study due to its insular characteristics with well-defined geographic boundaries. To reproduce local cultivation conditions in Sardinia, the AquaCrop-OpenSource (AquaCrop-OS) model is calibrated. Durum wheat productivity is simulated for historical and near-future periods, utilizing direct climatic measurements, reanalysis data and seven different climate model projections. Additionally, three irrigation scenarios are investigated to determine the volume of water required to stabilize productivity in the future with a specific focus on their influence on local water resource management.
The paper is structured as follows. Section 2 introduces the crop model utilized, as well as the regional soil characteristics, the calibrated crop parameters for durum wheat cultivated in Sardinia and the climatic input. The bias-corrected climatic timeseries, the crop model simulation results for four different climatic periods and the irrigation requirements to stabilize future productivity are presented in Section 3. Moreover, in Section 4, a detailed discussion on future durum wheat production in Sardinia is provided with a specific emphasis on climatic factors shaping future productivity and on irrigation demand to uphold stable production. Finally, Section 5 summarizes the main conclusions of this analysis and emphasizes the need for further research on the topic.

2. Materials and Methods

2.1. Model Set-Up for Durum Wheat Cultivation in Sardinia

In Sardinia durum wheat is primarily cultivated under rainfed conditions on about 37 thousand hectares [24], with big shares located in the Campidano plain, an important cultivation area of durum wheat [23,25]. The total production per year varies greatly on this Mediterranean island, from values of approximately 50 to 170 thousand tons per year [24].
To reproduce annual durum wheat productivity in Sardinia, the AquaCrop-OS model, the open-source code implementation of the crop model AquaCrop, was calibrated and run using MATLAB R2023a. AquaCrop is a widely utilized crop model, developed by the Food and Agriculture Organization of the United Nations (FAO), with a water-driven growth engine. The model simulates attainable crop yields under both rainfed or irrigated conditions based on water consumption. Transpiration is estimated in a first step and then converted into biomass using the biomass water productivity, a conservative, crop-specific parameter which takes into account the atmospheric evaporative demand and CO2 concentration. Furthermore, the yields of major herbaceous crops are computed as the product of harvest index ( H I ) and biomass. Effects of various stresses, such as soil, water and air temperature stress, on crop growth are represented by stress coefficients ( K s ), which vary from 1 (no stress) to zero (complete stress) and modify the associated model parameters [26]. Water stress effects are separated into four components, including canopy growth reduction, stomata closure, early canopy senescence, and changes in HI. Simulations can be run either in growing degree days (GDDs) or calendar days and are limited to one season’s productivity at a time [27,28]. In contrast, AquaCrop-OS, which is runnable in multiple programming languages such as MATLAB, is able to simulate multiple growing seasons and/or locations at once. However, it does not yet incorporate the effects of soil fertility and soil salinity nor weed management. These factors might be indirectly integrated by adjusting the crop parameters accordingly. In addition to information on crop characteristics, the model requires input on soil attributes, agricultural management (e.g., planting dates and irrigation) and daily weather data [29].
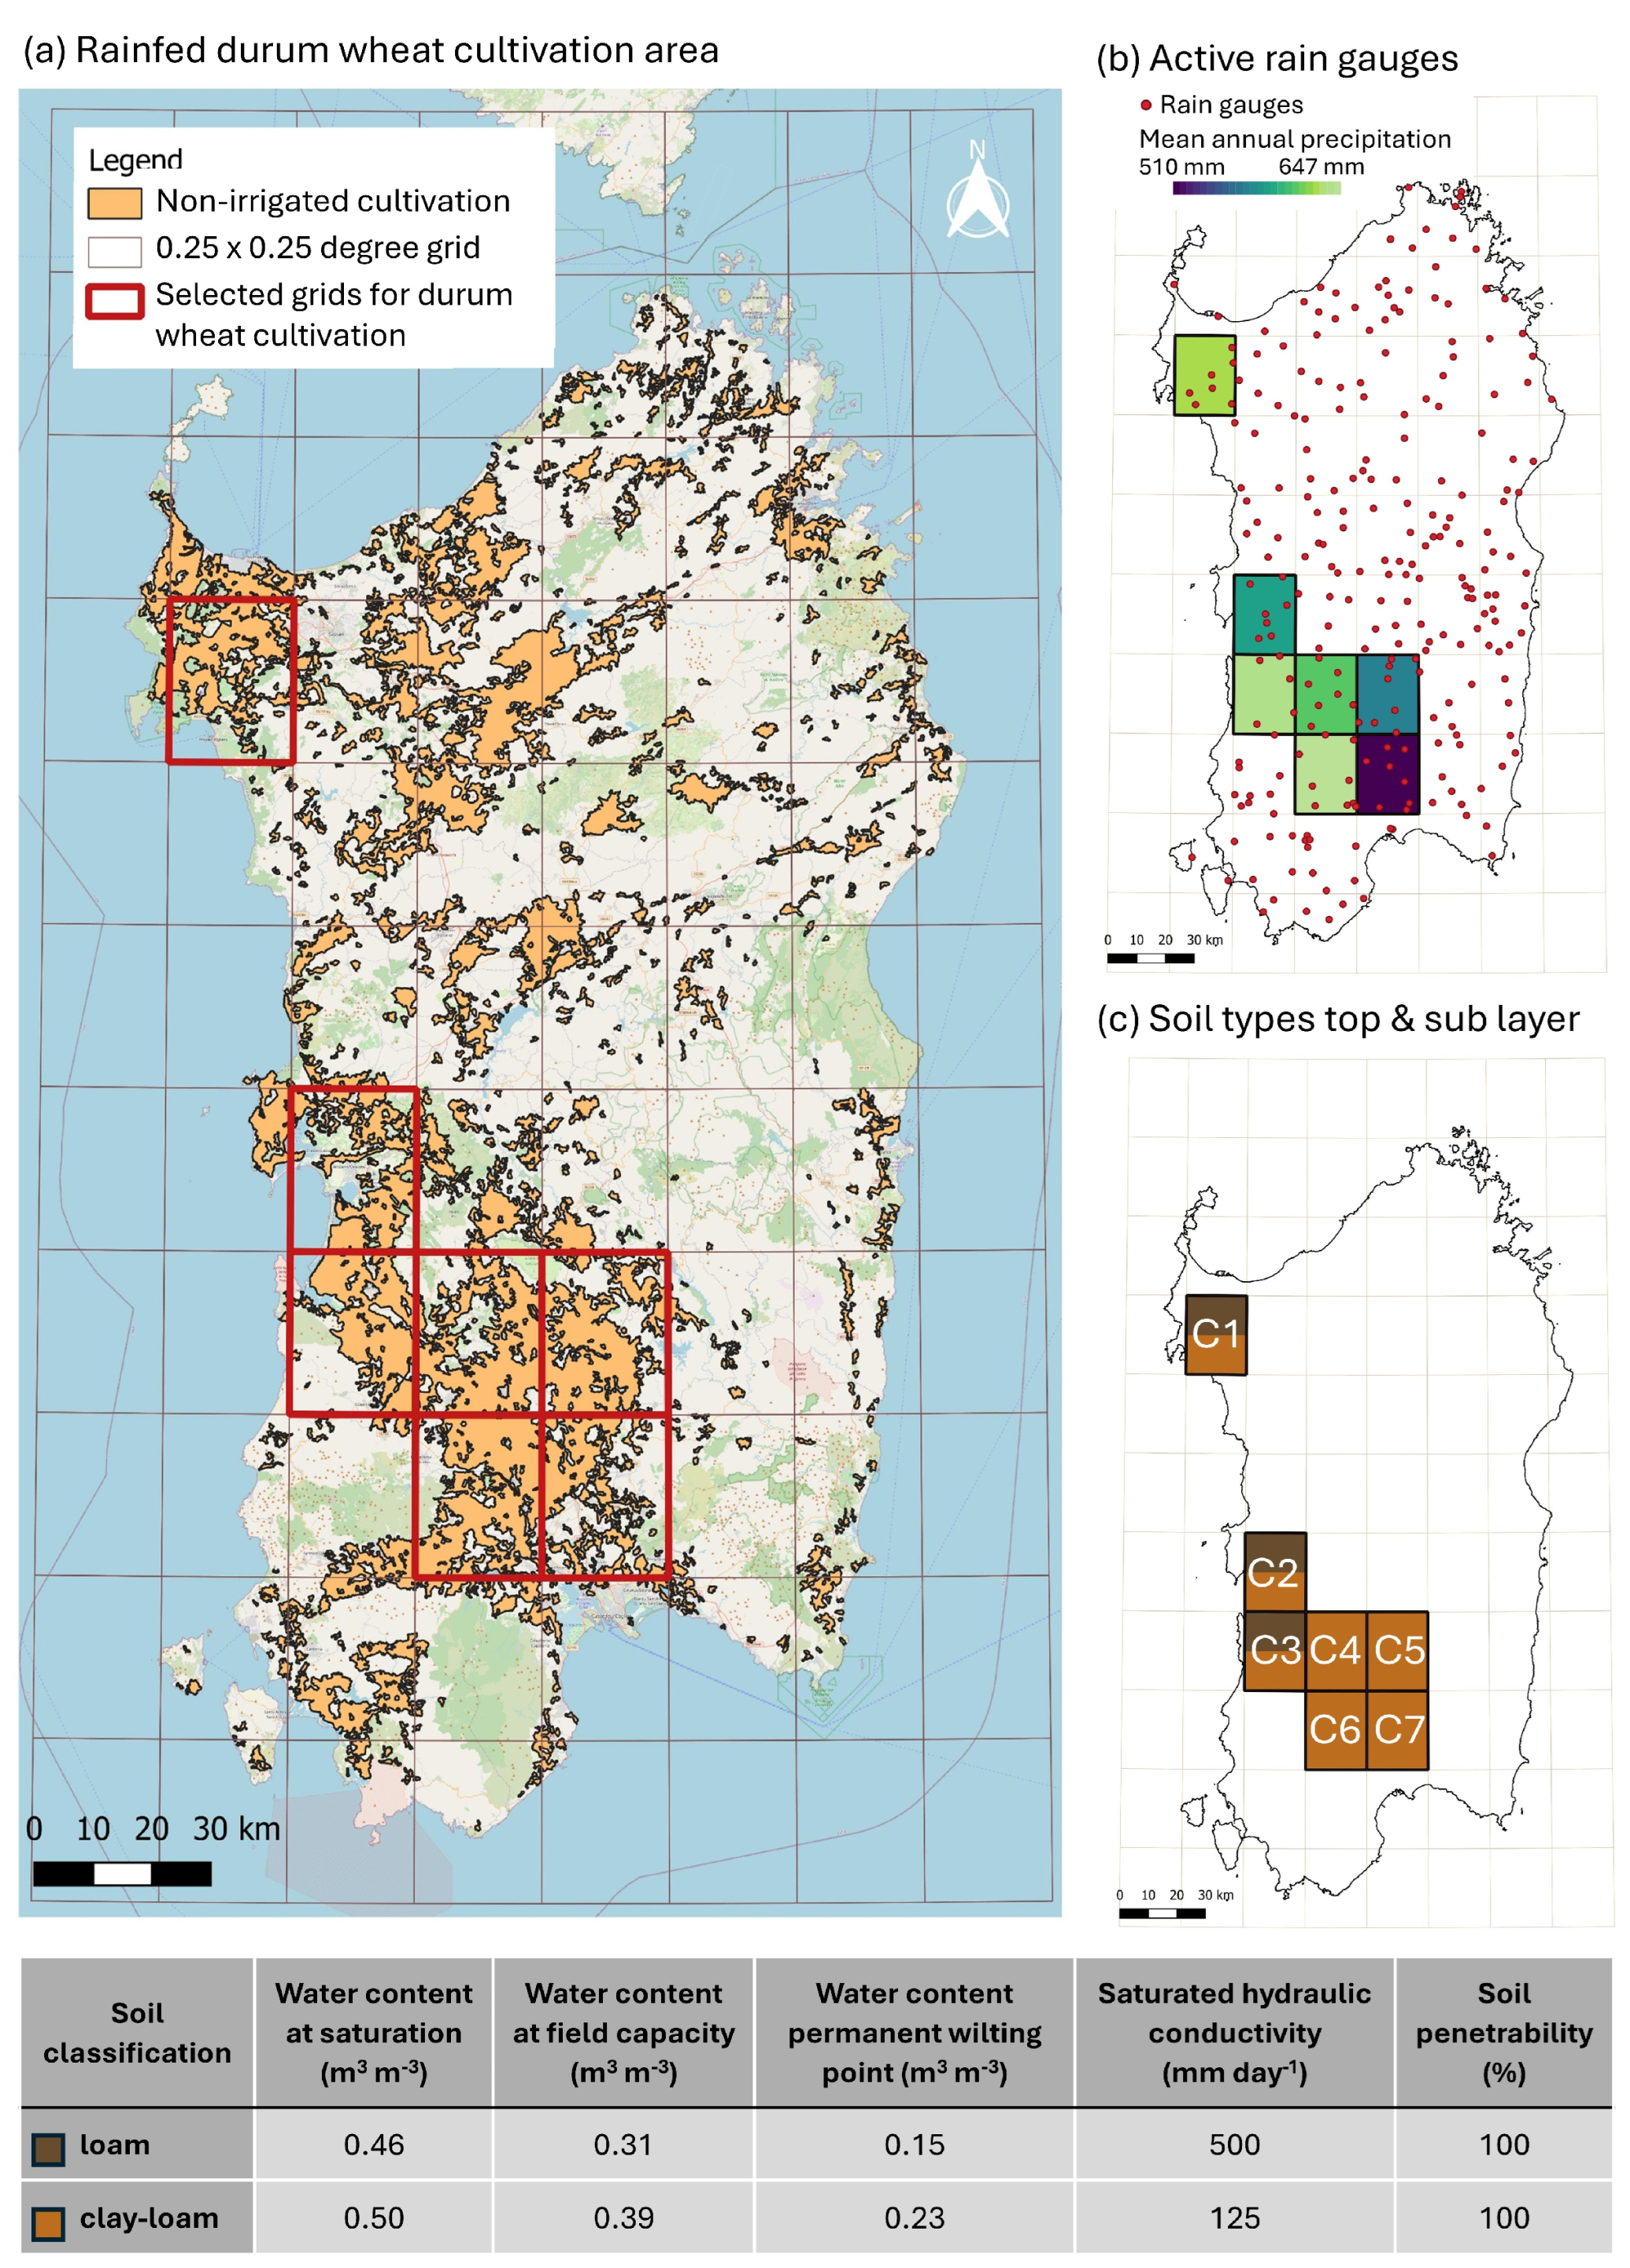
The area of durum wheat cultivation in Sardinia was derived from the CORINE Land Cover database manipulating the non-irrigated agriculture layer [30] and spatializing it into 0.25 degree × 0.25 degree grid cells, as shown in Figure 1a. In total seven grid cells were identified as the main durum wheat growing regions. The grid cells are numbered, as illustrated in Figure 1c, and will be referred to as C1, …, C7. The first cell is located in the north-west of the island, while the other six cells are concentrated in the south-western region, corresponding to the flat area of the Campidano. The composition of the soil was derived from the European Soil Database (with 500 m resolution) [31], which divides the soil into topsoil (0–20 cm) and the subsoil (20–200 cm). The average soil composition of the cultivated area per grid cell was used to identify the soil class according to the FAO soil classification [32] for the top and sub soil and, at the same time, to derive the corresponding soil hydraulic properties including saturated hydraulic conductivity (mm day-1), soil penetrability (%) and water content (m3 m−3) at saturation, field capacity and permanent wilting point. As AquaCrop performs point-based simulations, soil properties were considered homogeneous throughout the individual grid cell. The soil class of the top and sub soil were grouped in two categories (“loam” and “clay-loam”), and a summary of the hydraulic parameters per soil category is reported in the table included in the bottom of Figure 1, while the relative coverage of the two categories in each grid cell is depicted in Figure 1c.
Climatic data required by the AquaCropOS model comprises daily values of carbon dioxide concentration (CO2), precipitation, minimum and maximum temperature (Tmin and Tmax) and reference crop evapotranspiration (ET0). CO2 concentrations were retrieved from the records of the Mauna Loa Observatory in Hawaii, which are directly provided in AquaCropOS. Furthermore, local precipitation timeseries were obtained by Voronoi averages of daily rain gauge records on the seven grid cells for the years 1922 to 2023. Measured daily precipitation data were collected by the network of rain gauge managed by the Hydrological Survey of the Sardinia Region (now in charge of the Agenzia Regionale per la Protezione dell’Ambiente della Sardegna), as illustrated in Figure 1b. The annual mean rainfall depth in the seven cells varies between 520 mm and 640 mm, with a strong seasonality reflecting the typical Mediterranean behavior of Sardinian climate, characterized by most of the precipitation occurring in winter (between the months of October and March) and warm and dry summers.
Daily Tmin and Tmax data were obtained from ERA5-Land dataset, a high-resolution land-surface reanalysis produced by the European Centre for Medium-Range Weather Forecasts (ECMWF). ET0 was computed using the Penman–Monteith method, based on temperature, humidity, wind speed and solar radiation data from the same dataset. ERA5-Land is generated by rerunning the land component of the fifth-generation ECMWF reanalysis system (ERA5) at enhanced spatial resolution (9 km, 0.1° × 0.1°) while being uncoupled from the atmospheric assimilation cycle. The dataset spans from 1950 to nowadays and benefits from consistent land-surface modeling, data assimilation of land variables, and updated meteorological forcings [33]. For Sardinia’s Mediterranean climate, the selected climate variables (minimum and maximum temperature and reference crop evapotranspiration) from ERA5-Land are generally sufficiently accurate for regional crop modeling and trend analysis, as evaluated by Vanella, et al. [34]. The ERA5-Land dataset was made compatible with the 0.25 degree × 0.25 degree grid, employed in this study, using a nearest-neighbor approach.
Furthermore, for the calibration of the crop model, durum wheat yield data was taken from the Italian National Institute of Statistics (ISTAT) [24] for the years 2006 to 2023. The database provides yearly data on the cultivation area and production of durum wheat in Sardinia, which was used to calculate the annual yield. The yield values vary between 1.72 t/ha and 3.15 t/ha with a mean value of 2.33 t/ha. To account for the differences in area per grid cell, the respective productivity was weighted accordingly when calculating the total productivity per year. The timeseries for precipitation, Tmin, Tmax, and ET0 were cut to the same timeframe for the calibration.
In terms of agricultural management, AquaCrop-OS requires the date of crop sowing for each year of the simulation period, as well as information on irrigation management. To establish an adequate sowing date for durum wheat, a climatic criterion was adopted. In the Mediterranean it is common practice to schedule sowing based on rainfall. Starting from the 25th of November a minimum antecedent rainfall of 20 mm on six consecutive days was set as criteria for sowing to guarantee sufficient soil moisture conditions in accordance with the typical sowing period of the region [22]. Regarding irrigation, AquaCrop-OS distinguishes between rainfed and irrigated conditions. The crop model provides different irrigation methods including net irrigation and irrigation based on fixed intervals, soil moisture status or a pre-defined timeseries [29]. The net irrigation option calculates the water amount required to mitigate (a certain level of) water stress [35]. As mentioned before, in Sardinia durum wheat is predominantly cultivated under rainfed conditions and the initial model configuration was therefore set to ‘rainfed’. In a subsequent phase of the analysis, three additional irrigation scenarios were assessed utilizing the ‘net irrigation’ option. In the first scenario irrigation is always applied to guarantee optimal production. Conversely, the second and third scenarios involve irrigation only during years in which productivity would drop below a predetermined threshold if no irrigation was applied. These thresholds were based on the mean value and the 25th percentile, respectively, of the yields based on the measured climatic input.

2.2. Crop-Data Calibration

In terms of crop input parameters AquaCrop distinguishes between so-called conservative parameters and cultivar-specific parameters [28]. While the first are provided by AquaCrop as default values and do not change with geographic location, time or management practices, the latter depend on environmental conditions and must be calibrated by the user. The parameters with the greatest influence on the model outcomes were identified via sensitivity analysis and comprise the reference harvest index ( H I ), the crop decline coefficient ( C D C ), the crop growth coefficient ( C G C ), the number of plants per hectare and the length of the different growing stages. The other parameters were directly taken from the default crop file for wheat provided by AquaCrop and the literature [22,36,37,38]. The model was run in GDDs, and the lengths of the individual growing stages were taken from the literature and from experience. The remaining four key crop parameters, i.e., HI, CDC, CGC and number of plants per hectare, were adjusted employing a Monte Carlo Calibration for each of the seven selected grid cells separately based on durum wheat yield records [24]. Furthermore, three years had to be excluded from the calibration since additional irrigation was applied due to low rainfall and the information regarding the amount of irrigation is missing. Within each calibration step, the root mean square error ( R M S E ) was used as indicator to evaluate the accuracy of a model’s predictions. Mathematically this metric is expressed as:
R M S E =   ( i = 1 n ( x s i m i     x o b s i ) 2   / n
where x s i m i and x o b s i refer to the simulated and observed yield data in the i -th year and n is the number of samples. The model performance can be considered acceptable if the value of the R M S E approaches zero. For the calibrated model, the R M S E varied between 0.36 t/ha and 0.4 t/ha across the individual grid cells and amounts to 0.33 t/ha for the average yield of Sardinia. These values are comparable to the R M S E reported for durum wheat simulations in previous research utilizing the AquaCrop model, ranging from 0.2 t/ha to 1.01 t/ha [36,37,39]. The calibrated AquaCrop crop parameters for durum wheat are presented in Table 1.
The scenario data used in this study were downloaded using the Open-Meteo [40] Climate-API, that uses regional climate models from the High-Resolution Model Intercomparison Project (HighResMIP) group, developed as part of the Coupled Model Intercomparison Project Phase 6 (CMIP6) initiative. The API provides downscaled climate data at a 10 km resolution, allowing for regional comparisons to assess the impacts of climate change on sectors like agriculture and public health. The HighResMIP protocol focuses on high-resolution climate simulations and outlines three primary tiers of experiments, with a central emphasis on the period 1950–2050, which includes both historical and future projections, relevant for climate policy and decision-making [41].
  • Tier 1 consists of forced-atmosphere runs (1950–2014) using high-resolution SST and sea ice data [42], designed to replicate current climate conditions with minimal tuning.
  • Tier 2 involves coupled model runs for the period 1950–2050, including control simulations (100 years with 1950s forcing), historical simulations (1950–2014), and future projections (2015–2050).
  • Tier 3 expands the forced-atmosphere simulations to future climate scenarios (2015–2050 or up to 2100) to study potential climate impacts under various greenhouse gas pathways [41].
This analysis is based on a subset of seven coupled climate models from the CMIP6 HighResMIP Tier 2 experiment. This selection was driven primarily by the availability and accessibility of complete daily outputs for the experiments on Earth System Grid Federation (ESGF) nodes. Although the HighResMIP archive includes more contributions, the models chosen represent a heterogeneous set of models and centers that ran them and provided the specific high-resolution daily variables needed for this study. The seven model projections used are referred to as M1, …, M7. For a detailed overview of the models, their main components and the modeling consortium, including relevant bibliographic references, see Table A1 in Appendix A. All data presented closely align with RCP8.5. Although other models consider various emission scenarios, according to the IPCC’s Sixth Assessment Report, all emissions scenarios result in similar warming until about the mid-century [43]. It is only after this point that projections become strongly dependent on the chosen emission scenario.
Furthermore, the CO2 concentration records of the Mauna Loa Observatory in Hawaii were again used for the historical and future timeframes. The CO2 concentration rose from 398.81 ppm in 2014, the last actual measurement, to 572.57 ppm in 2099.
Climate model scenarios are subject to non-negligible systematic errors, as widely recognized and documented in the literature [44]. Consequently, rainfall and temperature variables from the models were bias-adjusted using the linear correction method [45,46]. The bias of the mean monthly rainfall was corrected by a multiplicative shift based on the rain gauge records from the seven sub-areas for the entire period 1922–2023:
x i , m = x i , m × ( x ¯ o b s , m / x ¯ s i m , m )
where x i , m and x i , m represent the uncorrected and corrected model rainfall on day i and month m (m = 1, …, 12) respectively, and x ¯ o b s , m and x ¯ s i m , m refer to the long-term m-th monthly mean rainfall from observations and the models’ historical rainfall data (1950–2023).
Modeled maximum and minimum temperature was bias-adjusted via additive correction. For each month the mean bias was calculated and then added to the daily model data:
x i , m = x i , m + ( x ¯ o b s , m x ¯ s i m , m )
with x i , m and x i , m referring to the raw and corrected temperature on the i -th day and m -th month, respectively, and x ¯ s i m , m to the mean historical m -th monthly temperature from the models. Here, the observed mean m -th monthly temperature x ¯ o b s , m   was calculated based on daily data from ERA5-Land [33]. Hereafter, when mentioning model precipitation and temperature values, it is specifically referred to the bias-corrected data.

3. Results

3.1. Analysis of Climatic Projections

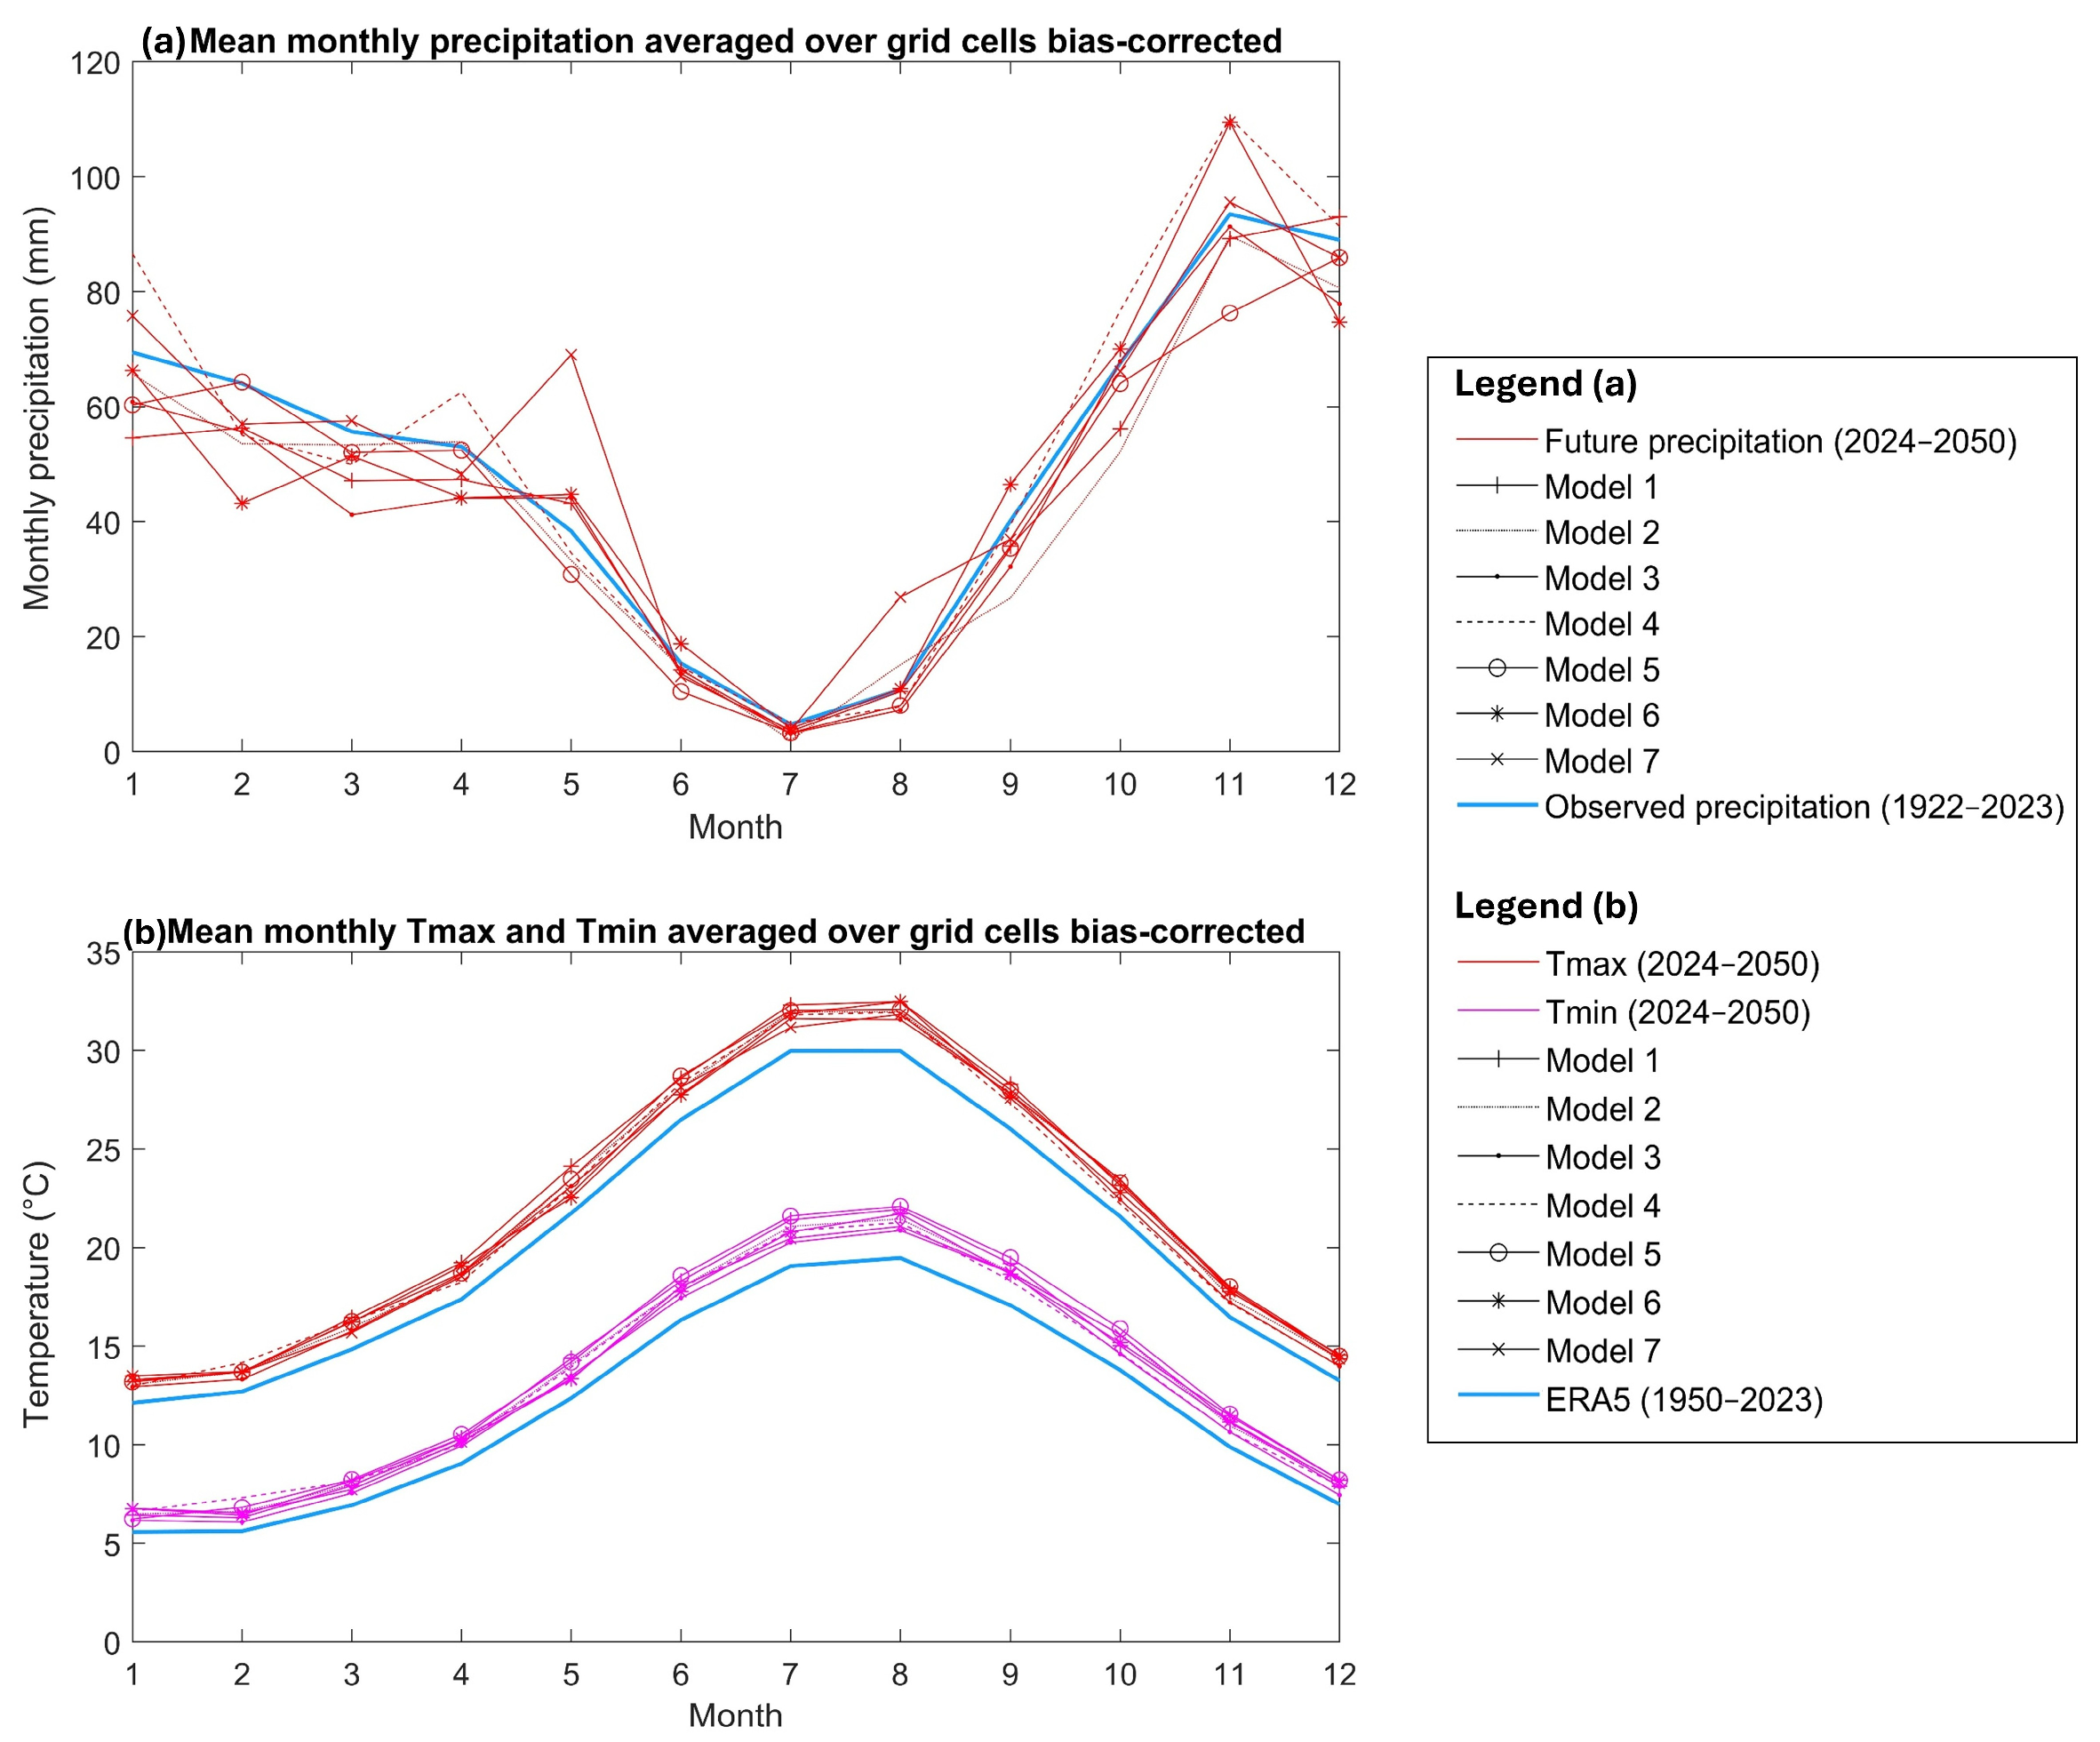
Comparing the mean monthly precipitation depth of the seven models for the future period (2024 to 2050) to the monthly means of the observations, as displayed in Figure 2a, reveals quite different trends throughout the year. In some months, such as February and March, precipitation is projected to be lower than measured conditions in almost every model, whereas for other months, in particular the rainy months November and December, rises and decreases are predicted depending on the model. Moreover, differences even larger than 20 mm in monthly means between models can be observed, for example between M5 and M7 in May and between M5 and M4 in November.
A more discernible trend becomes apparent when comparing the future monthly averages of minimum and maximum temperatures from the models with those of the ERA5 data, as illustrated in Figure 2b. Rising temperatures can be observed throughout the year for each month in every model. The highest increases are found in the summer months, especially in August with an average of 2.1 °C in maximum temperature and 2 °C in minimum temperature. In the winter period the increase is lower, amounting to about 1 °C on average.
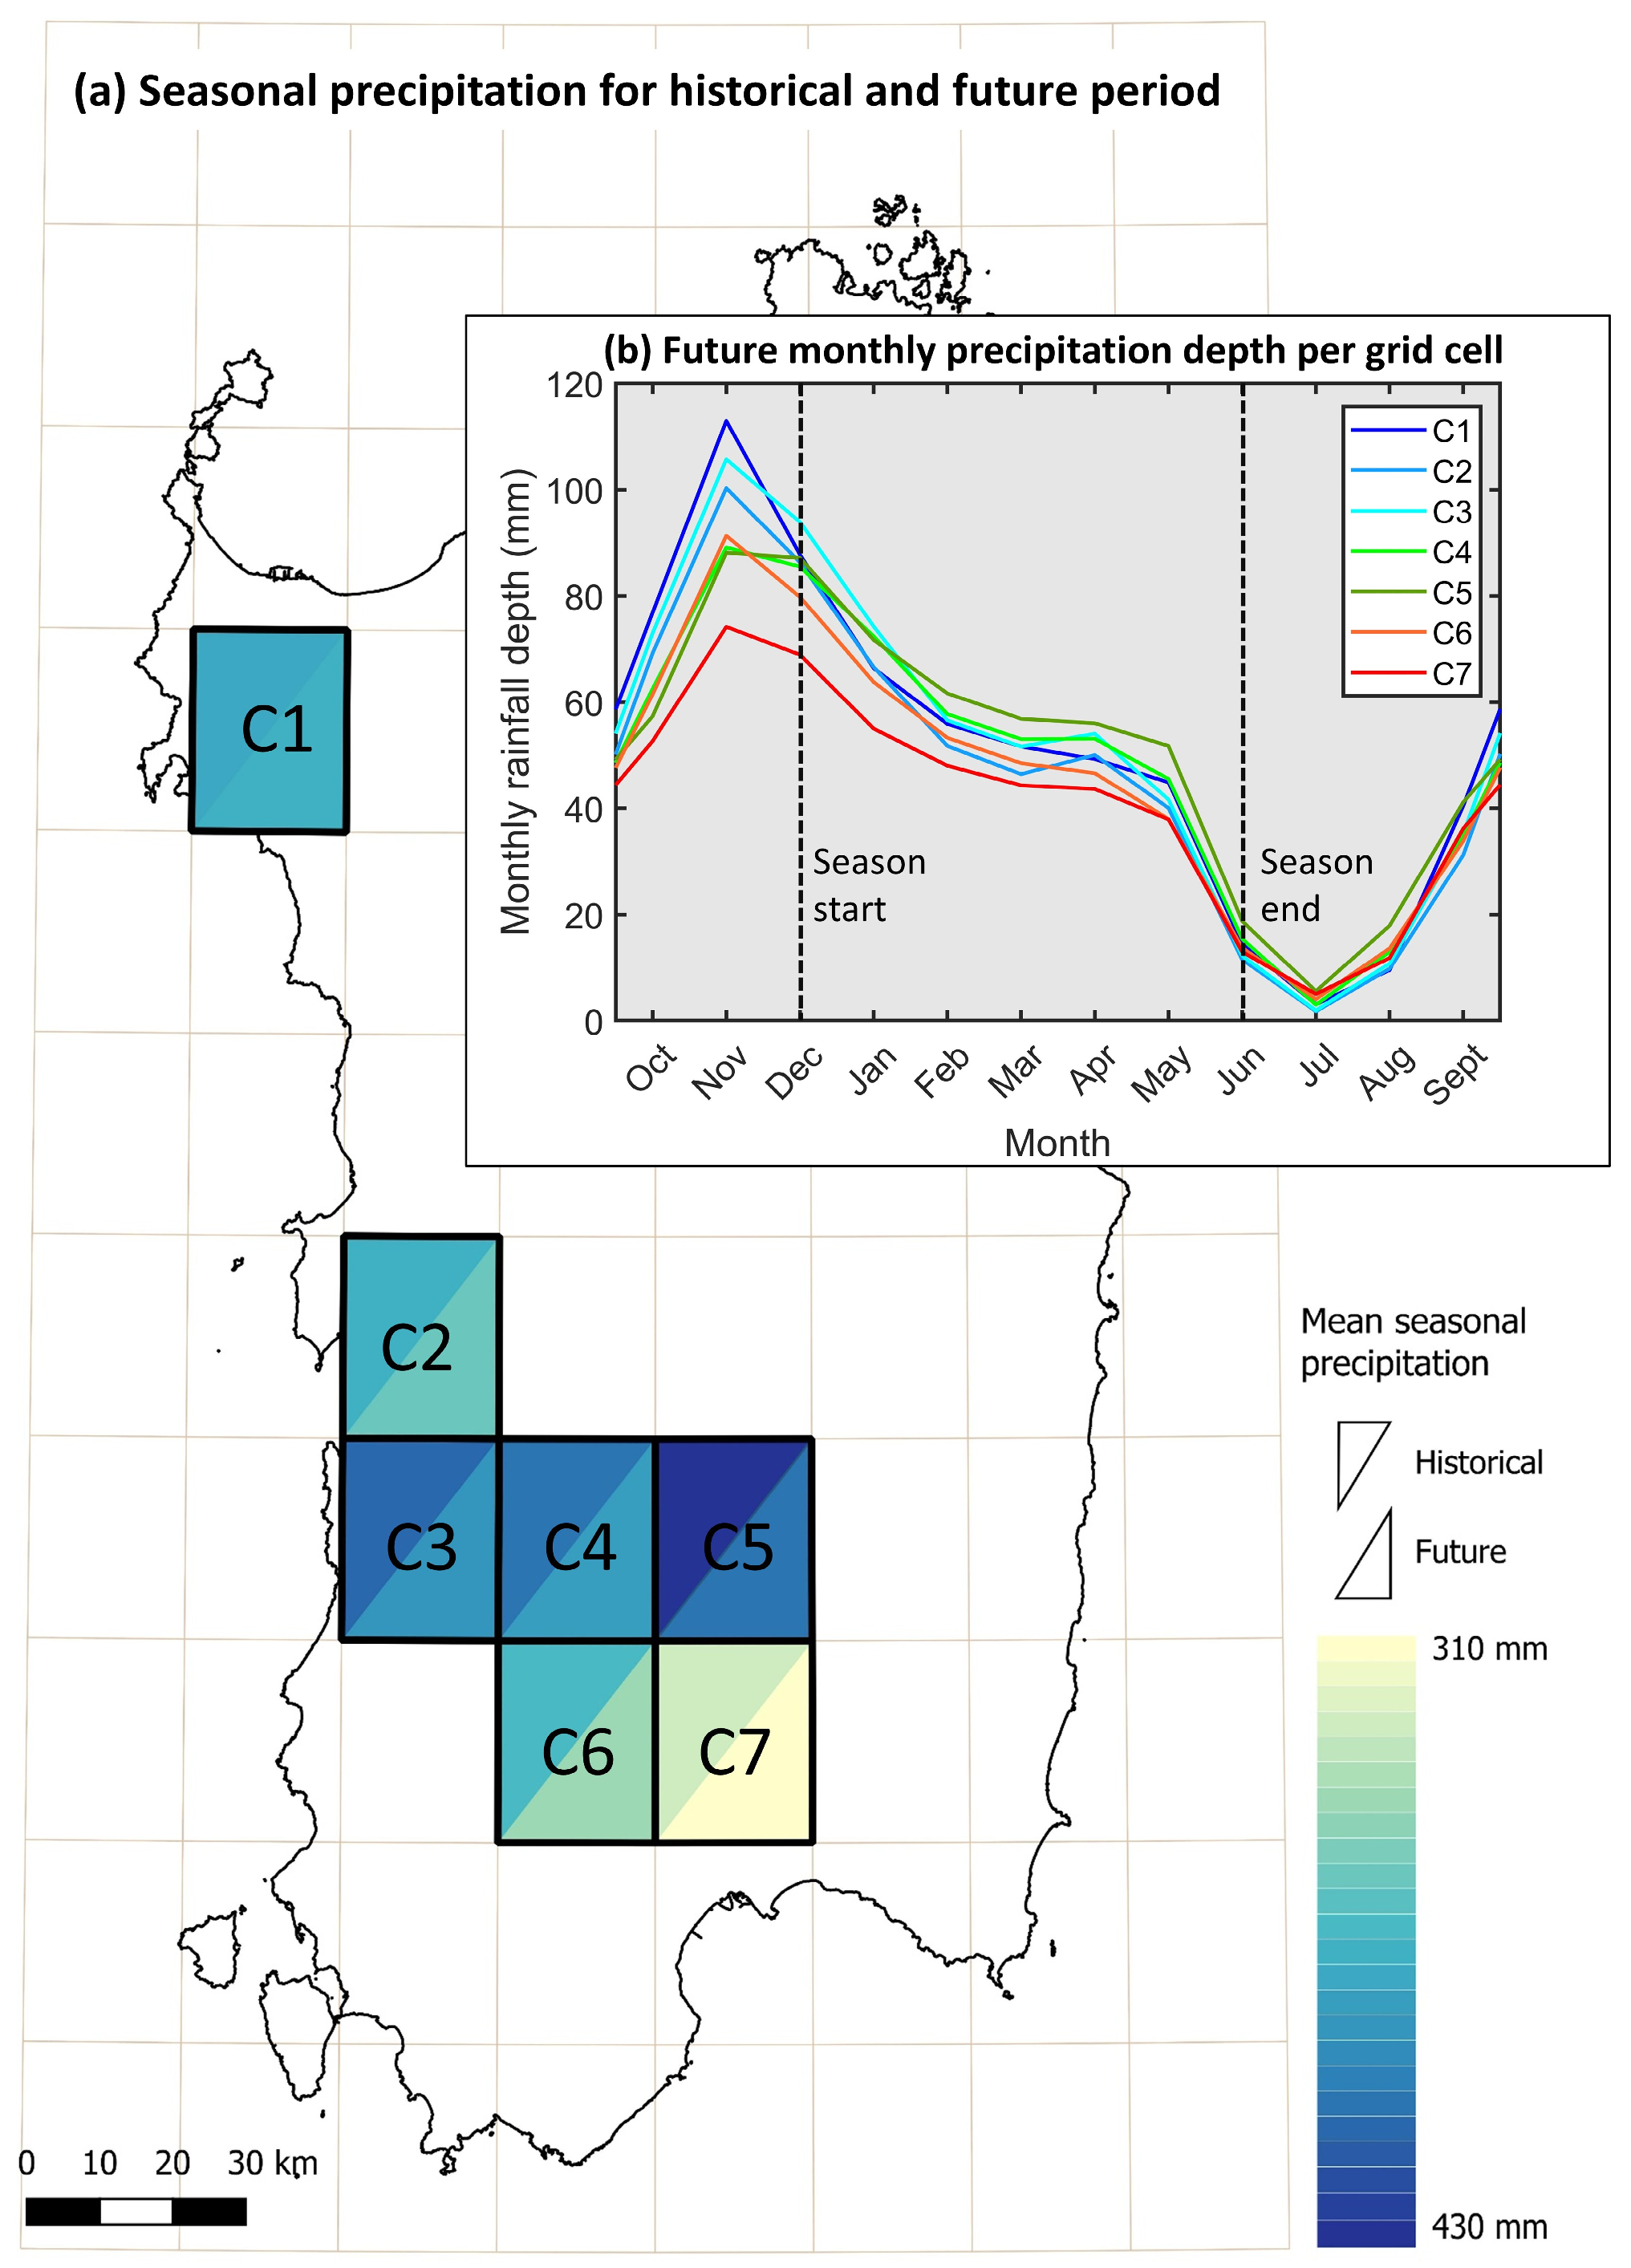
Additionally, the variations in rainfall patterns are examined across the different grid cells. Given that durum wheat productivity is dependent on the precipitation during the growing season and in the immediate pre-planting period, a focus is put on this critical timeframe. In Figure 3a, the mean precipitation of the durum wheat season, going from December to June, is presented for the historical (upper-left triangle) and the future (lower-right triangle) period. For all seven grid cells a decrease in rainfall depth can be observed, more pronounced towards the south. Interestingly, C5 and C7, both located in the south and sharing a boarder, show the highest and lowest seasonal rainfall depth, respectively, for both time windows. Furthermore, the future monthly rainfall depth per grid cell is illustrated in Figure 3b, again revealing November and December as the highest rainfall months and June to August as the low-rainfall season. C7 receives the lowest rainfall for every month during the durum wheat growing season. While in the beginning and directly before the start of the season C1, C2 and C3 have the highest precipitation, C5 leads the rest of the season.

3.2. Durum Wheat Response to Climate Change

The response of durum wheat productivity to future climatic conditions is evaluated comparing simulated annual yields derived from three climatic timeseries. The first one is composed of a combination of ground observation rainfall and ERA 5 reanalysis temperature and ET0 data. It covers the period 2006 to 2023 and is referred to as ground and reanalysis, GR (2006–2023), timeseries. The second and third timeseries come from the climatic model historical, HCM (1950–2023), and future, FCM (2024–2050), projections. Outputs from model runs with HCM (1950–2023) forcing are investigated for the entire period, as well as over a more recent interval from 2006 to 2023, which corresponds to the duration of the measured input data and will in the following be referred to as HCM (2006–2023). Additionally, the yields are averaged over the seven grid cells, weighted according to cultivation area. This offers a general overview of the effects of climate change on durum wheat productivity in Sardinia and will enable us to evaluate the impact on water resource management at regional level.
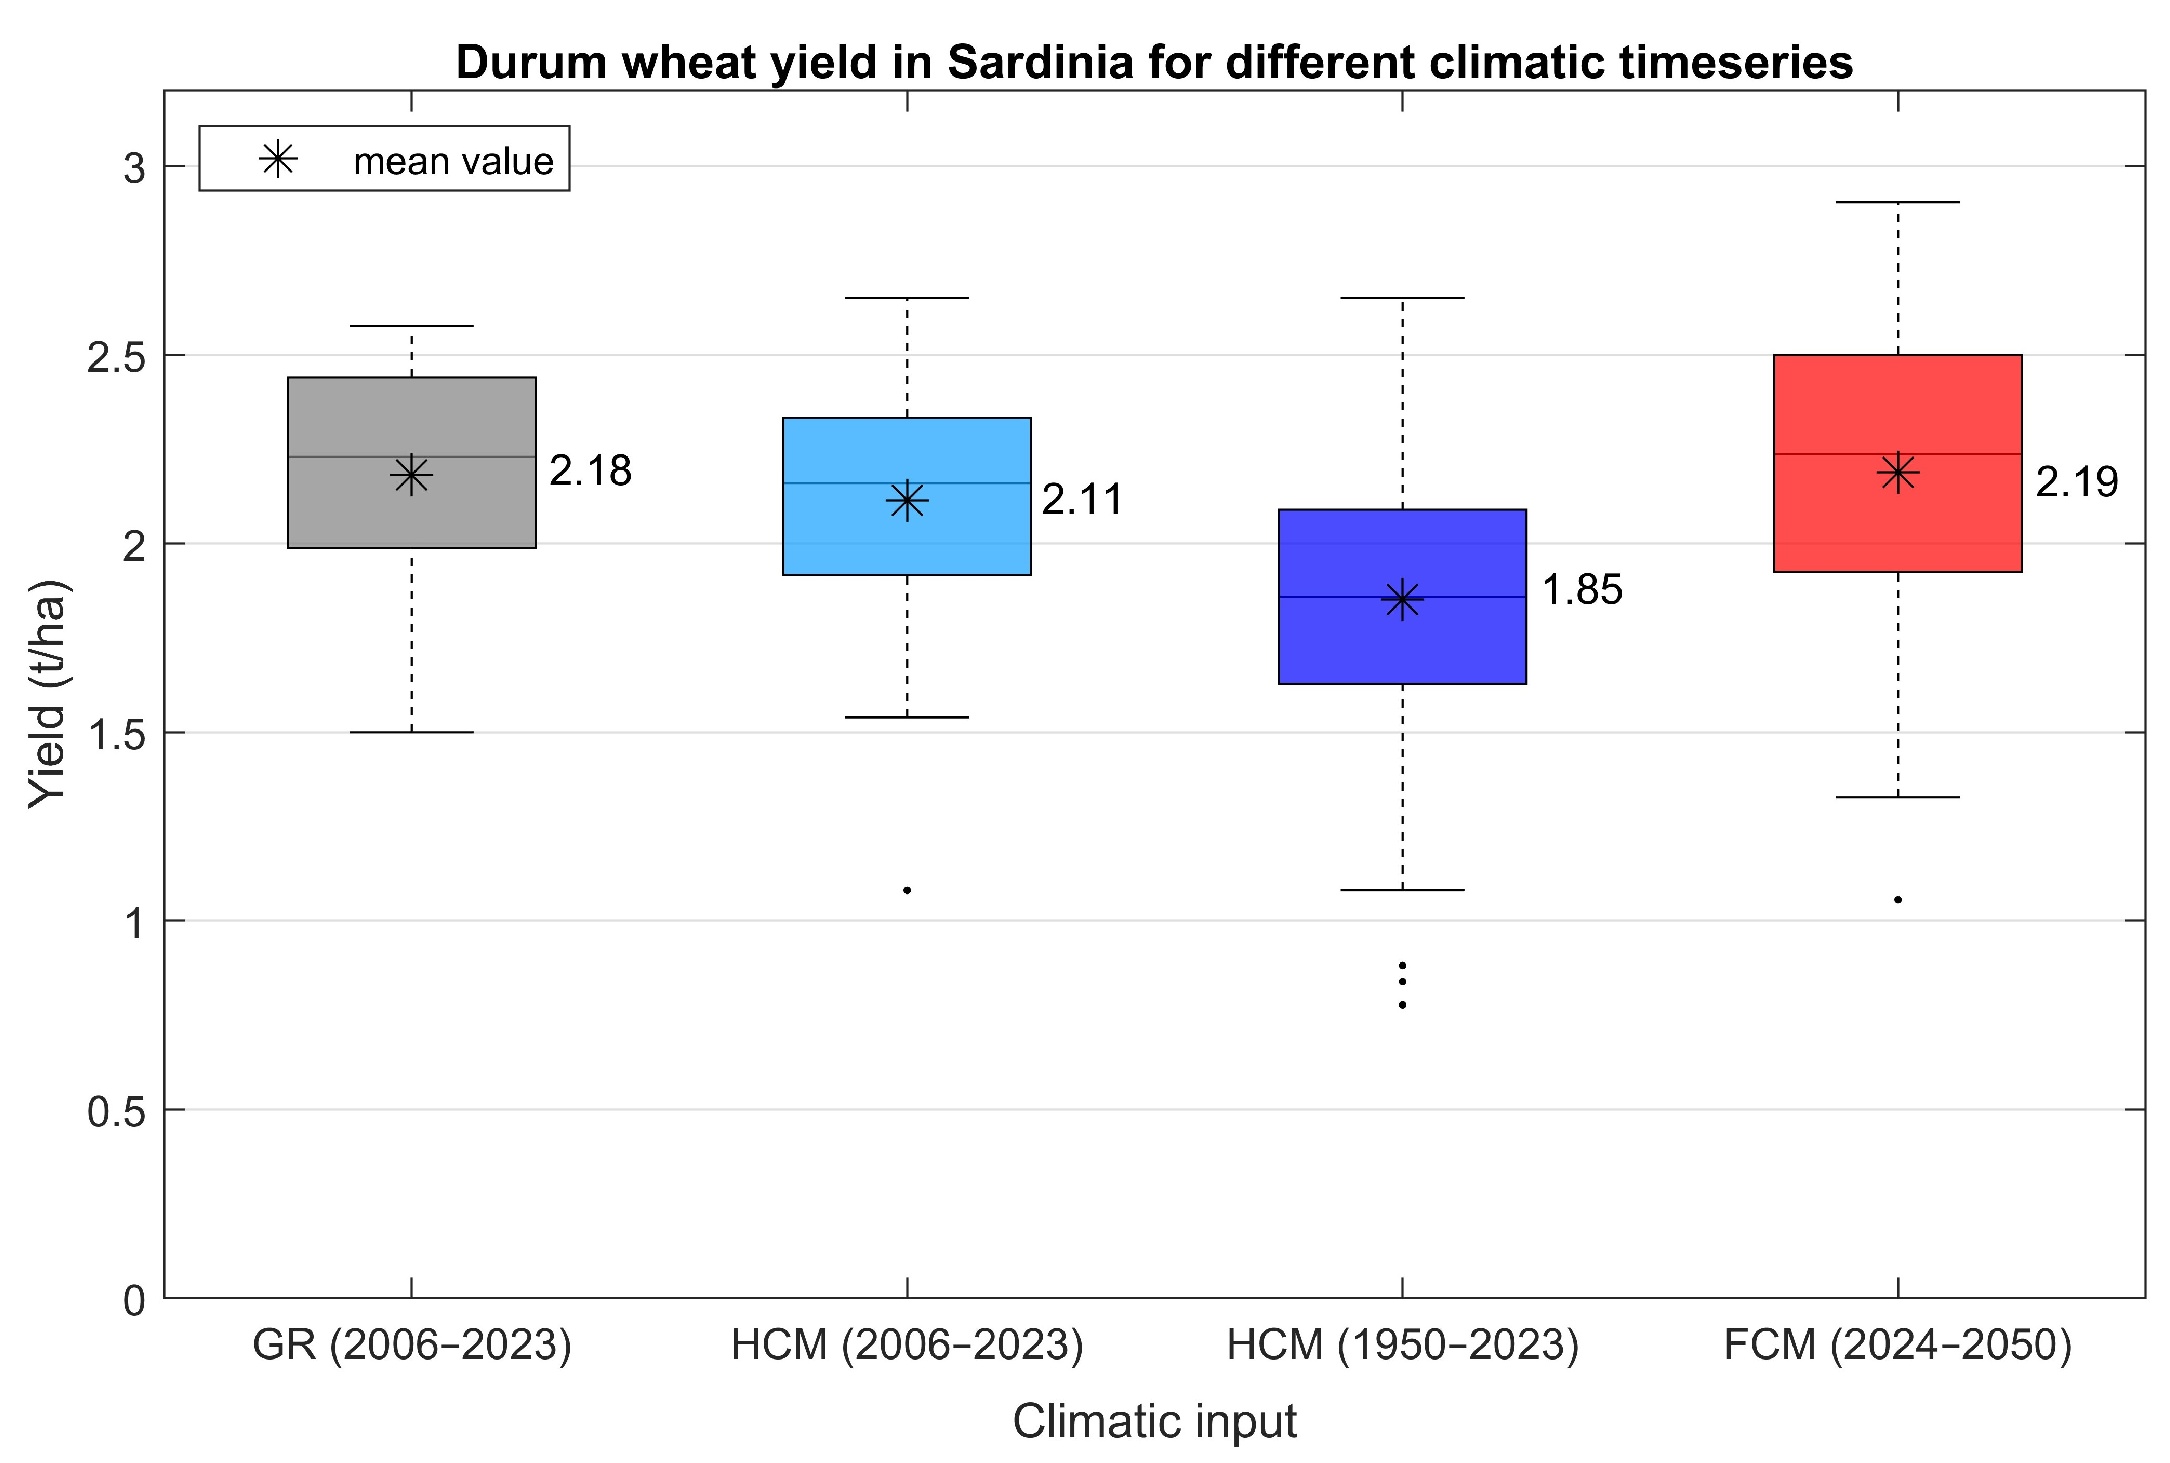
Crop productivity is presented in Figure 4, where the boxplots illustrate the spatial and temporal variability of the annual durum wheat yield in Sardinia for the different climatic timeseries. Additionally, the mean productivity for each simulation is marked with a star-symbol. The overall picture of the results reveals an increase in the average yield of durum wheat over time, already perceivable in the past decades when comparing HCM (1950–2023) and HCM (2006–2023), and continuing in the future. For HCM (1950–2023) the average yield amounts to 1.85 t/ha and increases up to 2.11 t/ha for HCM (2006–2023). The average productivity for GR (2006–2023) reaches the value of 2.18 t/ha and shows an internal variability quite close to the simulated yields from the recent historical input. In the future, for FCM (2024–2050), mean productivity is projected to slightly rise to 2.19 t/ha. Moreover, simulations for HCM (1950–2023) and FCM (2024–2050) show a higher internal variability in yield distributions as well as an increase in outliers compared to the other two timeseries. This might be due to the different length of the time intervals, especially in case of HCM (1950–2023). However, the disparity in length between FCM (2024–2050), HCM (2006–2023) and GR (2006–2023) is not significant, suggesting that this factor might only partially contribute to differences in internal variability and increases in outliers. This implies that the expected low increase in productivity is likely to be accompanied by a rise in the incidence of crop failures, compared to the recent historical yields.
The occurrence of crop failure is further investigated, considering all the individual simulations for both historical and future climatic conditions, for each considered grid cell and climate model. In the historical period spanning from 1950 to 2023, yields equal to zero were recorded in 29 instances out of 3626 simulated yield events, representing 0.8% of total yield occurrences. In contrast, during the projected period from 2024 to 2050, yields equal to zero are observed in 19 instances out of 1274 simulated yield events, corresponding to 1.5% of total yield occurrences. This analysis indicates that the probability of crop failure nearly doubles when comparing the historical and future timeseries. This finding suggests that while future productivity is expected to slightly increase or remain almost the same, there will also be a concomitant rise in the frequency of crop failures.
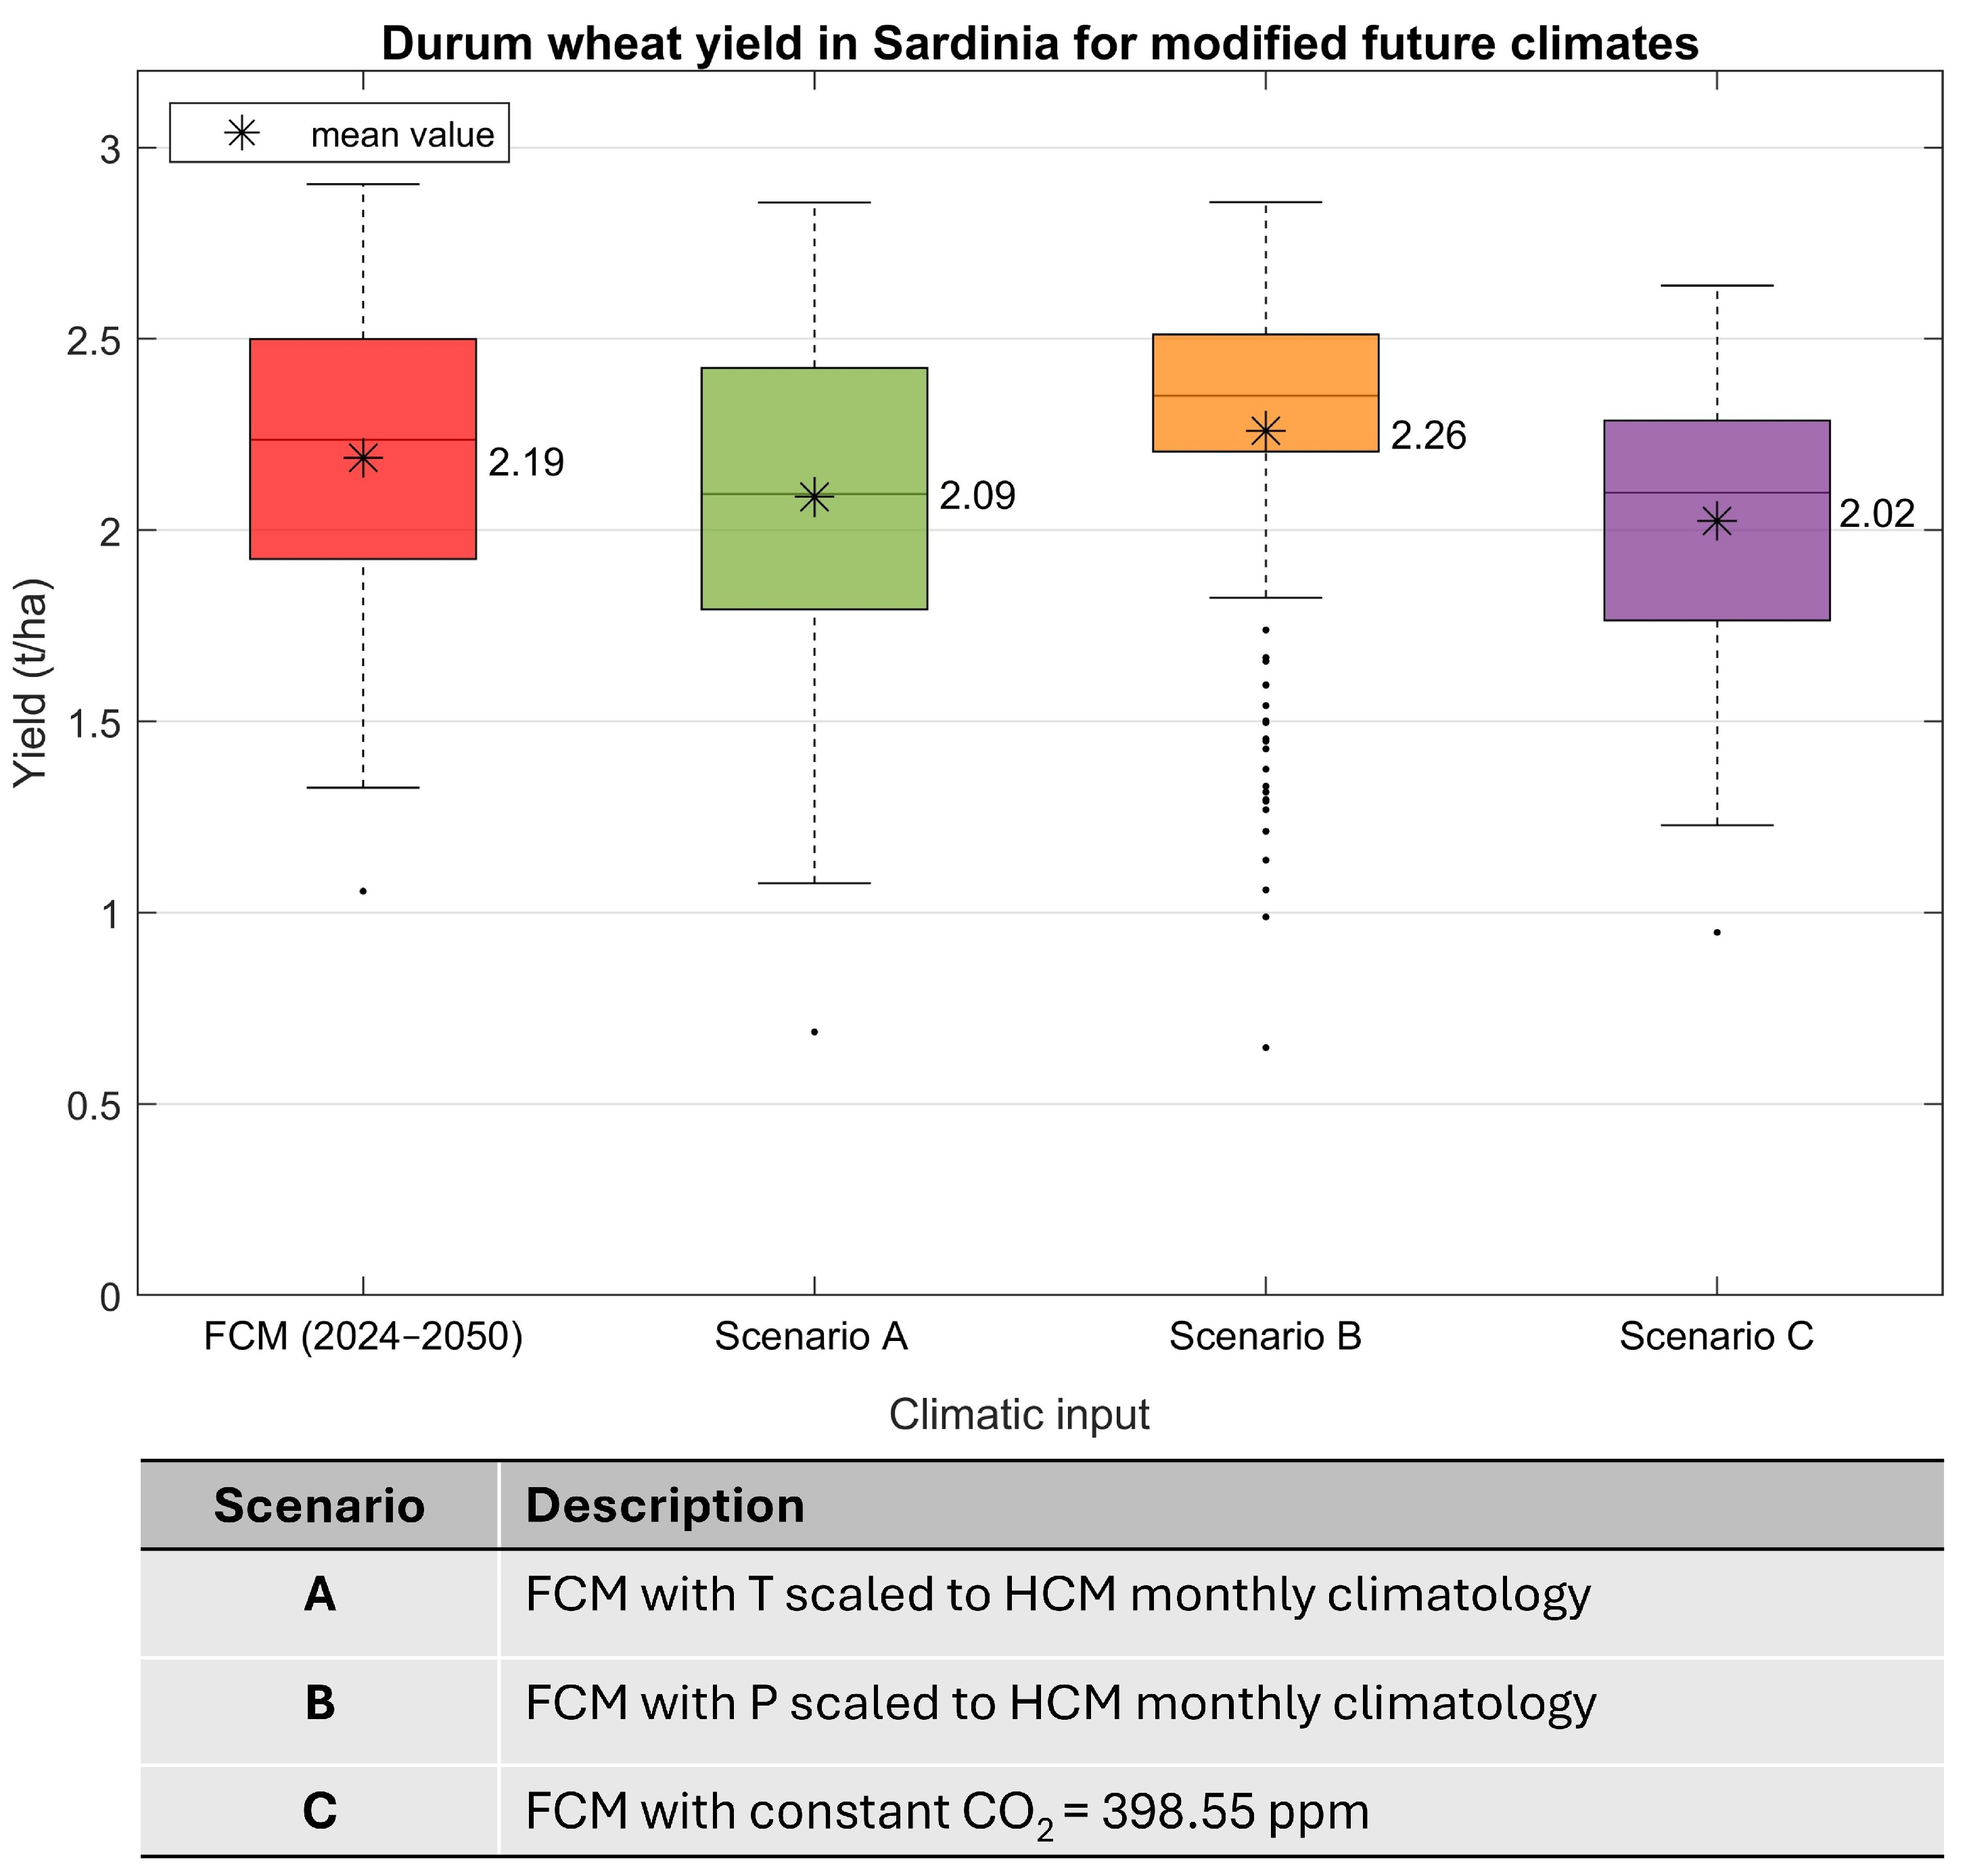
Since only the climatic input differs between the simulations, while the residual parameters are kept constant, the differences in the model output can clearly be linked to the changes in climatic conditions and sowing dates. To better understand the extent of influence of the individual climatic parameters, in particular precipitation, temperature and CO2 concentration, the crop model is rerun with three new climatic scenarios, in each of which only one climatic input is modified. In Scenario A the temperature timeseries of M1 to M7 from FCM (2024–2050) are scaled to the monthly climatology of the corresponding model (M1 to M7) from HCM (1950–2023), while the other climatic parameters remain unchanged. Furthermore, in Scenario B the same adjustment is applied to the rainfall timeseries of M1 to M7. For Scenario C the CO2 concentration is kept constant at 398.55 ppm, which corresponds to the last measured value from the Mauna Loa Observatory dataset, while the other parameters come from FCM (2024–2050).
The comparison of the mean yield values of the FCM (2024–2050) with the values of the three scenarios, as presented in Figure 5, reveals an overall decrease in yields for scenarios involving modified temperature and constant CO2, suggesting that future temperature and CO2 conditions might be beneficial for durum wheat yields. The decrease is more distinct in the case of the constant CO2, where not only the average yield drops to 2.02 t/ha, compared to 2.19 t/ha, but also the maximum value is 0.26 t/ha lower than that of the unmodified simulations. Additionally for Scenario A, the scenario with altered temperature, an increase in the internal variability can be noticed. On the contrary, the modification of the precipitation in Scenario B results in an enhancement in productivity with a lower internal variability, indicating that future changes in precipitation pattern are acting as the main constraint for durum wheat productivity.
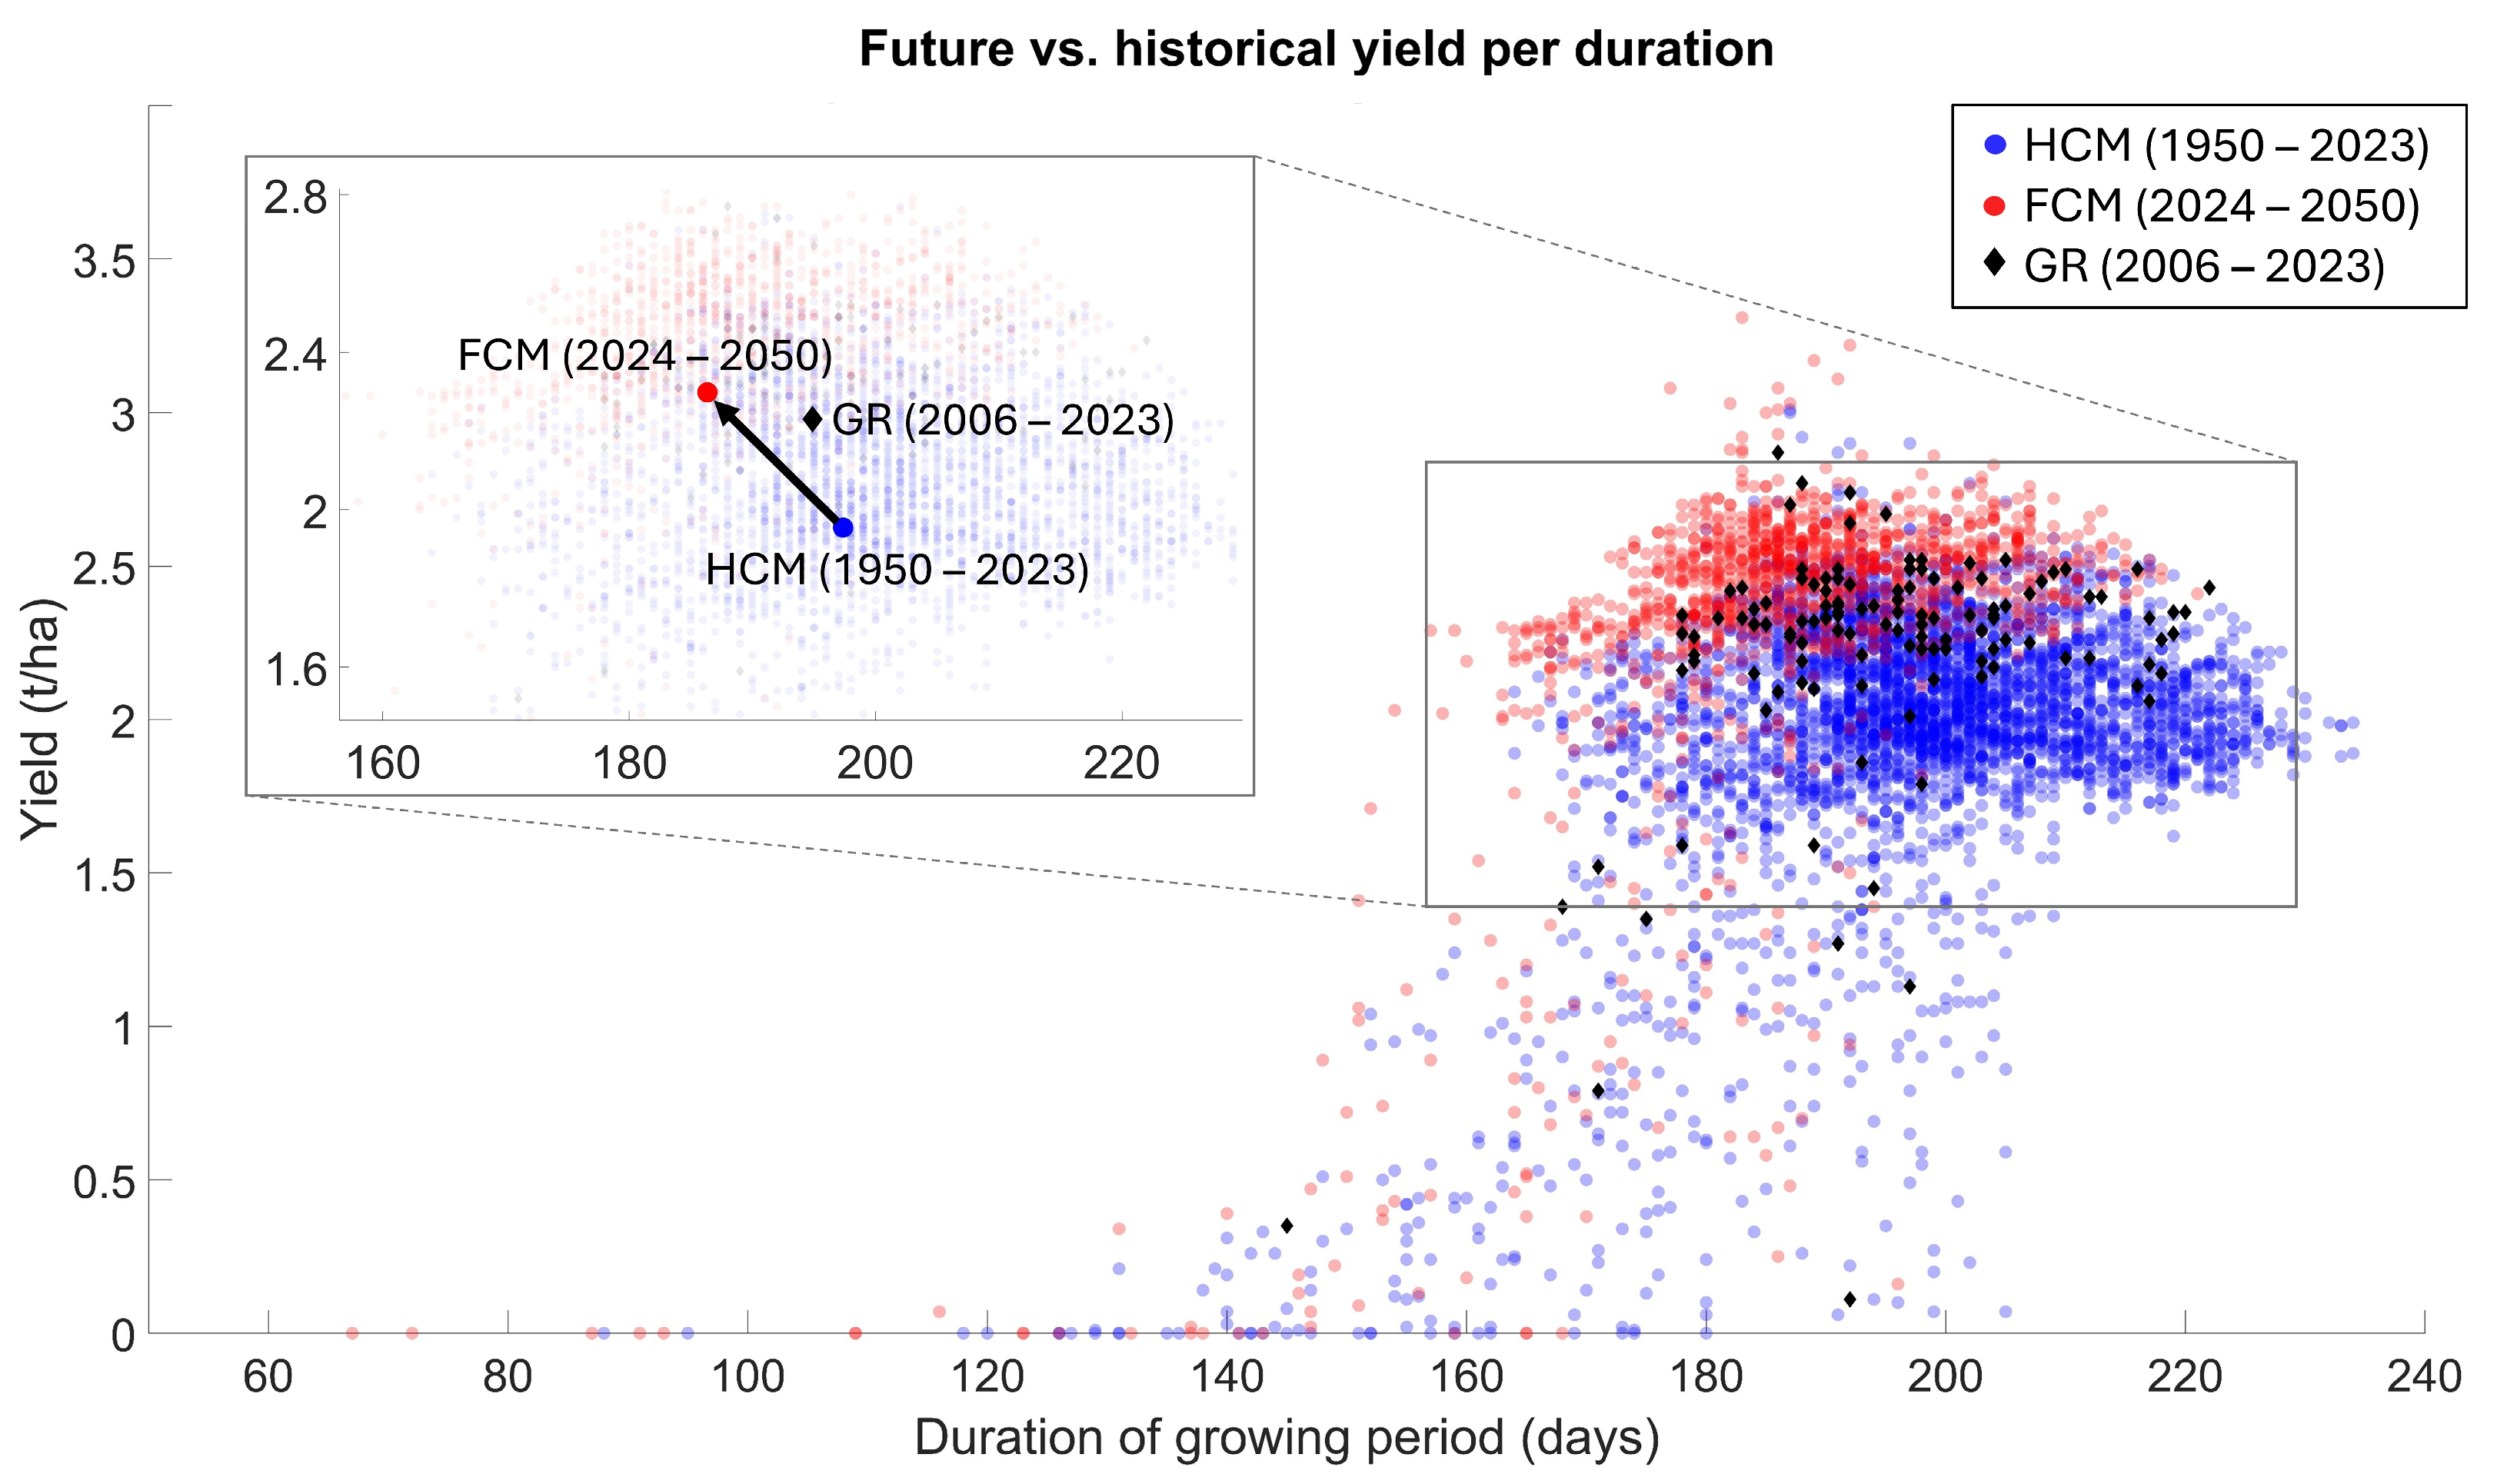
Moreover, the change in length of the growing period for the different timeseries is examined in relation to the productivity. Figure 6 illustrates that relationship for HCM (1950–2023), FCM (2024–2050) and GR (2006–2023). Other than in Figure 4 and Figure 5, each grid cell’s values are taken into account separately without averaging over the island. Comparing HCM (1950–2023) and FCM (2024–2050), a decrease in the duration of the durum wheat growing cycle, concurrent with the increase in productivity can be observed. This trend is also visible when drawing a comparison between the center of mass of the data sets, marked by a clear shift towards higher productivity and shorter growing cycle for the future climatic conditions. Also, in instances of crop failure the corresponding length of the growing period appears to be shorter for the future predictions compared to the historical ones. Moreover, for the simulations with GR (2006–2023) the yields and growing phase lengths fall within an intermediate range of those from HCM (1950–2023) and FCM (2024–2050). The corresponding center of mass of the data set shows that the yield component increases almost as much as under FCM (2024–2050), while the growing duration is only slightly decreased.

3.3. Impact on the Water Resource Management

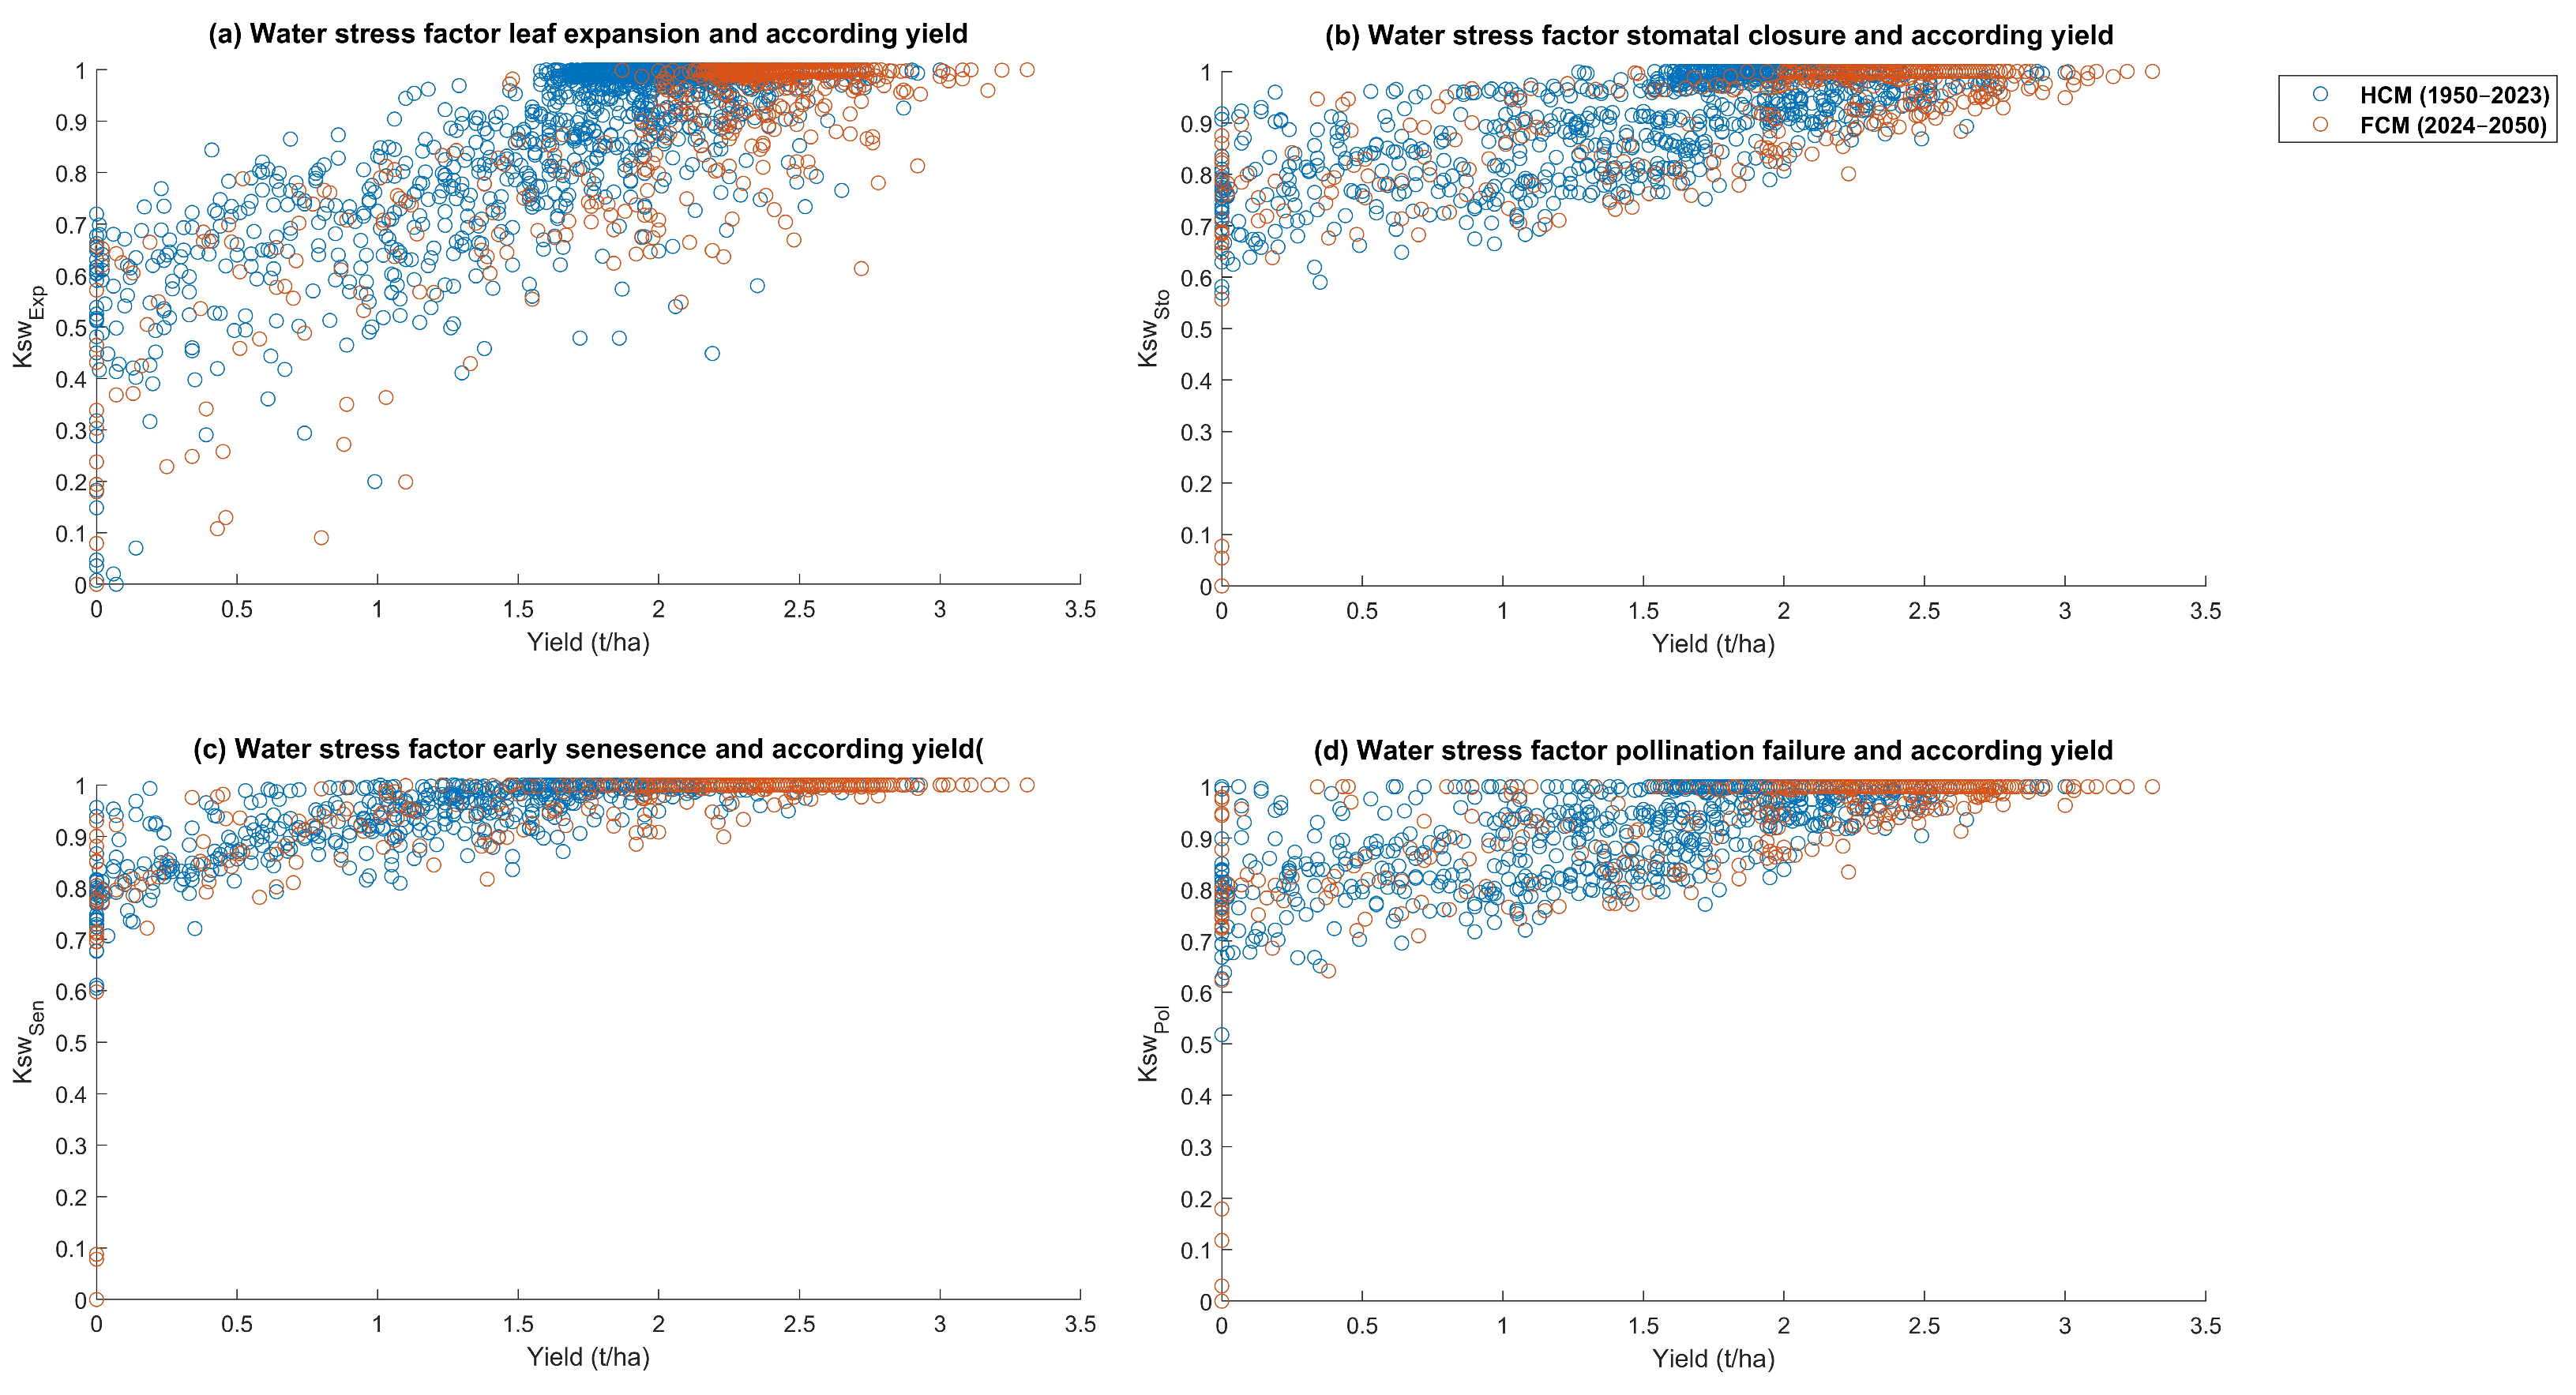
For a better understanding of the impact of future water availability on durum wheat cultivation, water stress under future climatic conditions, as well as irrigation as a potential strategy to stabilize yields, are investigated in the context of the Water-Food Nexus. In a first step, the water stress coefficients of the historical and future model simulations are compared. As explained in Section 2.1, AquaCrop considers the different effects of water stress in the form of four stress coefficients, which alter the corresponding model parameters. A coefficient of zero equals total stress while a coefficient of one translates into no stress. When comparing the coefficients’ numerical distribution, as well as the mean values of each of the four stress coefficients for the historical and future periods, an increase in water stress can be observed for the future. This is most severe in the case of the water stress coefficient for leaf expansion (Ksexp), followed by the stress coefficient for early senescence (Kssen). The total mean values for Ksexp and Kssen drop from 0.955 to 0.942 and from 0.990 to 0.986, respectively, in the future. For a more detailed presentation of the water stress coefficients, the reader is referred to Figure A1 in Appendix A, which illustrates the individual water stress coefficients together with the corresponding yield. The figure shows that Ksexp might exert the highest influence on the durum wheat productivity as low yields always correspond to lowered stress factor values.
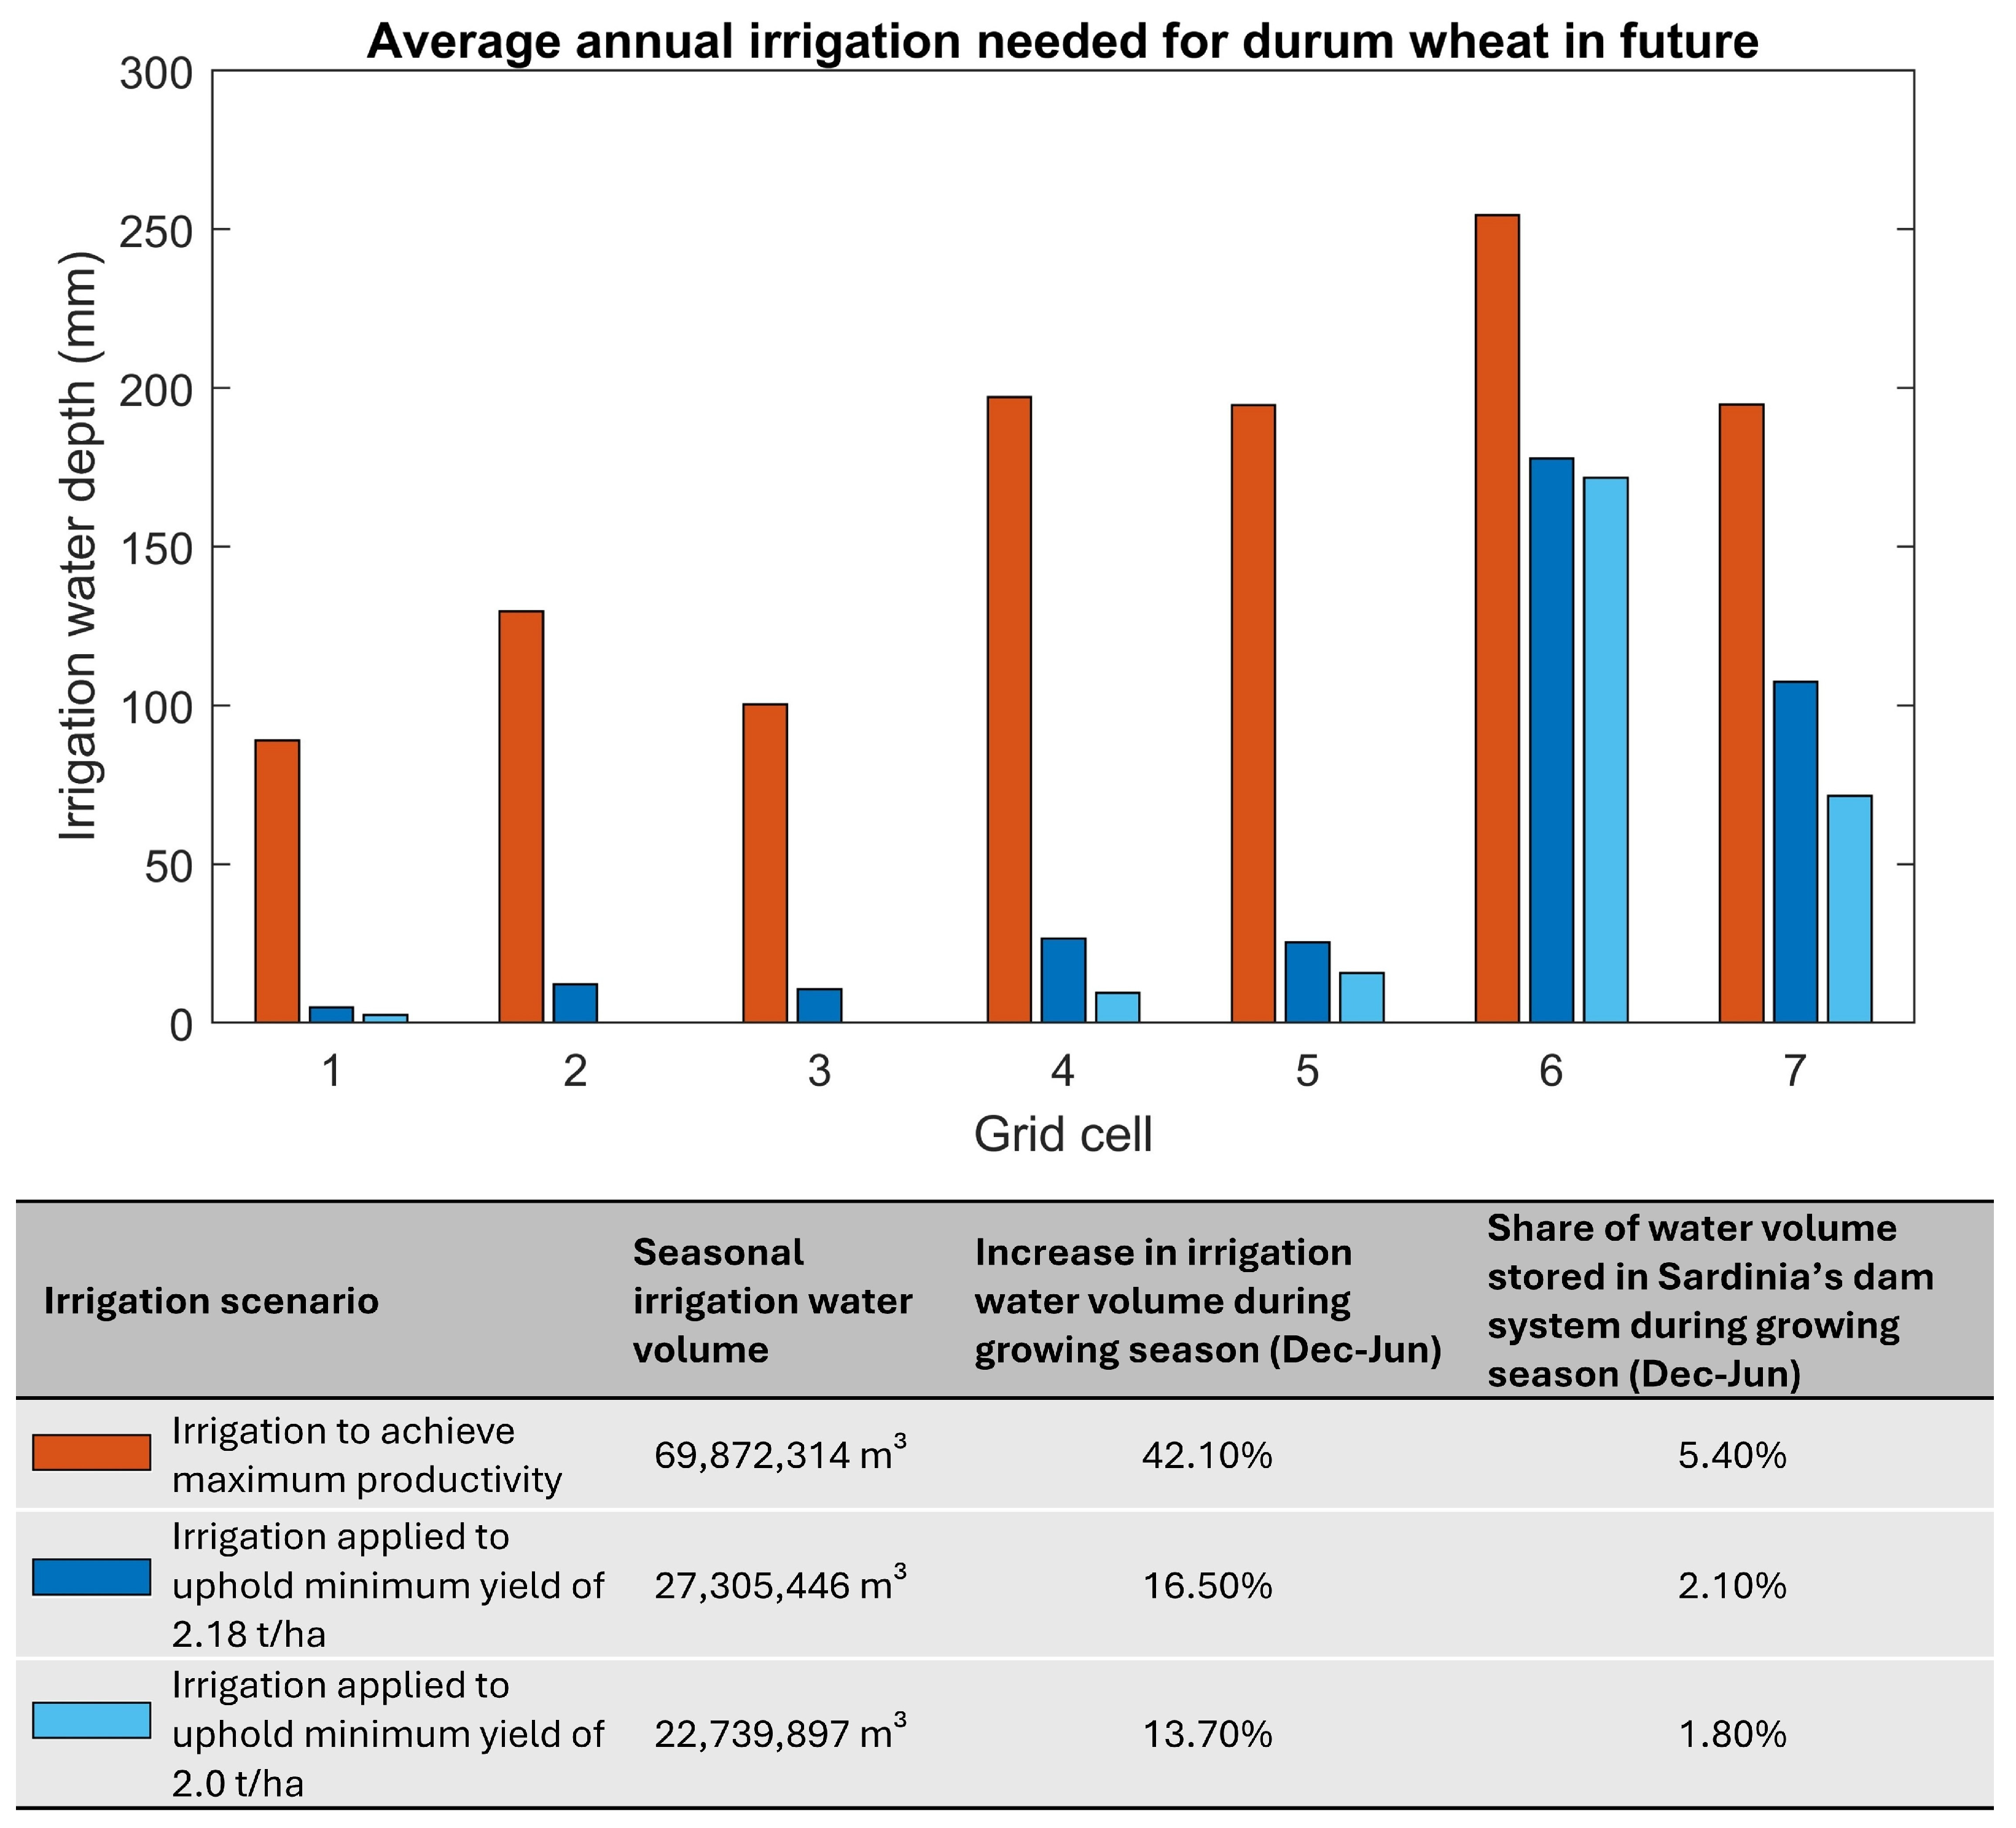
Irrigation is a common agricultural practice to prevent crop failures and to maximize production. So far, the investigations have only been conducted for durum wheat cultivated under rainfed conditions; however, it is fundamental to evaluate the additional water requirements for supplementary irrigation. To achieve this, three irrigation scenarios are investigated under FCM (2024–2050) conditions. As described in Section 2.1, the first scenario involves irrigation applied to achieve maximum productivity, while in scenarios two and three the crops are irrigated solely if the annual productivity would otherwise drop below a level of 2.18 t/ha and 2.0 t/ha, respectively. In Figure 7 the depth of the average annual irrigation requirements is illustrated for each scenario and individual grid cell. The requirements for scenario one range from 89 to 254 mm, while scenario two shows values between 5 mm and 178 mm, and scenario three exhibits a range of 0 mm to 171 mm. Overall, it is observed that C1, C2 and C3 have lower irrigation water requirements compared to the other four grid cells. Specifically, C1, which is located in the north-west region of Sardinia, demonstrates the lowest water requirements for scenarios one and two. However, for C2 and C3 no irrigation is required to guarantee productivity of 2 t/ha. The highest water requirements for all three scenarios are found in C6, located in the south-western part of the island. Even the water depth required in C6 to uphold a minimum productivity of 2.0 t/ha is higher than those required in C1, C2 and C3 to guarantee maximum yields. Furthermore, C4, C5 and C7 all require about 200 mm of seasonal irrigation to achieve maximum productivity, whereas for scenarios one and two C7 requires about four times the amount of the other two cells.
Additionally, the average total annual water volume for irrigation for durum wheat cultivation in Sardinia was calculated. The cultivation area was taken from the ISTAT database [24] as the long-term average, amounting to 37,424 ha, and distributed over the grid cells according to the area used for non-irrigated cultivation and multiplied with the corresponding irrigation requirement of the grid cell. On an annual level an average water volume of 69,872,314 m3 is required for irrigation applied to achieve maximum production. Scenarios two and three require an average of 27,305,446 m3 and 22,739,897 m3 of irrigation water per year. During the growing season of durum wheat in Sardinia (December to June) the average water volume used for agricultural irrigation presently amounts to 165,851,739 m3. As presented in Figure 7, introducing irrigation for durum wheat in the future would increase that value by 42.1% for the maximization of production and by 16.5% and 13.7% for guaranteeing a minimum yield of 2.18 t/ha and 2.0 t/ha, respectively. Furthermore, in Sardinia, irrigation water is sourced from a network of interconnected dams, which collectively store a water volume of on average 1,284,102,001 m3 during the season of durum wheat. The projected additional water requirements for the three durum wheat irrigation scenarios are estimated to utilize 5.4%, 2.1% and 1.8% of this total volume, respectively.

4. Discussion

4.1. Future Durum Wheat Productivity

Understanding the impact of changing climatic conditions on the durum wheat productivity in Sardinia is of crucial importance for adapting agricultural practices accordingly. As delineated in Section 3.2, simulations indicate that the average durum wheat productivity in Sardinia is projected to slightly increase from 1.85 t/ha, for the period 1950 to 2023, to 2.19 t/ha in the near future spanning from 2024 to 2050. Although these findings might sound counterintuitive, they are in line with Soddu, Deidda, Marrocu, Meloni, Paniconi, Ludwig, Sodde, Mascaro and Perra [22]’s research on future durum wheat yields in Ussana, southern Sardinia, as well as the findings of Ventrella, Giglio, Charfeddine, Lopez, Castellini, Sollitto, Castrignanò and Fornaro [13] for durum wheat cultivated in the Capitanata plain in Puglia, Italy, both of which anticipate improved productivity in the future. Conversely, other studies for durum wheat in Italy suggest a potential decline in productivity [25,47]. However, in these latter studies the anticipated rise in CO2 concentrations is not considered. Furthermore, the productivity increase with progressing time is already apparent when comparing the long-term historical (HCM (1950–2023)) yields with the recent historical (HCM (2006–2023)) yields, as visible in Figure 4. A similar trend was detected by Soddu, Deidda, Marrocu, Meloni, Paniconi, Ludwig, Sodde, Mascaro and Perra [22], who, next to future changes, also investigated historical shifts in durum wheat productivity starting from 1950. Results have shown that the main driver for rising productivity is enhanced CO2 levels, as explained in Section 3.2, which is compatible with the conclusions of other studies carried out for the Mediterranean region [13,15,16]. Higher CO2 levels are shown to enhance photosynthetic capacity and improve water use efficiency, leading to increased biomass production, but at the same time deteriorating grain quality [12]. Given that CO2 concentrations have already been rising throughout the historical period, this trend might account for the increases in yield in the recent historical period relative to the long-term historical period. It has to be kept in mind that crop models generally neglect the indirect effects of climate change, such as the intensification of biotic stress factors including weeds, insect pests and fungal disease, which could exert an equally large impact on crop productivity compared to the direct effect related to climate [9]. This could result in an overestimation of the increase in yield due to the CO2 fertilization effect [10].
Additionally, future temperatures, which are predicted to rise, as discussed in Section 3.1, are found to exert an overall positive effect on the productivity of durum wheat, as shown in Figure 5, even though their influence is anticipated to be lower compared to that of CO2. This stands in contrast to other studies [14,25,48] that have identified rising temperatures, next to changed precipitation patterns, as a major threat to future durum wheat cultivation. It is noteworthy that these studies primarily focus on the far future (2071–2100), which may limit the extent of their comparability with the current analysis. Alterations in precipitation, on the contrary, are shown to constrain future durum wheat yields, as visible in Figure 5. During the growing season of durum wheat precipitation is decreasing in all seven grid cells, as outlined in Section 3.1. This results in a higher level of water stress, especially for leaf expansion, as described in Section 3.3, negatively affecting the canopy cover, crop transpiration, HI [26] and consequently the final yields. However, the positive effects of the increase in CO2 concentration and temperature seem to offset the stress on the crop due to insufficient availability of water. Moreover, these climatic changes are found to shorten the length of the durum wheat growing cycle, as described in Section 3.2, a trend that has been observed in several other studies [15,16,20,23]. These analyses indicate that the reduction is primarily attributable to rising temperatures, which predominantly shorten the vegetative development phase, resulting in early flowering. This phenological shift may provide the crop with an opportunity to avoid potential heat or drought stress during the reproductive stage. As illustrated in Figure 6, the shorter growing cycle appears concurrent with the increase in productivity, supporting this assumption.
It is important to note that this analysis is significantly dependent on, and limited by, the crop model employed. As highlighted in Section 2.1, AquaCrop-OS does not simulate the effects of soil fertility and weed management. Efforts were made to account for these factors during the calibration process of the crop input file, however this approach has some limitations. Additionally, within the crop model, higher CO2 levels enhance crop water productivity (WP) and canopy expansion [28]. These calculations are based on a combination of chamber and Free-Air CO2 Enrichment (FACE) experiments. However, for CO2 concentrations above 550 ppm the adjustments of WP remains purely theoretical, lacking validation from empirical field experiments [26,49], which bears the potential for inaccuracies in the simulation of the effect of enhanced CO2 levels. In this study the maximum CO2 concentration considered is still below this limit.

4.2. Water-Food Nexus

The analysis reveals that irrigation water requirements vary significantly across grid cells due to differences in soil properties and rainfall patterns. C1, C2 and C3, located in the north-west, with loam topsoil and higher saturated hydraulic conductivity, exhibit lower irrigation demands, as shown in Figure 7, making them more suitable for cultivation under future scenarios. Interestingly, the mean seasonal rainfall depths per grid cell, as presented in Figure 3a, do not follow the same spatial pattern as the irrigation demand. The highest value can be found for C5, while the lowest value occurs in C7, both of which are located in the south of Sardinia. In terms of irrigation water demand, to achieve maximum productivity in both cells about 200 mm is required per season, while for the other two irrigation scenarios the required irrigation water depth is significantly higher in C7. This example underlines the complexity of the crop’s water demand, which is not only dependent on the total amount of water available, but also on its temporal distribution. The three cells with the lowest irrigation requirements, C1, C2 and C3, are all characterized by high rainfall during November, as shown in Figure 3b, leading to saturated soil water conditions and early sowing, as the time of sowing is decided based on a rainfall criterion (see Section 2.1). Early sowing is considered a valuable tool to escape high temperatures and enhanced drought conditions towards the end of the growing season [10]. In Kourat, Smadhi and Madani [15]’s study on climate change impact on durum wheat cultivated in Algeria, yield improvements were witnessed under early-sowing conditions and Yang, et al. [50]’s research on winter wheat in Portugal showed that yield reductions under RCP 4.5 and RCP 8.5 could be partly reversed with early sowing. Both studies highlight that early sowing is not only a way to avoid high summer temperatures, but also to make use of increased rainfall in the beginning of the season, as is also evident in this study.
Moreover, C1, C2 and C3 differ from the other grid cells in terms of soil composition. As shown in Figure 1c, their topsoil layer consists of loam instead of clay-loam, characterized by a higher saturated hydraulic conductivity ( K s a t ) of 500 mm day−1 instead of 125 mm day−1. In AquaCrop the K s a t of the top horizon limits the maximum amount of water infiltrating the soil, either as rainfall or irrigation [26]. The estimation of water lost by surface runoff follows the curve number method developed by the U.S. Soil Conservation Service [51], according to which a higher K s a t corresponds to a lower curve number and results in a higher amount of water infiltrating the soil and not contributing to the surface runoff. Moreover, the K s a t value influences the redistribution of water between the soil compartments, in particular in form of drainage. In AquaCrop this parameter is used to estimate the so-called drainage characteristics ( τ ); a higher K s a t increases the τ and correspondingly the amount of water leaving the soil layer as drainage over time [26]. Consequently, for C1, C2 and C3 water is traveling faster from the topsoil to the subsoil compared to the other grid cells. Since root density is generally more concentrated towards the soil surface and decreases with depth, which in AquaCrop is accounted for with a declining water extraction pattern with soil depth [28], the higher drainage in the case of the loam topsoil could be an unfavorable condition, especially in the early growing stages when the roots are still superficial. Furthermore, the two soil types are characterized by the same total available water, the volume of water held in the soil between field capacity and permanent wilting point. It should be noted that no field or laboratory soil texture analyses were available to validate the open-access soil dataset used in this study, which may introduce uncertainty in the representation of soil hydraulic properties and the resulting simulation of soil water dynamics.
The analysis of irrigation requirements, presented in Section 3.3, shows that the additional water volume, required to guarantee maximum productivity in the future, would increase the water allocated for irrigation during the durum wheat season by over 40%. This high share does not only highlight the need of a good distribution system to ensure efficient supply but also suggests that in the future potential competition over irrigation water with other irrigated crops in Sardinia, such as corn and rice, might arise. Additionally, the projected decrease in precipitation (see Figure 3a), as well as the increase in temperatures (see Figure 2b), will most likely also affect other water-using sectors, such as the energy, the domestic and the industry sectors. Next to a decreased replenishment of the water storage in dams from precipitation, the changed climate could result in changed water extraction patterns. High temperatures during the summer are likely to increase the water demand during that period. Furthermore, these extreme temperatures may prompt tourists, who traditionally visit the island predominantly in the summer, to shift their travel plans to other seasons, potentially enhancing the domestic water demand during the durum wheat season. Investigating how climate change impacting one sector indirectly affects other sectors, and thereby identifying potential trade-offs, is crucial to enable stakeholders, in particular policy makers, to make informed, interdisciplinary decisions for sustainable water resource management in the future. Irrigation scenarios two and three require lower water volumes, accounting to about 17% and 14%, respectively, of water currently supplied for irrigation during the durum wheat season, hence they might be the better realizable and more economic option in that context, still guaranteeing sufficient yields. As the results refer to the actual amount of water required to avoid plant water stress, they additionally underline the need to implement sustainable irrigation practices, such as drip or subsurface irrigation, to minimize water losses in the field and use the water efficiently. Currently, some durum wheat fields in Sardinia have emergency irrigation system in place, often with low efficiency. The large-scale implementation of sustainable irrigation systems would necessitate substantial financial investments, warranting a comprehensive cost–benefit analysis to evaluate their economic viability. Overall, the analysis of potential future plant water stress and the resulting irrigation demands highlights the importance of extending the focus beyond durum wheat productivity. It is equally important to evaluate consequences for local water resources and sectors reliant on water use in order to gain a holistic understanding of the overall situation. These results have direct implications for both farmers and policymakers, indicating that while near-term climatic conditions may favor durum wheat productivity in Sardinia, proactive irrigation planning and coordinated water management strategies will be essential to maintain stable production under increasing resource constraints.

5. Conclusions

In this study, future durum wheat yields in Sardinia and the irrigation required to uphold current production, are evaluated, considering changes in CO2 concentration, precipitation, temperature and evapotranspiration based on seven different climatic models. The AquaCrop-OS model was calibrated based on 18 years of yield data taking into account local soil conditions, sowing schedules and cultivar characteristics. Simulation results indicate a general enhancement in durum wheat productivity in the future, with a simultaneous increase in crop failures, highlighting the necessity of emergency irrigation measurements. Additionally, a reduction in growing period length could be observed. Further investigations demonstrated that rising CO2 concentrations and temperatures are likely to have a positive effect on future yields, while decreasing rainfall throughout the cultivation season is expected to constrain productivity due to increased water stress. Moreover, three irrigation scenarios were investigated, one aimed at maximizing productivity, while the other two focused on upholding a minimum productivity of 2.18 t/ha and 2.0 t/ha, respectively. The results demonstrated significant variability in irrigation water demands across different grid cells, with lower demands in the northern regions and higher demands in the southern regions of Sardinia. When aggregated for the whole island, the volume of water required for irrigation to guarantee maximum yields would increase the seasonal water volume allocation, currently provided for agricultural irrigation, by more than 40%, raising concerns about competition for water resources in the future. In contrast, the irrigation scenarios designed to sustain minimum productivity levels indicated an increase of less than 20%, suggesting greater feasibility under projected future conditions. In addition to purely agricultural considerations, it is essential to recognize the role of durum wheat cultivation in Sardinia as agricultural landscape heritage reflecting traditional farming practices while supporting biodiversity and sustainable land use. In this context, projected changes in yield levels, production stability, and irrigation demand may also influence the visual character, ecological integrity, and cultural continuity of these landscapes, highlighting the importance of adaptation strategies that balance productivity with heritage preservation.
This study’s findings have implications for local farmers and policymakers, providing critical insights for adapting to anticipated environmental changes and challenges. However, it is important to note that this study focuses solely on the near future (up to 2050) and does not account for indirect effects of climate change, such as the potential intensification of biotic stressors like plant diseases. Moreover, the investigation of the impact of changing climatic conditions on durum wheat grain quality has not been included. Future research should aim to explore the impact of climate change on durum wheat productivity extending towards the end of the century, incorporating a broader range of influencing factors and focusing on yield and grain quality simultaneously. In conclusion, this study emphasizes that while durum wheat productivity is predicted to increase in Sardinia in the near future, additional irrigation will be necessary to uphold stable production.

Author Contributions

Conceptualization, M.G.-H., E.C., G.P., M.M., F.V. and R.D.; methodology, M.G.-H.; software, M.G.-H.; validation, M.G.-H., E.C. and F.V.; investigation, M.G.-H. and E.C.; data curation, M.G.-H., G.P., M.M. and R.D.; writing—original draft preparation, M.G.-H.; writing—review and editing, M.G.-H., E.C., G.P., M.M., F.V. and R.D.; visualization, M.G.-H. and E.C.; supervision, E.C., G.P., M.M., F.V. and R.D.; funding acquisition, F.V. and R.D. All authors have read and agreed to the published version of the manuscript.

Funding

This project has received funding from the European Union’s Horizon H2020 innovation action program under grant agreement 101037424 (ARSINOE).

Data Availability Statement

The raw data supporting the conclusions of this article will be made available by the authors on request.

Conflicts of Interest

The authors declare no conflicts of interest.

Abbreviations

The following abbreviations are used in this manuscript:
AquaCrop-OSAquaCrop-OpenSource
HIReference harvest index
KsStress coefficients
GDDGrowing degree days
C1–C7Grid cell 1–grid cell 7
CO2Carbon dioxide
TminMinimum temperature
TmaxMaximum temperature
ET0Reference crop evapotranspiration
CDCCrop decline coefficient
CGCCrop growth coefficient
ERA5Fifth generation of the European Centre for Medium-Range Weather Forecasts atmospheric reanalysis
HighResMIPHigh-Resolution Model Intercomparison Project
CMIP6Coupled Model Intercomparison Project Phase 6
RMSERoot mean square error
M1–M7Climate model projections 1–climate model projections 7
GR (2006–2023)Climatic timeseries based on ground and reanalysis data for period 2006–2023
HCM (1950–2023)Historical climatic model timeseries for period 1950–2023
HCM (2006–2023)Historical climatic model timeseries for period 2006–2023
FCM (2024–2050)Future climatic model timeseries for period 2006–2023

Appendix A

Appendix A.1

Table A1. General information on the used climatic models from the HighResMIP.
IDModel NameResolutionMain ComponentsModeling Consortium and Reference
M1CMCC-CM2-VHR425 kmAerosol, atmosphere, land, ocean, and sea iceFondazione Centro Euro-Mediterraneo sui Cambiamenti Climatici (CMCC) in Lecce, Italy [52]
M2EC-Earth3P-HR50 km for atmosphere and land, 25 km for ocean and sea ice Atmosphere, land, ocean and sea ice International consortium of research institutions and universities from several countries, coordinated by the EC-Earth consortium based at the Swedish Meteorological and Hydrological Institute (SMHI) [53]
M3FGOALS-f3-H25 km for atmosphere and land, 10 km for ocean and sea iceAtmosphere, land, ocean and sea iceChinese Academy of Sciences (CAS) in Beijing, China [54]
M4HiRAM-SIT-HR25 km Atmosphere, land, oceanResearch Center for Environmental Changes, Academia Sinica (AS-RCEC) in Taipei, Taiwan [55]
M5MPI-ESM1-2-XR50 kmAerosol, atmosphere, land, land ice, ocean, ocean biogeochemistry, and sea iceMax Planck Institute for Meteorology (MPI-M) in Hamburg, Germany [56]
M5MRI- AGCM3-2-S250 km for aerosol, 25 km for atmosphere and landAerosol, atmosphere and landMeteorological Research Institute (MRI) in Tsukuba, Japan [57]
M6NICAM16-8S25 km for aerosol and land, and 50 km for atmosphere and sea iceAerosol, atmosphere, land and sea iceInternational consortium, including Japan Agency for Marine-Earth Science and Technology (JAMSTEC), Atmosphere and Ocean Research Institute, University of Tokyo (AORI), National Institute for Environmental Studies (NIES), and RIKEN Center for Computational Science (R-CCS), coordinated under MIROC [58]
M7CMCC-CM2-VHR425 kmAerosol, atmosphere, land, ocean, and sea iceFondazione Centro Euro-Mediterraneo sui Cambiamenti Climatici (CMCC) in Lecce, Italy [52]

Appendix A.2

Figure A1. Water stress factors and corresponding yield; (a) water stress factor leaf expansion; (b) water stress factor stomatal closure; (c) water stress factor early senescence; (d) water stress factor pollination failure.
Earth 07 00027 g0a1

References

  1. Gkoltsiou, A.; Athanasiadou, E.; Paraskevopoulou, A.T. Agricultural Heritage Landscapes of Greece: Three Case Studies and Strategic Steps towards Their Acknowledgement, Conservation and Management. Sustainability 2021, 13, 5955. [Google Scholar] [CrossRef] [Scilit]
  2. Santoro, A.; Venturi, M.; Agnoletti, M. Agricultural Heritage Systems and Landscape Perception among Tourists. The Case of Lamole, Chianti (Italy). Sustainability 2020, 12, 3509. [Google Scholar] [CrossRef] [Scilit]
  3. De Santis, M.A.; Soccio, M.; Laus, M.N.; Flagella, Z. Influence of Drought and Salt Stress on Durum Wheat Grain Quality and Composition: A Review. Plants 2021, 10, 2599. [Google Scholar] [CrossRef] [Scilit] [PubMed]
  4. Liu, H.; Able, A.J.; Able, J.A. Genotypic performance of Australian durum under single and combined water-deficit and heat stress during reproduction. Sci. Rep. 2019, 9, 14986. [Google Scholar] [CrossRef] [Scilit]
  5. Rezzouk, F.Z.; Gracia-Romero, A.; Kefauver, S.C.; Nieto-Taladriz, M.T.; Serret, M.D.; Araus, J.L. Durum wheat ideotypes in Mediterranean environments differing in water and temperature conditions. Agric. Water Manag. 2022, 259, 107257. [Google Scholar] [CrossRef] [Scilit]
  6. Martínez-Moreno, F.; Ammar, K.; Solís, I. Global Changes in Cultivated Area and Breeding Activities of Durum Wheat from 1800 to Date: A Historical Review. Agronomy 2022, 12, 1135. [Google Scholar] [CrossRef] [Scilit]
  7. Li, Y.-F.; Wu, Y.; Hernandez-Espinosa, N.; Peña, R.J. Heat and drought stress on durum wheat: Responses of genotypes, yield, and quality parameters. J. Cereal Sci. 2013, 57, 398–404. [Google Scholar] [CrossRef] [Scilit]
  8. Monneveux, P.; Jing, R.; Misra, S.C. Phenotyping for drought adaptation in wheat using physiological traits. Front. Physiol. 2012, 3, 429. [Google Scholar] [CrossRef] [Scilit]
  9. De Vita, P.; Taranto, F. Durum Wheat (Triticum turgidum ssp. durum) Breeding to Meet the Challenge of Climate Change. In Advances in Plant Breeding Strategies: Cereals; Springer: Cham, Switzerland, 2019; pp. 471–524. [Google Scholar]
  10. Grosse-Heilmann, M.; Cristiano, E.; Deidda, R.; Viola, F. Durum wheat productivity today and tomorrow: A review of influencing factors and climate change effects. Resour. Environ. Sustain. 2024, 17, 100170. [Google Scholar] [CrossRef] [Scilit]
  11. IPCC. Summary for Policymakers; Intergovernmental Panel on Climate Change: Geneva, Switzerland, 2023. [Google Scholar]
  12. Sabella, E.; Aprile, A.; Negro, C.; Nicolì, F.; Nutricati, E.; Vergine, M.; Luvisi, A.; De Bellis, L. Impact of Climate Change on Durum Wheat Yield. Agronomy 2020, 10, 793. [Google Scholar] [CrossRef] [Scilit]
  13. Ventrella, D.; Giglio, L.; Charfeddine, M.; Lopez, R.; Castellini, M.; Sollitto, D.; Castrignanò, A.; Fornaro, F. Climate change impact on crop rotations of winter durum wheat and tomato in southern Italy: Yield analysis and soil fertility. Ital. J. Agron. 2012, 7, e15. [Google Scholar] [CrossRef] [Scilit]
  14. Ferrara, R.M.; Trevisiol, P.; Acutis, M.; Rana, G.; Richter, G.M.; Baggaley, N. Topographic impacts on wheat yields under climate change: Two contrasted case studies in Europe. Theor. Appl. Climatol. 2009, 99, 53–65. [Google Scholar] [CrossRef] [Scilit]
  15. Kourat, T.; Smadhi, D.; Madani, A. Modeling the Impact of Future Climate Change Impacts on Rainfed Durum Wheat Production in Algeria. Climate 2022, 10, 50. [Google Scholar] [CrossRef] [Scilit]
  16. Moriondo, M.; Giannakopoulos, C.; Bindi, M. Climate change impact assessment: The role of climate extremes in crop yield simulation. Clim. Change 2010, 104, 679–701. [Google Scholar] [CrossRef] [Scilit]
  17. Ceglar, A.; Toreti, A.; Zampieri, M.; Royo, C. Global loss of climatically suitable areas for durum wheat growth in the future. Environ. Res. Lett. 2021, 16, 104049. [Google Scholar] [CrossRef] [Scilit]
  18. Rosa, L.; Rulli, M.C.; Davis, K.F.; Chiarelli, D.D.; Passera, C.; D’Odorico, P. Closing the yield gap while ensuring water sustainability. Environ. Res. Lett. 2018, 13, 104002. [Google Scholar] [CrossRef] [Scilit]
  19. D’Odorico, P.; Chiarelli, D.D.; Rosa, L.; Bini, A.; Zilberman, D.; Rulli, M.C. The global value of water in agriculture. Proc. Natl. Acad. Sci. USA 2020, 117, 21985–21993. [Google Scholar] [CrossRef] [Scilit]
  20. Moriondo, M.; Bindi, M.; Kundzewicz, Z.W.; Szwed, M.; Chorynski, A.; Matczak, P.; Radziejewski, M.; McEvoy, D.; Wreford, A. Impact and adaptation opportunities for European agriculture in response to climatic change and variability. Mitig. Adapt. Strateg. Glob. Change 2010, 15, 657–679. [Google Scholar] [CrossRef] [Scilit]
  21. D’Odorico, P.; Davis, K.F.; Rosa, L.; Carr, J.A.; Chiarelli, D.; Dell’Angelo, J.; Gephart, J.; MacDonald, G.K.; Seekell, D.A.; Suweis, S.; et al. The Global Food-Energy-Water Nexus. Rev. Geophys. 2018, 56, 456–531. [Google Scholar] [CrossRef] [Scilit]
  22. Soddu, A.; Deidda, R.; Marrocu, M.; Meloni, R.; Paniconi, C.; Ludwig, R.; Sodde, M.; Mascaro, G.; Perra, E. Climate Variability and Durum Wheat Adaptation Using the AquaCrop Model in Southern Sardinia. Procedia Environ. Sci. 2013, 19, 830–835. [Google Scholar] [CrossRef] [Scilit]
  23. Dettori, M.; Cesaraccio, C.; Duce, P.; Mereu, V. Performance Prediction of Durum Wheat Genotypes in Response to Drought and Heat in Climate Change Conditions. Genes 2022, 13, 488. [Google Scholar] [CrossRef] [Scilit] [PubMed]
  24. ISTAT. Coltivazioni: Cereali, Legumi, Radici Bulbi e Tuberi. Available online: https://esploradati.istat.it/databrowser/#/en/dw/categories/IT1,Z1000AGR,1.0/AGR_CRP (accessed on 4 October 2025).
  25. Dettori, M.; Cesaraccio, C.; Duce, P. Simulation of climate change impacts on production and phenology of durum wheat in Mediterranean environments using CERES-Wheat model. Field Crops Res. 2017, 206, 43–53. [Google Scholar] [CrossRef] [Scilit]
  26. Raes, D.; Steduto, P.; Hsiao, T.C.; Fereres, E. Chapter 3: Calculation procedures. In AquaCrop Version 7.1—Reference Manual; Food and Agriculture Organization of the United Nations: Rome, Italy, 2023. [Google Scholar]
  27. Steduto, P.; Hsiao, T.C.; Raes, D.; Fereres, E. AquaCrop—The FAO Crop Model to Simulate Yield Response to Water: I. Concepts and Underlying Principles. Agron. J. 2009, 101, 426–437. [Google Scholar] [CrossRef] [Scilit]
  28. Raes, D.; Steduto, P.; Hsiao, T.C.; Fereres, E. AquaCrop—The FAO Crop Model to Simulate Yield Response to Water: II. Main Algorithms and Software Description. Agron. J. 2009, 101, 438–447. [Google Scholar] [CrossRef] [Scilit]
  29. Foster, T.; Brozović, N.; Butler, A.P.; Neale, C.M.U.; Raes, D.; Steduto, P.; Fereres, E.; Hsiao, T.C. AquaCrop-OS: An open source version of FAO’s crop water productivity model. Agric. Water Manag. 2017, 181, 18–22. [Google Scholar] [CrossRef] [Scilit]
  30. EEA. CORINE Land Cover; European Environment Agency (EEA): Copenhagen, Denmark, 2019. [Google Scholar] [CrossRef]
  31. Ballabio, C.; Panagos, P.; Monatanarella, L. Mapping topsoil physical properties at European scale using the LUCAS database. Geoderma 2016, 261, 110–123. [Google Scholar] [CrossRef] [Scilit]
  32. Jahn, R.; Blume, H.P.; Asio, V.B.; Spaargaren, O.; Schád, P. FAO Guidelines Soil Description; Food and Agricultural Organization of the United Nations: Rome, Italy, 2006. [Google Scholar]
  33. Muñoz Sabater, J. ERA5-Land Hourly Data from 1950 to Present; Copernicus Climate Change Service: Bonn, Germany, 2019. [Google Scholar] [CrossRef]
  34. Vanella, D.; Longo-Minnolo, G.; Belfiore, O.R.; Ramírez-Cuesta, J.M.; Pappalardo, S.; Consoli, S.; D’Urso, G.; Chirico, G.B.; Coppola, A.; Comegna, A.; et al. Comparing the use of ERA5 reanalysis dataset and ground-based agrometeorological data under different climates and topography in Italy. J. Hydrol. Reg. Stud. 2022, 42, 101182. [Google Scholar] [CrossRef] [Scilit]
  35. Raes, D.; Steduto, P.; Hsiao, T.C.; Fereres, E. Chapter 2: Users guide. In AquaCrop Version 7.1—Reference Manual; Food and Agriculture Organization of the United Nations: Rome, Italy, 2023. [Google Scholar]
  36. Benabdelouahab, T.; Balaghi, R.; Hadria, R.; Lionboui, H.; Djaby, B.; Tychon, B. Testing Aquacrop to Simulate Durum Wheat Yield and Schedule Irrigation in a Semi-Arid Irrigated Perimeter in Morocco. Irrig. Drain. 2016, 65, 631–643. [Google Scholar] [CrossRef] [Scilit]
  37. Kale Celik, S.; Madenoğlu, S. Evaluating AquaCrop Model for Winter Wheat under Various Irrigation Conditions in Turkey. Tarım Bilim. Derg. 2018, 24, 205–217. [Google Scholar] [CrossRef] [Scilit]
  38. Trombetta, A.; Iacobellis, V.; Tarantino, E.; Gentile, F. Calibration of the AquaCrop model for winter wheat using MODIS LAI images. Agric. Water Manag. 2016, 164, 304–316. [Google Scholar] [CrossRef] [Scilit]
  39. Bouazzama, B.; Karrou, M.; Boutfiras, M.; Bahri, A. Assessment of AquaCrop model in the simulation of durum wheat (Triticum aestivum L.) growth and yield under different water regimes. Rev. Mar. Sci. Agron. Vét. 2017, 5, 222–230. [Google Scholar]
  40. Open-Meteo. Climate API. 2022. Available online: https://open-meteo.com/en/docs/climate-api (accessed on 1 February 2025).
  41. Haarsma, R.J.; Roberts, M.J.; Vidale, P.L.; Senior, C.A.; Bellucci, A.; Bao, Q.; Chang, P.; Corti, S.; Fučkar, N.S.; Guemas, V.; et al. High Resolution Model Intercomparison Project (HighResMIP v1.0) for CMIP6. Geosci. Model Dev. 2016, 9, 4185–4208. [Google Scholar] [CrossRef] [Scilit]
  42. Kennedy, J.; Titchner, H.; Rayner, N.; Roberts, M. input4MIPs.CMIP6.HighResMIP.MOHC.MOHC-HadISST-2-2-0-0-0; World Climate Research Programme (WCRP): Geneva, Switzerland, 2017. [Google Scholar] [CrossRef]
  43. Lee, J.-Y.; Marotzke, J.; Bala, G.; Cao, L.; Corti, S.; Dunne, J.P.; Engelbrecht, F.; Fischer, E.; Fyfe, J.C.; Jones, C.; et al. Future Global Climate: Scenario-based Projections and Near-term Information. In Climate Change 2021: The Physical Science Basis. Contribution of Working Group I to the Sixth Assessment Report of the Intergovernmental Panel on Climate Change; Cambridge University Press: Cambridge, UK; New York, NY, USA, 2023; pp. 553–672. [Google Scholar]
  44. Hawkins, E.; Osborne, T.M.; Ho, C.K.; Challinor, A.J. Calibration and bias correction of climate projections for crop modelling: An idealised case study over Europe. Agric. For. Meteorol. 2013, 170, 19–31. [Google Scholar] [CrossRef] [Scilit]
  45. Lafon, T.; Dadson, S.; Buys, G.; Prudhomme, C. Bias correction of daily precipitation simulated by a regional climate model: A comparison of methods. Int. J. Climatol. 2012, 33, 1367–1381. [Google Scholar] [CrossRef] [Scilit]
  46. Chen, J.; Yang, Y.; Tang, J. Bias correction of surface air temperature and precipitation in CORDEX East Asia simulation: What should we do when applying bias correction? Atmos. Res. 2022, 280, 106439. [Google Scholar] [CrossRef] [Scilit]
  47. Cosentino, S.L.; Sanzone, E.; Testa, G.; Patanè, C.; Anastasi, U.; Scordia, D. Does post-anthesis heat stress affect plant phenology, physiology, grain yield and protein content of durum wheat in a semi-arid Mediterranean environment? J. Agron. Crop Sci. 2018, 205, 309–323. [Google Scholar] [CrossRef] [Scilit]
  48. Chourghal, N.; Lhomme, J.P.; Huard, F.; Aidaoui, A. Climate change in Algeria and its impact on durum wheat. Reg. Environ. Change 2015, 16, 1623–1634. [Google Scholar] [CrossRef] [Scilit]
  49. Steduto, P.; Hsiao, T.C.; Fereres, E. On the conservative behavior of biomass water productivity. Irrig. Sci. 2007, 25, 189–207. [Google Scholar] [CrossRef] [Scilit]
  50. Yang, C.; Fraga, H.; van Ieperen, W.; Trindade, H.; Santos, J.A. Effects of climate change and adaptation options on winter wheat yield under rainfed Mediterranean conditions in southern Portugal. Clim. Change 2019, 154, 159–178. [Google Scholar] [CrossRef] [Scilit]
  51. USDA. Estimation of direct runoff from storm rainfall. In Part 630 Hydrology—National Engineering Handbook; U.S. Department of Agriculture: Washington, DC, USA, 1964; Chapter 10; pp. 11–20. [Google Scholar]
  52. Scoccimarro, E.; Bellucci, A.; Peano, D. CMCC CMCC-CM2-VHR4 Model Output Prepared for CMIP6 HighResMIP; World Climate Research Programme (WCRP): Geneva, Switzerland, 2017. [Google Scholar] [CrossRef]
  53. EC-Earth Consortium. EC-Earth3P-HR Model Output Prepared for CMIP6 HighResMIP. 2018, Earth System Grid Federation; World Climate Research Programme (WCRP): Geneva, Switzerland, 2018. [Google Scholar] [CrossRef]
  54. Bao, Q.; He, B. CAS FGOALS-f3-H Model Output Prepared for CMIP6 HighResMIP; World Climate Research Programme (WCRP): Geneva, Switzerland, 2019. [Google Scholar] [CrossRef]
  55. Tu, C.-Y. AS-RCEC HiRAM-SIT-HR Model Output Prepared for CMIP6 HighResMIP; World Climate Research Programme (WCRP): Geneva, Switzerland, 2020. [Google Scholar] [CrossRef]
  56. von Storch, J.-S.; Putrasahan, D.; Lohmann, K.; Gutjahr, O.; Jungclaus, J.; Bittner, M.; Haak, H.; Wieners, K.-H.; Giorgetta, M.; Reick, C.; et al. MPI-M MPI-ESM1.2-XR Model Output Prepared for CMIP6 HighResMIP; World Climate Research Programme (WCRP): Geneva, Switzerland, 2017. [Google Scholar] [CrossRef]
  57. Mizuta, R.; Yoshimura, H.; Ose, T.; Hosaka, M.; Yukimoto, S. MRI MRI-AGCM3-2-S Model Output Prepared for CMIP6 HighResMIP highresSST-Present; World Climate Research Programme (WCRP): Geneva, Switzerland, 2019. [Google Scholar] [CrossRef]
  58. Kodama, C.; Ohno, T.; Seiki, T.; Yashiro, H.; Noda, A.T.; Nakano, M.; Yamada, Y.; Roh, W.; Satoh, M.; Nitta, T.; et al. MIROC NICAM16-8S Model Output Prepared for CMIP6 HighResMIP; World Climate Research Programme (WCRP): Geneva, Switzerland, 2019. [Google Scholar] [CrossRef]
Figure 1. Cultivated area, soil characteristics and rain gauge network available in Sardinia. (a) Area of rainfed durum wheat cultivation from the CORINE Land Cover; (b) Active rain gauges in Sardinia; (c) Soil types of top and sub soil layers in the main cultivation areas (cell C1–C7) from the European Soil Database and hydraulic characteristics.
Earth 07 00027 g001
Figure 2. Climatic projections for the future period (2024–2050) over the seven grid cells. (a) Mean monthly precipitation of the bias-corrected model and observed daily rainfall averaged; (b) Mean monthly maximum and minimum temperature (Tmax and Tmin) of the bias-corrected model and ERA5 daily temperature averaged.
Earth 07 00027 g002
Figure 3. Precipitation patterns of in the main cultivation areas (cell C1–C7). (a) Mean seasonal precipitation for the historical and future period: each grid cell is divided into two parts, where the upper triangle shows the historical mean seasonal precipitation and the lower triangle the future mean seasonal precipitation and (b) monthly precipitation in the future, where the season start and the season end are marked by a dashed black line.
Earth 07 00027 g003
Figure 4. Durum wheat productivity averaged over the main cultivation area in Sardinia for four climatic timeseries: Ground observation rainfall and reanalysis temperature and ET0—GR (2006–2023); historical climate model projections for two periods—HCM (2006–2023) and HCM (1950–2023); and future climate model projections—FCM (2024–2050).
Earth 07 00027 g004
Figure 5. Productivity of durum wheat for modified (Scenario A, B and C) and unmodified future climate model (FCM (2024–2050)) forcing.
Earth 07 00027 g005
Figure 6. Yield per growing period duration for HCM (1950–2023), FCM (2024–2050) and GR (2006–2023) data. The inset shows a zoom (of the most populated area) and the centers of mass for the three different forcings.
Earth 07 00027 g006
Figure 7. Future irrigation requirements. Average annual irrigation water depth in the future per grid cell and seasonal irrigation water volumes compared to current agricultural irrigation volume and available water volume in dams.
Earth 07 00027 g007
Table 1. Calibrated AquaCrop model crop parameters for durum wheat in Sardinia.
DescriptionValueUnit
Conservative Parameters
Base temperature below which growth does not progress0°C
Upper temperature above which crop development no longer increases30°C
Canopy cover per seeding at 90% emergence (CC0)1.5cm2
Maximum canopy cover0.96fraction of soil cover
Canopy decline coefficient (CDC) 10.0037–0.006fraction per GDD
Canopy growth coefficient (CGC) 10.0011–0.0039fraction per GDD
Water productivity normalized for ET0 and C0215g/m2
Upper-soil water-depletion threshold for water stress effects on canopy expansion0.2
Lower-soil water-depletion threshold for water stress effects on canopy expansion0.65
Upper-soil water-depletion threshold for water stress effects on canopy senescence0.7
Shape factor describing water stress effects on canopy expansion5
Shape factor describing water stress effects on stomatal control2.5
Shape factor describing water stress effects on canopy senescence2.5
Reference harvest Index (HI) 10.18–0.44
Non-conservative parameters
Number of plants per hectare 12,479,229–3,987,716number/ha
Maximum canopy cover0.96fraction of soil cover
Time from sowing to emergence155GDD
Time sowing to maximum root depth857GDD
Time from sowing to senescence1872GDD
Time from sowing to maturity2598GDD
Time from sowing to start of yield formation1465GDD
Duration of flowering193GDD
Minimum effective rooting depth 0.3m
Maximum rooting depth1.5m
1 Calibrated parameter, varies according to grid cell.
Disclaimer/Publisher’s Note: The statements, opinions and data contained in all publications are solely those of the individual author(s) and contributor(s) and not of MDPI and/or the editor(s). MDPI and/or the editor(s) disclaim responsibility for any injury to people or property resulting from any ideas, methods, instructions or products referred to in the content.