Abstract
Synthetic aperture radar (SAR) is an active microwave imaging system equipped with penetration capability, enabling all-time and all-weather Earth observation, and demonstrates significant advantages in large-scale surface water-body detection. Although SAR images can provide relatively clear water-body details, they are susceptible to interference from external factors such as complex terrain and background noise, resulting in fragmented detection outcomes and poor connectivity. Therefore, a Connectivity Refinement Network (ConRNet) is proposed in this study to address the issue of fragmented water-body regions in water-body detection results, combining HISEA-1 and Chaohu-1 SAR data. ConRNet is equipped with attention mechanisms and a connectivity prediction module, combined with dual supervision from segmentation and connectivity labels. Unlike conventional attention modules that only emphasize pixel-wise saliency, the proposed Dual Self-Attention Module (DSAM) jointly captures spatial and channel dependencies. Meanwhile, the Connectivity Prediction Module (CPM) reformulates water-body connectivity as a regression problem to directly optimize structural coherence without relying on post-processing. Leveraging dual supervision from segmentation and connectivity labels, ConRNet achieves simultaneous improvements in topological consistency and pixel-level accuracy. The performance of the proposed ConRNet is evaluated by con-ducting comparative experiments with five deep learning models: FCN, U-Net, DeepLabv3+, HRNet, and MAGNet. The experimental results demonstrate that the ConRNet achieves the highest accuracy in water-body detection, with an intersection over union (IoU) of 88.59% and an F1-score of 93.87%.
1. Introduction
Surface water resources are a crucial foundation for maintaining the stability of the Earth’s ecosystem and the development of human civilization. An intact and interconnected water system network governs the redistribution of precipitation and runoff, influences regional groundwater recharge and evapotranspiration, and plays an essential role in carbon and sediment transport within the Earth system. Wetlands, rivers, lakes, and other water bodies not only support rich biodiversity but also maintain the dynamic balance of the environment through processes such as climate regulation, flood buffering, and biogeochemical cycling. Efficient and accurate detection of surface water bodies has become a key factor in water resource conservation and sustainable utilization [1]. Synthetic aperture radar (SAR), as an active microwave sensor, enables all-weather, all-time Earth observation. Furthermore, the significant differences in SAR echo signals’ responses to various land cover types provide a basis for water-body detection [2,3].
Traditional methods for water-body detection in SAR images can be broadly categorized into classical image processing methods and conventional machine learning methods. Classical image processing methods are generally based on mathematical or physical models rather than data-driven paradigms, encompassing techniques such as edge detection [4], threshold segmentation [5], level set methods [6], and active contour models [7]. Water-body detection methods based on traditional machine learning are mainly categorized into supervised and unsupervised learning. Supervised learning methods, such as support vector machine [8] and random forest [9], rely on manually labeled sample data to train models that establish classification boundaries between water bodies and backgrounds. Unsupervised learning methods, such as K-means clustering [10], operate without requiring labeled training data. Instead, these methods perform pixel-level clustering into aqueous and non-aqueous categories based on the gray-level distribution characteristics of SAR images. Traditional methods have been widely explored in water-body detection based on SAR images. However, these traditional methods primarily rely on the analysis of low-level features such as geometry, gray level, and texture of SAR images. When faced with complex backgrounds and different types of water bodies, their performance tends to deteriorate significantly, showing inadequate generalization capacities [11].
With the advancement of deep learning technologies, methods based on convolutional neural networks (CNNs) have achieved remarkable progress in SAR water-body detection by enabling data-driven feature abstraction and learning complex nonlinear relationships across spatial scales [12,13,14]. Recent studies can be grouped according to their technical focus. Some researchers have concentrated on enhancing feature representation and boundary refinement through attention mechanisms and multi-scale fusion strategies. Chen et al. proposed a multi-level attention network to separate water and shadows in SAR images [15]. Zhang et al. proposed a cascaded fully convolutional network integrating upsampling pyramid networks, conditional random fields, and a variable focal loss to enhance pixel accuracy in water-body detection [16]. Ren et al. proposed a dual-attention U-Net for classifying sea ice and open water from SAR images, demonstrating the effectiveness of the attention mechanism in improving classification accuracy [17]. Han et al. developed a U-Net model with integrated attention fusion mechanisms and an active contour loss function, which optimizes boundary feature learning to enhance segmentation performance [18]. Huang et al. enhanced the DeepLabv3+ architecture by integrating self-attention mechanisms, achieving significant improvements in water-body detection accuracy [19]. Wang et al. proposed the multi-scale attention detailed feature fusion network, integrating a deep pyramid pooling module for multi-scale water feature extraction and a channel–spatial attention module for edge refinement [20]. Other researchers have focused on improving computational efficiency and optimization strategies while maintaining high accuracy. Zortea et al. proposed a lightweight network based on U-Net which reduces the number of parameters while maintaining nearly the same flood detection accuracy as the original model [21]. Yuan et al. enhanced DeepLabv3+ via the Dung Beetle Optimizer, boosting training efficiency and water-body detection accuracy [22]. From these studies, it can be observed that researchers have significantly advanced water-body detection by introducing attention mechanisms, multi-scale feature fusion, and optimized training strategies, thereby improving pixel-level accuracy, boundary localization, and model generalization. However, most of these methods remain pixel-centric, emphasizing local feature enhancement while neglecting the global structural integrity of water systems. In SAR imagery, the presence of speckle noise, variable scattering characteristics caused by environmental conditions, and the similarity of backscattering between water and non-water surfaces make accurate delineation of boundaries difficult. Consequently, existing models still suffer from fragmented and disconnected water regions because they fail to incorporate the global topological constraints that govern hydrological connectivity. These limitations highlight the necessity of a connectivity-aware framework capable of maintaining the continuity and integrity of water networks while ensuring high detection accuracy.
To address these challenges, we propose the Connectivity Refinement Network (ConRNet), which makes the following three contributions:
- A Dual Self-Attention Module (DSAM) to integrate global contextual features, reducing ambiguity from large-scale low-backscatter zones.
- A Local Attention Module (LAM) incorporated into skip connections to refine fine-grained spatial patterns and enhance robustness to localized speckle noise.
- A novel Connectivity Prediction Module (CPM) with a joint loss function that explicitly models water-body topology, forcing the network to produce contiguous, physically realistic water networks rather than fragmented segments.
2. Materials and Methods
2.1. Study Area and Data
2.1.1. Study Area
The study area encompasses the urban zone of Kaifeng City and adjacent reaches of the Yellow River (Figure 1), where the water-body types are diverse and characterized by distinct features. These include the main channel of the Yellow River, historical landscape water bodies within the city, and densely distributed irrigation canals. Conducting high-precision water-body detection in this area is of significant practical value for maintaining the ecological security of the Yellow River basin, preserving the hydrological heritage of the ancient city, and optimizing urban and rural water resource management.
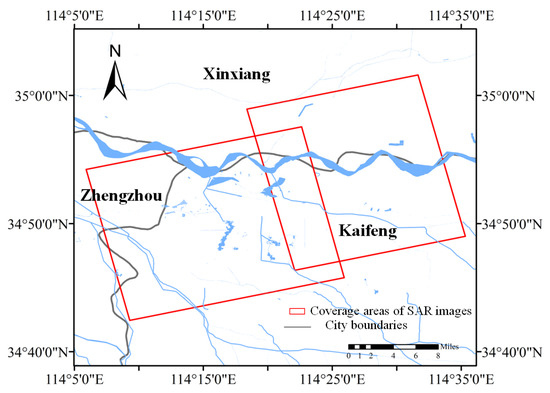
Figure 1.
Location of study area.
2.1.2. SAR Data and Pre-Processing
This study utilizes HISEA-1 and Chaohu-1 SAR data for water-body detection experiments. Two single-look complex (SLC) single-polarized SAR images with VV polarization modes were selected, where the HISEA-1 data acquisition date was 10 February 2022 and the Chaohu-1 data 28 September 2022. Their incident angles are approximately 33.4° and 35.1°. Meanwhile, their coverage areas include multiple types of land features and typical water scenarios, including open lake surfaces, low-lying wetlands, flooded farmland areas, and densely populated urban surface reflector areas. These scenarios exhibit significant differences in surface roughness, electromagnetic scattering mechanisms, and background textures, which can effectively assess the model’s generalization ability in different terrains and scattering environments under limited data conditions. The parameters of HISEA-1 and Chaohu-1 SAR images are as shown in Table 1.

Table 1.
Parameters of HISEA-1 and Chaohu-1SAR images.
The pre-processing steps for obtaining backscatter intensity features from HISEA-1 and Chaohu-1 images are illustrated in Figure 2. The data pre-processing steps encompass multilooking, mean filtering, and ellipsoid correction. Furthermore, the number of range looks and azimuth looks are set to two and one during the multilooking process, respectively. The 3 × 3 window mean filtering is used to mitigate the speckle noise commonly found in SAR images and preserve local textures and edge details, reducing excessive smoothing effects on boundaries. Terrain correction is performed through ellipsoid correction geocoding, obviating the need for additional DEM data. It can ensure accurate geometric positioning and consistent pixel spacing while avoiding terrain-induced distortions in flat areas such as floodplains and lake basins.
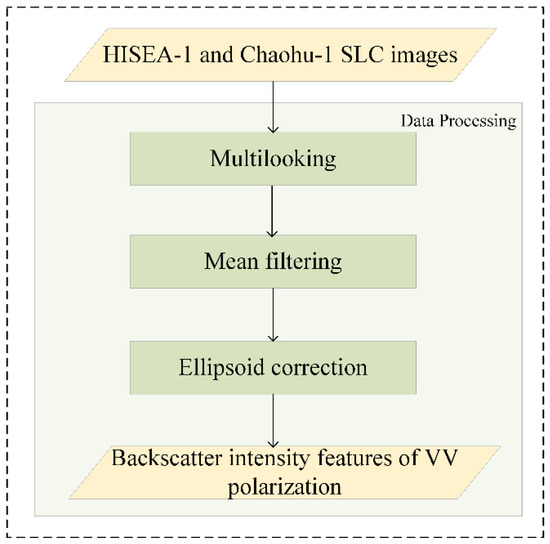
Figure 2.
Pre-processing of the HISEA-1 and Chaohu-1 SLC images.
2.1.3. Dataset Creation
To ensure the accuracy of the sample labels, Google Earth images acquired on dates close to those of the two SAR scenes were selected as references. Water-body regions are delineated by visual interpretation using the Labelme v5.6.0 tool. After the initial annotation, several rounds of manual verification are performed. Mislabels in potentially confusing areas are corrected, and the refined annotations are adopted as the final dataset. The SAR images and corresponding labels are cropped to 512 × 512 pixel patches, followed by synchronized data augmentation operations comprising horizontal flipping, vertical flipping, and diagonal mirroring. The final sample comprises a total of 1052 patches, with 80% designated for training, 10% for validation, and 10% for testing.
2.2. Methodology
The workflow of the proposed method is represented in Figure 3. The method for water-body detection in this study primarily consists of three components. (1) The data pre-processing phase focuses on extracting backscatter intensity features from single-polarized SAR data. (2) Constructing the ConRNet mainly enhances the recognition and optimization of water-body connectivity through architectural refinements and coordinated supervision strategies. (3) Evaluating the performance of ConRNet through quantitative analysis and qualitative analysis. The quantitative analysis employs four evaluation metrics: Precision, Recall, Intersection over Union (IoU), and F1-score, while the qualitative analysis assesses the accuracy and connectivity in the water-body detection results.
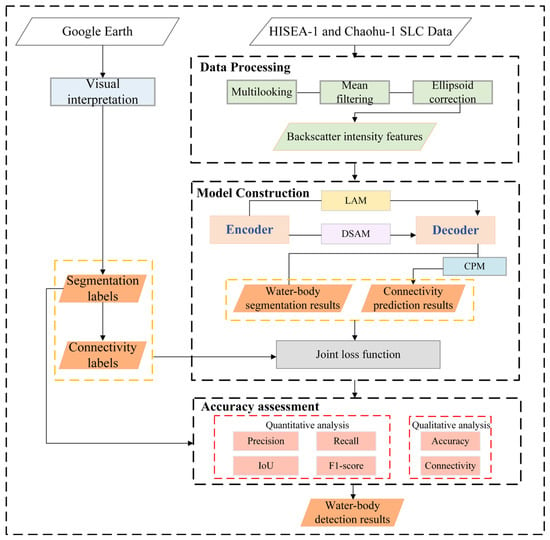
Figure 3.
Flow chart of water-body detection from SAR images using ConRNet.
2.2.1. ConRNet Construction
The proposed ConRNet model adopts an encoder–decoder architecture, as illustrated in Figure 4. Each residual block in the encoder consists of two cascaded 3 × 3 convolutional layers. Through a series of residual blocks and max-pooling operations, the model progressively extracts multi-scale water-body features. In the decoder, the high-level features extracted by the encoder are reconstructed to the same resolution as the input through a sequence of 2 × 2 upsampling and 3 × 3 convolution operations, thereby restoring detail and spatial information. The DSAM is introduced between the encoder and decoder in ConRNet to integrate global contextual features, thereby precisely capturing pixel-level differences between water bodies and the background. LAMs are incorporated within the skip connections to focus on local feature refinement, thereby enhancing the model’s sensitivity to fine-grained features. Furthermore, to optimize water-body connectivity, the CPM is also incorporated into ConRNet, whereby the connectivity prediction task is approximated as a regression problem. The final water-body detection results are obtained by fusing the binarized connectivity prediction output with the segmentation prediction.
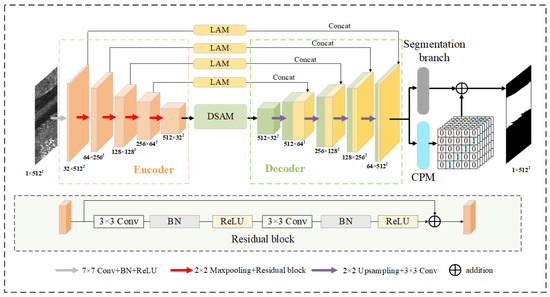
Figure 4.
Structure of ConRNet.
2.2.2. Dual Self-Attention Module
Self-attention mechanisms have been widely adopted in water-body detection, operating by computing feature affinity matrices to generate attention-weighted feature representations, whereby long-range dependencies are captured and feature representational capacity is enhanced. To enhance water-body detection performance, this study introduces the DSAM, which integrates spatial and channel self-attention mechanisms, to capture the global context dependencies that are often missing in traditional convolution operations. SAR backscatter is not only affected by local surface roughness, but also by large-scale scattering environments; therefore, combining dual self-attention in both spatial and channel dimensions enables the model to dynamically emphasize information regions while suppressing redundancy caused by speckle, as shown in Figure 5. The input feature map is processed along two distinct paths, which enables the effective extraction and integration of multidimensional information.
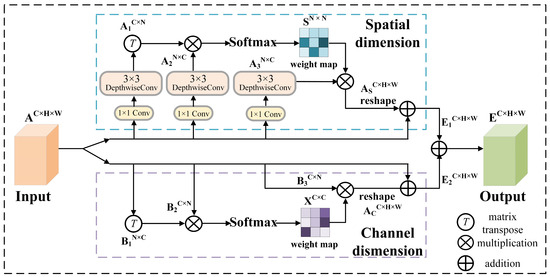
Figure 5.
Structure of DSAM.
In the spatial dimension, global spatial dependencies among feature positions are captured, thereby enhancing the model’s perception of the overall structure of water-body regions. The input feature map is extracted by the encoder, where , , and denote the number of channels, height, and width, respectively. is processed by a 1 × 1 convolution followed by a 3 × 3 depthwise separable convolution. Three feature matrices, , , and , are thereby produced. The 1 × 1 convolution adjusts channel numbers, while the 3 × 3 depthwise separable convolution retains critical spatial information while lowering computational complexity. The matrix is then reshaped into , where . The spatial attention weight map is computed by applying the Softmax function to the matrix multiplication of and the reshaped , where attains higher values when features at positions exhibit stronger similarity. The result obtained by multiplying with is reshaped to . is then scaled by a learnable parameter and is added element-wise to the original feature map to produce the final feature matrix . The process can be represented as follows:
The feature map integrates and global features , thereby optimizing the spatial-dimensional representation of the input features.
In the channel dimension, inter-channel relationships are reflected primarily by the relative importance of individual feature channels, and attention weights computed across channels are employed to selectively enhance or suppress information in specific channels. The input feature map is convolved and reshaped into , , and . After transposing to , the channel attention weight map is computed via matrix multiplication of and followed by the Softmax function. The product of and is then reshaped to , completing the channel-wise feature recalibration. For every spatial position in , the channel-wise feature value is computed as the weighted sum of all channel features at the corresponding position in the original feature map . is then scaled by a learnable factor and is added element-wise to to yield the final feature matrix . The process can be represented as follows:
Global semantic dependencies across channels are fused in the feature map , thereby optimizing the channel dimension of the input features. The final feature map is obtained by performing element-wise addition of the refined feature maps and .
2.2.3. Local Attention Module
The LAM is designed to extract multi-scale local information, expand the local receptive field and enhance the model’s attention to detailed features. Although the DSAM integrates the background, the LAM ensures detailed protection of fine structures such as narrow rivers, ponds, and fragmented submerged areas exhibiting weak or discontinuous backscattering. The use of multi-scale dilated convolution allows for the simultaneous aggregation of features at different receptive field sizes, improving sensitivity to subtle local contrasts. as shown in Figure 6. The input feature map is processed through three parallel pathways, each employing a 3 × 3 dilated convolution with distinct dilation rates to extract features at varying receptive field scales. The dilated convolution operation can be mathematically formulated as follows:
where denotes the input feature map and represents the 3 × 3 dilated convolution operation with a dilation rate of .
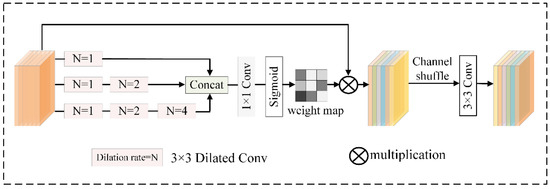
Figure 6.
Structure of the LAM.
The three feature maps processed with different dilated convolutions are concatenated to form a multi-scale composite feature map. A 1 × 1 convolution followed by a sigmoid activation function is then applied to the concatenated feature map, generating an attention-weight map of identical spatial dimensions that represents the importance of different regions. This attention-weight map is subsequently multiplied element-wise with the original feature map, allowing the model to adaptively modulate feature responses across local region. The process can be represented as follows:
where represents the attention-weight map and σ represents the sigmoid function.
The input tensor is divided into multiple groups along the channel dimension in the channel shuffle operation. Within each group, depth-wise separable convolutions are applied to shuffle the channels. The output tensors from all groups are then concatenated along the channel dimension to form a new tensor, which is subsequently processed by a 3 × 3 convolution to extract features, thereby enhancing the representation capacity of local features.
2.2.4. Connectivity Prediction Module
To better capture the topological information of water bodies, this study proposes the CPM, which predicts connectivity relationships between adjacent water-body pixels. The CPM eliminates background interference and explicitly explores topological dependencies among water-body pixel pairs. Connectivity labels are first generated to enable the prediction of water-body topology. Typically, water-body segmentation results are obtained by thresholding the probability map produced using the sigmoid activation. Based on the pixel-level water-body segmentation labels, background information is removed, and water-body connectivity labels are produced, as shown in Figure 7. In Figure 7, the left cube illustrates the water-body region and blue pixels denote water-body pixels, whereas white pixels represent background pixels. The right cube depicts the connectivity labels that are generated by counting adjacent water-body pixels. These labels take into account the spatial distribution and mutual connections of the water-body pixels.
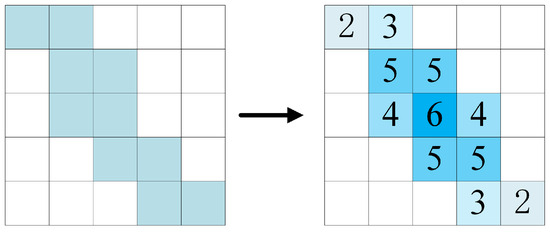
Figure 7.
Illustration of the connectivity label.
The CPM processes the input feature map through a 3 × 3 convolution to generate C channels, where C = 8 corresponds to eight neighborhood directions, as shown in Figure 8. Each channel encodes connectivity information for a specific directional adjacency. The predicted connectivity cube is subsequently recalibrated by a normalization-based channel-attention mechanism [23] so that connectivity information along the most important directions is strengthened. The input feature map is denoted as , where each slice represents the feature map in the -th direction. Channel attention employs the scaling factors from batch normalization (BN) to measure channel importance. BN is first applied to the input feature map, and the absolute values of its scaling factors are normalized to compute a weighting ratio for each channel. These weights are used to perform per-channel weighted multiplication on the input feature map, and the result is further normalized with a sigmoid function, yielding a vector whose elements lie in the range (0, 1), each indicating the importance of the corresponding channel. This weight vector is subsequently multiplied with the original feature map on a channel-by-channel basis, and the weighted multi-channel features are summed along the channel dimension. The process can be represented as follows:
where represents the final output feature map.
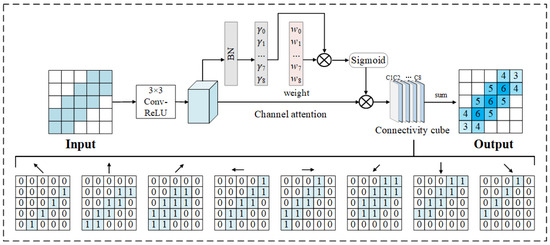
Figure 8.
Structure of the CPM.
Directional features are effectively extracted in the CPM by means of dynamic weight allocation and channel fusion, while computational redundancy is simultaneously reduced, rendering the module suitable for tasks that require pronounced spatial continuity, such as water-body detection. The connectivity prediction output is thresholded to generate a binary water-body mask, which is incorporated into the output of the segmentation branch to yield the final water-body detection results.
2.2.5. Joint Loss Function
A joint loss function that combines segmentation loss and connectivity loss is employed to train the model. Binary cross-entropy loss is adopted as the segmentation criterion to measure pixel-wise classification errors between water bodies and background. The segmentation loss, denoted as , is calculated using the following formula:
where denotes the number of pixels, is the ground truth of the -th pixel (1 for water body, 0 for background), and is the predicted probability of the -th pixel being a water body.
Furthermore, the water connectivity prediction task is formulated as a regression problem, where each pixel predicts a continuous value representing the count of adjacent water pixels within its eight-direction neighborhood, with values ranging from zero to eight. Consequently, mean squared error is utilized as the connectivity loss, denoted as , calculated using the formula
where n denotes the total number of elements in the connectivity cube, represents the predicted connectivity value at the -th position, and represents the connectivity value of corresponding ground truth. The connectivity loss quantitatively measures the topological consistency of water regions, thereby enhancing the model’s comprehension of hydrological connectivity patterns. The final form of the joint loss function is formulated as a weighted combination of the segmentation loss and connectivity loss:
where and are balancing coefficients that control the contributions of the segmentation loss and connectivity loss, respectively. Equal weights are assigned to and in this study. This same proportion achieves the optimal balance between segmentation accuracy and connectivity learning, ensuring stable optimization. By integrating the segmentation loss with the connectivity loss, the spatial structure of water-body regions can be better captured, and the connectivity of water-body detection are enhanced.
3. Results
3.1. Implementation Details
This study utilizes the PyTorch framework to build network models, which are executed on a workstation featuring an NVIDIA RTX A5000 GPU (Made by NVIDIA in Santa Clara, CA, USA) and 24 GB of RAM. The ConRNet is trained utilizing an Adam optimizer, with weight decay set at 0.00001, a learning rate of 0.0001, and a batch size of 4 over a total of 80 epochs. The configuration is presented in Table 2.

Table 2.
Configurations of the experiments.
3.2. Evaluation Metrics
To comprehensively evaluate the performance of the proposed method, four evaluation metrics are used for the quantitative analysis of the water-body detection results. Since and often exhibit a trade-off, using both and F1-score as accuracy metrics in water-body detection provides a more objective assessment. Their calculation formulas are as follows:
where (True Positive) represents he number of pixels that are actually water bodies and correctly classified as water bodies, (False Positive) represents the number of pixels that are actually non-water bodies but incorrectly classified as water bodies, (False Negative) represents the number of pixels that are actually water bodies but incorrectly classified as non-water bodies.
To quantitatively assess the structural integrity and connectivity of detected water bodies, two topology-aware metrics are introduced in addition to conventional IoU and F1. The Connected Components Error (CCE) measures the absolute difference in the number of connected regions between prediction and ground truth: A smaller CCE indicates less fragmentation and better topological consistency. It is defined as:
where and are the numbers of connected water-body regions in the predicted and ground-truth masks, respectively.
The Largest Component IoU (LC-IoU) evaluates the overlap of the largest connected water-body region in prediction and reference. Higher LC-IoU values indicate that the main water body is well preserved.
where and denote the largest connected component in the prediction and ground truth, respectively, and represents the number of pixels in a region.
3.3. Comparative Evaluation of ConRNet and Other Methods
Comparative experiments were conducted between the proposed ConRNet and five semantic segmentation models—FCN [24], U-Net [25], DeepLabv3+ [26], HRNet [27], and MAG-Net [28]. To ensure fairness, all models were trained and evaluated on the SAR dataset constructed in this study.
Water-body detection results for five representative regions in the test set are qualitatively presented in Figure 9. These regions encompass the Yellow River channel (Region A), reservoirs (Regions B and C), small ponds (Region D), and urban water bodies (Region E), with the aim of assessing the model’s capability to detect different water-body types. FCN captures the overall spatial distribution of water bodies but struggles to detect small streams, and it also erroneously classifies roads as water bodies, as shown in the red-boxed areas in Figure 9(e3). Compared with FCN, U-Net and DeepLabv3+ demonstrate improved performance, yet they still fail to fully detect fragmented water bodies, as shown in the red-boxed areas of Figure 9(d4,d5). HRNet demonstrates accurate detection of narrow water streams in Regions A and D. However, as shown in Figure 9(e6), it exhibits significant misclassification errors within the red-boxed areas, where impervious surfaces are falsely identified as water bodies. While MAG-Net demonstrates better performance in maintaining topological consistency compared to previous models, it still falls short of ConRNet in capturing fine details, as shown in the red-boxed areas of Figure 9(b7,c7). Observations indicate that ConRNet accurately and completely detects the Yellow River channel and scattered water bodies, as shown in the red-boxed areas of Figure 9(a8). Furthermore, ConRNet produces markedly fewer misclassifications in Region E than the comparison methods in Figure 9(e8). Specifically, within the blue-boxed areas, the transition zone between the road and the water-body is detected seamlessly, thereby avoiding false positives. Qualitative comparative experiments validate the robustness of ConRNet in water-body detection across diverse backgrounds, making it suitable for the fine-grained detection of water bodies in high-resolution SAR images. It reduces fragmentation and missed detection of small rivers and fragmented water bodies while effectively distinguishing water and non-water regions in urban scenes, thus minimizing noise interference.
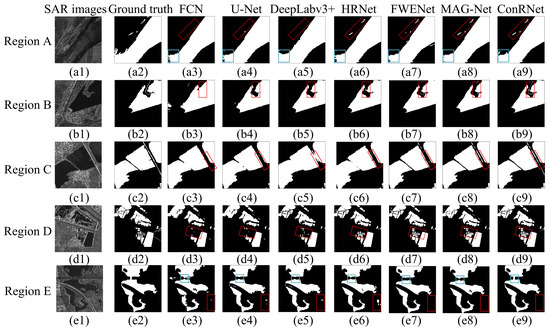
Figure 9.
The detection results of different methods. (a1–e1) SAR images. (a2–e2) Ground truth. (a3–e3) FCN. (a4–e4) U-Net. (a5–e5) DeepLabv3+. (a6–e6) HRNet. (a7–e7) FWENet. (a8–e8) MAG-Net. (a9–e9) ConRNet.
Table 3 presents the quantitative evaluation results of ConRNet and five comparison methods in water-body detection. Overall, ConRNet outperforms the comparison methods across all metrics, with Precision at 94.42%, Recall at 93.28%, IoU at 88.59%, F1-score at 93.87%, CCE at 4, and LC-IoU at 88.36%. FCN performs the worst, with Recall and F1-score below 90%, indicating a high rate of missed detections. Both U-Net and DeepLabv3+ have Precision values below 92%, suggesting relatively high false positive rates in water-body detection. HRNet and MAG-Net achieve IoU scores above 85%, but still fall short of the proposed method by 3.53% and 1.33%, respectively, indicating that the ConRNet delivers better performance. In contrast, traditional architectures such as FCN and U-Net exhibit higher CCE values, reflecting the presence of fragments or fake shards. Indicating that ConRNet produces the most coherent and topologically continuous water-body graph among all comparison methods. Although the proposed model introduces moderate computational cost, it maintains high segmentation accuracy with a favorable balance between efficiency and complexity.

Table 3.
Results of quantitative evaluation by different methods.
3.4. Evaluation of Ablation Experiments
In this study, ConRNet introduces three core modules, DSAM, LAM, and CPM, designed to enhance the accuracy and topological consistency of water-body detection in SAR images. Four ablation experiments were conducted to validate the effectiveness of these modules.
Figure 10 qualitatively presents the ablation results for four regions: the Yellow River channel (Region A), urban water bodies (Region B), water channels in suburban areas (Region C), and streams in agricultural fields (Region D). Case 1 shows significant missed detections for small water bodies and poor water-body connectivity in Figure 10(c3,d3). In Figure 10(b3,b4), due to the absence of the DSAM for integrating global information, both Case 1 and Case 2 suffer from significant false positives in construction areas with low backscatter coefficients, highlighted by the blue-boxed areas. Compared to Case 1, Case 3 provides more complete detection of water bodies in the red-boxed areas of Figure 10(b3,b5). Furthermore, Case 3 significantly improves the detection of water flow in the red-boxed area of Figure 10(d3,d5) by incorporating the LAM, as the LAM effectively integrates information across different scales, enhancing the completeness of small-stream and fragmented water-body detection. In Figure 10(c6,d6), due to the absence of the CPM, Case 4 experiences significant fragmentation, with discontinuous water-body boundaries leading to poor connectivity, thus negatively affecting the overall detection performance. In contrast, ConRNet accurately and completely identifies small water bodies in Regions A and B, benefiting from fine-tuning of local features, which captures water-body details and reduces information loss, and the role of CPM in optimizing water-body connectivity, effectively reducing boundary fragmentation. Overall, ConRNet performs best in all regions, effectively avoiding false positives and missed detections caused by complex backgrounds, demonstrating strong robustness and stability.
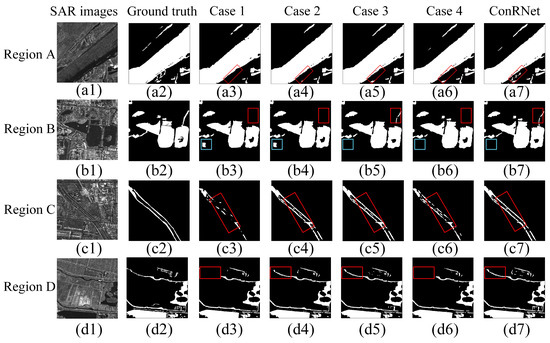
Figure 10.
The qualitative results of ablation experiments. The SAR images, ground truth, and detection results based on Case 1 to ConRNet are shown in (a1–d1), (a2–d2), (a3–d3), (a4–d4), (a5–d5), (a6–d6), and (a7–d7), respectively.
Quantitative results from Table 4 show that the proposed ConRNet model incorporating a DSAM, LFM, and CPM, achieves improved performance metrics compared to other cases. When the DSAM is removed independently, the IoU decreases by 1.76%, the F1-score decreases by 1.72% compared to the ConRNet model, and LC-IoU decreases from 88.36% to 85.03%, while CCE increases from 4 to 6, highlighting the crucial role of the DSAM in enhancing the model’s ability to integrate global features. When the LFM is removed independently, the IoU decreases by 1.95% and the F1-score decreases by 1.05%, accompanied by an increase in CCE from 4 to 7 compared to ConRNet, reflecting the advantage of the LFM in capturing water-body details. Similarly, when the CPM is removed independently, the IoU decreases by 2.66%, the F1-score decreases by 1.46%, and a decline in LC-IoU from 88.36% to 83.97%, while CCE doubles from 4 to 8, indicating the effectiveness of the CPM in modeling water-body connectivity and improving detection performance.

Table 4.
Different cases and the quantitative evaluation for ablation experiments.
4. Discussion
4.1. Model Application
The trained ConRNet model was used to predict water-body spatial distribution maps for the HISEA-1 and Chaohu-1 SAR images. The Yellow River channel has a high sediment content and contains extensive tidal flats, which lead to complex scattering characteristics of the water bodies in the SAR images. Additionally, the water-body surface is affected by wind waves and noise, causing uneven scattering characteristics. As a result, the detection results show some holes and gaps. To address this, mathematical morphology methods, including image erosion and dilation, are applied for post-processing of the detection results. These operations effectively repair some of the missing water-body areas and enhance the clarity of water-body boundaries. The final processed water-body detection results are shown in Figure 11.
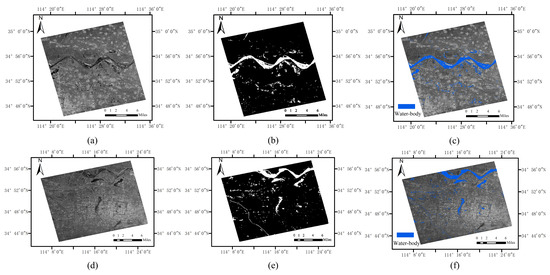
Figure 11.
The water-body detection results predicted by ConRNet. (a) SAR image of HISEA-1. (b) ground truth of HISEA-1 SAR image. (c) Water-body mapping of HISEA-1 SAR image. (d) SAR image of Chaohu-1. (e) Ground truth of Chaohu-1 SAR image. (f) Water-body mapping of Chaohu-1 SAR image.
As shown in Figure 11, the proposed ConRNet model achieves accurate results in water-body detection in the Yellow River channel during both the February and September periods, particularly demonstrating strong discrimination capabilities in rocky and desert areas, while maintaining the connectivity of the main watercourses. Additionally, the method precisely identifies the water-body boundaries of ponds and reservoirs in the lower reaches of the Yellow River, accurately delineating the contours of the water bodies. In urban areas, particularly for small rivers, the proposed ConRNet model also exhibits excellent performance, effectively maintaining the topological connectivity of the water bodies. In low-backscatter-intensity areas such as airport runways and playgrounds, although a small number of misclassified pixels are present, these issues are effectively addressed through post-processing. Overall, the proposed ConRNet model demonstrates excellent performance in water-body detection on SAR images, accurately identifying water bodies in various complex environments and effectively preserving water-body connectivity and boundary details.
4.2. Post-Processing and Error Analysis
To clarify the intrinsic capability of ConRNet independent of manual refinement, we compared the raw network outputs with results after erosion–dilation post-processing. As shown in Table 5, the IoU and LC IoU of the model without post-processing were 87.99% and 87.56%, respectively. Compared with the pre-processed model, the improvements were of 0.6% and 0.8%, indicating that ConRNet inherently has strong topological consistency, and morphological operations mainly provide slight visual smoothness at the water–land interface.

Table 5.
Quantitative evaluation of post-processing.
In some regions with low backscatter values, such as dry lakebeds, the model tends to misclassify non-water surfaces as water due to similar scattering characteristics. To evaluate this effect, we compared model performance in normal and low-backscatter regions. The average IoU in low-backscatter areas decreased by 2.31%, and the Precision decreased by 2.63% compared with normal regions, indicating that scattering ambiguity remains a key limitation for SAR-based water detection, as shown in Table 6.

Table 6.
Quantitative evaluation of error analysis.
4.3. Model Limitations and Future Directions
The Dual Self-Attention Module (DSAM) helps the model understand both spatial and channel relationships in SAR images. SAR backscatter changes with surface roughness, polarization, and incidence angle. By learning these relationships, the DSAM reduces the inconsistency caused by different imaging conditions and highlights continuous water areas. This mechanism helps ConRNet keep water bodies more connected and reduces fragmentation, improving both accuracy and topological consistency.
ConRNet shows good performance within the study area, but its generalization to other SAR sensors is still limited. This is mainly because SAR backscatter is affected by polarization and incidence angle, which vary across sensors. These differences may cause small errors when the model is applied to new data. Future work will focus on improving model robustness through multi-modal data fusion (such as combining SAR and optical images) and domain adaptation to handle sensor differences. We also plan to expand the dataset to include more regions and time periods, so the model can adapt to different surface and environmental conditions.
5. Conclusions
This study proposes the ConRNet model for water-body detection, which combines HISEA-1 and Chaohu-1 SAR images. The ConRNet model introduces attention mechanisms and a CPM, effectively reducing water-body fragmentation and improving both detection connectivity and accuracy. Through the joint supervision of connectivity and segmentation labels, the proposed method not only enhances the representation of water-body topological connectivity but also improves pixel-level classification accuracy. To evaluate the performance of the ConRNet model, comparative experiments are conducted with five semantic segmentation models. The results show that the proposed ConRNet model outperforms the others in water-body detection, with an IoU of 88.59% and an F1-score of 93.87%, accurately identifying surface water bodies while maintaining good connectivity. These findings highlight the potential of connectivity-aware learning for improving the topological reliability of SAR-based segmentation tasks. The proposed framework provides a methodological reference for future research on flood mapping, wetland monitoring, and cross-sensor water-body detection using deep learning approaches.
Author Contributions
Z.G., J.S. and P.X. conceived the study, conducted the research, and wrote the original draft; L.W. and Q.P. supervised the research and contributed to manuscript refinement; Y.H., N.L. and Z.Z. performed the SAR data analysis. All authors have read and agreed to the published version of the manuscript.
Funding
This work was supported by the Key R&D Project of Science and Technology of Kaifeng City (22ZDYF006).
Data Availability Statement
The code and data that support the findings of this study are available from the authors upon reasonable request.
Acknowledgments
The authors would like to express their gratitude to all those who helped with this work.
Conflicts of Interest
The authors declare no conflicts of interest.
References
- Cheng, T.; Liu, R.; Zhou, X. Water Information Extraction Method in Geographic National Conditions Investigation Based High Resolution Remote Sensing Images. Bull. Surv. Mapp. 2014, 4, 86–89. [Google Scholar]
- Huang, W.; DeVries, B.; Huang, C.; Lang, M.W.; Jones, J.W.; Creed, I.F.; Carroll, M.L. Automated extraction of surface water extent from Sentinel-1 data. Remote Sens. 2018, 10, 797. [Google Scholar] [CrossRef]
- Guo, Z.; Wu, L.; Huang, Y.; Guo, Z.; Zhao, J.; Li, N. Water-body segmentation for SAR images: Past, current, and future. Remote Sens. 2022, 14, 1752. [Google Scholar] [CrossRef]
- Liu, H.; Jezek, K.C. Automated Extraction of Coastline from Satellite Imagery by Integrating Canny Edge Detection and Locally Adaptive Thresholding Methods. Int. J. Remote Sens. 2004, 25, 937–958. [Google Scholar] [CrossRef]
- Tan, J.; Tang, Y.; Liu, B.; Zhao, G.; Mu, Y.; Sun, M.; Wang, B. A self-adaptive thresholding approach for automatic water extraction using sentinel-1 SAR imagery based on Otsu algorithm and distance block. Remote Sens. 2023, 15, 2690. [Google Scholar] [CrossRef]
- Silveira, M.; Heleno, S. Classification of Water Regions in SAR Images Using Level Sets and Non-Parametric Density Estimation. In Proceedings of the 16th IEEE International Conference on Image Processing (ICIP), Cairo, Egypt, 7–10 November 2009; pp. 1685–1688. [Google Scholar]
- Li, N.; Wang, R.; Deng, Y.; Chen, J.; Liu, Y.; Du, K.; Lu, P.; Zhang, Z.; Zhao, F. Waterline Mapping and Change Detection of Tangjiashan Dammed Lake After Wenchuan Earthquake from Multitemporal High-Resolution Airborne SAR Imagery. IEEE J. Sel. Top. Appl. Earth Obs. Remote Sens. 2014, 7, 3200–3209. [Google Scholar] [CrossRef]
- Possa, E.M.; Maillard, P. Precise delineation of small water bodies from Sentinel-1 data using support vector machine classification. Can. J. Remote Sens. 2018, 44, 179–190. [Google Scholar] [CrossRef]
- Zhang, X.; Xu, J.; Chen, Y.; Xu, K.; Wang, D. Coastal wetland classification with GF-3 polarization SAR imagery by using object-oriented random forest algorithm. Sensors 2021, 21, 3395. [Google Scholar] [CrossRef]
- Obida, C.B.; Blackburn, G.A.; Whyatt, J.D.; Semple, K.T. River Network Delineation from Sentinel-1 SAR Data. Int. J. Appl. Earth Obs. Geoinf. 2019, 83, 101910. [Google Scholar] [CrossRef]
- Xu, P.; Gao, Z.; Wu, L.; Guo, Z.; Li, N.; Geng, Z.; Huang, Y. Water-Body Detection from Synthetic Aperture Radar Images Using Dual-Branch Fusion Network. J. Appl. Remote Sens. 2025, 19, 021008. [Google Scholar] [CrossRef]
- Zhan, W.; Chen, Y.; Liu, Q.; Li, J.; Sacchi, M.D.; Zhuang, M.; Liu, Q.H. Simultaneous prediction of petrophysical properties and formation layered thickness from acoustic logging data using a modular cascading residual neural network (MCARNN) with physical constraints. J. Appl. Geophys. 2024, 224, 105362. [Google Scholar] [CrossRef]
- Liu, D.; Wang, Q.; You, N.; Sacchi, M.D.; Chen, W. Filling the Gap: Enhancing Borehole Imaging with Tensor Neural Network. Geophysics 2024, 90, D71–D83. [Google Scholar] [CrossRef]
- Li, N.; Guo, Z.; Zhao, J.; Wu, L.; Guo, Z. Characterizing ancient channel of the Yellow River from spaceborne SAR: Case study of Chinese Gaofen-3 satellite. IEEE Geosci. Remote Sens. Lett. 2022, 19, 1502805. [Google Scholar] [CrossRef]
- Chen, L.; Zhang, P.; Xing, J.; Li, Z.; Xing, X.; Yuan, Z. A multi-scale deep neural network for water detection from SAR images in the mountainous areas. Remote Sens. 2020, 12, 3205. [Google Scholar] [CrossRef]
- Zhang, J.; Xing, M.; Sun, G.-C.; Chen, J.; Li, M.; Hu, Y.; Bao, Z. Water body detection in high-resolution SAR images with cascaded fully-convolutional network and variable focal loss. IEEE Trans. Geosci. Remote Sens. 2020, 59, 316–332. [Google Scholar] [CrossRef]
- Ren, Y.; Li, X.; Yang, X.; Xu, H. Development of a dual-attention U-Net model for sea ice and open water classification on SAR images. IEEE Geosci. Remote Sens. Lett. 2021, 19, 4010205. [Google Scholar] [CrossRef]
- Han, B.; Xing, G.; Lu, X.; Basu, A. AFUNet with active contour loss for water body detection in SAR imagery. IEEE J. Sel. Top. Appl. Earth Obs. Remote Sens. 2024, 17, 17540–17554. [Google Scholar] [CrossRef]
- Huang, B.; Li, P.; Lu, H.; Yin, J.; Li, Z.; Wang, H. WaterDetectionNet: A new deep learning method for flood mapping with SAR image convolutional neural network. IEEE J. Sel. Top. Appl. Earth Obs. Remote Sens. 2024, 17, 14471–14485. [Google Scholar] [CrossRef]
- Wang, J.; Jia, D.; Xue, J.; Wu, Z.; Song, W. Automatic water body extraction from SAR images based on MADF-Net. Remote Sens. 2024, 16, 3419. [Google Scholar] [CrossRef]
- Zortea, M.; Muszynski, M.; Fraccaro, P.; Weiss, J. Flood Mapping Using Sentinel-1 Images and Light-Weight U-Nets Trained on Synthesized Events. IEEE Geosci. Remote Sens. Lett. 2023, 20, 1502905. [Google Scholar] [CrossRef]
- Yuan, Q.; Wu, L.; Huang, Y.; Guo, Z.; Li, N. Water-body detection from spaceborne SAR images with DBO-CNN. IEEE Geosci. Remote Sens. Lett. 2023, 20, 4013405. [Google Scholar] [CrossRef]
- Liu, Y.; Shao, Z.; Teng, Y.; Hoffmann, N. NAM: Normalization-based attention module. arXiv 2021, arXiv:2111.12419. [Google Scholar] [CrossRef]
- Long, J.; Shelhamer, E.; Darrell, T. Fully convolutional networks for semantic segmentation. In Proceedings of the IEEE conference on computer vision and pattern recognition, Boston, MA, USA, 7–12 June 2015; pp. 3431–3440. [Google Scholar]
- Ronneberger, O.; Fischer, P.; Brox, T. U-net: Convolutional networks for biomedical image segmentation. In Medical Image Computing and Computer-Assisted Intervention–MICCAI 2015: 18th International Conference; Springer: Munich, Germany, 2015. [Google Scholar]
- Chen, L.C.; Zhu, Y.; Papandreou, G.; Schroff, F.; Adam, H. Encoder-decoder with atrous separable convolution for semantic image segmentation. In Proceedings of the European Conference on Computer Vision (ECCV); Springer: Berlin/Heidelberg, Germany, 2018; pp. 801–818. [Google Scholar]
- Sun, K.; Xiao, B.; Liu, D.; Wang, J. Deep high-resolution representation learning for human pose estimation. In Proceedings of the IEEE/CVF Conference on Computer Vision and Pattern Recognition, Long Beach, CA, USA, 15–20 June 2019; pp. 5693–5703. [Google Scholar]
- Zhu, L.; Zhou, Z.; Zhang, Y.; Sun, Y.; Liu, X.; Kan, X.; Cao, H.; Li, Z. Water body extraction based on multi-scale attention from synthetic aperture radar images. J. Appl. Remote Sens. 2024, 18, 036510. [Google Scholar] [CrossRef]
Disclaimer/Publisher’s Note: The statements, opinions and data contained in all publications are solely those of the individual author(s) and contributor(s) and not of MDPI and/or the editor(s). MDPI and/or the editor(s) disclaim responsibility for any injury to people or property resulting from any ideas, methods, instructions or products referred to in the content. |
© 2025 by the authors. Licensee MDPI, Basel, Switzerland. This article is an open access article distributed under the terms and conditions of the Creative Commons Attribution (CC BY) license (https://creativecommons.org/licenses/by/4.0/).