1. Introduction
In recent years, with the accelerated pace of industrialization and the expansion of urban land use, the invasion of arable land resources has become more and more severe [
1]. According to the 2022 national land use change survey, the total arable land area in China was 127.6 million hectares, while construction land accounted for 42 million hectares, representing a net increase of approximately 293,000 hectares compared to the end of 2021. At the international level, China’s population has reached 1.412 billion. With rapid population growth and economic development, the human–land conflict has become more pronounced, and the irrational use of arable land resources has become increasingly evident [
2,
3,
4], leading to an intensification of the non-agriculturalization of arable land. Previous studies indicate that the low economic returns of arable land inevitably drive its conversion to higher-profit land types, such as construction land and garden plots [
5,
6]. Non-agriculturalization of arable land exacerbates the scarcity of an already limited resource, posing a serious threat to the security of the 1.8 billion mu (approximately 120,000 km
2) arable land red line’, increasing risks to food security, and contributing to ecological degradation and loss of agricultural ecosystem services [
7,
8], as well as large-scale transfer of rural labor to non-agricultural sectors [
9].
With the rapid advancement of aerospace remote sensing technology, remote sensing imagery has become an essential tool for monitoring changes in arable land, particularly demonstrating significant value in the identification of non-agriculturalization [
10,
11]. Its core advantage lies in the ability to capture high-resolution large-scale surface information through satellite imagery, providing robust support for the monitoring and analysis of arable land dynamics [
12,
13,
14]. Numerous studies have been conducted in the field of arable land resource monitoring, focusing primarily on the extraction of spatial information from arable land [
15], the assessment of quality changes [
16], the spatio-temporal dynamics [
17,
18], the analysis of change of land use/land cover (LULC) [
19,
20,
21] and the exploration of spatial patterns without agriculture. For example, monitoring based on Landsat imagery enables the rapid extraction of spatial distribution information for both arable and non-arable land, while comparative analysis of multi-temporal imagery facilitates the detection of dynamic changes in arable land [
22,
23].
At the same time, with continuous advancements in remote sensing and spatial analysis techniques, spatio-temporal pattern analysis has gradually emerged as a key approach for investigating arable land non-agriculturalization. By integrating remote sensing imagery with spatial analytical methods [
24], researchers can accurately examine the spatio-temporal variations and regional heterogeneity of non-agriculturalization processes. Commonly applied methods in spatio-temporal evolution studies include spatial autocorrelation analysis and hotspot analysis, which reveal the degree of clustering and evolutionary trends of non-agriculturalized regions, providing critical support for land management and arable land protection [
25,
26]. For example, spatial autocorrelation analysis based on multi-temporal remote sensing imagery can quantitatively assess the spatial association of arable land non-agriculturalization across different regions, whereas hotspot analysis helps identify concentrated zones of non-agriculturalization. Furthermore, researchers frequently integrate remote sensing data with socioeconomic statistics to explore the driving mechanisms of non-agriculturalization, including factors such as economic growth, urban expansion, and population density [
27,
28,
29]. Similar studies have been conducted in various global contexts, such as mapping mangrove change using remote sensing in Samut Songkhram Province, Thailand [
30], analyzing agricultural land transition dynamics in the Thiès region, Senegal through integrated remote sensing and survey data [
31], and detecting the impact of urban expansion on arable land in the Buenos Aires metropolitan region, South America [
32].
Existing studies have shown that urban fringes and urban–rural transition zones are areas of high incidence of non-agriculturalization, strongly influenced by infrastructure development and rising land values. These findings provide a theoretical foundation for understanding the spatial characteristics of arable land non-agriculturalization. In summary, although significant progress has been made in monitoring arable land non-agriculturalization and conducting spatio-temporal analyses, existing studies primarily rely on medium- to low-resolution data sources, which limits their capability for high-precision dynamic monitoring. In addition, relatively few studies have comprehensively characterized both the evolution of spatial patterns and the underlying driving processes. To address these gaps, this study uses Sentinel-2 satellite imagery. First, four categories of characteristics were selected and optimized by principal component analysis (PCA), and refined characteristics were used for image classification using four different algorithms to extract relevant land cover information. Second, the algorithm with the highest classification accuracy was applied for annual arable land classification, and GIS-based spatial analysis was used to visualize temporal changes in arable land. Finally, the geographic detector model was used to quantitatively reveal the driving mechanisms of localized non-agriculturalization.
2. Materials and Methods
2.1. Overall Research Route
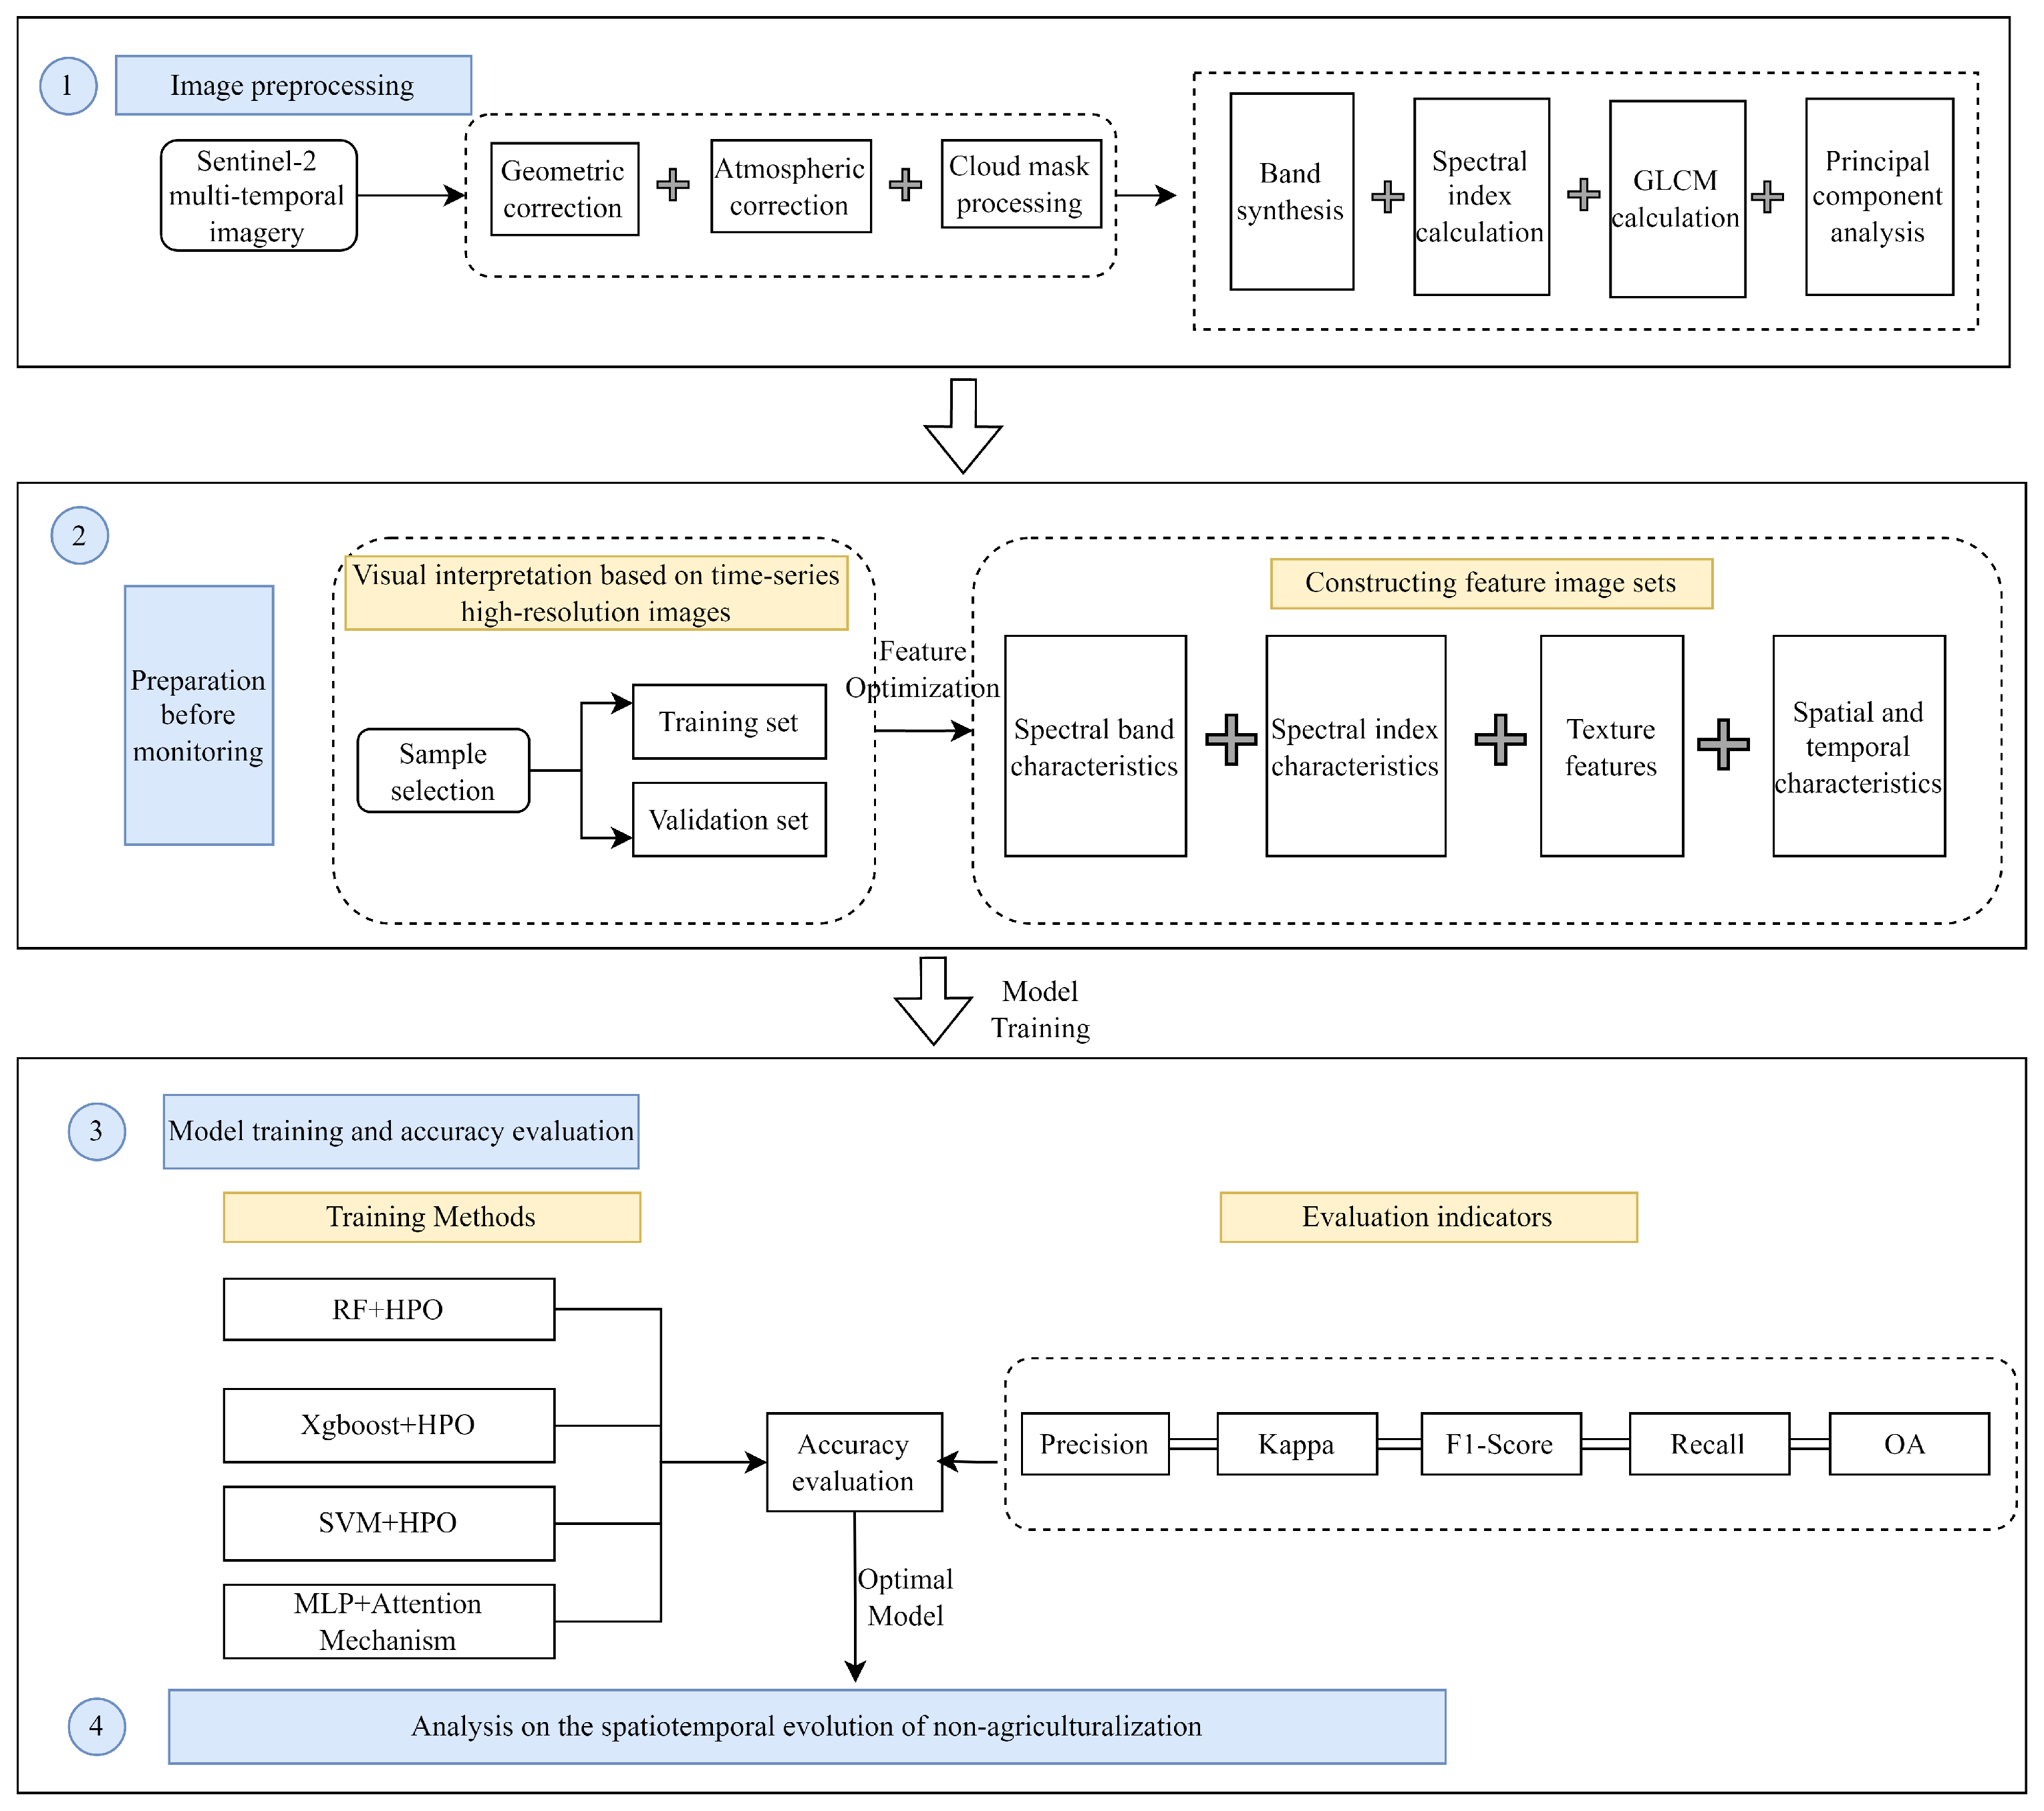
In this study, Sentinel-2 satellite images were selected, four types of features were chosen for the study and feature variables were optimized by principal component analysis method, the optimized features were classified based on four basic algorithms for image classification, relevant feature information was extracted, the algorithm with the highest model accuracy was selected for year-by-year arable land classification and GIS spatial analysis method was used to show the change of temporal arable land, and, finally, socioeconomic factors and natural factors driving force analysis was performed. The overall flow chart is shown in
Figure 1.
2.2. Study Area
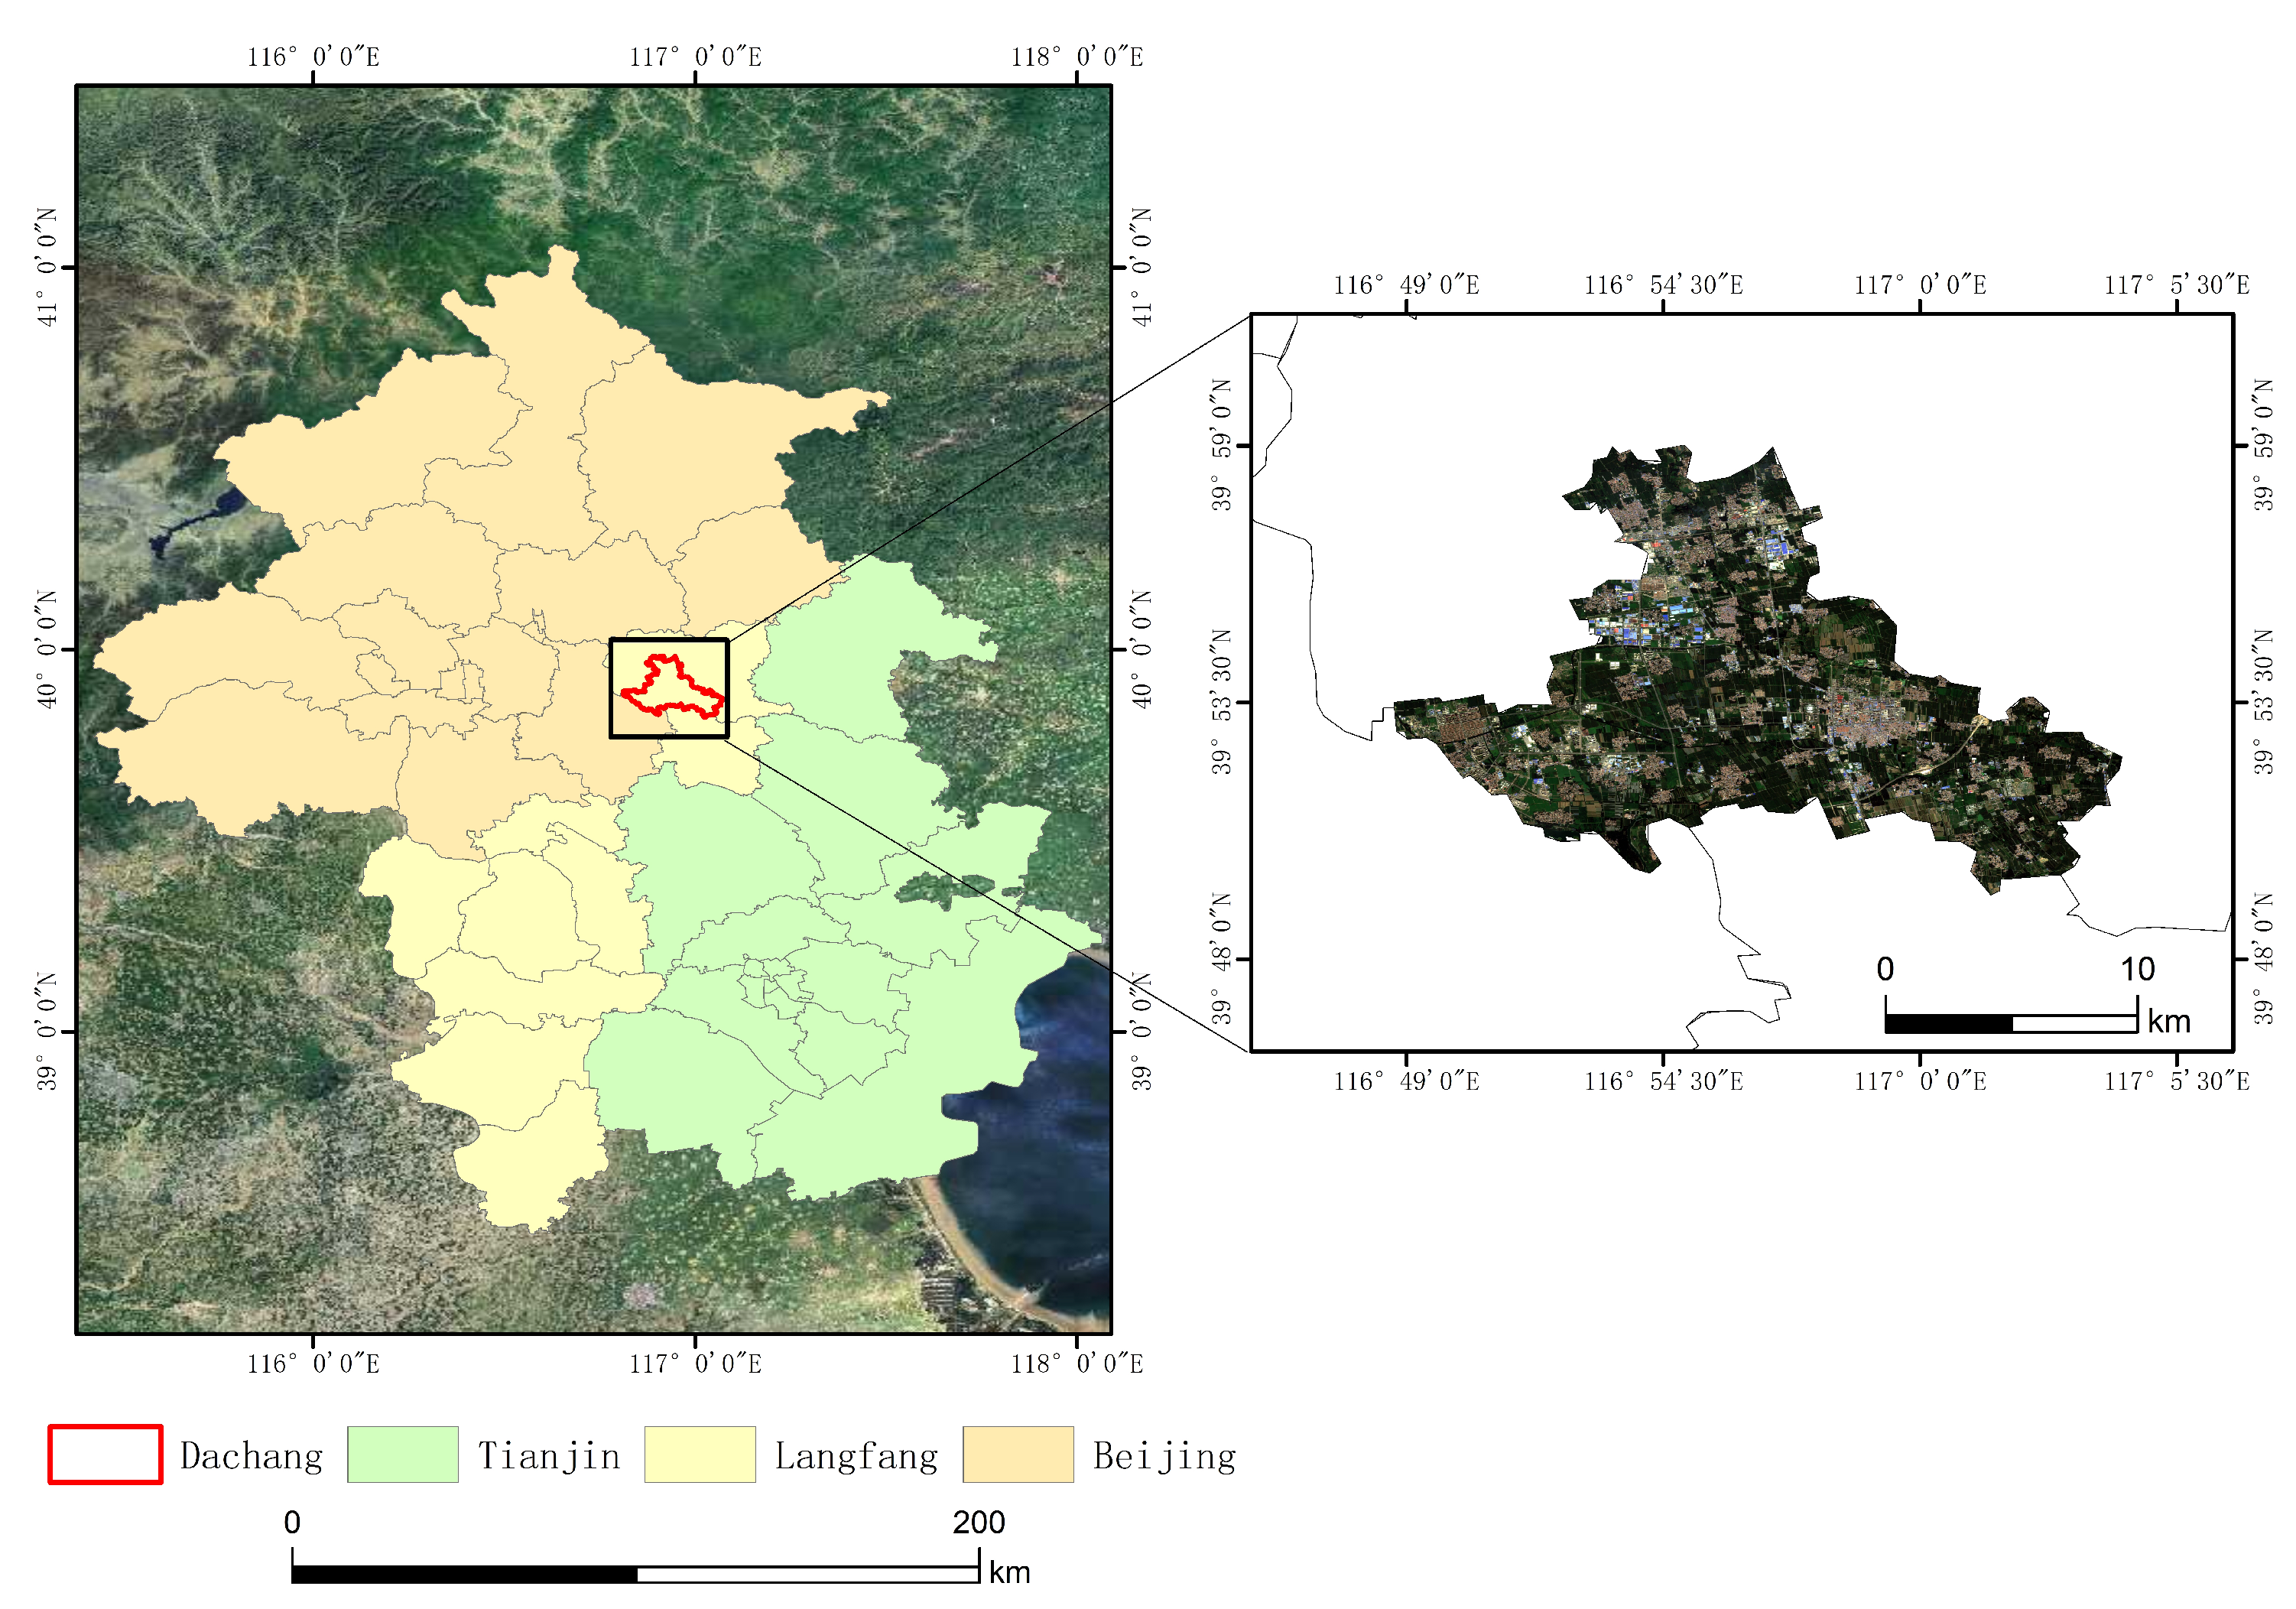
The study area selected for this research is Dachang Hui Autonomous County, located in Langfang City, in the central and northern part of Hebei Province, within the core region of the Bohai Economic Rim. The county covers a total area of 176.3 km
2 and serves as a key node of the Beijing–Tianjin–Hebei (BTH) coordinated development strategy, exhibiting typical characteristics of a metropolitan fringe zone. Geographically, it is situated between 39°
–39°
N latitude and 116°
–117°
E longitude. The region has a warm temperate, semi-humid to semi-arid continental monsoon climate, with an average annual precipitation of approximately 555.4 mm and a mean annual temperature of 11.9 °C. As an area adjacent to Beijing’s Tongzhou Subcenter, Dachang County has experienced significant spillover effects of urban expansion and industrial relocation in recent years, making it a primary recipient of Beijing’s industrial transfer and functional decentralization of the urban. Consequently, its land use structure has undergone dramatic transformations, particularly the rapid conversion of agricultural land to non-agricultural uses such as industrial, logistics, and real estate development, leading to a pronounced phenomenon of arable land non-agriculturalization. At the same time, this area is among those with stringent enforcement of arable land protection policies in recent years. Therefore, Dachang County exemplifies both the severe pressure on arable land caused by accelerated urbanization and the intertwined impacts of policy interventions and spatial evolution. Selecting this region as a case study enables an in-depth examination of the driving mechanisms, spatio-temporal evolution, and policy responses of arable land non-agriculturalization in metropolitan fringe areas. Such insights have representative and transferable value for the formulation of arable land protection strategies in the context of rapid urban expansion. The geographical overview of the study area is shown in
Figure 2.
2.3. Data and Preprocessing
Considering the evolutionary characteristics of non-agriculturalization of arable land and the temporal heterogeneity of samples within the study area, this research selected Sentinel-2 remote sensing imagery from August for each year between 2016 and 2023. August represents a critical period of agricultural production. In China, particularly within the study area, the main agricultural activities typically follow a seasonal cycle: sowing in spring, crop growth in summer, and harvesting in autumn. Therefore, selecting August imagery effectively captures the growth status of arable land and the key phase of land use transformation. Moreover, August imagery provides representative features of land cover and arable land utilization, including crop growth stages, the occurrence of non-agriculturalization, and its spatial distribution, thereby facilitating the analysis of the spatio-temporal dynamics of arable land non-agriculturalization.
For data selection, this study used Level-2A products released by the European Space Agency (ESA). These data sets have undergone radiometric calibration, atmospheric correction, and orthorectification, providing surface reflectance characteristics that meet the accuracy requirements to monitor spatio-temporal dynamics, thereby aligning with the objectives of this research. Sentinel-2 employs a multispectral sensor with 13 spectral bands, offering comprehensive coverage for land surface analysis. Image acquisition and pre-processing were performed using the Google Earth Engine (GEE) platform, a cloud-based geospatial analysis system developed by Google that enables online visualization, computation, and large-scale processing of Earth observation data. GEE provides access to extensive repositories of satellite imagery and geospatial datasets, hosting more than 200 public datasets and more than 5 million individual images. Compared with traditional desktop software such as ENVI5.6, GEE offers significant advantages in terms of computational efficiency and scalability, enabling rapid and batch processing of large volumes of imagery, which is critical for multi-temporal analysis at regional scales.
The data set of images, comprising eight selected spectral bands, is summarized in
Table 1. During the pre-processing stage, cloud and shadow removal was performed first using a combined masking approach based on the QA60 quality band and cloud probability scores to eliminate high-cloud contamination. Subsequently, each image was spatially clipped to the administrative boundary of the study area, and the eight selected bands were standardized to enhance spectral comparability across different acquisition dates. To address missing and anomalous values, linear interpolation was applied for gap filling, while statistical distribution analysis was used to identify and remove outliers. This preprocessing workflow ensured temporal consistency and accurate spatial registration of the imagery, providing a robust and reliable data base for subsequent land cover classification, change detection, and spatial analysis.
To analyze changes in arable land and the driving forces behind its non-agriculturalization in Dachang County from 2016 to 2023, this study comprehensively selected six potential influencing factors, as shown in
Table 2: topography (DEM), mean annual precipitation, intensity of nightlight, mean annual NDVI, population density, and GDP per capita. The selection of these variables was primarily based on driving frameworks commonly adopted in existing land use change studies and the key pathways influencing land transformation in the metropolitan fringe areas [
33,
34]. Specifically, topography and precipitation reflect the constraints imposed by natural geographic conditions on land suitability, serving as fundamental determinants of arable land distribution and development potential. Nighttime light intensity, widely recognized as a spatial proxy for the urbanization process, has been extensively applied to depict the intensity of human activity and the density of land development and has been shown to be highly correlated with urban expansion and non-agriculturalization in numerous studies [
35]. The annual mean NDVI indicates the level of vegetation cover and ecological quality, indirectly representing the production conditions and the trends of arable land degradation. Meanwhile, population density and per capita GDP, respectively, capture demographic pressure and economic development level, both of which are major socioeconomic drivers of urban expansion and land use functional transformation. Therefore, these six factors, covering natural, ecological, and socioeconomic dimensions, provide a comprehensive characterization of the potential driving mechanisms of arable land non-agriculturalization and demonstrate strong representativeness and applicability.
The topographic data (DEM) were obtained from the US Earth Observation Global Elevation Dataset (
https://lpdaac.usgs.gov. accessed on 10 March 2025). Precipitation data were sourced from the Resource and Environmental Science Data Center of the Chinese Academy of Sciences (
https://www.resdc.cn. accessed on 12 March 2025). The nighttime light intensity data was derived from the NPP/VIIRS nighttime light remote sensing data set (
https://ngdc.noaa.gov/eog/viirs.html. accessed on 12 March 2025). VIIRS (Visible Infrared Imaging Radiometer Suite) is a satellite sensor jointly developed by the National Oceanic and Atmospheric Administration (NOAA) and the National Aeronautics and Space Administration (NASA) for Earth observation. Population density and GDP data per capita were obtained from statistical yearbooks published by the Hebei Provincial Bureau of Statistics (
http://tjj.hebei.gov.cn. accessed on 15 March 2025).
2.4. Research Methods
2.4.1. Feature Optimization
Remote sensing imagery typically contains high-dimensional, multiband feature information, where strong interband correlations may lead to feature redundancy, thereby reducing model training efficiency and generalization capability. To enhance the stability and interpretability of the model, this study employs Principal Component Analysis (PCA) [
36] to perform dimensional reduction in the original features of remote sensing. PCA, as a classical unsupervised feature reduction technique, retains the principal components that account for the maximum data variance within a minimal set of dimensions, effectively removing redundant information while emphasizing dominant features. In this study, PCA contributes to compressing the dimensions of the input features, mitigating the risk of overfitting, and improving both the efficiency of model training and the precision of subsequent analysis of driving factors. The relevant mathematical formulation is expressed as follows.
First, all features are centralized, and then the covariance matrix is computed. The eigenvalues and the corresponding eigenvectors (, , …, ) of the covariance matrix C are determined. Finally, the original features are projected onto the selected eigenvectors to obtain the new K-dimensional features after dimensionality reduction.
2.4.2. RF + HPO
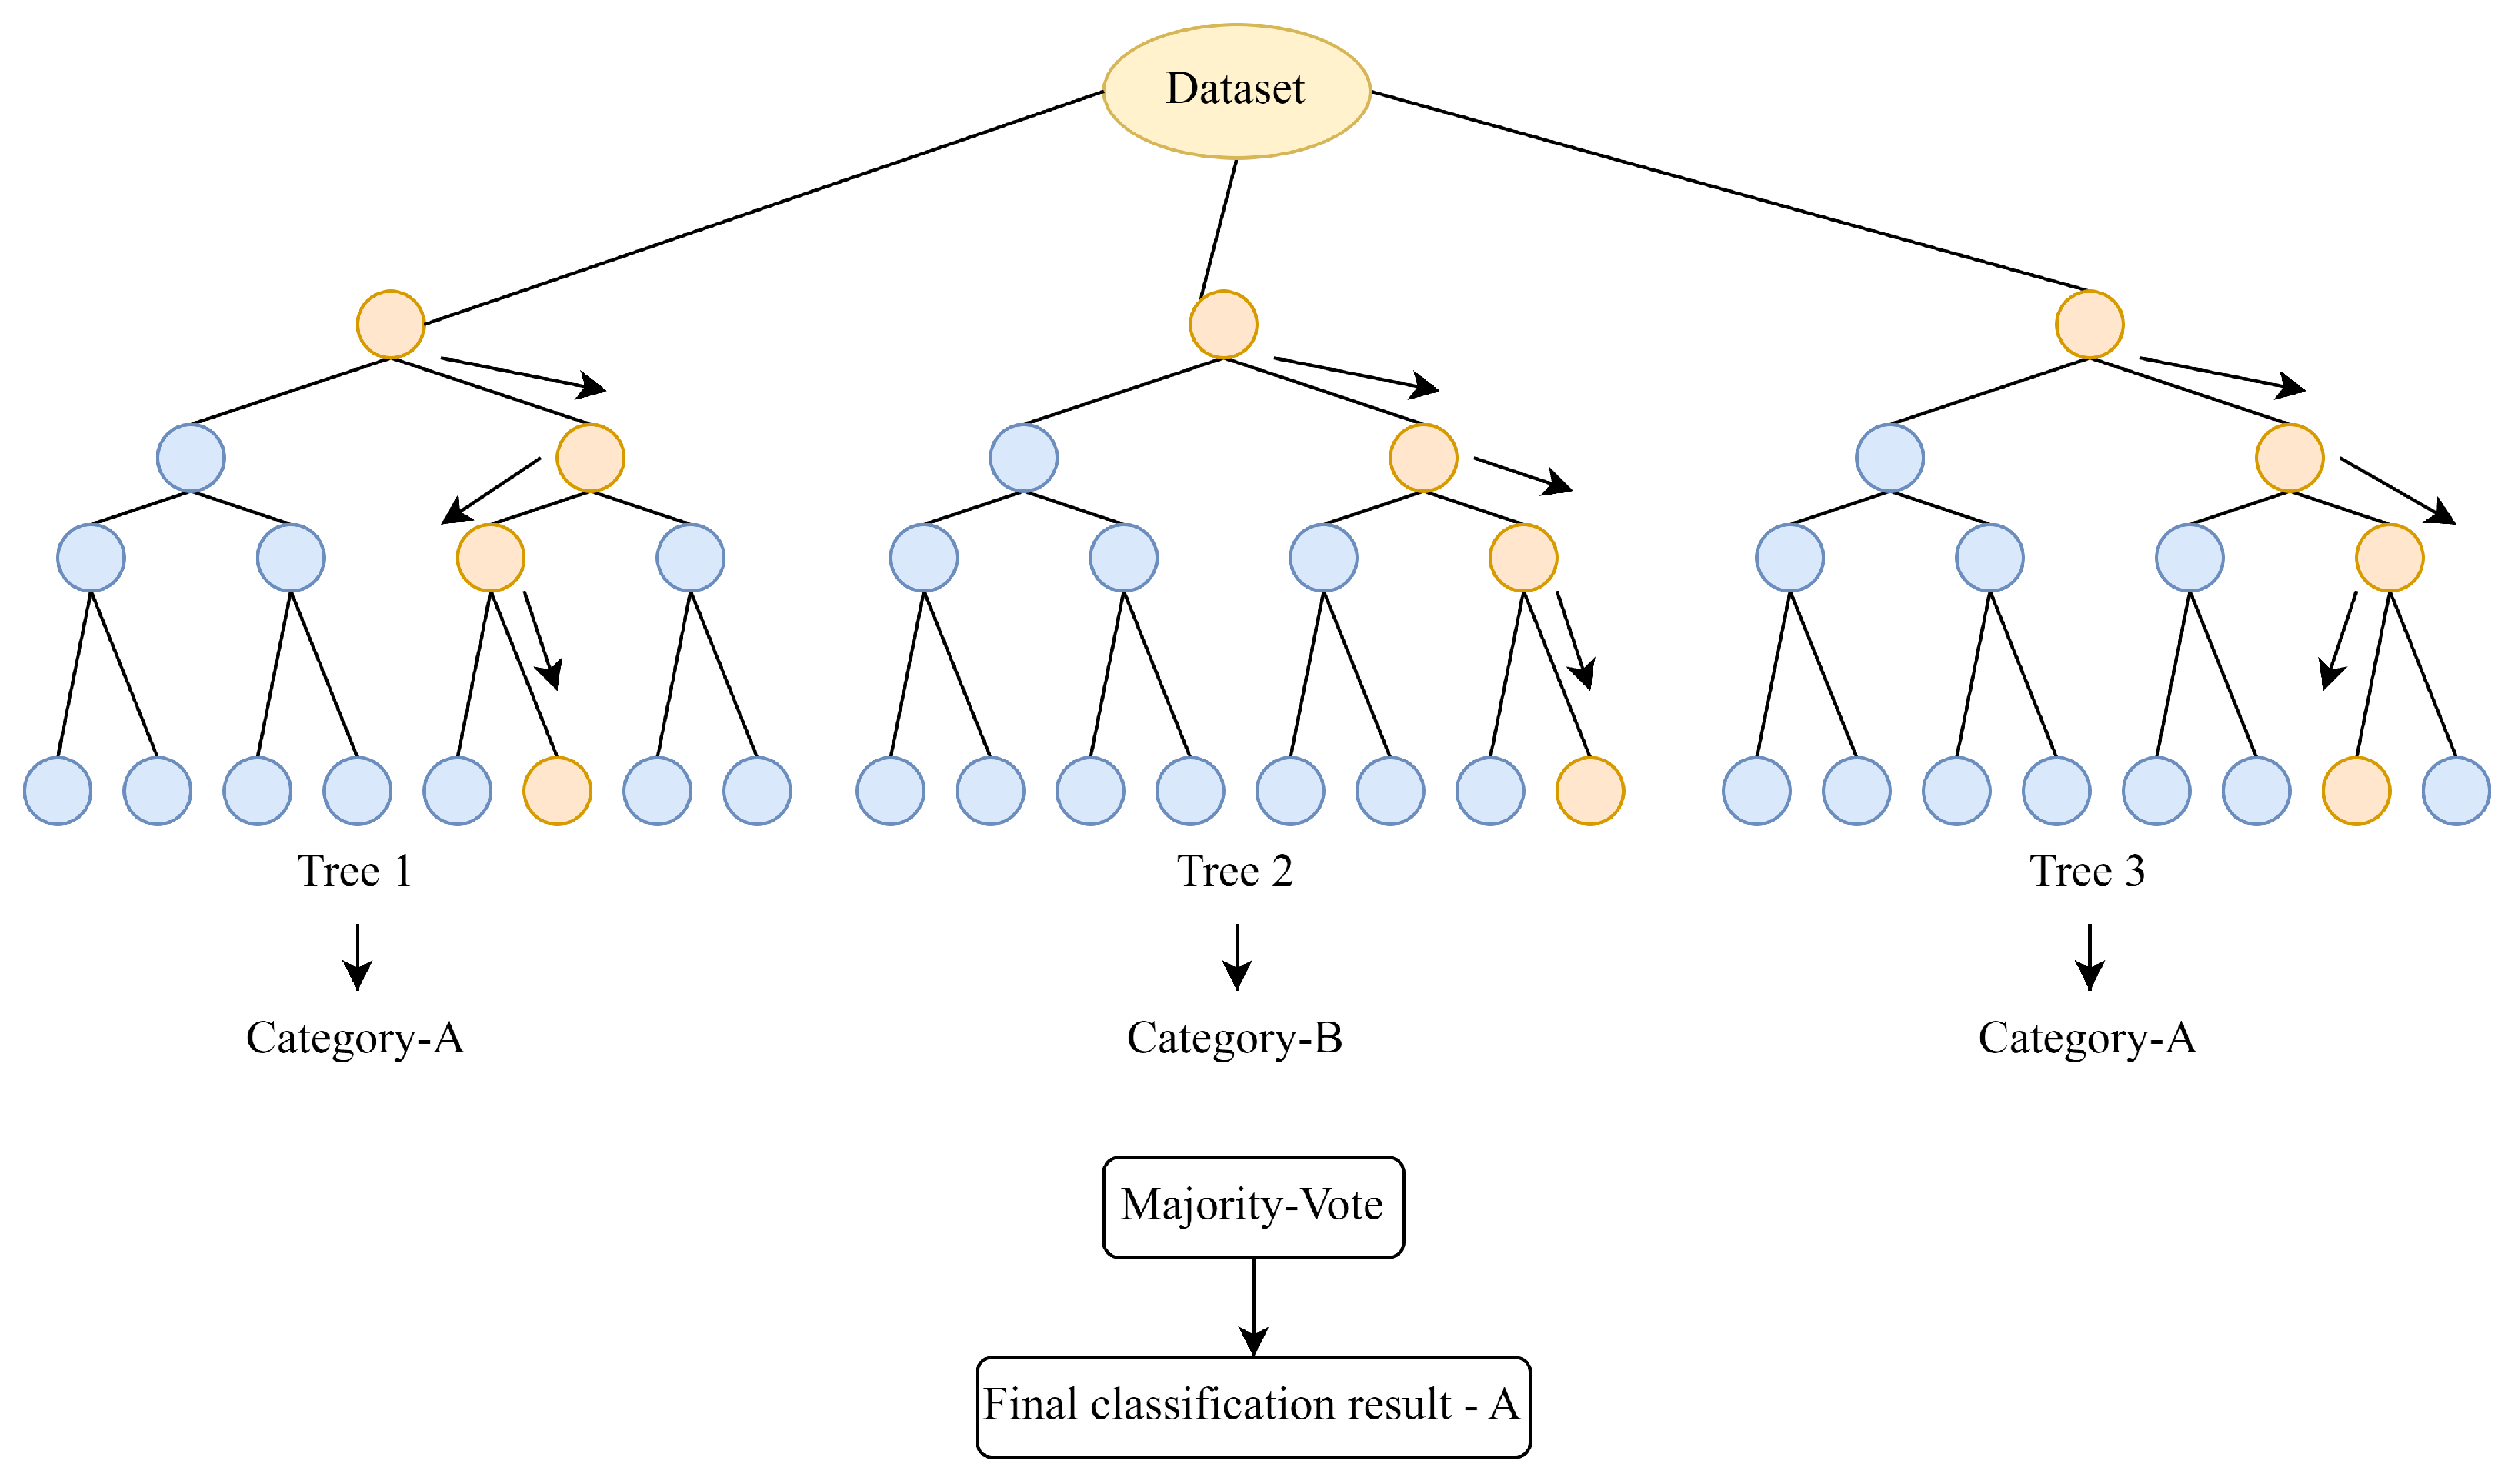
In this study, the Random Forest (RF) algorithm was employed for the classification of arable land non-agriculturalization. As an ensemble learning model with strong generalization capability and robustness, RF exhibits stable performance in handling high-dimensional remote sensing features and complex land cover categories. It is also insensitive to outliers and feature redundancy, making it particularly suitable for land cover classification in multi-source data fusion scenarios (
Figure 3) [
37]. To further improve model performance and address the high computational cost and low search efficiency of traditional hyperparameter tuning approaches, Bayesian Hyperparameter Optimization (BHO) was introduced. BHO constructs a surrogate model to predict the performance of candidate hyperparameter combinations and adaptively adjusts the search trajectory, enabling efficient optimization with fewer iterations. The integration of RF and BHO improves training efficiency and stability while maintaining high classification accuracy, demonstrating strong adaptability and interpretability in the multi-temporal remote sensing image classification tasks of this study.
2.4.3. XGBoost + HPO
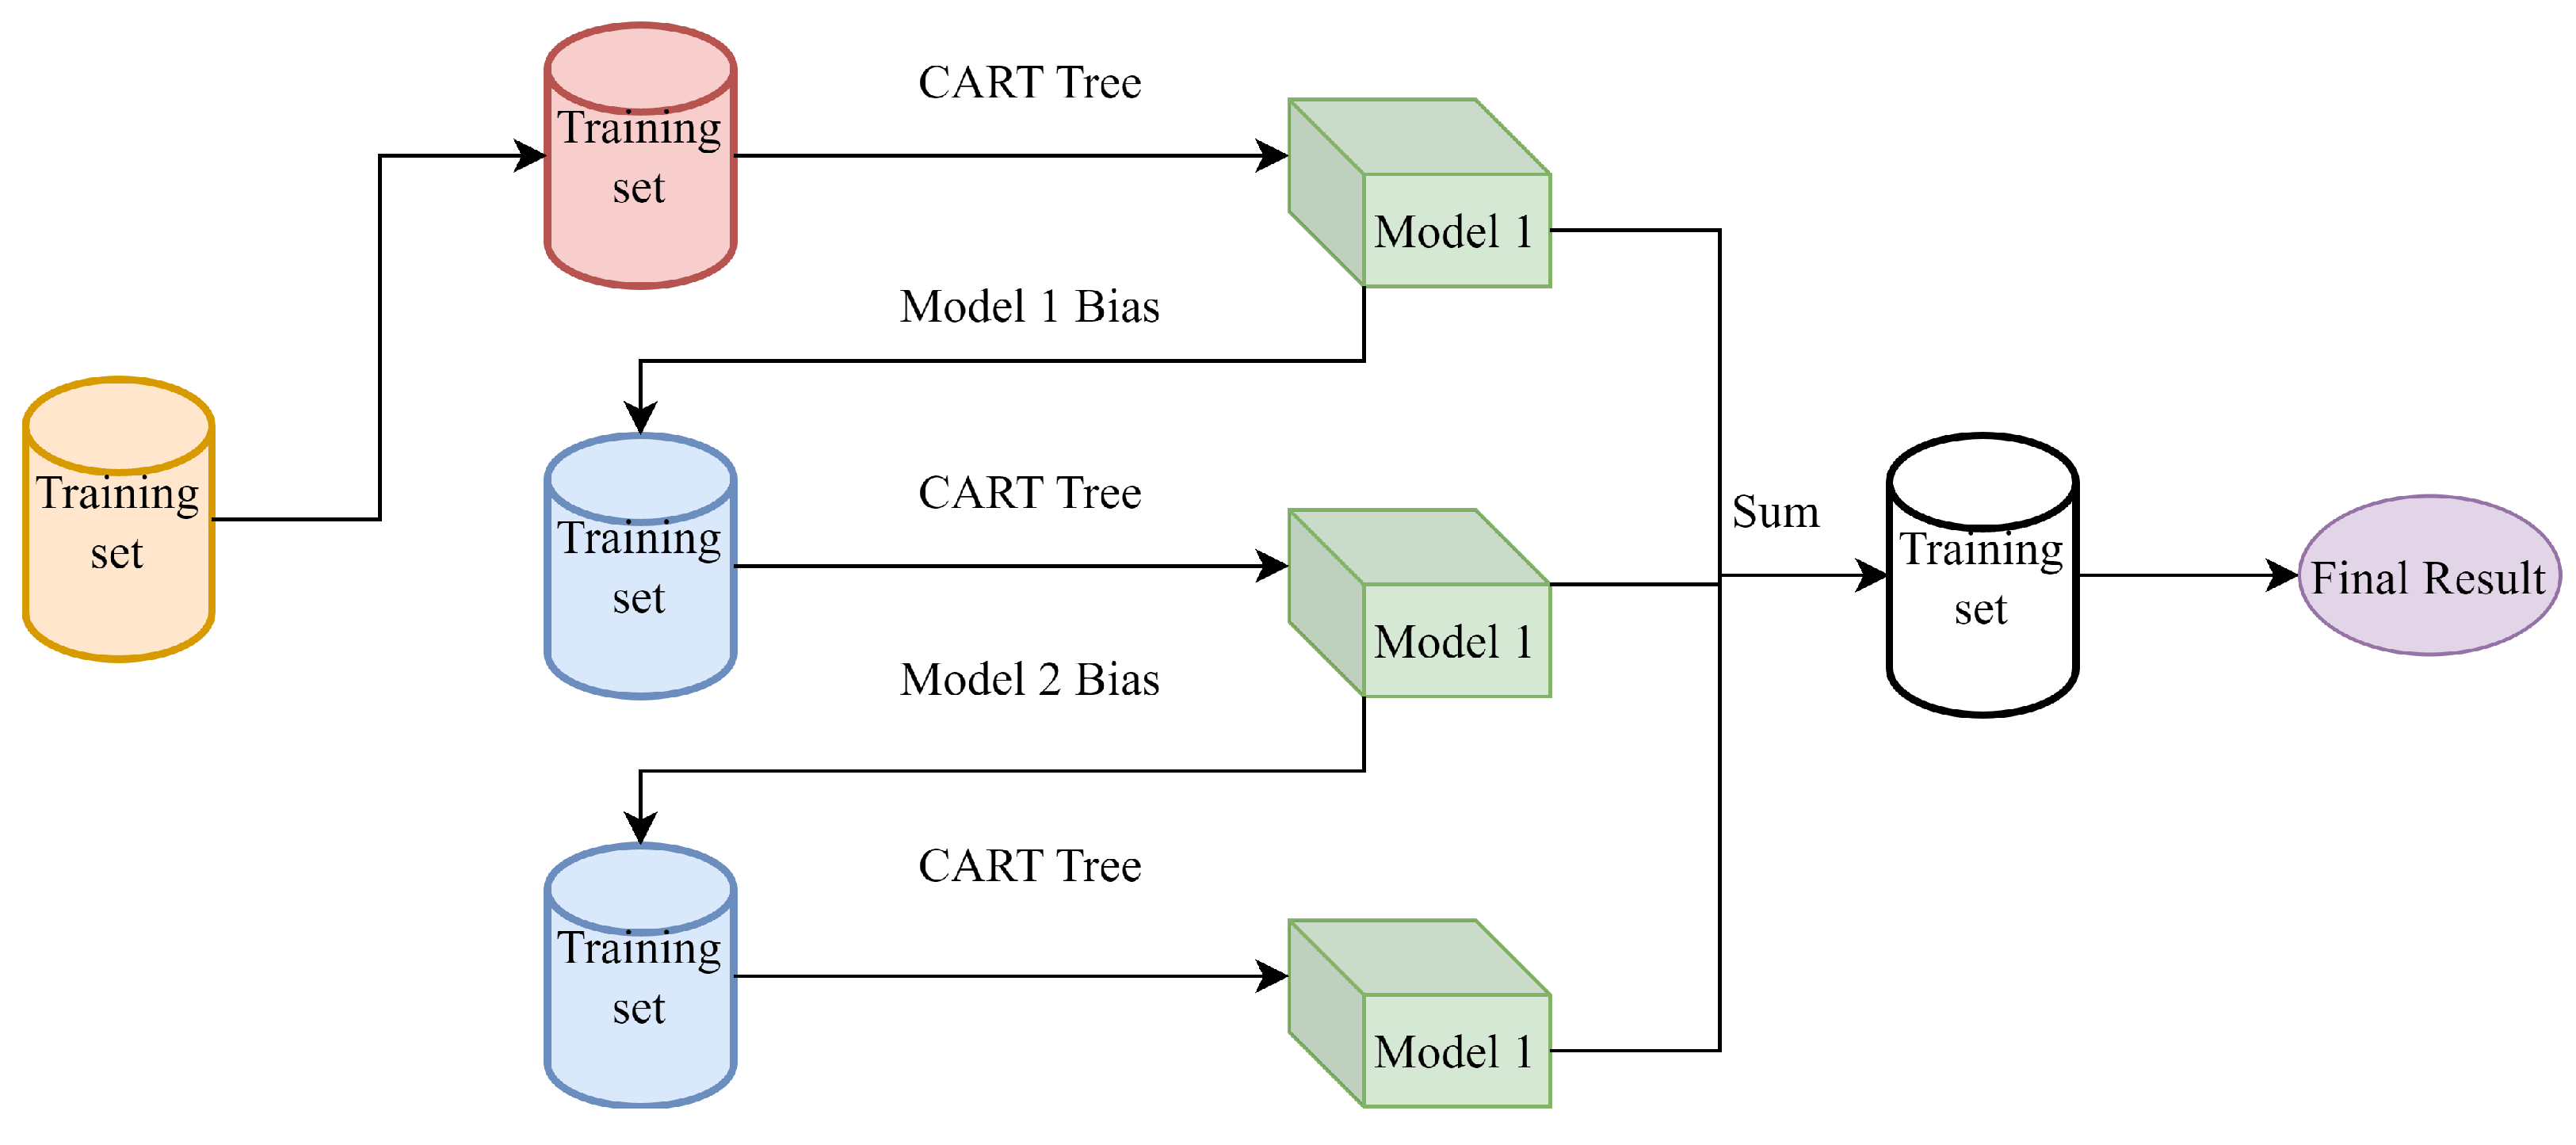
Extreme Gradient Boosting (XGBoost) is an efficient implementation of the Gradient Boosting Decision Tree (GBDT) algorithm (
Figure 4) and is widely applied in classification, regression, and ranking tasks [
38]. In this study, XGBoost was introduced for the classification of non-agriculturalization of arable land. As an enhanced version of gradient boosting, XGBoost offers excellent predictive accuracy and generalization capability, particularly when handling nonlinear feature interactions, high-dimensional feature spaces, and complex class separability inherent in remote sensing data [
39]. Compared to traditional models, XGBoost incorporates a regularization mechanism during training, effectively mitigating overfitting while maintaining the ability to handle missing values. This makes it well-suited for the multi-temporal remote sensing imagery and multi-source data fusion scenario in this research. To further improve performance, Bayesian Hyperparameter Optimization (BHO) was employed to tune the XGBoost parameters. Using surrogate functions to guide the search process, BHO efficiently identifies the optimal parameter combination with fewer iterations. The optimized XGBoost model demonstrated superior stability and accuracy in multi-temporal image classification, providing reliable results for monitoring arable land non-agriculturalization.
2.4.4. SVM + HPO
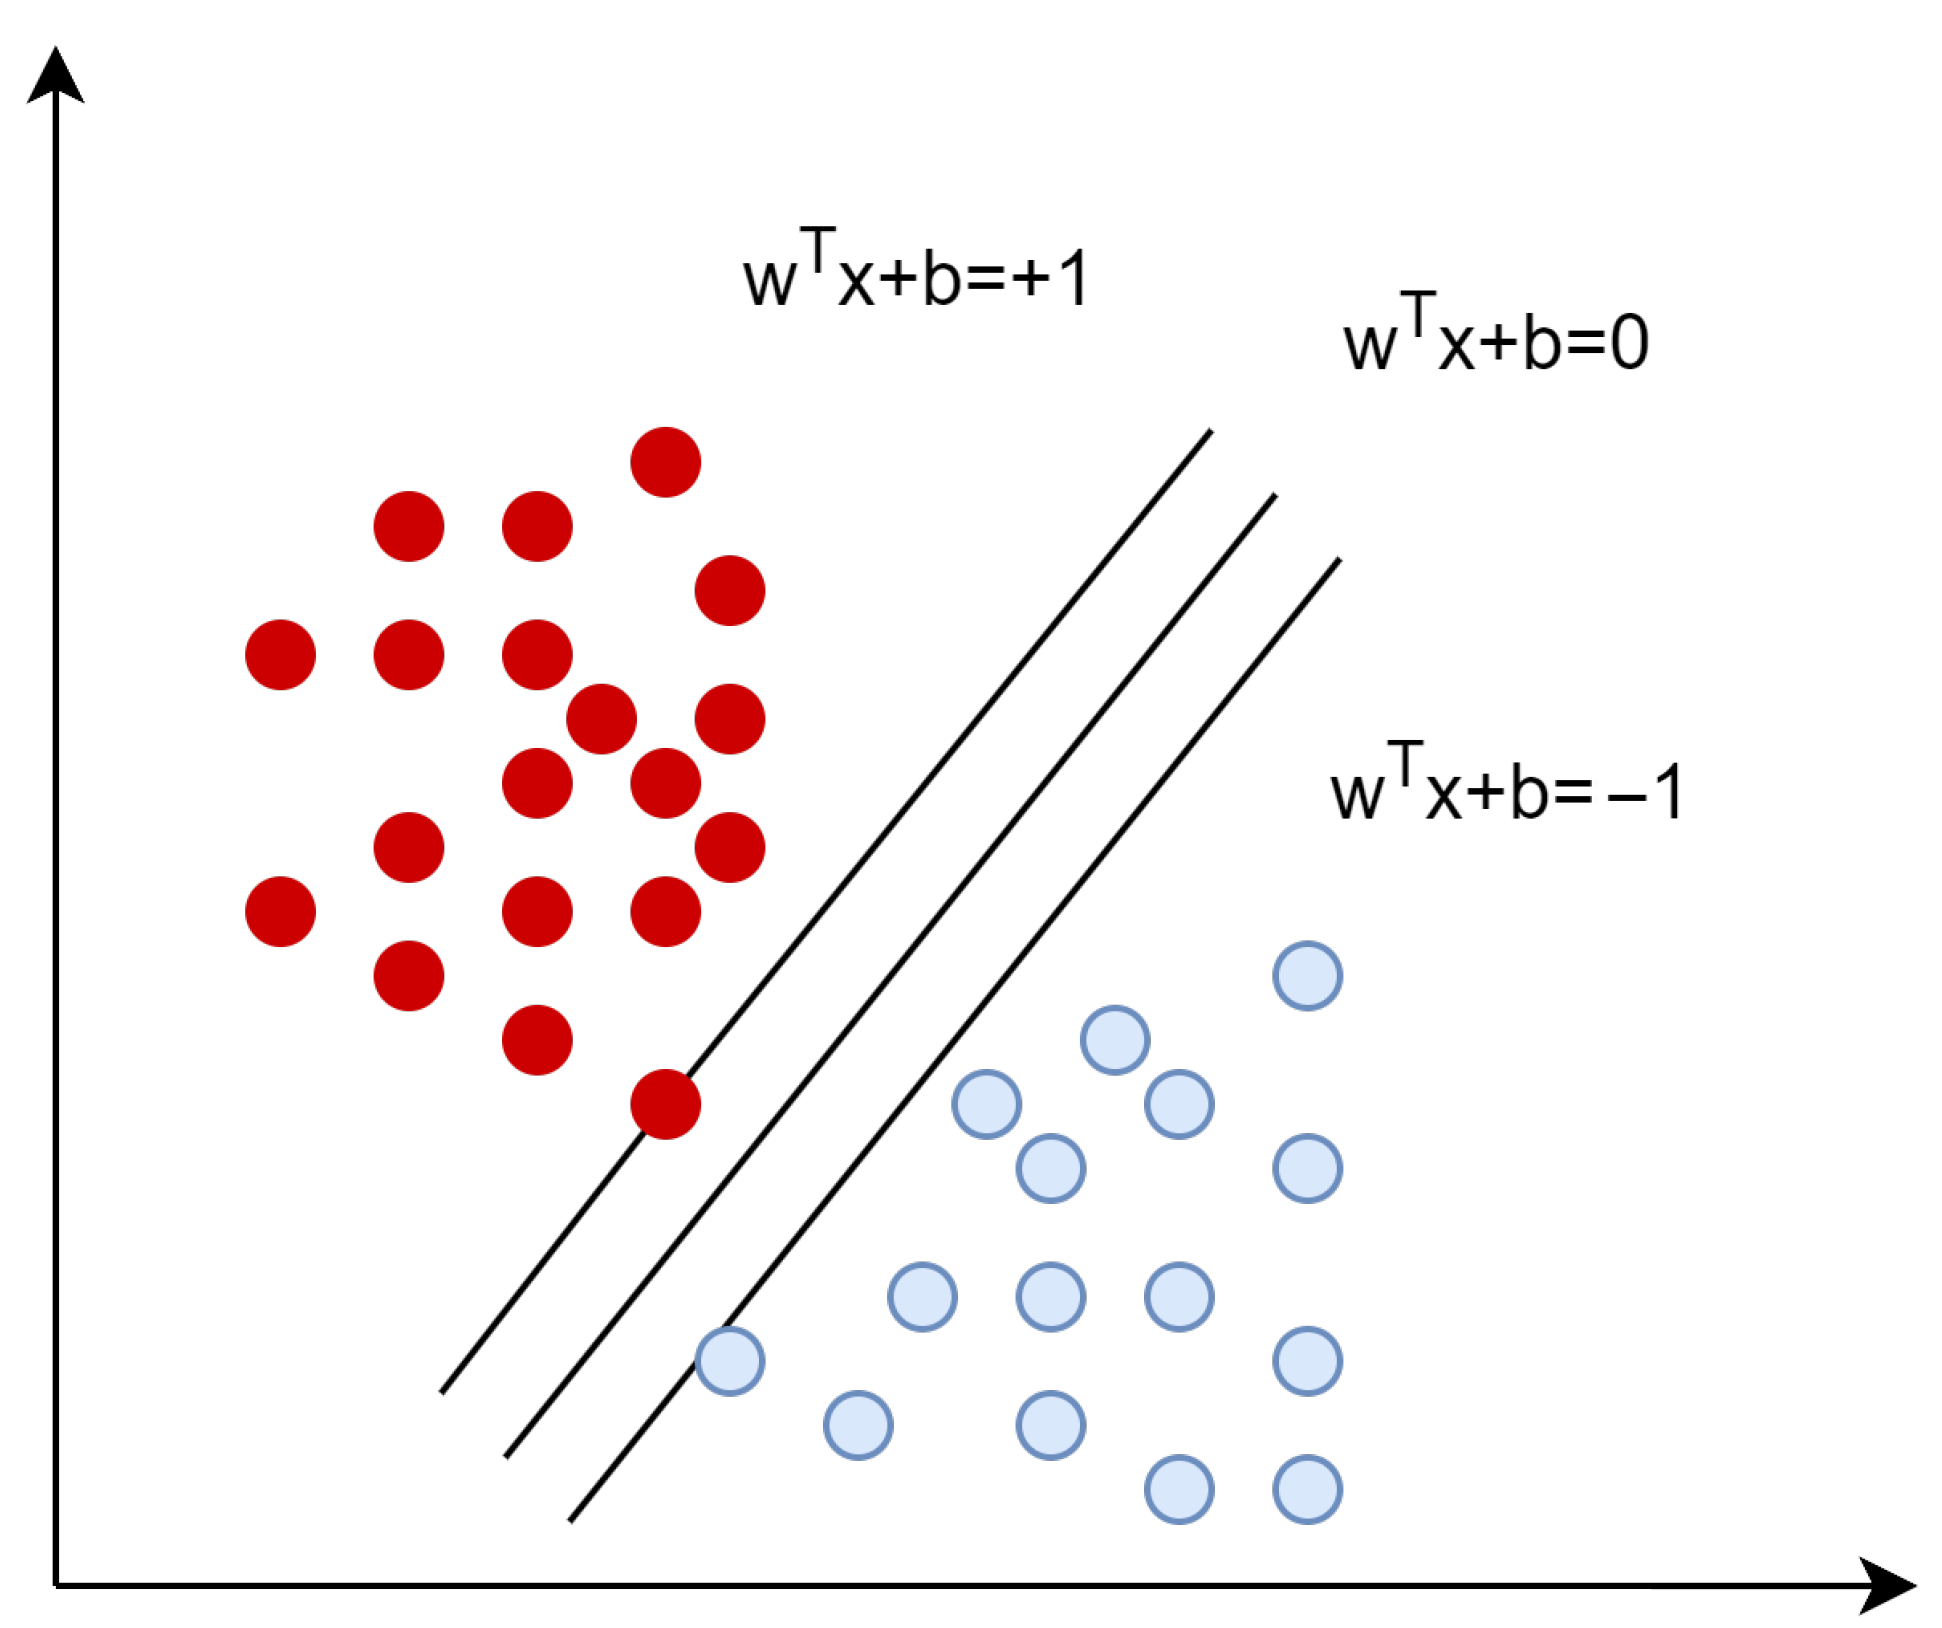
Support Vector Machine (SVM) is a powerful supervised learning algorithm and was selected as one of the candidate classifiers for the identification of non-agriculturalized arable land in this study (
Figure 5). SVM demonstrates stable performance in classification tasks that involve small-to-medium-sized samples, high-dimensional feature spaces, and clearly defined class boundaries. It is particularly suitable for addressing issues commonly encountered in remote sensing imagery, such as blurred boundaries between arable and non-arable land and sample imbalance [
40]. By incorporating kernel functions, SVM can effectively capture non-linear relationships, thus improving its ability to discriminate complex landcover types. To further enhance the model classification performance and reduce the computational burden of manual hyperparameter tuning, Bayesian Hyperparameter Optimization (BHO) was employed to optimize key hyperparameters, including kernel function parameters and regularization coefficients. This approach improved the classification accuracy and generalization capability of SVM in the context of multi-temporal remote sensing image classification.
2.4.5. MLP + Attention Mechanism
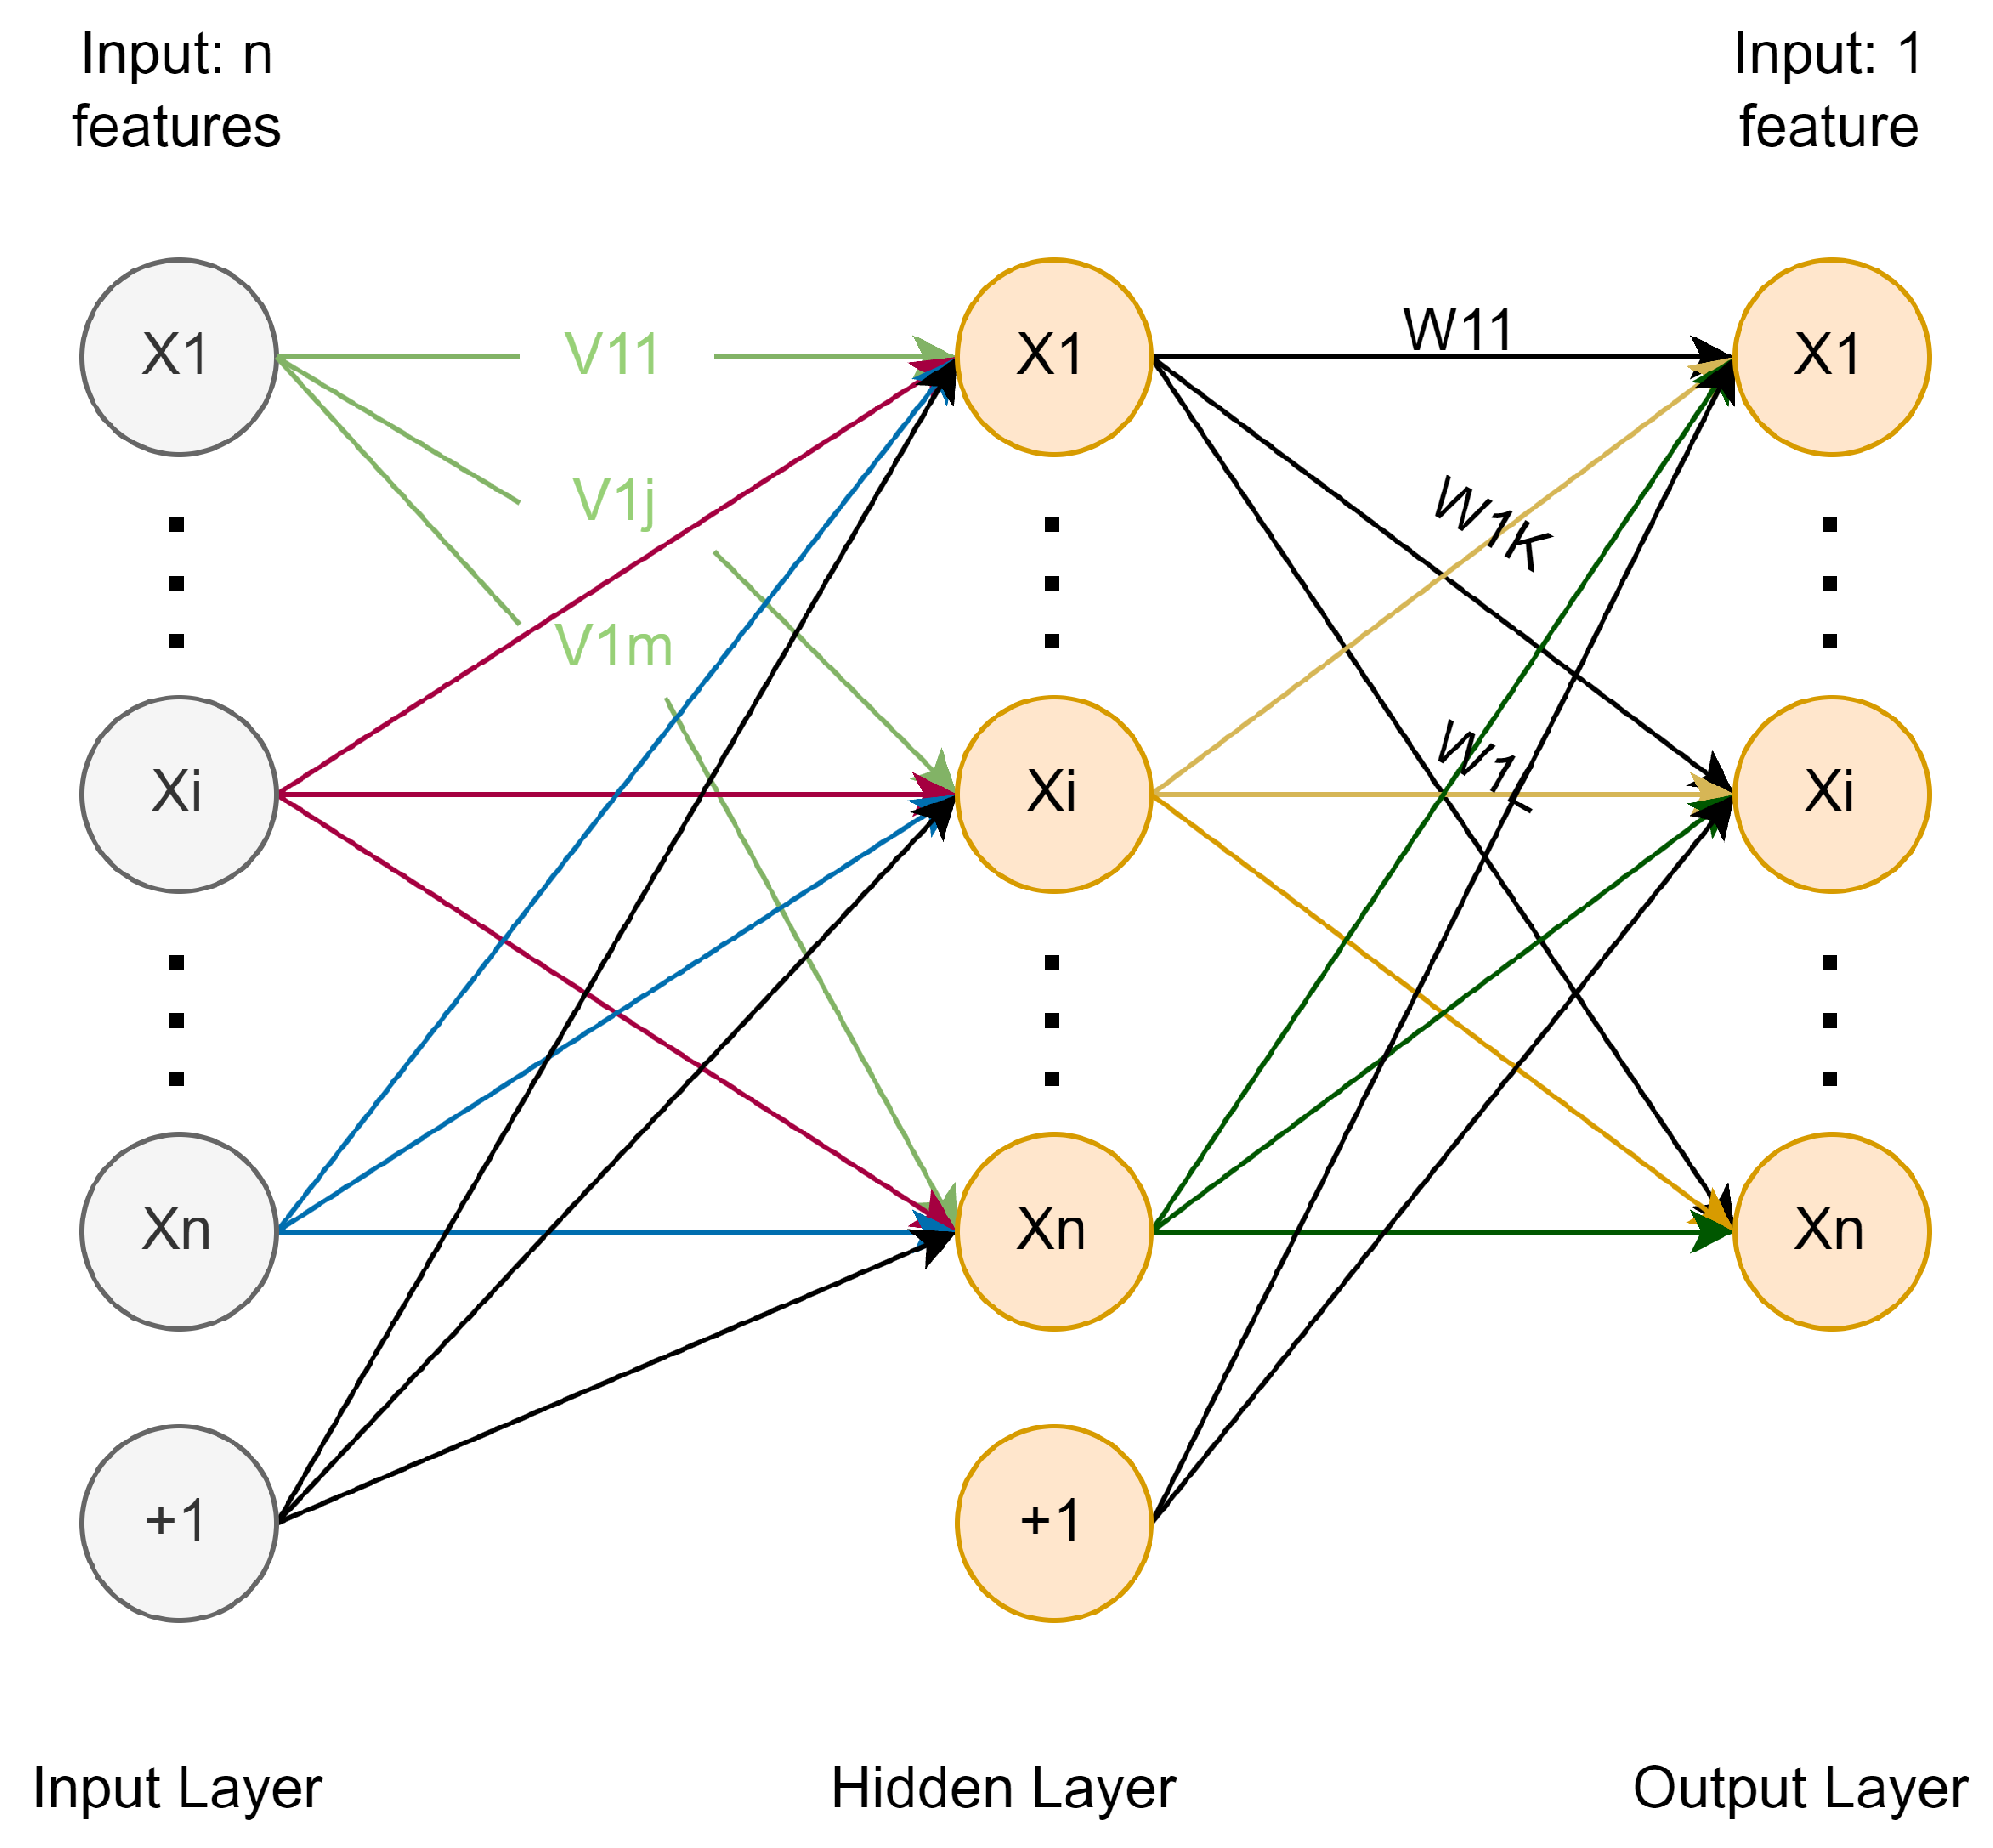
In the non-agriculturalization classification task of arable land in this study, the Multilayer Perceptron (MLP) was used as the fourth comparative model (
Figure 6). MLP is able to model non-linear relationships and handle high-dimensional features, making it suitable for the classification of complex types of land cover in remote sensing imagery [
41]. Its multilayer architecture facilitates deep feature abstraction and nonlinear mapping, enabling effective discrimination of arable land and non-agricultural land across spectral, spatial, and temporal dimensions. Considering the susceptibility of MLP to overfit during training, appropriate regularization strategies were introduced [
42]. In addition, Bayesian Hyperparameter Optimization (BHO) was applied to tune key hyperparameters, including the number of layers, neurons per layer, and activation functions, in order to improve the generalizability and classification accuracy of the model. The optimized MLP model exhibited strong feature representation and robust classification performance, providing deep learning support for the extraction of non-agriculturalization information in remote sensing applications.
2.5. Accuracy Evaluation Metrics
In the remote sensing classification task of arable land non-agriculturalization, relying on a single evaluation metric often fails to provide a comprehensive assessment of model performance. To ensure a more accurate and multi-dimensional evaluation, this study employed five complementary metrics: Overall accuracy (OA), Kappa coefficient, Recall, Precision, and F1-Score. Together, these indicators form a robust performance evaluation framework that accounts for both global and class-specific aspects of classification accuracy and stability.
Specifically, OA and Kappa are used to measure the overall classification accuracy and agreement, making them suitable for multiclass scenarios and unbalanced sample distributions. Recall emphasizes the ability to correctly identify all relevant instances of the target class, which is crucial in reducing omission errors in critical areas. Precision evaluates the reliability of positive predictions, helping to control false alarms. The F1-Score provides a balanced view between Precision and Recall, making it particularly valuable when class proportions are uneven. The corresponding formulas are expressed as follows:
In the above equations,
denotes the number of correctly classified samples for class
i,
k represents the total number of classes, and
N is the total number of samples.
refers to the overall accuracy observed, while
represents the expected accuracy under random classification, both of which are computed from the confusion matrix. Here,
denotes the number of true positive samples (actual positive and correctly predicted as positive), and
indicates the number of false negatives (actual positive but incorrectly predicted as negative). The
is the harmonic mean of
and
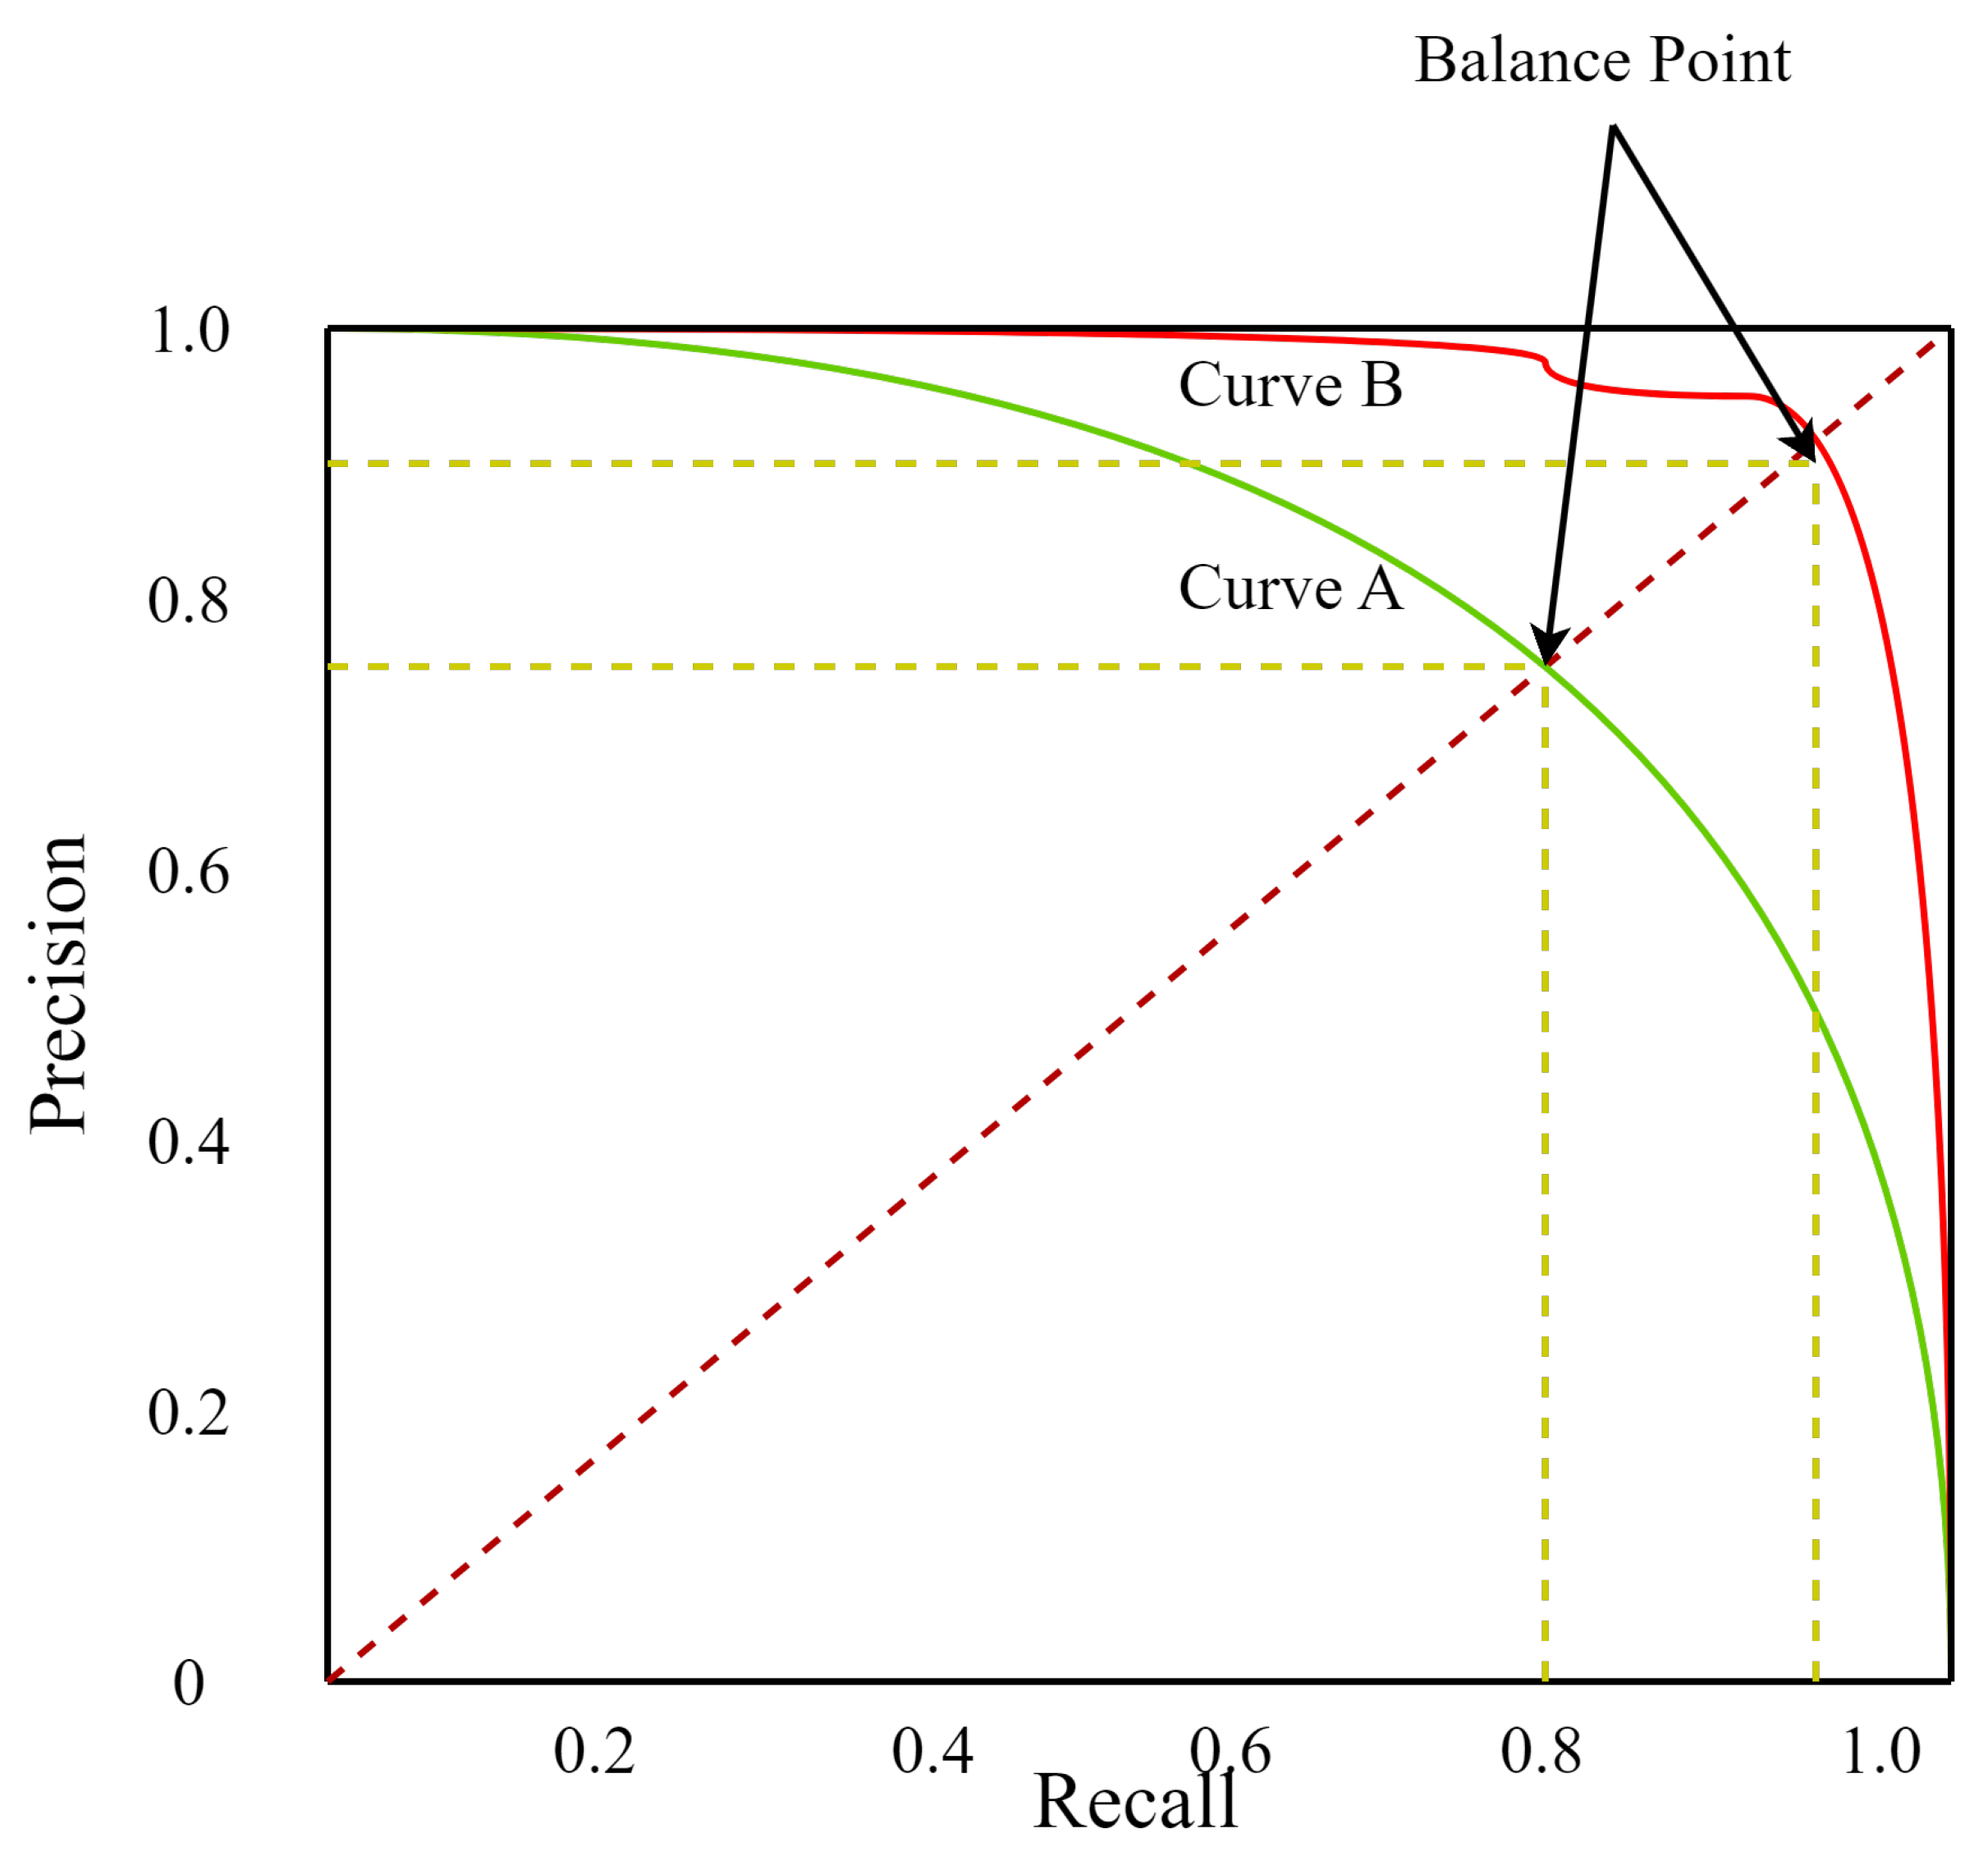
, providing a balanced measure between these two metrics. The relationship between Precision and Recall can be visually represented by the Precision–Recall (PR) curve, as illustrated in
Figure 7.
By introducing multiple complementary indicators, this paper aims to avoid performance misjudgments caused by single-indicator bias, thereby more scientifically and comprehensively verifying the applicability and reliability of classification models in the task of identifying non-agricultural land conversion.
3. Results
3.1. Construction and Dimensionality Reduction of the Image Feature Set
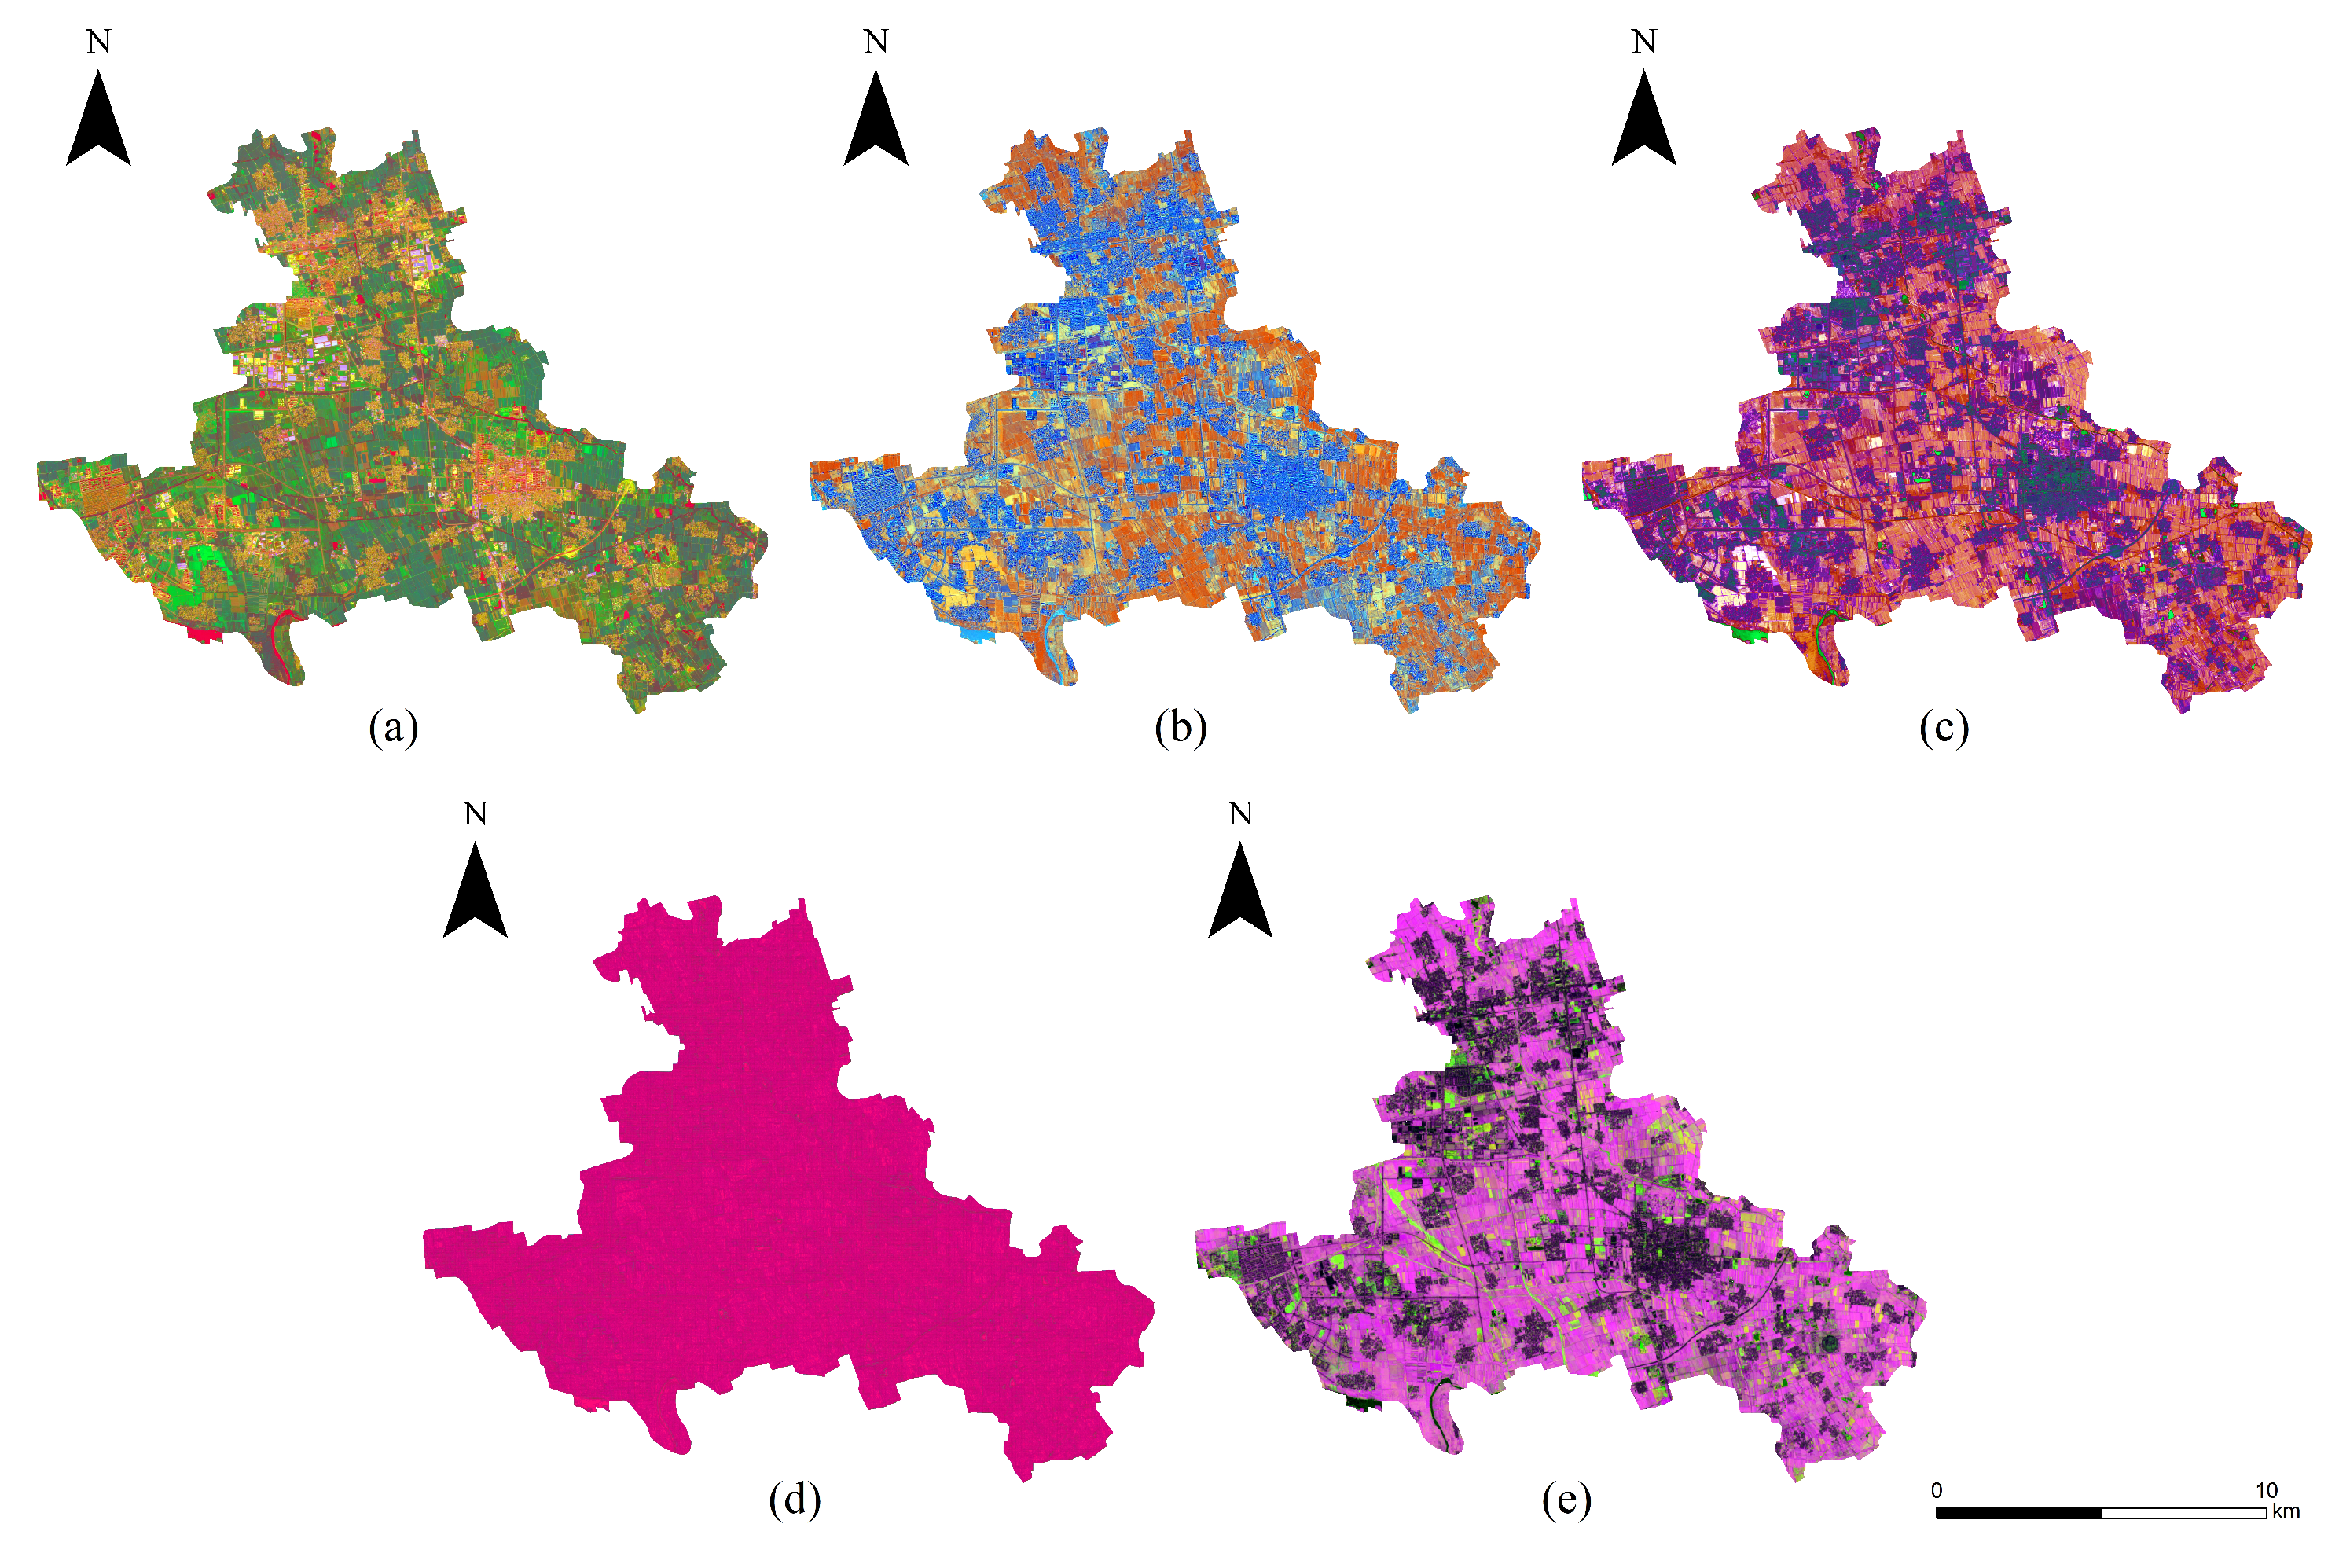
This study used the rich spectral information and high spatial resolution of Sentinel-2 imagery to construct a multi-dimensional feature set comprising spectral band features, spectral indices, texture features, and spatio-temporal features. However, features extracted from remote sensing imagery are typically high-dimensional and often exhibit redundancy. To reduce computational complexity and improve model efficiency, Principal Component Analysis (PCA) was applied to reduce dimensionality. PCA calculates the covariance matrix and extracts the principal components, and in this study the first three principal components—explaining more than 98% of the total variance—were selected as the final characteristic variables. This approach preserved critical information while eliminating redundancy, thus improving the efficiency of data processing and classification accuracy. The characteristic factors corresponding to the selected variables are summarized in
Table 3, and
Figure 8 shows the set of characteristic images after reduction in dimensionality.
3.2. Multi-Temporal Extraction of Non-Agriculturalization of Arable Land
3.2.1. Construction of the Non-Agriculturalization Sample Set
Constructing a high-quality sample dataset is critical for accurate classification and monitoring of arable land non-agriculturalization. In this study, the sample collection was based on GF (Gaofen) imagery and Google Earth imagery, combined with field surveys on site to ensure precision. Visual interpretation was performed on the imagery and the sample points were manually selected according to the NDVI mean and NDVI change rate images for August of each year, enabling precise class labeling and verification. The samples were categorized into five types of land cover: arable land, urban construction land, industrial land, roads, and water bodies. Initially, candidate samples were annotated on GF imagery and subsequently cross-validated using multi-temporal Google Earth imagery to ensure temporal consistency and reduce misclassification errors. Furthermore, samples were collected uniformly across different geographic units within the study area to ensure representativeness and spatial balance.
A total of 1193 sample points were selected, including 463 arable land samples, 221 urban construction land samples, 186 industrial land samples, 184 road samples and, 139 water body samples. Of these, 70% (836 points) were used for training and 30% (357 points) for testing. All sample categories were evenly distributed throughout the study region, ensuring robust representation for model training and evaluation.
3.2.2. Model Training and Accuracy Assessment
During the model training phase, cross-validation was employed to evaluate model performance, ensuring adaptability to different sample distributions and mitigating overfitting risks. For machine learning classifiers, Bayesian hyperparameter optimization was applied to fine-tune key parameters, aiming to achieve the best classification performance. For the deep learning model (MLP), an attention mechanism was integrated into the training process to improve the representation of characteristics and improve the efficiency of optimization. By comparing the performance of different classifiers, the optimal classification method was identified for subsequent analysis. The classification outputs of the four models are illustrated in
Figure 9.
To evaluate the performance of different classification models in identifying various land cover classes involved in arable land non-agriculturalization (0: arable land, 1: water body, 2: roads, 3: residential land, and 4: industrial land), this study systematically compared the classification results using confusion matrices and five accuracy metrics: Overall accuracy (OA), Kappa coefficient, Recall, Precision, and F1-Score, as summarized in
Table 4. The results indicate that the XGBoost model outperformed the other classifiers in all evaluation metrics, achieving an OA of 0.94 and a Kappa coefficient of 0.9241, demonstrating its significant advantage in the general accuracy and consistency of the classification. Although the deep learning model (MLP with Attention) exhibited stronger feature representation capability, its performance in this task was inferior to that of XGBoost. This discrepancy can be attributed to two key factors: (1) the relatively limited number of samples for arable land non-agriculturalization, where XGBoost, as an ensemble learning method, offers superior robustness in small-sample scenarios; and (2) the structured nature and strong spatial autocorrelation of remote sensing features in this study, which favor the stability of XGBoost when addressing medium-scale, nonlinear problems with controlled feature dimensions. In contrast, deep neural networks, while offering higher representational power, are prone to overfitting or instability in the absence of large-scale training data. Therefore, considering accuracy, stability, and data adaptability, the XGBoost model optimized with Bayesian hyperparameter tuning was selected as the optimal classifier for subsequent multi-temporal land-cover classification and change detection analyses.
3.2.3. Extraction of Non-Agriculturalization of Arable Land in Dachang County from 2016 to 2023
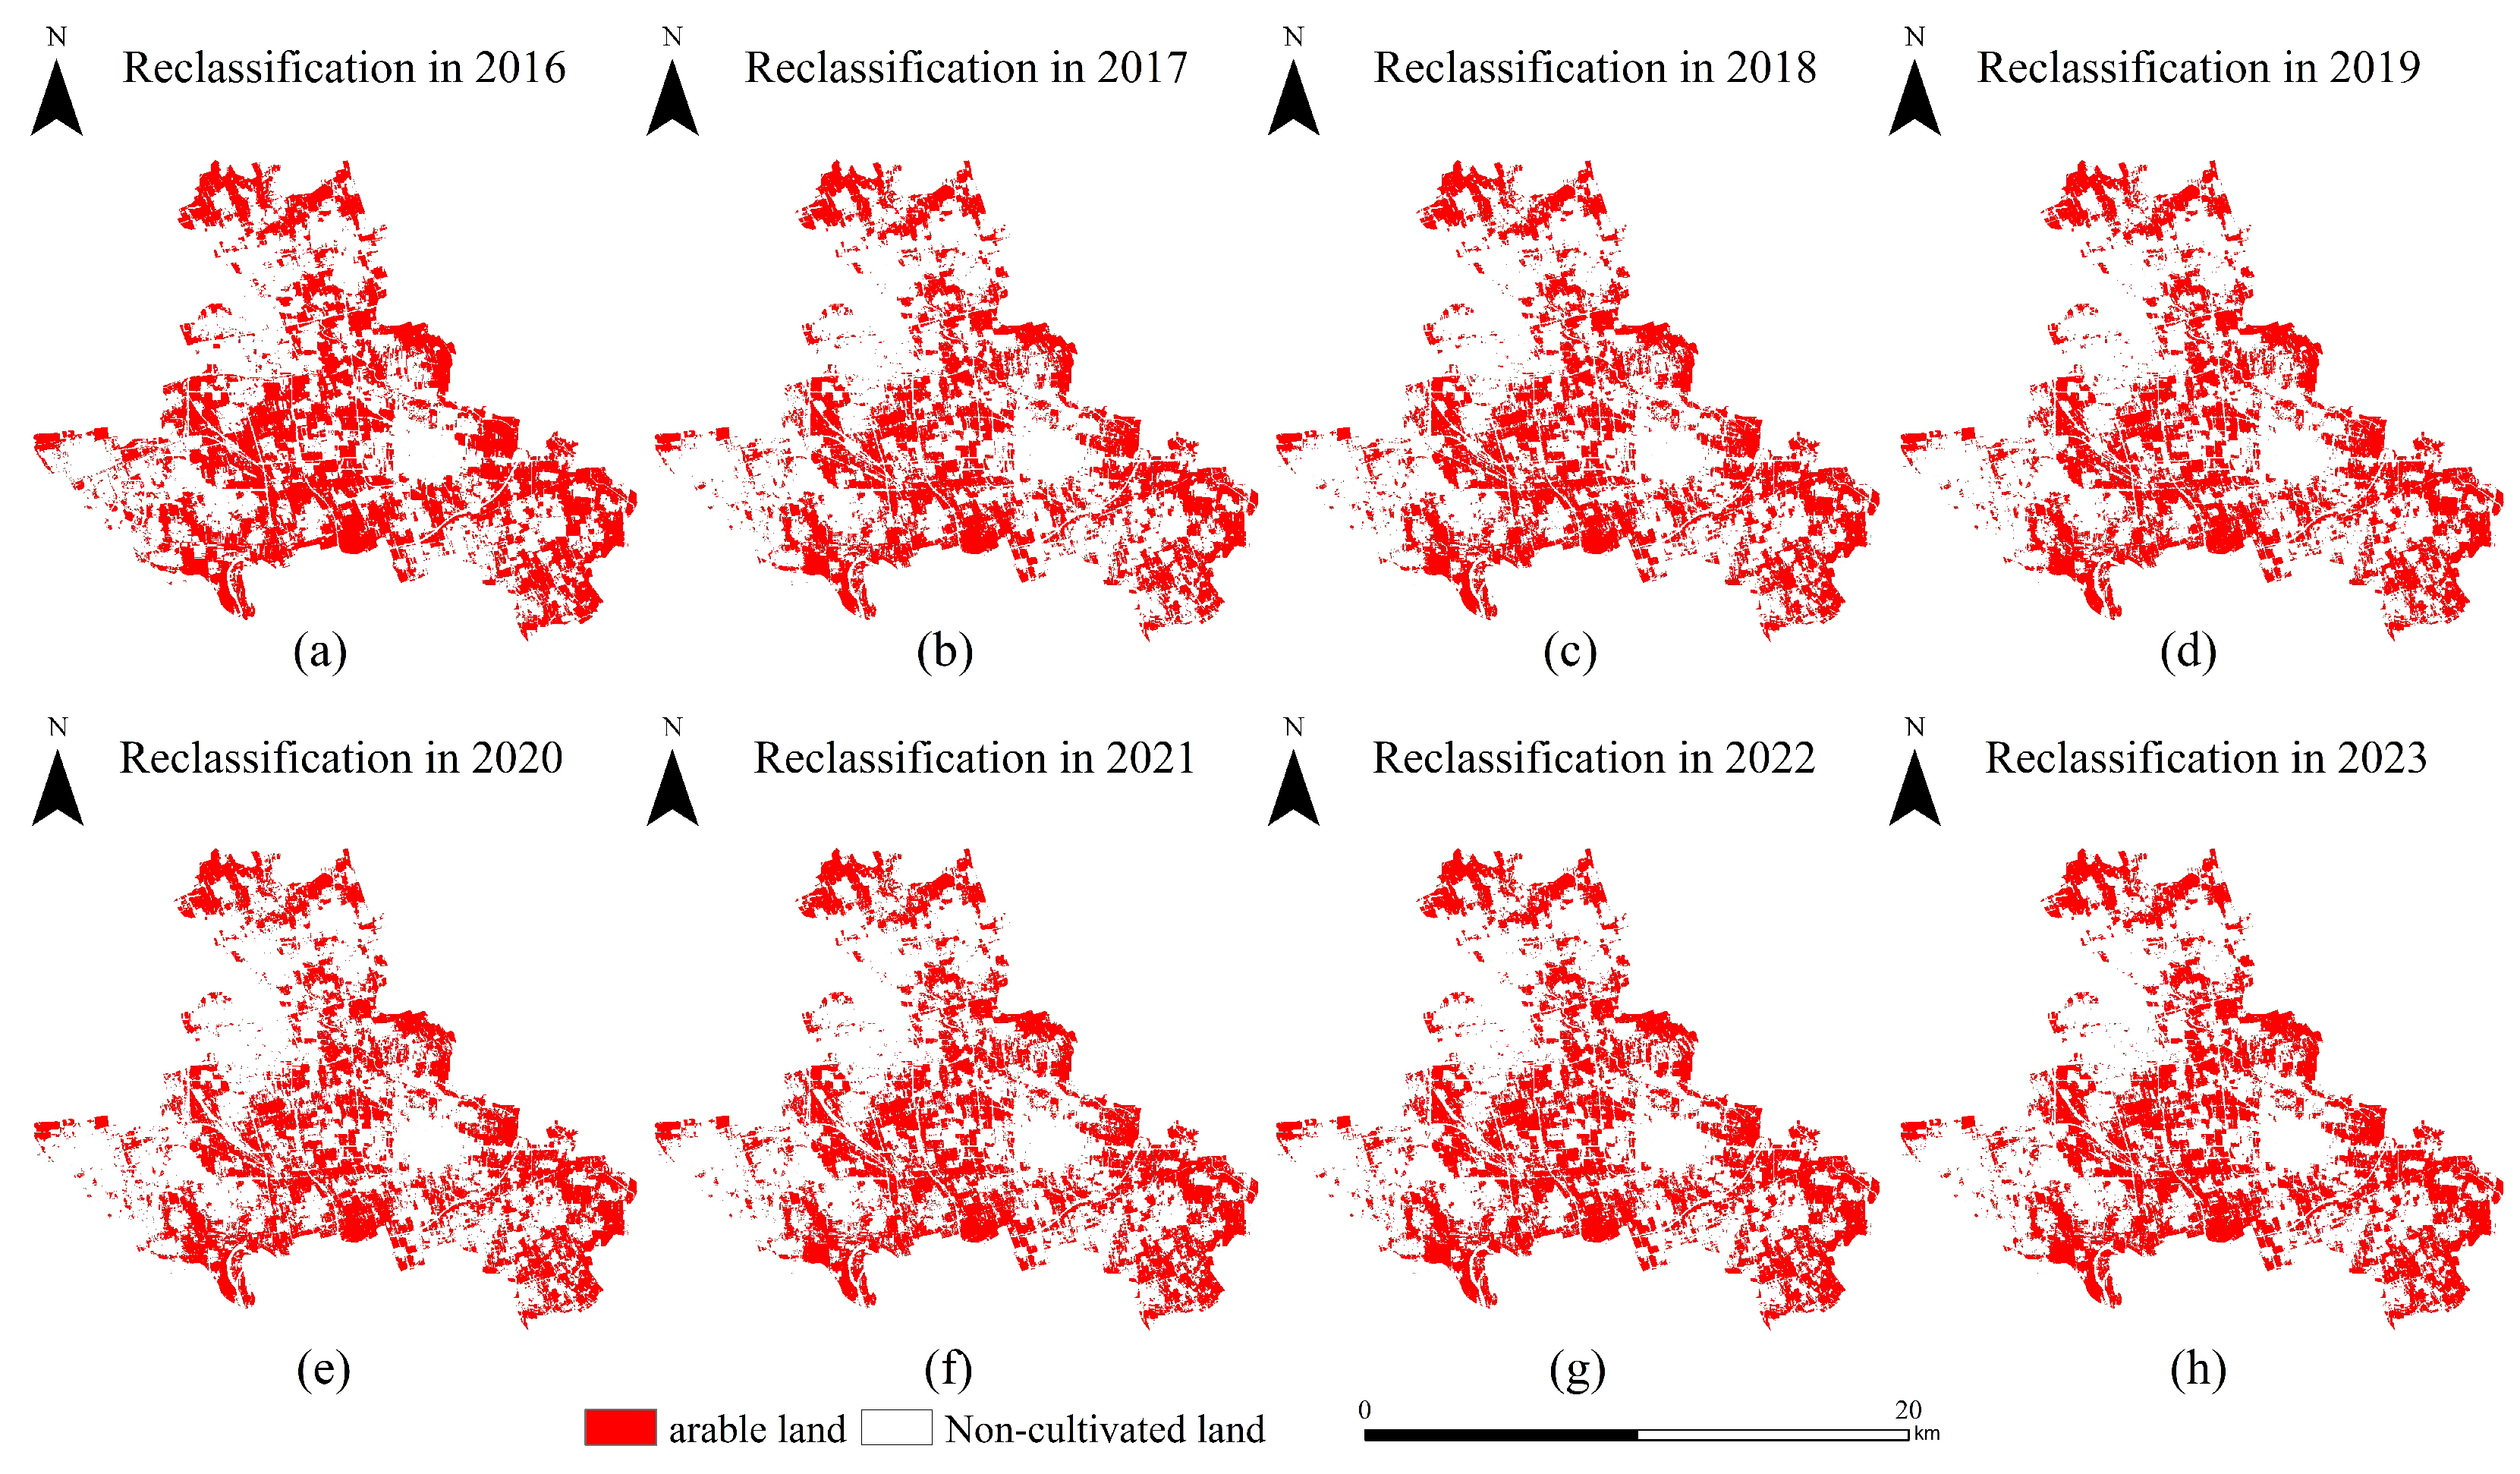
Based on the optimized XGBoost model, annual dynamic monitoring of Dachang County was conducted using Sentinel-2 imagery from 2016 to 2023. The types of land cover were classified into five categories: arable land, water bodies, roads, residential land, and industrial land. The results of the annual classification, including the area statistics for each type of land cover, are presented in
Table 5. For further analysis, the four non-arable classes (water bodies, roads, residential land, and industrial land) were merged into a single non-arable category, allowing binary classification of arable versus non-arable land. The temporal reclassification results are illustrated in
Figure 10.
3.3. Spatio-Temporal Evolution Analysis of Non-Agriculturalization
3.3.1. Trend of Non-Agriculturalization Area Change
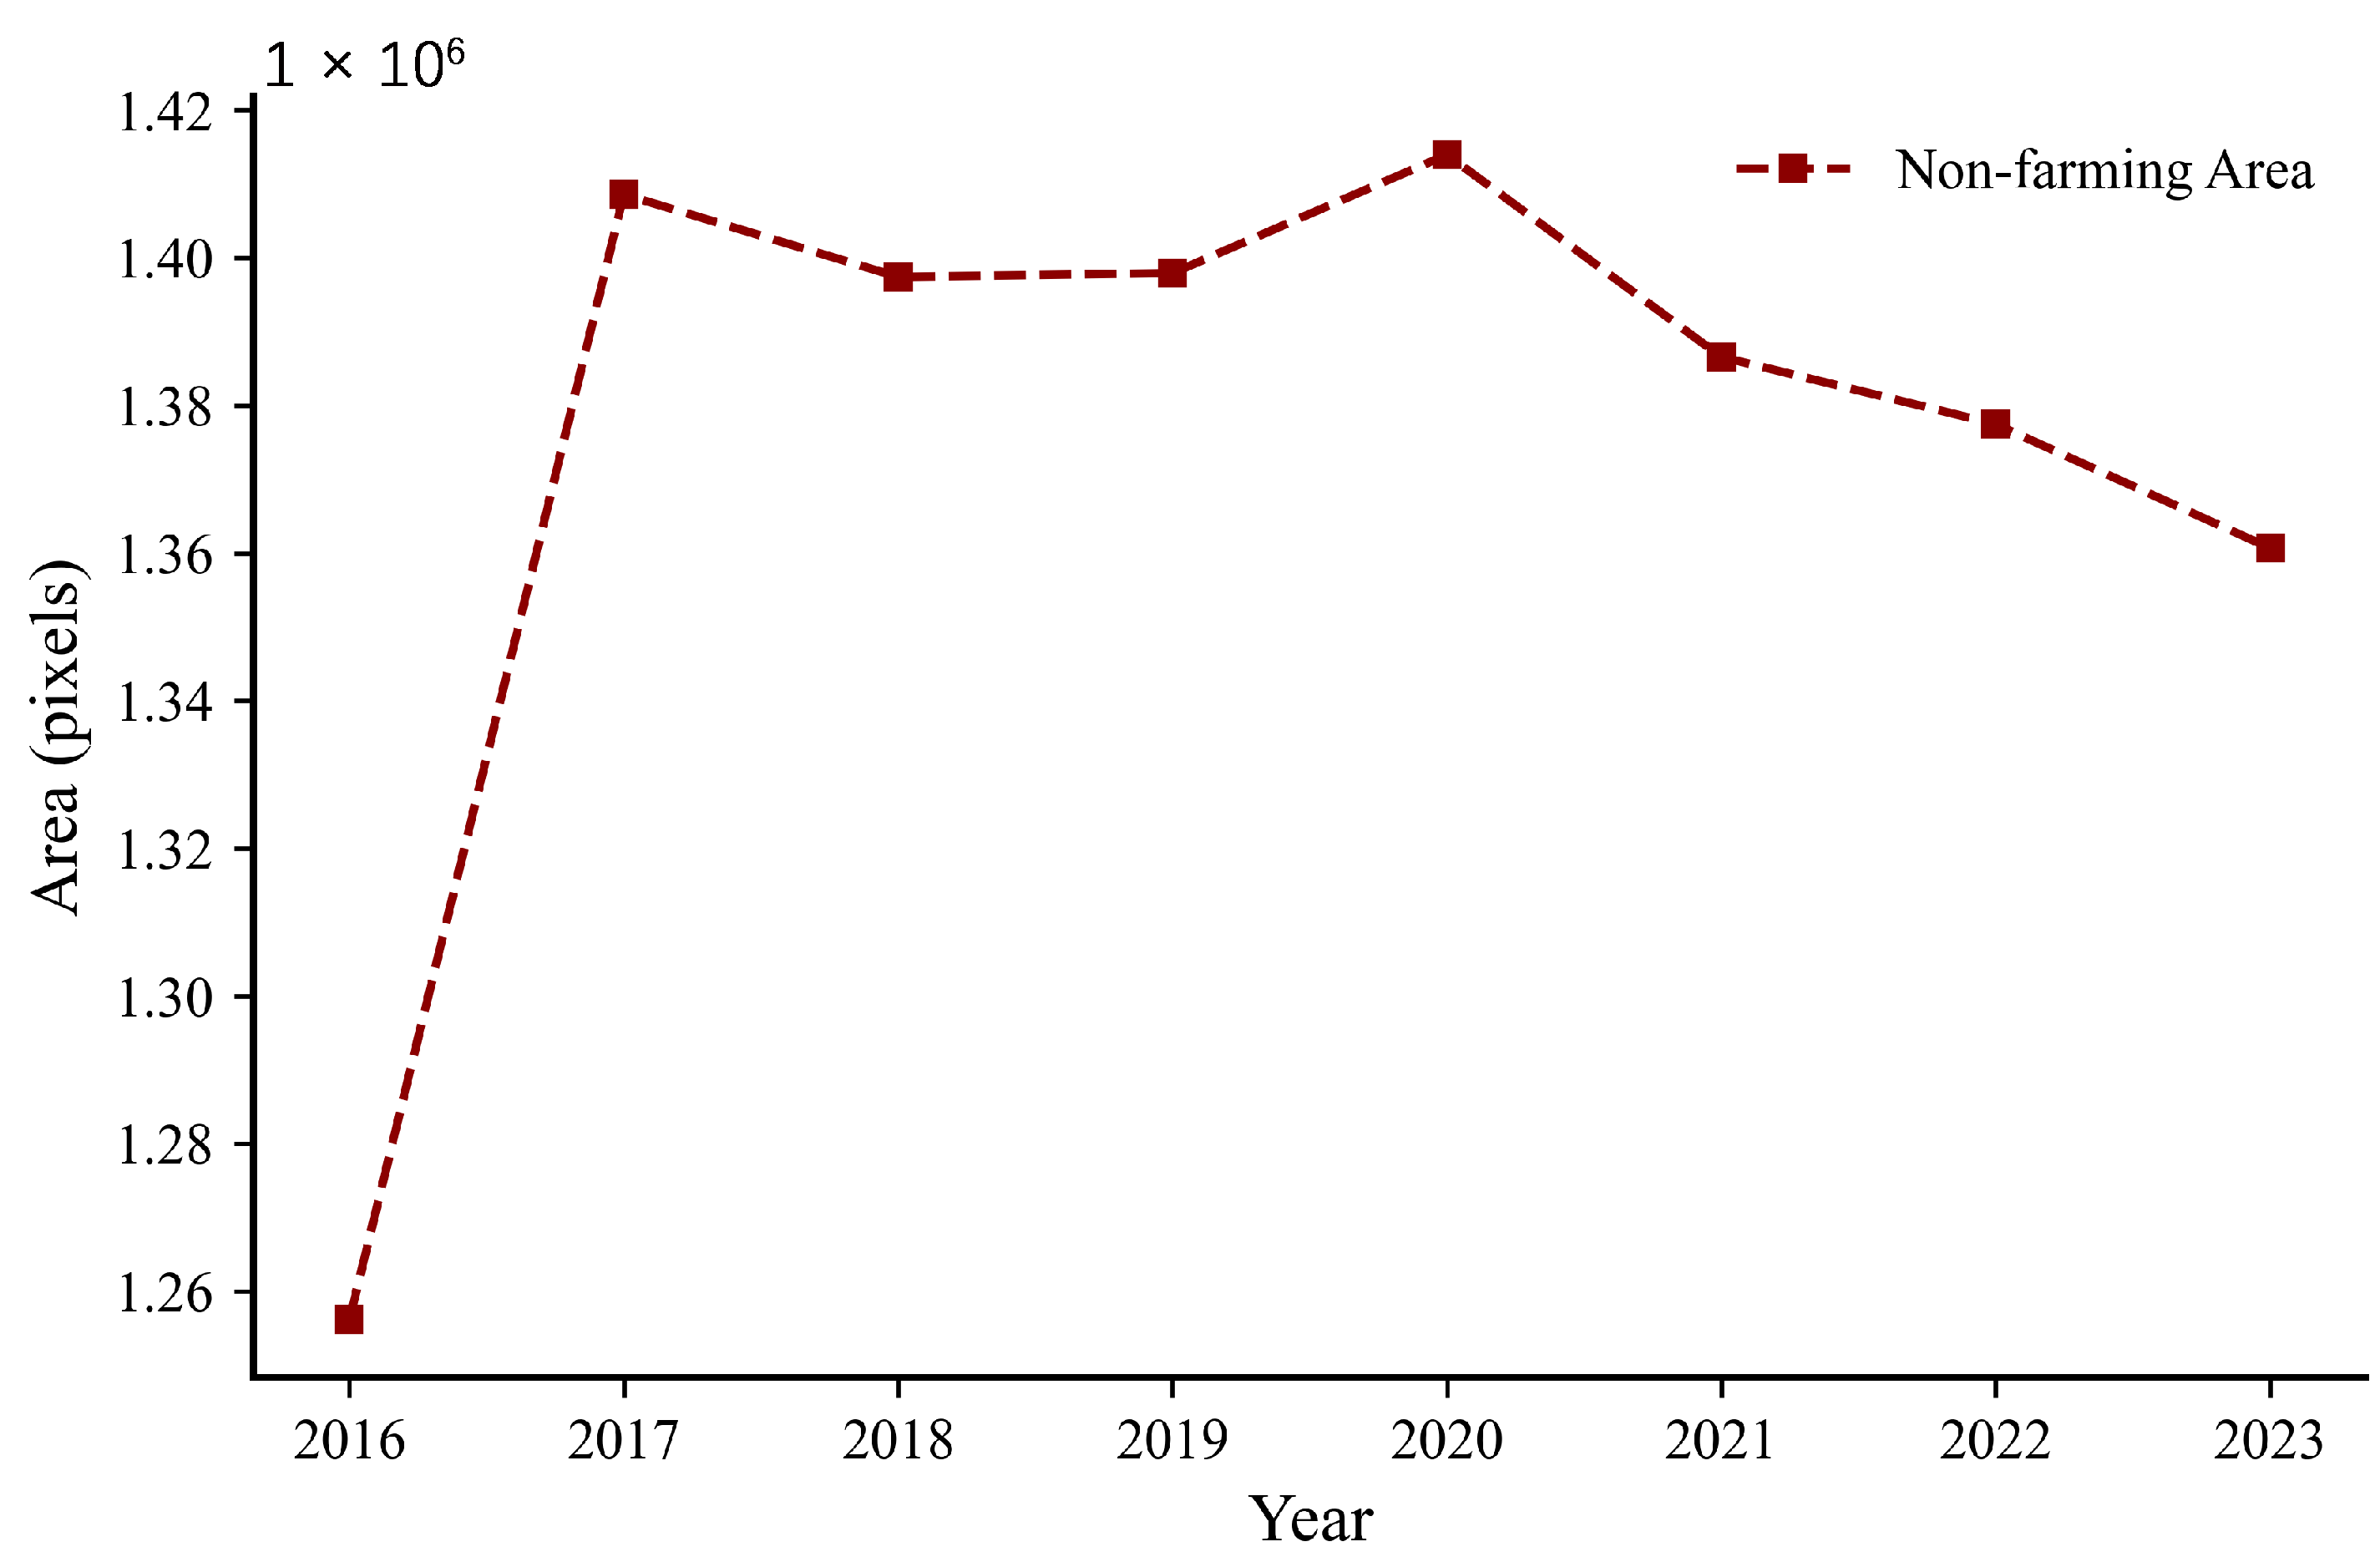
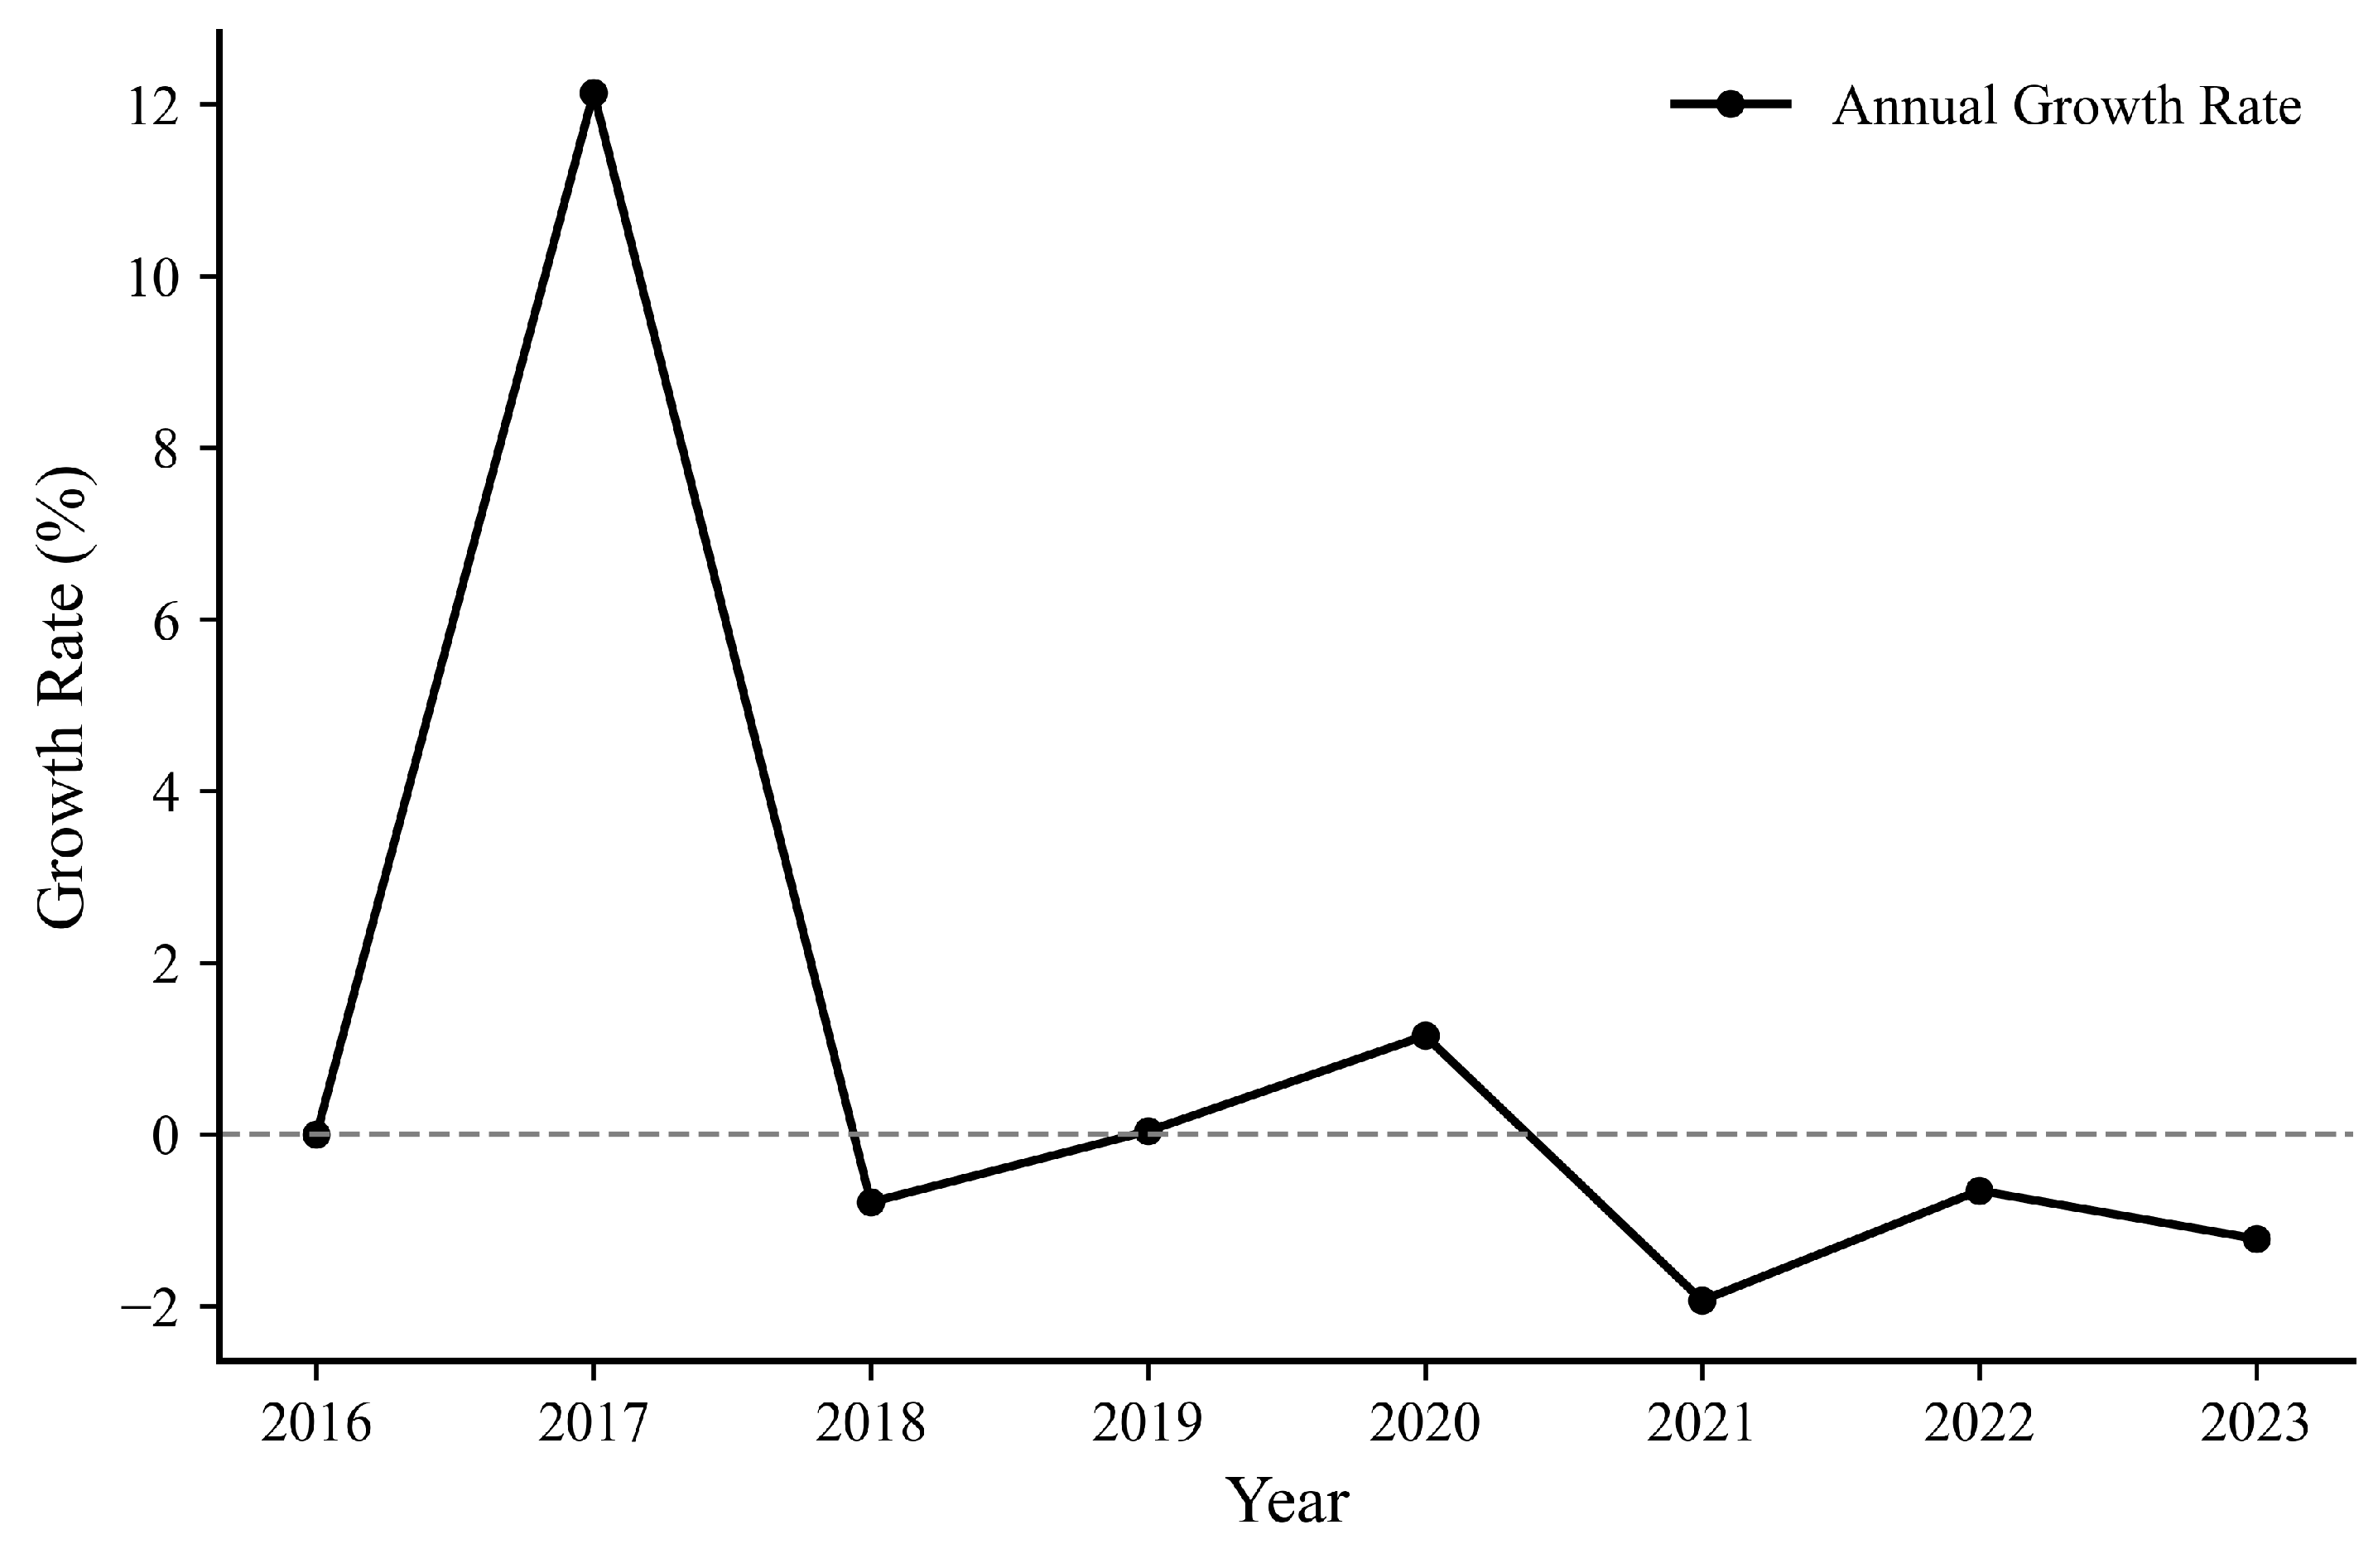
To further reveal the characteristics of the temporal evolution of the non-agriculturalization of arable land in Dachang County, this study calculated and plotted the total change in area of non-agriculturalized regions based on the results of the multi-temporal classification from 2016 to 2023, as well as the annual growth rate curve. These are illustrated in
Figure 11 and
Figure 12, respectively.
As shown in
Figure 11, the total non-agriculturalized area exhibited a continuous increase trend from 2016 to 2020, with the most significant increase occurring between 2016 and 2017, reaching 12%. This period corresponds to the early stage of the Beijing–Tianjin–Hebei coordinated development strategy, during which Dachang, as a key node on the Beijing metropolitan fringe, experienced substantial urban expansion and a surge in construction land demand.
However, since 2020, the growth of non-agriculturalized land has slowed markedly, and, after 2021, a consecutive decline was observed. This trend is more clearly reflected in the annual growth rate curve in
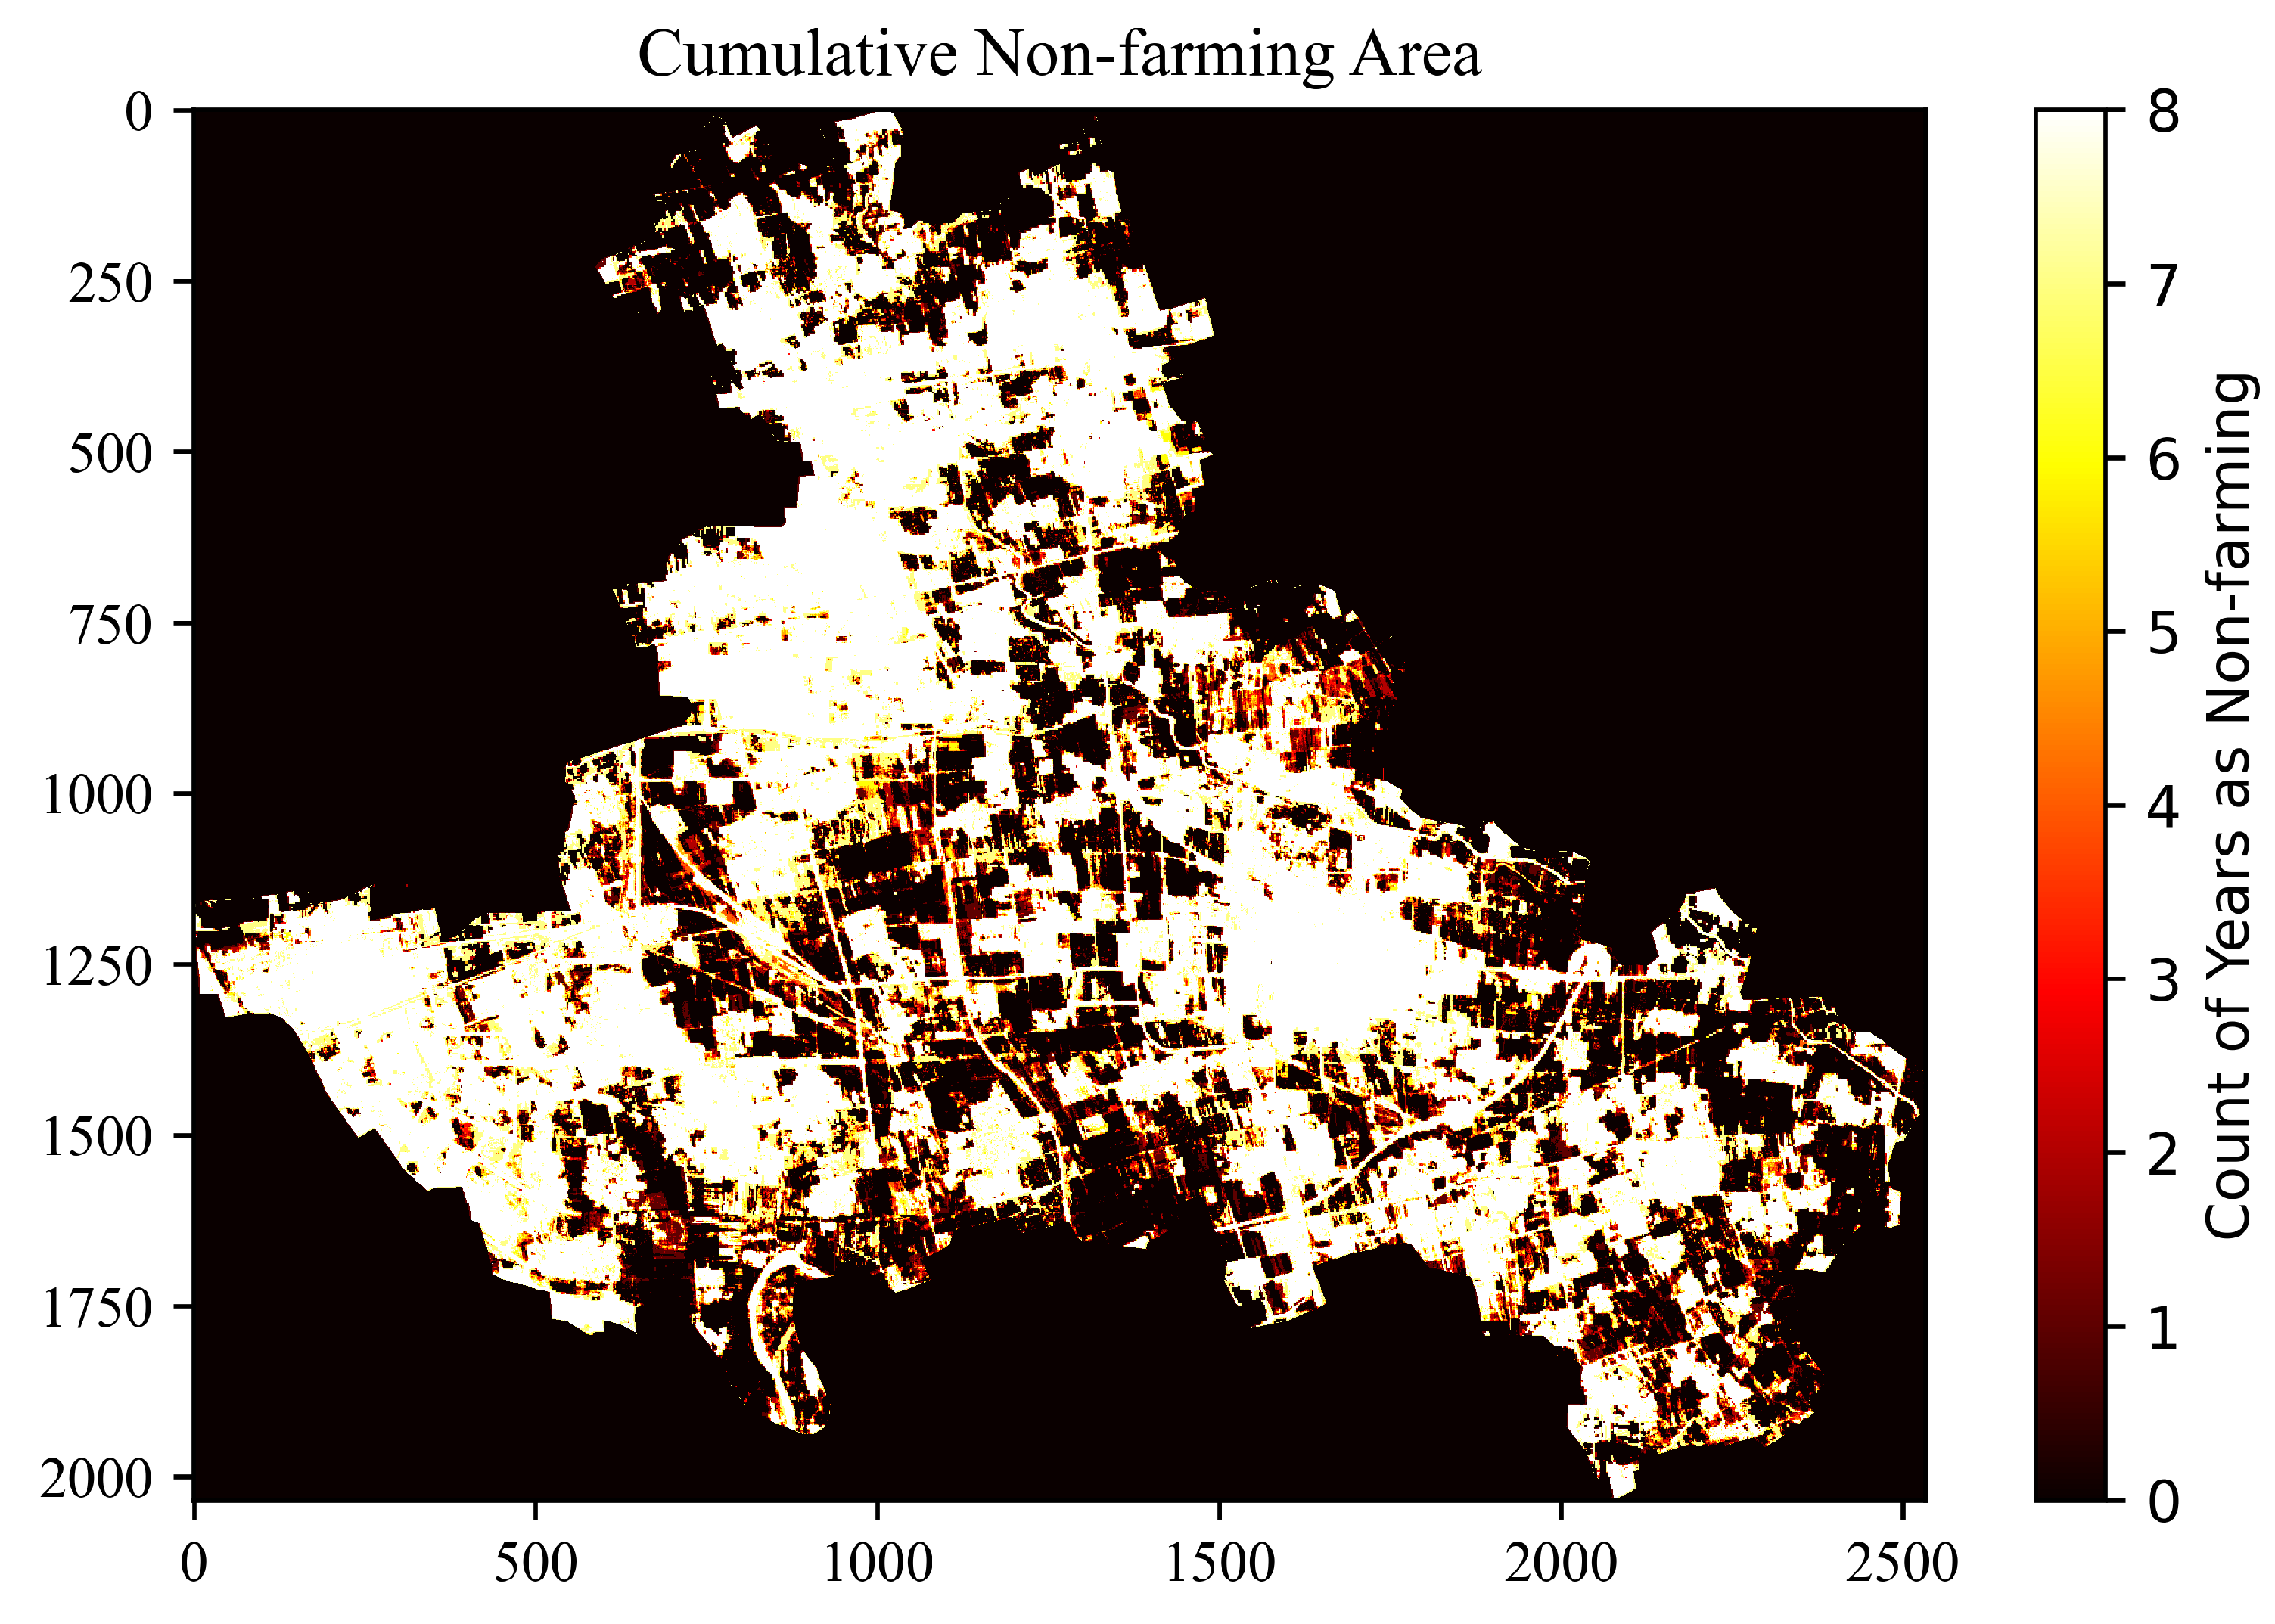
Figure 12, which peaked in 2017 and subsequently exhibited a steady deceleration in most years. In particular, negative growth rates occurred in 2021 and 2023, at 2.1% and 1.1%, respectively, indicating that the expansion of non-agricultural land has gradually slowed. The cumulative distribution of non-agriculturalized areas throughout the study period was further calculated and is presented in
Figure 13.
Figure 13 illustrates the spatial distribution of cumulative non-agriculturalized areas in Dachang County from 2016 to 2023. A color gradient was used to represent the degree of non-agriculturalization, where lighter colors indicate areas with higher levels of non-agriculturalization, and darker colors represent areas with relatively lower levels. Over time, the extent of non-agriculturalized land has gradually expanded. The figure clearly shows that the non-agriculturalization process is primarily concentrated in urban areas and their immediate surroundings, particularly within the urban core and near major transportation hubs. These regions exhibit the highest degree of non-agriculturalization, and the affected areas demonstrate a spatial diffusion trend extending toward the urban fringe and along major transportation corridors. This spatial distribution pattern is strongly associated with urbanization and infrastructure development, indicating that as urbanization accelerates, former agricultural land has been progressively converted into industrial, commercial, and residential uses. Furthermore, the figure highlights the rapid expansion and strong clustering of non-agriculturalization activities over a relatively short time period, particularly in rapidly urbanizing zones. As urban expansion and human activities intensify, the spatial distribution of non-agriculturalized land tends to form a centrally clustered pattern, while some degree of outward diffusion persists at the urban periphery.
3.3.2. Dynamic Monitoring of Non-Agriculturalization
As shown in the trend analysis (
Section 3.3.1), the year 2020 marks a critical turning point. From 2016 to 2020, the non-agriculturalized area expanded steadily. However, after 2020, the degree of non-agriculturalization in Dachang County was significantly mitigated, largely due to the implementation of national land policies, including the Notice on Resolutely Preventing the Non-Agriculturalization of Arable Land issued by the General Office of the State Council in 2020. Dynamic monitoring was conducted for the two phases before and after this policy intervention.
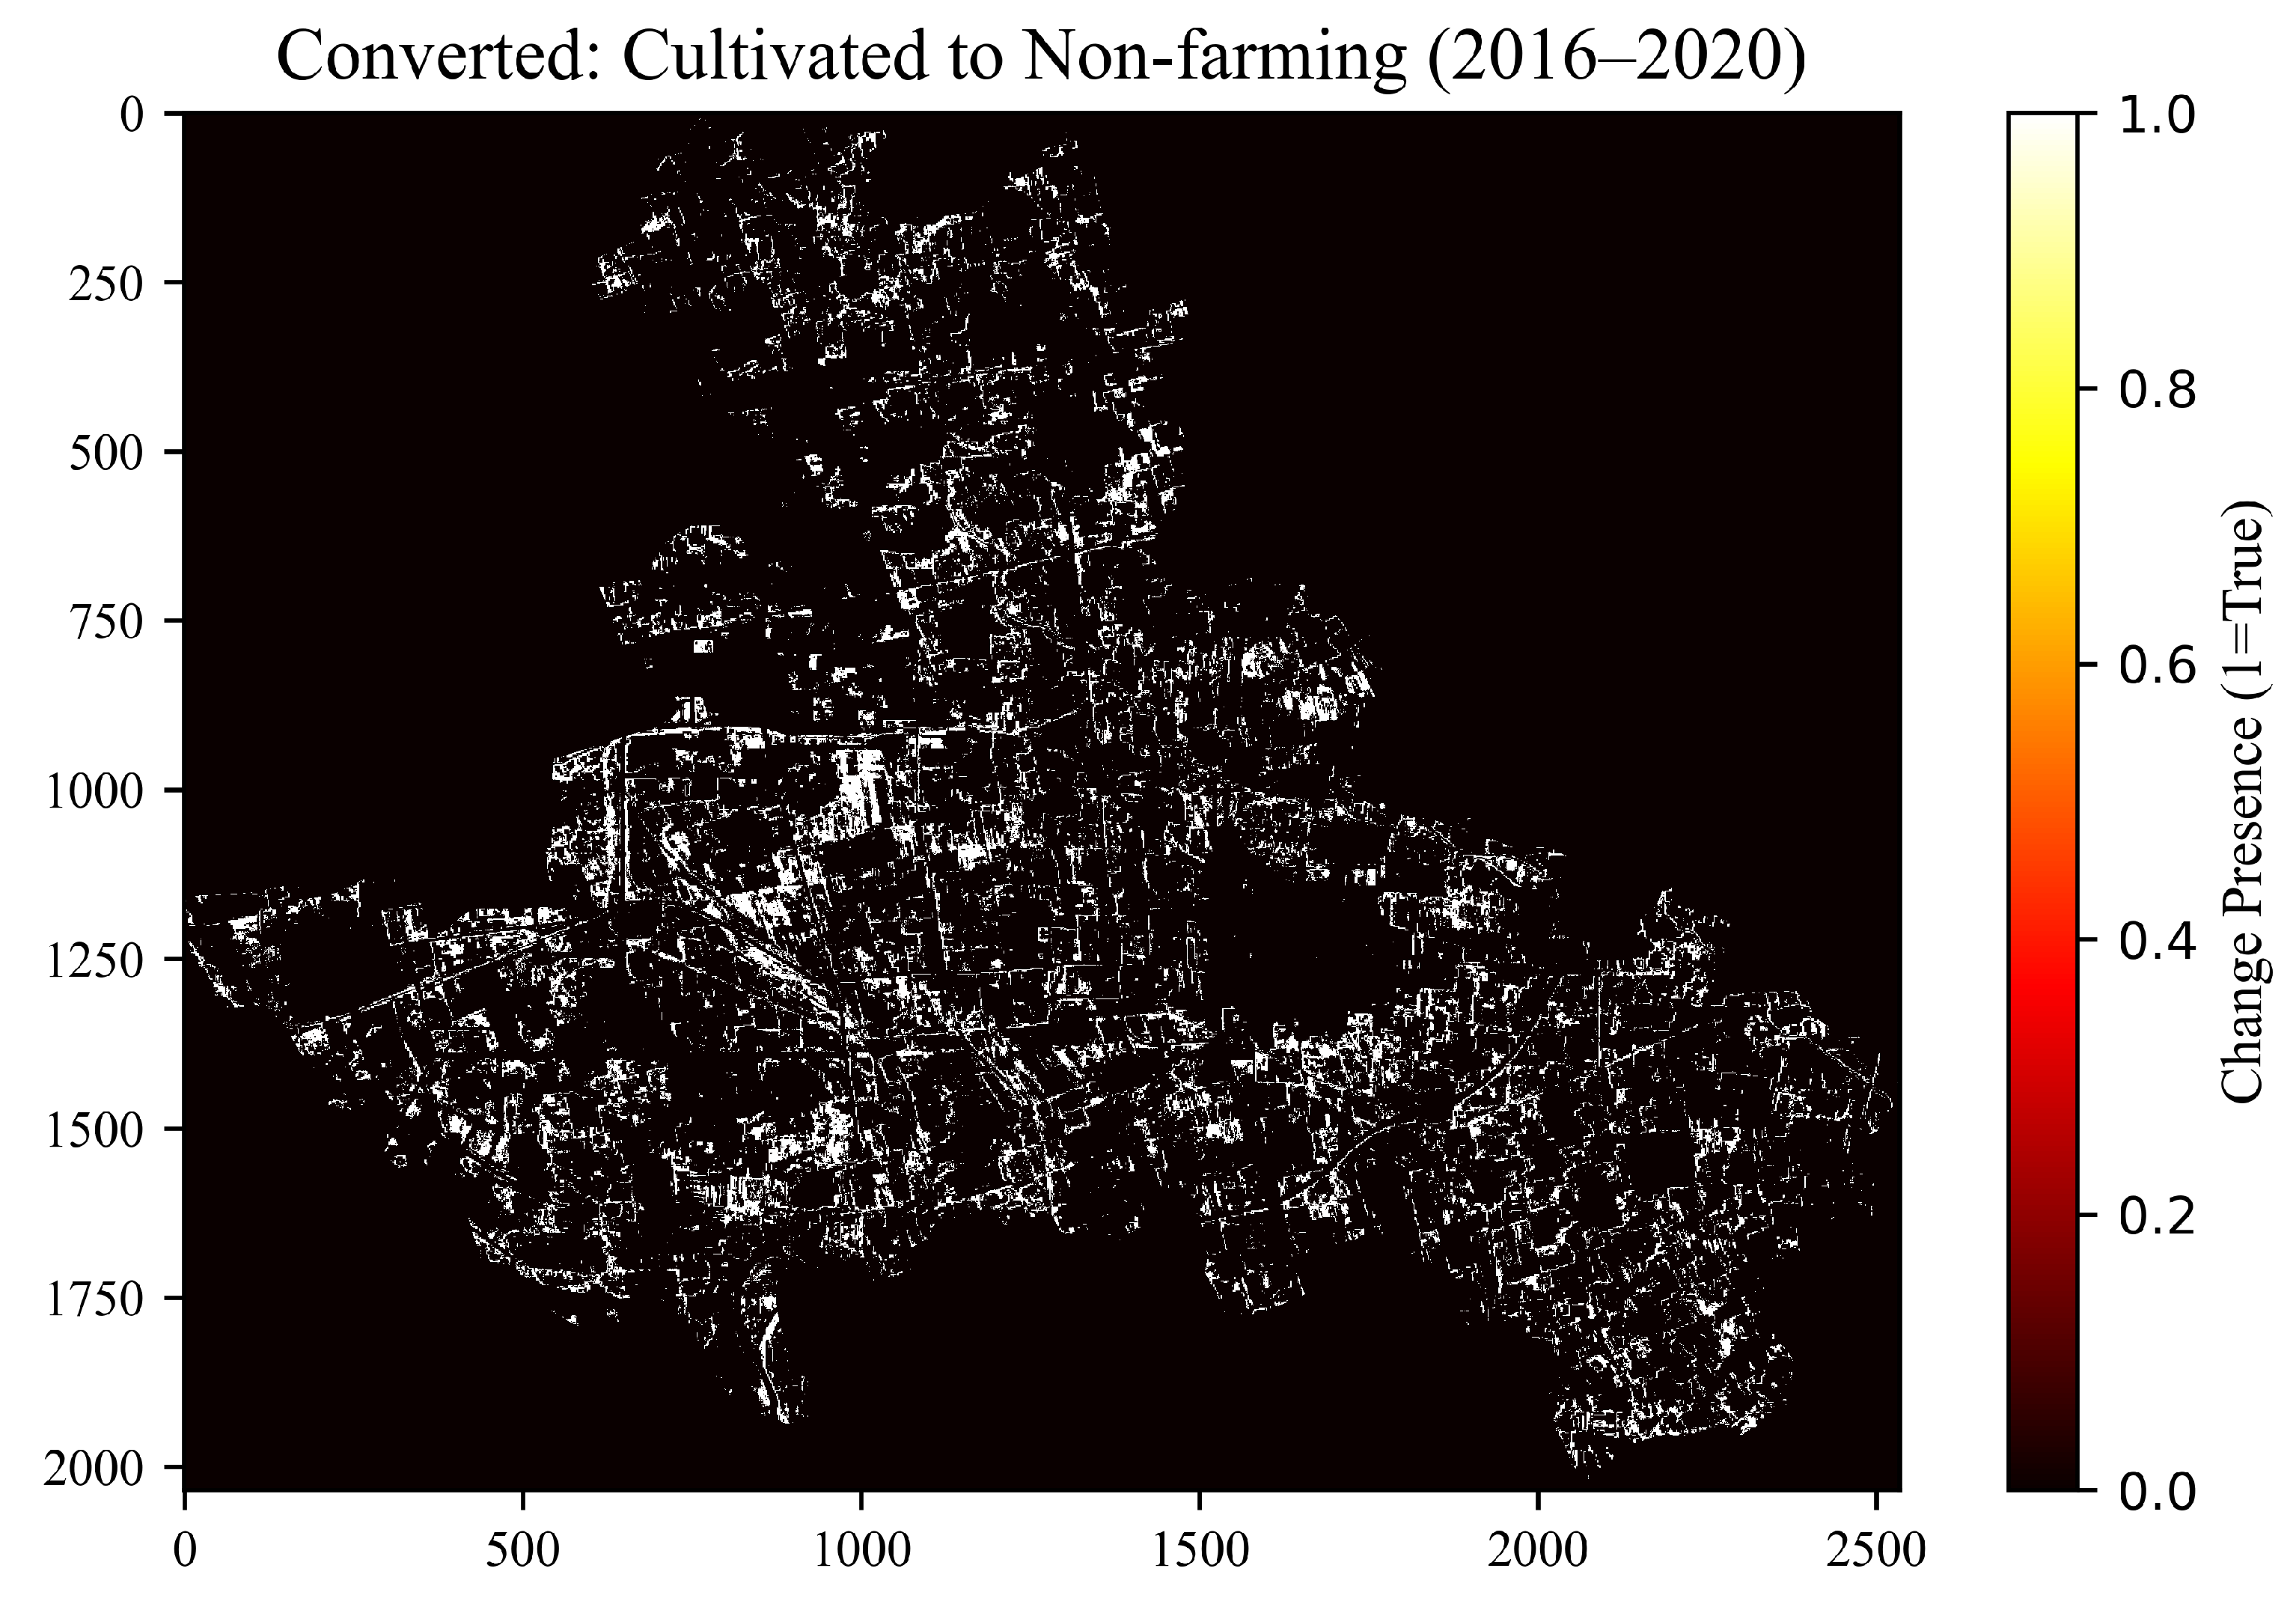
Figure 14 illustrates the spatial distribution of areas that transitioned from arable land to non-agricultural land between 2016 and 2020. In the map, lighter-colored regions indicate areas where land use conversion occurred during this period. These areas are concentrated mainly along urban fringes and around major transportation hubs, reflecting the direct impact of urban expansion and industrialization.
Figure 15 illustrates the spatial distribution of areas converted from non-agricultural land back to arable land during the period 2020–2023. Dark blue areas indicate locations where non-agriculturalized land was restored to arable land. Although the non-agriculturalized area increased significantly between 2016 and 2020, a partial reversal trend was observed from 2020 to 2023. As indicated in
Table 5 (
Section 3.2.3), the main categories of land restored to arable use were residential land and industrial land. This finding suggests that the dynamics of land use in certain urban fringe zones and industrial adjustment areas exhibit partial reversibility, which is likely influenced by factors such as land consolidation projects, reclamation policies, and industrial restructuring.
Through spatial analysis of land use changes across different time periods, this study reveals the spatio-temporal dynamics of land transformation during the process of non-agriculturalization. Under the accelerated pace of urbanization, non-agriculturalized areas were predominantly concentrated within urban cores and expansion zones, particularly in proximity to transportation infrastructure and industrial districts. In addition, a partial reversal from non-agricultural land back to arable land was observed in the later period, reflecting the combined influence of multiple factors, including policy adjustments, ecological restoration initiatives, and agricultural development strategies.
3.3.3. Driving Force Analysis
To explore the mechanisms underlying the spatial pattern of non-agriculturalization in Dachang County, this study used the geographic detector method [
43,
44]. Six driving factors (
x variables) were selected from three dimensions—natural, ecological, and socioeconomic—including topography (DEM), precipitation, nighttime light intensity, annual mean NDVI, population density within each spatial unit, and GDP per capita. The analysis aimed to evaluate the explanatory power of these factors and their potential interactions by integrating socioeconomic data, land use policies, and information on infrastructure development [
45,
46], thus establishing a comprehensive analysis framework of driving factors. The geographic detector model evaluates the explanatory power of each factor through the
q statistic, which ranges from 0 to 1, where 0 indicates no explanatory capacity and 1 represents complete explanatory power for the target phenomenon. In this study, the
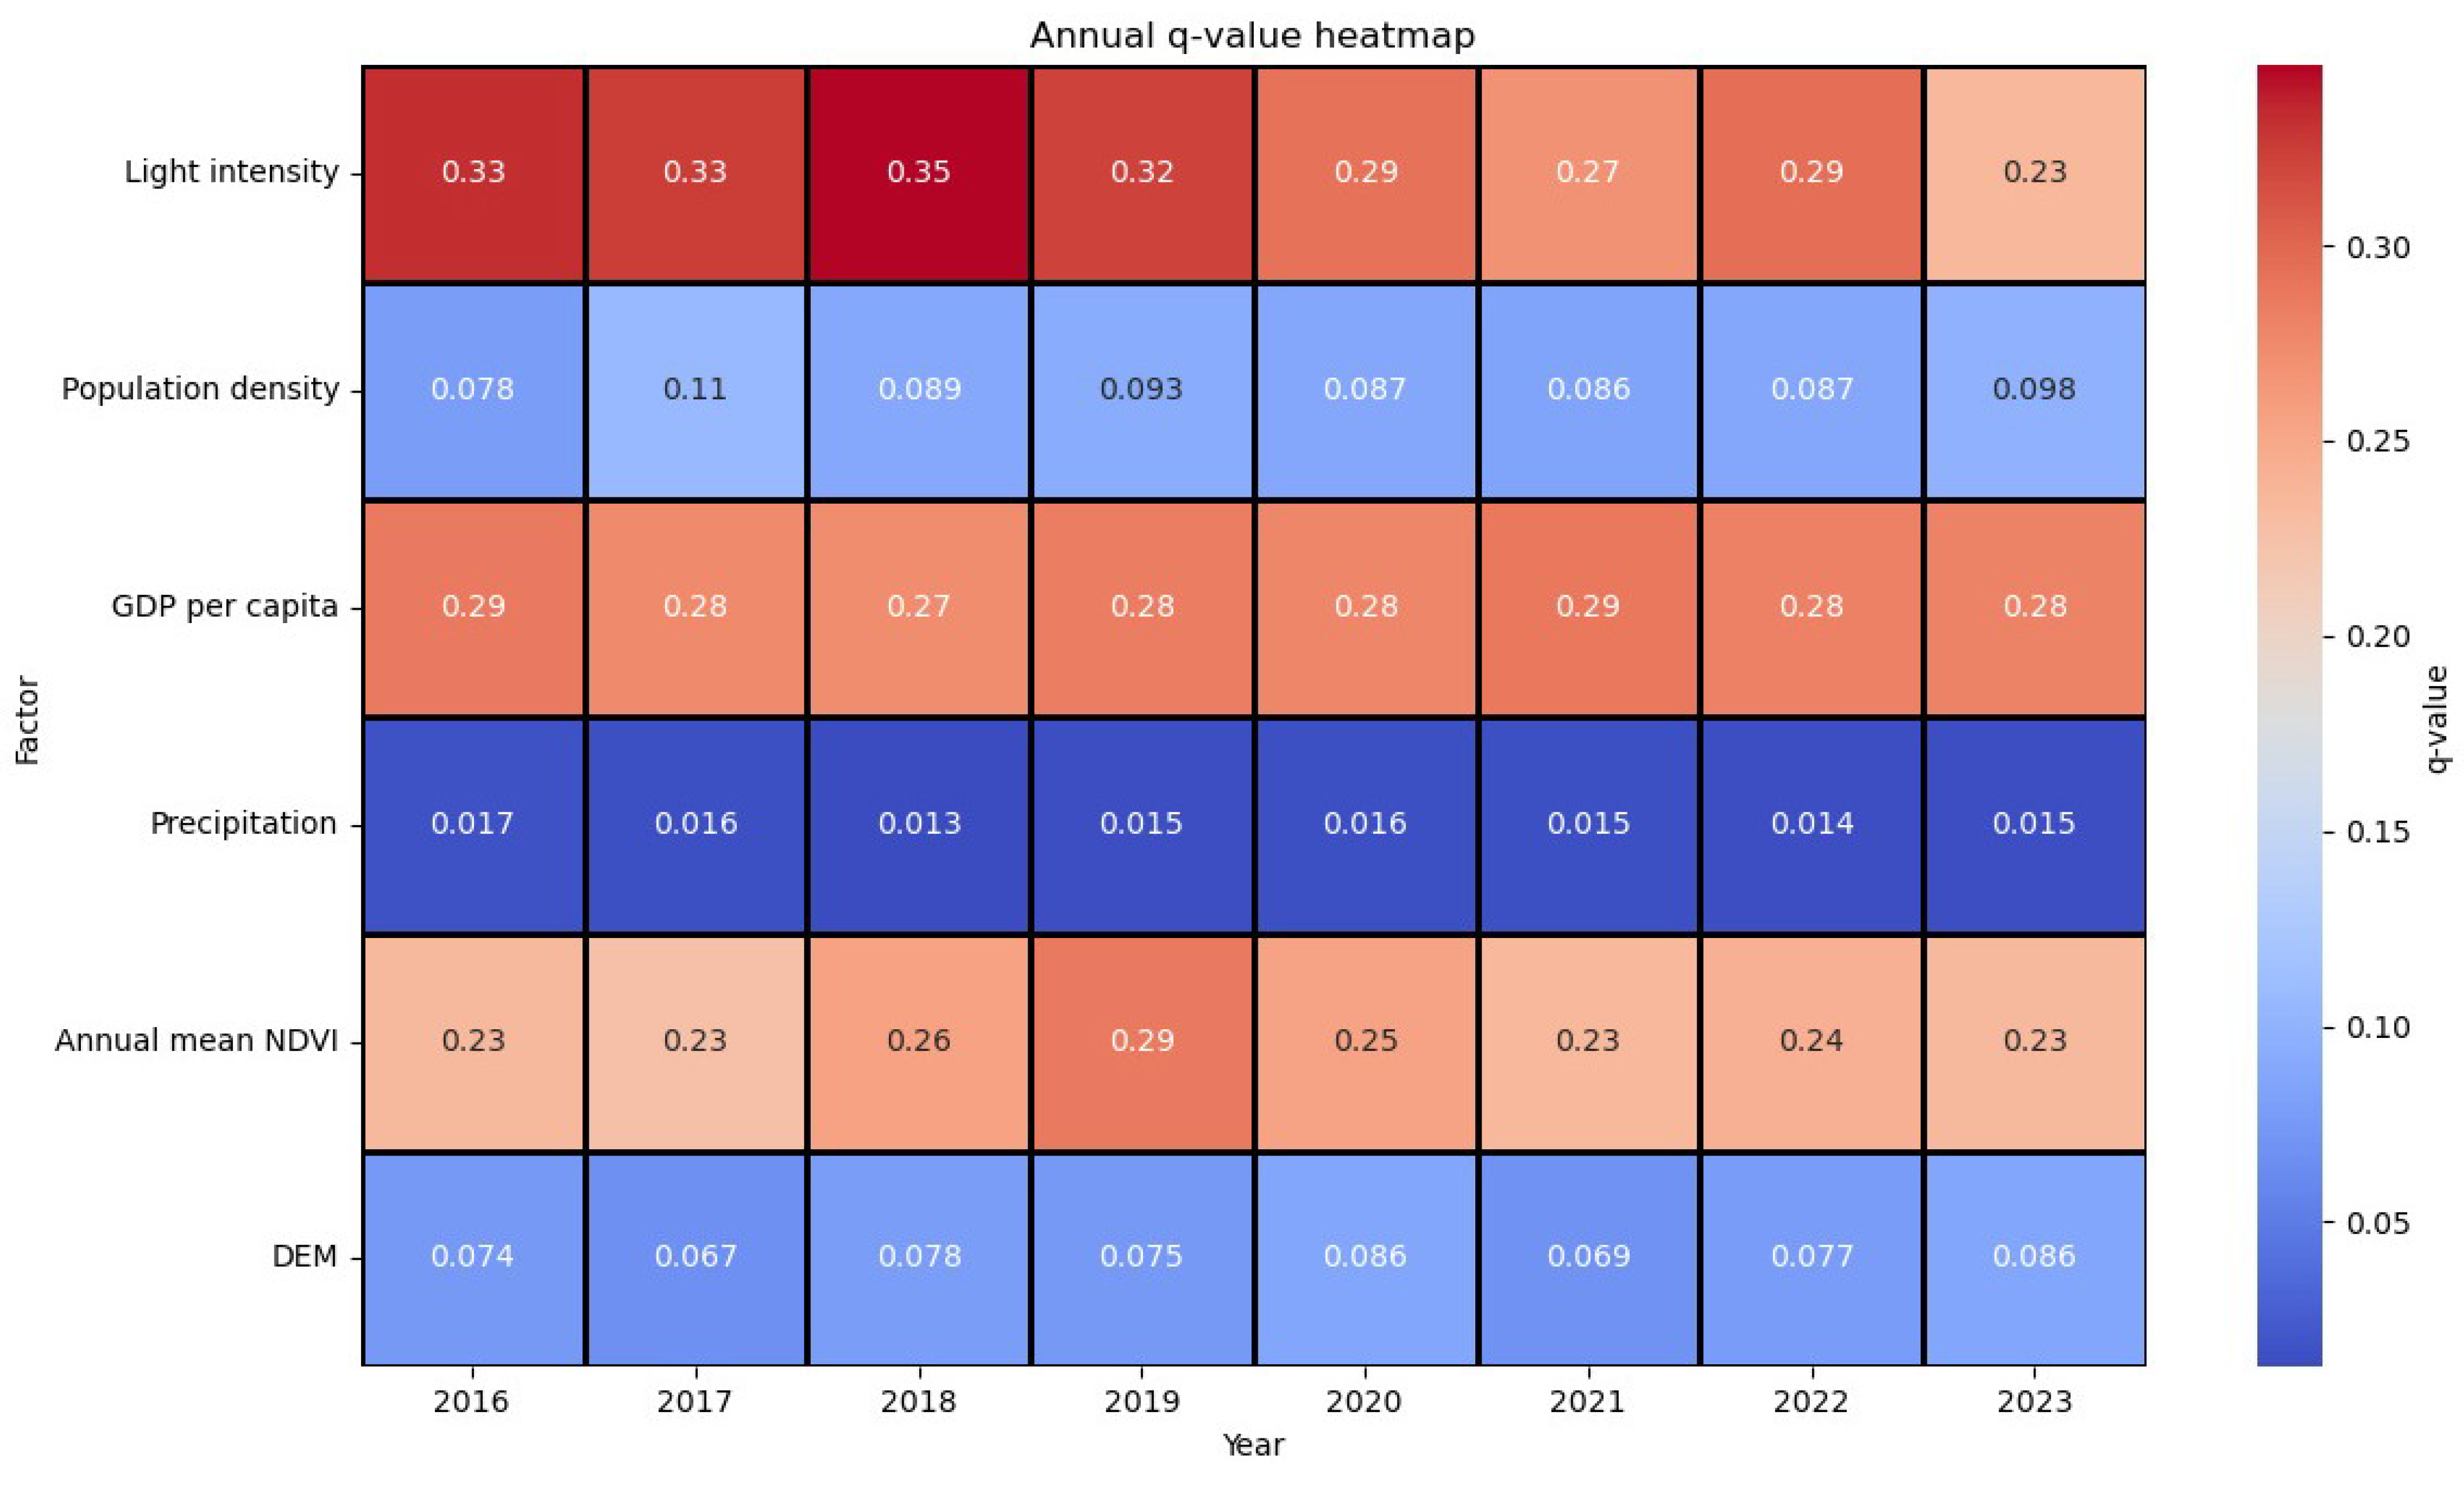
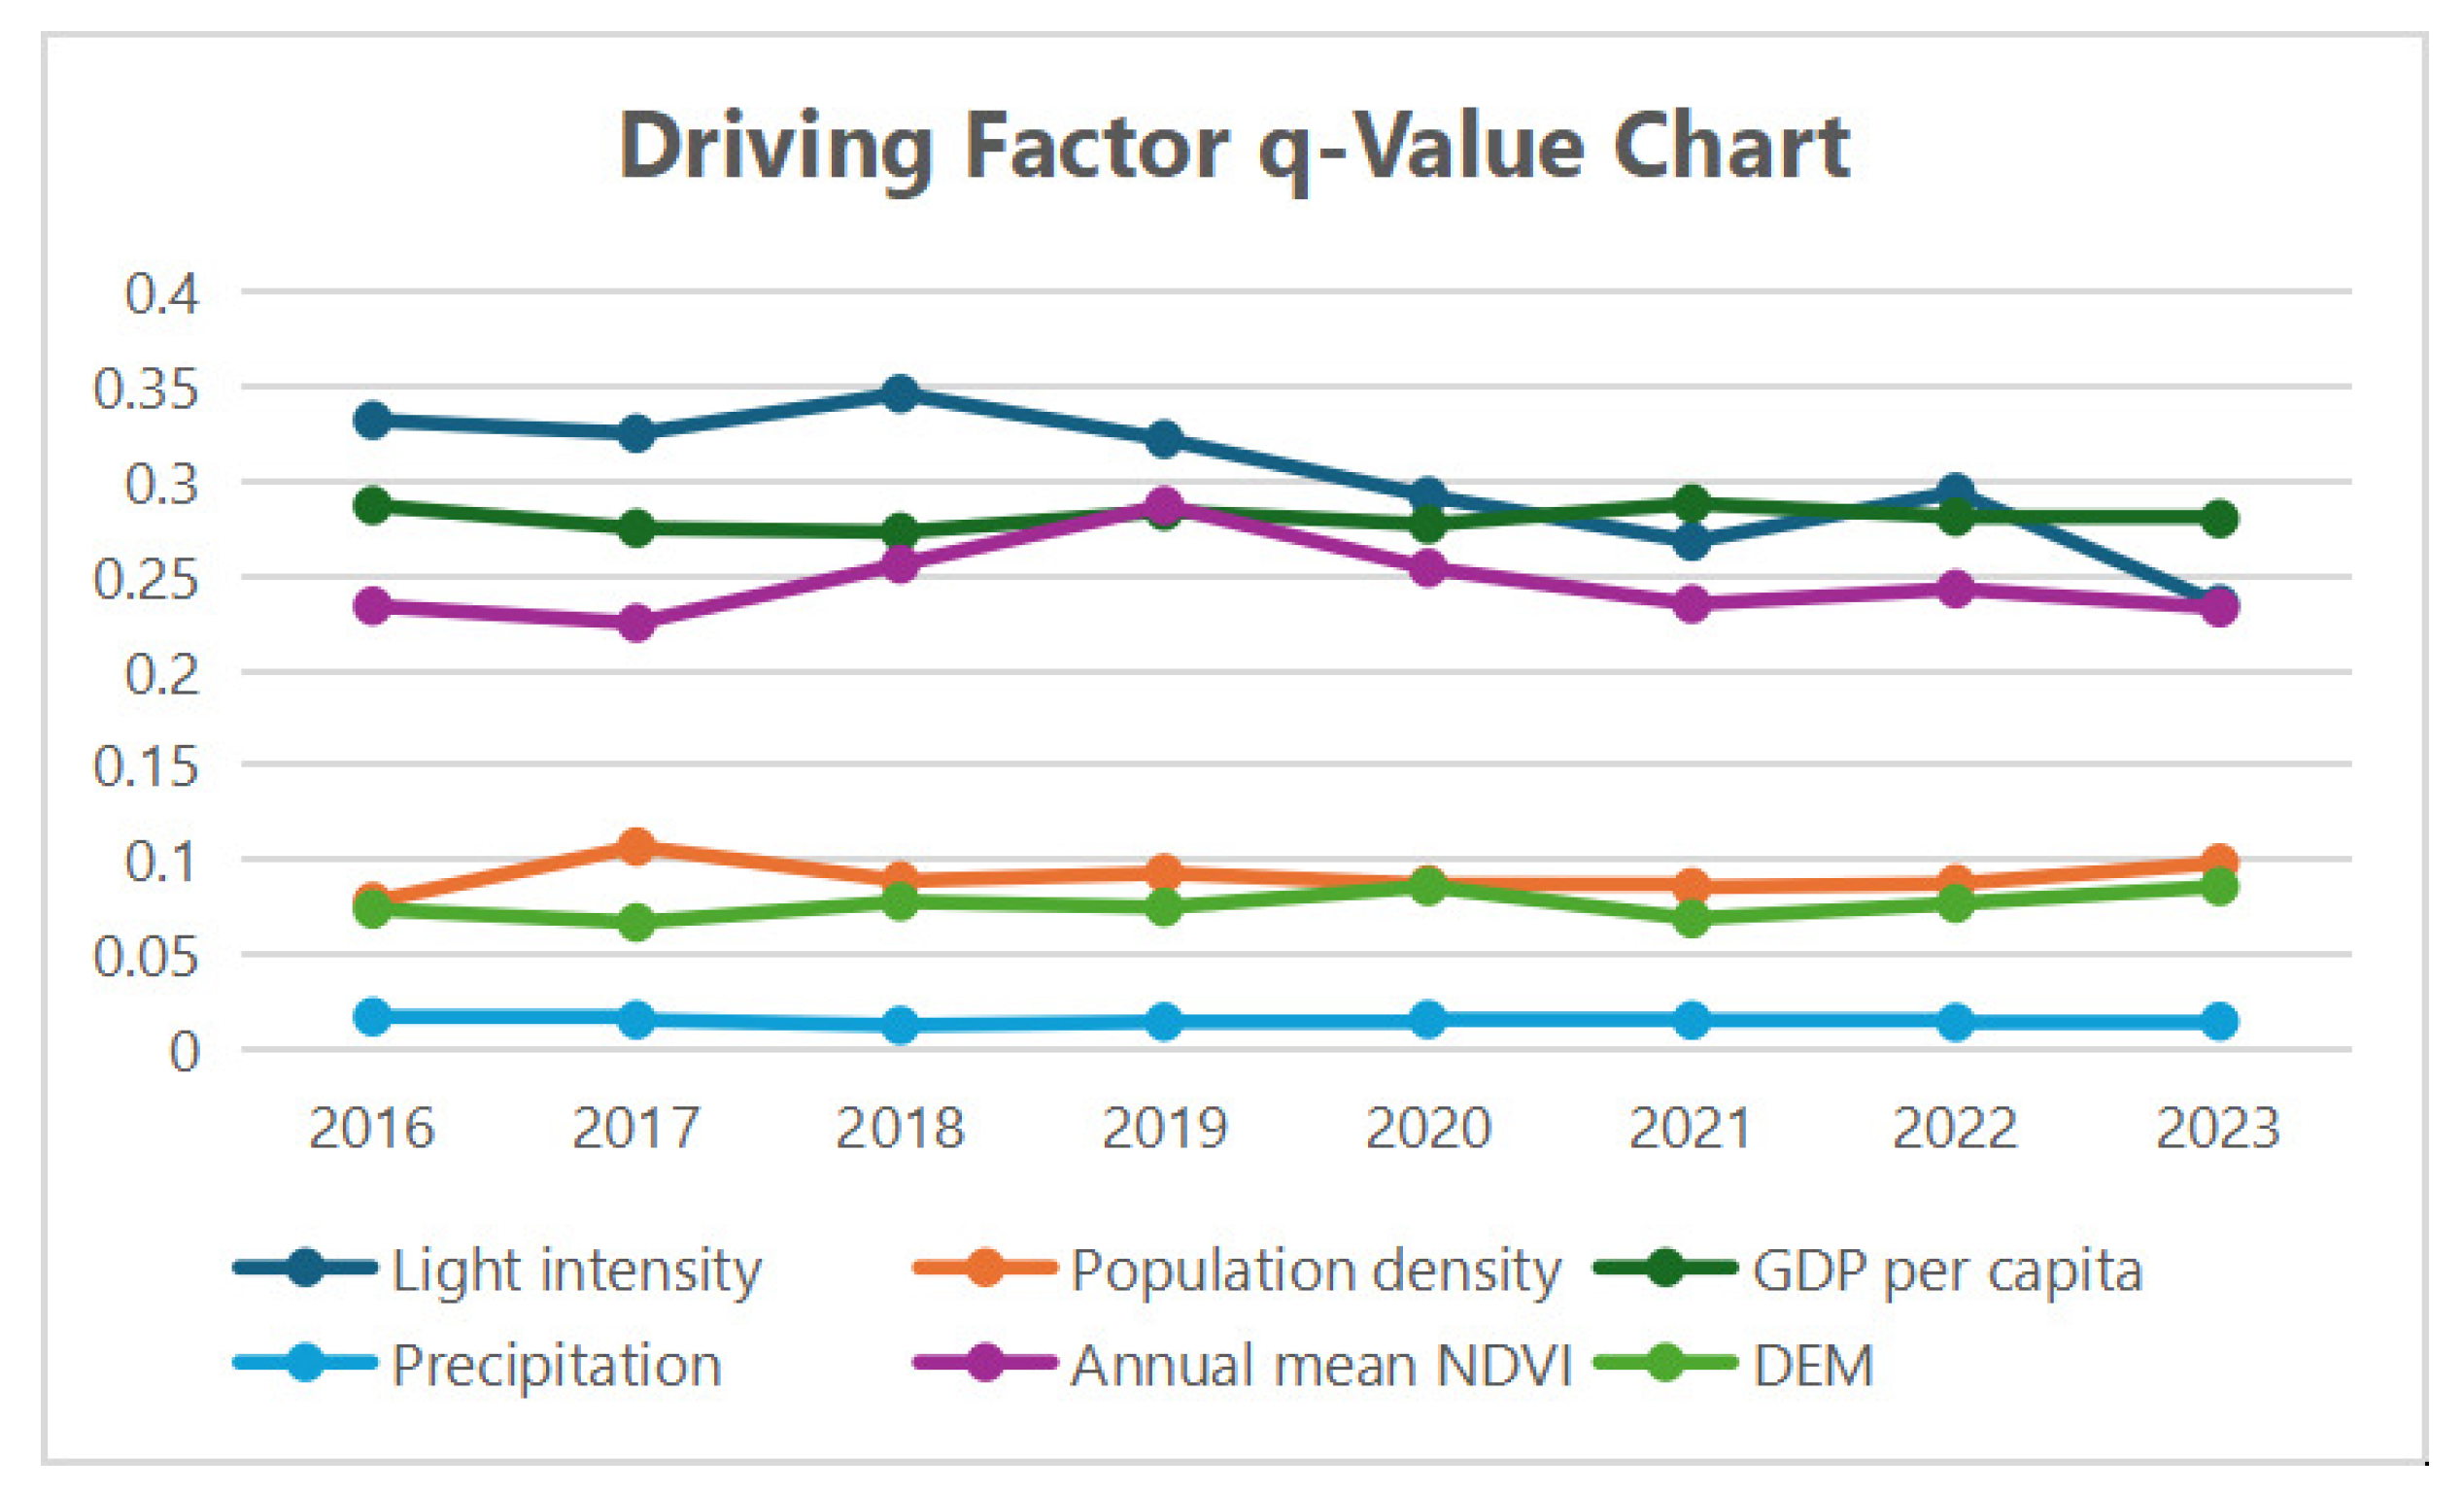
q values for the six selected factors were calculated and ranked to determine their relative contributions to the spatial heterogeneity of non-agriculturalization of arable land. The results are illustrated in
Figure 16 and
Table 6.
As shown in
Figure 17, the intensity of night light, the GDP per capita, and the annual mean NDVI exhibited relatively higher
q values (approximately 0.3) among the selected factors, indicating a notable explanatory power for the spatial distribution of arable land non-agriculturalization compared to other variables. Nighttime light intensity, as a proxy for urbanization level, suggests that areas with higher values are more susceptible to non-agricultural land conversion. Similarly, the increase in GDP per capita is closely associated with the expansion of construction land, reflecting the coupling between economic development and land use transformation. Among socioeconomic factors, nighttime light intensity and per capita GDP exerted the most substantial influence on non-agriculturalization. In rapidly urbanizing regions, the conversion of arable land to non-agricultural uses occurred at a faster pace, and the interaction effect between nighttime light intensity and population-related variables was the strongest, highlighting accelerated urbanization in economically developed areas. For natural and ecological factors, the annual mean NDVI also demonstrated a significant impact, suggesting its role in indicating vegetation conditions and land productivity. In contrast, DEM exhibited a relatively low
q value, consistent with the flat terrain and urbanization-driven characteristics of Dachang County. This finding implies that in rapidly urbanizing plain areas, topographic variation exerts minimal influence on land use changes compared to socioeconomic forces.
4. Discussion
This study used multi-temporal Sentinel-2 imagery from 2016 to 2023, integrating spectral, index-based, texture, and temporal features. After dimensionality reduction through PCA, high-accuracy classification (overall accuracy: 0.94) was achieved using XGBoost combined with Bayesian optimization. Finally, spatial analysis and the geographic detector model were used to reveal the spatio-temporal dynamics and driving factors of arable land non-agriculturalization in Dachang County. Although the study provides important information on the spatial patterns of non-agriculturalization and its major driving forces, several limitations remain and warrant further investigation. First, the causal mechanisms linking policy interventions and land use changes have not been quantitatively validated. Moreover, the dynamic trade-offs between rapid urbanization and farmland protection policies require a more systematic assessment. Future studies should incorporate multi-dimensional datasets and causal inference approaches to better understand these interactions. Second, from a technical perspective, although the classification accuracy was improved through model optimization, the reliability of remote sensing data is still constrained by factors such as cloud cover, atmospheric conditions, and spatial resolution. These limitations may reduce the accuracy of the classification in localized areas, particularly in parcels where changes in land use are subtle. Finally, in terms of methodological robustness, the current framework faces challenges when applied to large-scale or cross-regional scenarios due to sample heterogeneity and data distribution differences, which affect the model generalization capability.
Future research can be extended in three directions, First, integrate higher spatial and temporal resolution remote sensing data with multi-source data fusion and advanced deep learning models to enhance dynamic monitoring accuracy and real-time performance. Second, conduct multi-scale and multi-regional comparative analyses to develop classification and prediction frameworks with stronger generalization capabilities. Third, combine policy enforcement intensity, socioeconomic processes, and ground-based observations with causal inference and scenario simulation techniques to systematically evaluate the regulatory effects of policies on farmland non-agriculturalization, thereby providing a scientific basis for precision farmland protection and sustainable land use planning.
5. Conclusions
This study developed an integrated framework combining Sentinel-2 multi-temporal remote sensing data and multi-source driving factor data for classification and spatio-temporal analysis. The research first extracted spectral, index-based, texture, and temporal features, applied PCA for feature selection, and employed Bayesian optimization to tune four classification models (RF, XGBoost, SVM, and MLP) to identify the optimal model for high-precision multi-temporal image classification. Finally, GIS-based spatial analysis was used to characterize the historical spatio-temporal characteristics of arable land non-agriculturalization from 2016 to 2023, and the geographic detector was applied to quantify the driving effects of natural, ecological, and socioeconomic factors. The main conclusions are as follows.
(1) Comparative analysis of multiple classifiers revealed that the XGBoost model optimized with Bayesian hyperparameter tuning achieved the highest precision, with an overall accuracy (OA) of 0.94 and a Kappa coefficient of 0.9241. This performance surpassed that of Random Forest, SVM, and MLP, indicating that the optimized XGBoost model exhibits strong stability and generalization under small-to-medium sample conditions. The approach is well-suited for land use classification using multi-temporal remote sensing data and provides a high-precision, scalable solution for dynamic monitoring of arable land non-agriculturalization.
(2) From 2016 to 2020, the non-agriculturalization of arable land in Dachang County increased significantly, with the highest annual growth observed in 2017. These changes were concentrated mainly along urban expansion zones and transportation corridors. After 2020, the expansion trend slowed markedly and began to decline after 2021, demonstrating an evolutionary pattern of “rapid growth–slowdown–partial reversion”.
(3) Geographic detector results showed that nighttime light intensity and per capita GDP had relatively high explanatory power among the selected factors, highlighting the central role of socioeconomic forces in driving non-agriculturalization, particularly in urban fringe areas where intensified urbanization accelerates land conversion. Among natural factors, the annual mean NDVI ranked second in explanatory power, reflecting its indirect influence through ecological quality and land productivity, while DEM had minimal impact, consistent with the characteristics of the flat terrain of the study area.
(4) The findings suggest that future farmland protection efforts should focus on strengthening dynamic monitoring and regulation in urban expansion zones, particularly in areas with high intensity of night light and population density, to effectively control the expansion of construction land and prevent further loss of arable land.
Author Contributions
Authorship contribution statement B.L.: Visualization, Software, Methodology, Conceptualization. N.L.: Supervision, Visualization, Methodology, Funding Acquisition, Formal Analysis, Conceptualization. X.Z.: Project administration, Methodology, Investigation, Formal Analysis. C.W.: Validation, Resources. K.Y.: Software, Formal Analysis. K.Y.: Writing—review and editing, Validation. K.D.: Formal Analysis, Software. B.W.: Project administration, Data curation. All authors have read and agreed to the published version of the manuscript.
Funding
The Natural Science Foundation of Chongqing (grant No. CSTB2023NSCQ-MSX0781), Team Building Project for Graduate Tutors in Chongqing (No. JDDSTD2022002).
Acknowledgments
This research was supported by the Natural Science Foundation of Chongqing. The authors would like to thank the Chongqing Geomatics and Remote Sensing Center for providing the field monitoring data set.
Conflicts of Interest
The authors declare no conflicts of interest.
References
- Su, H.; Liu, F.; Zhang, H.; Ma, X.; Sun, A. Progress and prospects of non-grain production of cultivated land in China. Sustainability 2024, 16, 3517. [Google Scholar] [CrossRef]
- Jiang, Q.-O.; Deng, X.-Z.; Lin, Y.-Z.; Cui, Y.-W. Impacts of cultivated land conversion on cultivated land productivity in China: Prediction and analysis. Chin. J. Appl. Ecol. Shengtai Xuebao 2010, 21, 3113. [Google Scholar]
- Xui, Z.C.; Yu, D.S.; Pan, Y.; Wang, X.Y.; Huang, J.J.; Sun, B. Temporal characteristics of soil fertility of cropland requisition-compensation in the typical region of Yangtze River Delta, China. Ying Yong Sheng Tai Xue Bao = J. Appl. Ecol. 2018, 29, 617–625. [Google Scholar]
- Song, Y.; Gao, M.X.; Wang, Z.R.; Wang, J.F.; Xu, Z.X. Spatiotemporal variation characteristics and driving factors of cultivated land NPP in the shandong area around the Bohai sea. Huan Jing Ke Xue = Huanjing Kexue 2024, 45, 4733–4743. [Google Scholar]
- Deng, X.; Huang, J.; Rozelle, S.; Uchida, E. Economic growth and the expansion of urban land in China. Urban Stud. 2010, 47, 813–843. [Google Scholar] [CrossRef]
- Cui, J.; Kong, X.; Chen, J.; Sun, J.; Zhu, Y. Spatially explicit evaluation and driving factor identification of land use conflict in yangtze river economic belt. Land 2021, 10, 43. [Google Scholar] [CrossRef]
- Xu, H.Z. Market failure and loss of ecosystem service value of farmland in the process of farmland conversion—A case study of Jiangsu Province. Chin. J. Eco-Agric. 2010, 18, 1366–1371. [Google Scholar] [CrossRef]
- Yang, W.; Liu, D.; Gong, Q. Estimation loss of agroecosystem service value in farmland conversion and its provincial difference in 2001–2016. Econ. Geogr. 2019, 39, 201–209. [Google Scholar]
- Xiao, Y.; Wu, X.Z.; Wang, L.; Liang, J. Optimal farmland conversion in China under double restraints of economic growth and resource protection. J. Clean. Prod. 2017, 142, 524–537. [Google Scholar] [CrossRef]
- Xu, S. Temporal and spatial characteristics of the change of cultivated land resources in the black soil region of Heilongjiang Province (China). Sustainability 2018, 11, 38. [Google Scholar] [CrossRef]
- Cuypers, S.; Nascetti, A.; Vergauwen, M. Land use and land cover mapping with VHR and multi-temporal Sentinel-2 imagery. Remote Sens. 2023, 15, 2501. [Google Scholar] [CrossRef]
- Ruan, O.; Liu, S.-H.; Luo, J.; Hiu, H.T. Rocky desertification information extraction in karst terrain complex area based on endmember variable. Spectrosc. Spectr. Anal. 2022, 42, 2269–2277. [Google Scholar]
- Shi, T.T.; Zhang, X.B.; Guo, L.P.; Huang, L.Q. Random forest classification of Callicarpa nudiflora from WorldView-3 imagery based on optimized feature space. Zhongguo Zhong Yao Za Zhi = Zhongguo Zhongyao Zazhi = China J. Chin. Mater. Medica 2019, 44, 4073–4077. [Google Scholar]
- Wu, J.; Peng, D.L. Tree Species information extraction of farmland returned to forests based on improved support vector machine algorithm. Spectrosc. Spectr. Anal. 2011, 31, 1038–1041. [Google Scholar]
- Mohamed, M.A.; Anders, J.; Schneider, C. Monitoring of changes in land use/land cover in Syria from 2010 to 2018 using multitemporal landsat imagery and GIS. Land 2020, 9, 226. [Google Scholar] [CrossRef]
- Xie, H.; He, Y.; Choi, Y.; Chen, Q.; Cheng, H. Warning of negative effects of land-use changes on ecological security based on GIS. Sci. Total Environ. 2020, 704, 135427. [Google Scholar] [CrossRef]
- Zhou, Y.; Li, X.; Liu, Y. Land use change and driving factors in rural China during the period 1995–2015. Land Use Policy 2020, 99, 105048. [Google Scholar] [CrossRef]
- Paul, S.; Saxena, K.G.; Nagendra, H.; Lele, N. Tracing land use and land cover change in peri-urban Delhi, India, over 1973–2017 period. Environ. Monit. Assess. 2021, 193, 52. [Google Scholar] [CrossRef] [PubMed]
- Qi, Y.T.; Zhang, P.; Liu, L.; Ma, X.N.; Wang, H.; Zhao, J. Multi-scenario optimization of land use structure and prediction of ecosystem service value in Guanzhong Plain urban agglomeration. Ying Yong Sheng Tai Xue Bao = J. Appl. Ecol. 2023, 34, 2507–2517. [Google Scholar]
- Jia, K.; Li, Q.Z.; Tian, Y.C.; Wu, B.F. A review of classification methods of remote sensing imagery. Spectrosc. Spectr. Anal. 2011, 31, 2618–2623. [Google Scholar]
- Song, Y.; Song, X.D.; Guo, Q.H.; Tang, L.N. Remote sensing monitoring and pre-alarming of algal blooms in Taihu Lake. Spectrosc. Spectr. Anal. 2011, 31, 753–757. [Google Scholar]
- Li, Y.S.; Zhao, G.X.; Wang, Z.R.; Cui, K.; Xi, X.; Dou, J.C. Remote sensing inversion of cultivated land fertility at county scale based on SWCI-NDVI feature space. Ying Yong Sheng Tai Xue Bao = J. Appl. Ecol. 2021, 32, 252–260. [Google Scholar]
- Xi, F.M.; He, H.S.; Hu, Y.M.; Wu, X.Q.; Bao, L.; Tian, Y.; Wang, J.N.; Ma, W.J. Simulation and prediction of urban and rural settlement growth and land use change in Yingkou City. Ying Yong Sheng Tai Xue Bao = J. Appl. Ecol. 2008, 19, 1529–1536. [Google Scholar]
- Li, C.; Han, J.; Pan, X.; Wang, S.; Yin, J. Detection of volcanic disaster scene from high-resolution remote sensing image with deep learning. Chin. J. Geophys. 2024, 67, 4717–4732. [Google Scholar]
- Shao, Z.D.; Zhang, F.; Peng, K.; Zhang, F.F. Ecological Environment Quality Monitoring of Qitai Oasis Based on Land Use/Cover Change and Remote Sensing Ecological Index. Huan Jing Ke Xue = Huanjing Kexue 2024, 45, 5890–5899. [Google Scholar]
- Zhao, J.L.; Li, X.; Sun, B. Spatial-temporal evolution and driving factors analysis of ecological environment quality in Daihai Basin based on AWRSEI. Huan Jing Ke Xue = Huanjing Kexue 2024, 45, 1598–1614. [Google Scholar]
- Li, Y.C.; Yuan, J.G.; Liu, B.H.; Guo, H. Ecological Environment Dynamical Evaluation of Hutuo River Basin Using Remote Sensing. Huan Jing Ke Xue = Huanjing Kexue 2024, 45, 2757–2766. [Google Scholar]
- Li, T.; Gan, X.; Yang, Z.; Wang, K.; Qi, Z.; Li, H.; Chen, X. Spatial-temporal evolvement of ecosystem service value of Dongting Lake area influenced by changes of land use. Ying Yong Sheng Tai Xue Bao = J. Appl. Ecol. 2016, 27, 3787–3796. [Google Scholar]
- Liu, K.; Li, Y.; Wu, Q.; Shen, J.F. Driving force analysis of land use change in the developed area based on Probit regression model: A case study of Nanjing City, China. Chin. J. Appl. Ecol. Shengtai Xuebao 2015, 26, 2131. [Google Scholar]
- Phonphan, W.; Thanakunwutthirot, M. Mapping of mangrove change with remote sensing in Samut Songkhram Province, Thailand. In Proceedings of the International Conference on Human Interaction and Emerging Technologies, Lausanne, Switzerland, 23–25 April 2020; pp. 191–197. [Google Scholar]
- Faye, B.; Du, G.; Li, Q.; Sané, T.; Mbaye, E.; Zhang, R. Understanding the characteristics of agricultural land transition in Thiès region, Senegal: An integrated analysis combining remote sensing and survey data. Front. Environ. Sci. 2023, 11, 1124637. [Google Scholar] [CrossRef]
- Li, S. Change detection: How has urban expansion in Buenos Aires metropolitan region affected croplands. Int. J. Digit. Earth 2018, 11, 195–211. [Google Scholar] [CrossRef]
- Li, K.; Wang, X.; Yao, L.; Shi, Y. Spatio-temporal change and driving factor analysis of ecosystem service value in the Beijing-Tianjin-Hebei region. J. Environ. Eng. Technol. 2022, 12, 1114–1122. [Google Scholar]
- Li, X.; Zhang, X.; Jin, X. Spatio-temporal characteristics and driving factors of cultivated land change in various agricultural regions of China: A detailed analysis based on county-level data. Ecol. Indic. 2024, 166, 112485. [Google Scholar] [CrossRef]
- Elvidge, C.D.; Baugh, K.; Zhizhin, M.; Hsu, F.C.; Ghosh, T. VIIRS night-time lights. In Remote Sensing of Night-Time Light; Routledge: London, UK, 2021; pp. 6–25. [Google Scholar]
- Jolliffe, I.T.; Cadima, J. Principal component analysis: A review and recent developments. Philos. Trans. R. Soc. A Math. Phys. Eng. Sci. 2016, 374, 20150202. [Google Scholar] [CrossRef]
- Amini, S.; Saber, M.; Rabiei-Dastjerdi, H.; Homayouni, S. Urban land use and land cover change analysis using random forest classification of landsat time series. Remote Sens. 2022, 14, 2654. [Google Scholar] [CrossRef]
- Chen, T.; Guestrin, C. Xgboost: A scalable tree boosting system. In Proceedings of the 22nd ACM SIGKDD International Conference on Knowledge Discovery and Data Mining, San Francisco, CA, USA, 13–17 August 2016; pp. 785–794. [Google Scholar]
- Grekousis, G. Geographical-XGBoost: A new ensemble model for spatially local regression based on gradient-boosted trees. J. Geogr. Syst. 2025, 27, 169–195. [Google Scholar] [CrossRef]
- Karan, S.K.; Samadder, S.R. A comparison of different land-use classification techniques for accurate monitoring of degraded coal-mining areas. Environ. Earth Sci. 2018, 77, 713. [Google Scholar] [CrossRef]
- Zhang, H.; Dong, Z.; Li, B.; He, S. Multi-Scale MLP-Mixer for image classification. Knowl.-Based Syst. 2022, 258, 109792. [Google Scholar] [CrossRef]
- Mondal, R.; Pal, T.; Dey, P. Discriminative regularized input manifold for multilayer perceptron. Pattern Recognit. 2024, 151, 110421. [Google Scholar] [CrossRef]
- Lin, Y.M.; Li, W.H.; Nan, X.X.; Zhang, J.H.; Hu, Z.R.; Ni, X.L.; Wang, F. Spatial-temporal differentiation and driving factors of vegetation coverage in Ningxia Helan Mountain based on geodetector. Ying Yong Sheng Tai Xue Bao = J. Appl. Ecol. 2022, 33, 3321–3327. [Google Scholar]
- Xin, P.Y.; Tian, T.; Zhang, M.L.; Han, W.Z.; Song, Y.T. Assessment of habitat quality changes and driving factors in Jilin Province based on InVEST model and geodetector. Ying Yong Sheng Tai Xue Bao = J. Appl. Ecol. 2024, 35, 2853–2860. [Google Scholar]
- Fu, J.X.; Cao, G.C.; Guo, W.J. Land use change and its driving force on the southern slope of Qilian Mountains from 1980 to 2018. Ying Yong Sheng Tai Xue Bao = J. Appl. Ecol. 2020, 31, 2699–2709. [Google Scholar]
- He, M.Z.; Zhang, L.T.; Wei, Y.Y.; Zheng, Z.H.; Wang, Q.Y. Landscape pattern vulnerability and its driving forces in different geomorphological divisions in the middle Yellow River. Huan Jing Ke Xue = Huanjing Kexue 2024, 45, 3363–3374. [Google Scholar] [PubMed]
Figure 1.
General flow diagram.
Figure 1.
General flow diagram.
Figure 2.
Geographic location of the study area.
Figure 2.
Geographic location of the study area.
Figure 3.
Random forest diagram.
Figure 3.
Random forest diagram.
Figure 4.
XGBoost diagram.
Figure 4.
XGBoost diagram.
Figure 7.
Precision–Recall curve.
Figure 7.
Precision–Recall curve.
Figure 8.
Feature image set. (a) Spectral feature image; (b) spectral index feature image without red edge; (c) spectral index feature image with red edge; (d) texture feature image; (e) spatio-temporal feature image.
Figure 8.
Feature image set. (a) Spectral feature image; (b) spectral index feature image without red edge; (c) spectral index feature image with red edge; (d) texture feature image; (e) spatio-temporal feature image.
Figure 9.
(a) is the original image, (b) is the XGBoost classification result, (c) is the RF classification result, (d) is the SVM classification result, and (e) is the MLP classification result.
Figure 9.
(a) is the original image, (b) is the XGBoost classification result, (c) is the RF classification result, (d) is the SVM classification result, and (e) is the MLP classification result.
Figure 10.
Figures (a–h) represent the reclassification results from 2016 to 2023.
Figure 10.
Figures (a–h) represent the reclassification results from 2016 to 2023.
Figure 11.
Annual trend chart of non-agricultural areas.
Figure 11.
Annual trend chart of non-agricultural areas.
Figure 12.
Annual growth rate change curve.
Figure 12.
Annual growth rate change curve.
Figure 13.
Cumulative distribution map of non-agricultural areas.
Figure 13.
Cumulative distribution map of non-agricultural areas.
Figure 14.
Trend change map from 2016 to 2020.
Figure 14.
Trend change map from 2016 to 2020.
Figure 15.
Trend change map from 2020 to 2023.
Figure 15.
Trend change map from 2020 to 2023.
Figure 16.
Factor heatmap.
Figure 16.
Factor heatmap.
Figure 17.
q-value curve chart.
Figure 17.
q-value curve chart.
Table 1.
Sentinel-2 Band Parameters.
Table 1.
Sentinel-2 Band Parameters.
| Band | Central Wavelength (nm) | Band Width (nm) | Spatial Resolution (m) |
|---|
| B2 | 490 | 65 | 10 |
| B3 | 560 | 35 | 10 |
| B4 | 665 | 30 | 10 |
| B5 | 705 | 15 | 20 |
| B6 | 740 | 15 | 20 |
| B7 | 783 | 20 | 20 |
| B8 | 842 | 115 | 10 |
| B8A | 865 | 20 | 20 |
Table 2.
Driving factors influencing arable land non-agriculturalization.
Table 2.
Driving factors influencing arable land non-agriculturalization.
| Factor Type | Driving Factor | Reasonable Explanation |
|---|
| Natural factors | Topography and precipitation | Determining land suitability |
| Ecological factors | Annual mean NDVI | Reflects ecological quality, farmland degradation, potential non-agricultural risks, and developability |
| Socioeconomic factors | Night light intensity, population density, GDP per capita | Reflects urbanization, human activity intensity, and economic driving force |
Table 3.
Feature variable set.
Table 3.
Feature variable set.
| Feature Variables | Feature Factors | Feature Descriptions |
|---|
| Spectral Features | B2 | Blue band reflectance |
| B3 | Green band reflectance |
| B4 | Red band reflectance |
| B5 | Vegetation red edge 1 |
| B6 | Vegetation red edge 2 |
| B7 | Vegetation red edge 3 |
| B8 | NIR band reflectance |
| B8A | Narrow NIR band |
| Non-Red Edge Spectral Index Features | RVI | B8/B4 |
| NDVI | |
| SAVI | |
| MSAVI | |
| DVI | |
| GNDVI | |
| NDWI | |
| Red Edge Spectral Index Features | RNDVI | |
| REDNDVI | |
| TVI | |
| RRI1 | B8/B5 |
| RRI2 | B5/B4 |
| MSRre | |
| Clre | B8/B5 - 1 |
| REDVI | |
| Texture Features | Mean | GLCM Mean texture value |
| Variance | GLCM Variance |
| Contrast | GLCM Contrast |
| Dissimilarity | GLCM Dissimilarity |
| Homogeneity | GLCM Homogeneity |
| Entropy | GLCM Entropy |
| Second Moment | GLCM Angular Second Moment |
| Correlation | GLCM Correlation |
| Spatio-temporal Features | Annual Change Rate of NDVI | |
| Temporal Mean | MAEN |
| Temporal Standard Deviation | StdDev |
Table 4.
Comparison of accuracy across different classification algorithms.
Table 4.
Comparison of accuracy across different classification algorithms.
| Method | Overall Accuracy | Kappa | Category | Recall | F1-Score | Precision |
|---|
| RF + HPO | 0.9281 | 0.9091 | 0 | 0.99 | 0.99 | 0.99 |
| 1 | 0.95 | 0.95 | 0.95 |
| 2 | 0.94 | 0.88 | 0.83 |
| 3 | 0.84 | 0.88 | 0.93 |
| 4 | 0.95 | 0.96 | 0.97 |
| XGBoost + HPO | 0.9401 | 0.9241 | 0 | 0.99 | 0.99 | 0.99 |
| 1 | 0.95 | 0.98 | 0.99 |
| 2 | 0.94 | 0.88 | 0.83 |
| 3 | 0.86 | 0.89 | 0.93 |
| 4 | 0.97 | 0.99 | 0.99 |
| SVM + HPO | 0.8982 | 0.8714 | 0 | 0.99 | 0.97 | 0.94 |
| 1 | 0.90 | 0.90 | 0.90 |
| 2 | 0.92 | 0.84 | 0.77 |
| 3 | 0.77 | 0.84 | 0.92 |
| 4 | 0.95 | 0.97 | 0.99 |
| MLP + Attention Mechanism | 0.9042 | none | 0 | 0.99 | 0.97 | 0.94 |
| 1 | 0.90 | 0.93 | 0.95 |
| 2 | 0.86 | 0.82 | 0.78 |
| 3 | 0.82 | 0.86 | 0.90 |
| 4 | 0.97 | 0.99 | 0.98 |
Table 5.
Area statistics of land use types in Dachang County for different years (unit: km2).
Table 5.
Area statistics of land use types in Dachang County for different years (unit: km2).
| Years | Arable Land | Water Body | Roads | Residential Land | Industrial Land |
|---|
| 2016 | 77.689 | 6.169 | 15.39 | 59.873 | 16.915 |
| 2017 | 67.994 | 5.844 | 16.158 | 68.373 | 17.695 |
| 2018 | 68.85 | 5.904 | 16.362 | 67.452 | 18.362 |
| 2019 | 68.812 | 5.857 | 16.582 | 67.551 | 18.082 |
| 2020 | 67.58 | 6.002 | 17.441 | 67.454 | 17.841 |
| 2021 | 69.682 | 6.051 | 17.624 | 65.089 | 17.624 |
| 2022 | 70.381 | 7.764 | 18.056 | 62.499 | 17.056 |
| 2023 | 71.67 | 6.935 | 17.704 | 63.859 | 16.304 |
Table 6.
Table of q values of different driving factors.
Table 6.
Table of q values of different driving factors.
| Years | Light Intensity | Population Density | GDP Per Capita | Precipitation | Annual Mean NDVI | DEM |
|---|
| 2016 | 0.332 | 0.078 | 0.287 | 0.0172 | 0.234 | 0.074 |
| 2017 | 0.325 | 0.107 | 0.275 | 0.0156 | 0.225 | 0.067 |
| 2018 | 0.346 | 0.089 | 0.273 | 0.0127 | 0.256 | 0.078 |
| 2019 | 0.322 | 0.093 | 0.284 | 0.0146 | 0.287 | 0.075 |
| 2020 | 0.292 | 0.087 | 0.277 | 0.0158 | 0.254 | 0.086 |
| 2021 | 0.268 | 0.086 | 0.288 | 0.0154 | 0.235 | 0.069 |
| 2022 | 0.294 | 0.087 | 0.281 | 0.0143 | 0.243 | 0.077 |
| 2023 | 0.235 | 0.098 | 0.280 | 0.0148 | 0.233 | 0.086 |
| Disclaimer/Publisher’s Note: The statements, opinions and data contained in all publications are solely those of the individual author(s) and contributor(s) and not of MDPI and/or the editor(s). MDPI and/or the editor(s) disclaim responsibility for any injury to people or property resulting from any ideas, methods, instructions or products referred to in the content. |
© 2025 by the authors. Licensee MDPI, Basel, Switzerland. This article is an open access article distributed under the terms and conditions of the Creative Commons Attribution (CC BY) license (https://creativecommons.org/licenses/by/4.0/).
