Article

Altitude and Temperature Drive Spatial and Temporal Changes in Vegetation Cover on the Eastern Tibetan Plateau

1
School of Big Data and Artificial Intelligence, Chengdu Technological University, Chengdu 611730, China
2
School of Tourism and Service Management, Chongqing University of Education, Chongqing 400065, China
3
State Key Laboratory of Geohazard Prevention and Geoenvironment Protection, Chengdu University of Technology, Chengdu 610059, China
4
College of Geography and Planning, Chengdu University of Technology, Chengdu 610059, China
5
Henan Polytechnic Institute, Nanyang 473009, China
*
Authors to whom correspondence should be addressed.
Earth 2025, 6(3), 92; https://doi.org/10.3390/earth6030092 (registering DOI)
Submission received: 5 June 2025 / Revised: 12 July 2025 / Accepted: 4 August 2025 / Published: 6 August 2025

Abstract

The Tibetan Plateau (TP) is experiencing higher warming rates than elsewhere, which may affect regional vegetation growth. Particularly on the Eastern Tibetan Plateau (ETP), where the topography is diverse and rich in biodiversity, it is necessary to clarify the drivers of climate and topography on vegetation cover. In this research, we selected the Shaluli Mountains (SLLM) in the ETP as the study area, monitored the spatial and temporal dynamics of the regional vegetation cover using remote sensing methods, and quantified the drivers of vegetation change using Geodetector (GD). The results showed a decreasing trend in annual precipitation (PRE) (−2.4054 mm/year) and the Palmer Drought Severity Index (PDSI) (−0.1813/year) in the SLLM. Annual maximum temperature (TMX) on the spatial and temporal scales showed an overall increasing trend, and the regional climate tended to become warmer and drier. Since 2000, fractional vegetation cover (FVC) has shown a fluctuating upward trend, with an average value of 0.6710, and FVC has spatially shown a pattern of “low in the middle and high in the surroundings”. The areas with non-significant increases (p > 0.05) and significant increases (p < 0.05) in FVC accounted for 46.03% and 5.76% of the SLLM. Altitude (q = 0.3517) and TMX (q = 0.3158) were the main drivers of FVC changes. As altitude and TMX increased, FVC showed a trend of increasing and then decreasing. The results of this study help us to clarify the influence of climate and topography on the vegetation ecosystem of the ETP and provide a scientific basis for regional biodiversity conservation and sustainable development.

1. Introduction

Vegetation is an important element of terrestrial ecosystems, playing a key role in the regulation of climate, maintenance of the global carbon cycle, and water conservation, and is closely related to soil, water, and the atmosphere [1,2,3]. Vegetation not only absorbs carbon dioxide and releases oxygen through photosynthesis but also provides source material and habitat for human and animal survival [4,5]. Vegetation changes directly affect ecosystem stability and sustainability [6]. Clarifying the spatial and temporal change characteristics and growth dynamics of regional vegetation, and understanding the driving mechanisms of vegetation change, will help us to more quickly develop a response strategy to the possible negative impacts of environmental change. Fractional vegetation cover (FVC) can directly reflect the growth dynamics of vegetation and is widely used as an indicator of vegetation change [7,8]. Remote sensing methods have many advantages in monitoring FVC and overcoming the shortcomings of traditional methods, such as high cost, low efficiency, and limited coverage, and have been widely used in the study of vegetation change [9]. Especially in plateau and mountain areas with complex terrain and variable climates, traditional ground monitoring methods can hardly satisfy the needs of large-scale and long-term monitoring, and remote sensing technology provides an efficient and scientific solution for monitoring vegetation dynamics.
There is much evidence that global climate change is accelerating, and the impacts of climate warming and precipitation changes on vegetation ecosystems are becoming more significant [10,11,12]. The Tibetan Plateau (TP) is also known as the “Third Pole of the Earth” and the “Water Tower of Asia”, with fragile ecosystems as one of its important characteristics, and it is a sensitive and indicative area of global climate change, with a warming rate far exceeding the global average [7,13,14]. It has been shown that the temperature of the TP has continued to rise and the precipitation distribution pattern has changed over the past decades, and these climate changes may have impacts on regional vegetation growth [15,16,17,18]. The Eastern Tibetan Plateau (ETP), with its complex topography and rich biodiversity, is one of the regions with the highest vegetation cover on the TP. Therefore, it is important to explore the effects of climate change on vegetation cover in the ETP to understand the evolutionary trends of the plateau ecosystem and its adaptive capacity to future climate change.
Previous research generally agrees that climatic factors (temperature, precipitation) are the dominant elements in determining the distribution and growth of vegetation [19,20]. Temperature can affect plant phenology and photosynthetic efficiency, while precipitation can directly regulate water availability in the soil, which consequently affects biomass accumulation and the growth status of vegetation [1,21,22]. However, in addition to climatic factors, topographic conditions (altitude, slope, aspect) also have important effects on vegetation growth [23,24,25,26]. Altitude not only affects temperature and precipitation distribution but also influences vegetation types and their growth adaptations [27,28]. In addition, the aspect determines the amount of solar radiation received, and the slope affects the flow of soil moisture and nutrients, which regulates the vegetation growth environment indirectly [29,30]. Therefore, a comprehensive study on the drivers of climate and topography on the spatial and temporal patterns of vegetation cover can help reveal the key influencing factors of vegetation change under complex geographic conditions and provide a scientific basis for vegetation conservation and sustainable development.
The Shaluli Mountains (SLLM), located in the ETP, are the core of the Hengduan Mountains, rich in biodiversity, with complex topography and significant vertical changes in climate, making it one of the most representative regions of the TP. However, existing studies on vegetation dynamics and its drivers in the SLLM are still limited, and how climate and topography drive the spatial and temporal patterns of regional vegetation is still unclear. Therefore, in this study, the SLLM was selected as the study area to monitor the spatial and temporal dynamics of regional vegetation cover based on remote sensing methods and to clarify the main drivers of regional vegetation changes to improve the knowledge of ecological changes in the ETP. This study aims to (1) reveal the changing pattern of vegetation cover in the SLLM in recent decades; (2) analyze the characteristics of climatic spatial and temporal changes in study area; and (3) quantitatively assess the contributions and driving patterns of climatic and topographic factors to the changes in regional vegetation cover. This study can enhance the understanding of the response of ETP vegetation ecosystems to climate change and provide scientific support for regional biodiversity conservation and vegetation restoration management.

2. Materials and Methods

2.1. Study Area

The SLLM is located in the ETP, the hinterland of the Hengduan Mountains, with a total area of 102,018.70 km2, latitude: 98.2082° E~101.5061° E, longitude: 27.6738° N~32.3534° N, and an average elevation of 4215 m (Figure 1). The landscape type of the SLLM is dominated by plateau and canyon; the plateau is mainly in the central and northern part, and the canyon is mainly in the margin of the SLLM, which is created by the cutting of the Jinsha River, Yalong River, and their branches. The study area has a large altitude range, high biodiversity, rich vegetation types, and obvious vertical zoning characteristics. As the elevation rises, the vegetation types are arid valley shrub, subtropical coniferous forest (or deciduous broadleaved forest and mixed coniferous and broadleaved forest), subalpine coniferous forest (or leafy broadleaved forest), alpine shrub (or meadows), and alpine sparse vegetation [31].

2.2. FVC Calculation

The FVC can reflect the vegetation growth status directly and is one of the common indicators revealing the response of vegetation to climate change [7]. Using satellite remote sensing data, FVC can be rapidly estimated at the regional scale and can also achieve the purpose of long time-series dynamic monitoring. Among the many approaches to estimating FVC by remote sensing methods, the path of combining NDVI data and image element dichotomous modeling is the most commonly applied [9]. In this study, NDVI data were used from the MOD13Q1 dataset (https://developers.google.com/earth-engine/datasets/catalog/MODIS_061_MOD13Q1, accessed on 2 November 2024) in the Google Earth Engine (GEE, https://developers.google.com/earth-engine/, accessed on 2 November 2024), with a spatial resolution of 250 m and a temporal resolution of 16 days. The maximum-value composite method [32] was used to obtain year-by-year NDVI data (2000–2023) based on MOD13Q1. The FVC was calculated by the following formula [33]:
FVC = NDVI NDVI S NDVI V NDVI S ,
where NDVI is the value of the pixel; NDVIS is the NDVI value of the bare ground pixel, which is taken as 5% of the cumulative frequency of the histogram; and NDVIV is the NDVI value of the vegetation pixel, which is taken as 95% of the cumulative frequency of the histogram. The range of the FVC value is from 0 to 1, and the value of the pixel NDVI is greater than the NDVIV taken as 1 and less than the NDVIS taken as 0.

2.3. Environmental Factors

To assess the influence of environmental variables on vegetation changes in the SLLM, this study comprehensively considered climatic and topographic factors, all obtained from the GEE. The climatic factors were obtained from the “TerraClimate” dataset (https://developers.google.com/earth-engine/datasets/catalog/IDAHO_EPSCOR_TERRACLIMATE, accessed on 7 November 2024), which includes the Palmer Drought Severity Index (PDSI), annual precipitation (PRE), annual maximum temperature (TMX), and soil moisture (Soil_W). The “TerraClimate” dataset provides high spatial resolution (4638.3 m), monthly climate, and climate water balance data and is widely used in studies of climate and ecological change [34,35,36]. When the value of the PDSI is less than −0.5, this indicates drought; −0.5~+0.5 indicates normal and greater than +0.5 indicates wet [37]. The topographic factors include altitude, slope, and aspect was obtained from the “SRTM V3” dataset (https://developers.google.com/earth-engine/datasets/catalog/USGS_SRTMGL1_003, accessed on 7 November 2024), with a spatial resolution of 30 m. The SRTM data is global in coverage, its accuracy has been analyzed globally, and it is a suitable choice for characterizing topographic factors [38,39].
To conduct the analysis using the Geodetector, we used ArcGIS 10.7 to stratify the continuous environmental factors. The altitude was divided into medium altitude (<2500 m), medium-high altitude (2500–3500 m), high altitude (3500–4500 m), and extremely-high altitude (>4500 m). The aspect was divided into north slope (315–360°, 0–45°), east slope (45–135°), south slope (135–225°), and west slope (225–315°). Other factors were stratified using the “Natural Interval Method” tool, where slope was divided into six categories, and the remaining environmental factors were divided into eight categories.

2.4. Data Analysis

2.4.1. Trend Analysis

SLOPE analysis can accurately reflect the spatial and temporal patterns of variable changes by identifying trends in individual image elements [40]. In this study, SLOPE analysis was used to analyze the trends of climate factors and FVC in the SLLM since 2000. The calculation methods are as follows [2,41]:
S L O P E = n × i = 1 n i × X i i = 1 n i i = 1 n X i n × i = 1 n i 2 i = 1 n i 2 ,
where SLOPE is the trend of X, n is the length of the time series, i is the time series from 2000–2023, and Xi is the value of X at year i. SLOPE > 0 indicates an increasing trend in X, and SLOPE < 0 indicates a decreasing trend.

2.4.2. Factor Analysis

In this study, the driving power of factors was analyzed using Geodetector (GD, http://www.geodetector.cn/, accessed on 25 November 2024). GD adopts a series of spatial statistical methods, which allow for exploring the explanatory variables affecting the dependent variable through spatial analysis of variance [42,43]. It consists of four modules, Factor Detector, Interaction Detector, Ecological Detector, and Risk Detector [9]. We used the Factor Detector module, which is implemented in QGIS based on the “Geographical detector” plug-in (https://plugins.qgis.org/plugins/geographical-detector/, accessed on 25 November 2024).
The Factor Detector uses a q-value to measure the ability of the factor to explain the changes in FVC. The q-value ranges from 0 to 1, and a q-value closer to 1 indicates that the factor’s explanatory power is stronger [11]. The principle can be expressed by the following formula [8]:
q = 1 h = 1 L N h σ h 2 N σ 2 ,
where q is the ability of the factor to explain the change of FVC, N is the sample size, Nh is the sample size of the factor in the h-zone, σ2 is the variance of FVC, and σh2 is the variance of the factor in the h-zone.

2.4.3. Correlation Analysis

Correlation analysis can reveal the degree of relationship between variables. The correlation coefficient r > 0 means positive correlation, r < 0 means negative correlation, and the larger |r| means the greater the relationship between the two variables [1]. The calculation formula is
r = i = 1 n ( a i a ¯ ) ( b i b ¯ ) i = 1 n ( a i a ¯ ) 2 ( b i b ¯ ) 2 ,
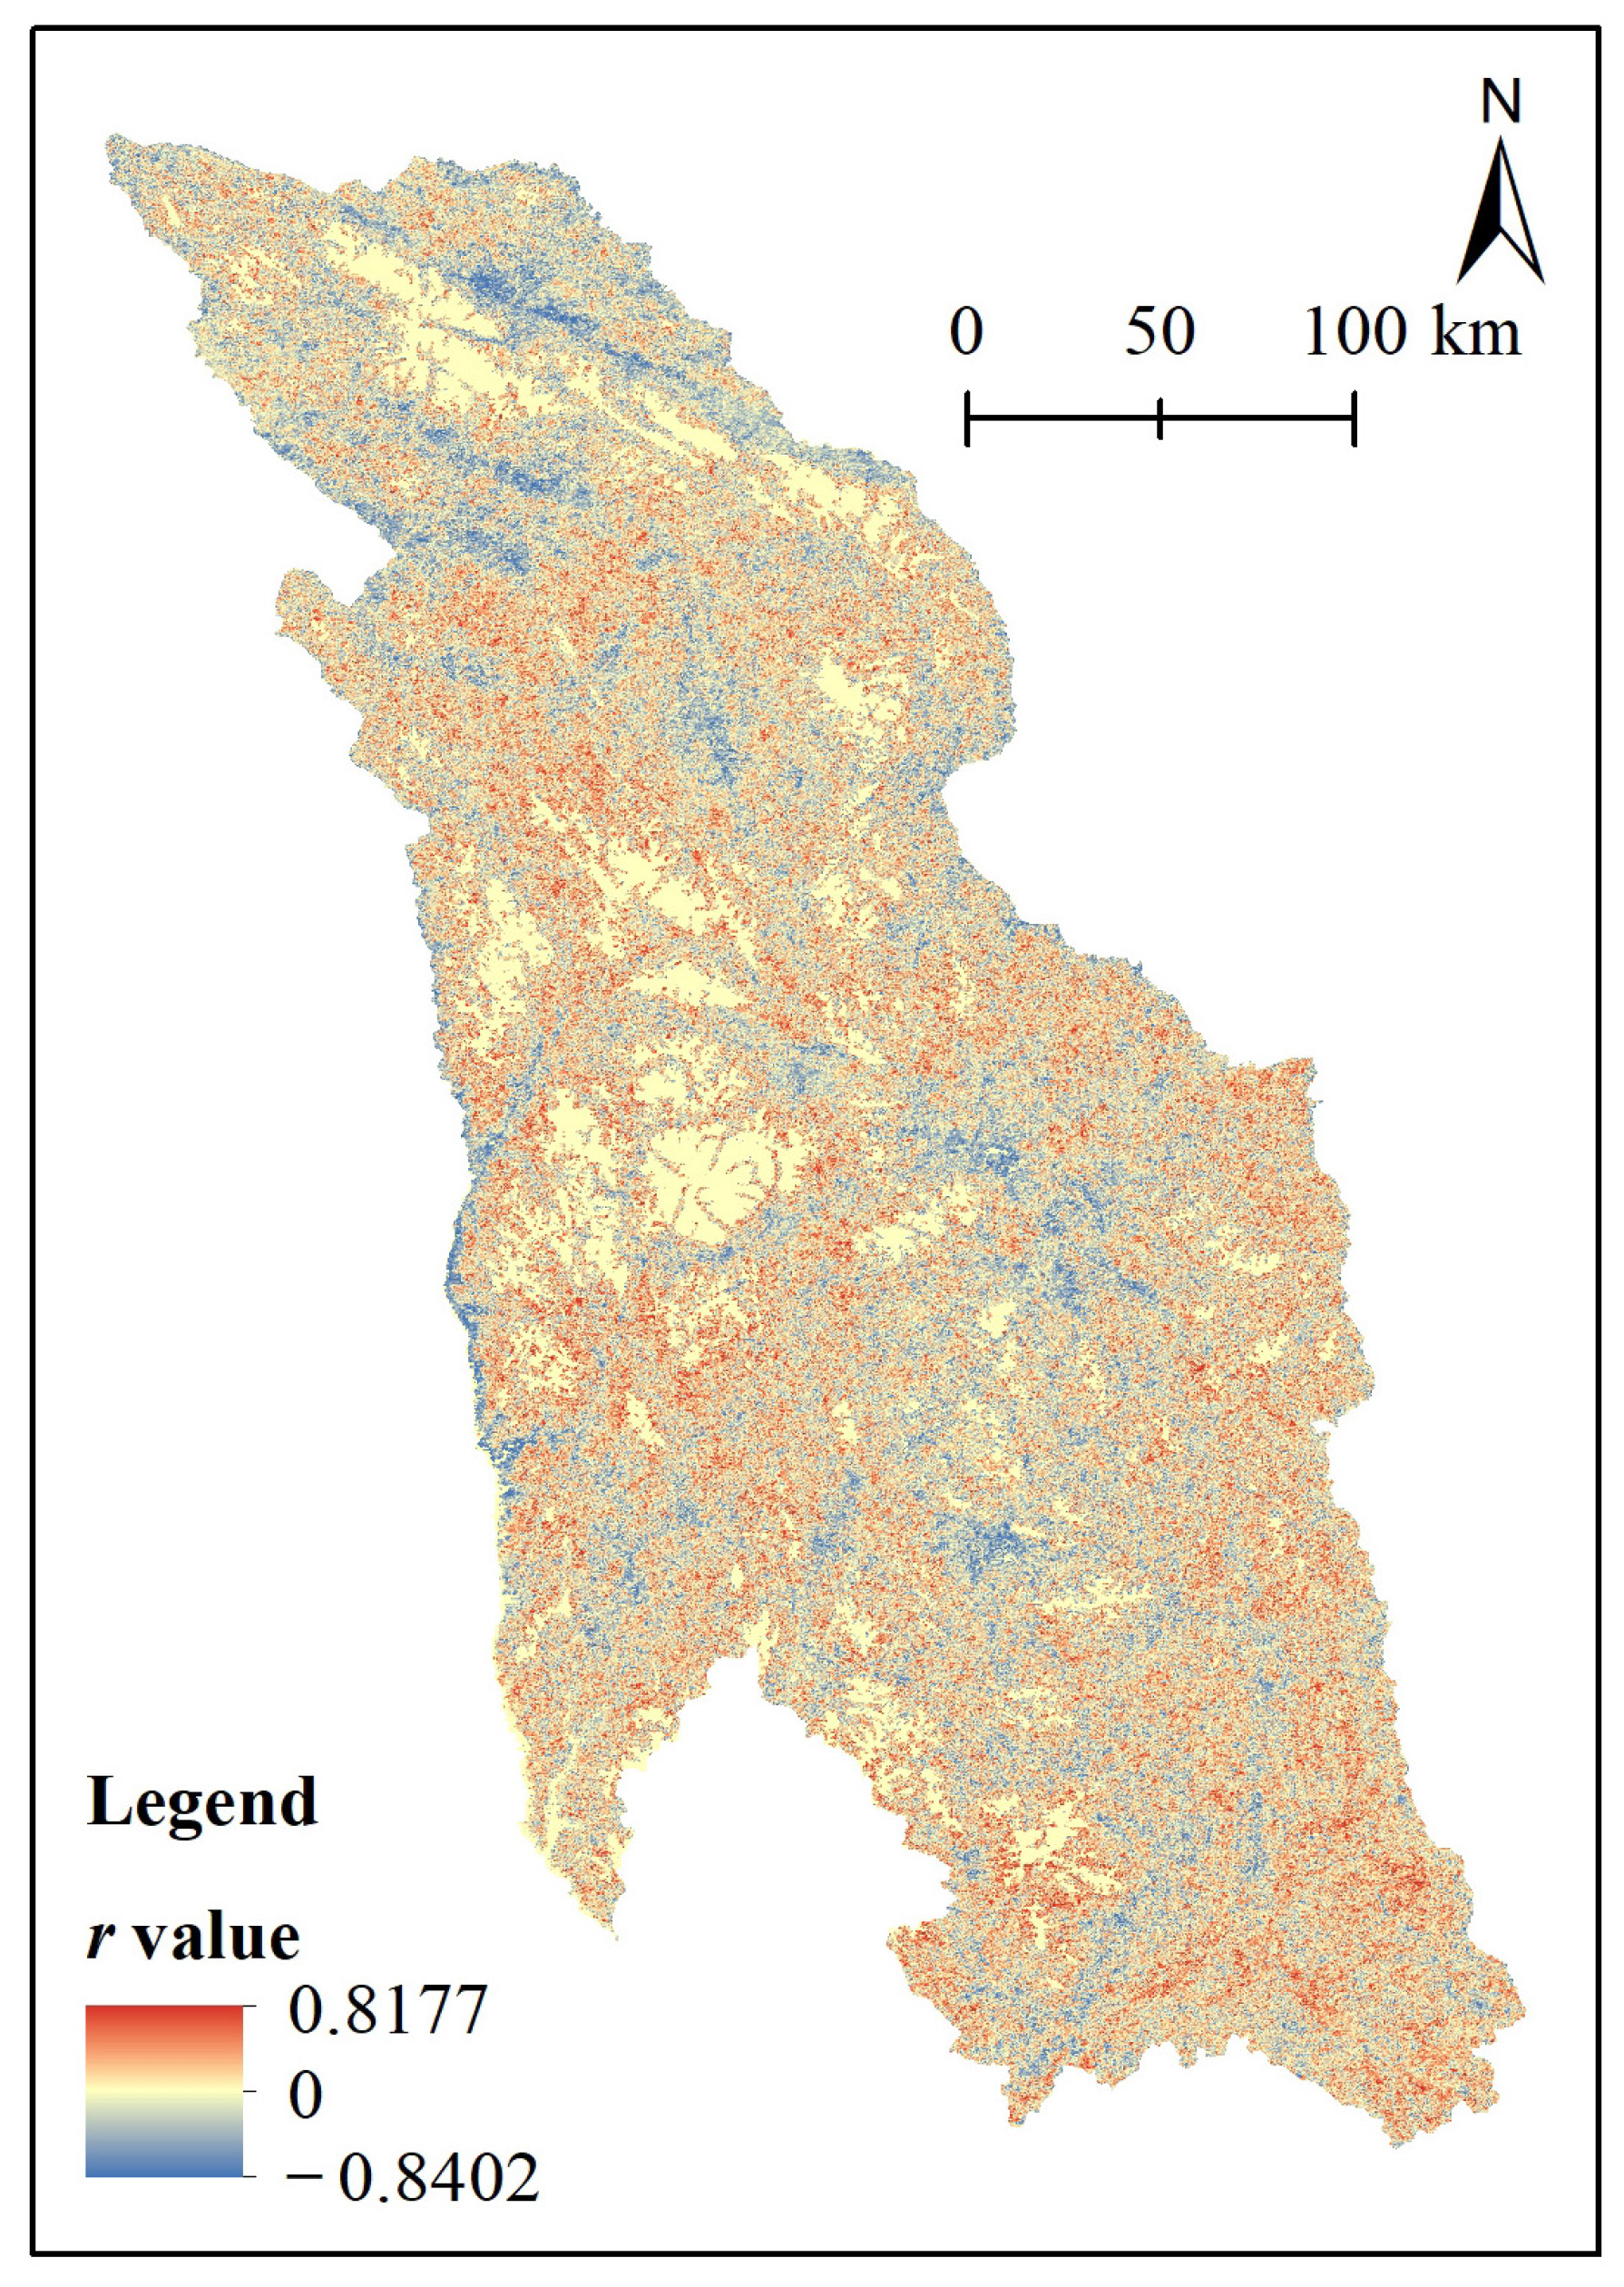
where r is the correlation coefficient between the two elements, n is the number of detection years, a is the FVC, b is the TMX, and a ¯ and b ¯ are the average values of the FVC and TMX. In this study, the correlation analysis used the “Corrcoef” function in MATLAB R2016b to analyze the correlation between FVC with TMX on a pixel-by-pixel basis.

3. Results

3.1. Characteristics of FVC Change

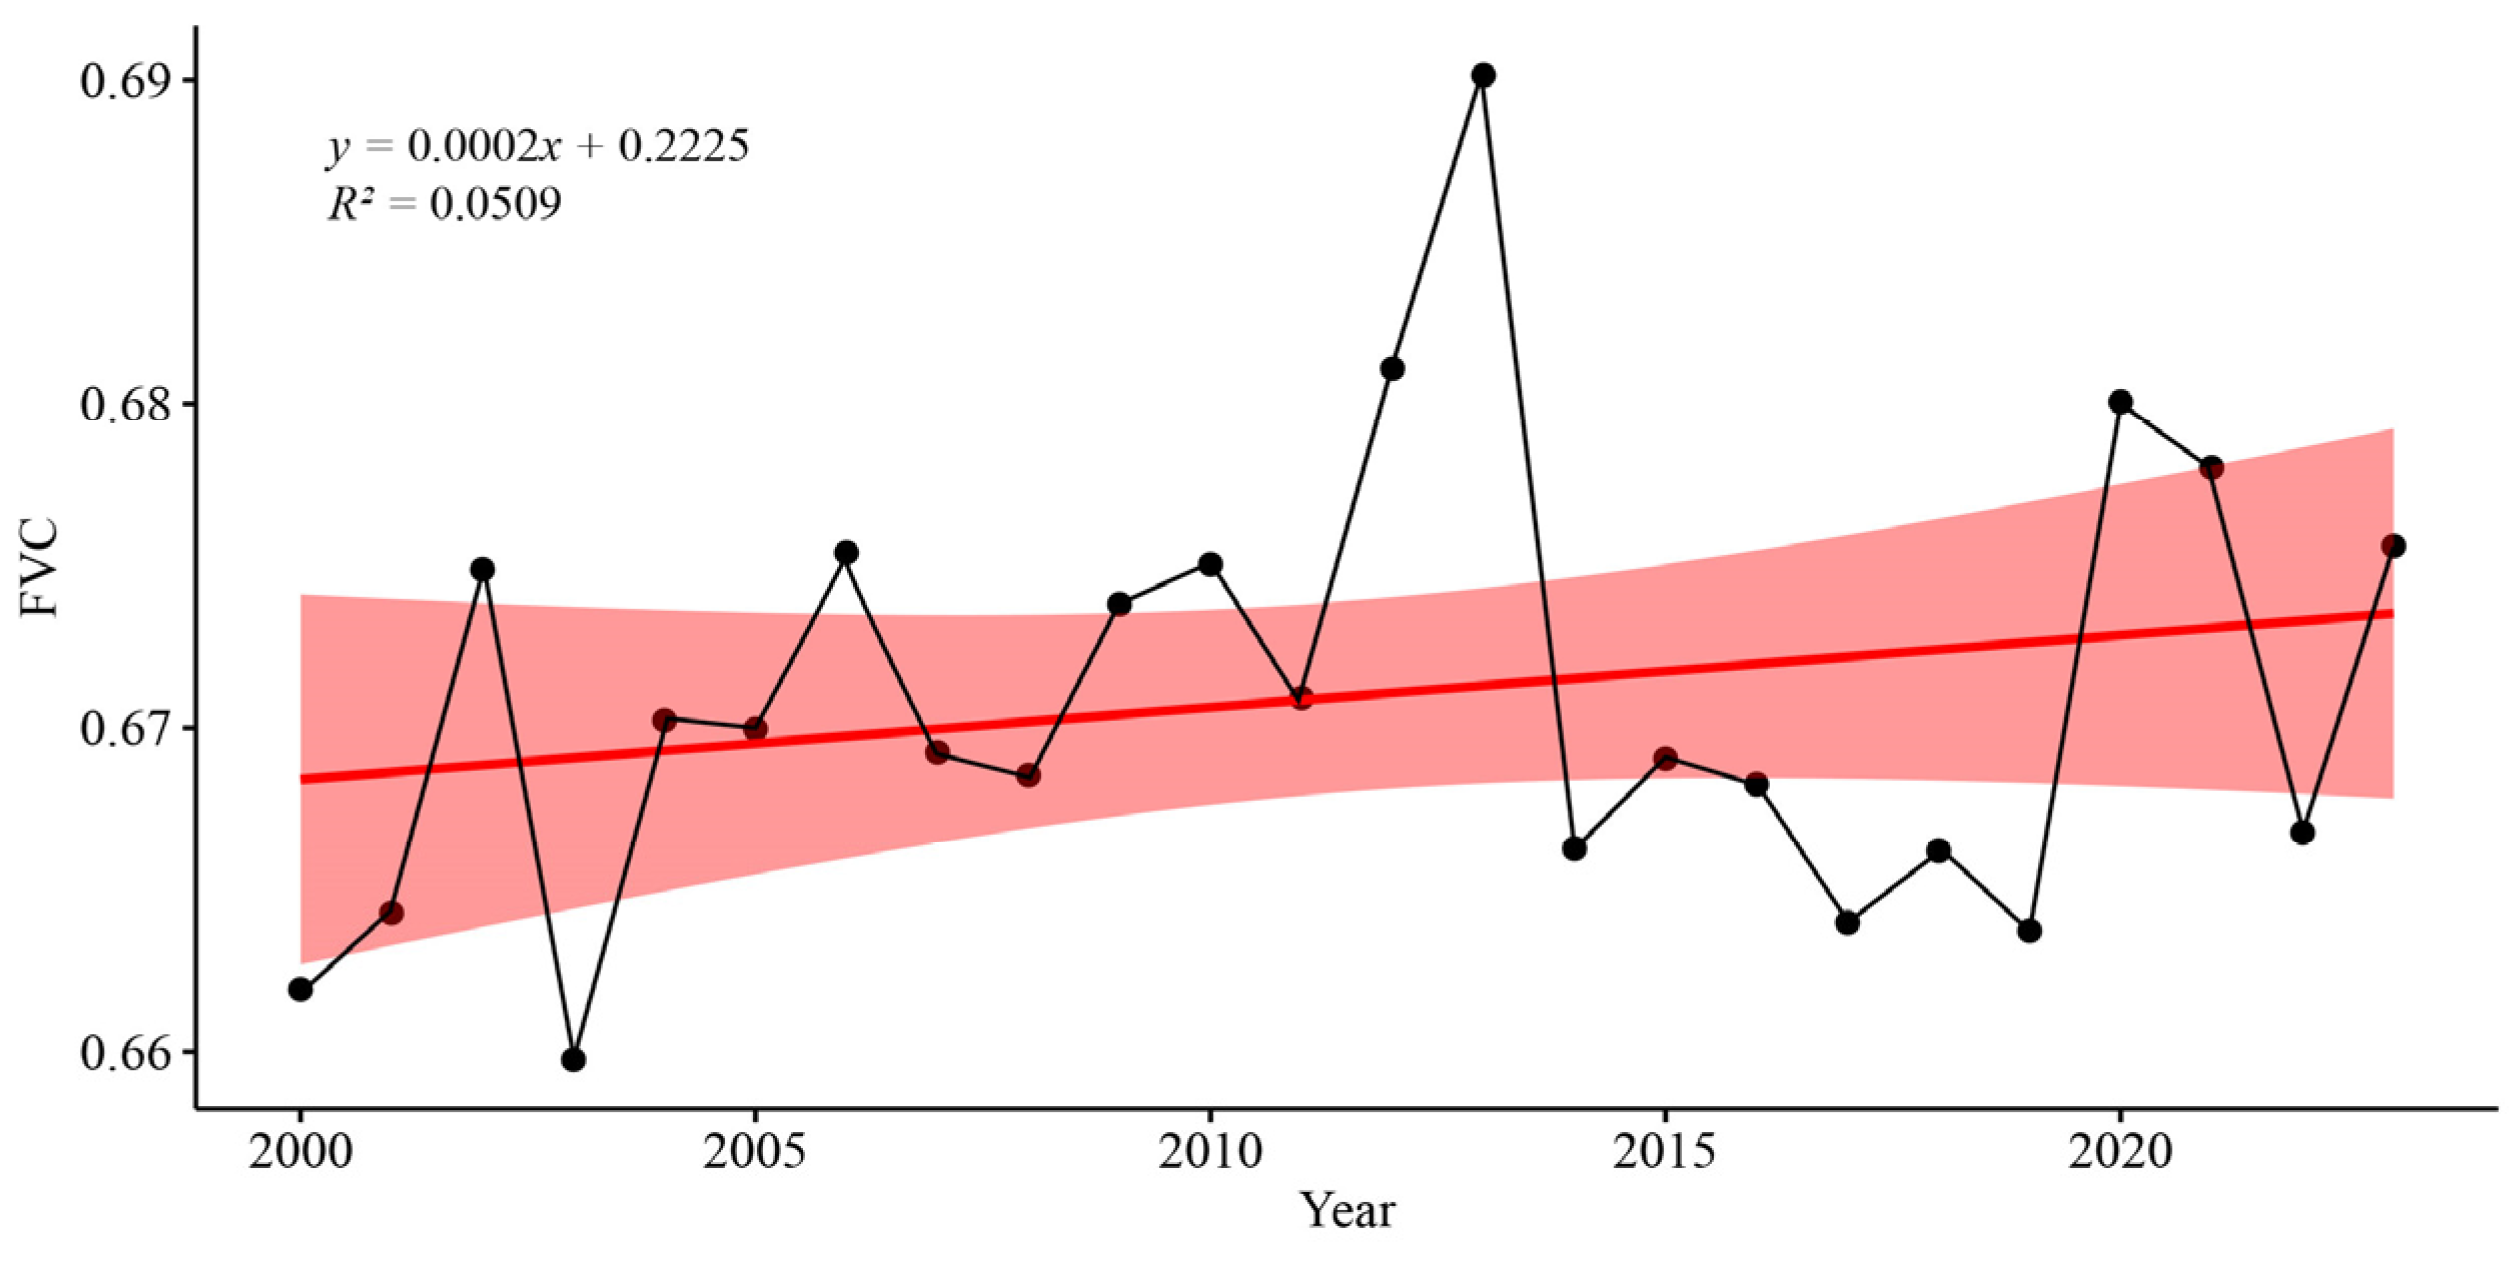
From the variation characteristics of the annual average FVC, it can be seen that from 2000 to 2023, the annual average FVC of the SLLM ranges from 0.6597 to 0.6902, with a mean value of 0.6710. The highest year of the annual average FVC is in 2013 (0.6902) and the lowest is in 2003 (0.6598). There is a fluctuating upward trend in the regional annual average FVC (Slope = 0.0002, R2 = 0.0509) (Figure 2).
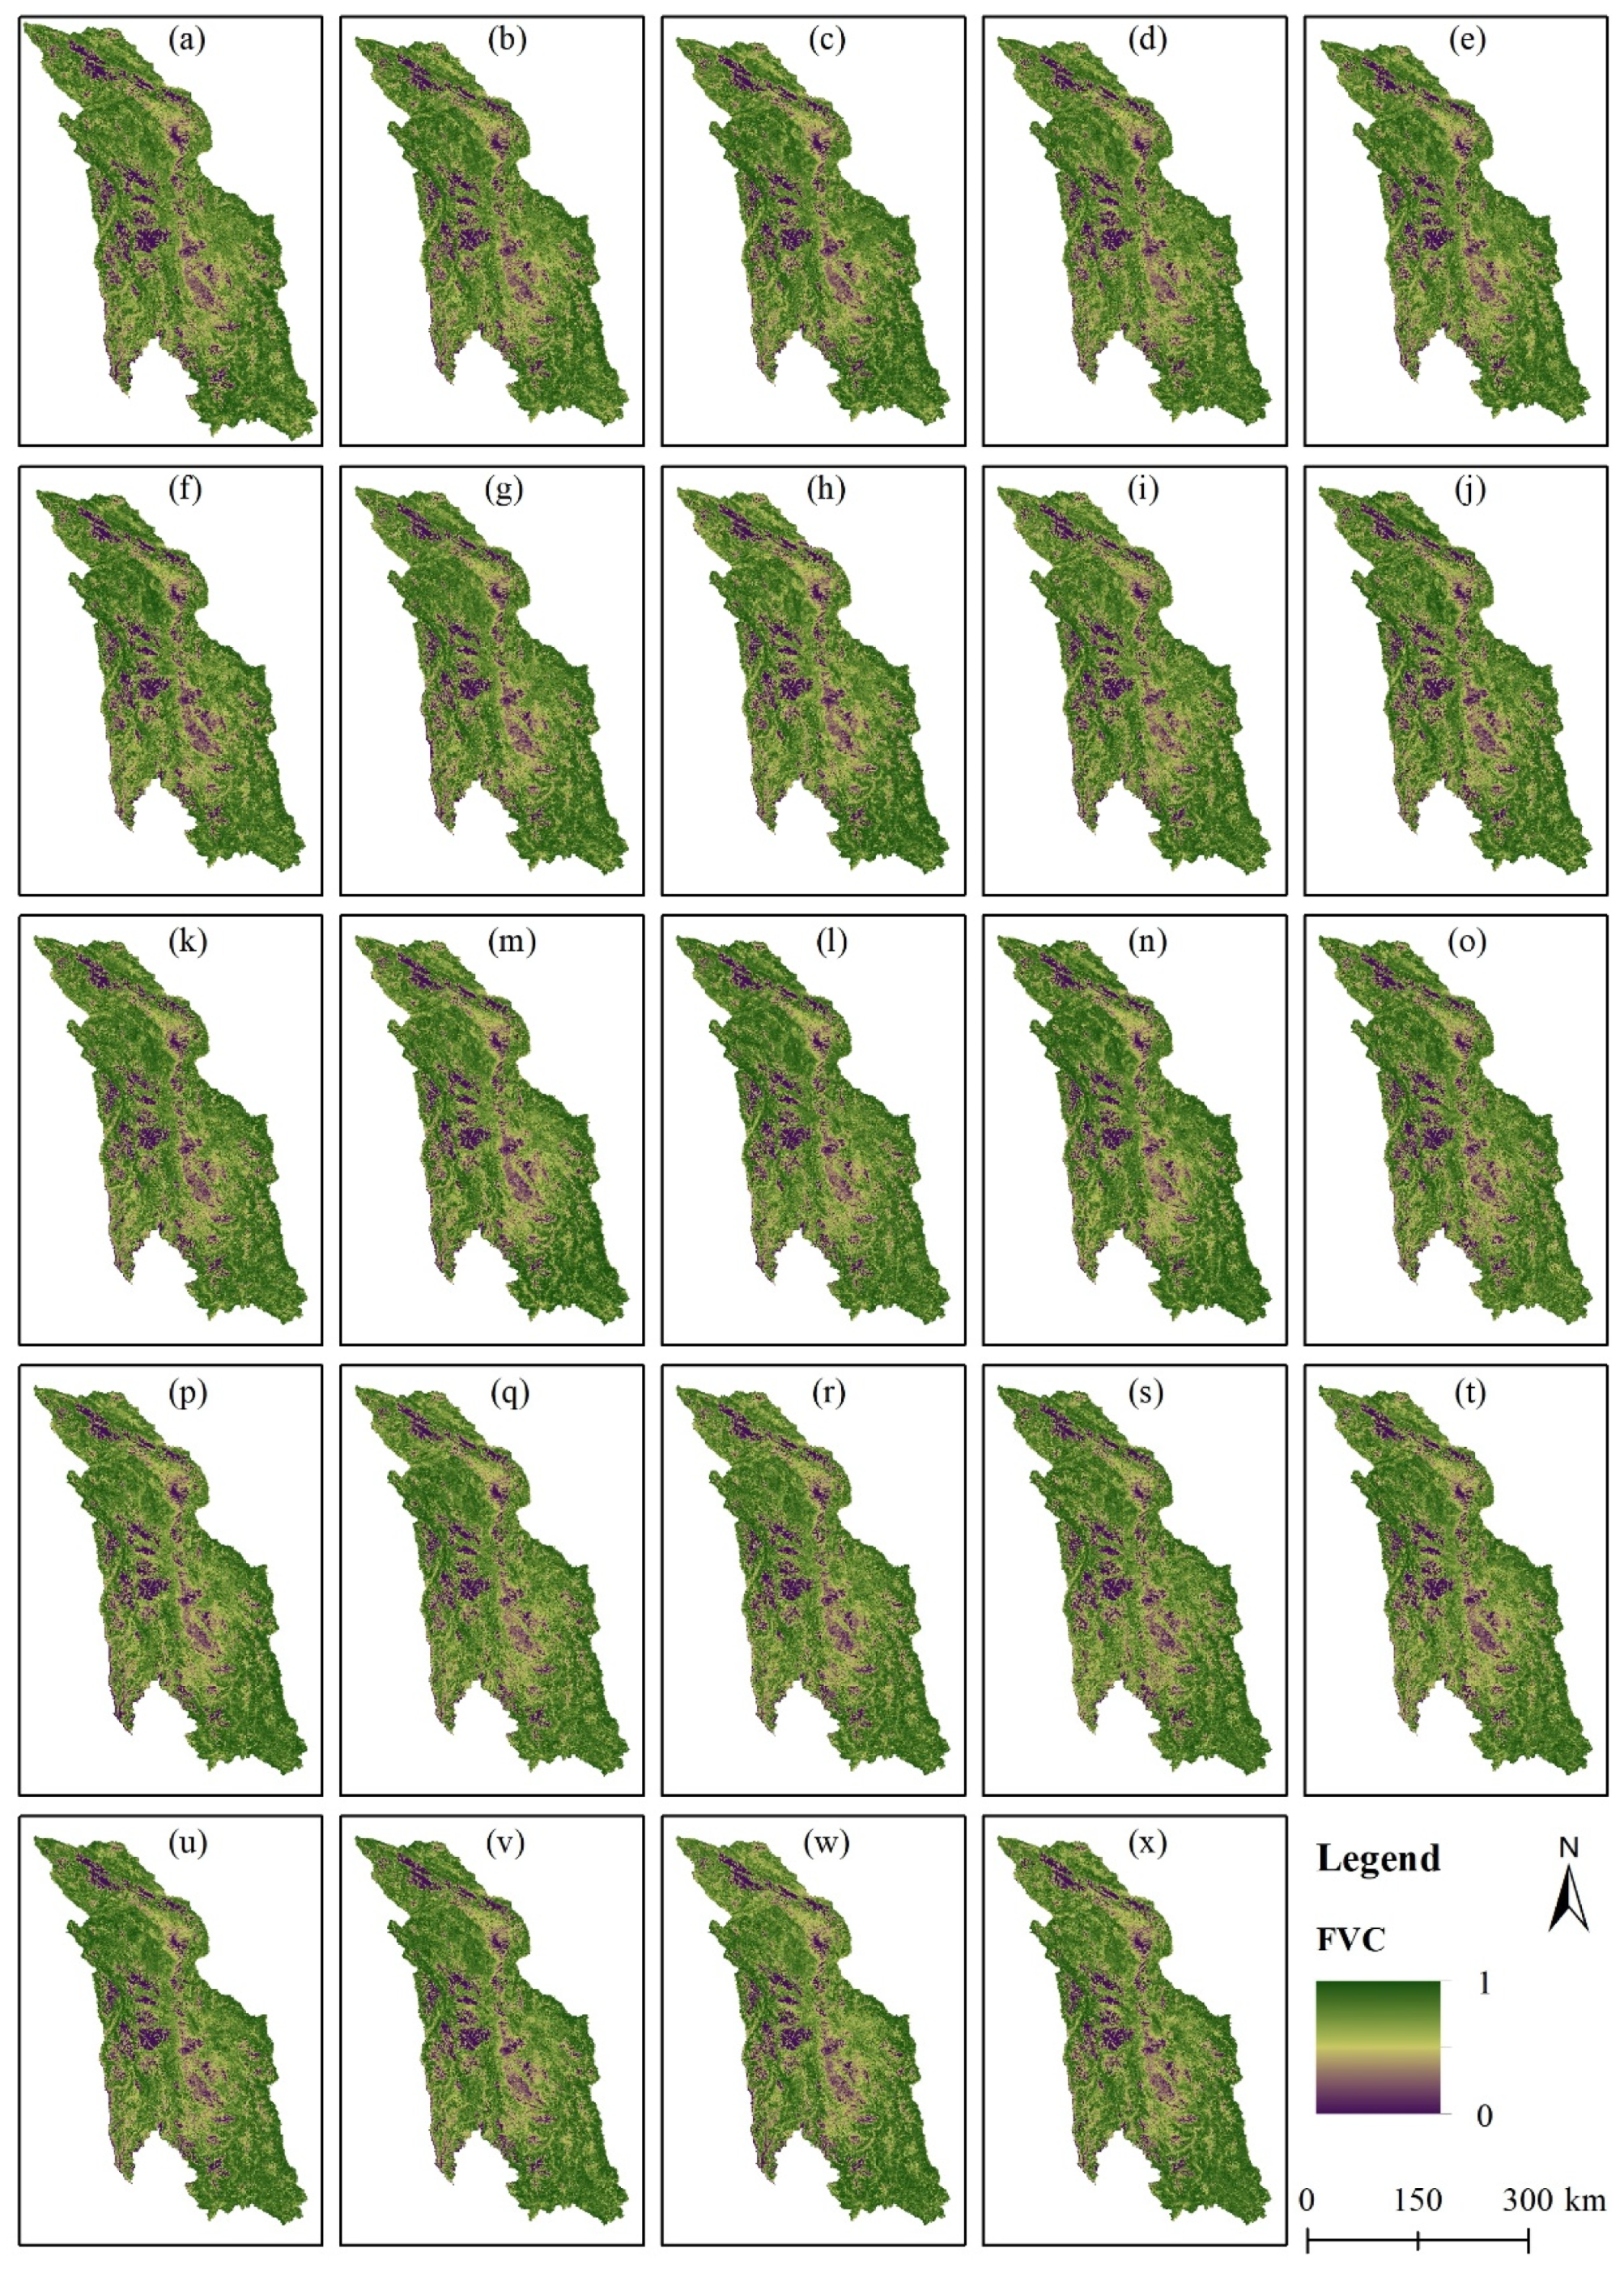
In terms of spatial pattern, in the center of the SLLM is a plateau or alpine landscape with higher elevation and lower FVC, and the margins of the study area are the valleys of the Jinsha and Yalong rivers and their branches, which have higher FVC (Figure 3 and Figure 4). According to the level of FVC, the FVC can be classified into Lower (0.0–0.2), Low (0.2–0.4), Medium (0.4–0.6), High (0.6–0.8), and Higher (0.8–1.0) (Table 1). The FVC classes in the SLLM are dominated by Higher and High, with Lower and Low in fewer areas (Figure 4b). The area with the FVC class Higher was the most widely distributed, with an area of 38,347.5 km2 (37.96%), followed by High (34,851.52 km2, 34.85%), Medium (13,197.52 km2, 13.06%), Lower (7905.04 km2, 7.83%), and Low (6717.13 km2, 6.65%). The Lower class was mainly located in the very high region in the northern and east-central part of the study area, while the Low, Medium, and High classes were mainly located in the central plateau region, and the Higher class was mainly located in the valley region at the margin of the study area.
According to the trend of FVC change (SLOPE) calculated pixel-by-pixel, the SLOPE values of FVC in the SLLM ranged from −0.0538~+0.0312/year from 2000 to 2023, with a mean value of +0.0002/year, indicating that FVC was dominated by the increase (Figure 5a). Combined with the SLOPE value and the significance test (p) results, the FVC change trends can be categorized into Significant decrease, Non-significant decrease, Stabilize, Non-significant increase, and Significant increase (Table 2). Among them, the FVC change trend was Non-significant increase with the most area of 46,956.92 km2, which accounted for 46.03% of the study area, followed by Non-significant decrease (43,532.10 km2, 42.67%), Significant increase (5867.14 km2, 5.76%), Significant decrease (4427.52 km2, 4.33%) and Stabilize (1235.01 km2, 1.21%). The areas where FVC is Significant decrease are concentrated in the southern part of the SLLM, and the distribution of Significant decrease is relatively decentralized but more central (Figure 5b).

3.2. Characteristics of Climate Change

In this study, we calculated PRE, PDSI, and TMX year by year from 2000 to 2023 and analyzed their temporal and spatial change characteristics. In terms of temporal changes, PRE and PDSI had a decreasing trend from 2000 to 2023, indicating a tendency of increasing drought in the SLLM (Figure 6a,b). PRE showed a fluctuating decreasing trend (R2 = 0.0932) with a slope of −2.4054 mm/year; PER had the highest (756.40 mm) value in 2003 and the lowest (539.85 mm) in 2011 (Figure 6a). The decreasing trend of PDSI was obvious (R2 = −0.3544), with a slope of −0.1813/year; the value of PDSI was lowest (−3.40) in 2024 and highest (+4.73) in 2000. Drought conditions before 2005 were wet (PDSI > 0.5), and drought (PDSI < −0.5) intensified after 2005 (Figure 6b). TMX tended to increase but fluctuated (R2 = 0.0908), with a slope of +0.0296 °C/year, with the highest (17.39 °C) value of TMX in 2016 and lowest (14.72 °C) in 2004 (Figure 6c). This suggests that the probability of extreme droughts and temperatures may increase in the SLLM and that climate change may alter regional vegetation cover patterns.
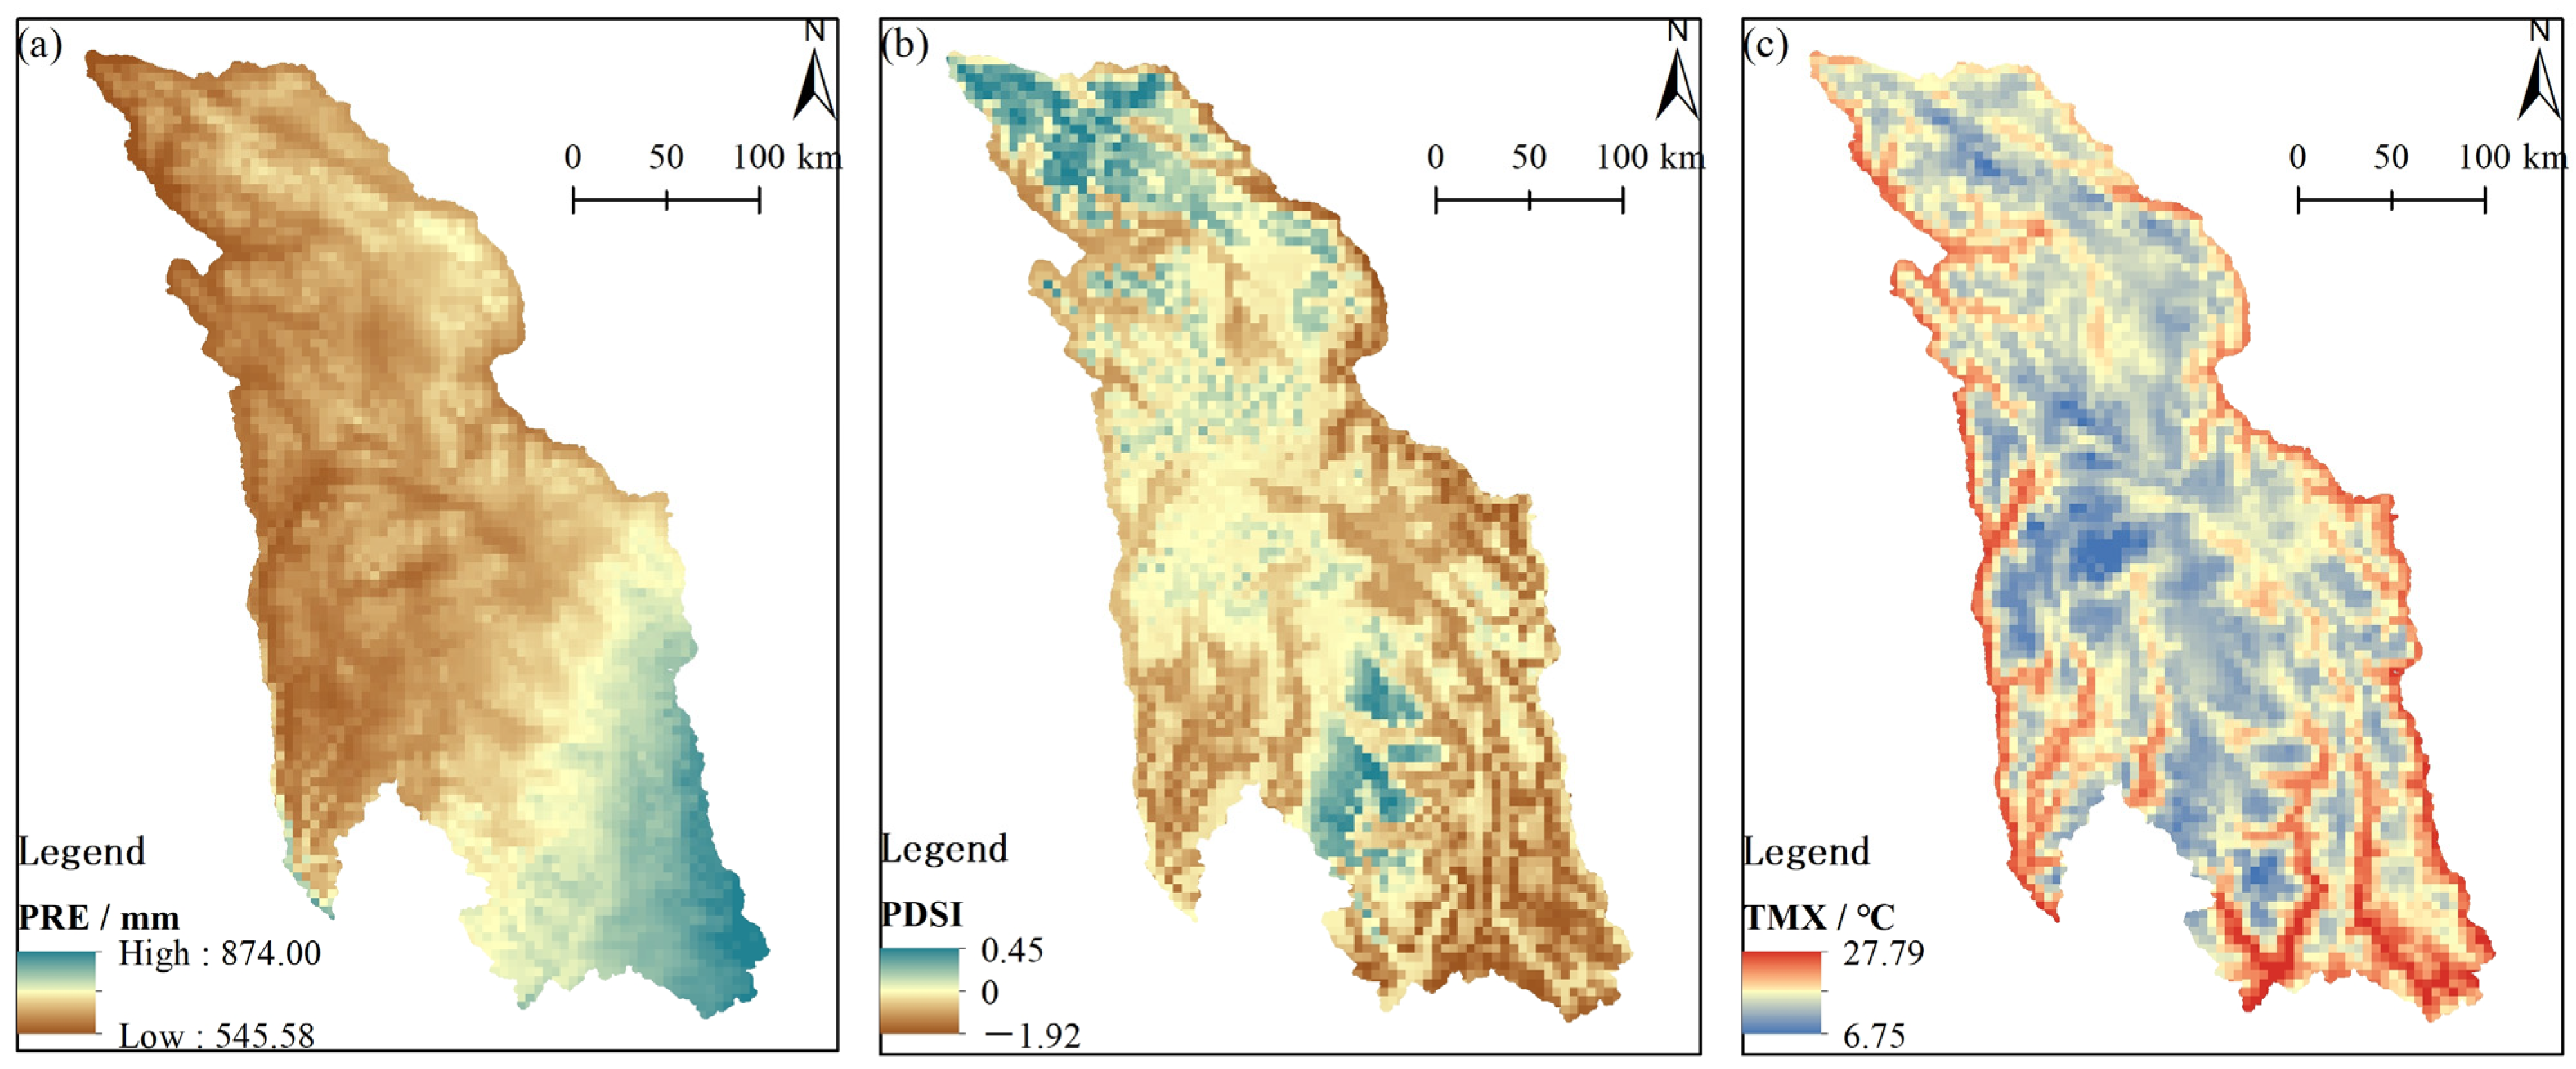
In terms of spatial pattern, PRE of the SLLM showed an increasing trend from northwest to southeast, with the lowest PRE of 545.58 mm and the highest of 874.00 mm. The high-value area of PRE was concentrated in the southeast, and PRE was relatively low in the northwest (Figure 7a). The values of PDSI in the study area ranged from −1.92 to +0.45, indicating that the regional drought condition was dominated by drought, with only parts of the northern and central-southern regions being normal (Figure 7b). The TMX ranged from +6.75 to +27.79 °C, with low values in the central and northern plateau and high values distributed in bands along the river valleys, with the highest values in the south (Shuiluo River valley) and the lowest in the central part (Genie Mountain, altitude 6154 m) (Figure 7c).
Based on the SLOPE analysis, the changing patterns of the SLLM climate factors from 2000 to 2023 were analyzed on a pixel-by-pixel basis (Figure 8). It was found that the areas with positive SLOPE values for PRE and PDSI were mainly located in the northern part of the SLLM; PRE and PDSI had an increasing trend, a tendency to become wetter in the north, and a tendency to become drier in the south (Figure 8a,b). The SLOPE values of TMX in the study area were all greater than 0, with an increasing trend in TMX and more obvious warming in the south and east (Figure 8c). In general, most of the SLLM has decreasing PRE, increasing aridity, obvious warming, and a warm-drying trend in the region.

3.3. Drivers of FVC Change

3.3.1. Factor Explanatory Power

In this study, we analyzed the explanatory power of the drivers for FVC change using the “Risk Detection” module of GD and quantified them using q-value (Figure 9). It was found that altitude is the most important factor driving FVC changes, with an average q-value of 0.3517 for 2000–2023, followed by TMX (0.3158), Soil_W (0.0859), PDSI (0.0786), PRE (0.0699), Slope (0.0128), and Aspect (0.0034). The q-values of altitude and TMX were consistently higher than 0.3 over the past 24 years, suggesting that they are the main driving factors for the FVC changes in the SLLM.

3.3.2. Impact of Altitude on FVC Change

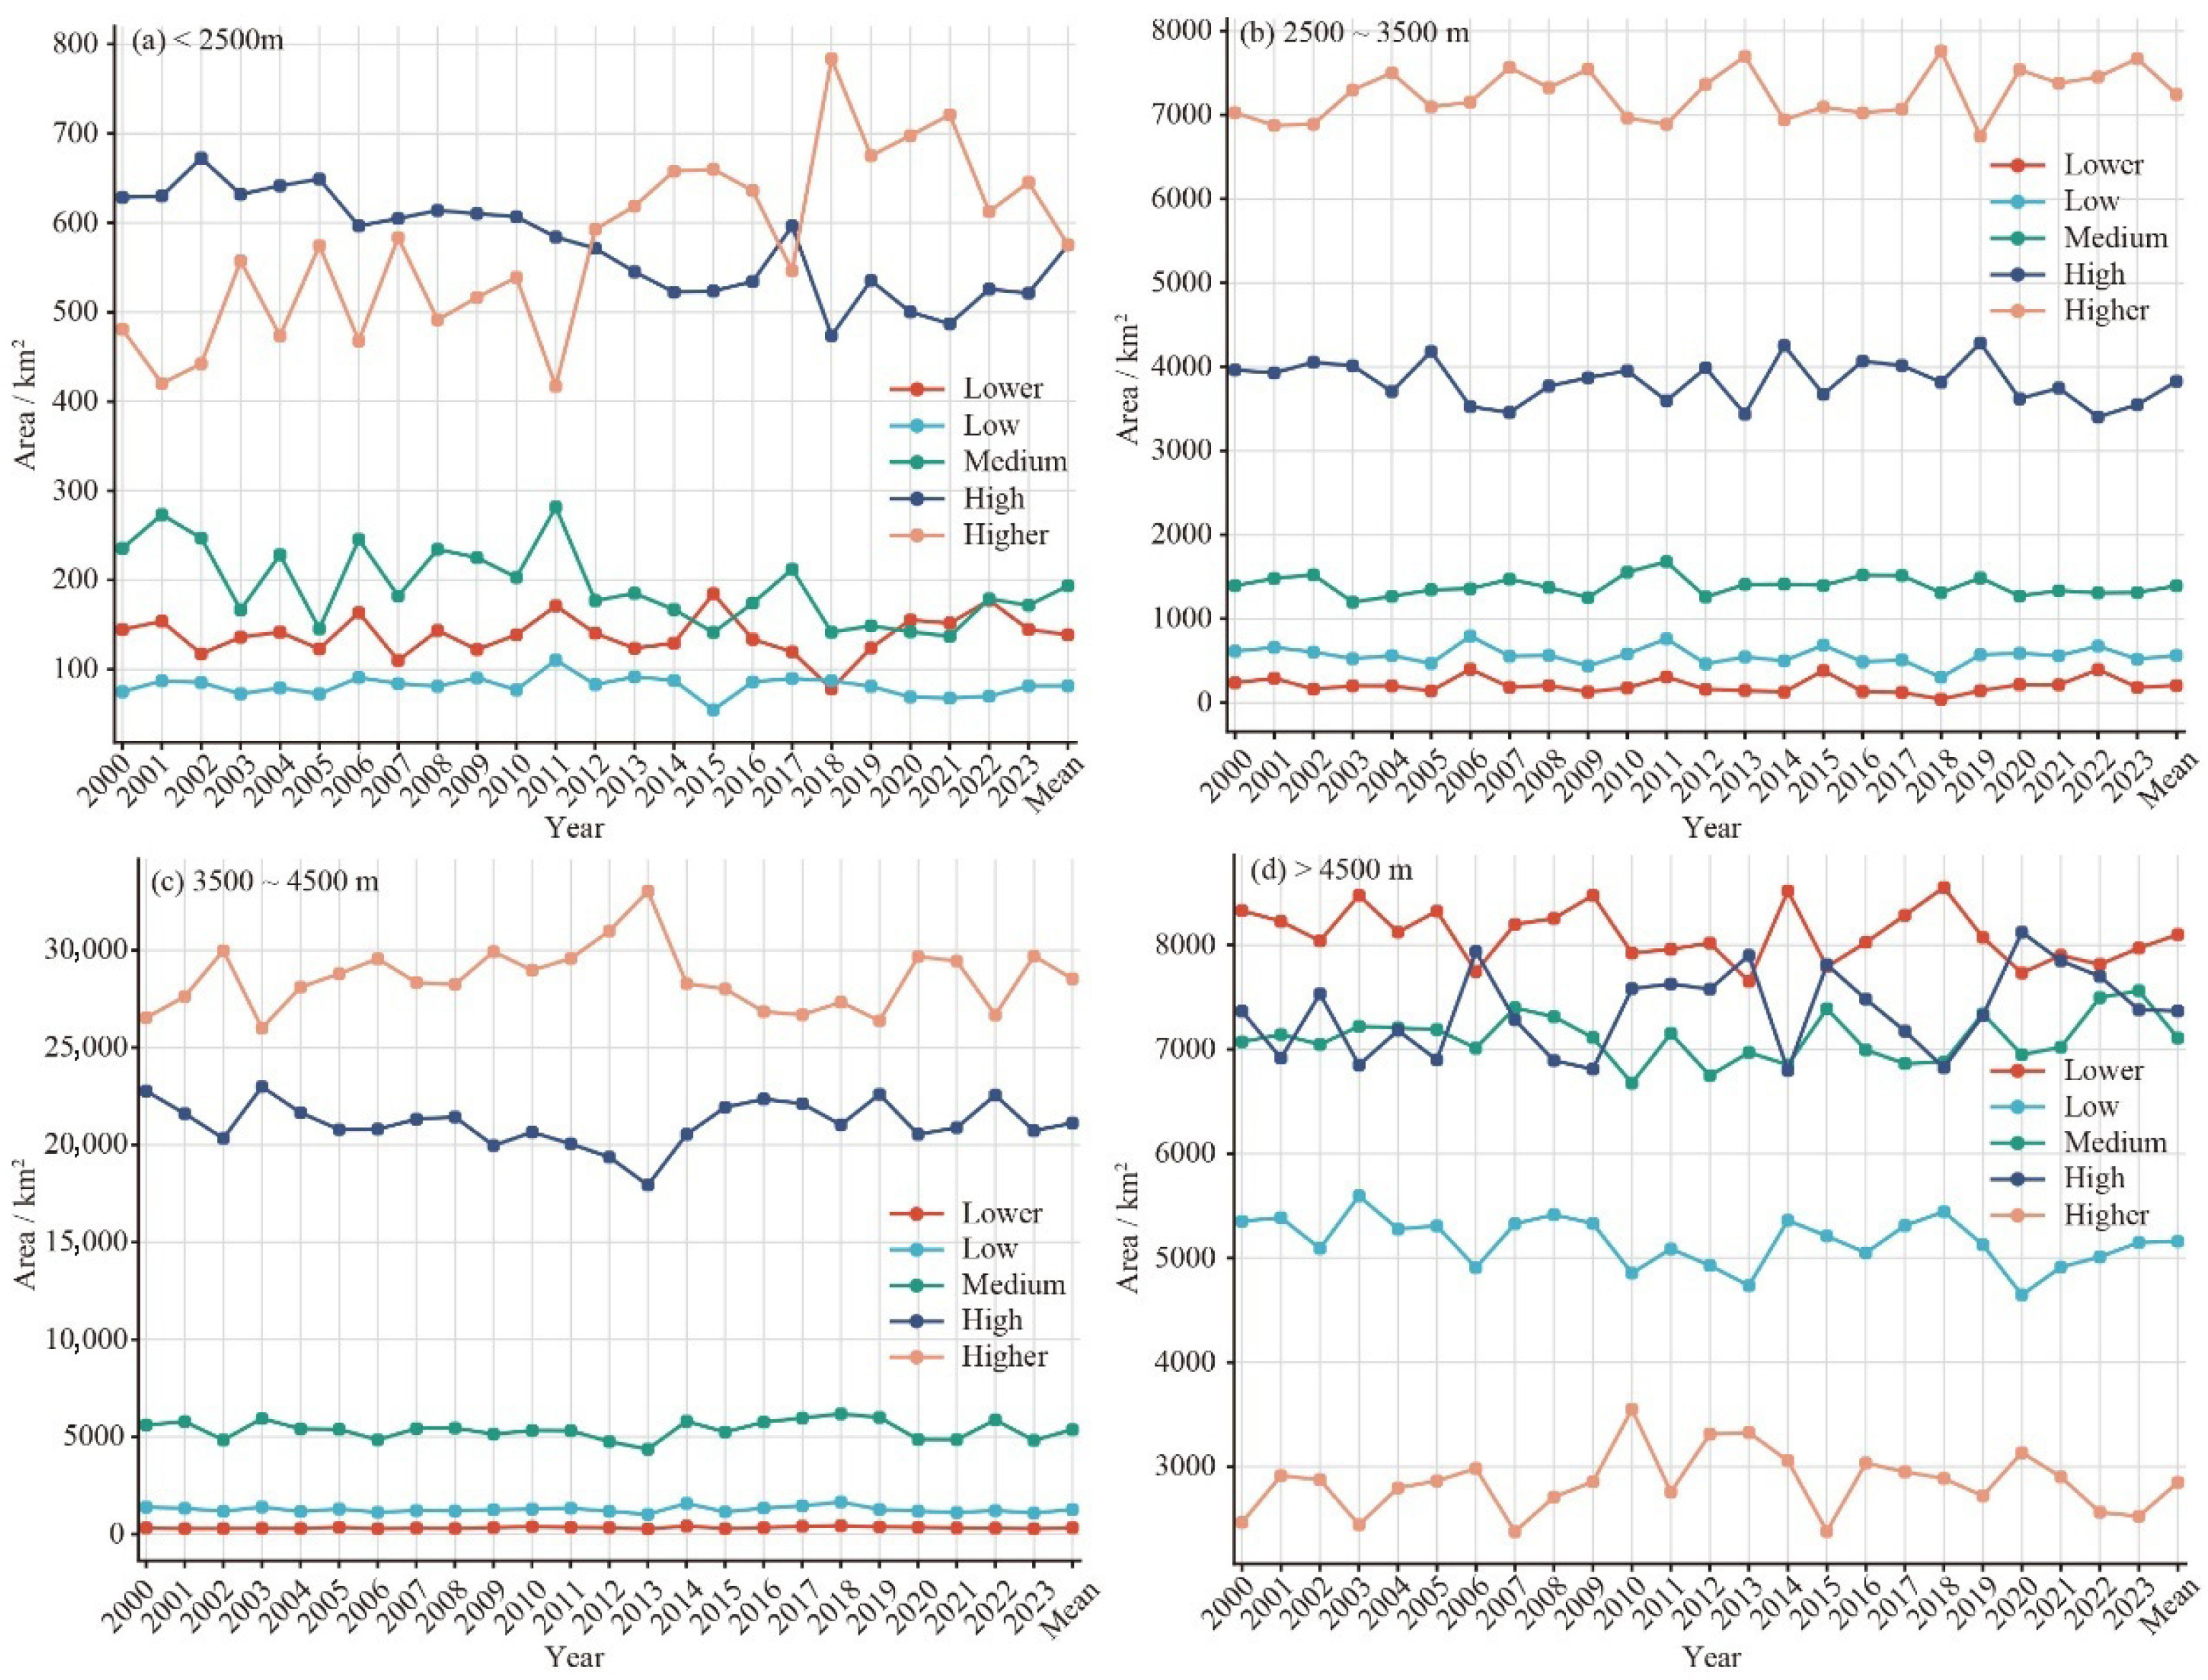
In ArcGIS 10.7, the study area was categorized into four classes based on altitude: medium altitude (<2500 m), medium-high altitude (2500~3500 m), high altitude (3500~4500 m), and extremely-high altitude (>4500 m), and the tool of “Zonal Statistics as Table” was used to count the mean FVC of different altitude zones. It was found that FVC tended to increase and then decrease with increasing altitude, and the highest FVC was found in the high altitude zone, with a mean value of 0.7785, followed by medium-high altitude (0.7687), medium altitude (0.6682), and extremely-high altitude (0.4289) (Figure 10). The FVC categories were dominated by High and Higher in the medium-altitude, medium-high-altitude, and high-altitude zones. In the medium-altitude zone, the area with the FVC class High was consistently larger than Higher until 2012, and after 2012, Higher exceeded High. In the last 24 years, the areas with FVC classes High and Higher were 575.28 km2 and 575.45 km2 (Figure 11a). This indicates that there is a trend of improvement in the vegetation cover in the medium-altitude zone from 2000 to 2023. In the medium-high-altitude and high-altitude zones, the areas with the FVC class Higher were the largest, with mean values of 7244.70 km2 and 28,531.62 km2, followed by the FVC class High, with mean values of 3828.05 km2 and 21,125.94 km2, with a fluctuating trend in the area of each FVC category (Figure 11b,c). In the extremely-high-altitude zone, the area with the FVC class Lower was the largest, with a mean value of 8100.84 km2 over the past 24 years, and the most fluctuating changes in the area out of all FVC classes (Figure 11d).

3.3.3. Impact of Temperature on FVC Change

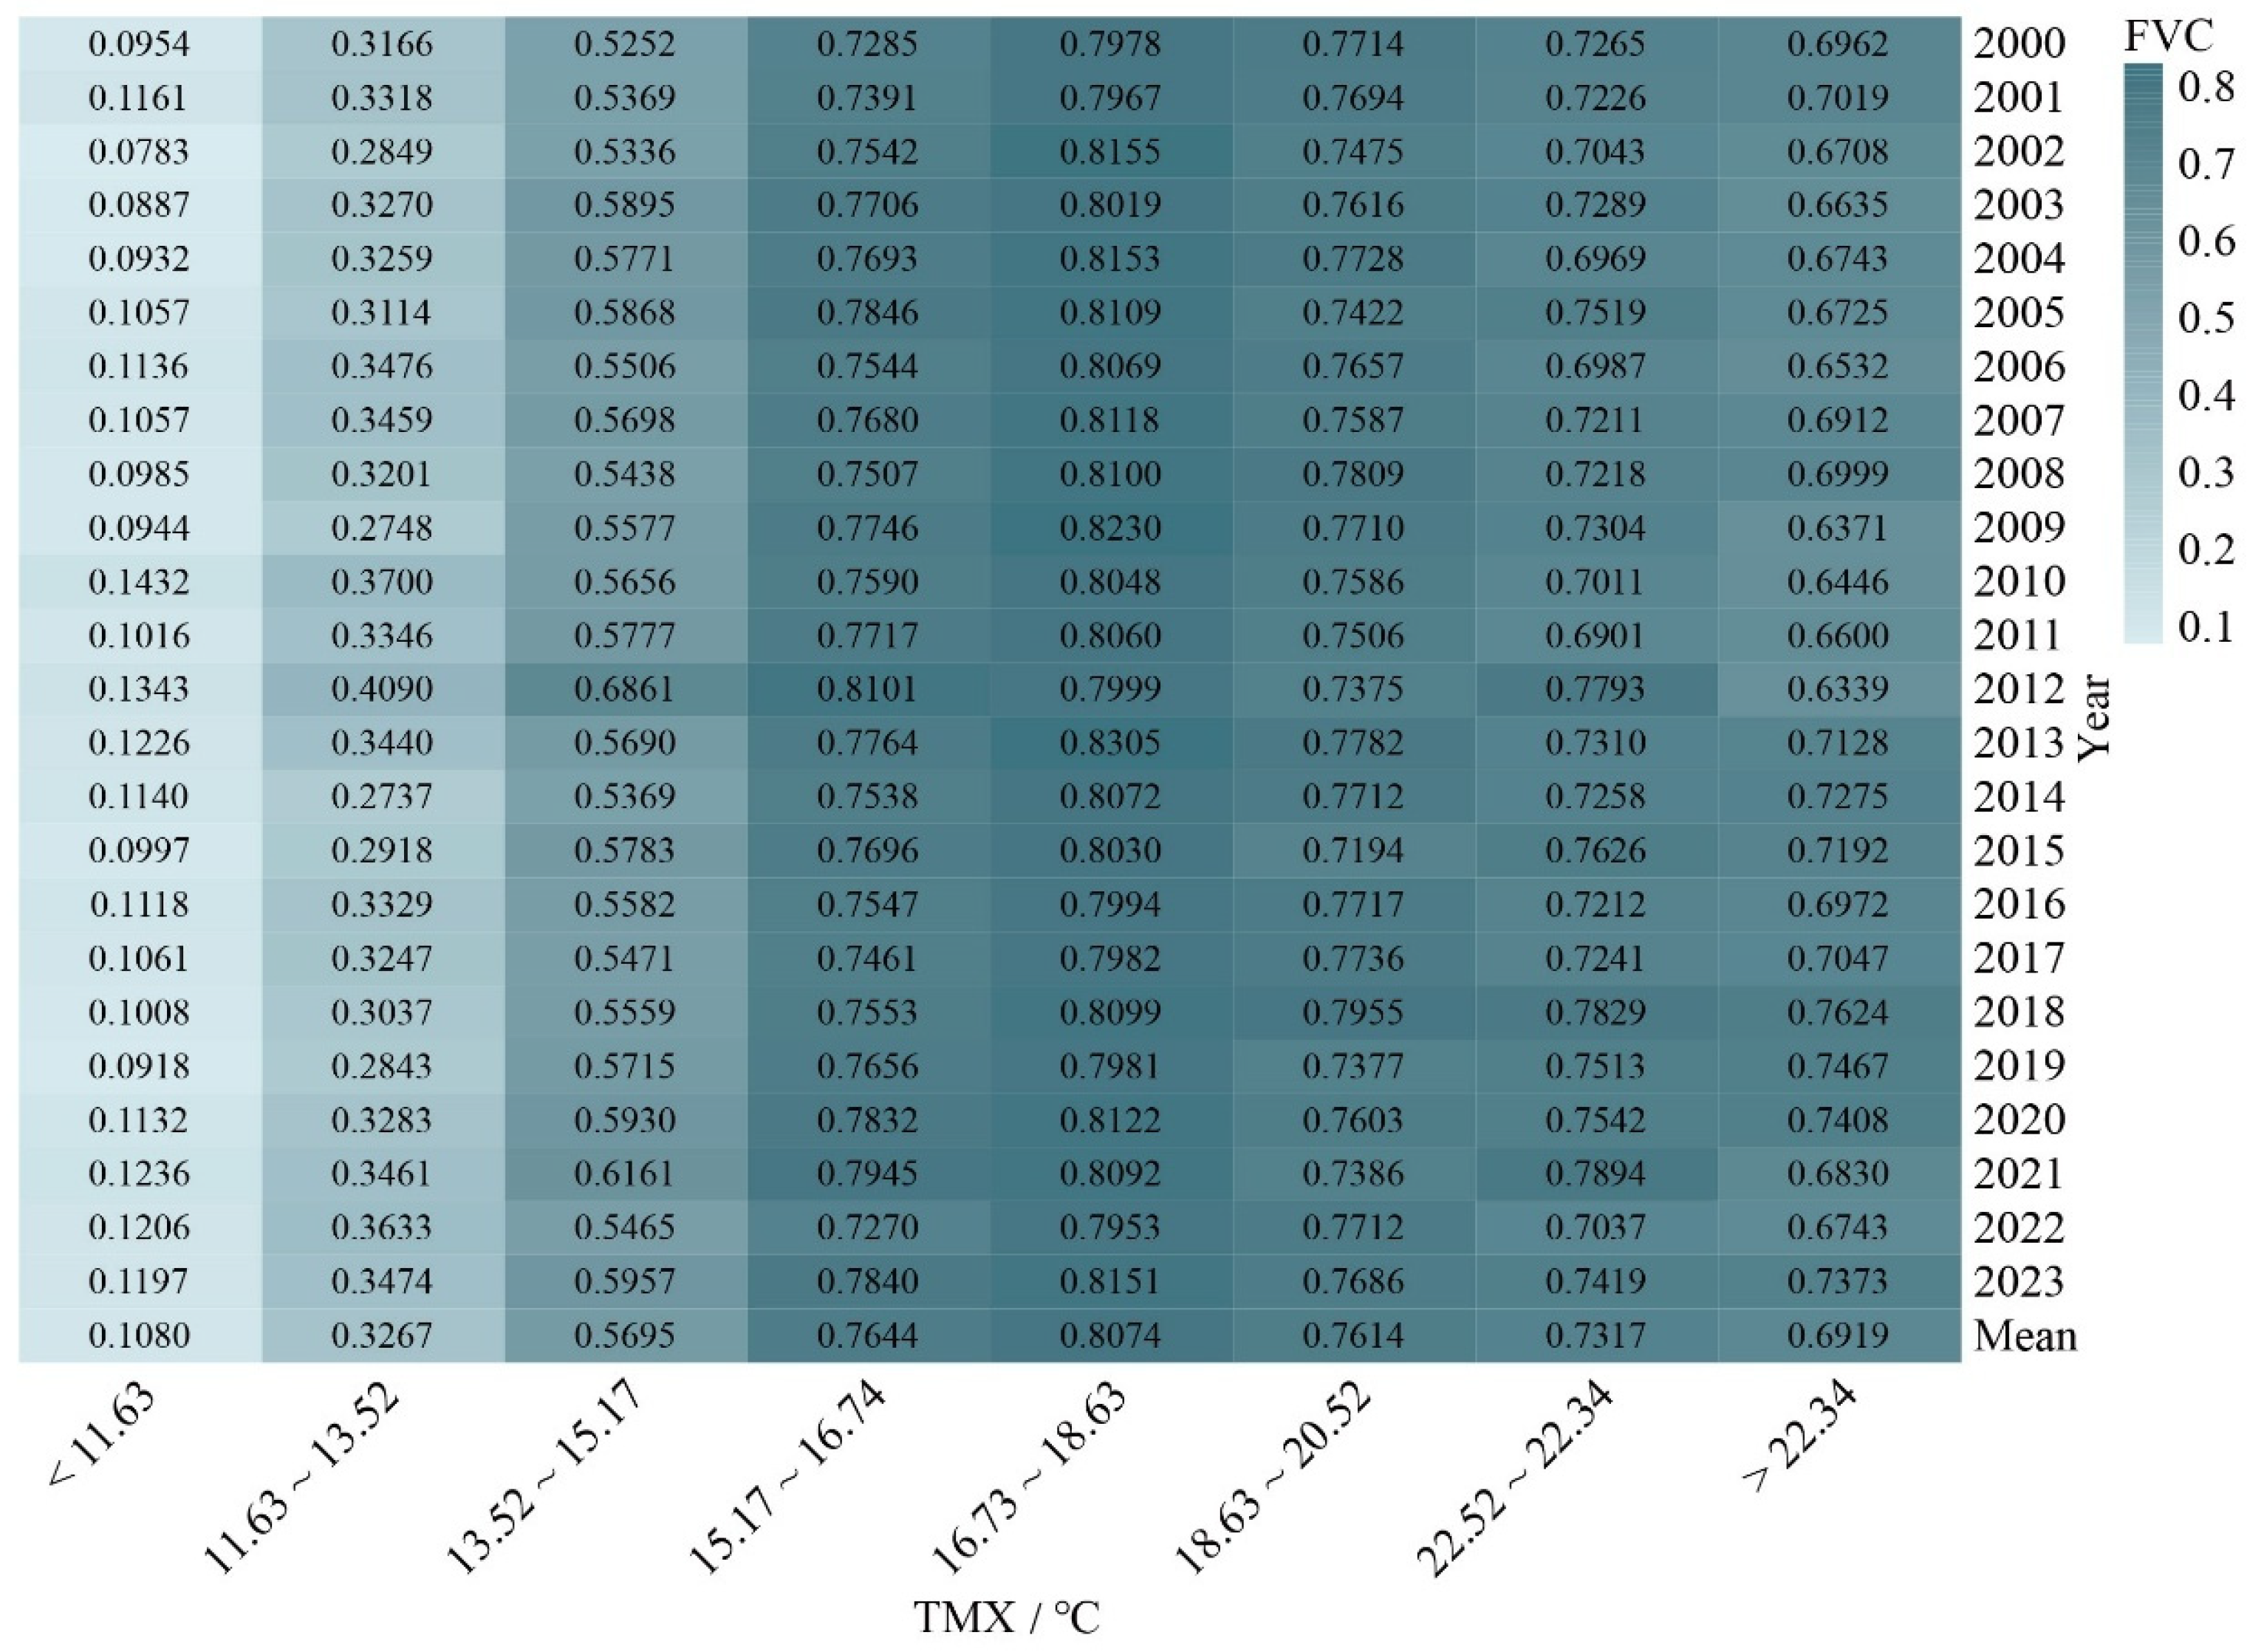
In ArcGIS 10.7, TMX values were categorized into eight classes using the “Natural Interval Method” (Figure 12), and the “Zonal Statistics as Table” tool was used to count the mean FVC in different temperature zones. In the SLLM, FVC increased and then decreased with the increase of TMX (Figure 12). The lowest FVC (0.1080) was found when TMX was below 11.63 °C, and FVC increased as TMX increased. When TMX was 16.73–18.63 °C, which was the most suitable TMX range for the SLLM vegetation growth, FVC was the highest (0.8075), and, thereafter, FVC gradually decreased with the increase of TMX, and when TMX was higher than 22.34 °C, FVC was reduced to 0.6919. From the response pattern of FVC with the change of TMX, a temperature too high or too low will lead to a decrease in FVC, both of which are negative for vegetation growth.
In this study, the correlation between FVC and TMX was also analyzed, and from the results, it can be seen that the correlation between TMX and FVC is dominated by the positive correlation, but there are some spatial differences (Figure 12). The areas with positive correlation coefficients (r > 0) between TMX and FVC are more dispersed, and those with negative correlation coefficients (r < 0) are relatively centralized, and the negative values of the correlation coefficients are mainly distributed in the north and center of the SLLM (Figure 13). This means that, in the northern and central parts of the study area, there is a potential for a decrease in FVC if TMX continues to increase.

4. Discussion

In this study, we found that the SLLM has had a clear trend of becoming drier since 2000, with a decreasing trend in precipitation. This is consistent with previous studies, which found that since the end of the last century, the TP has generally shown a humid trend, but the ETP has shown a regional drought, and the changes in precipitation and temperature are one of the reasons for this phenomenon [14,44]. Other studies have similarly found that annual precipitation in the ETP has decreased in the past decades [15]. In addition, the spatial and temporal change characteristics of TMX show that (Figure 4), the warming trend of the SLLM is obvious. The TP is a sensitive area of global climate change, and the warming trend of the TP is obvious in the context of global warming [16,45]. There is a warming and drying trend in the SLLM, and changes in precipitation and temperature may have negative impacts on regional vegetation growth [17,46].
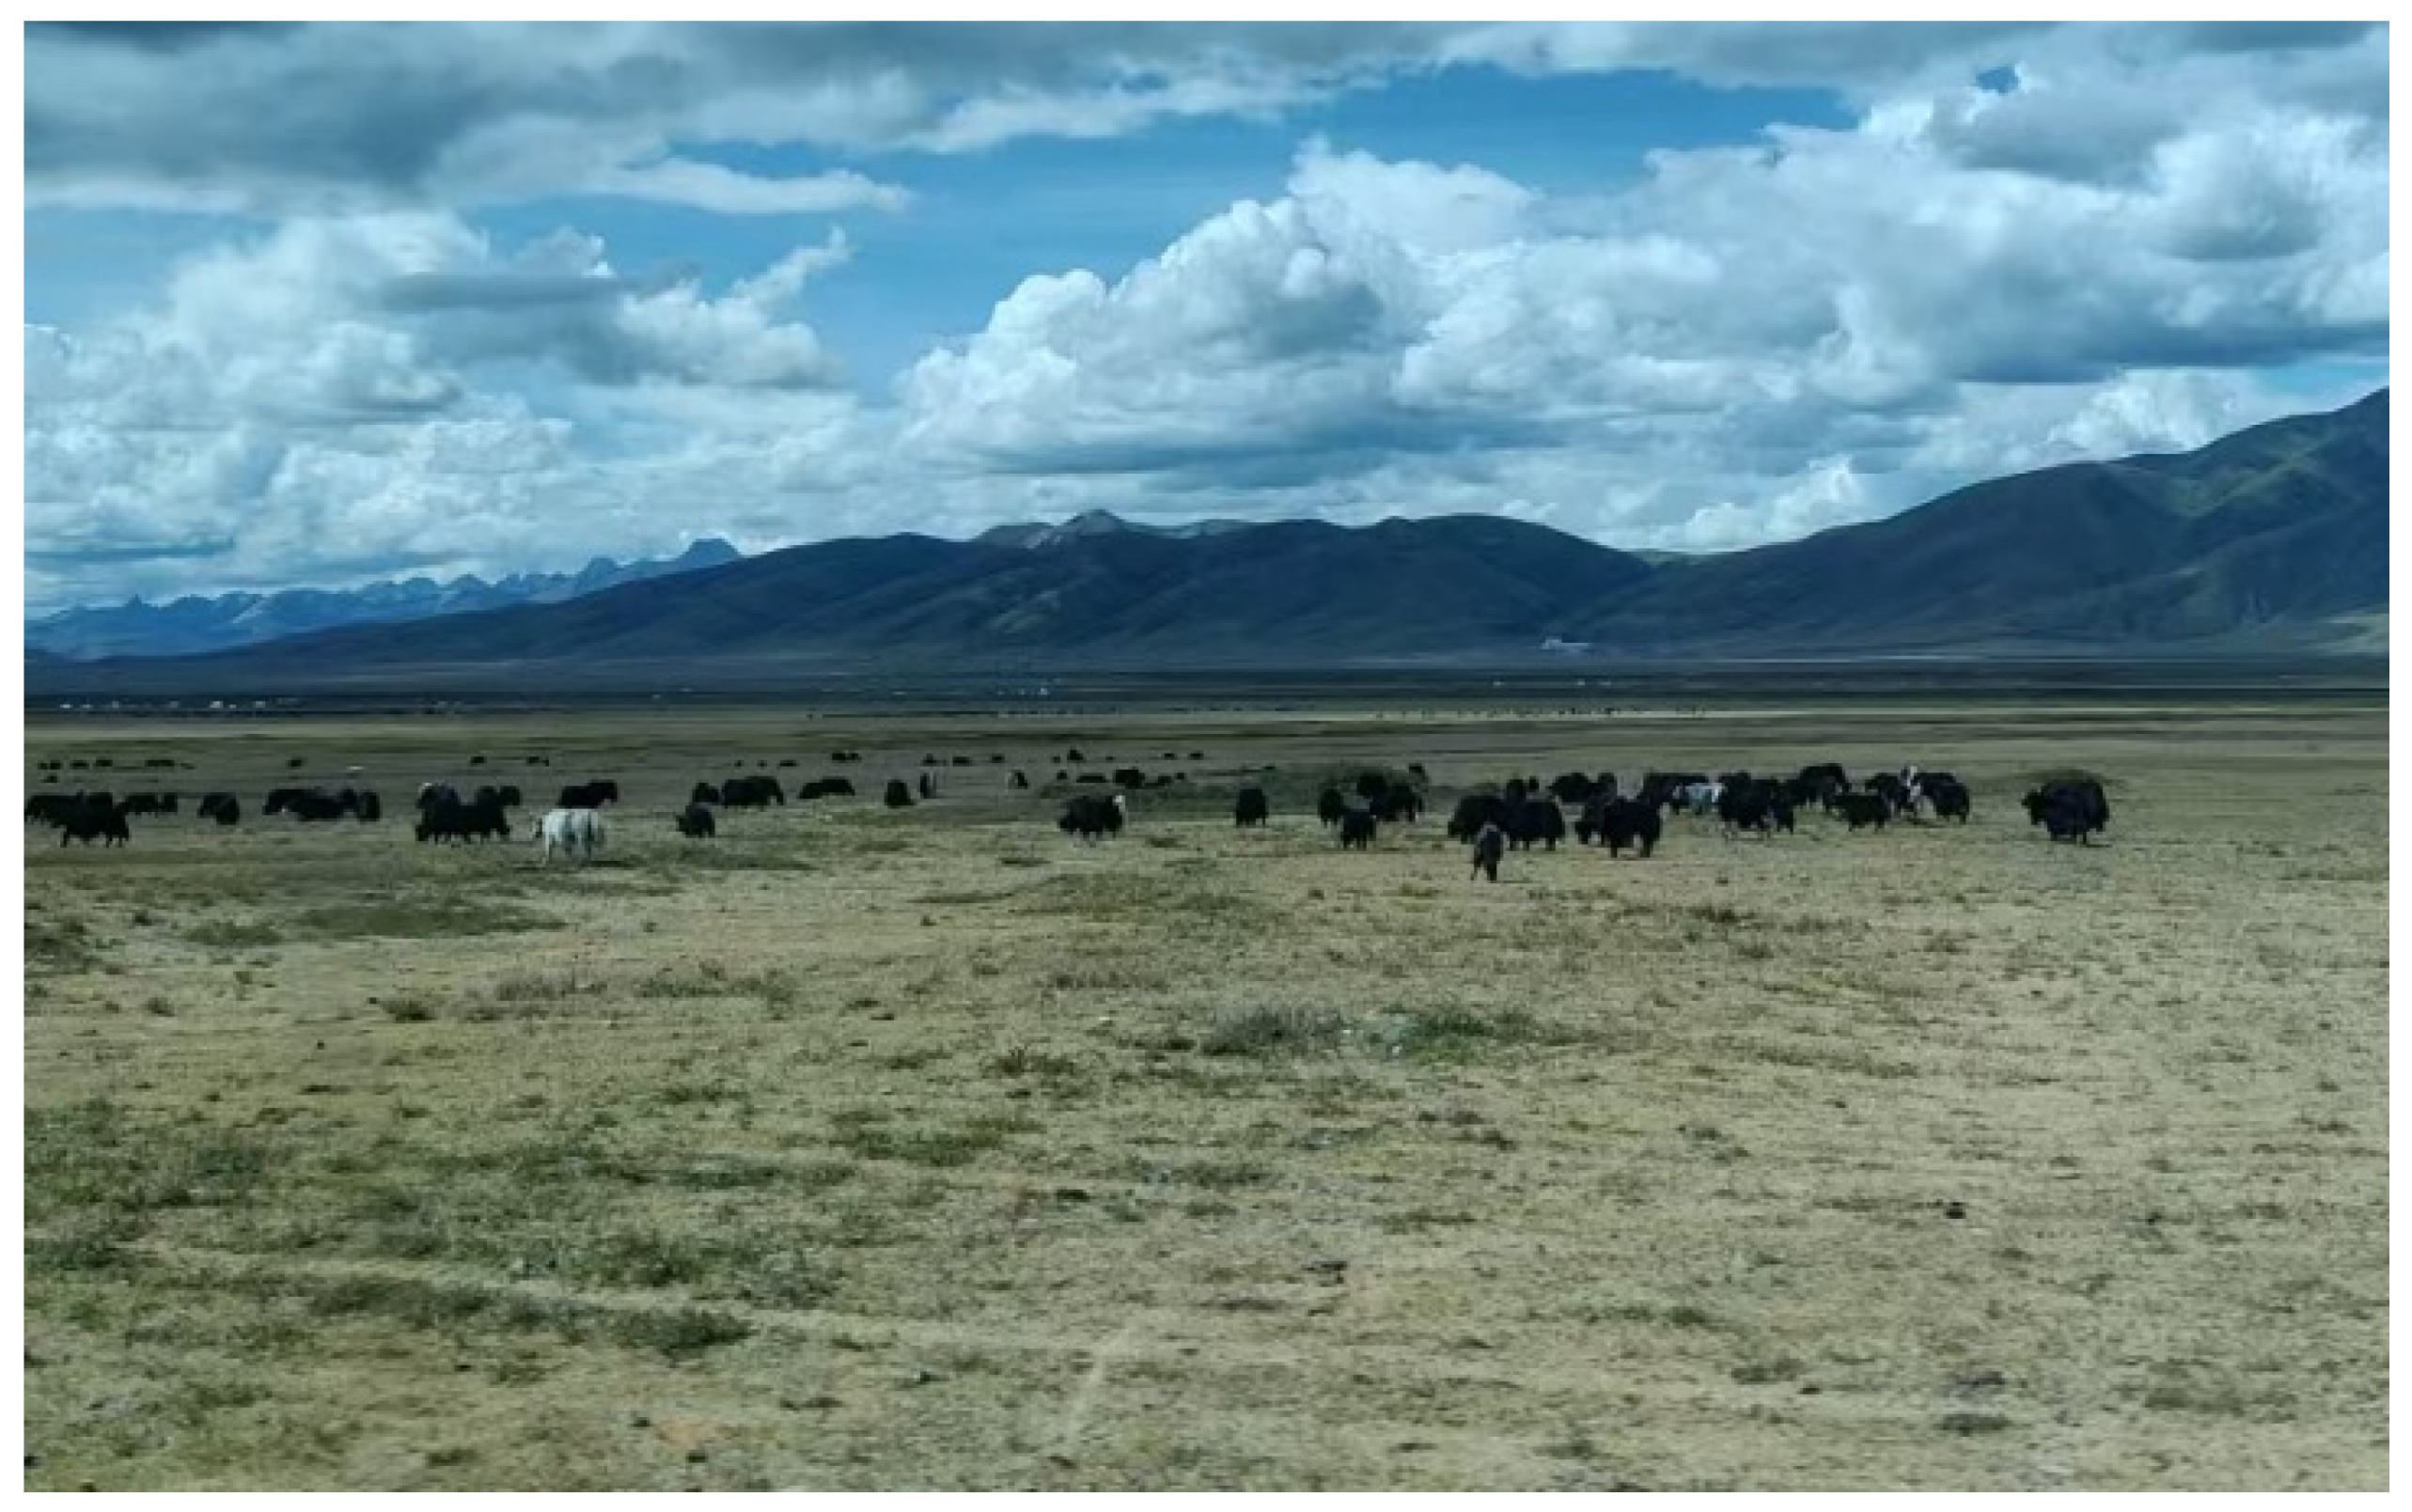
Remote sensing methods can rapidly estimate FVC at the regional scale and monitor its change dynamics [47,48,49]. Our study finds that FVC of the SLLM has generally shown a fluctuating upward trend since 2000. In terms of spatial pattern, the trend of FVC is dominated by increase. Other studies in the TP and neighboring regions have reached the same conclusion [50,51,52]. The intensity of human activities in the TP is low, and climate change is considered to be the main reason for the changes in vegetation [53]. Meanwhile, a series of ecological protection projects implemented by the Chinese government in the TP and other areas, such as “Returning Farmland to Forests”, “Returning Pasture to Grassland”, and “Protecting Natural Forests”, have also improved regional vegetation growth [54,55]. However, although there is a trend of improvement in vegetation growth, it is important to note that vegetation degradation may exist in the central part of the study area. The center of the SLLM is a plateau with a very fragile ecology, and the response of plateau vegetation to climate change is sensitive [56]. In addition, the field survey also found that meadows are widely distributed in the center of the SLLM (Figure 14), and there are high-intensity grazing activities, and overgrazing may be one of the reasons for the degradation of the vegetation [57]. Based on the Worldpop dataset (https://developers.google.com/earth-engine/datasets/catalog/WorldPop_GP_100m_pop#bands, accessed on 7 November 2024), we analyzed FVC values for different population ranges. As the population increased, FVC initially increased and then decreased (Table 3). This is because the areas with zero SLLM population (uninhabited areas) are mainly high-altitude regions with poor vegetation coverage. Excluding these areas, it can be seen that the increase in population is consistent with the decrease in vegetation coverage. In the ETP, human activities such as population and grazing have had a negative impact on the vegetation [58].
In this study, we focused more on the influence of natural factors on vegetation cover. Therefore, we quantified the power of topography and climate to drive the change of FVC. We found that altitude and temperature (TMX) were the main drivers of FVC change in the SLLM. Altitude and temperature constrain vegetation growth on the TP [59,60]. With the increase in altitude, FVC of the SLLM increased and then decreased. This is because vegetation on the TP is different in spatial distribution and has significant vertical zonation [27]. The lower altitude areas in the study area are dominated by river valley landscapes, which are the main areas of human activities, and the vegetation is vulnerable to human activities. Meanwhile, the river valley areas in the study area are typical of a dry and hot river valley climate [61], and the vegetation is dominated by arid thickets or grasses, resulting in low FVC. As the altitude increases, the vegetation type transitions to broadleaf and coniferous forests, and FVC increases. When the altitude continues to rise, the vegetation type changes to alpine meadow and scrub, and FVC begins to show a decreasing trend. Some studies have also found that, when the altitude exceeds 4000 m, FVC of the TP tends to decrease with increasing altitude [62].
Moreover, temperature has been recognized as one of the important factors affecting vegetation growth on the TP [59], and continuous warming may lead to changes in vegetation cover on the plateau. Therefore, this study analyzed the effect of temperature (TMX) on FVC of the SLLM. The results showed that FVC tended to increase and then decrease with increasing temperature. This is consistent with the response pattern of the rate of plant photosynthetic carbon sequestration to temperature change, and there is an ideal temperature range for vegetation growth, beyond which vegetation growth may be inhibited [60]. It is certain that there is a specific temperature threshold at which temperature promotes or inhibits plant growth, depending on whether it is below or above this threshold [63]. Studies around the world have found that, if temperatures continue to rise above the threshold, vegetation growth will be rapidly inhibited [64,65]. On the one hand, warming can relieve the limitation of photosynthesis on vegetation by low temperatures, reduce frost damage, lower seedling mortality, and favor vegetation growth [56]. On the other hand, a sustained increase in temperature can lead to increased evaporation and respiration, which can reinforce the limiting effect of moisture on vegetation growth and cause an increased risk of vegetation mortality [66]. In addition, we found spatial differences in the response of vegetation to temperature changes. The correlation between temperature (TMX) and FVC was more significant in the northern and central parts of the plateau region of the SLLM than in other regions, and FVC showed a negative correlation with TMX. This may be explained by the fact that, with lower temperatures in the high altitude zone, an increase in temperatures enhances photosynthesis in vegetation but a decrease in water utilization limits the beneficial effects of an increase in temperatures on vegetation growth [59].
The TP as a whole has tended to become warmer and wetter in recent years [67], but the SLLM climate in the ETP has tended to become warmer and drier. Other studies in the ETP have also found that the region is getting warmer and drier [68,69]. Certainly, temperature is the main factor influencing vegetation growth, but a sustained increase in temperature will enforce the moisture limitation on vegetation growth, and warming will also lead to a decrease in soil moisture in the high-altitude regions of the TP, which is harmful to the growth of vegetation [52]. In warm but not humid areas, higher temperatures may affect vegetation growth by controlling moisture conditions [70]. However, in the results of this study, we only found that temperature (TMX) contributed more to the change of vegetation cover, and the contribution of moisture conditions (PRE, PDSI, Soil_W) was lower. This is due to the fact that, on the Tibetan Plateau, temperature is usually a greater driver of vegetation change than precipitation [67,71], and vegetation response to moisture conditions increases rapidly only when moisture stress exceeds a threshold [72]. On the other hand, the interactions between vegetation, climate, and altitude are complex [71], with differences in climate effects on vegetation at different altitudes, and the correlation between vegetation growth status and moisture conditions may be decreased at higher altitudes [73]. In this study, the influence of climate on vegetation at different altitude gradients was not sufficiently considered, and the effects of topography–climate interaction on vegetation growth need to be considered in future studies.

5. Conclusions

This study explored the impacts of topography and climate on vegetation in the ETP and clarified the spatial and temporal patterns of FVC change and their drivers in the SLLM. The SLLM has been experiencing a warmer and drier trend since 2000, and this pattern of climate change possibly has an impact on vegetation growth. Benefiting from climate warming and the implementation of ecological protection projects, the vegetation growth in the SLLM has improved from 2000 to 2023 as a whole, and FVC change is dominated by an increasing trend. However, in the plateau area in the central part of the study area, there is a trend of vegetation degradation, which may be related to the degradation of meadows due to human activities such as overgrazing. In terms of the contribution of natural factors to changes in vegetation cover, topography and climate were the main drivers of vegetation change. Altitude was the most important factor driving vegetation change, and FVC increased and then decreased with increasing altitude, which was related to the vertical zonation characteristics of vegetation in the SLLM. In addition, FVC is also increasing and then decreasing as the temperature increases. In the central part of the SLLM, where the altitude is higher, FVC is negatively correlated with TMX, indicating that warming is not always favorable to vegetation growth, a fact to which more attention needs to be paid in future research. As climate warming continues, moisture limitations on vegetation growth may increase, and more consideration should be given to the effects of topography–climate interactions on vegetation growth in future studies.

Author Contributions

Conceptualization, Y.F. and H.Z.; methodology, Y.F. and X.Z.; software, F.Q., P.Y., and P.N.; validation, Y.F., X.W., and X.Z.; formal analysis, Y.F. and P.Y.; investigation, Y.F., S.S., X.W., and X.Z.; resources, P.Y. and P.N.; data curation, F.Q. and X.W.; writing—original draft preparation, Y.F. and H.Z.; writing—review and editing, Y.F.; visualization, Y.F.; supervision, S.S.; project administration, Y.F. and X.Z.; funding acquisition, Y.F. and X.Z. All authors have read and agreed to the published version of the manuscript.

Funding

This research was funded by the Chongqing Social Science Planning Project (Grant No. 2024NDQN052), Chengdu Technological University Talent Program (Grant No. 2025RC016), Chongqing Municipal Education Commission Humanities and Social Sciences Research Project (Grant No. 24SKGH328), and Natural Science Foundation of Sichuan, China (Grant No. 2023NSFSC0188).

Data Availability Statement

The data presented in this study are available on request from the corresponding author. The data are not publicly available due to the ongoing project to which the data belong.

Acknowledgments

We thank Mingjie Chen (Shanghai NewCore Biotechnology Co., Ltd.) for providing data analysis and visualization support.

Conflicts of Interest

The authors declare no conflicts of interest.

References

  1. Cheng, Y.; He, G.; Luo, J.; Gu, H. Effects of Climate Change on Temperature Sensitivity of Vegetation Growth in Huang-Huai-Hai Plain: Spatial–Temporal Dynamics and Ecological Adaptability. Remote Sens. 2024, 16, 4024. [Google Scholar] [CrossRef]
  2. Zhang, H.; Chang, J.; Zhang, L.; Wang, Y.; Li, Y.; Wang, X. NDVI dynamic changes and their relationship with meteorological factors and soil moisture. Environ. Earth Sci. 2018, 77, 582. [Google Scholar] [CrossRef]
  3. Hester, A.J.; Britton, A.J.; Hewison, R.L.; Ross, L.C.; Potts, J.M. Long-term vegetation change in Scotland’s native forests. Biol. Conserv. 2019, 235, 136–146. [Google Scholar] [CrossRef]
  4. Braghiere, R.K.; Quaife, T.; Black, E.; He, L.; Chen, J.M. Underestimation of Global Photosynthesis in Earth System Models Due to Representation of Vegetation Structure. Glob. Biogeochem. Cycles 2019, 33, 1358–1369. [Google Scholar] [CrossRef]
  5. Fourcade, Y.; Besnard, A.G.; Beslot, E.; Hennique, S.; Mourgaud, G.; Berdin, G.; Secondi, J. Habitat selection in a dynamic seasonal environment: Vegetation composition drives the choice of the breeding habitat for the community of passerines in floodplain grasslands. Biol. Conserv. 2018, 228, 301–309. [Google Scholar] [CrossRef]
  6. García-Pardo, K.A.; Moreno-Rangel, D.; Domínguez-Amarillo, S.; García-Chávez, J.R. Remote sensing for the assessment of ecosystem services provided by urban vegetation: A review of the methods applied. Urban For. Urban Green 2022, 74, 127636. [Google Scholar] [CrossRef]
  7. Liu, W.; Mo, X.; Liu, S.; Lu, C. Impacts of climate change on grassland fractional vegetation cover variation on the Tibetan Plateau. Sci. Total Environ. 2024, 939, 173320. [Google Scholar] [CrossRef]
  8. Zhang, Y.; Zhang, L.; Wang, J.; Dong, G.; Wei, Y. Quantitative analysis of NDVI driving factors based on the geographical detector model in the Chengdu-Chongqing region, China. Ecol. Indic. 2023, 155, 110978. [Google Scholar] [CrossRef]
  9. Zhang, H.; He, Z.; Xu, J.; Mu, W.; Chen, Y.; Wang, G. Analysis of Spatial and Temporal Changes in Vegetation Cover and Driving Forces in the Wuding River Basin, Loess Plateau. Forests 2023, 15, 82. [Google Scholar] [CrossRef]
  10. Jin, J.; Wang, Q.; Li, L. Long-term oscillation of drought conditions in the western China: An analysis of PDSI on a decadal scale. J. Arid Land 2016, 8, 819–831. [Google Scholar] [CrossRef]
  11. Lai, J.; Zhao, T.; Qi, S. Spatiotemporal Variation in Vegetation and Its Driving Mechanisms in the Southwest Alpine Canyon Area of China. Forests 2023, 14, 2357. [Google Scholar] [CrossRef]
  12. Qiu, T.; Sharma, S.; Woodall, C.W.; Clark, J.S. Niche Shifts from Trees to Fecundity to Recruitment That Determine Species Response to Climate Change. Front. Ecol. Evol. 2021, 9, 719141. [Google Scholar] [CrossRef]
  13. Shi, F.; Wu, X.; Li, X.; Chen, D.; Liu, H.; Liu, S.; Hu, X.; He, B.; Shi, C.; Wang, P.; et al. Weakening Relationship Between Vegetation Growth over the Tibetan Plateau and Large-Scale Climate Variability. J. Geophys. Res. Biogeosci. 2018, 123, 1247–1259. [Google Scholar] [CrossRef]
  14. Yuan, N.; Feng, Y.; Liang, S.; Wang, G.; Yin, T.; Yan, D.; Wu, P.; Kuang, X.; Wan, L. Spatial gathering characteristics of drought in the Qinghai-Tibet Plateau. Front. Environ. Sci. 2022, 10, 1008886. [Google Scholar] [CrossRef]
  15. Li, G.; Yu, Z.; Li, Y.; Li, Z.; Ju, Q.; Huang, Y. The evolution of precipitation and its physical mechanisms in arid and humid regions of the Tibetan Plateau. Atmos. Res. 2023, 285, 106638. [Google Scholar] [CrossRef]
  16. Meng, Y.; Duan, K.; Shi, P.; Shang, W.; Li, S.; Cheng, Y.; Xing, L.; Chen, R.; He, J. Sensitive temperature changes on the Tibetan Plateau in response to global warming. Atmos. Res. 2023, 294, 106948. [Google Scholar] [CrossRef]
  17. Zhang, Y.; Hu, Q.; Zou, F. Spatio-Temporal Changes of Vegetation Net Primary Productivity and Its Driving Factors on the Qinghai-Tibetan Plateau from 2001 to 2017. Remote Sens. 2021, 13, 1566. [Google Scholar] [CrossRef]
  18. Maharjan, S.K.; Sterck, F.J.; Raes, N.; Zhao, Y.; Poorter, L. Climate change induced elevational range shifts of Himalayan tree species. Biotropica 2023, 55, 53–69. [Google Scholar] [CrossRef]
  19. Afuye, G.A.; Kalumba, A.M.; Orimoloye, I.R. Characterisation of Vegetation Response to Climate Change: A Review. Sustainability 2021, 13, 7265. [Google Scholar] [CrossRef]
  20. Ontel, I.; Avram, S.; Gheorghe, C.A.; Niculae, M.I.; Pascu, I.S.; Rodino, S. Shifting vegetation phenology in protected areas: A response to climate change. Ecol. Inform. 2025, 85, 102962. [Google Scholar] [CrossRef]
  21. Ma, J.; Ren, H.-L.; Mao, X.; Liu, M.; Wang, T.; Ma, X. Spatiotemporal Evolution Disparities of Vegetation Trends over the Tibetan Plateau Under Climate Change. Remote Sens. 2024, 16, 2585. [Google Scholar] [CrossRef]
  22. Zarei, A.; Asadi, E.; Ebrahimi, A.; Jafari, M.; Malekian, A.; Mohammadi Nasrabadi, H.; Chemura, A.; Maskell, G. Prediction of future grassland vegetation cover fluctuation under climate change scenarios. Ecol. Indic. 2020, 119, 106858. [Google Scholar] [CrossRef]
  23. Zhong, F.; Xu, X.; Li, Z.; Zeng, X.; Yi, R.; Luo, W.; Zhang, Y.; Xu, C. Relationships between lithology, topography, soil, and vegetation, and their implications for karst vegetation restoration. CATENA 2022, 209, 105831. [Google Scholar] [CrossRef]
  24. Fan, J.; Xu, Y.; Ge, H.; Yang, W. Vegetation growth variation in relation to topography in Horqin Sandy Land. Ecol. Indic. 2020, 113, 106215. [Google Scholar] [CrossRef]
  25. Wang, B.; Cheng, W.; Xu, H.; Wang, R.; Song, K.; Bao, A.; Shi, Q. Vegetation differentiation characteristics and control mechanisms in the Altay region based on topographic gradients. Ecol. Indic. 2024, 160, 111838. [Google Scholar] [CrossRef]
  26. Li, Q.; Shi, X.; Wu, Q. Exploring suitable topographical factor conditions for vegetation growth in Wanhuigou catchment on the Loess Plateau, China: A new perspective for ecological protection and restoration. Ecol. Eng. 2020, 158, 106053. [Google Scholar] [CrossRef]
  27. Fan, Z.; Bai, X. Scenarios of potential vegetation distribution in the different gradient zones of Qinghai-Tibet Plateau under future climate change. Sci. Total Environ. 2021, 796, 148918. [Google Scholar] [CrossRef]
  28. Thakur, D.; Chawla, A. Functional diversity along elevational gradients in the high altitude vegetation of the western Himalaya. Biodivers. Conserv. 2019, 28, 1977–1996. [Google Scholar] [CrossRef]
  29. Bennie, J.; Hill, M.O.; Baxter, R.; Huntley, B. Influence of slope and aspect on long-term vegetation change in British chalk grasslands. J. Ecol. 2006, 94, 355–368. [Google Scholar] [CrossRef]
  30. Li, Y.; Gong, J.; Zhang, Y. Investigating the Relationship Between Topographic Factors and Vegetation Spatial Patterns in the Alpine Plateau: A Case Study in the Southwestern Tibetan Plateau. Remote Sens. 2023, 15, 5356. [Google Scholar] [CrossRef]
  31. Feng, Y.; Shi, S.; Niu, P.; Ye, P.; Wang, X.; Zhang, X. Climate and Altitude Drive Spatial and Temporal Changes in Forests on the Eastern Tibetan Plateau—Evidence from the Shaluli Mountain. Forests 2024, 15, 1968. [Google Scholar] [CrossRef]
  32. Xu, P.; Zhou, T.; Yi, C.; Fang, W.; Hendrey, G.; Zhao, X. Forest drought resistance distinguished by canopy height. Environ. Res. Lett. 2018, 13, 075003. [Google Scholar] [CrossRef]
  33. Anees, S.A.; Zhang, X.; Shakeel, M.; Al-Kahtani, M.A.; Khan, K.A.; Akram, M.; Ghramh, H.A. Estimation of fractional vegetation cover dynamics based on satellite remote sensing in Pakistan: A comprehensive study on the FVC and its drivers. J. King Saud. Univ. Sci. 2022, 34, 101848. [Google Scholar] [CrossRef]
  34. Melese, T.; Assefa, G.; Terefe, B.; Belay, T.; Bayable, G.; Senamew, A. Machine learning-based drought prediction using Palmer Drought Severity Index and TerraClimate data in Ethiopia. PLoS ONE 2025, 20, e0326174. [Google Scholar] [CrossRef] [PubMed]
  35. Abatzoglou, J.T.; Dobrowski, S.Z.; Parks, S.A.; Hegewisch, K.C. TerraClimate, a high-resolution global dataset of monthly climate and climatic water balance from 1958–2015. Sci. Data 2018, 5, 170191. [Google Scholar] [CrossRef]
  36. Araghi, A.; Martinez, C.J.; Adamowski, J.F. Evaluation of TerraClimate gridded data across diverse climates in Iran. Earth Sci. Inform. 2023, 16, 1347–1358. [Google Scholar] [CrossRef]
  37. Yang, B.; Kong, L.; Lai, C.; Huang, D.; Cheng, X. A Framework on Analyzing Long-Term Drought Changes and Its Influential Factors Based on the PDSI. Atmosphere 2022, 13, 1151. [Google Scholar] [CrossRef]
  38. Mahesh, R.; Jayadevan Sarunjith, K.; Rajakumari, S.; Muruganandam, R.; Ramesh, R. Quality assessment of open sourced digital elevation models in southeast coast of India. Egypt. J. Remote Sens. Space Sci. 2021, 24, 745–754. [Google Scholar] [CrossRef]
  39. Carrera-Hernández, J.J. Not all DEMs are equal: An evaluation of six globally available 30m resolution DEMs with geodetic benchmarks and LiDAR in Mexico. Remote Sens. Environ. 2021, 261, 112474. [Google Scholar] [CrossRef]
  40. He, J.; Shi, X.; Fu, Y. Identifying vegetation restoration effectiveness and driving factors on different micro-topographic types of hilly Loess Plateau: From the perspective of ecological resilience. J. Environ. Manag. 2021, 289, 112562. [Google Scholar] [CrossRef]
  41. Wang, S.; Xing, X.; Wu, Y.; Guo, J.; Li, M.; Fu, B. Seasonal Response of the NDVI to the SPEI at Different Time Scales in Yinshanbeilu, Inner Mongolia, China. Land 2024, 13, 523. [Google Scholar] [CrossRef]
  42. Wang, J.-F.; Zhang, T.-L.; Fu, B.-J. A measure of spatial stratified heterogeneity. Ecol. Indic. 2016, 67, 250–256. [Google Scholar] [CrossRef]
  43. Wang, J.F.; Li, X.H.; Christakos, G.; Liao, Y.L.; Zhang, T.; Gu, X.; Zheng, X.Y. Geographical Detectors-Based Health Risk Assessment and Its Application in the Neural Tube Defects Study of the Heshun Region, China. Int. J. Geogr. Inf. Sci. 2010, 24, 107–127. [Google Scholar] [CrossRef]
  44. Gao, Y.; Li, X.; Ruby Leung, L.; Chen, D.; Xu, J. Aridity changes in the Tibetan Plateau in a warming climate. Environ. Res. Lett. 2015, 10, 034013. [Google Scholar] [CrossRef]
  45. Lin, J.; Zhou, G.; Zhang, Q.; Lv, X.; Fang, F.; Zhao, G.; Miao, T. Variations of air temperature differences at different temporal scales over the Tibetan Plateau since 1961 and their possible causes. Int. J. Climatol. 2023, 43, 5866–5883. [Google Scholar] [CrossRef]
  46. Sun, J.; Qin, X. Precipitation and temperature regulate the seasonal changes of NDVI across the Tibetan Plateau. Environ. Earth Sci. 2016, 75, 291. [Google Scholar] [CrossRef]
  47. Wang, Y.; Tan, L.; Wang, G.; Sun, X.; Xu, Y. Study on the Impact of Spatial Resolution on Fractional Vegetation Cover Extraction with Single-Scene and Time-Series Remote Sensing Data. Remote Sens. 2022, 14, 4165. [Google Scholar] [CrossRef]
  48. Xiao, Q.; Tao, J.; Xiao, Y.; Qian, F. Monitoring vegetation cover in Chongqing between 2001 and 2010 using remote sensing data. Environ. Monit. Assess. 2017, 189, 493. [Google Scholar] [CrossRef]
  49. Gao, L.; Wang, X.; Johnson, B.A.; Tian, Q.; Wang, Y.; Verrelst, J.; Mu, X.; Gu, X. Remote sensing algorithms for estimation of fractional vegetation cover using pure vegetation index values: A review. ISPRS J. Photogramm. Remote Sens. 2020, 159, 364–377. [Google Scholar] [CrossRef]
  50. Guo, J.; Zhai, L.; Sang, H.; Cheng, S.; Li, H. Effects of hydrothermal factors and human activities on the vegetation coverage of the Qinghai-Tibet Plateau. Sci. Rep. 2023, 13, 12488. [Google Scholar] [CrossRef]
  51. Liu, S.; Gu, Y.; Wang, H.; Lin, J.; Zhuo, P.; Ao, T. Response of Vegetation Coverage to Climate Drivers in the Min-Jiang River Basin Along the Eastern Margin of the Tibetan Plat-Eau, 2000–2022. Forests 2024, 15, 1093. [Google Scholar] [CrossRef]
  52. Han, H.; Yin, Y.; Zhao, Y.; Qin, F. Spatiotemporal Variations in Fractional Vegetation Cover and Their Responses to Climatic Changes on the Qinghai–Tibet Plateau. Remote Sens. 2023, 15, 2662. [Google Scholar] [CrossRef]
  53. Wang, T.; Yang, M.; Yan, S.; Geng, G.; Li, Q.; Wang, F. Temporal and Spatial Vegetation Index Variability and Response to Temperature and Precipitation in the Qinghai-Tibet Plateau Using GIMMS NDVI. Pol. J. Environ. Stud. 2020, 29, 4385–4395. [Google Scholar] [CrossRef]
  54. Zhao, H.; Wei, D.; Wang, X.; Hong, J.; Wu, J.; Xiong, D.; Liang, Y.; Yuan, Z.; Qi, Y.; Huang, L. Three decadal large-scale ecological restoration projects across the Tibetan Plateau. Land Degrad. Dev. 2024, 35, 22–32. [Google Scholar] [CrossRef]
  55. Yu, Q.; Lu, H.; Yao, T.; Xue, Y.; Feng, W. Enhancing sustainability of vegetation ecosystems through ecological engineering: A case study in the Qinghai-Tibet Plateau. J. Environ. Manag. 2023, 325, 116576. [Google Scholar] [CrossRef]
  56. Diao, C.; Liu, Y.; Zhao, L.; Zhuo, G.; Zhang, Y. Regional-scale vegetation-climate interactions on the Qinghai-Tibet Plateau. Ecol. Inform. 2021, 65, 101413. [Google Scholar] [CrossRef]
  57. Niu, Y.; Bai, Y.; Rossi, S. Editorial: Vegetation-based degradation and restoration on the alpine grasslands of the Tibetan plateau. Front. Plant Sci. 2024, 15, 1467335. [Google Scholar] [CrossRef]
  58. Wei, Y.; Lu, H.; Wang, J.; Wang, X.; Sun, J. Dual Influence of Climate Change and Anthropogenic Activities on the Spatiotemporal Vegetation Dynamics over the Qinghai-Tibetan Plateau from 1981 to 2015. Earth’s Future 2022, 10, e2021EF002566. [Google Scholar] [CrossRef]
  59. Wang, Y.; Peng, D.; Shen, M.; Xu, X.; Yang, X.; Huang, W.; Yu, L.; Liu, L.; Li, C.; Li, X.; et al. Contrasting Effects of Temperature and Precipitation on Vegetation Greenness Along Elevation Gradients of the Tibetan Plateau. Remote Sens. 2020, 12, 2751. [Google Scholar] [CrossRef]
  60. Chen, A.; Huang, L.; Liu, Q.; Piao, S. Optimal temperature of vegetation productivity and its linkage with climate and elevation on the Tibetan Plateau. Glob. Change Biol. 2021, 27, 1942–1951. [Google Scholar] [CrossRef]
  61. Zhang, W.; Li, L.; Kechao, S.; Xiaodong, L.; Yidong, W.; Yi, T.; Jiang, H. Remote sensing the orographic effects of dry-hot valley on vegetation distribution in the southeast Tibetan Plateau. Int. J. Remote Sens. 2019, 40, 8589–8607. [Google Scholar] [CrossRef]
  62. Wang, R.; Wang, Y.; Yan, F. Vegetation Growth Status and Topographic Effects in Frozen Soil Regions on the Qinghai–Tibet Plateau. Remote Sens. 2022, 14, 4830. [Google Scholar] [CrossRef]
  63. Xu, B.; Li, J.; Liu, Y.; Zhang, T.; Luo, Z.; Pei, X. Disentangling the response of vegetation dynamics to natural and anthropogenic drivers over the Qinghai-Tibet Plateau using dimensionality reduction and structural equation model. For. Ecol. Manag. 2024, 554, 121677. [Google Scholar] [CrossRef]
  64. Li, X.; Huntingford, C.; Wang, K.; Cui, J.; Xu, H.; Kan, F.; Anniwaer, N.; Yang, H.; Peñuelas, J.; Piao, S. Increased crossing of thermal stress thresholds of vegetation under global warming. Glob. Change Biol. 2024, 30, e17406. [Google Scholar] [CrossRef] [PubMed]
  65. Wu, X.; Guo, W.; Liu, H.; Li, X.; Peng, C.; Allen, C.D.; Zhang, C.; Wang, P.; Pei, T.; Ma, Y.; et al. Exposures to temperature beyond threshold disproportionately reduce vegetation growth in the northern hemisphere. Natl. Sci. Rev. 2019, 6, 786–795. [Google Scholar] [CrossRef] [PubMed]
  66. Ganjurjav, H.; Gao, Q.; Gornish, E.S.; Schwartz, M.W.; Liang, Y.; Cao, X.; Zhang, W.; Zhang, Y.; Li, W.; Wan, Y.; et al. Differential response of alpine steppe and alpine meadow to climate warming in the central Qinghai–Tibetan Plateau. Agric. For. Meteorol. 2016, 223, 233–240. [Google Scholar] [CrossRef]
  67. He, Z.; Zhou, T.; Chen, J.; Fu, Y.; Peng, Y.; Zhang, L.; Yao, T.; Farooq, T.H.; Wu, X.; Yan, W.; et al. Impacts of Climate Warming and Humidification on Vegetation Activity over the Tibetan Plateau. Forests 2023, 14, 2055. [Google Scholar] [CrossRef]
  68. Shi, C.; Shen, M.; Wu, X.; Cheng, X.; Li, X.; Fan, T.; Li, Z.; Zhang, Y.; Fan, Z.; Shi, F.; et al. Growth response of alpine treeline forests to a warmer and drier climate on the southeastern Tibetan Plateau. Agric. For. Meteorol. 2019, 264, 73–79. [Google Scholar] [CrossRef]
  69. Shi, F.; Chen, H.; Chen, H.; Wu, Y.; Wu, N. The combined effects of warming and drying suppress CO2 and N2O emission rates in an alpine meadow of the eastern Tibetan Plateau. Ecol. Res. 2012, 27, 725–733. [Google Scholar] [CrossRef]
  70. Hua, W.; Lin, Z.; Guo, D.; Fan, G.; Zhang, Y.; Yang, K.; Hu, Q.; Zhu, L. Simulated Long-Term Vegetation–Climate Feedbacks in the Tibetan Plateau. Asia-Pac. J. Atmos. Sci. 2019, 55, 41–52. [Google Scholar] [CrossRef]
  71. Pu, G.; Han, L.; Chen, L.; Wan, D.; Teng, H. Elevational dynamics of vegetation changes in response to climate change on the Tibetan plateau. Sci. Rep. 2025, 15, 9813. [Google Scholar] [CrossRef] [PubMed]
  72. Piao, Z.; Li, X.; Xu, H.; Wang, K.; Tang, S.; Kan, F.; Hong, S. Threshold of climate extremes that impact vegetation productivity over the Tibetan Plateau. Sci. China Earth Sci. 2024, 67, 1967–1977. [Google Scholar] [CrossRef]
  73. Zhang, Y.; Xu, G.; Li, P.; Li, Z.; Wang, Y.; Wang, B.; Jia, L.; Cheng, Y.; Zhang, J.; Zhuang, S.; et al. Vegetation Change and Its Relationship with Climate Factors and Elevation on the Tibetan Plateau. Int. J. Environ. Res. Public Health 2019, 16, 4709. [Google Scholar] [CrossRef] [PubMed]
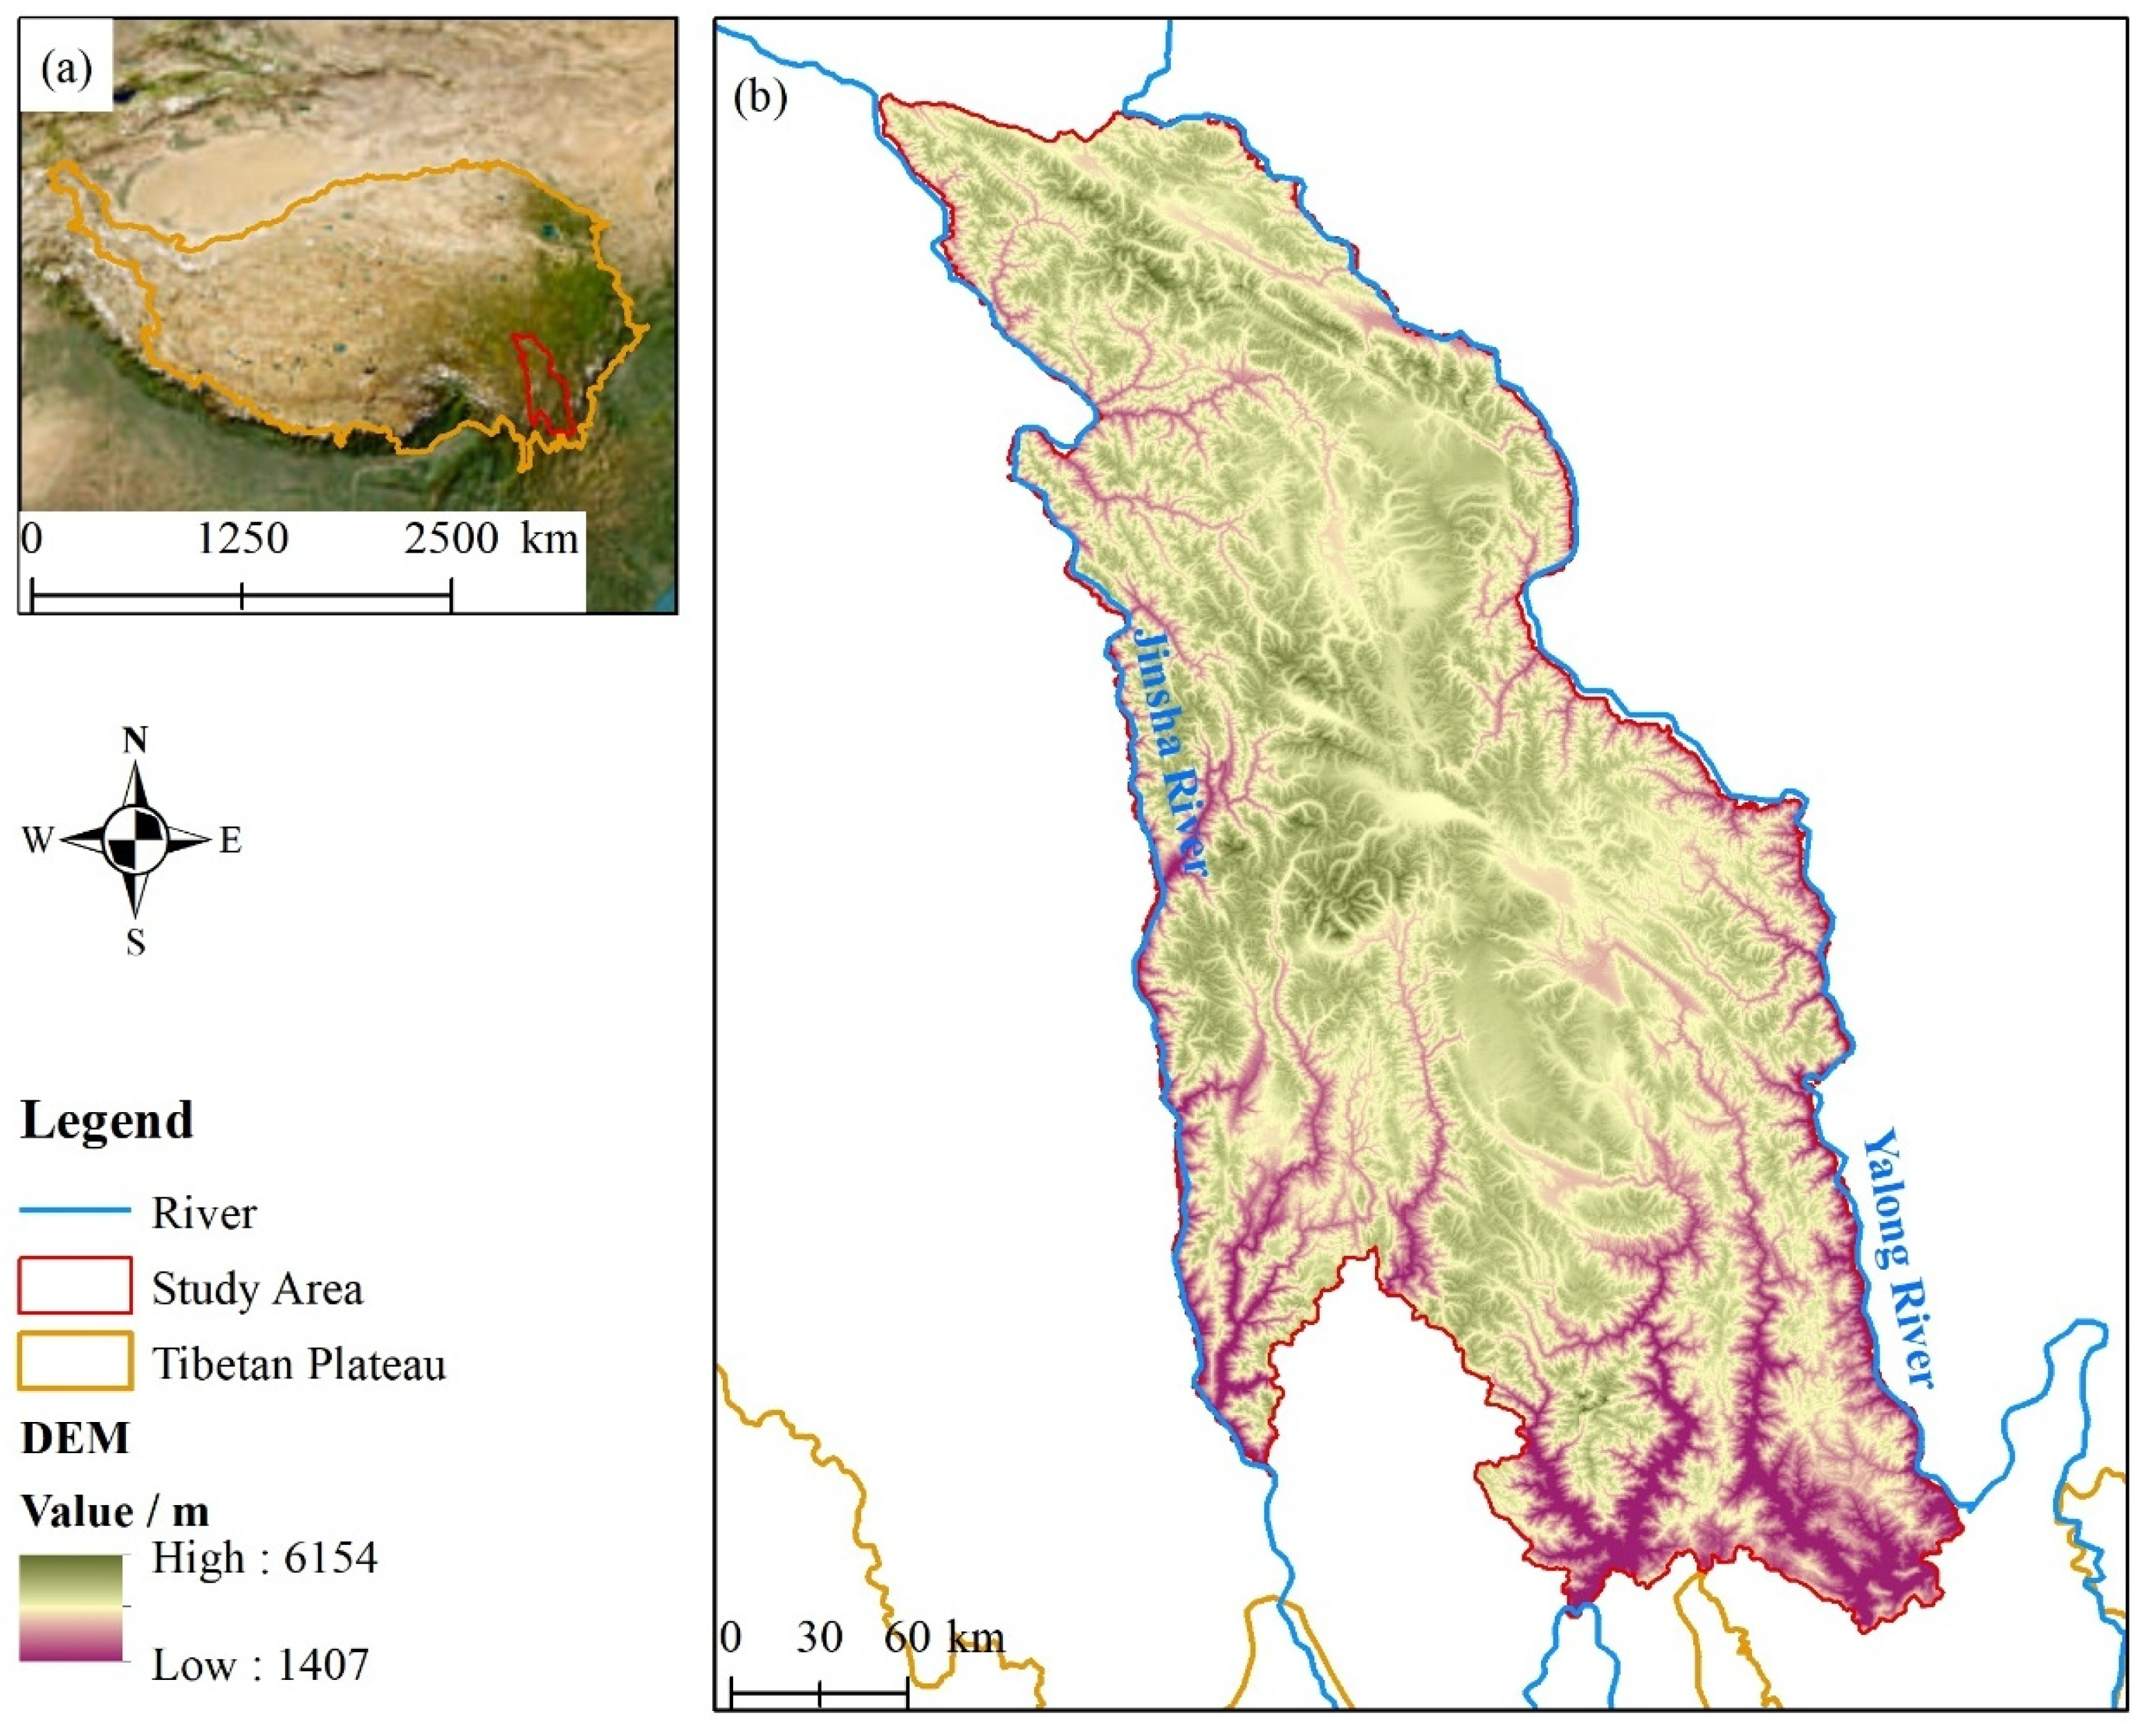
Figure 1. Location and topography of SLLM (images from https://www.esri.com/en-us/arcgis/products/arcgis-online, accessed on 31 March 2025). (a) Located at ETP, (b) DEM.
Earth 06 00092 g001
Figure 2. Characteristics of annual average FVC changes in SLLM (2000–2023).
Earth 06 00092 g002
Figure 3. Spatial pattern of FVC in SLLM from 2000 to 2023. (a) 2000, (b) 2001, (c) 2002, (d) 2003, (e) 2004, (f) 2005, (g) 2006, (h) 2007, (i) 2008, (j) 2009, (k) 2010, (m) 2011, (l) 2012, (n) 2013, (o) 2014, (p) 2015, (q) 2016, (r) 2017, (s) 2018, (t) 2019, (u) 2020, (v) 2021, (w) 2022, (x) 2023.
Earth 06 00092 g003
Figure 4. Spatial pattern of FVC for SLLM (the average of 2000–2023). (a) FVC value; (b) FVC class.
Earth 06 00092 g004
Figure 5. Spatial and temporal characteristics of FVC change in SLLM (2000–2023). (a) SLOPE Value of FVC; (b) FVC trend categories.
Earth 06 00092 g005
Figure 6. Characterization of temporal changes in climate factors for SLLM (2000–2023). (a) Precipitation trend; (b) PDSI trend; (c) Maximum temperature trend.
Earth 06 00092 g006
Figure 7. Spatial pattern of SLLM climate factors (mean values from 2000 to 2023). (a) PRE; (b) PDSI; (c) TMX.
Earth 06 00092 g007
Figure 8. Characteristics of spatial and temporal variations of climate factors in SLLM (2000~2023). (a) the SLOPE of PRE; (b) the SLOPE of PDSI; (c) the SLOPE of TMX.
Earth 06 00092 g008
Figure 9. Explanatory power (q-value) of driving factors to FVC change in SLLM.
Earth 06 00092 g009
Figure 10. Statistics of FVC values at different altitude zones.
Earth 06 00092 g010
Figure 11. The difference in the area of each FVC class in different altitude zones. Altitude zones (a) <2500 m, (b) 2500~3500 m, (c) 3500~4500 m, and (d) >4500 m.
Earth 06 00092 g011
Figure 12. Statistics of FVC values at different TMX zones.
Earth 06 00092 g012
Figure 13. The correlation coefficient (r) between FVC and TMX.
Earth 06 00092 g013
Figure 14. Alpine meadows affected by grazing in the central part of the SLLM, with yaks grazing the meadows in the picture (photo taken on 29 August 2022, in Heni Township, Litang County).
Earth 06 00092 g014
Table 1. FVC classification standard.
FVC ValueFVC ClassFVC ValueFVC Class
≤0.2Lower0.6~0.8High
0.2~0.4Low≥0.8Higher
0.4~0.6Medium
Table 2. FVC trend categories are classified according to SLOPE and p values.
CategoriesSLOPE Valuep Value
Significant decrease<−0.0001<0.05
Decrease<−0.0001>0.05
Stabilize−0.0001~+0.0001/
Increase>+0.0001>0.05
Significant increase>+0.0001<0.05
Table 3. The FVC values for different population ranges.
The Number of People Residing Within Each Grid Cell (Spatial Resolution 92.77 m)
(Average from 2000 to 2020)
FVC
(Average from 2000 to 2023)
00.4420
0–1.380.6910
1.38–4.610.6150
4.61–10.380.4353
10.38–20.060.3343
20.06–59.030.1551
Disclaimer/Publisher’s Note: The statements, opinions and data contained in all publications are solely those of the individual author(s) and contributor(s) and not of MDPI and/or the editor(s). MDPI and/or the editor(s) disclaim responsibility for any injury to people or property resulting from any ideas, methods, instructions or products referred to in the content.