Article

Flood Hazard Assessment and Monitoring in Bangladesh: An Integrated Approach for Disaster Risk Mitigation

by
Kashfia Nowrin Choudhury
1 and
Helmut Yabar
2,*
1
Graduate School of Science and Technology, University of Tsukuba, Tsukuba 305-8572, Japan
2
Faculty of Life and Environmental Sciences, University of Tsukuba, Tsukuba 305-0006, Japan
*
Author to whom correspondence should be addressed.
Earth 2025, 6(3), 90; https://doi.org/10.3390/earth6030090 (registering DOI)
Submission received: 20 May 2025 / Revised: 3 July 2025 / Accepted: 18 July 2025 / Published: 5 August 2025

Abstract

Floods are among the most devastating hydrometeorological natural disasters worldwide, causing massive infrastructure and economic loss in low-lying, flood-prone developing countries like Bangladesh. Effective disaster mitigation relies on organized and detailed flood damage information to facilitate emergency evacuation, coordinate relief distribution, and formulate an effective disaster management policy. Nevertheless, the nation confronts considerable obstacles due to insufficient historical flood damage data and the underdevelopment of near-real-time (NRT) flood monitoring systems. This study addresses this issue by developing a replicable methodology for flood damage assessment and NRT monitoring systems. Using the Google Earth Engine (GEE) platform, we analyzed flood events from 2019 to 2023, integrating geospatial layers such as roads, cropland, etc. Analysis of flood events over the five-year period revealed substantial impacts, with 21.60% of the total area experiencing inundation. This flooding affected 6.92% of cropland and 4.16% of the population. Furthermore, 18.10% of the road network, spanning over 21,000 km within the study area, was also affected. This system has the potential to enhance emergency response capabilities during flood events and inform more effective disaster mitigation policies.

1. Introduction

Floods are a global climate threat, usually triggered by heavy rainfall, tropical cyclones, intensive snow melting, etc., and cause an overflow of water over a widespread area. Factors like climate change, rapid urbanization, etc., are likely to intensify the vulnerability to this disaster in the future, especially for the low- and middle-income countries [1]. Other climate change factors, such as rising sea levels, increase the probability of coastal flooding, which may inundate 160,000 square kilometers of coastal land and threaten 410 million people by the end of 2100 [2,3]. In 2023, the global economic loss from natural disasters was 380 billion USD; floods stood third with damage worth 94 billion USD [4]. In the past decade, floods affected 31.15 million people and caused the death of 5275 people worldwide [5]. Floods are a global risk, but almost 70 percent (i.e., 1.24 billion) of vulnerable people live in South and East Asia [1,6,7]. The people from those developing countries of Asia face unimaginable suffering from floods due to an insufficient mitigation system [7].
Bangladesh is among the most vulnerable countries in the world to floods and is in South Asia. Due to its low-lying topography, geographic location, and subtropical monsoon climate, 20–25% of this country is inundated almost annually, and in extreme cases it reaches as high as 80% [7,8]. Bangladesh is one of the largest deltas in the world, which carries some 1360 billion m3 of water discharged, mostly generated from June to October, accelerating the probability of floods [9]. This country distributes a discharge twelve times larger than its size. It is located downstream of the GMB (Ganges– Brahmaputra–Meghna) Basin, one of the world’s most flood-prone basins, providing the basin outlet into the Bay of Bengal. This country’s river system is one of the most extensive in the world, and the Ganges and the Brahmaputra are considered the largest rivers in terms of catchment size, length, and discharge [8]. Around 700 rivers flow through this country, expanding over a 24,140 km path, creating favorable conditions for riverine floods, especially during the rainy season for four to six months [10]. Bangladesh experiences three types of floods: riverine, flash, and coastal [11]. The extended flooding period causes severe damage to the country’s overall economy.
Since 1972, this country has experienced around 86 flood events, which have caused 42,279 deaths and flooded 747,230 km2 [11]. In 1988, 1998, 2004, 2007, and 2017, this country experienced major floods with an economic loss of 1.2, 2.8, 6.6, 1, and 0.9 billion USD, respectively [12]. The floods of 1988 and 1998 were the most devastating in history, flooding over 60 percent of the area and causing an economic loss equivalent to more than 8% of the Gross Domestic Product (GDP) [9]. The floods cause immense damage to valuable infrastructure, including roads and bridges, and wash away crops. Floods annually disrupt traffic movement and damage roads. Prolonged inundation from flooding accelerates pavement deterioration and increases maintenance costs [13]. Around 95% of the roads in Bangladesh consist of bituminous pavement (i.e., flexible pavement) [14]. However, bituminous pavements are highly susceptible to water infiltration. Floodwater may seep through cracks, potholes, or the edges of roads. This water seepage leads to a loss of adhesion between bitumen and aggregate and eventually deteriorates the pavement structure, which weakens the pavement structure under traffic and may cause premature pavement failure [15]. In Bangladesh, roadways carry around 77% of total traffic, and disruption in traffic movement causes significant losses to the country’s economy [16,17]. The 1998 flood alone caused road damage equivalent to 137 million USD (i.e., 11.4% of GDP) [18]. The economic loss from the flood stands at 1.5% of the country’s GDP (i.e., 2.2 billion USD) [9]. The country is also highly vulnerable due to climate change and disaster risk. By 2050, this country will experience a 20% increase in monsoon rainfall, resulting in a 4% increase in flooded areas with an increased inundation depth [19].
Flooding is a natural phenomenon, and its complete prevention is not possible. Therefore, effectively identifying flood-vulnerable areas and damage extent is essential to flood risk management [20,21]. For flood mitigation, it is important to know which areas are inundated by floods [22]. Long-term flood mapping significantly contributes to flood management, planning, and decision-making [23]. Flood maps can provide information regarding historical flood patterns to plan evacuation routes or select flood shelters. They could be helpful in long-term flood management as well [6]. Near real-time flood monitoring can also develop the emergency response, evacuation route, relief distribution, estimation of budget for recovery planning, etc. However, in Bangladesh, a vast population is threatened by floods due to the lack of flood hazard zone information [22]. In Bangladesh, there is often insufficient historical flood data available for relevant mitigation planning. The available flood damage data is usually scattered and inadequate for effective decision-making. There is no detailed database for flood-damaged road network information from historical flooding events. Facilities for near-real-time monitoring of flood-affected road networks are also unavailable. The available flood damage data is often based on local people’s monetary losses or insurance databases [24]. Flood damage assessment from the insurance database may not reflect the actual extent of damage for flood mitigation planning. In this regard, satellite data has become a significant tool for flood monitoring, especially in regions where in situ data is limited or unavailable [25,26]. The unprecedented availability of numerous satellite observations, such as optical, radar, and the recent GNSS-R satellites, has made flood monitoring and extent mapping possible, including the remotest areas, which are difficult to access in person [27,28]. Due to their continuous monitoring capacities, spatial sensors often generate more reliable outcomes in monitoring flood extent than ground-based methods [29].
Flood monitoring with remote sensing technology using the weather-independent radar system, Sentinel-1 Synthetic Aperture Radar (SAR), is an efficient and rapid method [21,30]. Clouds influence optical sensors; therefore, they are unsuitable for monitoring the study area during monsoons with cloudy skies and frequent rains in a country like Bangladesh [22,31,32]. Various studies optimize Sentinel-1 image analysis using the Google Earth Engine (GEE) Platform for flood monitoring of different study areas [29,33,34,35]. Several studies have attempted to assess flood damage in various sectors, such as agricultural areas, municipal areas, etc., using the GEE platform and Sentinel-1 satellite images [21,29,35]. The GEE platform and Sentinel image were also used to develop real-time flood monitoring [22]. However, limited studies have developed a comprehensive methodology for flood database preparation, with detailed damage assessment, including real-time monitoring, especially in regions like Bangladesh. In a country like Bangladesh, the available flood damage data for various sectors (e.g., roads, cropland) is often limited, scattered, and inaccessible for general use. Advanced remote sensing technology for flood monitoring, particularly for damage assessment, remains underdeveloped in this country. This study aims to establish a comprehensive national flood damage database for Bangladesh by systematically quantifying impacts on road infrastructure, cropland, and population. To the best of our knowledge, this study is the first to systematically compile and prepare a national-scale database of flood-affected roads in Bangladesh, covering the period from 2019 to 2023, which is uniquely accessible through this methodology. This methodological advancement aims not only to fill a critical data gap but also to develop a near-real-time monitoring and impact assessment system, supporting more effective disaster management in Bangladesh, especially in the road sector. This study will investigate the following critical questions:
  • What is the spatial-temporal pattern of the flooded area in Bangladesh?
  • What is the extent of damage from the flood?
  • What system can identify near-real-time floods?

2. Materials and Methods

2.1. Study Area

The study area, Bangladesh, consists of 147,570 sq km and lies between 20°30′ and 26°40′ north latitude and 88°03′ and 92°40′ east longitude. The Bay of Bengal and Myanmar are in the south, and India surrounds the rest of the country. This small country is among one of the most densely populated countries in the world, with a population of approximately 174 million people [36]. This receives 2200 mm of rainfall annually, especially during the monsoon season (i.e., June to September) [37]. The country is low-lying (i.e., 9 m above mean sea level) with mostly flat topography, with only 12% of hills and 17% of forest. Cropland covers over 60% (i.e., 8,751,937 ha) of the country, and it accounts for 87% of the rural economy [32,38]. Usually, the slope of the country develops from the north to the south [8]. Several depressions exist in the northeastern part of the country, such as Mymensingh, the Sylhet division, and others in the northern part, the Rajshahi division.
The study area focuses on 21,453 km of the road network of the country, namely National Highways (i.e., NH), Regional Highways, and Zilla (i.e., District) Roads (Figure 1). NH refers to class 1 roads connecting the major economic hub of the country, the capital (i.e., Dhaka), with other significant places such as ports, other headquarters of the country, etc. Regional roads refer to class 2 roads that connect the city headquarters, main rivers, other not-connected segments with NH, etc., with each other. Zilla Roads, or district roads, indicate class 3; they interconnect other small city headquarters with other village headquarters.

2.2. Data

This study optimizes the advantage of freely available data in the GEE Platform, one of the public domains for Remote Sensing (RS) analysis. The essential data for the study is the Sentinel-1 C band. It is a satellite mission by the European Space Agency (ESA) that offers Synthetic Aperture Radar (SAR) data and is freely available in the public domain (e.g., GEE) [33]. This mission operates two satellites, Sentinel-1A and Sentinel-1B, with data available in 2014 and 2016, respectively [39]. This satellite data is widely used for its higher resolution (10 to 40 m) and operating features in all weather conditions. This global dataset captures images with 6 to 12 days of temporal resolution. This sensor has numerous applications in environmental monitoring, disaster management, agriculture, defense, etc. [40]. However, research has found that this sensor is highly suitable for flood monitoring [23,41]. This sensor is especially suitable for Bangladesh flood detection due to its wider wavelength and capacity to capture images regardless of clouds or rain. During floods in Bangladesh, the sky usually remains cloudy, accompanied by periodic rain. Therefore, Sentinel-1 is compatible with flood monitoring of the study area. Other essential data for administrative boundaries, water bodies, cropland, population, etc., were also used from the GEE platform. The road network and flood duration data were collected from the Roads & Highways Department (RHD), Bangladesh, and EM-DAT, the international disaster database, respectively.

2.3. Flood Extent Map

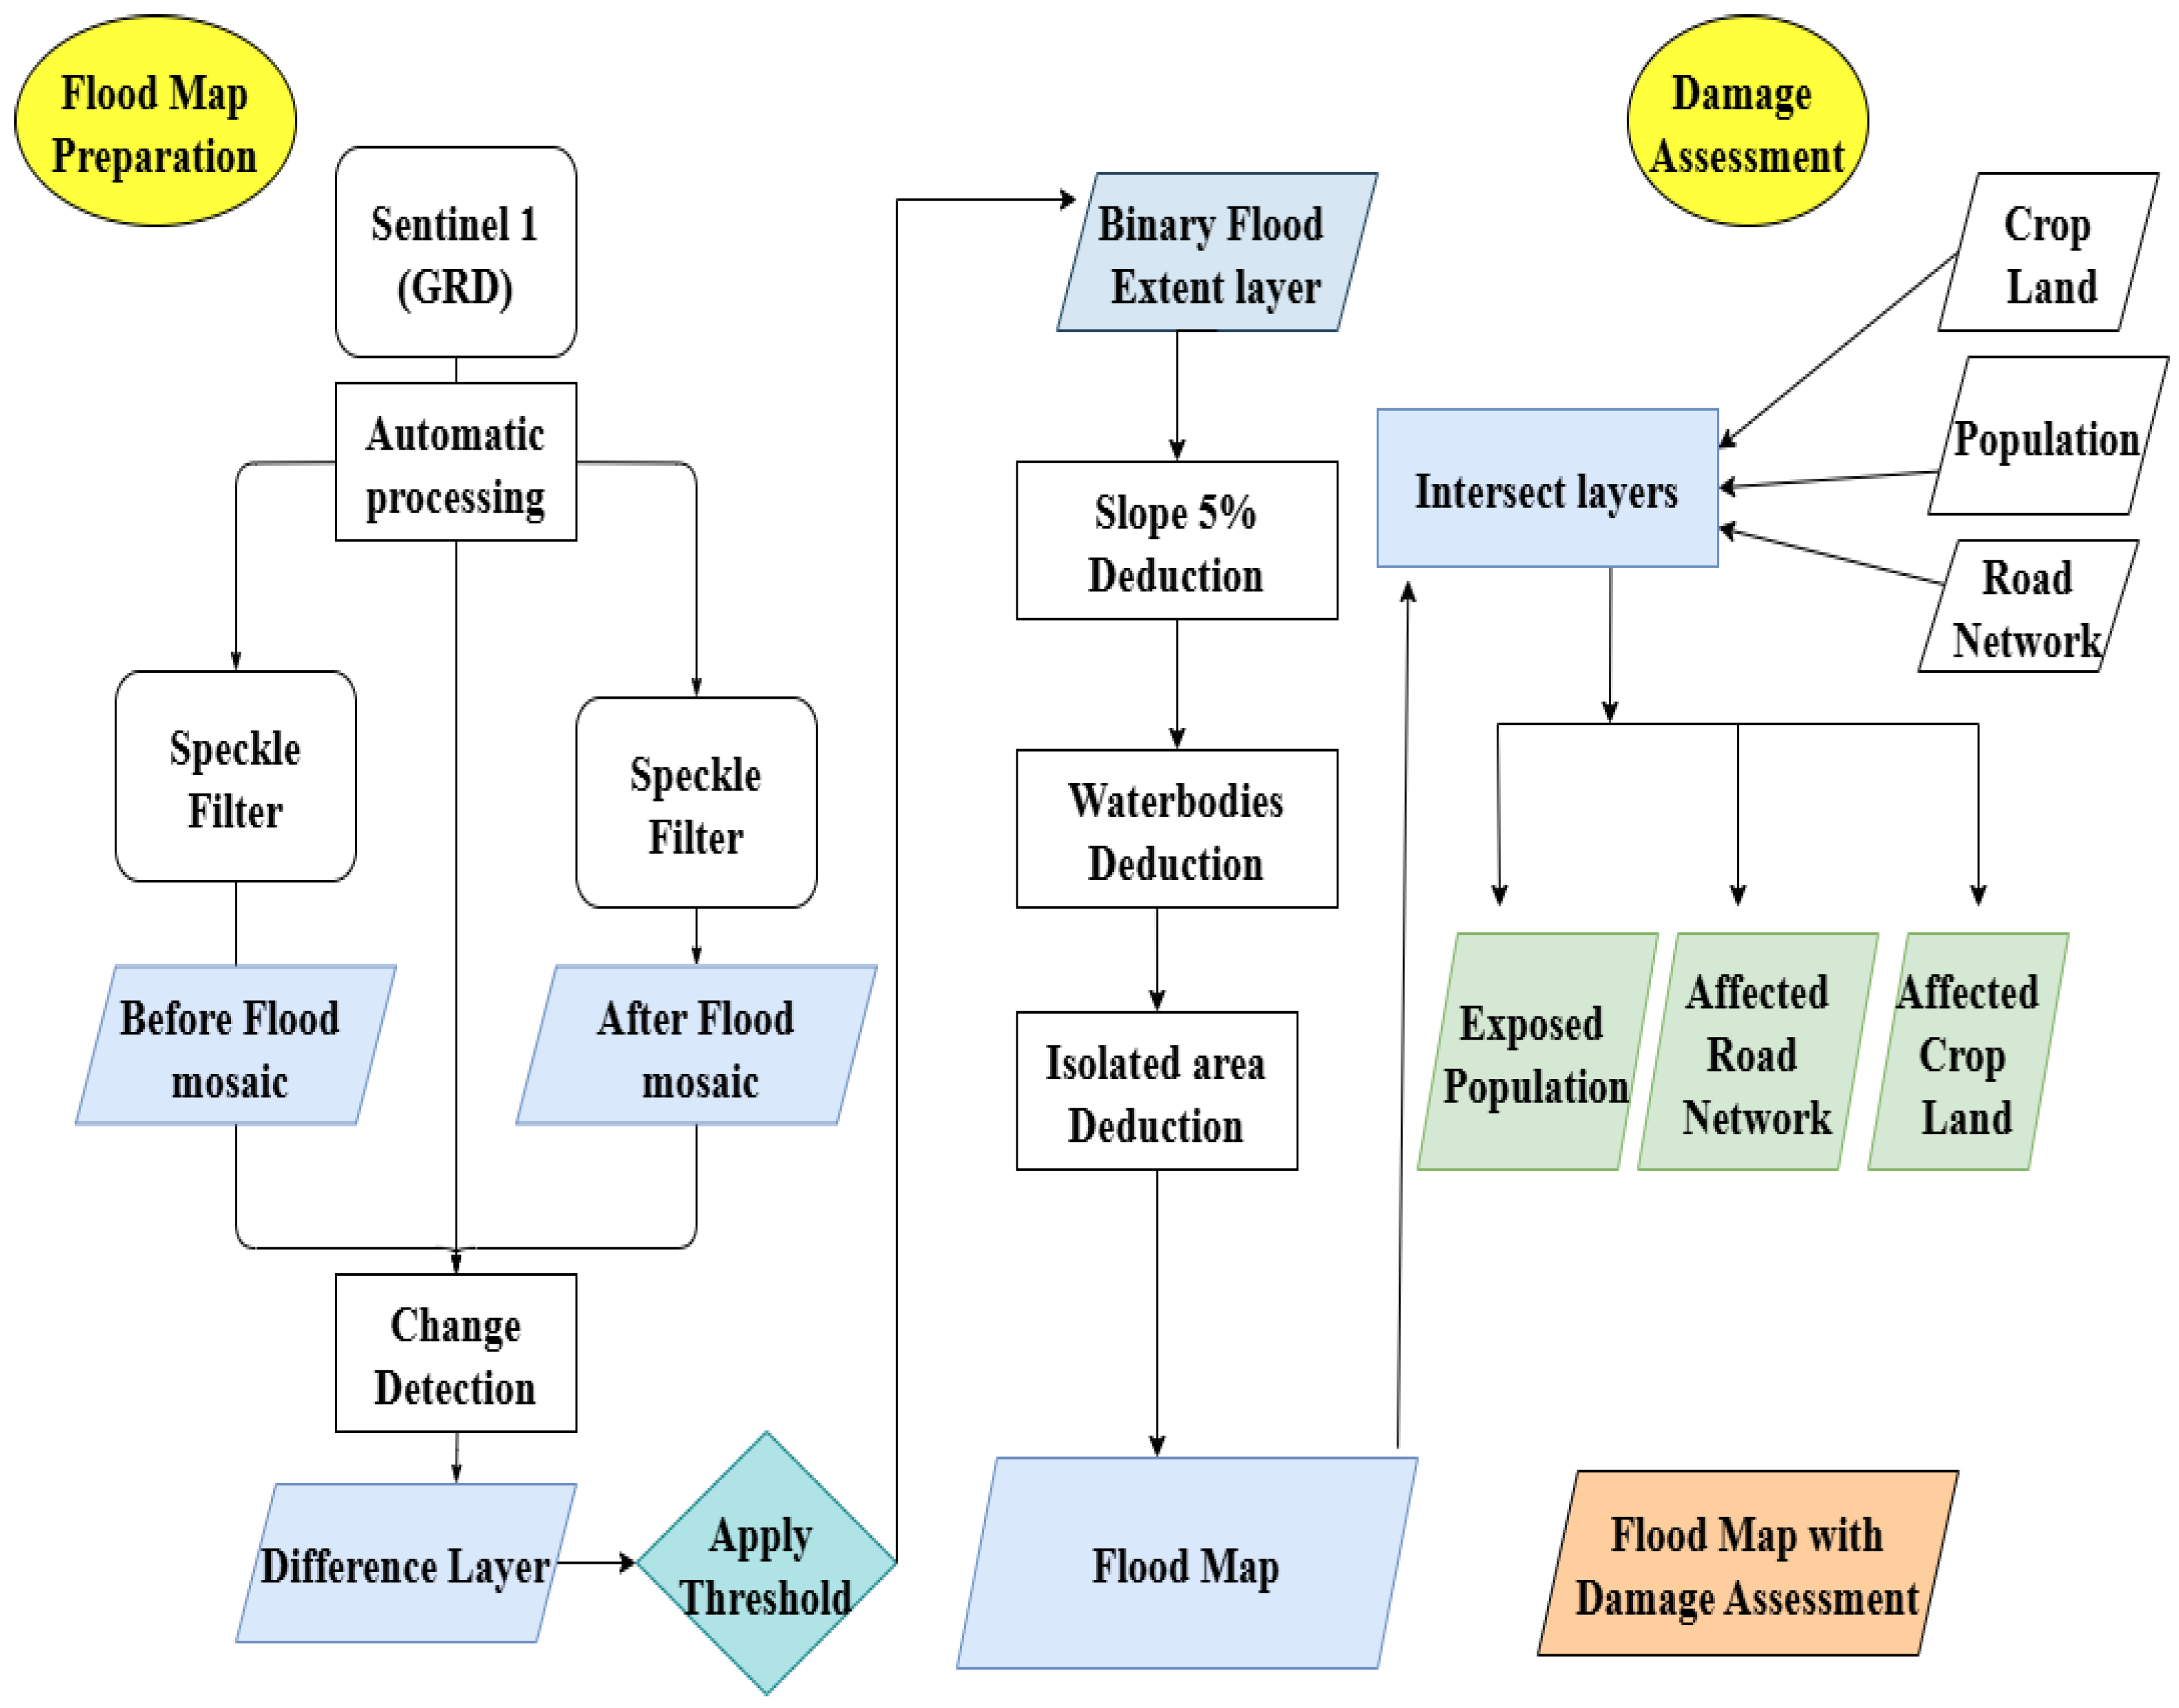
This study uses the Sentinel-1 C band in interferometric wide swath (IW) operational mode in a descending path with VH polarization for the flood map preparation of the study area. The basic steps of flood map preparation and damage assessment are illustrated in Figure 2. The Sentinel-1 SAR GRD: C-band data for the desired date was imported from the GEE database. The before and after duration of the historical floods of 2019–2023 was obtained from the EM-DAT disaster database [42]. Around 30 images had been processed before the flood map preparation, whereas post-flood image identification varied from 30 to 150. For instance, in 2021 flood map preparation, this study analyzes 31 satellite images to compose before-flood images, while 25 images are used for after-flood map preparation for the duration of one month. The number of images varies depending on the duration of the flood. This study’s flood duration ranges from 1 month to up to three months. Then, this study uses a mosaic filter to combine multiple satellite images into a single mosaic image, combining the before and after flood images. This filter combines numerous satellite images with overlapping and covering a wide area and duration into a single continuous image [43]. The mosaic approach allows for the creation of national-scale maps covering areas around 165,000 km2 or as high as 475,000 km2 [44]. Therefore, it is compatible with composing before- and after-flood images for a vast study area like Bangladesh over a comparatively longer duration, such as several months.
The Sentinel-1 GRD datasets available in GEE are already processed (e.g., thermal noise removal, radiometric calibration, etc.). The combination of the Refined Lee algorithm, Google Earth Engine (GEE), and SAR data makes flood management more comprehensive [35]. This study also uses the Refined Lee algorithm speckle filter for noise removal. This filter enhances the image quality to distinguish between water and non-water areas by reducing the inherent speckle noise in the SAR [45]. This study assigns a 1.25 threshold to develop a raster binary layer to distinguish flooded from non-flooded areas, following the approach established in previous studies. Numerous studies have found that the 1.25 threshold gives reliable results and the least amount of false positives (i.e., identifying non-flooded areas as flooded) and false negatives (i.e., failing to identify actual flooded areas) [29,35,46]. This value was selected to ensure methodological consistency across the entire country and throughout the five-year study period, thereby maintaining harmony among the results. The threshold can also be locally calibrated to enhance regional accuracy, and this adjustment remains an available methodological option upon availability of higher-resolution validation data [46].
To refine the flood extent, areas with a slope greater than 5% were excluded, along with permanent water bodies and isolated patches, to produce the final flood map. The decision to use a 5% slope threshold reflects the predominantly flat terrain of Bangladesh, where most flood-prone zones are found in low-lying, gently sloped areas, with only a small proportion being hilly in the southeast and northeast parts [8]. The probability of a flood increases as the slope of that location decreases [47]. Considering these aspects, this study selects a slope parameter of 5%. By maintaining these thresholds, the study ensures uniformity for analysis at both the national level and over multiple years. Nonetheless, both the flood and slope thresholds can be recalibrated as needed to suit local conditions better, address unique hydrological or topographical features, or align with specific study objectives.
Identifying and deducting the permanent water bodies in a highly deltaic environment, such as the study area, is crucial due to seasonal fluctuations, river migration, and the presence of numerous small ephemeral water features. To address this issue, this study identified permanent water bodies using the JRC Global Surface Water Mapping Layers, v1.4, specifically by leveraging the ‘seasonality’ band. A threshold of 8 months was applied to the ‘seasonality’ band to delineate permanent water bodies. This threshold is selected in the context of Bangladesh, where large rivers and major water bodies tend to persist throughout the monsoon and dry seasons. A multi-month composite helps filter out short-term inundation while capturing the core permanent water network. However, this threshold is also flexible and can be modified as needed, depending on the hydrological context or specific study objectives.

2.4. Damage Assessment

The GEE database’s Global Settlement Characteristics (GHSL) layer was used to calculate the population. This dataset represents human settlements at a 250 m resolution. Then, the flood extent layer derived from a Sentinel-1 image was used to identify the flooded area. To ensure spatial harmonization, the reproject() function was used to transform the flood layer from its original resolution to the 250 m resolution of the GHSL data. This step is crucial to ensure spatial consistency between the two layers. Then, for population exposure calculation, the updateMask() function was applied twice: first to the flood extent and then to ensure that only cells with population data were included. A masked population layer was created by applying the reprojected flood data to the population density layer data. This step identifies the exposed population in the flooded area. The reduceRegion() function was used to calculate the total population. This function sums all the pixel values in the exposed population raster within the study area.
MCD12Q1.061 MODIS Land Cover Type Yearly Global 500 m GEE database was used for affected cropland calculation. This is a combined Terra and Aqua Moderate Resolution Imaging Spectroradiometer (MODIS) Land Cover Type, offering global land cover data at a 500 m resolution. After clipping this layer with the study area, cropland pixels were extracted using class 12 (>60% cropland) and class 14 (40–60% cropland/natural vegetation mosaic). This data was also similarly processed, first for the identification of cropland, then for spatial harmonization, and subsequently for the identification of affected cropland. The extent of the damage was then calculated using a function similar to the calculation of the affected population.
The road network data in shapefile format was collected from the RHD, Bangladesh. It must be uploaded to the GEE database, as it is gathered from different sources. The road dataset was first clipped to the study area. Then, a function called findIntersections() was used to identify the flooded road segments to find the intersection. This function intersects and clips the flooded area with the road and calculates the affected length. Then, the .map() function was used, and a road with an intersection area greater than 0 was considered affected. Then the total affected length was calculated by summing the ‘length_km’ field of all affected road features. The road dataset was in a vector format; therefore, resampling was not necessary, unlike the raster dataset used in the previous analysis. The scale in the reduceRegion() function determines the resolution at which the intersection was calculated, combining both datasets without resampling.

2.5. Near Real-Time Flood Monitoring

Sentinel-1 SAR images were useful for near real-time (NRT) emergency response, as data are freely available within a few hours of capture, which helps to support NRT emergency responses [22,23,46]. The flood monitoring and damage assessment for crop population was modified from the UN-SPIDER Knowledge Portal’s recommended best practices for flood mapping and damage assessment as per the requirement of the study area [46]. An intensive literature review prepared the road damage assessment code. The population and cropland damage assessment code is available for a sample division in S1 (https://code.earthengine.google.com/9297d8f4a52c0a61089e415701d5365b, accessed on 20 March 2025) and the road damage assessment in S2 (https://code.earthengine.google.com/30472c459f6988b5353e5a06b65c28bf?noload=true, accessed on 20 March 2025). Monitoring flooded crops and populations can be done by running the code, as the satellite images are from GEE. However, to monitor and assess the damage of the flood-affected roads, the road data must be uploaded to the GEE platform first to activate the code. This code is replicable and can be applied to the entire study area, but it may take longer to compute. This code can also be used to monitor near-real-time floods and various historical flood events by changing the dates based on the availability of satellite images on the GEE platform.

3. Results

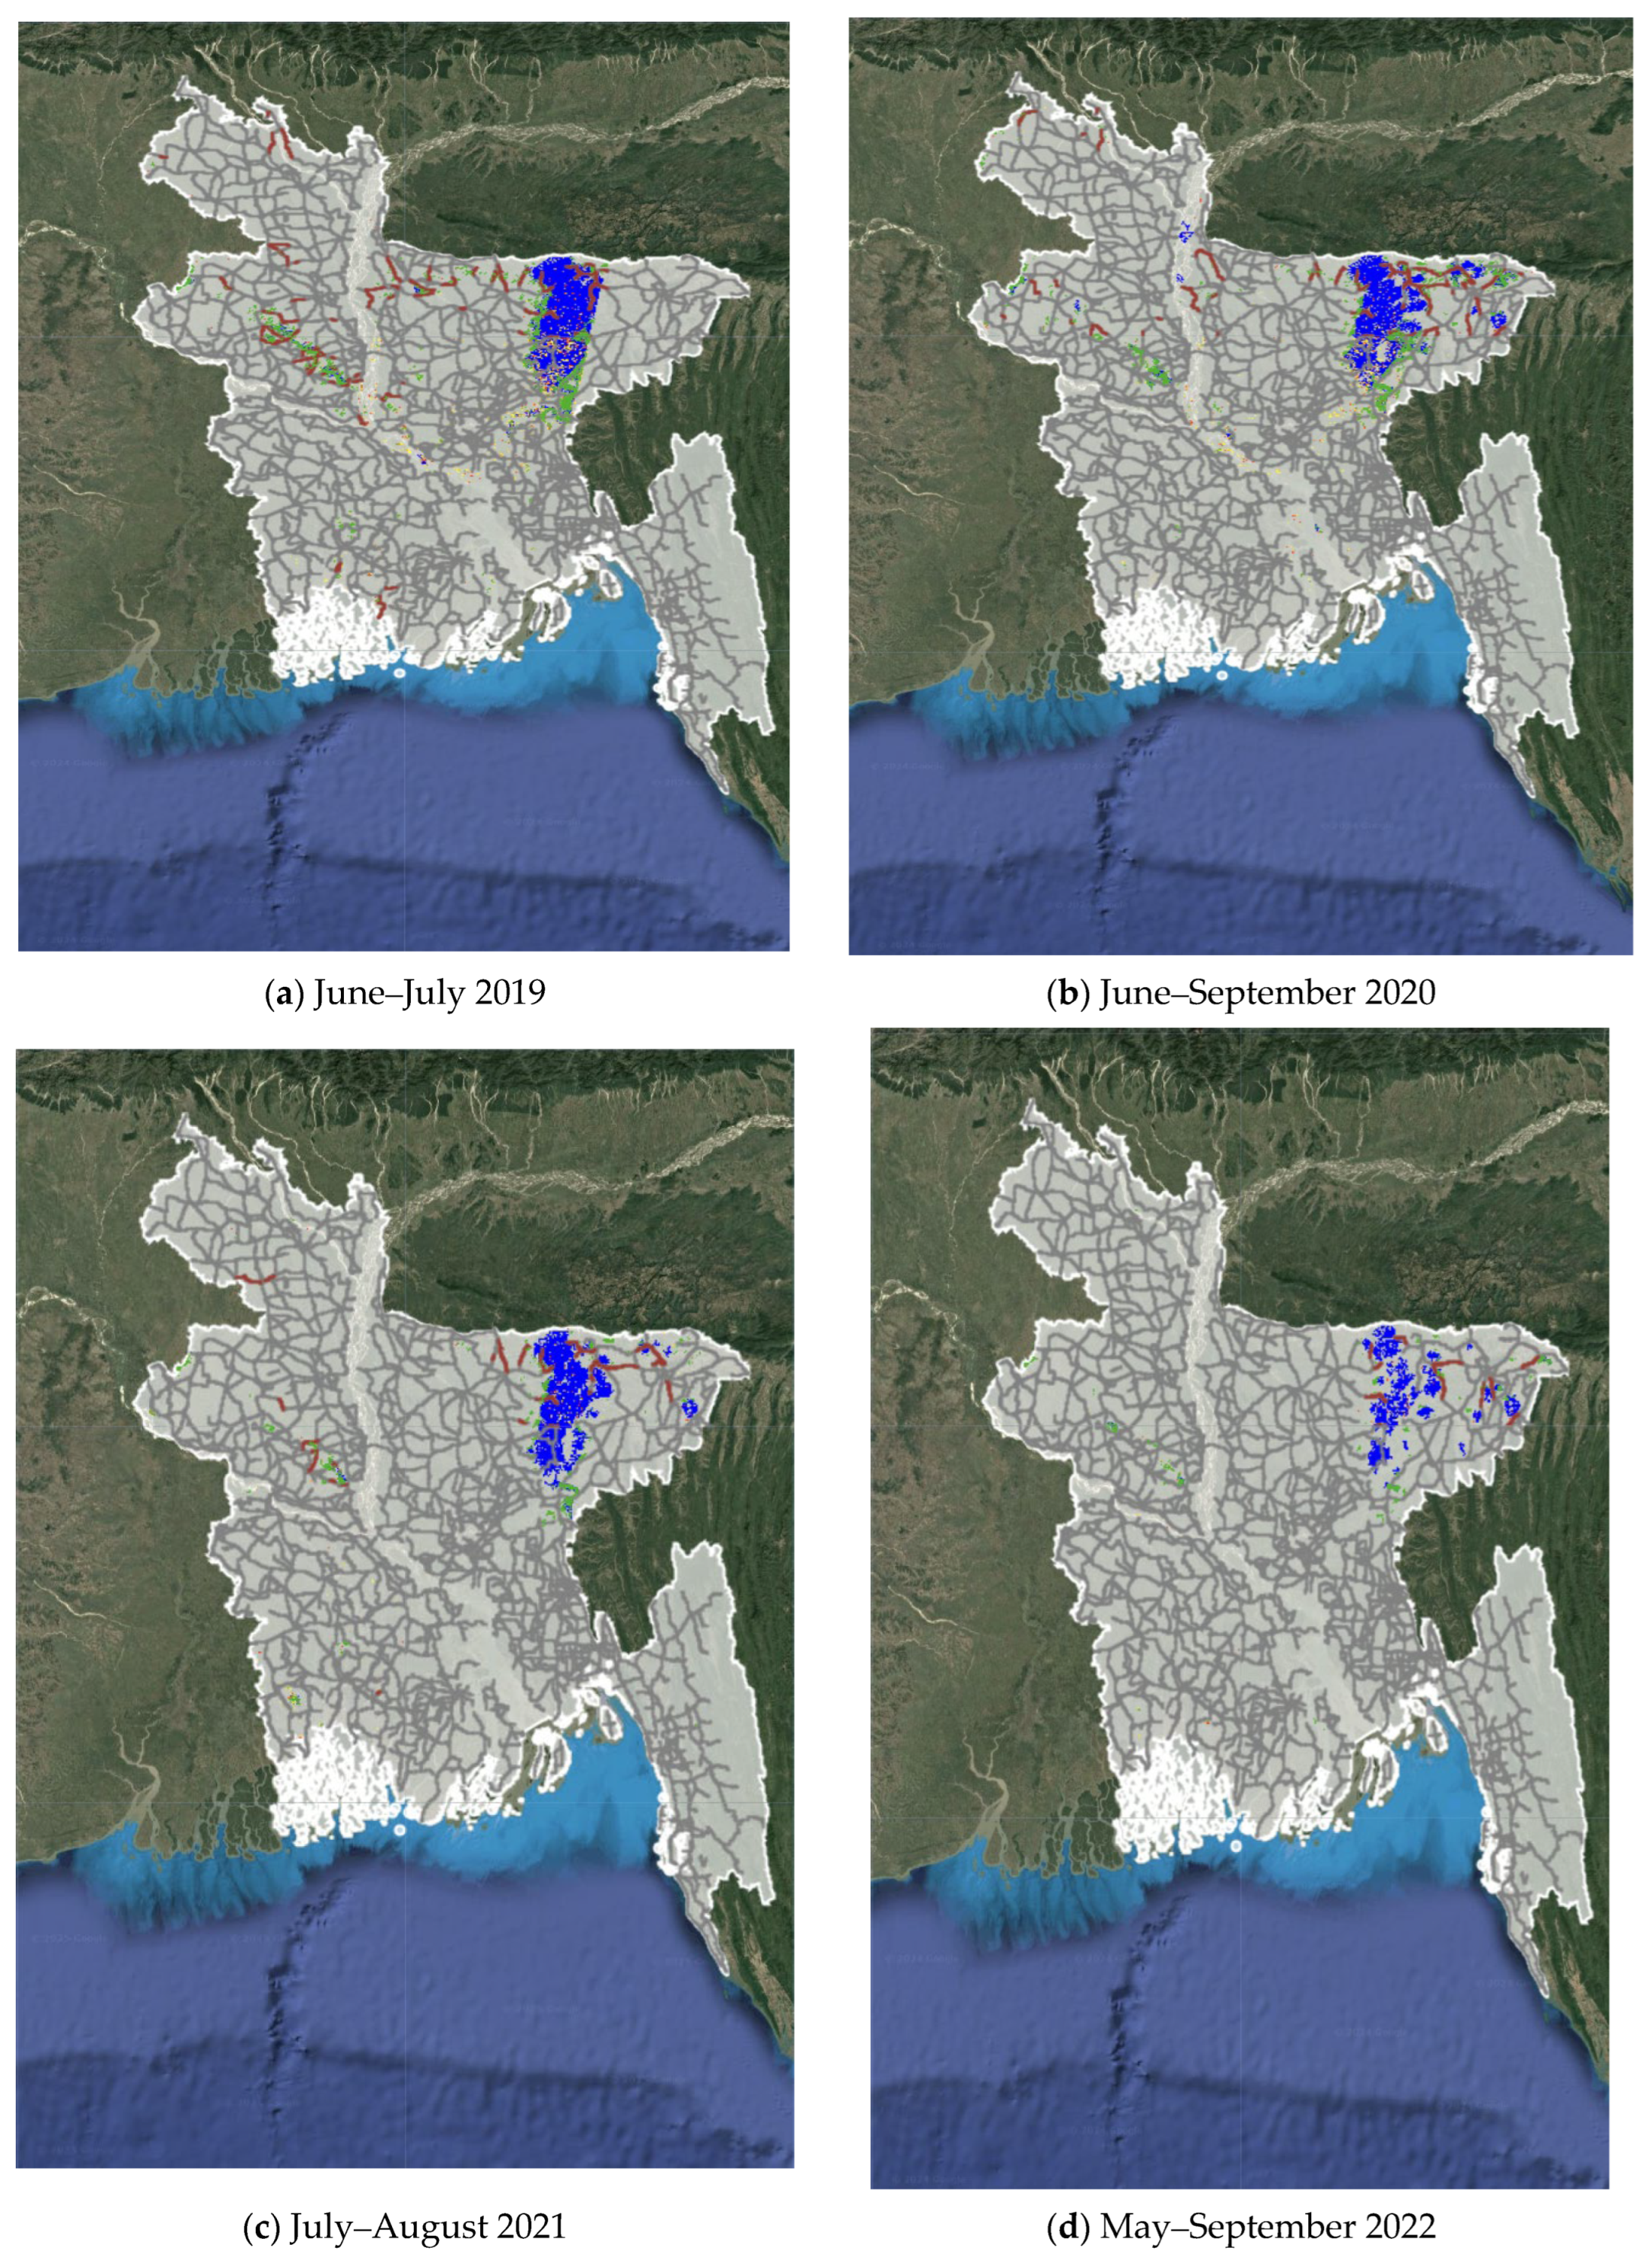
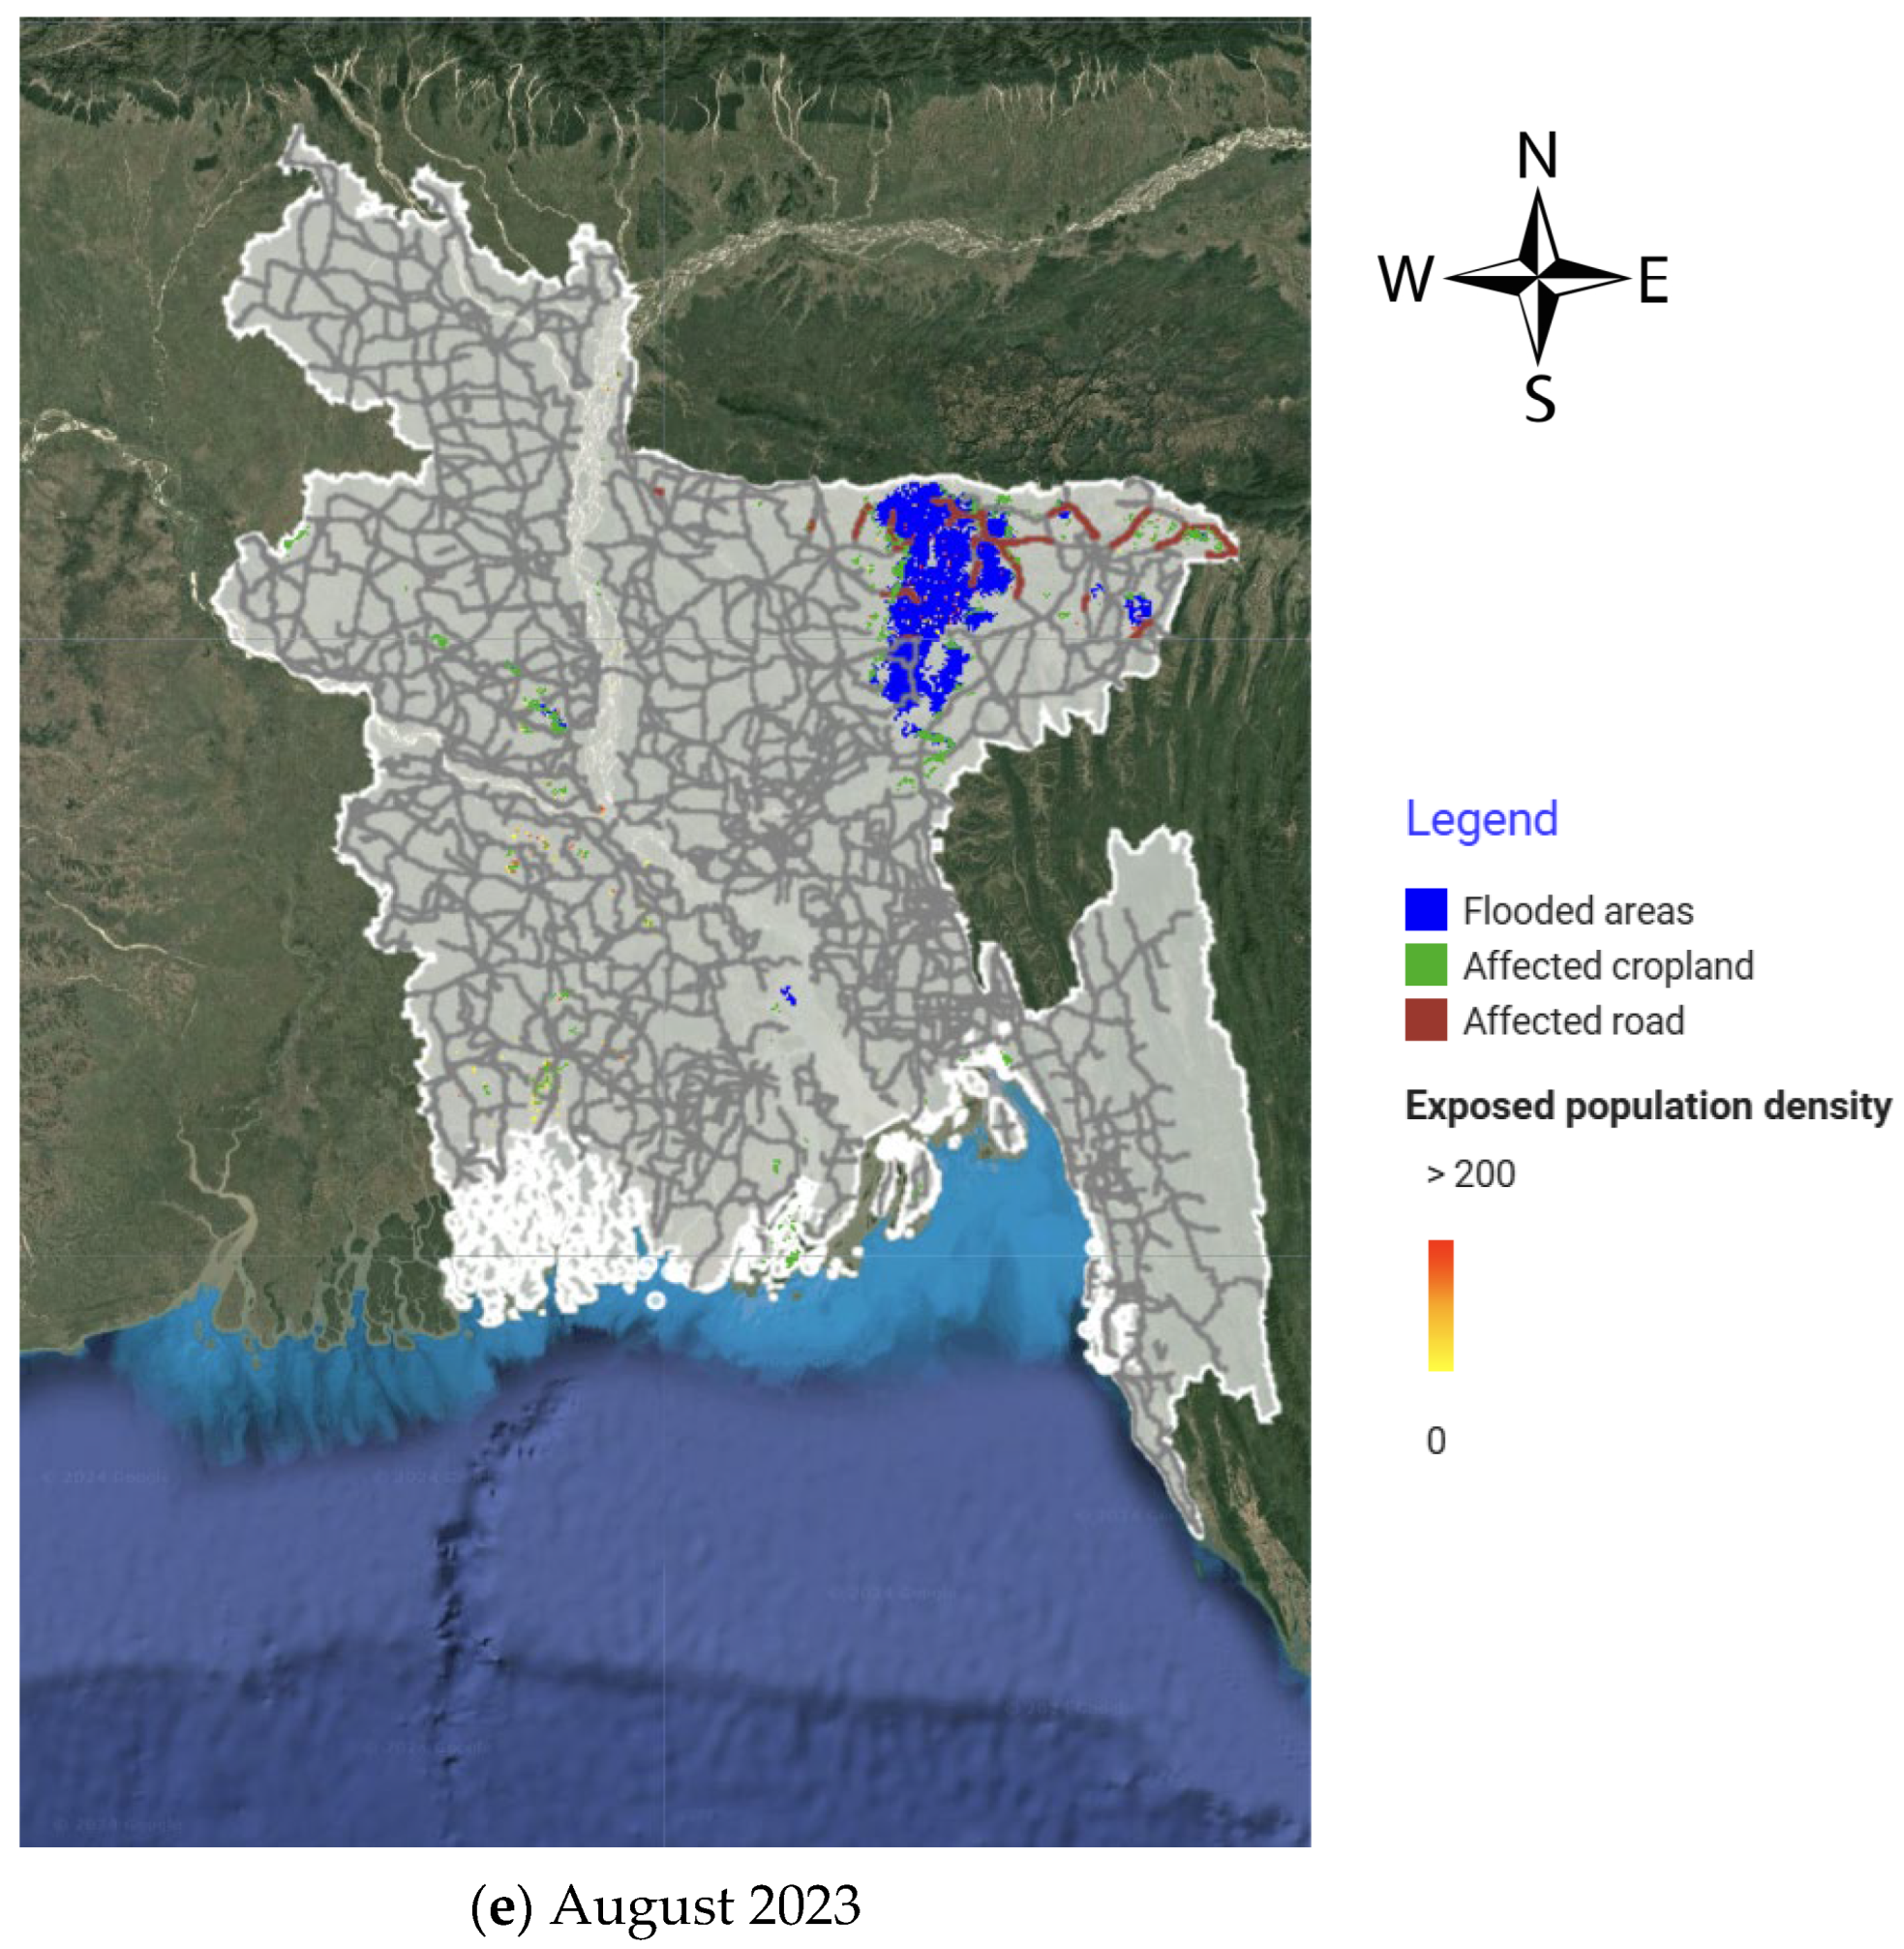
The floods from 2019 to 2023 covered 21.60% of the country, and the extent of cumulative damage in cropland, roads, and exposed people was 6.92%, 18.10%, and 4.16%, respectively (Figure 3). During 2019 and 2020, flood extents were severe over the entire study area, among other floods. During this period, the Sylhet division of Bangladesh was the most affected, followed by the Dhaka-Mymensingh divisions. The 2020, 2019, and 2023 floods covered 5.66%, 5.46%, and 4.21% of the country, respectively (Table 1). The rest of the floods covered over 2.5% of the study area. Throughout this course, these floods critically affected the Sylhet division. In 2023, around 22% of the Sylhet division and 5.93% of the Dhaka-Mymensingh division were covered by floods. This year, 2.53%, 1.24%, 0.60%, and 1.86% of the Rajshahi, Chattogram, Rangpur, and the rest of the study area were flooded, respectively. Similarly, in the 2020 floods, 28.49%, 7.80%, and 6.06% of the Sylhet, Dhaka-Mymensingh, and Rajshahi divisions were inundated, respectively. In 2019, the Sylhet and Dhaka-Mymensingh divisions were again affected critically, covering 16.59% and 9.83% of the land. This year, in the Rajshahi and Chattogram divisions, 7.71% and 2.34% of the area were flooded. In 2021 and 2022, the Sylhet division was again the most flooded area, followed by the Dhaka-Mymensingh divisions. Throughout these years, other divisions, such as Rajshahi, Rangpur, Chattogram, etc., were occasionally affected by floods but not as critically as the Sylhet and Dhaka-Mymensingh divisions.
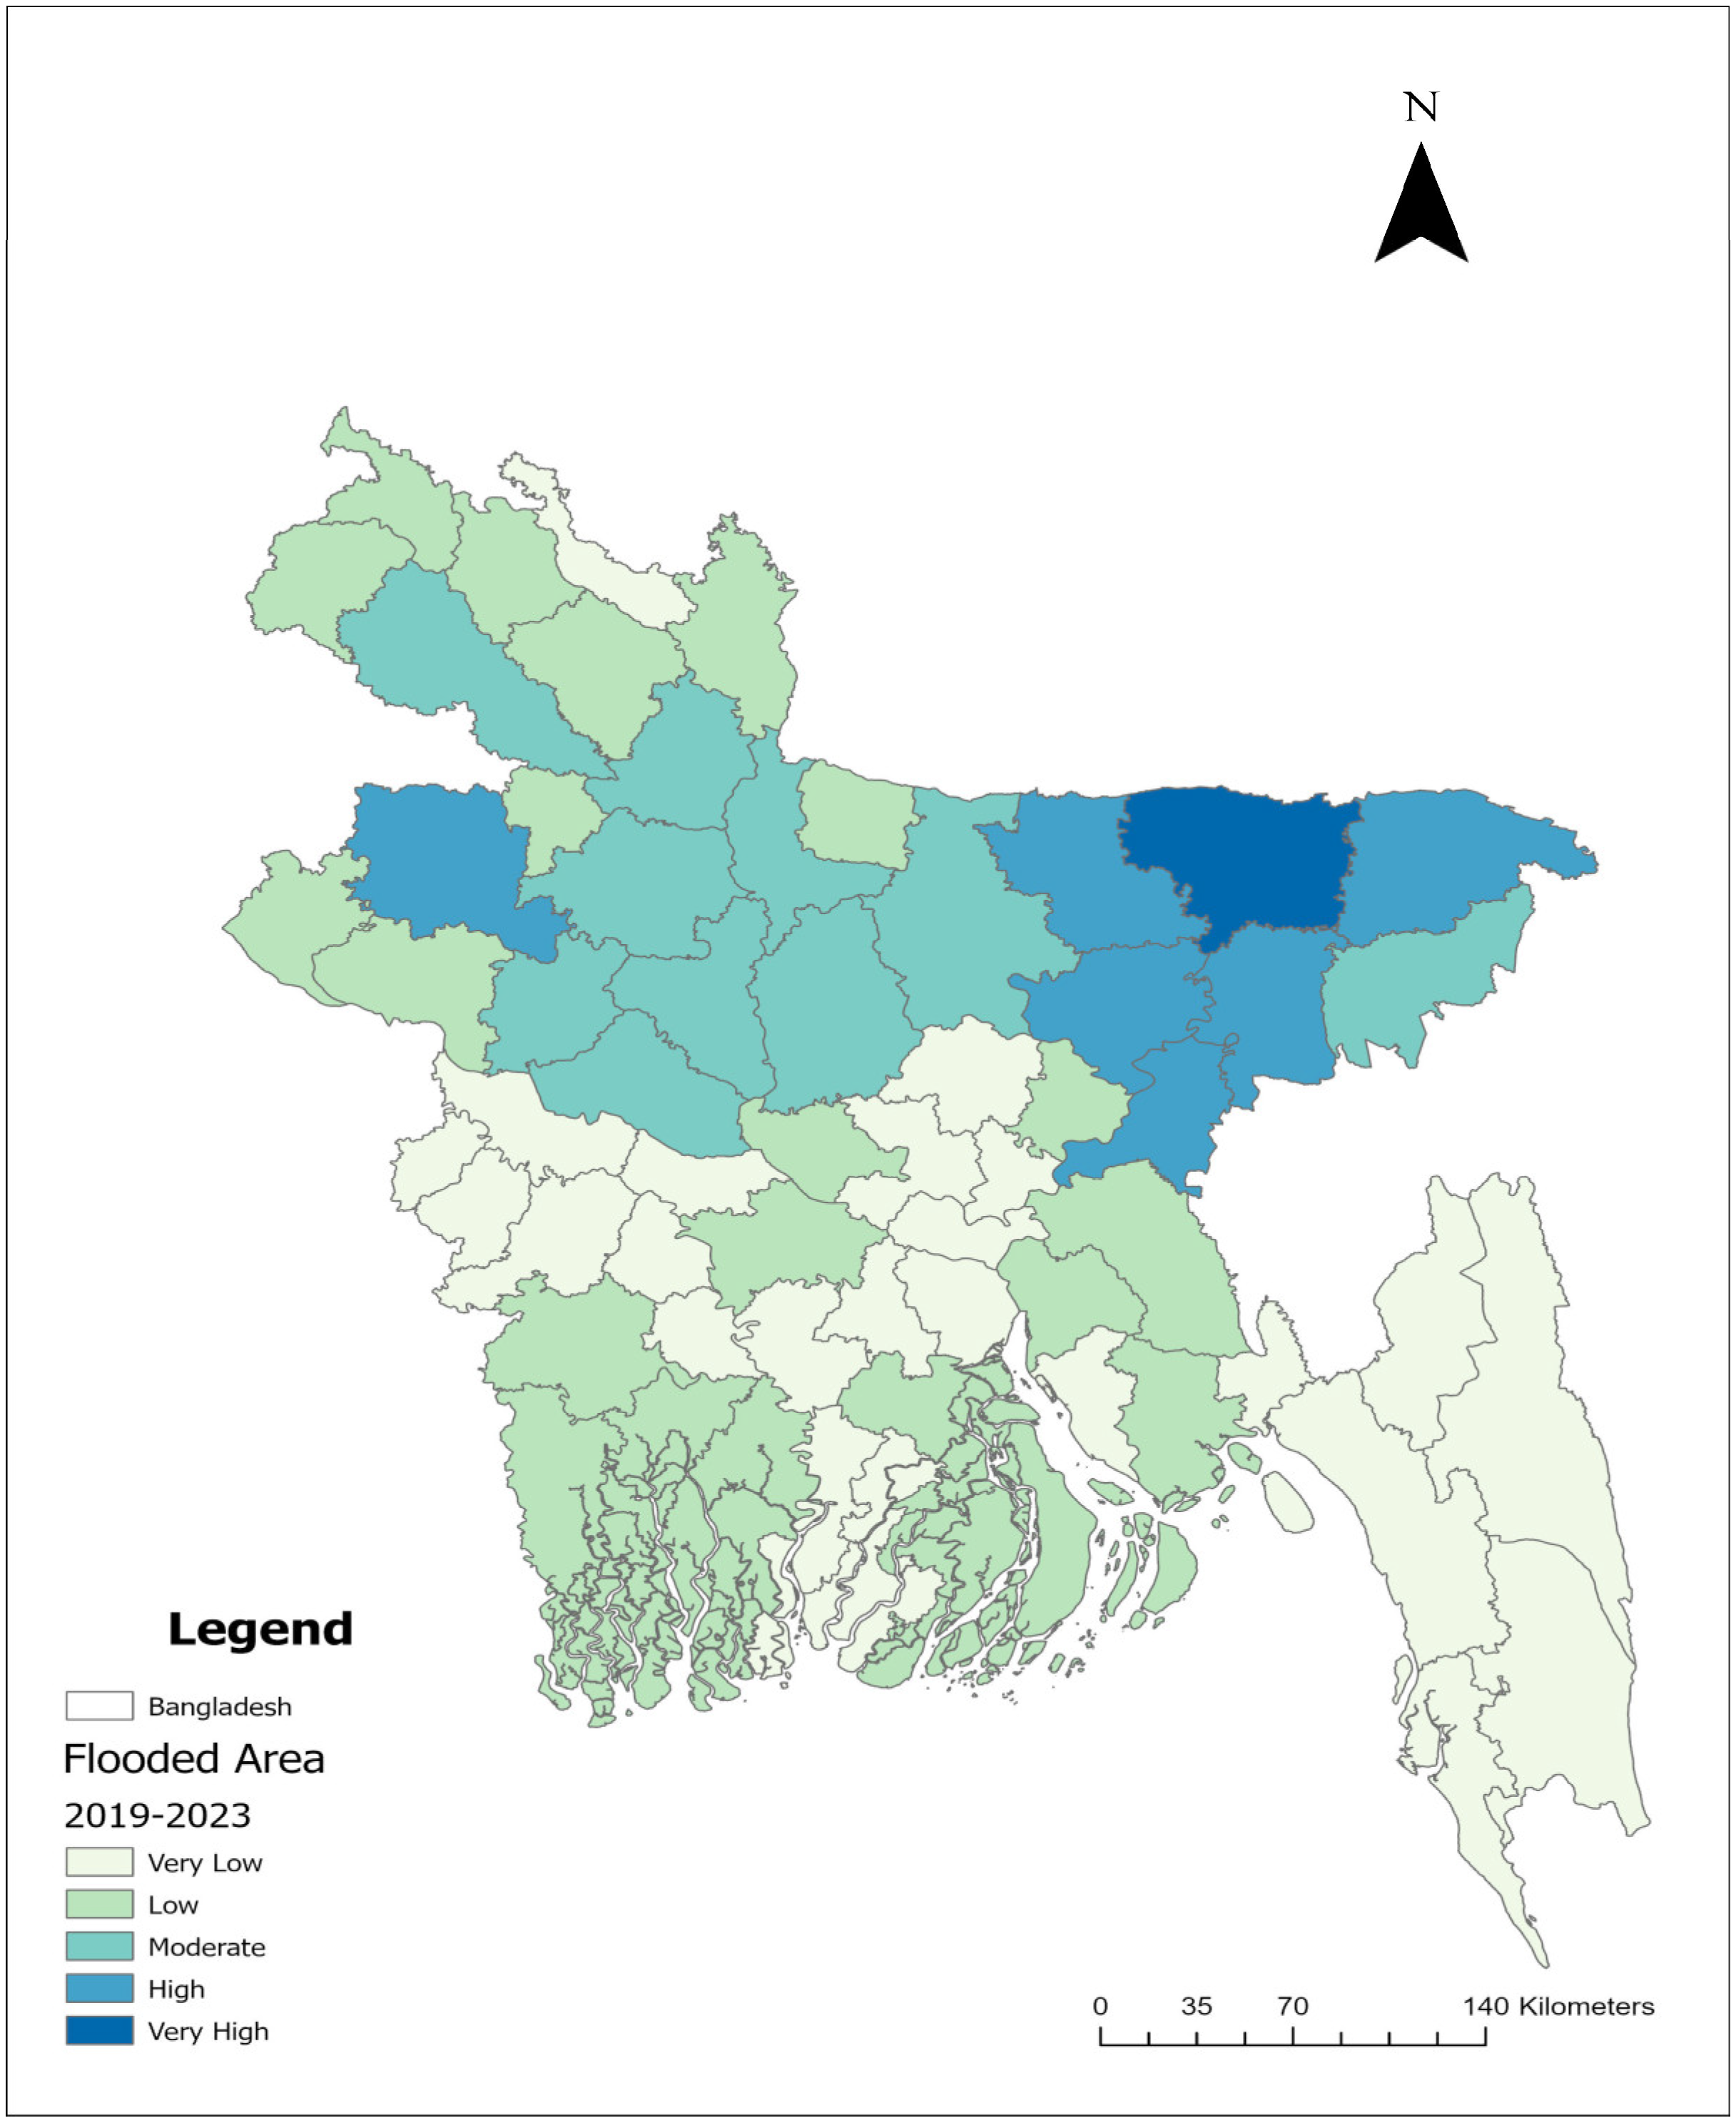
Based on the total affected area within this period, the most affected district was Sunamganj (Figure 4). In the Sylhet division, other districts such as Habiganj and Sylhet were also highly affected by floods. Kishorgonj and Netrokona also remained in the Dhaka-Mymensingh division in the highly affected districts. In the Rajshahi division, the Naogaon districts were highly affected. Pabna, Sirajganj, Gaibandha, Bhola, Barishal, etc., were also affected during these floods. The Chattogram hill tracks remained the region with the least affected during this period.
Usually, the Sylhet division cropland was more affected by floods than other divisions (Table 2). In 2020, around 6.41% of cropland was flooded in this division, which was the highest during this period. In 2023, around 2.70% of cropland was again inundated in the same division. The affected cropland was below 2% in this division during the rest of the period. In terms of crop damage, the Rajshahi division was also highly affected. In 2019 and 2020, over 2.5% of cropland was affected, whereas the rest of the flood affected around 1% in the Rajshahi division. In Dhaka-Mymensingh, 1.92% of cropland was affected in 2019, remaining below 1% during the rest of the period. In the Chattogram division, the affected cropland varied within the 0.5% to 1% range. The cropland of Rangpur and the rest of the divisions was less affected by floods analyzed within this study.
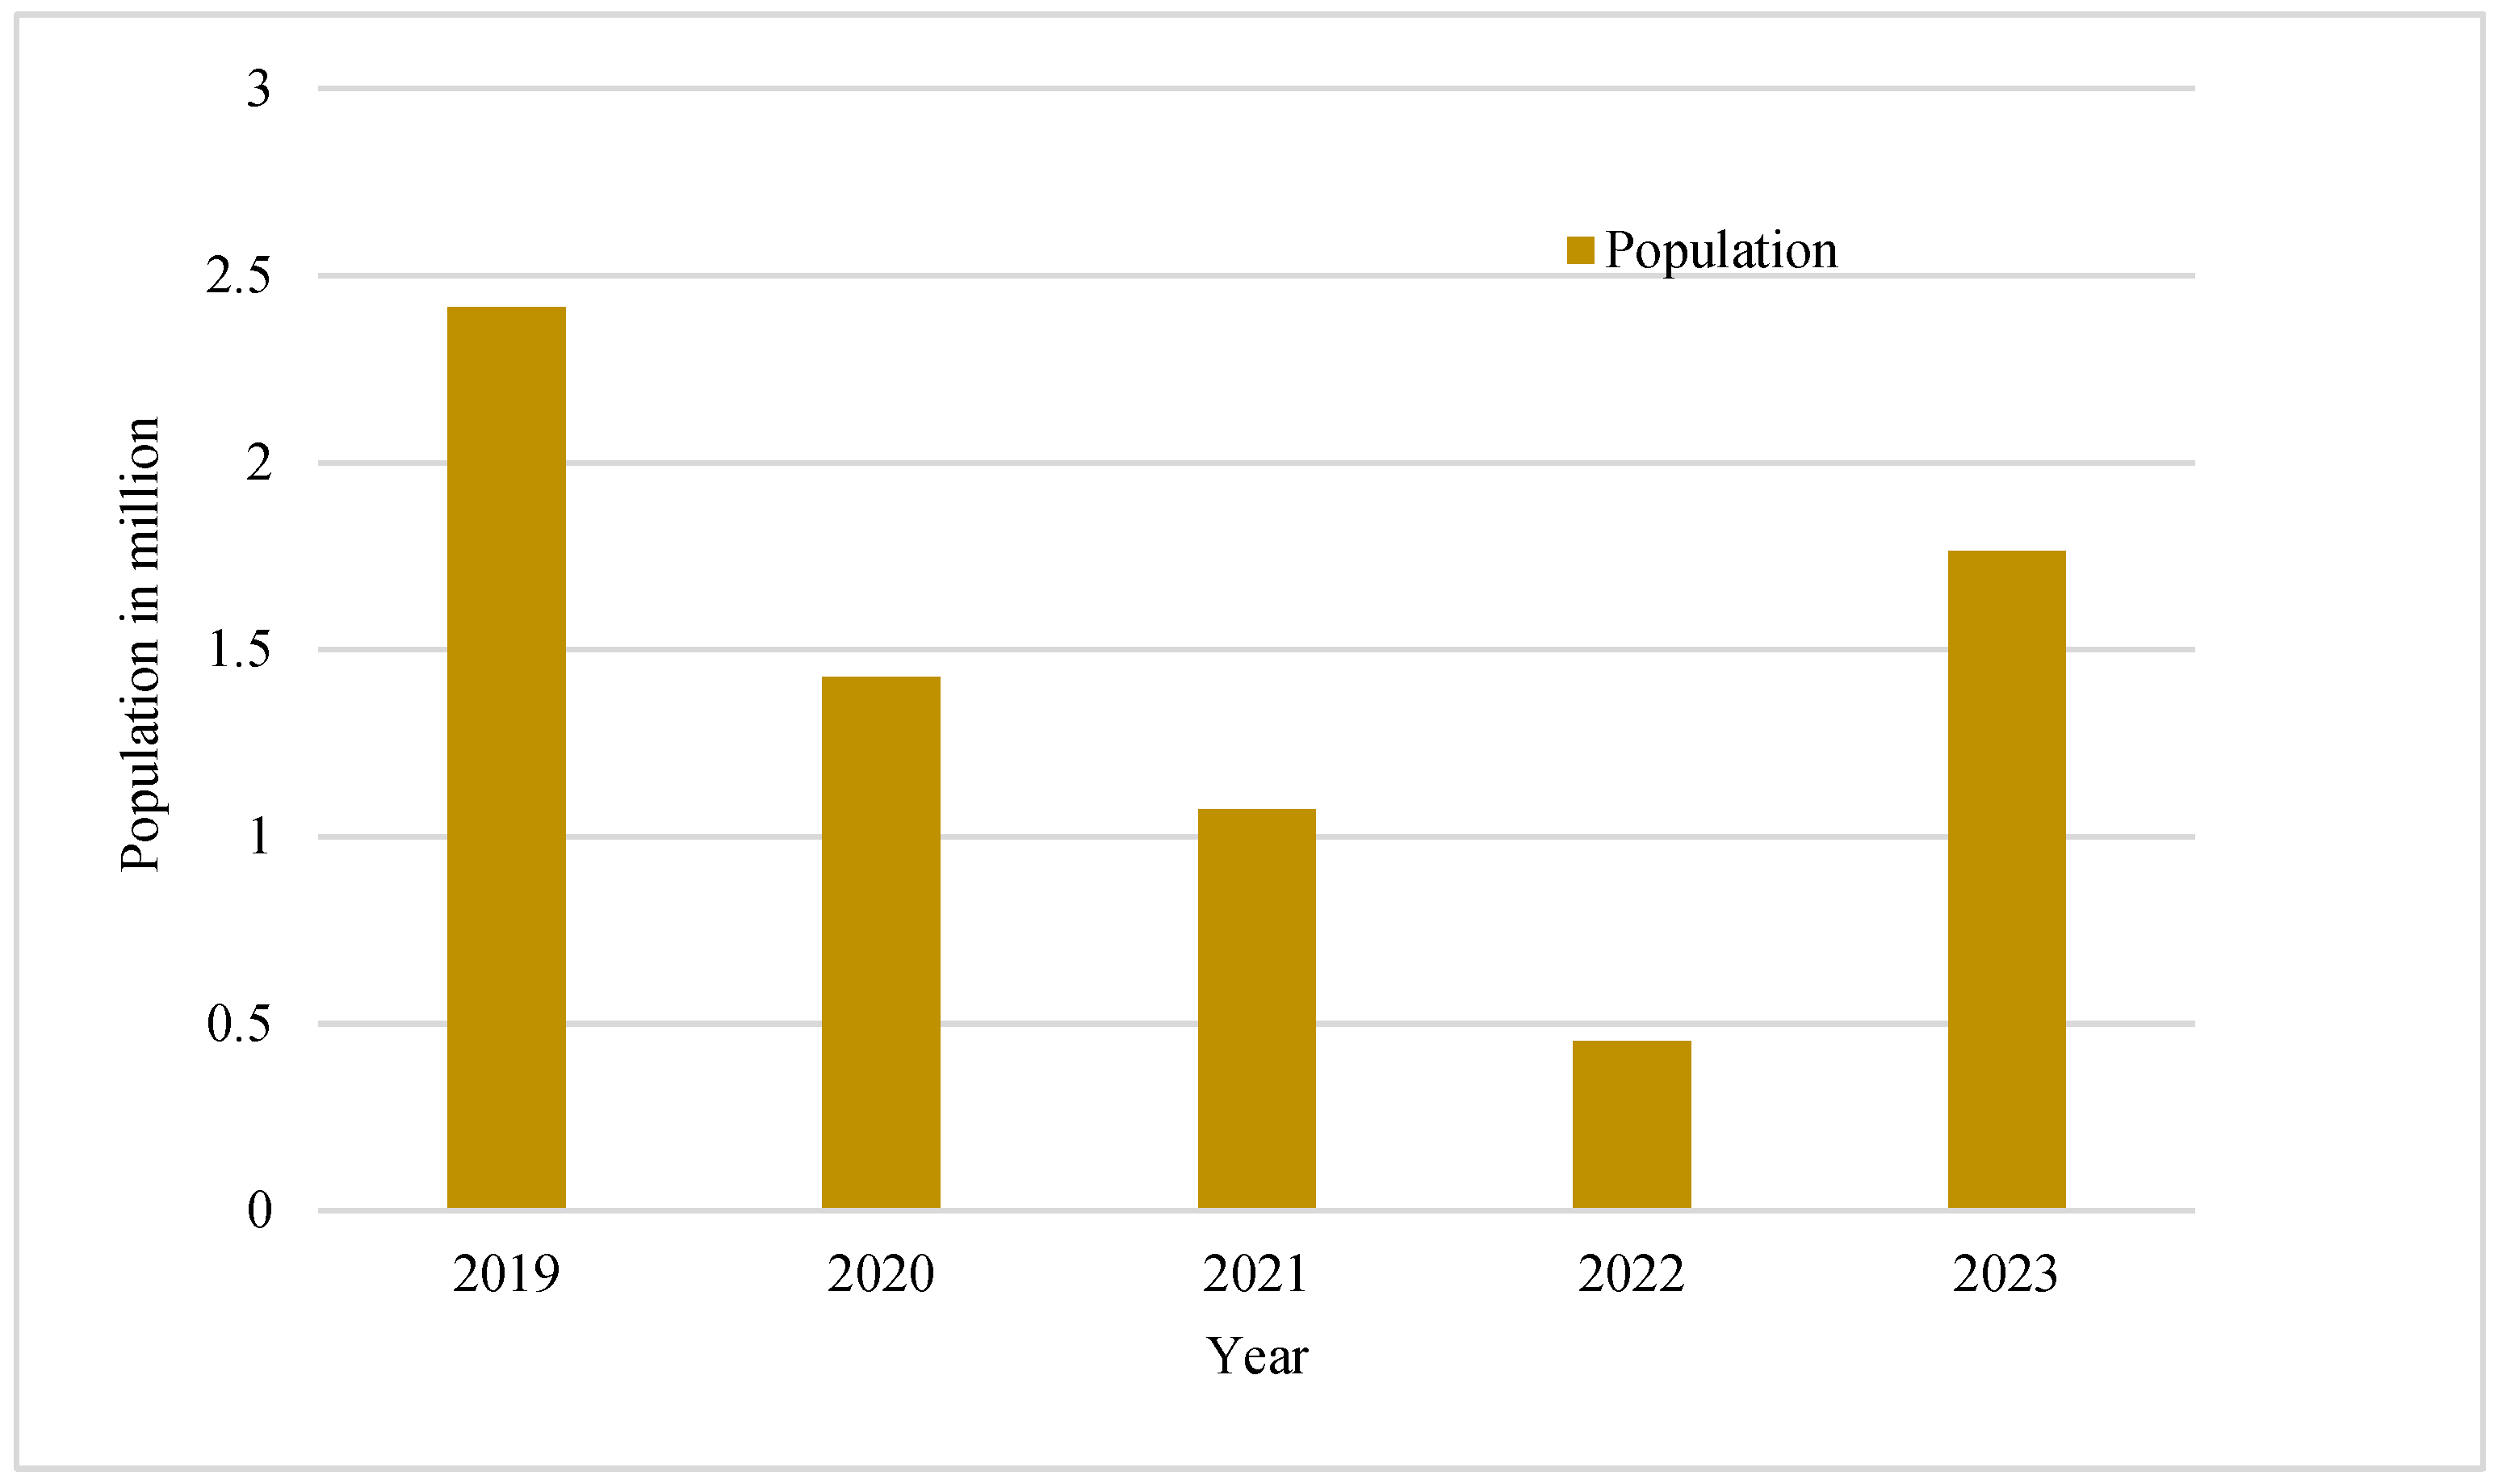
These 5 years of floods affected around 7.13 million people, and each year, on average, it affected around 1.4 million people. In 2019 and 2023, the exposed populations from floods were 2.4 and 1.76 million, respectively (Figure 5). Then, in 2020–2021, the affected population was over 1 million. During 2022, around half a million people were affected, which is the lowest in these five years. Most people were exposed to floods from the Sylhet and Dahak-Mymensingh divisions during this period. In Sylhet, from 2019–2020, around 4 to 5.5% of the population of this division was exposed to floods (Table 3). Due to high population density, the Dhaka-Mymensingh division was also highly affected by the floods, except in 2022. The exposed population of the Dhaka-Mymensingh division was generally in the range of half to one million, which consists of 2.5 to 1% of the population of this division. On average, around 4% of the people of Sylhet and 1% of the population of the Dhaka-Mymensingh divisions were exposed to floods annually. During these floods, the people of other divisions (i.e., Barishal, Khulna) were also highly affected, especially in the 2023 flood, with around 0.74 million people. Around 0.4 to 1% of people were exposed to floods in these coastal divisions during the rest of the floods. Over 1% of people were exposed to floods annually within these two divisions. In 2019, 2020, and 2023, the people of the Rajshahi and Chittagong divisions were also affected by floods.
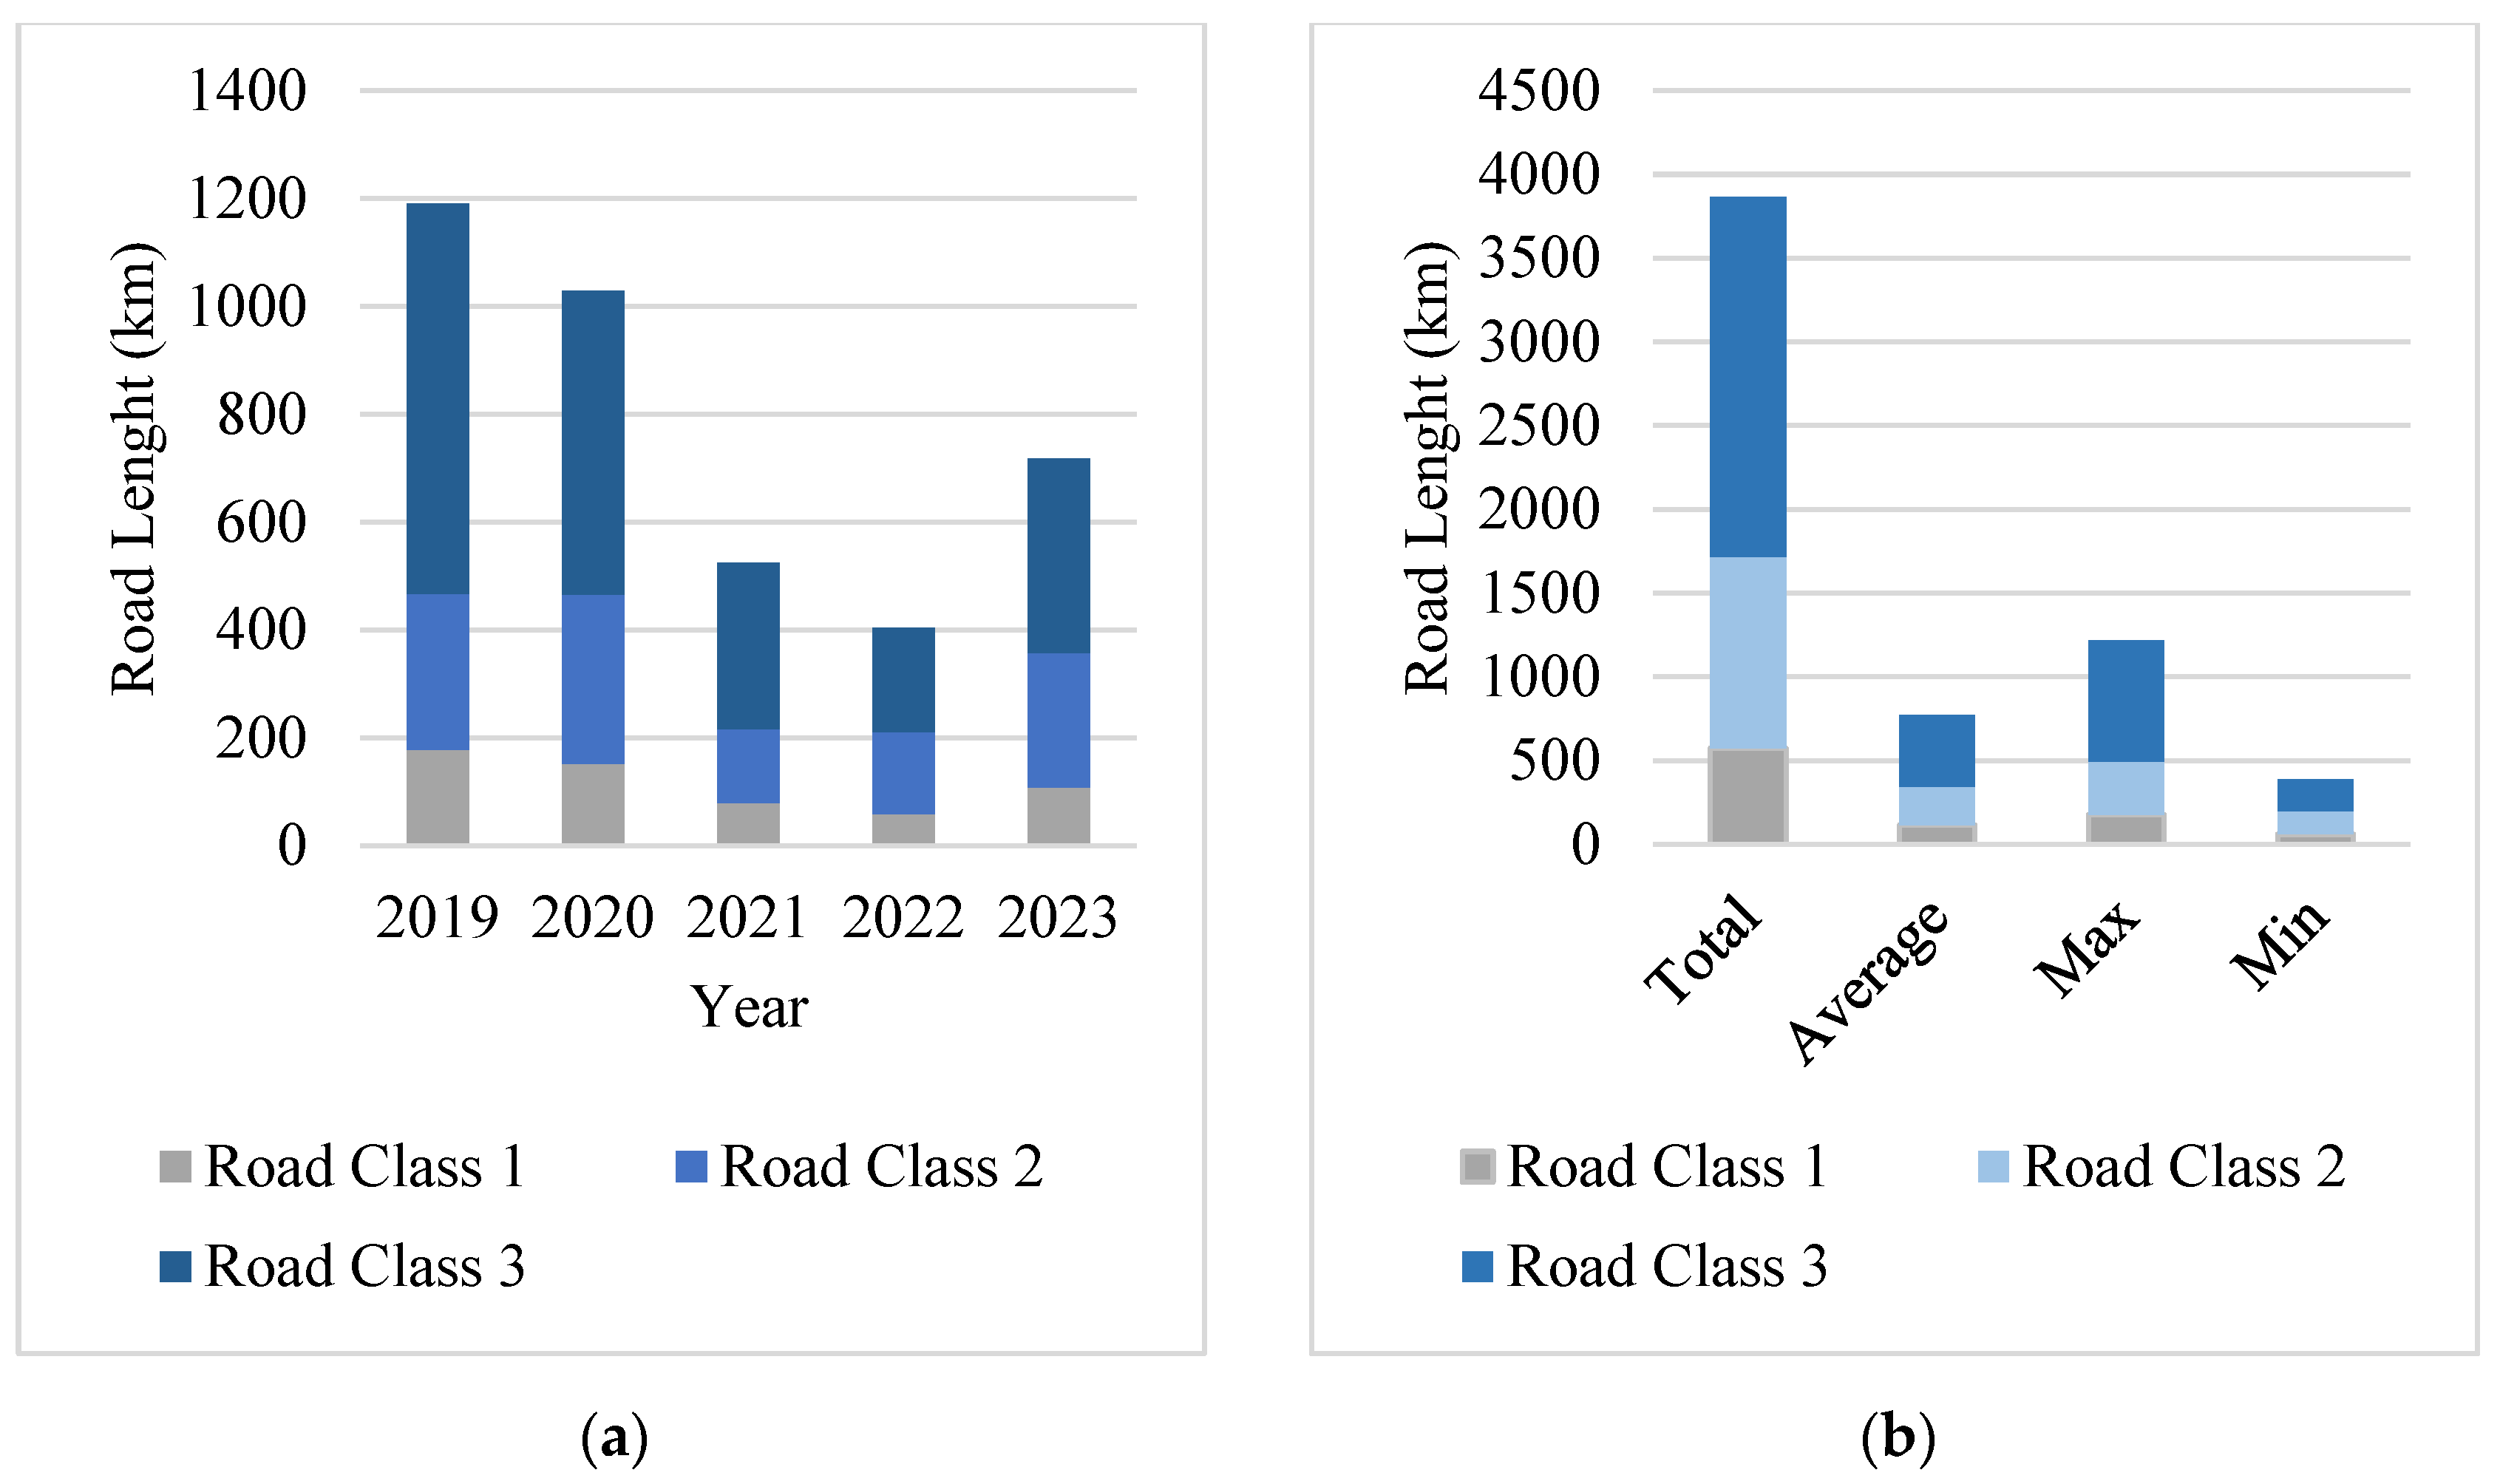
During this period, the cumulative road length affected was 3884 km (18.10%); on average, 776 km (3.62%) was affected from the study area spanning over 21,000 km. In terms of road types, class 1, class 2, and class 3 were affected by 575, 1142, and 2149 km, respectively, in total (Figure 6a). In 2019 and 2020, floods affected around 1196.42 (5.58%) and 1040.43 km (4.48%) of road length, respectively. In 2021 and 2022, the flood affected over 400 km of roads. Figure 6b illustrates the typical and extreme impacts of floods on road infrastructure over a five-year period. Overall, class 3 types of roads were identified as the most affected in terms of affected length, which was around 2416 km, affecting over 400 km annually. The class 2 road was affected over 1100 km during this period and, on average, over 200 km annually. Around 600 km of class 1 road was affected during this period, and around 115 km was affected annually.
Based on location, the road was most affected in the Sylhet and Dhaka-Mymensingh divisions (Table 4). The roads of Sylhet and the Dahak-Mymensingh divisions were affected the most. In 2020 and 2023, Sylhet division’s road length was around 455 and 292 km. In the rest of the floods in this division, the affected road range was within 150 to 200 km. Dhaka-Mymensingh division roads were highly affected during the 2019 flood, with 470 km. In 2020, around 300 km of roads were affected in this division. The roads of Rajshahi and Chattogram were also affected by floods. The other divisions (i.e., Khulna, Barishal) were affected significantly by the 2023 flood. The roads of the Rangpur division remained less affected than those of other divisions during this period.

4. Discussion

Overall, 21.60% of the study area was flooded, with an annual average of 4.32% affected by the floods analyzed in this study. Regarding Cropland, 6.92% of the study areas were inundated, while 1.38% of cropland areas were flooded annually. The Sylhet division was mostly affected by floods, and around 20% of the area was affected annually. The affected cropland, population, and road network remained high in this division during this period. Therefore, this study recommends that the Sylhet division require more attention to flood mitigation policy regarding roads, population, and cropland, especially in the Sunamganj district. The Dhaka-Mymensingh division was also highly affected by floods, especially since the population of this division was more exposed to floods than the rest of the country. Dhaka is the country’s capital and most densely populated area; as a result, the population exposed to floods remained significantly high in the Dhaka-Mymensingh division. The Dhaka-Mymensingh division also receives significant damage from floods. Attention is also needed to ensure prompt evacuation and sufficient flood shelters in most affected districts, such as Netrokona, Kishoreganj, etc. The flood affected the Rajshahi division, where districts such as Naogaon, Sirajganj, etc., were more affected than the rest of the divisions, so these affected districts require attention in flood mitigation. In the Chattogram divisions, districts like Cumilla, Chandpur, Noakhali, etc., were affected by floods, and the hill tracks remain the least affected by floods. The other divisions (i.e., Barishal and Khulna) were also affected, especially the coastal regions such as Satkhira, Bhola, Patuakhali, etc., which were more affected than other parts of these divisions. In coastal divisions, the districts near the coast were more vulnerable than the entire divisions; therefore, special attention was needed for the flood shelters in coastal regions (e.g., Bhola, Patuakhali, etc.). In the Rangpur division, districts like Gaibandha need special attention for floods rather than the entire division. As per this study’s findings, it will be helpful to allocate sufficient flood shelters or to identify designated emergency evaculations, especially for the regions with the most affected people (e.g., Sylhet, Dhaka-Mymensingh) or in coastal regions (e.g., Bhola, Barishal) to reduce the number of casualties during floods. In terms of cropland, based on this study’s findings, the cropland from Sylhet, Rajshahi, and Dhaka-Mymensingh needs more attention, especially from the Sylhet divisions’ farmers, who need special incentives to recover from the devastating crop damage from repeated floods. In post-flood rehabilitation prioritization in the agriculture sector, this information could be utilized to prioritize among different divisions. Overall, the Sylhet division and some parts of the Dhaka-Mymensingh division were highly affected by floods; therefore, these two regions need special attention for overall flood management regarding roads, crops, and population. In the case of other divisions, instead of the overall division, specific districts require attention for flood mitigation.
The floods not only cause damage to the structures, force people to migrate, and adversely influence their livelihood. This study identified that around 7.13 million people were exposed to flood threats. These 5 years of floods caused the deaths of around 537 people [42]. This study identified that over half a million croplands were devastated during this period. It adversely affects farmers and the rural economy. Bangladesh has 16.5 million farmers, which constitutes around 28% of the population and contributes to 40% of the national economy [48]. The data generated in this study can support the development of flood disaster recovery strategies aimed at assisting the rural economy and affected farmers. This study method is replicable and could generate a historical flood map from 2014 to the present or near real-time, upon the availability of satellite images. The disaster mitigation authority of the country could identify which location needs attention from frequent flooding through near-real-time monitoring for emergency route selection, relief distribution, etc. This methodology could also help assess damage such as flooded road length, damaged crop area, and flooded population assessment, which could contribute to emergency situation budget allocation or estimation of relief. This study’s information could help prioritize highly vulnerable flooded regions, especially useful for countries with budget constraints in long-term flood adaptation policies to ensure safety for populations, management of cropland, and smooth communication through roads.
Validation of remote sensing-based flood mapping in Bangladesh presents significant challenges due to the limited availability and reliability of ground-truth and ancillary data. In Bangladesh, the assessment of flooded areas is frequently conducted using traditional survey techniques, which are widely recognized as a major limitation for effective flood management [49]. Field data collection during disasters is particularly challenging, further constraining the availability of reliable validation data [32]. As a result, opportunities to compare the results of this study with existing datasets on flood-affected areas, damaged cropland, or affected populations are limited. Moreover, many available reports lack transparency regarding their data collection methodologies and often do not provide detailed temporal information on flood duration. To avoid introducing ambiguity or bias into the validation process, this study refrains from comparison with such datasets and instead validates its results against published studies that utilize similar datasets and methodologies.
Compared with similar past studies, the 2019 June–July flood covered 5.57% of the area, whereas another study using Sentinel-1 images identified the following months’ flooding in the 2019 July–August area as 5.01% of the study area [22]. The flooded road network data is compared with a published report from the 2019 flood (Table 5) [50]. This study identified that in 2019, June to July, 1191 km of road was inundated; the report confirms that 1003.9 km of road length was damaged and needed emergency repair. Therefore, it is evident that around 84% of flooded roads were affected immediately. In Bangladesh, most roads have flexible bituminous pavement, and bitumen is highly susceptible to water. Therefore, it is evident that prolonged floodwater inundation and infiltration adversely affect pavement strength [16]. The traffic loads and environmental conditions (e.g., temperature and moisture content) also influence the deterioration of affected road pavements over time, eventually reducing the road’s structural capacity [15]. Moreover, the extreme changes in moisture content within a pavement structure during floods may lead to an increase in the pore water pressure, and the pore water pressure could significantly impact the bearing capacity and performance of the pavement structure; as a result, this leads towards excessive deformation and failures of the road structures [10,15,51]. Therefore, it is most likely that on Bangladesh roads, the condition of an inundated road degrades more adversely than that of a non-inundated road.
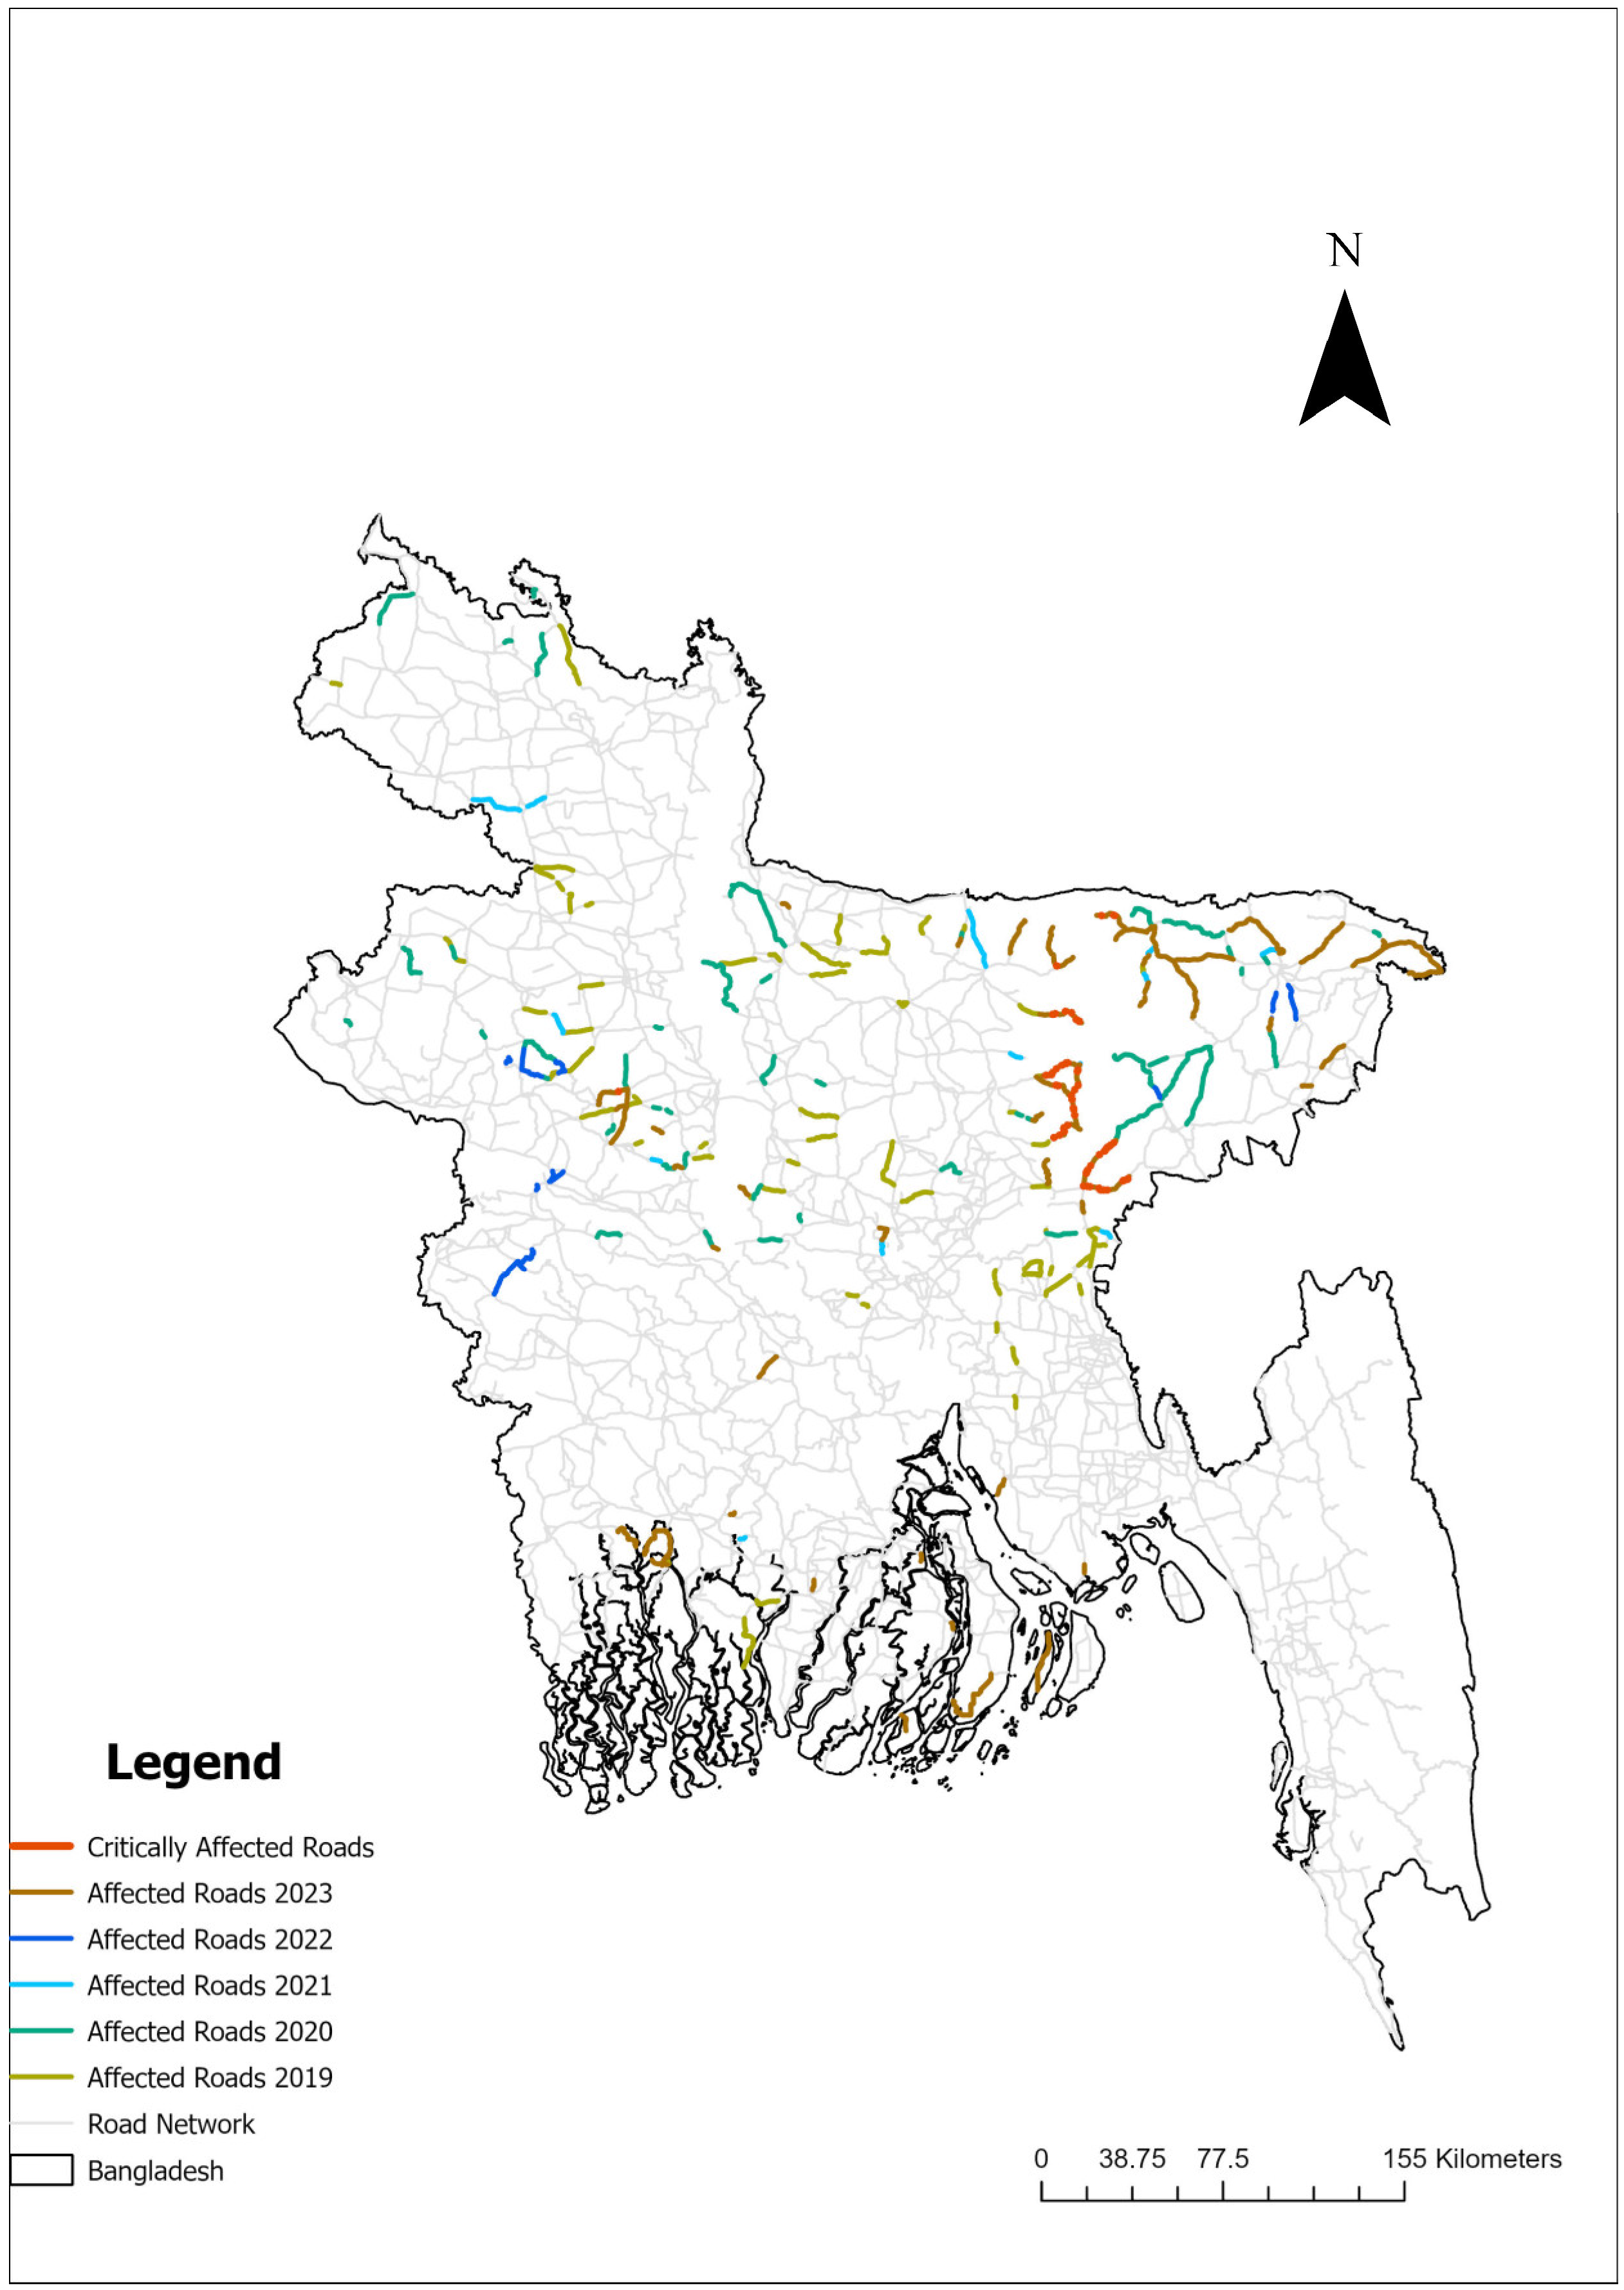
The study area of over 21,000 km of road is affected on average by around 800 km annually. Some road segments appeared more vulnerable to floods, were affected several times, and were assigned as critically affected road sections (Figure 7). These critical segments need further investigation to identify the reason for the repeated impacts. Resources are repeatedly shared in such sections for affected road recovery. This is causing a waste of resources repeatedly, and it is likely that with proper investigation, the cause of this affected portion may be identified. Class 3 types were identified as the most affected road type among the three types of roads. The Class 3 types are Zilla or district roads. This class of road condition is comparatively inferior to that of other road types, consisting of a comparatively higher portion of road with an IRI (International roughness index) greater than 8, and the thickness of this type of road pavement (i.e., 400 mm) is less than that of the other roads; therefore, it is likely getting more affected than other road types [51]. In this road class, the thickness of the bituminous layer is also significantly less than that of other types. In the road pavement design of the class 3 types of roads, especially the affected road segments, the road authority concerned should consider this issue to mitigate the impact of flood damage on road class 3, especially in the flood-affected road segments. On the other hand, Class 1 (i.e., National Highways) type of road has great significance in the economy, and it is often considered the country’s backbone [51]. This road type experiences over 100 km of flood impact each year, which can have a substantial negative effect on the national economy. Therefore, the concerned road authority should also address this issue to resolve the repeated investment of resources in flood-prone regions such as the Sylhet, Dhaka-Mymensingh divisions, etc. However, this study analyzes only 3 types of road networks, but there are other types of roads in the country as well. The road length affected could likely be much higher than estimated in this study, and therefore, the situation could be worse than what this study anticipates. This methodology is extensible to assess flood impacts on additional road types within the study area, contingent upon the availability of relevant spatial datasets.
The National Adaptation Plan Bangladesh Goal 1 ensures protection against climate change-induced disasters like floods. It aims to enhance the adaptability of humans, the economy, and nature with various strategies [12]. Some strategies are protecting and managing vulnerable areas, dredging rivers, constructing flood and drainage management measures, etc. This study result may contribute to identifying the most susceptible areas, settlements, and cropland, as well as taking further mitigative measures for flood mitigation. The Highway Act of 2021 aims to identify the highly climate change-vulnerable road segments to ensure the road networks’ climate-resilient development and emphasizes road drainage [52]. The critical road segment identified in this study will contribute to taking further sustainable measures through further investigation of those segments. The near real-time monitoring of floods will also contribute to ensuring uninterrupted traffic flow by identifying the flooded roads and adapting suitable approaches, such as improving the drainage; otherwise, it may select alternate routes from the relevant unaffected road segment to enhance emergency response.
This study contributes to the development of a comprehensive flood database for the country by leveraging freely available, ready-to-use global datasets such as MCD12Q1.061 MODIS for cropland and the GHSL population layer, combined with higher-resolution Sentinel-1 flood maps to enable prompt assessments. This integrative approach lays a crucial foundation for national-scale flood monitoring. However, future research will benefit from the incorporation of emerging higher-resolution satellite imagery, which holds promise for improving spatial detail and refining assessments in complex landscapes, including fragmented agricultural areas. Additionally, expanding validation efforts through systematic ground-based observations and the integration of locally validated datasets will enhance the robustness and accuracy of the flood database, supporting more precise and detailed flood management.

5. Conclusions

This study demonstrates that while individual flood impacts may appear scattered and insignificant, their cumulative effect across the entire study area is severe. This methodological advancement systematically quantifies the impacts of floods on road infrastructure, cropland, and population, addressing a critical data gap and introducing a replicable workflow for near-real-time flood monitoring and impact assessment. This study provides the first national-scale flood damage database for roads in Bangladesh, covering 2019–2023. By making these data and tools available, the study supports more effective disaster risk mitigation and management, particularly in the road sector, and lays the groundwork for improved emergency response and recovery planning. The near-real-time flood monitoring and damage extent assessment utilizing the GEE platform with high-resolution Sentinel-1 data has great potential in flood hazard mitigation, especially in the road sector and emergency response, such as relief work. The generation of maps does not require downloading massive amounts of data or laborious preprocessing, which significantly reduces the technical and computational barriers for users. This replicable methodology can generate maps swiftly and can be operated with basic coding knowledge, as step-by-step procedures and annotated scripts support the workflow, enabling it to be used by users with basic programming knowledge. This feature is particularly significant in areas where a recognized shortage of advanced technical expertise and resources exists for remote sensing and geospatial analysis. The damage data obtained from GEE can be used for further analysis using ArcGIS, QGIS, and other tools to prepare flood hazard zone maps and evacuation route plans and to inform the adaptation of various mitigation measures. In a country like Bangladesh, it is almost inevitable to prevent floods from happening, and climate change could enhance their magnitude in the future. Therefore, the detailed flood database developed through this study will be used to understand the pattern of historical floods and monitor the events carefully to formulate an adaptive policy to reduce the vulnerability from frequent flooding. A better understanding of the disaster will improve preparedness and identify relevant mitigation measures. This methodology may contribute significantly to Bangladesh’s flood disaster mitigation policy formulation.

Author Contributions

Conceptualization, K.N.C. and H.Y.; methodology, K.N.C. and H.Y.; formal analysis, K.N.C.; investigation, K.N.C.; writing—original draft preparation, K.N.C.; writing—review and editing, K.N.C. and H.Y.; supervision, H.Y.; project administration, H.Y. All authors have read and agreed to the published version of the manuscript.

Funding

This research received no external funding.

Data Availability Statement

The original contributions presented in this study are included in the article. Further inquiries can be directed to the corresponding author.

Conflicts of Interest

The authors declare no conflicts of interest.

Abbreviations

The following abbreviations are used in this manuscript:
EM-DATThe International Disaster Database
ESAEuropean Space Agency
GDPGross Domestic Product
GEEGoogle Earth Engine
GHSLGEE database’s global settlement characteristics
GMBGanges-Brahmaputra-Meghna
GNSS-RGlobal Navigation Satellite System Reflectometry
IRIInternational roughness index
IWInterferometric wide swath
MODISModerate Resolution Imaging Spectroradiometer
NHNational Highways
NRTNear-Real-Time
RHDRoads & Highways Department
RSRemote Sensing
SARSynthetic Aperture Radar
USDThe United States Dollar

References

  1. Jun, R.; Melda, S.; Arga, J. Flood Risk Already Affects 1.81 Billion People. Climate Change and Unplanned Urbanization Could Worsen Exposure. Available online: https://blogs.worldbank.org/en/climatechange/flood-risk-already-affects-181-billion-people-climate-change-and-unplanned (accessed on 26 November 2024).
  2. World Economic Forum. Sea Level Rise Is a GlobalThreat—Here’s Why|World Economic Forum. Available online: https://www.weforum.org/stories/2024/09/rising-sea-levels-global-threat/ (accessed on 26 November 2024).
  3. United Nations Development Program (UNDP). Climate Change’s Impact on Coastal Flooding to Increase 5 Times over This Century, Putting over 70 Million People in the Path of Expanding Floodplains, According to New UNDP and CIL Data|United Nations Development Program. Available online: https://www.undp.org/press-releases/climate-changes-impact-coastal-flooding-increase-5-times-over-century-putting-over-70-million-people-path-expanding-floodplains (accessed on 26 November 2024).
  4. Salas, R.B. Global Economic Loss from Natural Disasters 2023|Statista. Available online: https://www.statista.com/statistics/510922/natural-disasters-globally-and-economic-losses-by-peril/ (accessed on 26 November 2024).
  5. Decadal Average: Annual Number of Deaths from Disasters, World. Available online: https://ourworldindata.org/grapher/decadal-deaths-disasters-type (accessed on 26 November 2024).
  6. Osti, R.; Tanaka, S.; Tokioka, T. Flood Hazard Mapping in Developing Countries: Problems and Prospects. Disaster Prev. Manag. Int. J. 2008, 17, 104–113. [Google Scholar] [CrossRef]
  7. Rana, S.M.S.; Habib, S.A.; Sharifee, M.N.H.; Sultana, N.; Rahman, S.H. Flood Risk Mapping of the Flood-Prone Rangpur Division of Bangladesh Using Remote Sensing and Multi-Criteria Analysis. Nat. Hazards Res. 2024, 4, 20–31. [Google Scholar] [CrossRef]
  8. BWDB 2021 Annual Flood Report, Flood Forecasting and Warning Centre, Processing and Flood Forecasting Circle; Bangladesh Water Development Board: Dhaka, Bangladesh, 2020.
  9. Kabir, H.; Hossen, N. Impacts of Flood and Its Possible Solution in Bangladesh. Disaster Adv. 2019, 12, 48–57. [Google Scholar]
  10. Sultana, M.; Chai, G.; Martin, T.; Chowdhury, S. Modeling the Post flood Short-Term Behavior of Flexible Pavements. J. Transp. Eng. 2016, 142, 04016042. [Google Scholar] [CrossRef]
  11. Baten, A.; González, P.A.; Delgado, R.C. Natural Disasters and Management Systems of Bangladesh from 1972 to 2017: Special Focus on Flood. OmniSci. Multi-Discip. J. 2019, 8, 35–47. [Google Scholar]
  12. Ministry of Environment Forest and Climate Change (MoEF). National Adaptation Plan of Bangladesh; Ministry of Environment, Forestry and Climate Change: Dhaka, Bangladesh, 2022. [Google Scholar]
  13. Amin, M.S.R.; Tamima, U.; Amador, L. Towards Resilient Roads to Storm-Surge Flooding: Case Study of Bangladesh. Int. J. Pavement Eng. 2018, 21, 63–73. [Google Scholar] [CrossRef]
  14. Rahaman, M.O.; Mostafa, T.; Mamun, M.A.A. Scarcity of Road Construction Materials in Bangladesh: Exploring Pavement Recycling Option as a Solution. Int. J. Struct. Civ. Eng. Res. 2020, 9, 25–33. [Google Scholar] [CrossRef]
  15. Elshaer, M.; Daniel, J.S. Impact of Pavement Layer Properties on the Structural Performance of Inundated Flexible Pavements. Transp. Geotech. 2018, 16, 11–20. [Google Scholar] [CrossRef]
  16. Alam, M.J.B.; Zakaria, M. Design and Construction of Roads in Flood-Affected Areas. Eng. Concerns Flood 2008, 99, 91–99. [Google Scholar]
  17. United Nations Economic and Social Commission for Asia and the Pacific (UNESCAP). Sustainable Freight Transport in Bangladesh; United Nations. 2022. Available online: https://repository.unescap.org/bitstream/handle/20.500.12870/5167/ESCAP-2022-RP-Sustainable-Freight-Transport-in-Bangladesh.pdf (accessed on 20 March 2025).
  18. Hossen, N.; Nawaz, S.; Kabir, H. Flood Research in Bangladesh and Future Direction: An Insight From Last Three Decades. Int. J. Disaster Risk Manag. 2022, 4, 15–39. [Google Scholar] [CrossRef]
  19. World Bank. The Cost of Adapting to Extreme Weather Events in a Changing Climate; BANGLADESH Development Series; World Bank: Washington, DC, USA, 2011; pp. 1–21. [Google Scholar]
  20. Ullah, K.; Id, J.Z. GIS-Based Flood Hazard Mapping Using Relative Frequency Ratio Method: A Case Study of Panjkora River Basin, Eastern Hindu Kush. PLoS ONE 2020, 15, e0229153. [Google Scholar] [CrossRef]
  21. Tai, C.V.; Dinh, Q.N.; Ho, T.S.; Viet, N.T. Rapid Assessment of Flood Extent and Damages in Quang Nam Province by Using Sentinel-1 Data Rapid Assessment of Flood Extent and Damages in Quang Nam Province by Using Sentinel-1 Data. 2021. Available online: https://tailieuso.tlu.edu.vn/handle/DHTL/10996 (accessed on 20 March 2025).
  22. Uddin, K.; Matin, M.A. Potential Flood Hazard Zonation and Flood Shelter Suitability Mapping for Disaster Risk Mitigation in Bangladesh Using Geospatial Technology. Prog. Disaster Sci. 2021, 11, 100185. [Google Scholar] [CrossRef]
  23. Uddin, K.; Matin, M. Rapid Flood Mapping Using Multi-Temporal SAR Images: An Example from Bangladesh. In Earth Observation Science and Applications for Risk Reduction and Enhanced Resilience in Hindu Kush Himalaya Region; Springer: Cham, Switzerland, 2021; Chapter 10. [Google Scholar] [CrossRef]
  24. Haque, S.; Ikeuchi, K.; Shrestha, B.B.; Kawasaki, A.; Minamide, M. Establishment of Flood Damage Function Model for Rural Roads: A Case Study in the Teesta River Basin, Bangladesh. Prog. Disaster Sci. 2023, 17, 100269. [Google Scholar] [CrossRef]
  25. Rahman, M.M.; Kamruzzaman, M.; Deb, L.; Islam, H.M.T. Flood Mapping, Damage Assessment, and Susceptibility Zonation in Northeastern Bangladesh in 2022 Using Geospatial Datasets. Prog. Disaster Sci. 2025, 25, 100402. [Google Scholar] [CrossRef]
  26. Tripathi, G.; Parida, B.R.; Pandey, A.C. Spatio-Temporal Rainfall Variability and Flood Prognosis Analysis Using Satellite Data over North Bihar during the August 2017 Flood Event. Hydrology 2019, 6, 38. [Google Scholar] [CrossRef]
  27. Unnithan, S.L.K.; Biswal, B.; Rüdiger, C.; Dubey, A.K. A Novel Conceptual Flood Inundation Model for Large-Scale Data-Scarce Regions. Environ. Model. Softw. 2024, 171, 105863. [Google Scholar] [CrossRef]
  28. Yan, K.; Di Baldassarre, G.; Solomatine, D.P.; Schumann, G.J.-P. A Review of Low-cost Space-borne Data for Flood Modelling: Topography, Flood Extent and Water Level. Hydrol. Process. 2015, 29, 3368–3387. [Google Scholar] [CrossRef]
  29. Gord, S.; Hafezparast Mavaddat, M.; Ghobadian, R. Flood Impact Assessment on Agricultural and Municipal Areas Using Sentinel-1 and 2 Satellite Images (Case Study: Kermanshah Province). Nat. Hazards 2024, 120, 8437–8457. [Google Scholar] [CrossRef]
  30. Huang, M.; Jin, S. Rapid Flood Mapping and Evaluation with a Supervised Classifier and Change Detection in Shouguang Using Sentinel-1 SAR and Sentinel-2 Optical Data. Remote Sens. 2020, 12, 2073. [Google Scholar] [CrossRef]
  31. Dhanabalan, S.P.; Rahaman, S.A.; Jegankumar, R. Flood Monitoring Using Sentinel-1 Sar Data: A Case Study Based on an Event of 2018 and 2019 Southern Part of Kerala. Int. Arch. Photogramm. Remote Sens. Spat. Inf. Sci.—ISPRS Arch. 2021, 44, 37–41. [Google Scholar] [CrossRef]
  32. Uddin, K.; Matin, M.A.; Meyer, F.J. Operational Flood Mapping Using Multi-Temporal Sentinel-1 SAR Images: A Case Study from Bangladesh. Remote Sens. 2019, 11, 1581. [Google Scholar] [CrossRef]
  33. Singha, M.; Dong, J.; Sarmah, S.; You, N.; Zhou, Y.; Zhang, G.; Doughty, R.; Xiao, X. Identifying Floods and Flood-Affected Paddy Rice Fields in Bangladesh Based on Sentinel-1 Imagery and Google Earth Engine. ISPRS J. Photogramm. Remote Sens. 2020, 166, 278–293. [Google Scholar] [CrossRef]
  34. Tazmul Islam, M.; Meng, Q. An Exploratory Study of Sentinel-1 SAR for Rapid Urban Flood Mapping on Google Earth Engine. Int. J. Appl. Earth Obs. Geoinf. 2022, 113, 103002. [Google Scholar] [CrossRef]
  35. Singh, G.; Rawat, K.S. Mapping Flooded Areas Utilizing Google Earth Engine and Open SAR Data: A Comprehensive Approach for Disaster Response. Discov. Geosci. 2024, 2, 5. [Google Scholar] [CrossRef]
  36. Worldometer Bangladesh Population. Worldometer. 2024. Available online: https://www.worldometers.info/world-population/bangladesh-population/ (accessed on 22 November 2024).
  37. World Bank Bangladesh—Climatology|Climate Change Knowledge Portal. Available online: https://climateknowledgeportal.worldbank.org/country/bangladesh/climate-data-historical (accessed on 22 November 2024).
  38. Japan International Cooperation Agency (JICA). Data Collection Survey on Disaster Risk Reduction; Japan International Cooperation Agency: Tokyo, Japan, 2017; Volume 2, p. 245. [Google Scholar]
  39. Potin, P.; Rosich, B.; Miranda, N.; Grimont, P. Sentinel-1 Mission Status. Procedia Comput. Sci. 2016, 100, 1297–1304. [Google Scholar] [CrossRef]
  40. European Space Agency (ESA). S1 Applications. Available online: https://sentiwiki.copernicus.eu/web/s1-applications (accessed on 23 November 2024).
  41. Tarpanelli, A.; Mondini, A.C.; Camici, S. Effectiveness of Sentinel-1 and Sentinel-2 for Flood Detection Assessment in Europe. Nat. Hazards Earth Syst. Sci. 2022, 22, 2473–2489. [Google Scholar] [CrossRef]
  42. EM-DAT—The International Disaster Database. Available online: https://www.emdat.be/ (accessed on 1 December 2024).
  43. Kang, Y.; Pan, L.; Chen, Q.; Zhang, T.; Zhang, S.; Liu, Z. Automatic Mosaicking of Satellite Imagery Considering the Clouds. ISPRS Ann. Photogramm. Remote Sens. Spat. Inf. Sci. 2016, III–3, 415–421. [Google Scholar] [CrossRef]
  44. Portalés-Julià, E.; Mateo-García, G.; Purcell, C.; Gómez-Chova, L. Global Flood Extent Segmentation in Optical Satellite Images. Sci. Rep. 2023, 13, 20316. [Google Scholar] [CrossRef]
  45. Haghighi, M.H. Large-Scale Mapping of Flood Using Sentinel-1 Radar Remote Sensing. Int. Arch. Photogramm. Remote Sens. Spat. Inf. Sci. 2022, XLIII-B3-2022, 1097–1102. [Google Scholar] [CrossRef]
  46. United Nations. Step-by-Step: Recommended Practice: Flood Mapping and Damage Assessment Using Sentinel-1 SAR Data in Google Earth Engine|UN-SPIDER Knowledge Portal. Available online: https://www.un-spider.org/advisory-support/recommended-practices/recommended-practice-google-earth-engine-flood-mapping/step-by-step (accessed on 24 November 2024).
  47. Rahman, M.; Ningsheng, C.; Islam, M.M.; Dewan, A.; Iqbal, J.; Washakh, R.M.A.; Shufeng, T. Flood Susceptibility Assessment in Bangladesh Using Machine Learning and Multi-Criteria Decision Analysis. Earth Syst. Environ. 2019, 3, 585–601. [Google Scholar] [CrossRef]
  48. iFarmer: The Tech-Enabled One-Stop Solution for Smallholder Farmers | The Daily Star. Available online: https://www.thedailystar.net/supplements/accelerating-bangladesh/news/ifarmer-the-tech-enabled-one-stop-solution-smallholder-farmers-3263131 (accessed on 3 December 2024).
  49. Dewan, A.M.; Alam, M.; Nishigaki, M. Remote Sensing of 1998 and 2000 Floods in Greater Dhaka, Bangladesh: Experiences from Catastrophic and Normal Events. J. Fac. Environ. Sci. Technol. 2005, 10, 57–65. [Google Scholar]
  50. Adhikary, T.S. Over 1,000 km Roads Damaged by Flood. Available online: https://www.thedailystar.net/frontpage/news/over-1000km-roads-damaged-flood-1787584 (accessed on 7 February 2021).
  51. Roads & Highways Department (RHD). Road Master Plan; Roads & Highways Department (RHD): Dhaka, Bangladesh, 2009. [Google Scholar]
  52. Ministry of Road Transport & Bridges (MoRTB). Bangladesh Highway Act, 2021; Bangladesh National Parliament, Bangladesh: Dhaka, Bangladesh, 2021. [Google Scholar]
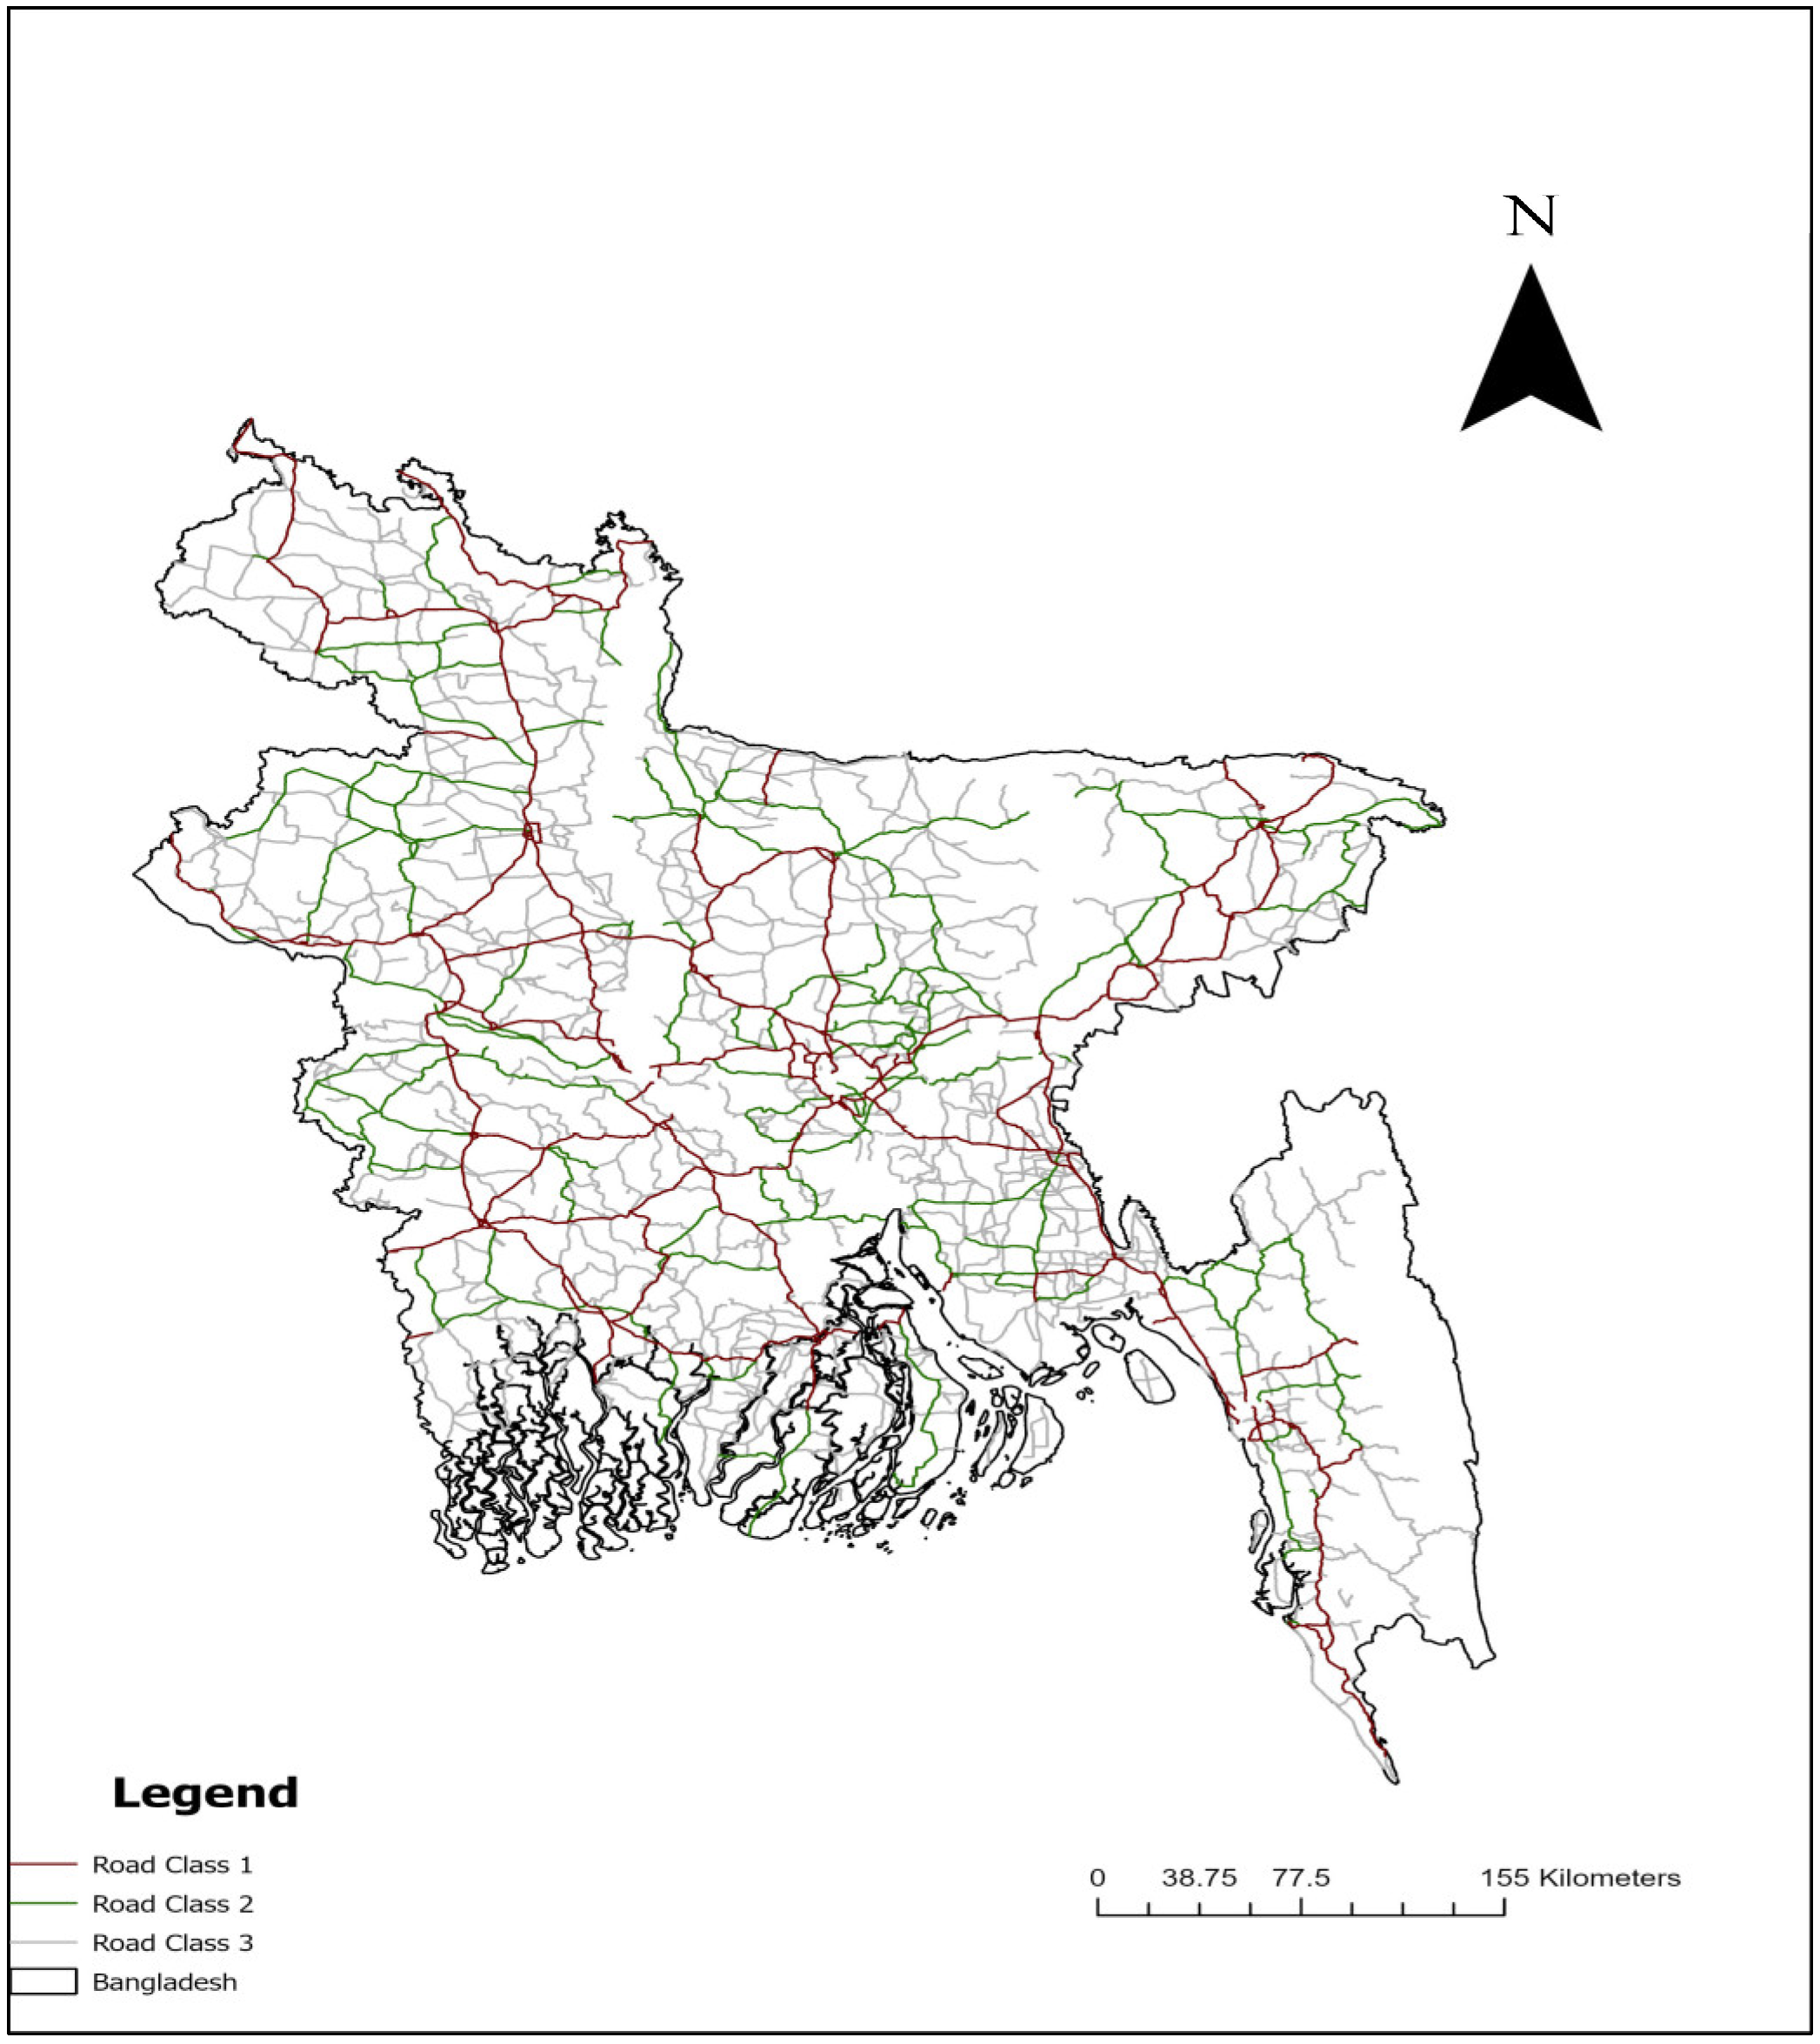
Figure 1. Various roads within the study area. Note: Classes 1, 2, and 3 refer to National Highways, Regional Highways, and Zilla or district roads, respectively.
Earth 06 00090 g001
Figure 2. Flood Map Preparation and Damage Assessment Framework.
Earth 06 00090 g002
Figure 3. Flood map with various damage extents (a) June–July 2019, (b) June–September 2020 (c) July–August 2021, (d) May–September 2022, and (e) August 2023 Note: The population density represents the number of people per pixel.
Earth 06 00090 g003aEarth 06 00090 g003b
Figure 4. Flood-affected districts of Bangladesh 2019–2023.
Earth 06 00090 g004
Figure 5. Flood Affected Population in million during 2019–2023.
Earth 06 00090 g005
Figure 6. Flood Affected Road Network (a) Total affected length (km) 2019–2023 and (b) Cumulative Impact from duration 2019–2023. Note: (b) “Average,” “Max,” and “Min” represent, respectively, the mean, highest, and lowest annual lengths of roads affected by flooding during the 2019–2023 period.
Earth 06 00090 g006
Figure 7. Historically affected roads and critically affected Road Segments.
Earth 06 00090 g007
Table 1. Flood Affected Area (ha) during 2019–2023.
Division/Year20192020202120222023
Sylhet209,573360,033238,719212,659273,040
16.59%28.49%18.89%16.83%21.61%
Dhaka-
Mymensingh
306,356243,302171,003112,029185,036
9.83%7.80%5.48%3.59%5.93%
Rajshahi139,891110,09444,85030,37245,993
7.71%6.06%2.47%1.67%2.53%
Rangpur22,87434,299875832749728
1.41%2.12%0.54%0.20%0.60%
Chattogram79,39954,40834,24019,02342,162
2.34%1.60%1.01%0.56%1.24%
Others47,99732,65936,30413,51465,975
1.35%0.92%1.02%0.38%1.86%
Total Affected Area806,091834,796533,876390,872621,934
5.46%5.66%3.62%2.65%4.21%
Table 2. Flood Affected Cropland (ha) during 2019–2023.
Division/Year20192020202120222023
Sylhet23,18881,02516,23816,65134,119
1.84%6.41%1.29%1.32%2.70%
Dhaka-
Mymensingh
59,81126,38514,396324221,051
1.92%0.85%0.46%0.10%0.68%
Rajshahi57,50142,91719,10112,66218,338
3.17%2.36%1.05%0.70%1.01%
Rangpur7824357548252117
0.01%0.01%0.01%0.01%0.01%
Chattogram43,40625,59217,376731917,123
1.28%0.75%0.51%0.22%0.50%
Other Divisions10,39053256626103219,134
0.29%0.15%0.19%0.03%0.54%
Total195,078185,60174,28541,158109,882
1.32%1.26%0.50%0.28%0.74%
Table 3. Population exposed to floods during 2019–2023.
Division/Year20192020202120222023
Sylhet505,590546,488414,880237,651273,040
5.10%5.51%4.19%2.40%2.76%
Dhaka-
Mymensingh
1,140,221467,878307,80374,183512,701
2.40%0.99%0.65%0.16%1.08%
Rajshahi245,875208,76252,10526,57179,722
1.33%1.13%0.28%0.14%0.43%
Rangpur12,79942,28212,38790329438
0.08%0.27%0.08%0.06%0.06%
Chattogram256,23471,04641,52311,208124,286
0.90%0.25%0.15%0.04%0.44%
Other255,35589,895243,82994,247764,850
1.06%0.37%1.02%0.39%3.19%
Total2,416,0751,426,3521,072,528452,8931,764,038
1.68%0.99%0.74%0.31%1.22%
Table 4. Flood Affected Road Length (km) during 2019–2023.
Division/Year20192020202120222023
Sylhet178.36455.58170.75146.26291.47
12.46%31.82%11.93%10.22%20.36%
Dhaka-
Mymensingh
470.40283.08183.59103.00163.56
11.07%6.66%4.32%2.43%3.85%
Rajshahi261.34173.2761.2170.2754.03
10.77%7.14%2.52%2.90%2.23%
Rangpur69.7448.4828.26----
2%2%1%----
Chattogram164.2863.2950.8146.0962.43
7.35%2.83%2.27%2.06%2.79%
Other52.3016.7329.8837.83147.67
0.65%0.21%0.37%0.47%1.82%
Total1196.421040.43524.50403.45719.16
5.58%4.85%2.44%1.88%3.35%
Table 5. Affected and Damaged Road Length in the 2019 flood.
Road ConditionClass 1 (km)Class 2 (km)Class 3 (km)Total (km)
Flooded road177.74289.42724.11191
Damaged road195.3167.66411003.9
Disclaimer/Publisher’s Note: The statements, opinions and data contained in all publications are solely those of the individual author(s) and contributor(s) and not of MDPI and/or the editor(s). MDPI and/or the editor(s) disclaim responsibility for any injury to people or property resulting from any ideas, methods, instructions or products referred to in the content.