Article

Land Use Land Cover (LULC) Mapping for Assessment of Urbanization Impacts on Cropping Patterns and Water Availability in Multan, Pakistan

1
Department of Soil Science, Bahauddin Zakariya University, Multan 60700, Pakistan
2
Department of Water Resource Management, The University of Agriculture, Peshawar 25130, Pakistan
3
Department of Agricultural Engineering, Bahauddin Zakariya University, Multan 60800, Pakistan
4
Department of Health Science, University of Basilicata, Potenza 85100, Italy
5
Department of Agricultural Engineering and Technology, Ghazi University, Dera Ghazi Khan 32200, Pakistan
*
Author to whom correspondence should be addressed.
Earth 2025, 6(3), 79; https://doi.org/10.3390/earth6030079
Submission received: 29 May 2025 / Revised: 5 July 2025 / Accepted: 11 July 2025 / Published: 14 July 2025

Abstract

Urbanization is causing a decrease in agricultural land. This leads to changes in cropping patterns, irrigation water availability, and water allowance. Therefore, change in cropping pattern, irrigation water availability, and water allowance were investigated in the Multan region of Pakistan using remote sensing and GIS techniques. The multi-temporal Landsat images with 30 m resolution were acquired for both Rabi (winter) and Kharif (summer) seasons for the years of 1988, 1999 and 2020. The image processing tasks including layer stacking, sub-setting, land use/land cover (LULC) classification, and accuracy assessment were performed using ERDAS Imagine (2015) software. The LULC maps showed a considerable shift of orchard area to urban settlements and other crops. About 82% of orchard areas have shifted to urban settlements and other crops from 1988 to 2020. The LULC maps for Kharif season indicated that cropped areas for cotton have decreased by 42.5% and the cropped areas for rice have increased by 718% in the last 32 years (1988–2020). During the rabi season, the cropped areas for wheat (Triticum aestivum L.) have increased by 27% from 1988 to 2020. The irrigation water availability and water allowance have increased up to 125 and 110% due to decrease in agricultural land, respectively. The overall average accuracies were found as 87 and 89% for Rabi and Kharif crops, respectively. The LULC mapping technique may be used to develop a decision support system for evaluating the changes in cropping pattern and their impacts on net water availability and water allowances.

1. Introduction

Water is fundamental for supporting quality life on the earth. This finite commodity has a direct bearing on almost all sectors of the economy. In Pakistan, its significance is more than ordinary due to the agrarian nature of the economy. The portion of agriculture sector in the Gross Domestic Product (GDP) of Pakistan is more than 19.9% [1]. Since agriculture is the major user of water, sustainability of agriculture depends on timely and adequate availability of water. The increasing pressures from population expansion and industrialization have significantly increased the demands for water, leading to an increasing number and intensity of local and regional conflicts over its availability and use [2,3,4]. Around the world, there is a continuous shift of population from rural areas to urban areas, resulting in great stress on resources in urban areas. Currently, the world is facing the worst time in history due to the increasing urban population. According to an estimate, more than 55% of the world’s population is living in urban areas, and this is expected to increase to 68% by 2050. Urban growth has led to a significant reduction in agricultural land including orchards, croplands, and forests areas, as these were converted into residential housing colonies [1,4,5,6,7]. Pakistan has the relatively highest rate of urbanization in South Asia. According to the 2018 census, 40% of the population is living in urban hubs. Estimates based on a modified definition of urban settlements suggested that the ratio of urban to rural population could be 45%, or even higher [8,9,10]. About 1 × 10⁵ ha of fertile irrigated land has been converted to urban land use in Multan [8]. Urbanization is also causing food security problems in two ways: firstly by reducing agricultural land, and secondly increasing food demand. Increasing urban population and environmental change have caused changes in cropping patterns of the Multan region of Pakistan. The cotton crop is being replaced with maize, rice, fodder crops, etc., which have a different water requirement than that of cotton [11].There is an increase in net water available and water allowance per hectare due to urbanization in canal command areas of South Punjab, Pakistan. Therefore, calculation of crop water requirement and water allowance is of great importance for better understanding of the changes in water availability in the last three decades.
Land use and land cover (LULC) mapping has been widely used in recent times to acquire up-to-date information regarding the changes in water availability and allowance over time [5,12]. Remote sensing (RS) has been widely used to map and classify land use/land cover (LULC) changes with different datasets and techniques. At a larger scale for LULC classification, Landsat imagery was used [13,14]. Recently, various classification techniques have been developed that can be used for LULC change detection. Supervised classification or clustering, unsupervised classification, principal components analysis (PCA), fuzzy classification, and hybrid classification are the commonly used techniques for LULC classification [15,16]. The extensively used classification method for LULC change analysis throughout the world is supervised classification [7,17,18]. These techniques depend on a combination of personal experience with the study area and background knowledge to a greater extent. Several researchers have reported an accuracy from 85 to 95% in results with supervised classification [19,20]. Similarly, the performance and accuracy of Linear Discriminant Analysis (LDA), Support Vector Machines (SVM), K-Nearest Neighbors (KNN), and Random Forest (RF) classification methods has been evaluated. The results of these studies indicated that selection of appropriate classification methods is crucial to obtain the good classification of land use features [21].
Therefore, the main objective of the present research was to utilize GIS and Remote Sensing applications to discern the extent of LULC changes that occurred in Multan, Pakistan over three decades. The impact of urbanization on change in cropping patterns, net depth of water availability, and canal water allowance in the Multan region from 1988 to 2020 were also investigated.

2. Study Area

The study area consists of two Tehsils (Multan City and Multan Saddar) of Multan district, which is a part of the Southern Punjab (Pakistan). It lies between 29.32° to 30.46° N and 70.96° to 71.81° E at an elevation of 122 m (Figure 1). It has mostly flat topography and very productive land bounded by the River Chenab to its west. Multan Saddar tehsil is near River Chenab and some of its western parts are frequently flooded during Monsoon season. In the east lies district Lodhran, in the north lies district Khanewal, and in the south lies district Bahawalpur. This area is selected because there is a significant shift from fertile agricultural land to intense urban development. However, the water allocation is the same as that allocated at the time of the development of the irrigation network, but agricultural land is shrinking due to urbanization. The study area is about 1936 km2. Salient features of the study area are its fertile land, many shrines of famous saints, old forts, and mango orchards. It is one of the oldest cities in the world. Multan is 7th largest city of Pakistan with respect to its population. The population of the area was 1 million in 1988, which increased to 2.5 million in 2018 [22]. About 40% of the population lives in urban areas. Multan lies in an arid region where summers are very hot, and winters are very cold. It is also famous for its extreme storms due to extraordinarily high temperatures throughout the summer season from May to August and very cold temperatures in December and January.
The highest temperature of Multan in summer is 50.1 °C (122 °F), the lowest summer temperature is 26 °C (78.8 °F), the highest winter temperature is 23.5 °C (74.3 °F), and the lowest winter Temperature is 4.6 °C (40.3 °F). Average annual rainfall is less than 200 mm, which mostly occurs in Monsoon months (based on data acquired from Pakistan Meteorological Department). The study area is irrigated by Sidhnai Canal diverted from River Ravi through Sidhnai Barrage. The study area consists of 3 branch canals (Shujabad, Multan and Makhdoom Rashid), 28 distributaries, 15 minors and 3 sub-minors distributaries

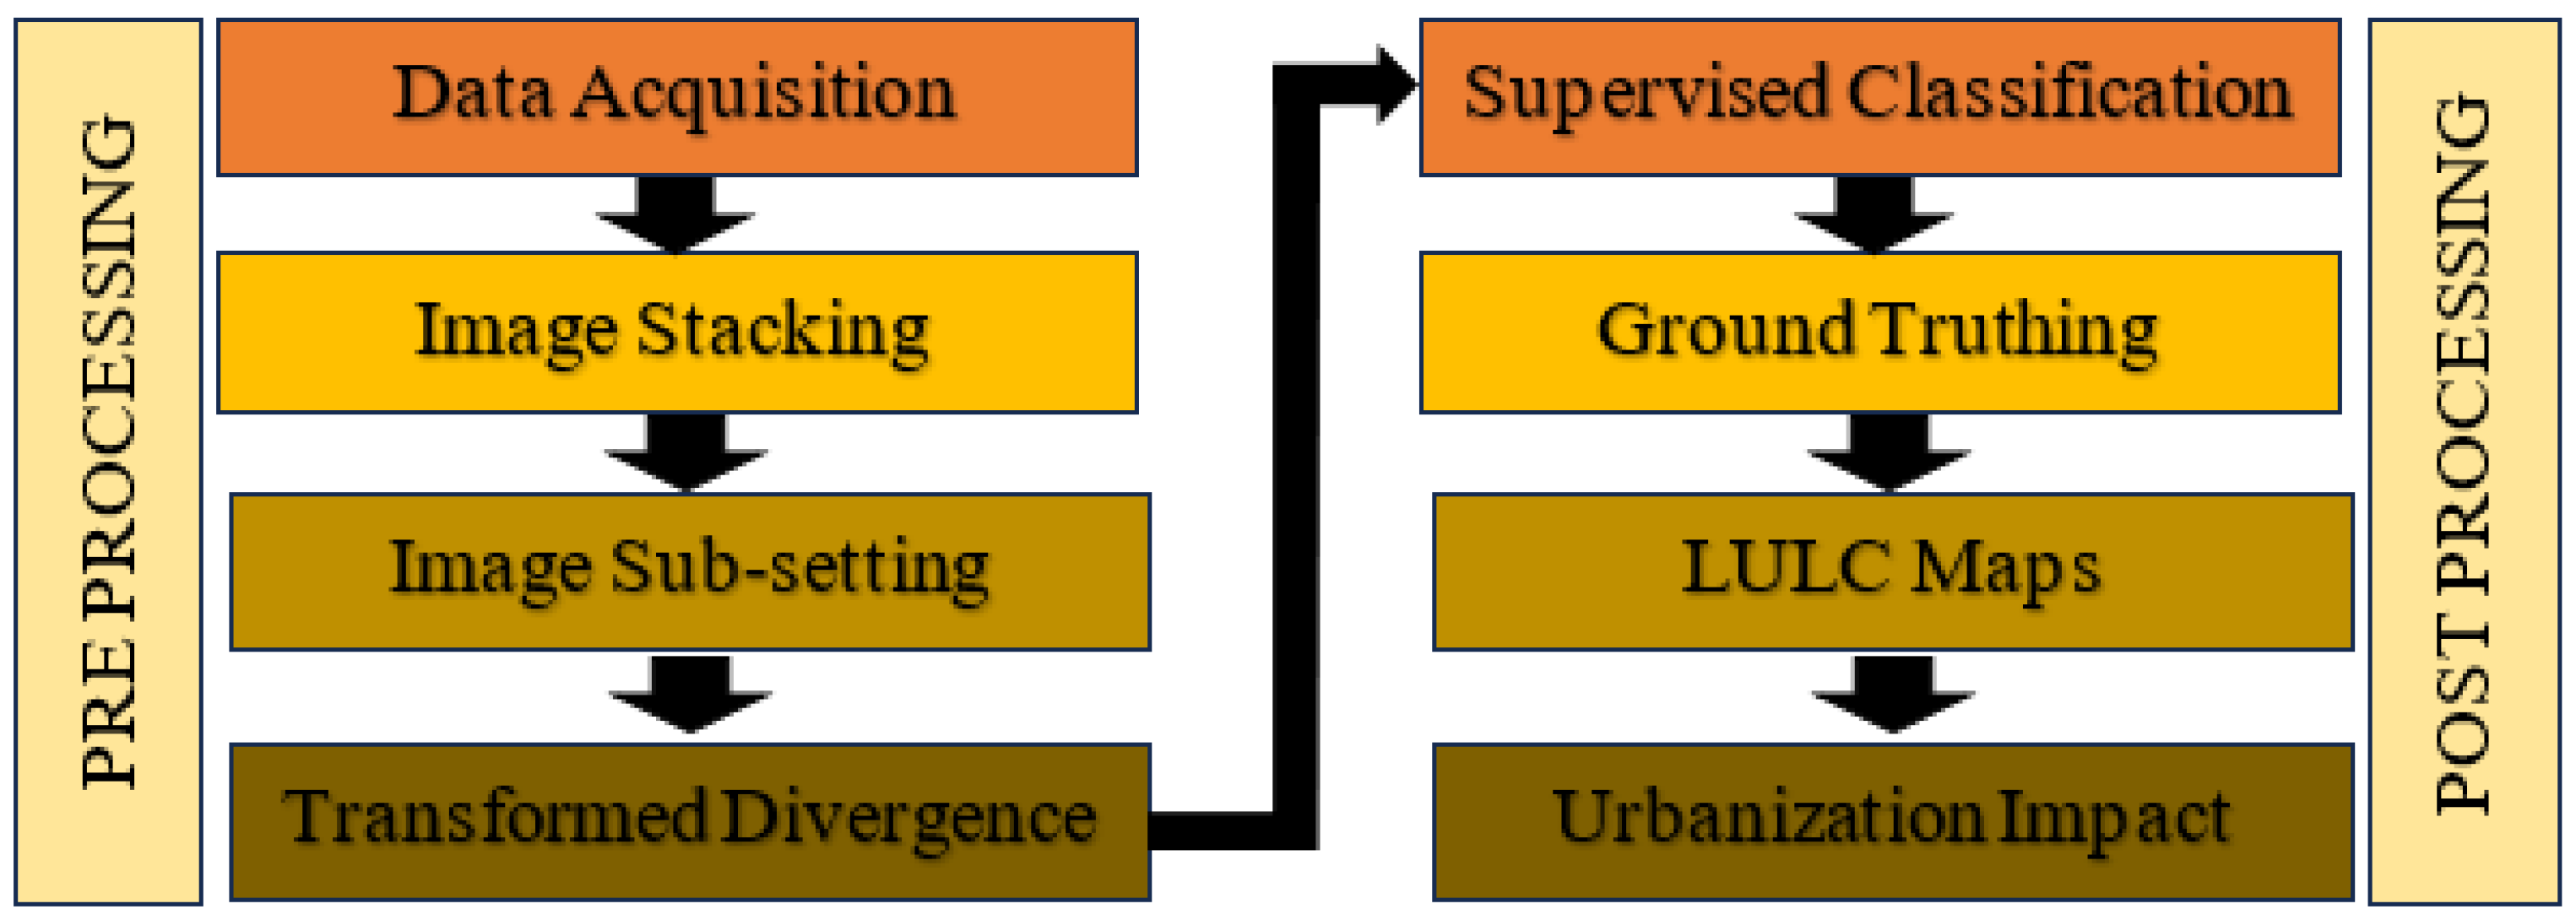
3. Materials and Methods

The assessment of urbanization on cropping patterns and water allowance needs acquisitions of data from different sources as well as classification of remotely sensed images collected for different periods. Later, the classified maps were used for the assessment of water availability and water allowance. The details of data sources and applied methods are summarized below.

3.1. Cropping Pattern

The study area has two cropping seasons, i.e., winter season (Rabi) and summer season (Kharif). During the Rabi season, wheat is the major crop, with other crops such as vegetables, maize, and a few fodders also being cultivated. In the Kharif season, rice, cotton, vegetables, maize, and a few fodders were grown. Sugarcane, a perennial crop, is typically planted in February and September. Common cropping systems practiced in the study area include wheat–cotton, rice–wheat, wheat–sugarcane, and orchard–wheat combinations. The major area of the Multan region follows the cropping pattern of wheat–cotton.

3.2. Data Acquisition

Freely available images of Landsat 4-5 Thematic Mapper (TM) and Landsat 8 Operational Land Imager (OLI) were acquired from glovis.usgs.gov. Landsat 4-5 TM is the 4th satellite program of Landsat, which is equipped with Thematic Mapper. Landsat 8 OLI is the 8th satellite of Landsat program, which is equipped with Operational Land Imager. Similarly, the data regarding agricultural census, crop reporting, meteorological parameter, irrigation, soil type, and crop calendar were taken from the relevant departments, as shown in Table 1.

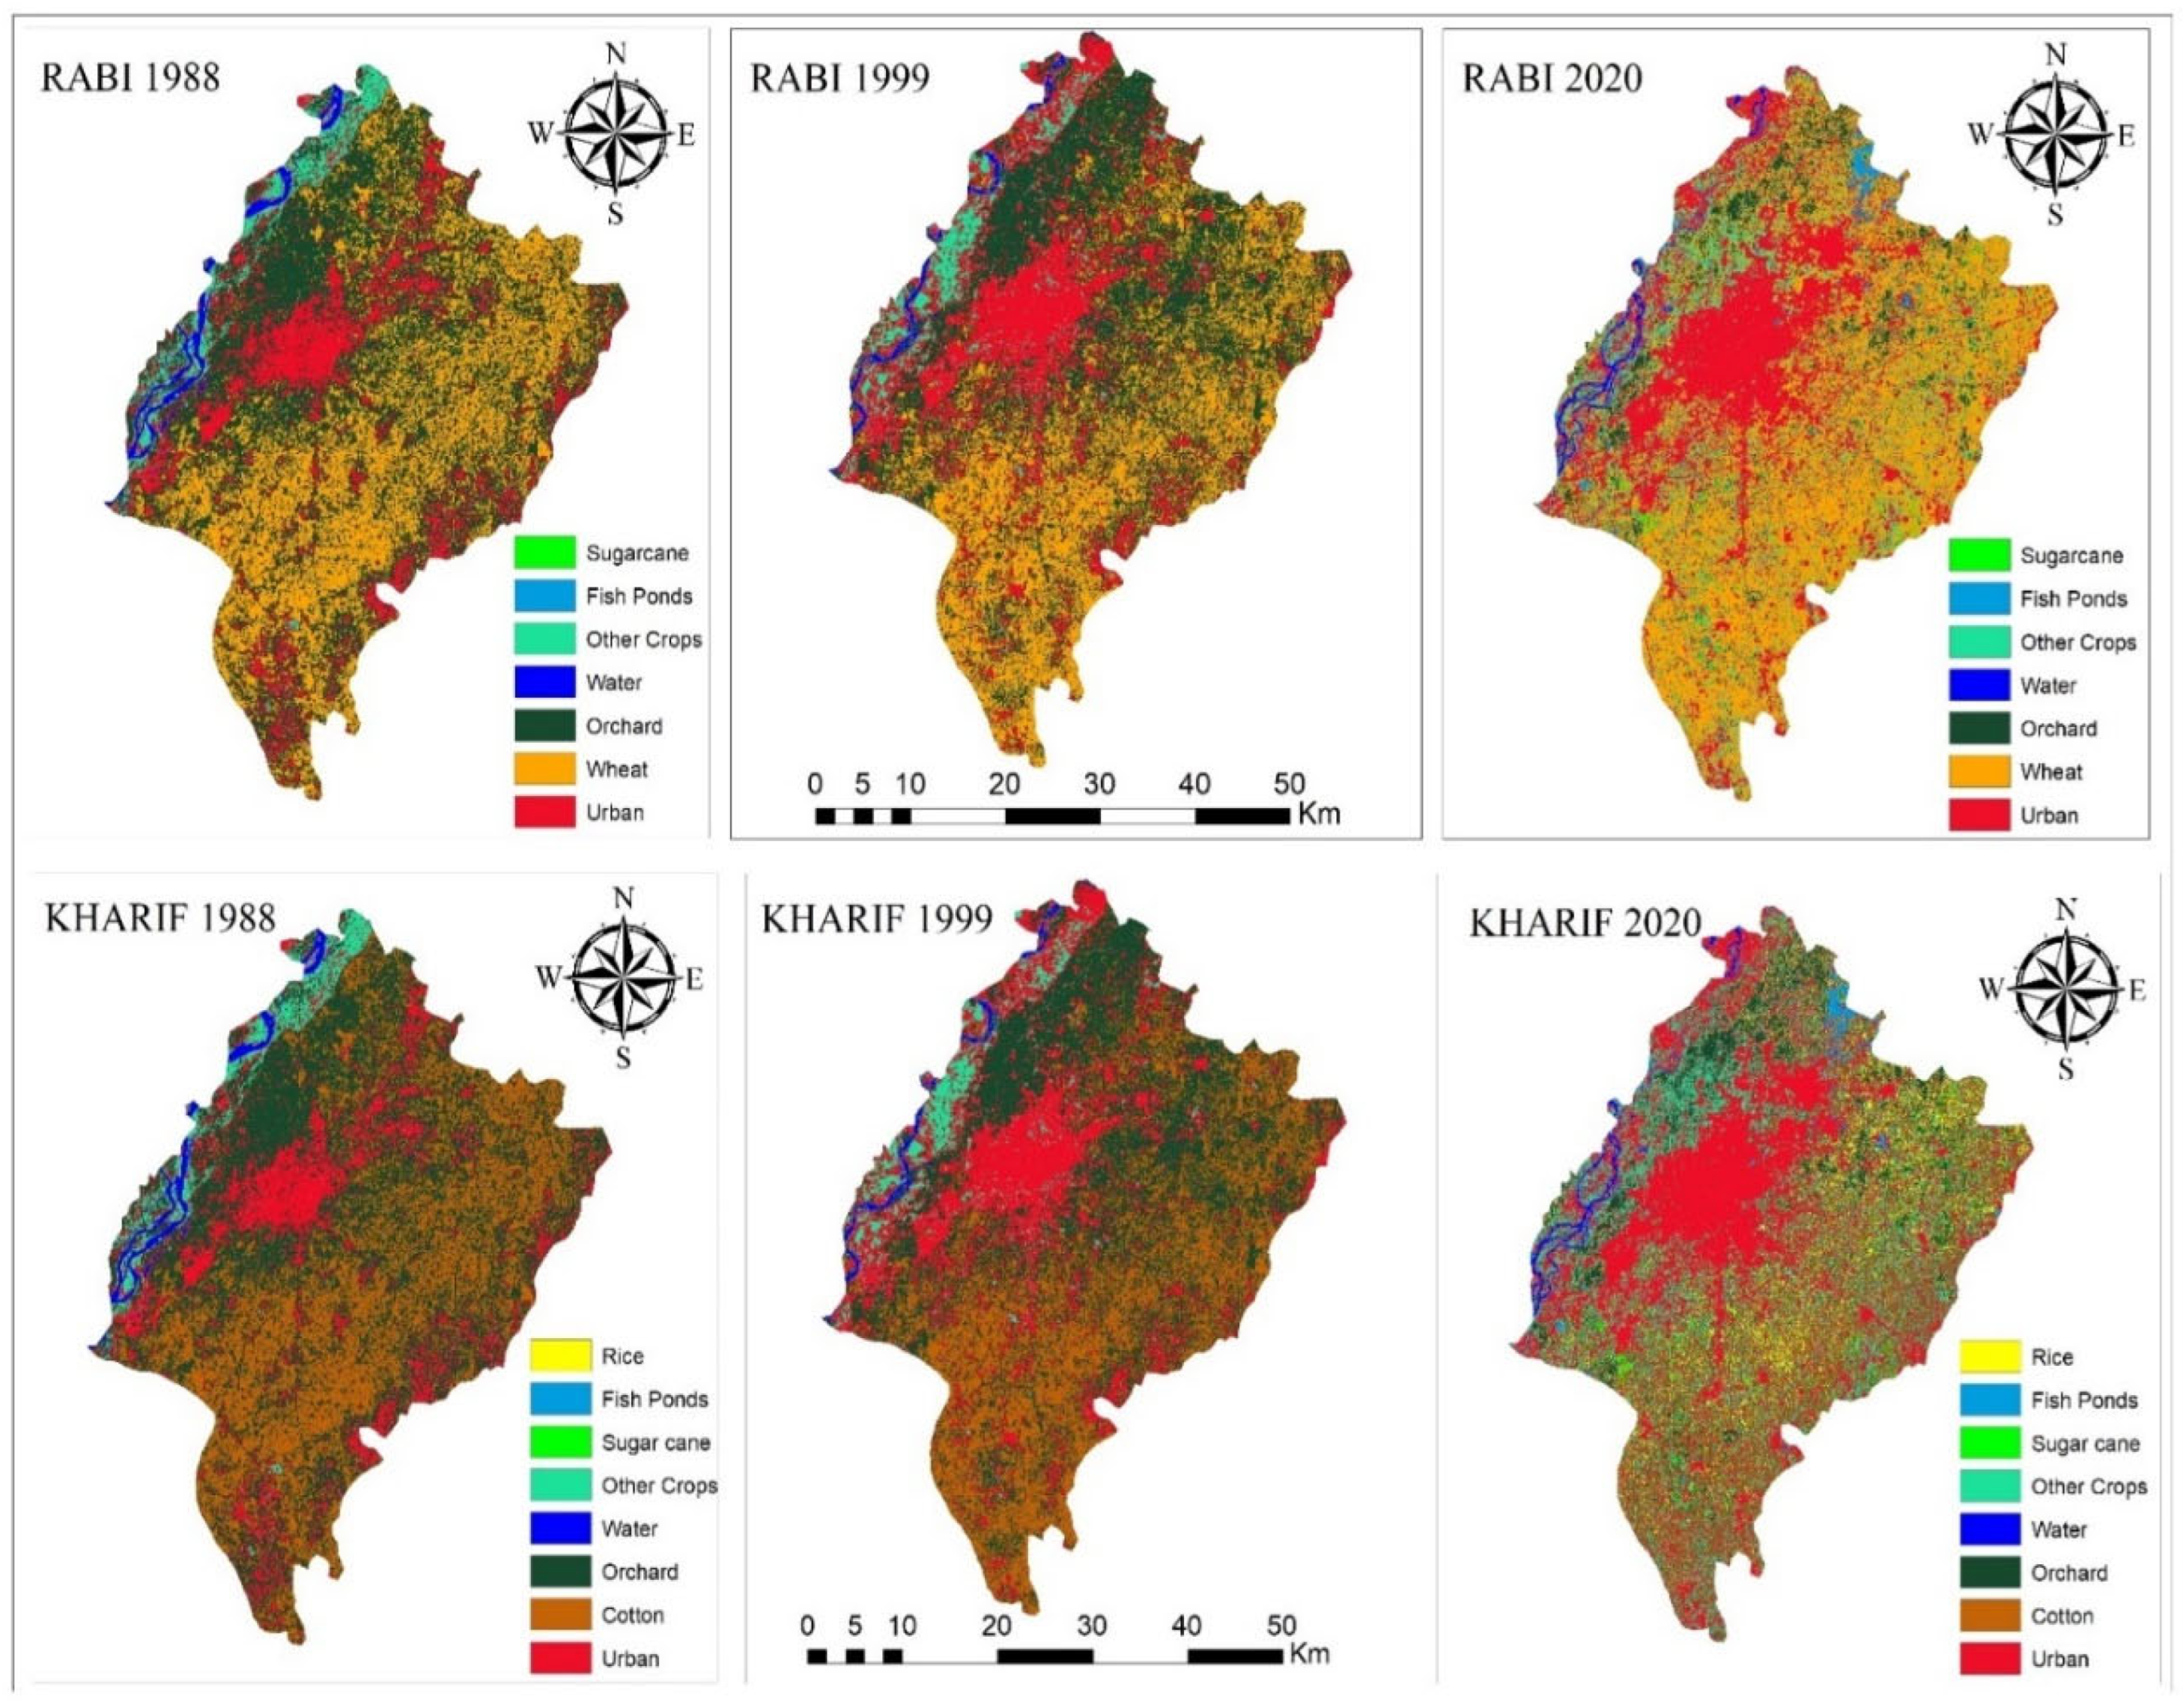
3.3. Image Classification and Interpolation

For land use land cover and change detection, Landsat 8 OLI and Landsat 4-5 TM images were used. Three remotely sensed images for different periods (1988, 1999, and 2020) were used for classification (Figure 2). These were freely downloaded from the website https://www.glovis.usgs.gov (accessed on 5 July 2025). ERDAS Imagine 2015 was used to perform layer stacking and subsetting. A shapefile of the study area was created by adding the GPS points of training data in ArcGIS 10.1 Vs. Using the shapefile, a digital polygon for the study area was created. Layer stacking was used to obtain single multi-band images with 7 bands of Landsat 4-5 TM and 11 bands of Landsat 8 OLI. A subset of two tehsils (Multan city and Multan Saddar) was extracted from layer-stacked images. Once the images were prepared, crop signatures (previously collected spectral polygon and points of known crop types) were used as a training data set in a supervised classification technique. Local knowledge and reference data, as well as visual analysis, can effectively improve the results obtained from supervised algorithms. The spectral signatures categorized the unique reflectance patterns of different crops in the electromagnetic spectrum. An efficient spectral signature is considered if there is a minimum confusion between the LULC classes [23]. Knowledge of the cropping calendar is also very important for proper classification. The separability of the signatures and effectiveness between the classes were then evaluated using the transformed divergence statistical technique. After the evaluation, the maximum likelihood classification algorithm was applied to compare each pixel with training signatures and to assign it to the most probable class. Using the same procedure, the study area was classified into seven classes for the Rabi season and eight classes for the Kharif season for the years 1988, 1999, and 2020. The classes for the Rabi season were urban (settlements, roads, industries, barren land, etc.), water, fishponds, orchards (mango, citrus, and other fruits), sugarcane, wheat, and other crops (maize, fodder, and vegetables). The classes for the Kharif season were urban (settlements, roads, industries, barren land, etc.), water, fishponds, orchards (mango, citrus, and other fruits), sugarcane, rice, cotton, and other crops (maize, fodder, and vegetables).

3.4. Accuracy Assessment for Land Use/Land Cover Maps

Classification accuracy assessments are very important and useful for mapping land use/land cover change and for the knowledge of map quality and reliability of the results. In the end, there is no method which is accurate or perfect to assess the absolute accuracy of image classification; not even an estimate of the relative accuracy of classification results, which provides useful information for researchers to consider a classification result at a certain confidence level. An error matrix is the most used method, and is a very important technique to determine the accuracy of a particular map. It compares the coordinates of matching pixels in the classified images with that of ground truth data. The general accuracy of the classified image compares how much of each of the pixels is classified versus the actual ground truth and land cover conditions obtained from their corresponding ground truth data. The number of ground truth points was selected based on the extent of the cropped area. Specifically, 45 points were selected for urban settlements, 9 for river bodies), 8 for fishponds, 28 for wheat, 12 for other crops, 19 for orchards, 10 for cotton, 9 sugarcane, and 8 points for rice. The producer, user, and overall accuracies were measured to verify the LULC maps. The Kappa Coefficient (K) was also measured to evaluate the agreement between the classified and truth values of a classified image; if the Kappa value was 1, then there was 100% agreement, and if it was 0, then no agreement happened between the classified and the referenced truth image. The proposed study used the Kappa Coefficient (K) measurement procedure as describe by [24].

3.5. Water Availability and Canal Performance Assessment

Daily discharge data of 6 distributaries and 3 minors were taken from Punjab Irrigation Department of Multan and Shujabad Division, which was also available on their website https://www.irrigation.punjab.gov.pk (accessed on 5 July 2025). All the information about distributaries (Head discharge, R + d, command area, channel type, etc.) was collected from Punjab Irrigation Department. Discharge readings for August, September, October, and November were also taken for the selected distributaries (Table 2).
Actual discharge data over 4 months were collected daily for the months of September, October, November, and December. There was a change in net irrigation water availability with the change in the command area of distributaries (Table 2). There was a decrease in the command area of each distributary, which caused an increase in net irrigation volume and water allowance.

4. Results

Figure 3 shows the spatial analysis of land use/land cover (LULC) of the study area for the years 1988, 1999, and 2020. It was observed that the urban settlement has expanded in the middle of the northwest part of the study area. The expansion of the urban settlement in the middle of the northwest led to a reduction in orchard area from 1988 to 2020. The area under the water bodies in the western part has also declined over the past 40 years (Figure 3). In the year 1988, 41% of the total area was covered by orchards and 16% by the urban settlements. The area under orchards was observed as 7% and the area under urban settlement was observed as 35% of the total area in the year 2020. Similarly, land use/land cover classification indicates that the area covered by the river was 1.5% of the total area in 1988, which reduced to 0.8% in 2020. Fishponds covered about 0.7% of the total area in 1988, which increased to 1.5% in 2020. These findings indicated that the urban settlements have increased to 124% at the rate of 3.88% per year in the last 32 years. This increase was due to the increase in the population and the migration of people from nearby villages to the cities.
Land cover/land use area distribution and change detection in area distribution are given in Table 3. Significant changes were observed during the study period in the study area (Rabi and Kharif seasons of 1988, 1999, and 2020). For example, urban settlements and other crops have replaced the orchard in the region. Similarly, rice and some vegetation have replaced the cotton. Wheat is the main crop of the Rabi season. The mean area of wheat during 1988 was 62,166 ha, which declined to 57,338 ha in 1999 and then increased to 79,211 ha in 2020, showing a significant gain during the last 20 years (Table 3).
Other crops grown in the Rabi season are maize, fodder, and vegetables. The mean area of other crops (Rabi) during 1988 was 19,232 ha, which increased to 23,577 ha in 1999. In the Rabi season of 2020, the area of other crops increased to 26,831 ha. The average area under orchards during 1988 was 82,400 ha, which decreased to 66,000 ha in 1999. Similarly, in 2020, the area covered by orchards decreased to 14,600 ha.
Cotton is the main crop of the Kharif season. The cropped area of cotton in 1988 was 70,976 ha, which reduced to 62,196 ha in 1999. In the Kharif season of 2020, the cropped area for cotton reduced to 40,791 ha. The cropped area of rice was 1547 ha in 1988, which rose to 238 ha in 1999 and 13,122 ha in 2020. There was an increase in cropped areas of sugarcane from 1988 to 2020. The average area of sugarcane during 1988 was 568 ha, which increased to 1123 ha in 1999. In 2020, the cropped area of sugarcane increased to 3240 ha. Other crops grown in the Kharif season are maize, fodder, oil seeds, and vegetables. Th mean area of other crops during 1988 was 20,192 ha, which increased to 29,687 ha in 1999. However, in the Kharif season in 2020, the cropped area of other crops increased to 58,032 ha. There was a reduction of 8% in cropped area of wheat from 1988 to 1999, which was taken by sugarcane, fishponds, and other crops. There was a gain of 38% in cropped areas of wheat during 1999 to 2020, which was previously under orchards. There was an increase of 22% in cropped areas of other crops (Rabi) from 1988 to 1999, which were previously covered by wheat and orchards. The area covered by orchards was 82,440 ha in 1988, which has reduced by 20% in 1999. It was taken by urban settlements, other crops, and rice. The area under orchards was reduced by 78% from 1999 to 2020, which converted to urban settlements, wheat, fishponds, other crops, sugarcane, and rice. Cotton decreased by 12% from 1988 to 1999. However, there was a reduction of 35% in cropped areas of cotton, which was replaced by urban settlement, other crops, rice, and sugarcane from 1999 to 2020. There was an increase in cultivation of rice by 100% from 1988 to 1999. However, there was a three-fold increase in cropped area of rice during 1999 to 2020. There was an increase of 83% of cropped areas of other crops (Kharif) from 1988 to 1999 and there was also a two-fold increase of cropped areas of other crops (Kharif) from 1999 to 2020, which was previously under cotton cultivation. There was an increase of 83% in cropped areas of sugarcane from 1988 to 1999, whereas during 1999 to 2020, it almost doubled.

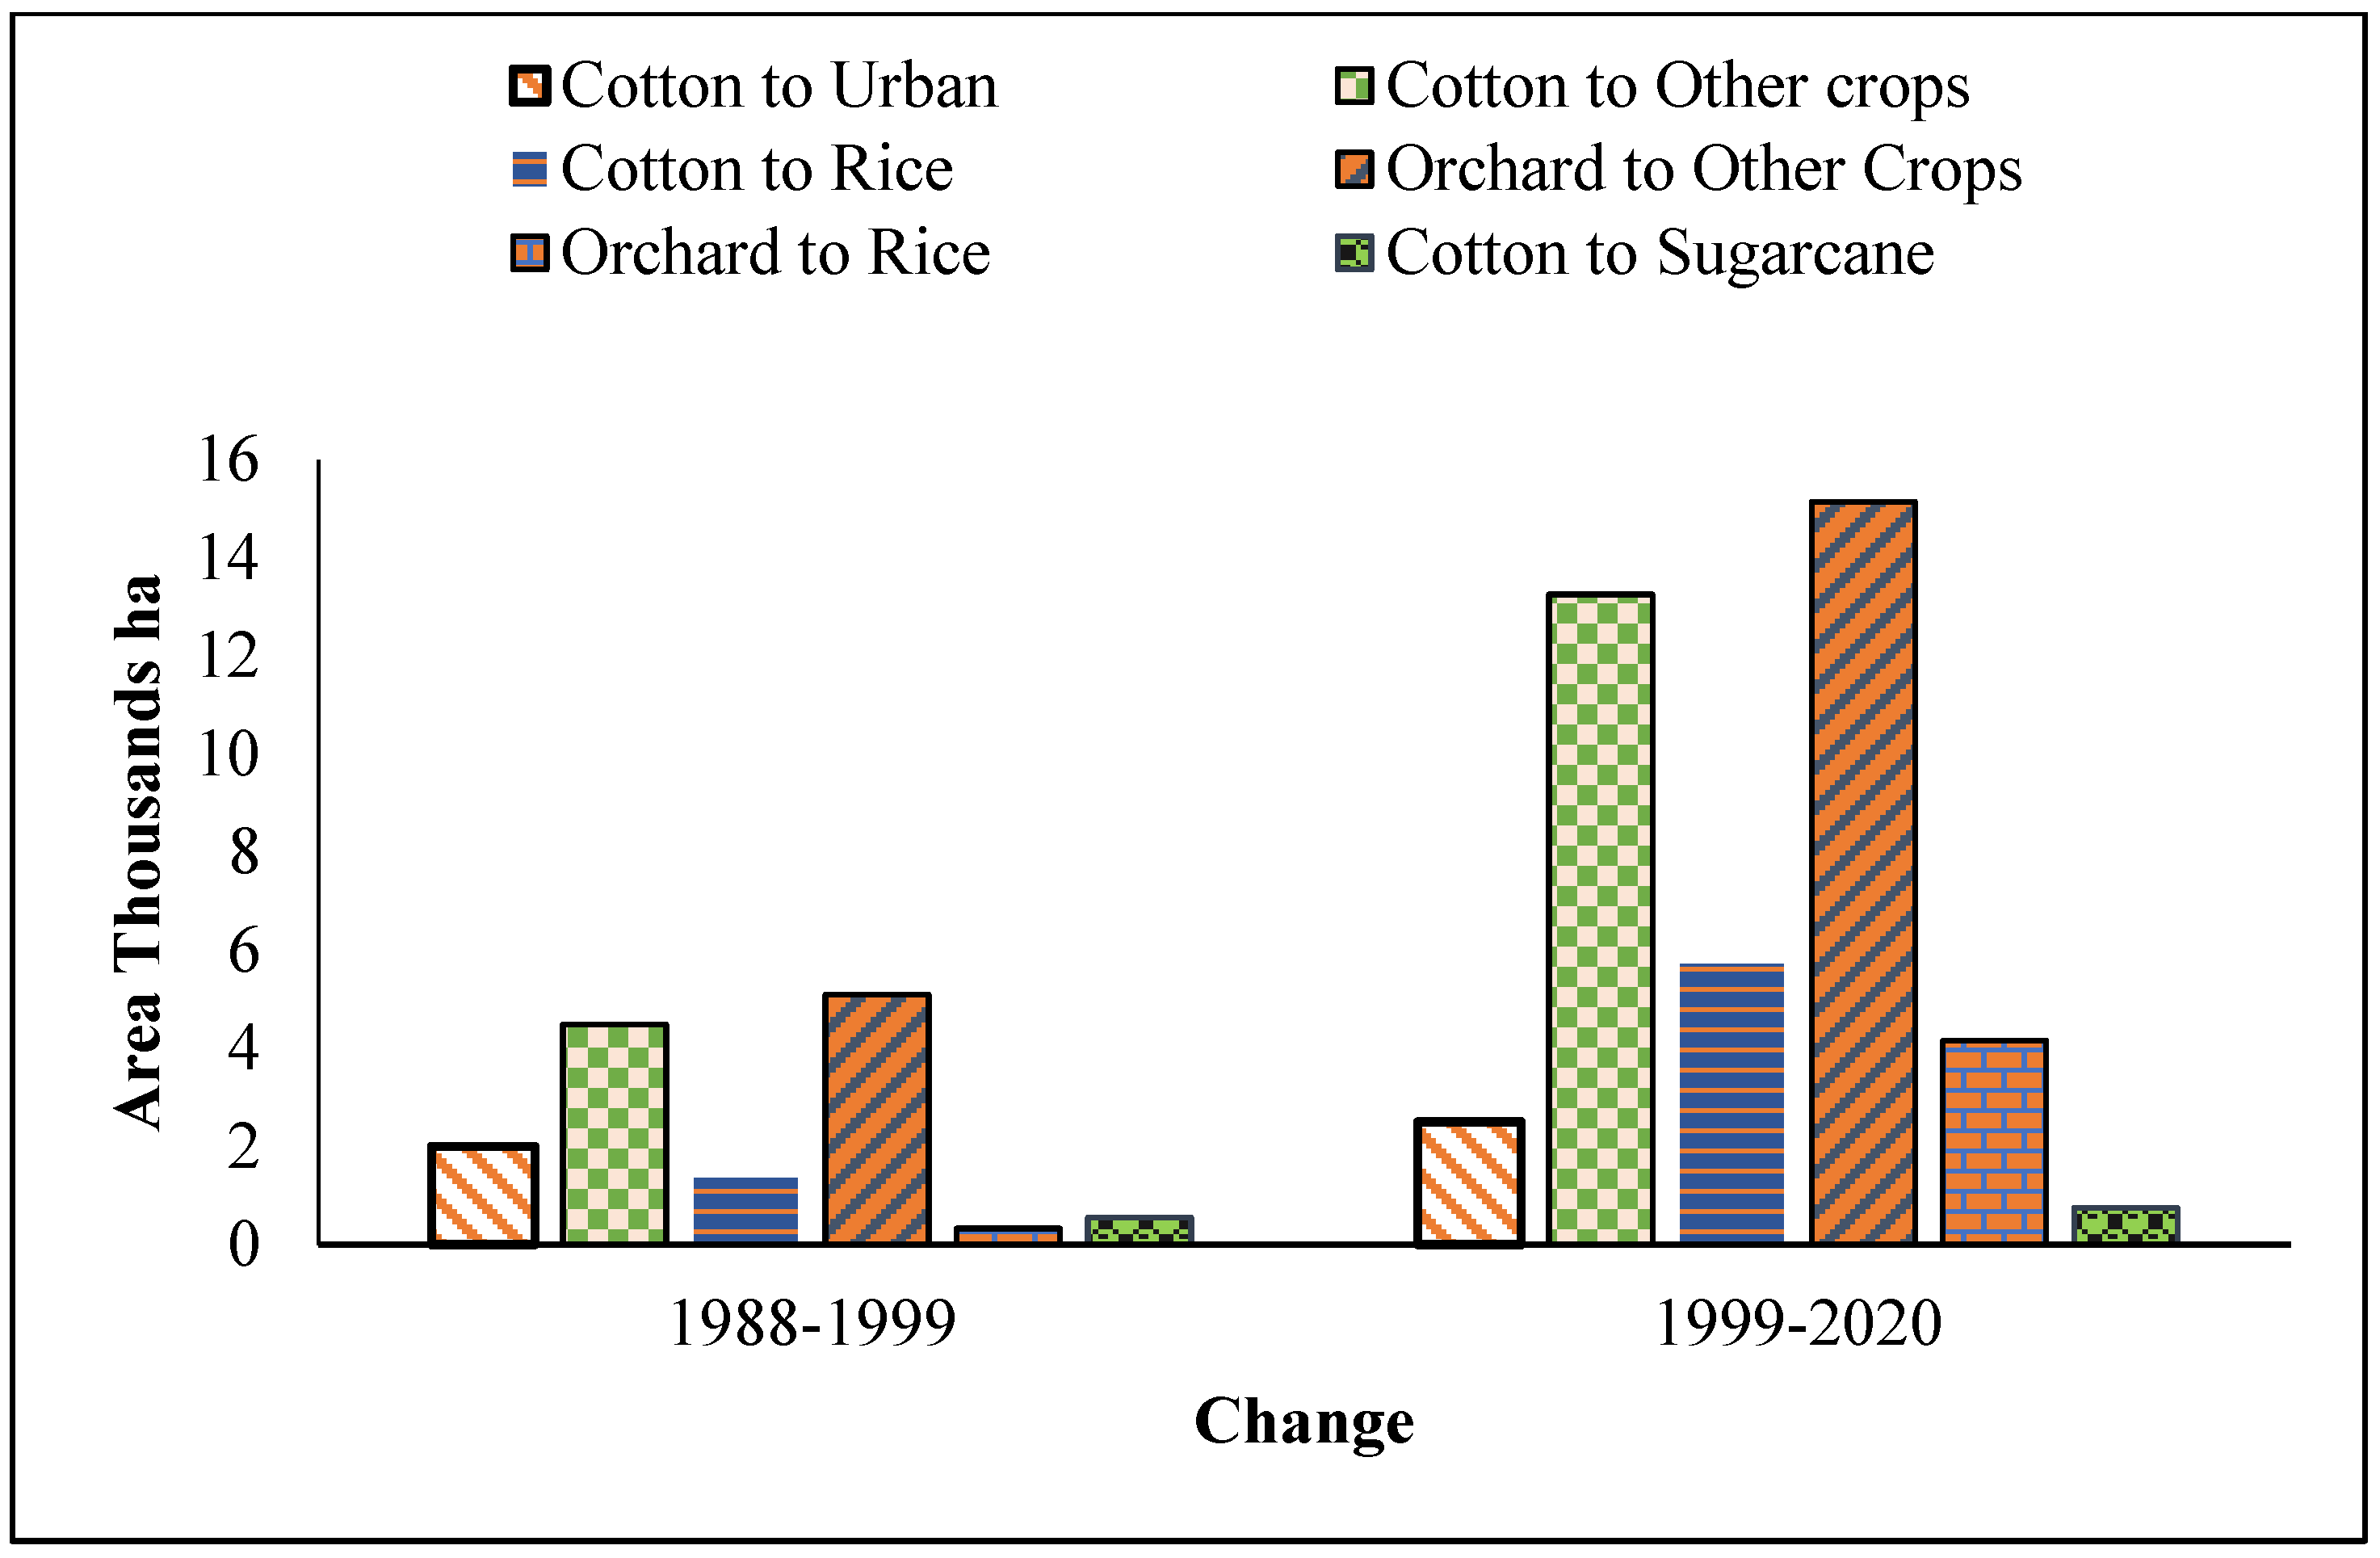
4.1. Change in Cropping Pattern

In the Rabi season, 21,900 ha of orchard area (33%) was replaced by wheat crop from 1999 to 2020, which was a significant change. An orchard area of 1400 ha (2%) was replaced by fishponds during 1999–2020 (Table 4). An orchard area of 1400 ha (1.7%) was taken by other crops (maize, fodders, and vegetables) during 1988 to 1999 and 3300 ha (5%) during 1999–2020. An orchard area of 2117 ha (3%) was taken by sugarcane during 1999–2020. A wheat area of 3180 ha (5%) was taken by other crops (maize, fodder, and vegetables) from 1988 to 1999 (Table 5). A wheat area of 1345 ha (2%) was taken by fishponds from 1988 to 1999 (Figure 3, Figure 4 and Figure 5).
In the summer season, an orchard area of 5100 ha (6%) was replaced by other crops from 1988 to 1999, which was a significant change, and 15,145 ha (23%) from 1999 to 2020 (Table 4). An orchard area of 330 ha (0.4%) was replaced by rice from 1988 to 1999 and 4161 ha (6.3%) from 1999 to 2020. A cotton area of 555 ha (1%) was taken by sugarcane from 1988 to 1999 and 750 ha (1%) from 1999 to 2020.
A cotton area of 1998 ha (3%) was taken by urban settlements from 1988 to 1999 and 2500 ha (4%) from 1999 to 2020. A total of 4480 ha (6%) of cotton area was replaced by other crops (maize, fodders, oil seeds, and vegetables) from 1988 to 1999 and 13,253 (21.3%) from 1999 to 2020. A cotton area of 1361 ha (2%) was taken over by rice from 1988 to 1999 and 5725 ha (9%) from 1999 to 2020 (Figure 3 and Figure 5). The cropping pattern of the study area is changing from cotton to rice, and other crops (maize, oil seeds, vegetables, and fodders). It is also changing from orchard to wheat, rice, sugarcane, and other crops (maize, oil seeds, vegetables, and fodders). Even a little shift from seasonal to perennial crops was noticed such as wheat and cotton to sugarcane, and orchard to sugarcane [11].

4.2. Ground Truthing and Accuracy Assessment

During the Rabi season, the average producer and user accuracy of sugarcane was 86% and 83%. Similarly, in the Kharif season, the average producer and user accuracy of sugarcane was 84 and 82% (Table 5). The highest producer accuracy for wheat, other crops (Rabi), cotton, and sugarcane was observed in 2020; for wheat 88.8%, other crops (Rabi) 86%, cotton 85%, and 86% for sugarcane. The lowest producer accuracy for wheat, cotton, and other crops (Kharif) was observed in 1988: wheat 83%, cotton 82%, and 81% for other crops (Kharif). The highest user accuracy for rice, cotton, and other crops (Rabi) was observed in 1988: rice 88%, cotton 81.9%, and for other crops (Rabi) 84%. During the Kharif season, the producer’s accuracies ranged between 82% and 84% for cotton and 79% and 82% for rice, whereas for sugarcane and other crops (Kharif) they ranged from 82% to 87% and 80% to 83%, respectively.
In the Rabi season, the average accuracies for the producers as well as user were 86% and 85% for 1988, 81% and 83% for 1999, and 85% and 80% for 2020, respectively. Similarly, in the Kharif season, the average producer as well as user accuracies were 85% and 84% in 1988, 84% and 82.7% in 1999, and 84% and 84% in 2020, respectively (Table 6). Ref [25] also reported the overall accuracy ranged between 78% and 83% depending on the spatial analysis of satellite data.

4.3. Change in Net Irrigation Water Availability

In 1988, the net monthly irrigation depth available in the command area of the Khadil distributary was 55, 43, 25, and 13 mm for August, September, October, and November, respectively. In 1999, it increased to 68, 53, 31, and 16 mm for the above months, respectively. Similarly, in 2020, it increased to 98, 77, 45, and 23 mm. This increase in net irrigation depth was due to a decrease in command area from 3565 ha to 1985 ha from 1988 to 2020 (Table 3). The water allowance was 0.516 m3/s/1000 ha in 1988, which was increased to 0.92 m3/s/1000 ha in 2020 (Table 7). This increase in water allowance was due to a decrease in the canal command area. At the Multan distributary, the net monthly available irrigation depth was 58, 49, 50, and 30 mm in 1988, and 82, 69, 71, and 42 mm in 1999 for August, September, October, and November, respectively. In 2020, the net irrigation depth increased to 100, 84, 86, and 51 mm for August, September, October, and November, respectively. The water allowance was 0.62 m3/s/1000 ha in 1988, which was increased to 1.6 m3/s/1000 ha in 2020. This increase in water allowance was due to a decrease in the canal command area. At the Buch distributary, the net monthly irrigation depth available was 60, 50, 44, and 16 mm in 1988, and 65, 54, 48, and 18 mm for August, September, October, and November in 1999, respectively. In 2020, the net irrigation depth increased to 74, 62, 55, and 20 mm for August, September, October, and November, respectively. The water allowance was 0.56 m3/s/1000 ha in 1988, which was increased to 0.69 m3/s/1000 ha in 2020. The results indicate that the net available irrigation depth is increasing. The increase in net available irrigation depth may be a result of a reduction in command areas due to urban settlements, as these areas no longer require irrigation water.
At the Jalwala distributary, the net monthly irrigation depth available was 34, 23, 32, and 17 mm in 1988, and 39, 26, 37, and 20 mm for August, September, October, and November in 1999, respectively. In 2020, the net irrigation depth increased to 41, 27, 39, and 21 mm for August, September, October, and November, respectively. The increase in net irrigation depth available was due to decrease in the command area because of urbanization. The water allowance was 0.31 m3/s/1000 ha in 1988, which was increased to 0.38 m3/s/1000 ha in 2020. This increase in water allowance was due to a decrease in the canal command area. In 1988, the net monthly irrigation depth available in command area of Piran Ghaib Minor was 25, 23, 25, and 21 mm for August, September, October, and November, respectively. In 1999, the net irrigation depth was increased to 29, 27, 29, and 25 mm, respectively. Similarly, in 2020 it increased to 42, 39, 29, and 25 mm for the above months. This increase in net irrigation depth available was due to a decrease in command area from 415 ha to 250 ha from 1988 to 2020. The water allowance was 0.27 m3/s/1000 ha in 1988, which increased to 0.44 m3/s/1000 ha in 2020. This increase in water allowance was due to a decrease in the canal command area. In 1988, the net monthly irrigation depth available in command area of Khoja Minor was 23, 20, 24, and 22 mm for August, September, October, and November, respectively. In 1999, the net irrigation depth was increased to 25, 22, 25, and 24 mm, respectively. Similarly, in 2020 it increased to 31, 27, 32, and 30 mm. This increase in net irrigation depth available was due to a decrease in command area from 1600 ha to 1185 ha from 1988 to 2020. The water allowance was 0.23 m3/s/1000 ha in 1988, which was increased to 0.31 m3/s/1000 ha in 2020. This increase in water allowance was due to a decrease in the canal command area.
In 1988, the net monthly irrigation depth available in the command area of the Rashida distributary was 23, 18, 23, and 22 mm for August, September, October, and November, respectively. In 1999, the net irrigation depth increased to 27, 21, 27, and 26 mm, respectively. Similarly, in 2020 it increased to 34, 26, 34, and 33 mm. This increase in net irrigation depth available was due to decrease in command area from 4223 ha to 2850 ha from 1988 to 2020. The water allowance was 0.22 m3/s/1000 ha in 1988, which increased to 0.32 m3/s/1000 ha in 2020. This increase in water allowance was due to a decrease in the canal command area. At Tatepur Minor, the net monthly irrigation depth available was 26, 18, 26, and 24 mm in 1988, and 26, 19, 26, and 25 mm for August, September, October, and November in 1999, respectively. In 2020, the net irrigation depth increased to 30, 21, 30, and 28 mm for August, September, October, and November, respectively. The increase in net irrigation depth available was due to a decrease in the command area because of urbanization. The water allowance was 0.23 m3/s/1000 ha in 1988, which was increased to 0.27 m3/s/1000 ha in 2020. This increase in water allowance was due to a decrease in the canal command area. At Gulzar Minor, the net monthly irrigation depth available was 27, 20, 27, and 25 mm in 1988, and 29, 22, 30, and 28 mm for August, September, October, and November in 1999, respectively. In 2020, the net irrigation depth increased to 35, 27, 36, and 33 mm for August, September, October, and November, respectively. The increase in net irrigation depth available was due to decrease in the command area because of urbanization. The water allowance was 0.25 m3/s/1000 ha in 1988, which increased to 0.33 m3/s/1000 ha in 2020. This increase in water allowance was due to a decrease in the canal command area.

5. Discussion

Land use and land cover (LULC) studies may provide the exact calculation of land under certain features, which is very useful for proper planning [11,26,27]. The current study demonstrates the extent of urban settlements and their impacts on irrigated agriculture, cropping patterns, and water availability. Rapid urban settlement is occurring in the Multan region at the expense of agricultural land (especially mango orchards in the northwestern part). Furthermore, the reduction in orchard area was driven by increasing land prices, the development of housing societies around Multan’s orchard belt, the low price of mango produce at farm-gate, and a shortage of labor availability [24,26,28,29]. Moreover, the increase in fishponds was due to increasing demand for fresh-water fish with the increasing population and relatively high income. The riverbed had also been changed with the passage of time from 1988 to 2020. The reduction in area of river was due to change in river regime, construction of flood bunds, and the reduction in river flow [30]. The results for the Rabi seasons of 1988, 1999, and 2020 showed an increase in cultivated areas of wheat and other crops (Rabi). The increase in wheat and other crops (Rabi) cultivations were driven by increasing demands associated with population expansion. There was a significant reduction in cotton cultivation. The reduction in cotton cultivation was due to climate change, an increase in pest–insect attacks, and a lack of good quality seed [31]. There was a significant increase in rice cultivation. This increase was due to favorable climatic condition, less insect–pest attacks, and relatively high income compared to cotton. The finding also showed that sugarcane partially replaced cotton. The increase in sugarcane was driven by its higher market price due to the shifting of the sugar industry in the cotton growing areas. However, the cropping pattern is shifting towards wheat–rice, wheat–maize, and wheat with other crops due to the high production cost of cotton and changes in climate [11].
Similarly, various studies also reported the change in cropping pattern with the increase in urbanization in this part of the globe. Negative impacts of an increase in urbanization on crops, livestock interaction, and rural development have also been observed by [32,33,34]. Ref. [11] reported that the cropping pattern of Multan has changed during the last three decades (i.e., 1988–2017) due to high temperature and low precipitation. Similarly, the change in cropping pattern from cereal crops to vegetable crops was found in Beijing Metropolitan area. Due to the change in cropping pattern, the water demands for various crops have changed. In 1990, the annual water demand was 2112 m3/ha and in 2010, it increased to 2425 m3/ha [35]. Ref. [25] studied LULC classification and change-detection using multi-temporal images in Rachna Doab during 2006–2012. They reported that the change in cropping pattern adopted by the farmers was wheat–rice–wheat; wheat–cotton–wheat; wheat–sugarcane–wheat; wheat–kharif fodder–wheat, and rice–kharif fodder–rice. Ref. [36] conducted a study on the impact of cropping pattern shifts on natural resources. They concluded that area under cotton was decreased in Pakistan because of farmers adopting competitive crops like sugarcane due to an increasing number of sugarcane mills in cotton-growing areas. Irrigation should play an important role in stabilizing food security, especially in the less developed parts of the world. However, surface water supplies in these areas are not enough to exploit the potential of soil and crops towards achieving food security [37,38,39]. Ref. [40] initiated research on urbanization, agricultural water uses, and regional and national crop production in China. They concluded that with an increase in the urban population, a decrease in water availability for agricultural use had occurred. An increase of 1% in urban settlements caused a reduction of about half a percent (0.5%) of water availability for agricultural uses. There was a decrease in water availability for agricultural use in irrigated areas as compared to rain-fed areas. Reducing losses of irrigation water for agriculture due to a rapid increase in urbanization, a re-assessment of water allocation, adoption of water-saving technologies, and providing incentives to farmers should be considered.

6. Conclusions

The aim of this research was to give a current view of changes in LULC, cropping patterns, and water allowance in the Multan district. The results indicated that urban settlement has expanded in the middle of the northwest part of the study area. The expansion of urban settlements in the middle of the northwest led to a reduction in orchard area from 1988 to 2020. Furthermore, the urban settlements have increased to 124% at a rate of 3.88% per year in the last 32 years. The cropped area for orchards has decreased at a rate of 2.63% per year. The cropped area of cotton has also decreased (42.5%) at a rate of 1.3% per year. The cropped areas of vegetables and food have increased from 1988 to 2020 at a rate of 5.75% per year. The change in cropping pattern was observed from cotton to rice and other crops. The 35% reduction in cropped areas of cotton was observed from 1999 to 2020, which was replaced by urban settlements, other crops, rice, and sugarcane. Cotton cultivation was mainly affected by environmental change, an increase in pest–insect attacks, and a lack of quality seeds. There was an increase of 125% in water availability depth from 1988 to 2020 due to a decrease in command area of distributary/minors, due to the development of urban settlements. As a result, water allowance increased by 110% from 1988 to 2020. These results showed that the re-assessment of water allocation among farmers may be considered for the equitable distribution of canal water resources.

Author Contributions

Conceptualization, K.M.Z., T.S. and H.U.F.; methodology, K.M.Z., R.A. and M.A.I.; software, M.S.; validation, K.M.Z., T.S., H.U.F. and M.A.I.; formal analysis, K.M.Z.; investigation, M.A.I.; data curation, A.A., M.A., M.S. and H.U.F.; writing—original draft preparation, K.M.Z.; writing—review and editing, M.S. and R.A.; visualization, A.A. and M.A., supervision, T.S. and R.A. All authors have read and agreed to the published version of the manuscript.

Funding

This research received no external funding.

Data Availability Statement

Data will be made available from the first author on reasonable request.

Conflicts of Interest

The authors declare no conflicts of interest.

References

  1. Khan, R.; Li, H.; Afzal, Z.; Basir, M.; Arif, M.; Hassan, W. Monitoring Subsidence in Urban Area by PSInSAR: A Case Study of Abbottabad City, Northern Pakistan. Remote Sens. 2021, 13, 1651. [Google Scholar] [CrossRef]
  2. Lebu, S.; Lee, A.; Salzberg, A.; Bauza, V. Adaptive Strategies to Enhance Water Security and Resilience in Low-and Middle-Income Countries: A Critical Review. Sci. Total Environ. 2024, 925, 171520. [Google Scholar] [CrossRef] [PubMed]
  3. Azizi, M.A.; Leandro, J. Factors Affecting Transboundary Water Disputes: Nile, Indus, and Euphrates–Tigris River Basins. Water 2025, 17, 525. [Google Scholar] [CrossRef]
  4. Aslam, R.W.; Shu, H.; Yaseen, A. Monitoring the Population Change and Urban Growth of Four Major Pakistan Cities through Spatial Analysis of Open Source Data. Ann. GIS 2023, 29, 355–367. [Google Scholar] [CrossRef]
  5. Alam, M.J.B.; Rahman, M.H.; Khan, S.; Munna, G.M. Unplanned Urbanization: Assessment through Calculation of Environmental Degradation Index. Int. J. Environ. Sci. Technol. 2006, 3, 119–130. [Google Scholar] [CrossRef]
  6. Governament of Pakistan, Agricultural Census 2010. Statistics Division; Agricultural Census Organization: Lahore, Pakistan, 2012; Volume 59.
  7. Putra, D.P.E.; Baier, K. Impact of Urbanization on Groundwater Recharge-The Example of the Indonesian Million City Yogyakarta. In Proceedings of the UN Habitat-United Nations Settlement Programs: Fourth session of the World Urban Forum, Nanjing, China, 3–6 November 2008. [Google Scholar]
  8. Mangi, M.Y.; Yue, Z.; Kalwar, S.; Ali Lashari, Z. Comparative Analysis of Urban Development Trends of Beijing and Karachi Metropolitan Areas. Sustainability 2020, 12, 451. [Google Scholar] [CrossRef]
  9. Beckers, V.; Poelmans, L.; Van Rompaey, A.; Dendoncker, N. The Impact of Urbanization on Agricultural Dynamics: A Case Study in Belgium. J. Land. Use Sci. 2020, 15, 626–643. [Google Scholar] [CrossRef]
  10. Bo Del, A.; Bignami, D.F.; Bruno, F.; Cardinale, M.V.; Perego, S. An Experience of Urban Transformation in Multan-Pakistani Punjab. In Regeneration of the Built Environment from a Circular Economy Perspective; Springer: Berlin/Heidelberg, Germany, 2020. [Google Scholar]
  11. Hussain, S.; Mubeen, M.; Akram, W.; Ahmad, A.; Habib-ur-Rahman, M.; Ghaffar, A.; Amin, A.; Awais, M.; Farid, H.U.; Farooq, A.; et al. Study of Land Cover/Land Use Changes Using RS and GIS: A Case Study of Multan District, Pakistan. Environ. Monit. Assess. 2020, 192, 2. [Google Scholar] [CrossRef]
  12. Mahlayeye, M.; Darvishzadeh, R.; Nelson, A. Cropping Patterns of Annual Crops: A Remote Sensing Review. Remote Sens. 2022, 14, 2404. [Google Scholar] [CrossRef]
  13. Ozesmi, S.L.; Bauer, M.E. Satellite Remote Sensing of Wetlands. Wetl. Ecol. Manag. 2002, 10, 381–402. [Google Scholar] [CrossRef]
  14. Zoungrana, B.J.; Conrad, C.; Thiel, M.; Amekudzi, L.K.; Da, E.D. MODIS NDVI Trends and Fractional Land Cover Change for Improved Assessments of Vegetation Degradation in Burkina Faso, West Africa. J. Arid. Environ. 2018, 153, 66–75. [Google Scholar] [CrossRef]
  15. Hu, Y.; Raza, A.; Syed, N.R.; Acharki, S.; Ray, R.L.; Hussain, S.; Dehghanisanij, H.; Zubair, M.; Elbeltagi, A. Land Use/Land Cover Change Detection and NDVI Estimation in Pakistan’s Southern Punjab Province. Sustainability 2023, 15, 3572. [Google Scholar] [CrossRef]
  16. Seyam, M.M.H.; Haque, M.R.; Rahman, M.M. Identifying the Land Use Land Cover (LULC) Changes Using Remote Sensing and GIS Approach: A Case Study at Bhaluka in Mymensingh, Bangladesh. Case Stud. Chem. Environ. Eng. 2023, 7, 100293. [Google Scholar] [CrossRef]
  17. Tahir, Z.; Haseeb, M.; Mahmood, S.A.; Batool, S.; Abdullah-Al-Wadud, M.; Ullah, S.; Tariq, A. Predicting Land Use and Land Cover Changes for Sustainable Land Management Using CA-Markov Modelling and GIS Techniques. Sci. Rep. 2025, 15, 3271. [Google Scholar] [CrossRef]
  18. Aghajani, H.; Sarkari, F.; Fattahi Moghaddam, M. Predicting Land Use/Land Cover Changes Using CA-Markov and LCM Models in the Metropolitan Area of Mashhad, Iran. Model. Earth Syst. Environ. 2024, 10, 7079–7096. [Google Scholar] [CrossRef]
  19. Rawat, J.S.; Kumar, M. Monitoring Land Use/Cover Change Using Remote Sensing and GIS Techniques: A Case Study of Hawalbagh Block, District Almora, Uttarakhand, India. Egypt. J. Remote Sens. Sp. Sci. 2015, 18, 77–84. [Google Scholar] [CrossRef]
  20. Rawat, J.S.; Biswas, V.; Kumar, M. Changes in Land Use/Cover Using Geospatial Techniques: A Case Study of Ramnagar Town Area, District Nainital, Uttarakhand, India. Egypt. J. Remote Sens. Sp. Sci. 2013, 16, 111–117. [Google Scholar] [CrossRef]
  21. Fan, Y.; Gao, Z.; Wang, S.; Chen, H.; Liu, J. Evaluation of the Water Allocation and Delivery Performance of Jiamakou Irrigation Scheme, Shanxi, China. Water 2018, 10, 654. [Google Scholar] [CrossRef]
  22. Governament of Pakistan, Pakistan Demograhic Survey-2020. Ministry of Planning, Development and Special Initiatives; Pakistan Beureau of Statistics: Islamabad, Pakistan, 2020; Volume 162.
  23. Gao, J.; Liu, Y. Determination of Land Degradation Causes in Tongyu County, Northeast China via Land Cover Change Detection. Int. J. Appl. Earth Obs. Geoinf. 2010, 12, 9–16. [Google Scholar] [CrossRef]
  24. Naeem, M.; Farid, H.U.; Madni, M.A.; Ahsen, R.; Khan, Z.M.; Dilshad, A.; Shahzad, H. Remotely Sensed Image Interpretation for Assessment of Land Use Land Cover Changes and Settlement Impact on Allocated Irrigation Water in Multan, Pakistan. Environ. Monit. Assess. 2022, 194, 98. [Google Scholar] [CrossRef]
  25. Usman, M.; Liedl, R.; Shahid, M.A.; Abbas, A. Land use/land cover Classification and its Change Detection Using Multi-temporal MODIS NDVI. J. Geographical sciences. 2015, 25, 1479–1506. [Google Scholar] [CrossRef]
  26. Tesfaye, W.; Elias, E.; Warkineh, B.; Tekalign, M.; Abebe, G. Modeling of Land Use and Land Cover Changes Using Google Earth Engine and Machine Learning Approach: Implications for Landscape Management. Environ. Syst. Res. 2024, 13, 31. [Google Scholar] [CrossRef]
  27. Aryal, J.; Sitaula, C.; Frery, A.C. Land Use and Land Cover (LULC) Performance Modeling Using Machine Learning Algorithms: A Case Study of the City of Melbourne, Australia. Sci. Rep. 2023, 13, 13510. [Google Scholar] [CrossRef] [PubMed]
  28. Mohsin, M.; Mehmood, S.; Jamal, F.; Anwer, M.M. Modeling and Forecasting of Declining Area and Production of Mango Orchards in District Bahawalpur, Pakistan. J. Agric. Res. 2021, 59, 197–212. [Google Scholar]
  29. Yagi, H.; Garrod, G. The Future of Agriculture in the Shrinking Suburbs: The Impact of Real Estate Income and Housing Costs. Land. Use Policy 2018, 76, 812–822. [Google Scholar] [CrossRef]
  30. Wrzesiński, D.; Sobkowiak, L. Transformation of the Flow Regime of a Large Allochthonous River in Central Europe—An Example of the Vistula River in Poland. Water 2020, 12, 507. [Google Scholar] [CrossRef]
  31. Arshad, A.; Raza, M.A.; Zhang, Y.; Zhang, L.; Wang, X.; Ahmed, M.; Habib-ur-rehman, M. Impact of Climate Warming on Cotton Growth and Yields in China and Pakistan: A Regional Perspective. Agriculture 2021, 11, 97. [Google Scholar] [CrossRef]
  32. Swain, B.B.; Teufel, N. The Impact of Urbanisation on Crop–Livestock Farming System: A Comparative Case Study of India and Bangladesh. J. Soc. Econ. Dev. 2017, 19, 161–180. [Google Scholar] [CrossRef]
  33. Anwar, M.M.; Breuste, J.H.; Ahmad, A.; Aziz, A.; Aldosari, A.A. Quantifying the Impacts of Urbanization on Urban Agriculture and Food Security in the Megacity Lahore, Pakistan. Sustainability 2023, 15, 12143. [Google Scholar] [CrossRef]
  34. Braamhaar, D.J.M.; van der Lee, J.; Bebe, B.O.; Oosting, S.J. From Rural to Urban: Exploring Livestock Farming Practices in Urbanizing Landscapes. Agric. Syst. 2025, 225, 104297. [Google Scholar] [CrossRef]
  35. Huang, J.; Ridoutt, B.G.; ZHANG, H.; CHEN, F. Cropping Pattern Modifications Change Water Resource Demands in the Beijing Metropolitan Area. J. Integr. Agric. 2012, 11, 1914–1923. [Google Scholar] [CrossRef]
  36. Shahzad, M.; Iftikhar, M.; Shahbaz, B.; Wajid, S.A. Impact of Cropping Pattern Shift on Livelihood Assets of the Farmers in Punjab, Pakistan. Int. J. Agric. Ext. 2021, 8, 189–197. [Google Scholar] [CrossRef]
  37. Fader, M.; Shi, S.; von Bloh, W.; Bondeau, A.; Cramer, W. Mediterranean Irrigation under Climate Change: More Efficient Irrigation Needed to Compensate for Increases in Irrigation Water Requirements. Hydrol. Earth Syst. Sci. 2016, 20, 953–973. [Google Scholar] [CrossRef]
  38. Velasco-Muñoz, J.F.; Aznar-Sánchez, J.A.; Batlles-delaFuente, A.; Fidelibus, M.D. Sustainable Irrigation in Agriculture: An Analysis of Global Research. Water 2019, 11, 1758. [Google Scholar] [CrossRef]
  39. Abdi, A.H.; Mohamed, A.A.; Mohamed, F.H. Enhancing Food Security in Sub-Saharan Africa: Investigating the Role of Environmental Degradation, Food Prices, and Institutional Quality. J. Agric. Food Res. 2024, 17, 101241. [Google Scholar] [CrossRef]
  40. Yan, T.; Wang, J.; Huang, J. Urbanization, Agricultural Water Use, and Regional and National Crop Production in China. Ecol. Modell. 2015, 318, 226–235. [Google Scholar] [CrossRef]
Figure 1. Map of the study area. The points represent training data sets and ground truthing. Two areas represent whole Multan district (in pink) and two Tehsils of district Multan (Multan City and Multan Sadar).
Earth 06 00079 g001
Figure 2. Flow chart showing steps of remote sensing data analysis.
Earth 06 00079 g002
Figure 3. Land cover/land use (LULC) classification maps of the study area for the Rabi and Kharif seasons of the years 1988, 1999, 2020. The maps highlight the major LULC classes such as rice, fishponds, sugarcane, other crops, water bodies, orchards, cotton, wheat, urban settlements.
Earth 06 00079 g003
Figure 4. Cropping pattern changes in Rabi seasons (from 1988 to 1999 and 1999 to 2020).
Earth 06 00079 g004
Figure 5. Cropping pattern changes in Kharif seasons (from 1988 to 1999 and 1999 to 2020).
Earth 06 00079 g005
Table 1. Acquired data and source.
Type and SourceData ComponentsDescription/Details
Satellite data
(glovis.usgs.gov)
LANDSAT 4-5 Thematic Mapper (TM)
LANDSAT 8 Operational Land Imager (OLI)
30 m resolution, 7 spectral bands, for year 1988 and 1999
30 m resolution, 11 spectral bands for the year 2020.
Metrological data
(Pakistan Metrological Department, Islamabad)
Precipitation, Temperature, Wind Speed, Humidity and Sunshine HoursFor the year 1988 to 2020
Agriculture data
(Agriculture Department)

Irrigation data
(Irrigation Department)
Agricultural Census Data, Crop Calendar, Crop Coefficient, and Crop Rotation
Canal Flow Data, Canal Command Area
For the years 1988, 1999 and 2020


August to November, 2020
Table 2. Information related to Sidhani canal distributaries in study area.
DistributaryCodeLocationType *Assig. Discharge (m3/s)Command Area Change due to Urbanization (ha)
198819992020
Khadil16HeadNP1.84356528651985
Multan22MiddleNP1.3020701070785
Buch31TailNP1.1195318001585
Jalwala4HeadP1.37443438533658
Piran Ghaib11MiddleP0.11415363250
Khoja Minor45TailP0.37160014851185
Rashida26HeadP0.91422335852850
Tatepur Minor33MiddleP0.58247924002138
Gulzar Minor43TailP0.41163614851240
* Non-perennial (NP), Perennial (P).
Table 3. Land cover/land use area distribution and change detection in area distribution during Rabi and Kharif seasons of the years 1988, 1999, and 2020.
LULC TypeArea Distribution (ha)Change Detection (%)
1988199920201988–19991999–20201988–2020
Urban31,20044,40069,80042.357.2123.7
River300016001600−46.70.0−46.7
Fishponds014002900-107.1-
Sugarcane5681123324083.3190.9433.3
Rice1547322813,122100.0309.4718.8
Wheat62,20057,30079,200−7.938.227.3
Cotton70,67662,19640,791−12.4−34.4−42.5
Other Crops (R)19,23223,57726,83122.313.638.9
Other Crops (K)20,19229,68758,03247.095.3187.1
Orchard82,44066,00014,600−19.9−77.9−82.3
Table 4. Changes in land in Rabi and Kharif seasons from 1988 to 2020.
Land TypesChange Detection in Rabi Season (%)Land TypesChange Detection in Kharif Season (%)
1988–19992000–20201988–19992000–2020
Orchard to Urban13.734.8Cotton to Urban2.83.9
Orchard to Wheat033.2Cotton to Other Crops6.321.3
Orchard to Fishponds02.1Cotton to Rice2.09.3
Orchard to Other Crops1.75.0Orchard to Other Crops6.223
Orchard to Sugarcane03.0Orchard to Rice0.46.3
Wheat to Sugarcane1.00.0Cotton to Sugarcane0.81.2
Wheat to Other Crops4.80.0---
Wheat to Fishponds2.10.0---
Table 5. Accuracy report of ground truthing for LULC classification maps.
LULC ClassesProducer’s AccuracyUser’s Accuracy
198819992020Avg.198819992020Avg.
Urban8486888690868487
Rivers8290858684798583
Fishponds8678798180828683
Orchards8484878592758985
Wheat83.184.588.885.584.278.68682.9
Sugarcane (Rabi)83.579.580.781.279.581.685.782.3
Other crops (Rabi)81.280.58682.683.782.867.578
Cotton8283.184.883.381.978.281.580.5
Rice81.979.280.780.687.681.685.784.9
Sugarcane (Kharif)83.181.986.483.878.785.380.581.5
Other crops (Kharif)80.682.680.981.478.182.879.580.1
Table 6. Detail of periodic K (Kappa Coefficient) and accuracies for LULC classification maps.
YearRabi SeasonKharif Season
Avg. Producer’s AccuracyAvg. User’s AccuracyOverall AccuracyKAvg. Producer’s AccuracyAvg. User’s AccuracyOverall AccuracyK
198886.186.488.50.7685.381.887.00.82
199981.383.085.40.7884.482.890.20.85
202085.180.186.00.8384.184.088.60.79
Average82.283.286.60.7984.683.588.600.82
Table 7. Change in water allowance in the study area.
DistributaryChange in Water Allowance (m3/s)/1000 ha)
198819992020
Khadil0.5160.6420.92
Multan0.6281.211.65
Buch0.5630.6110.694
Jalwala0.310.3560.375
Piran Ghaib0.2650.3030.44
Khoja Minor0.2310.2490.312
Rashida0.2150.2540.319
Tatepur Minor0.2340.2420.271
Gulzar Minor0.2510.2760.331
Disclaimer/Publisher’s Note: The statements, opinions and data contained in all publications are solely those of the individual author(s) and contributor(s) and not of MDPI and/or the editor(s). MDPI and/or the editor(s) disclaim responsibility for any injury to people or property resulting from any ideas, methods, instructions or products referred to in the content.

