
Satellite-Based Approach for Crop Type Mapping and Assessment of Irrigation Performance in the Nile Delta


Abstract
1. Introduction
2. Materials and Methods
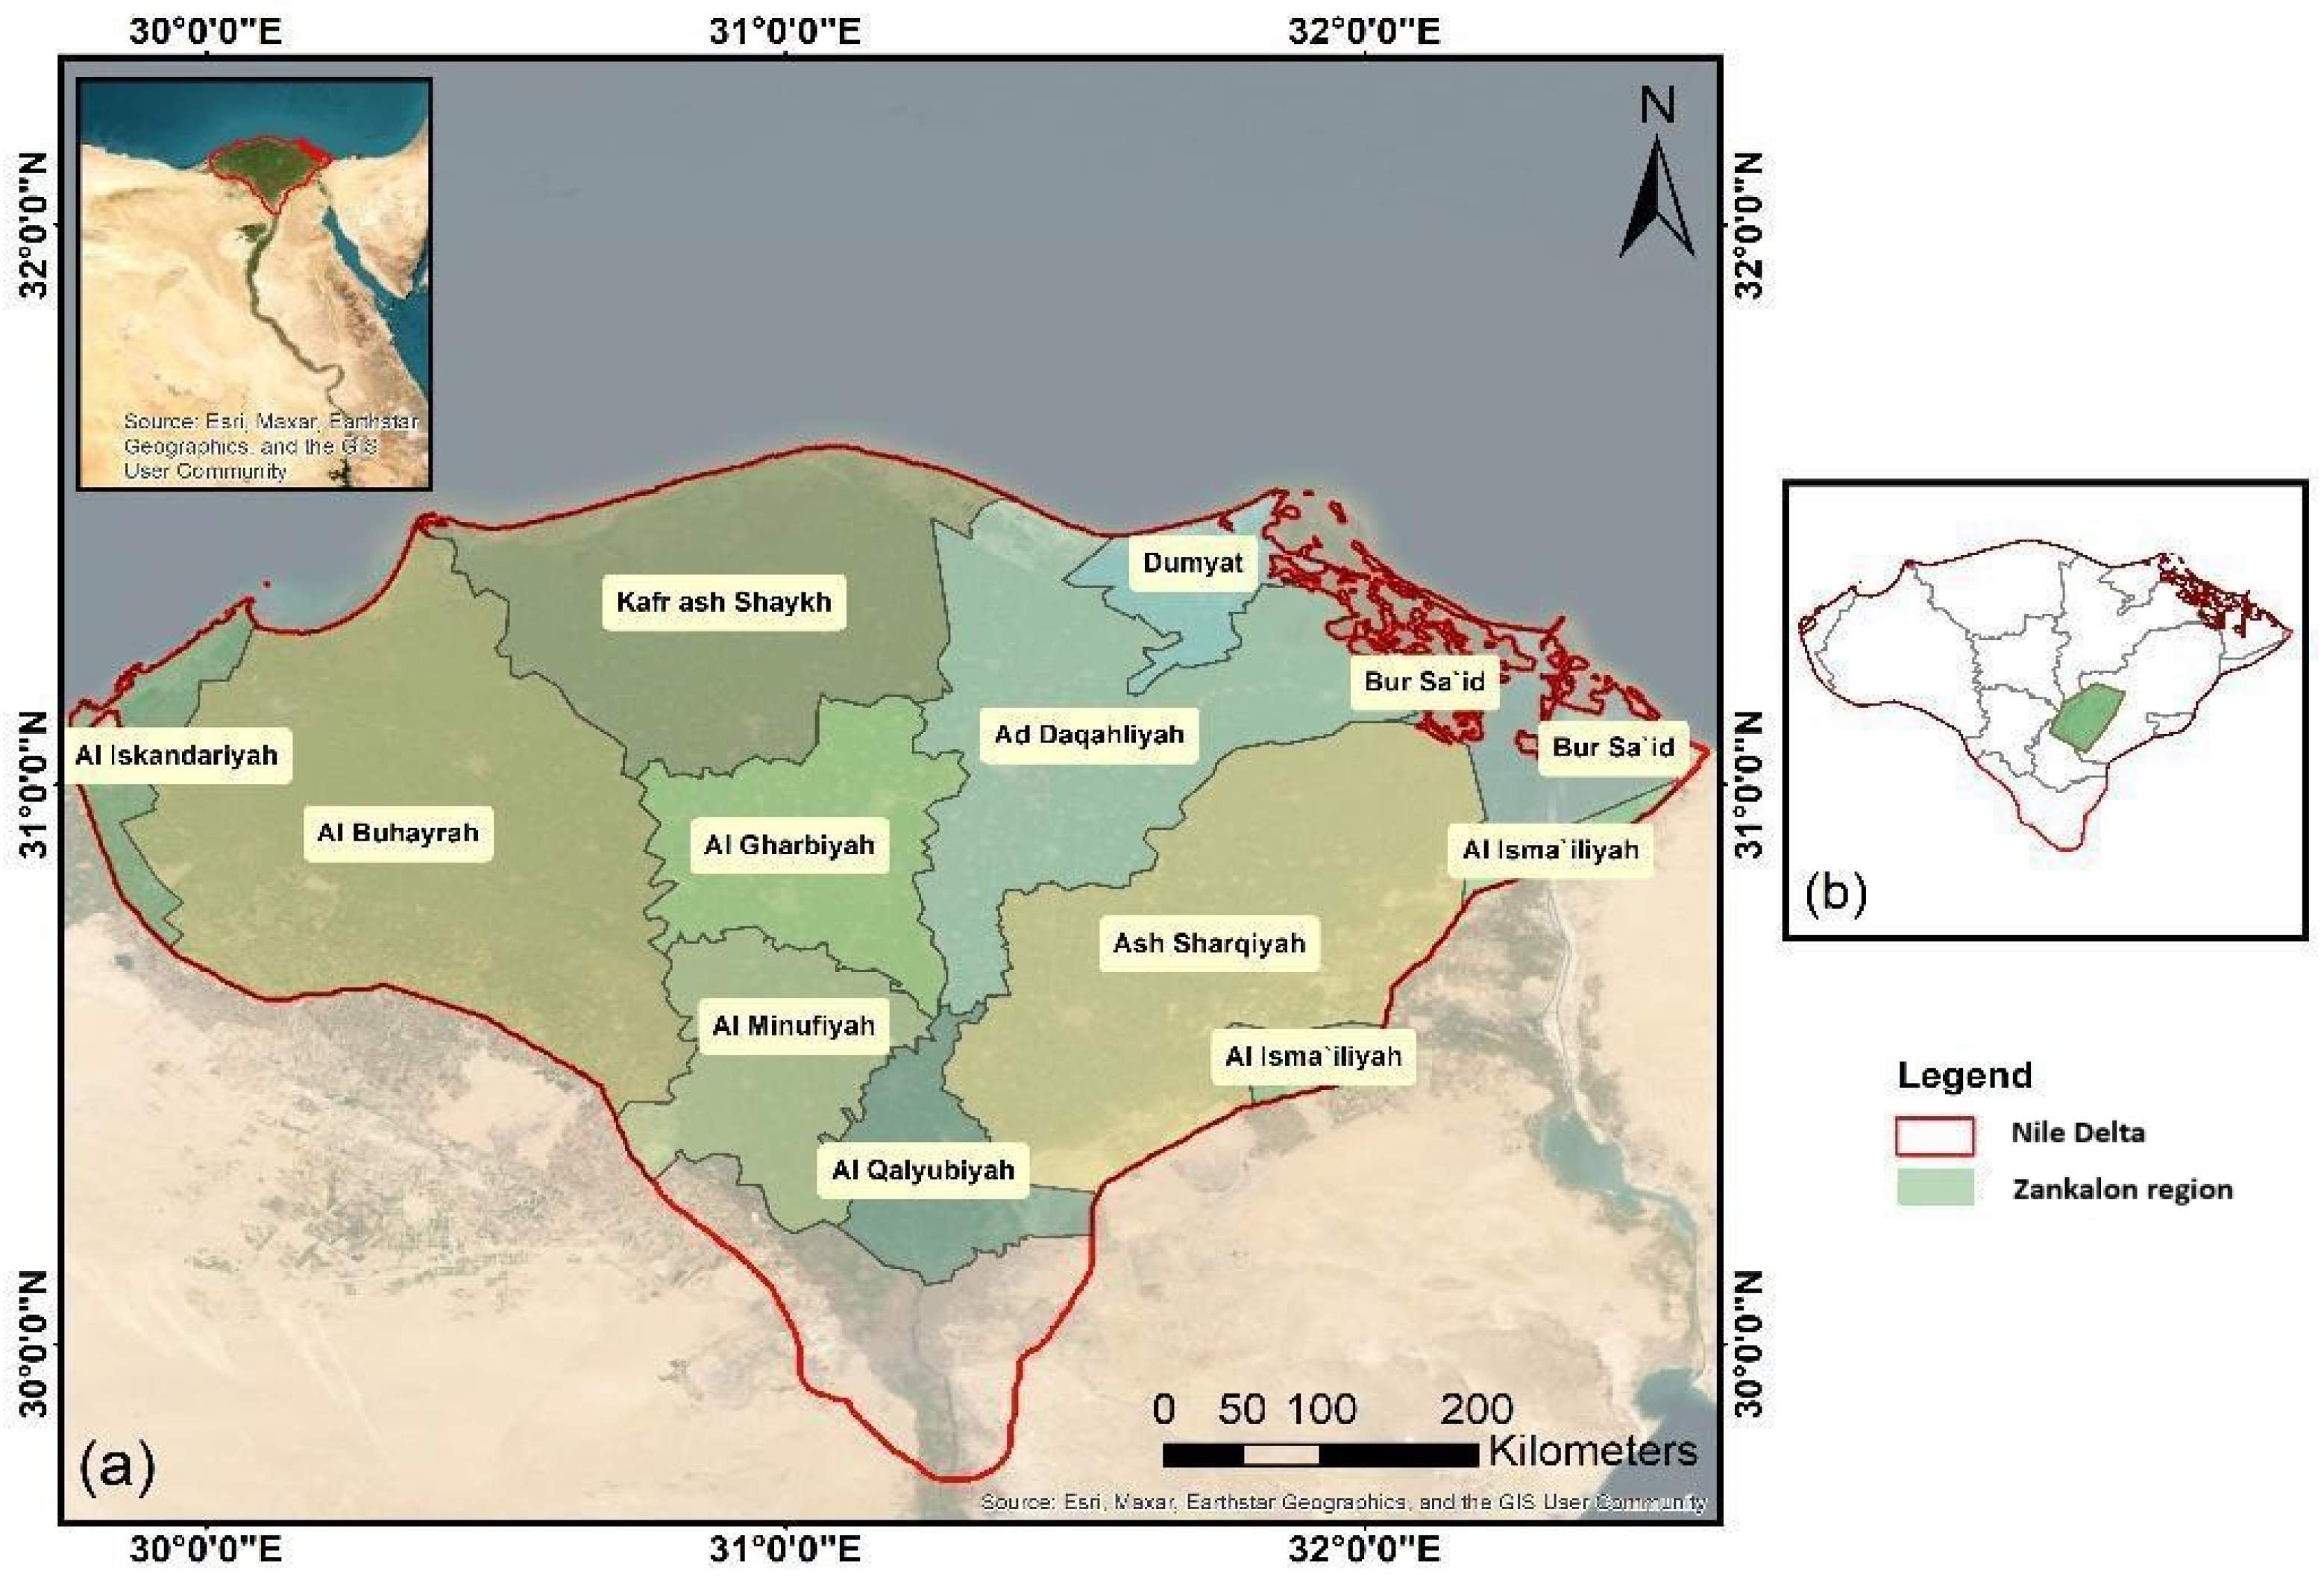
2.1. Study Area
2.2. Input Data
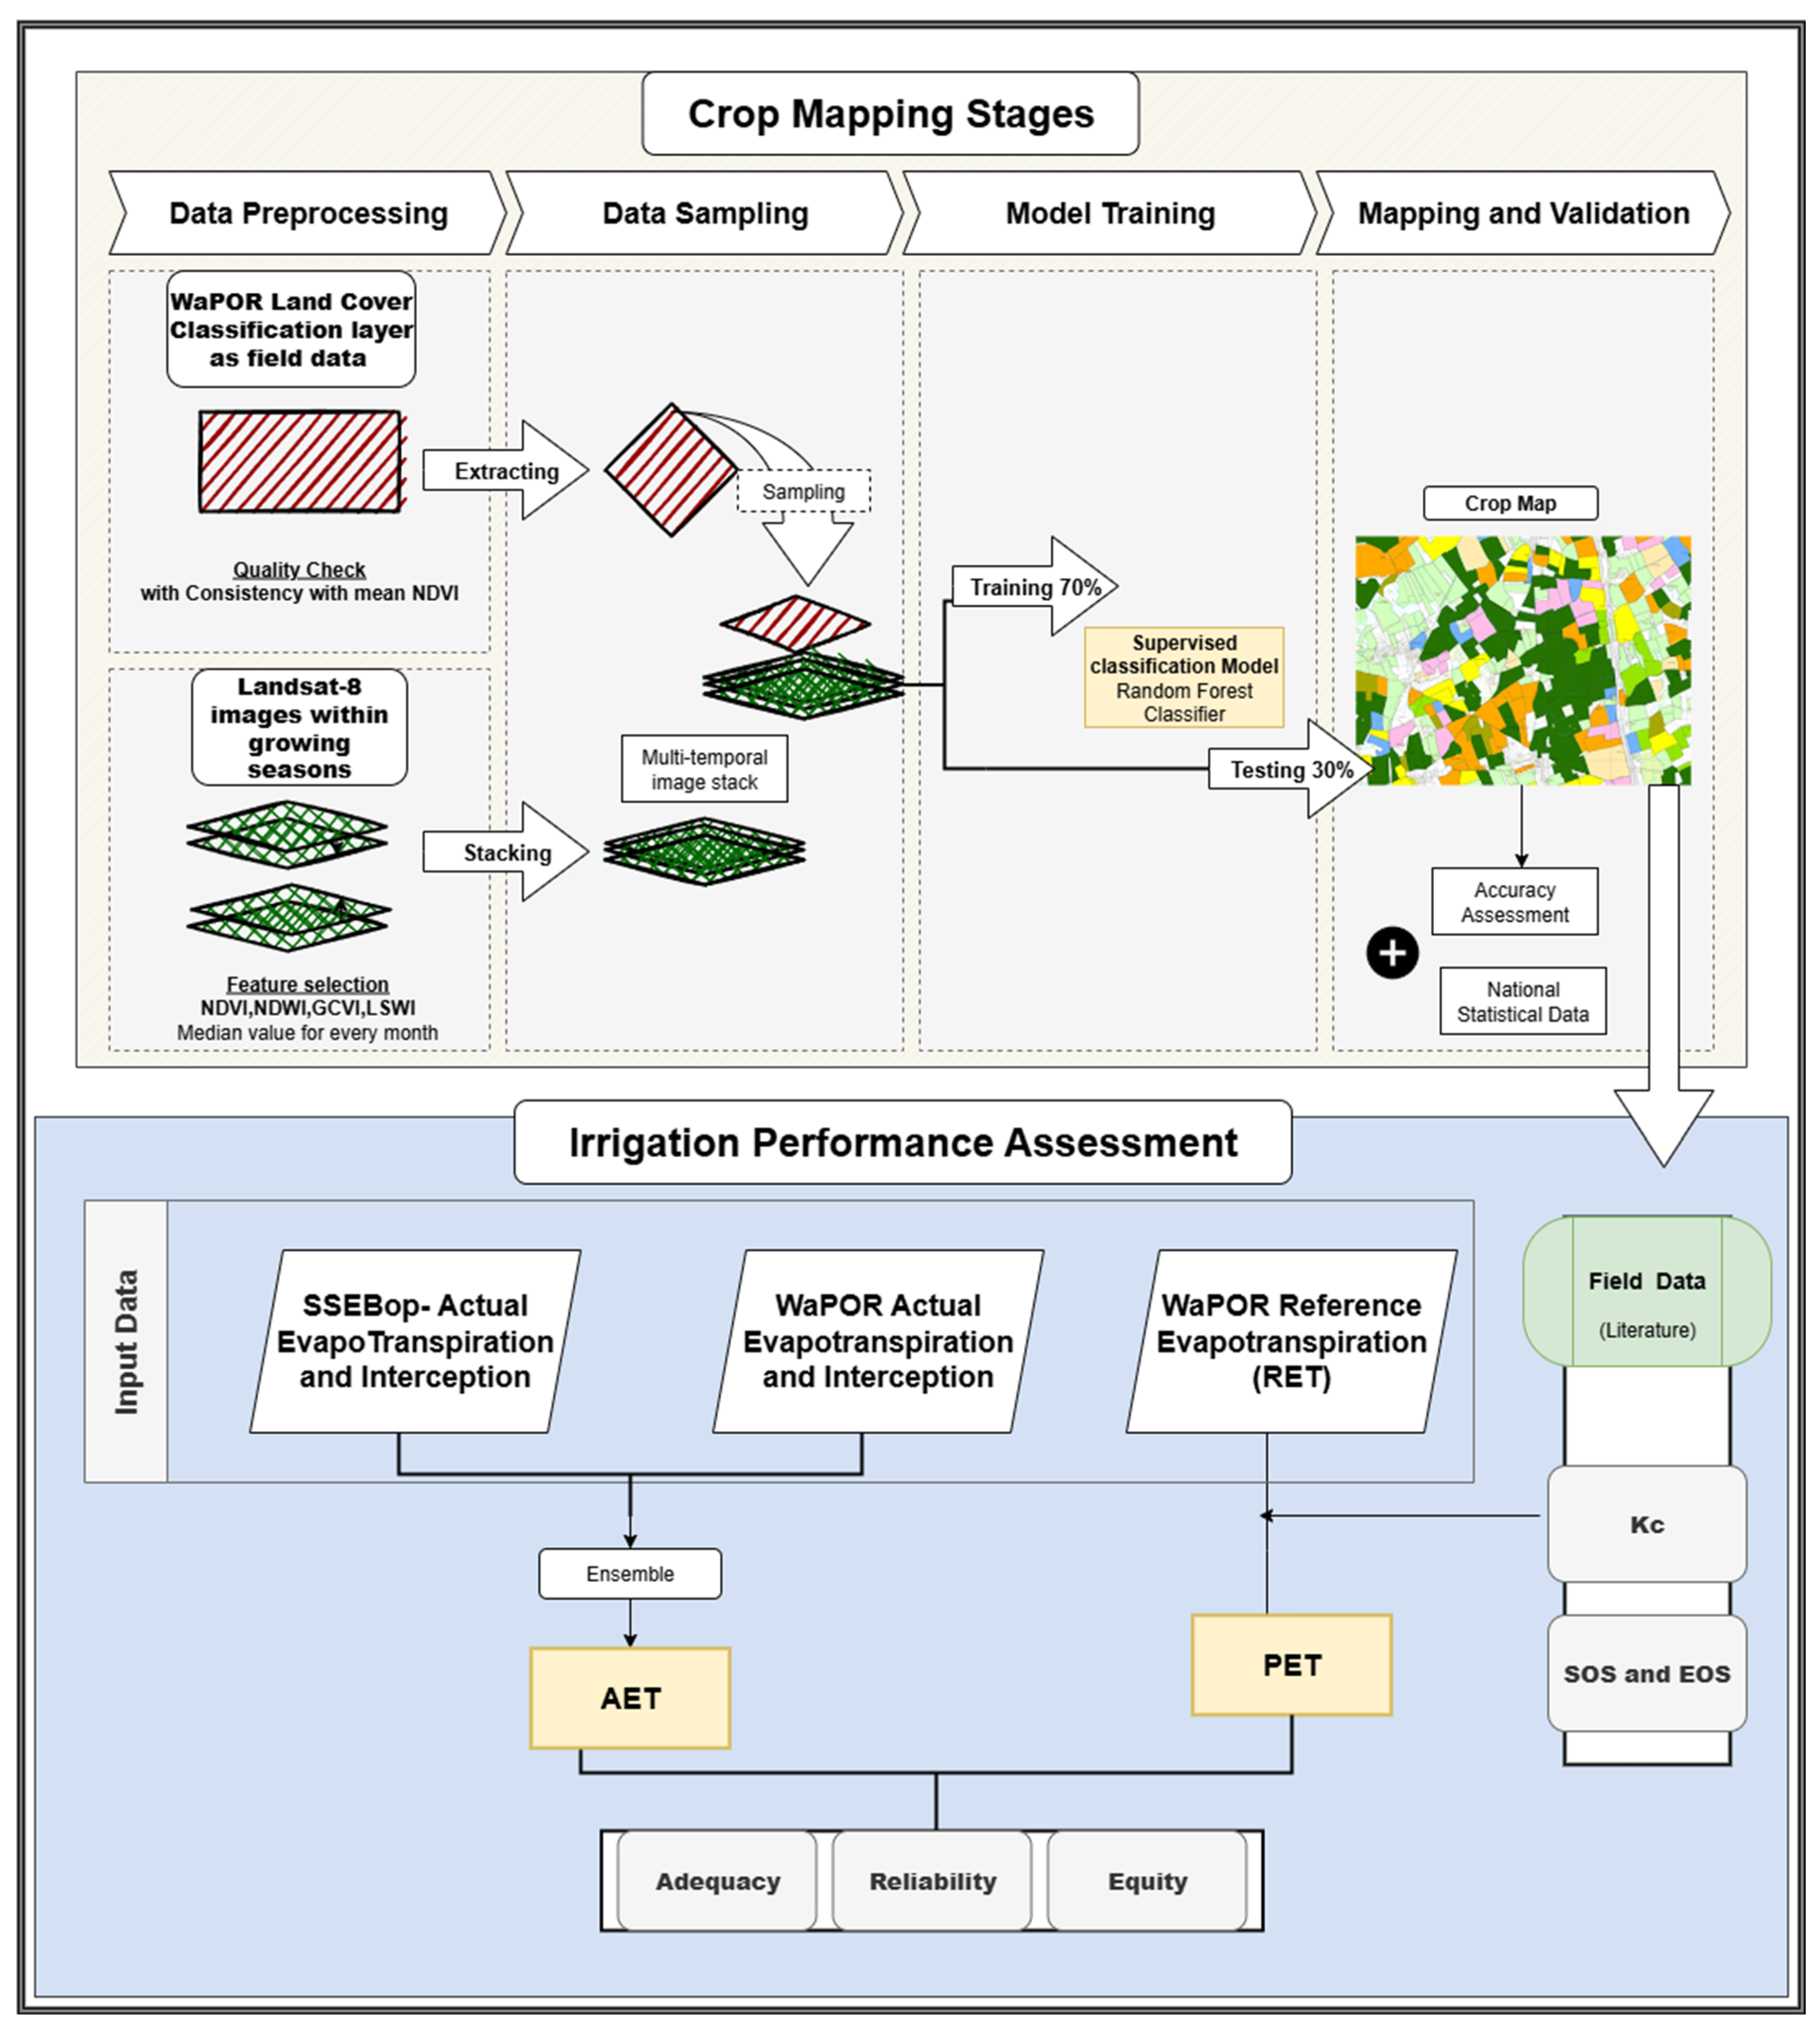
2.3. Data Preparation and Framework for Crop Classification
2.3.1. Satellite Data Pre-Processing
2.3.2. Reference Data Sampling
2.3.3. Model Training
2.3.4. Mapping and Validation
- Accuracy Assessment
- -
- Overall Accuracy (OA): The proportion of test samples that were correctly classified out of the total number of samples.
- -
- User Accuracy (UA): Indicates the probability that a pixel classified into a given class truly belongs to that class and is reflected by commission errors (instances where samples are incorrectly assigned to a class).
- -
- Statistical Data Comparison
2.4. Data Preparation and Framework for Assessing the Irrigation Performance
Performance Assessment Indicators

| Indicator | Definition | Range | Reference |
|---|---|---|---|
| Adequacy | Relative evapotranspiration (AETs/PETs) | Sufficient supply: 0.75 < A ≤ 1, Inadequate supply: A ≤ 0.65 | [79] |
| Reliability | Temporal variation of AETs/PETs | CV ≈ 0 indicating the highest reliability | [70] |
| Equity | CV of actual evapotranspiration (AETs) | Good equity: 0% ≤ CV ≤ 10%, Fair equity: 10% ≤ CV ≤ 25%, Poor equity: CV ≥ 25% | [79] |
3. Results
3.1. Crop Type Distribution
3.2. Crop Classification Technical Validation
3.2.1. Accuracy Assessment of Crop Type Mapping
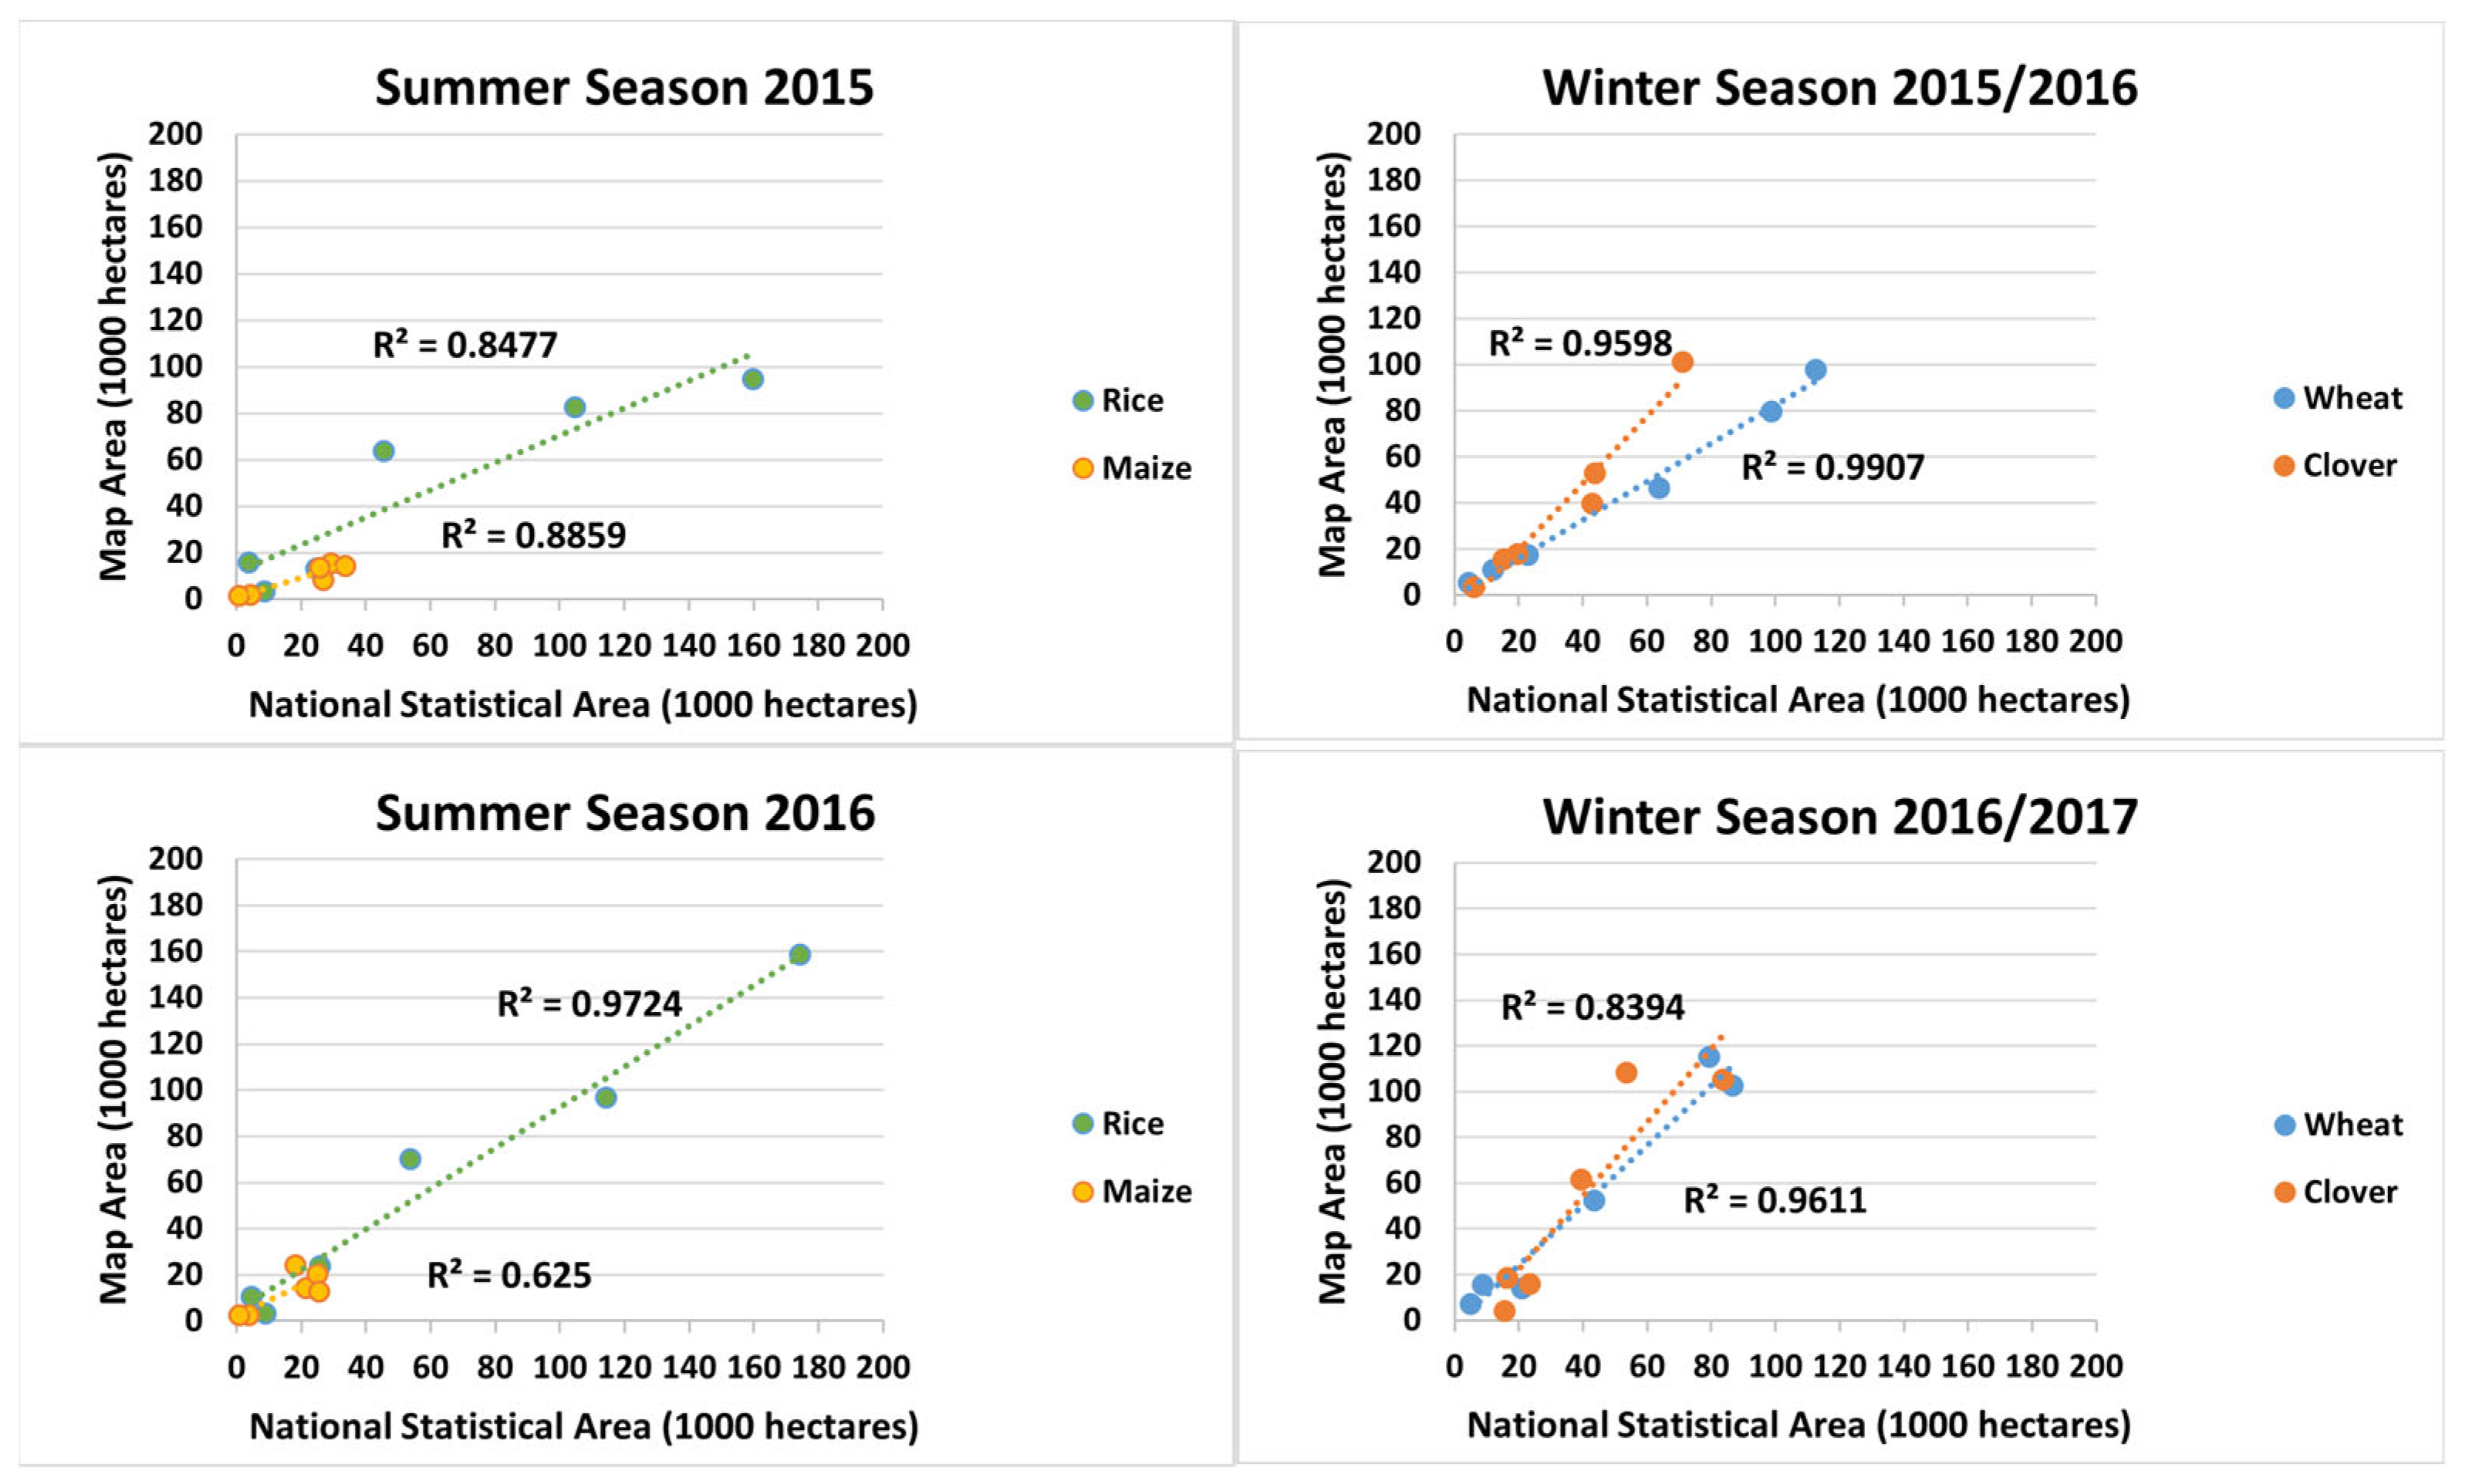
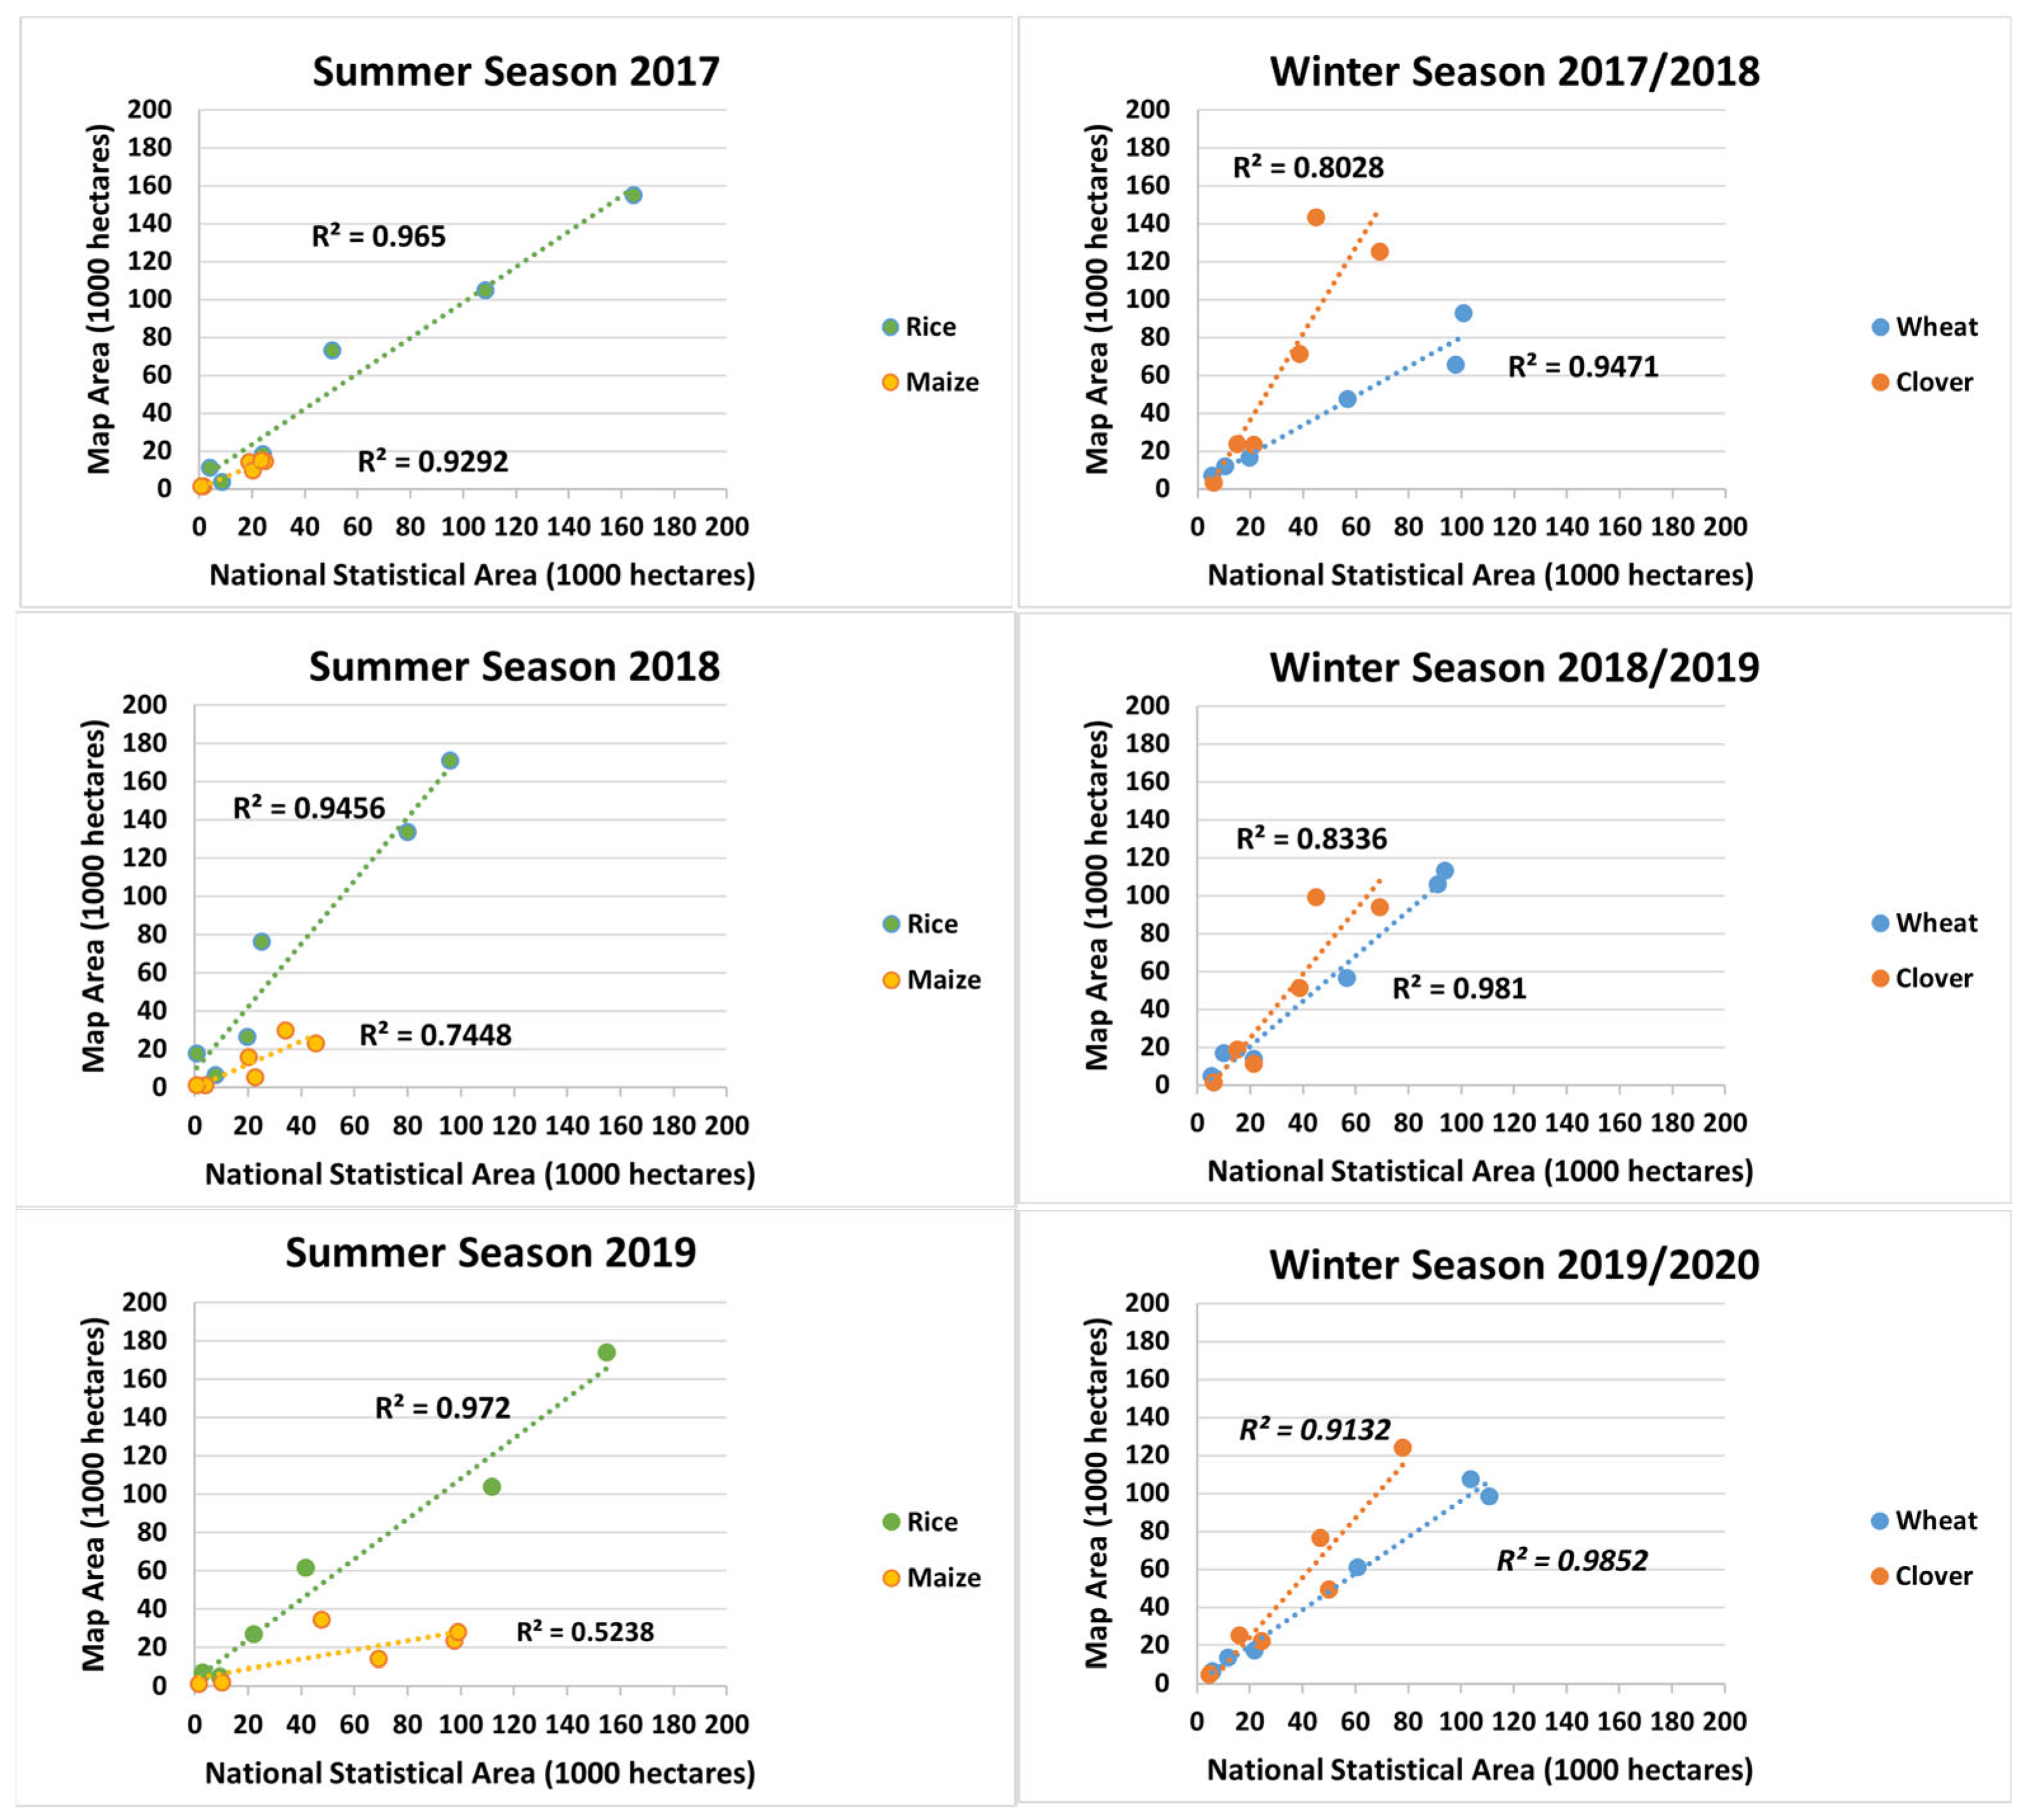
3.2.2. Compared with Official Statistical Data
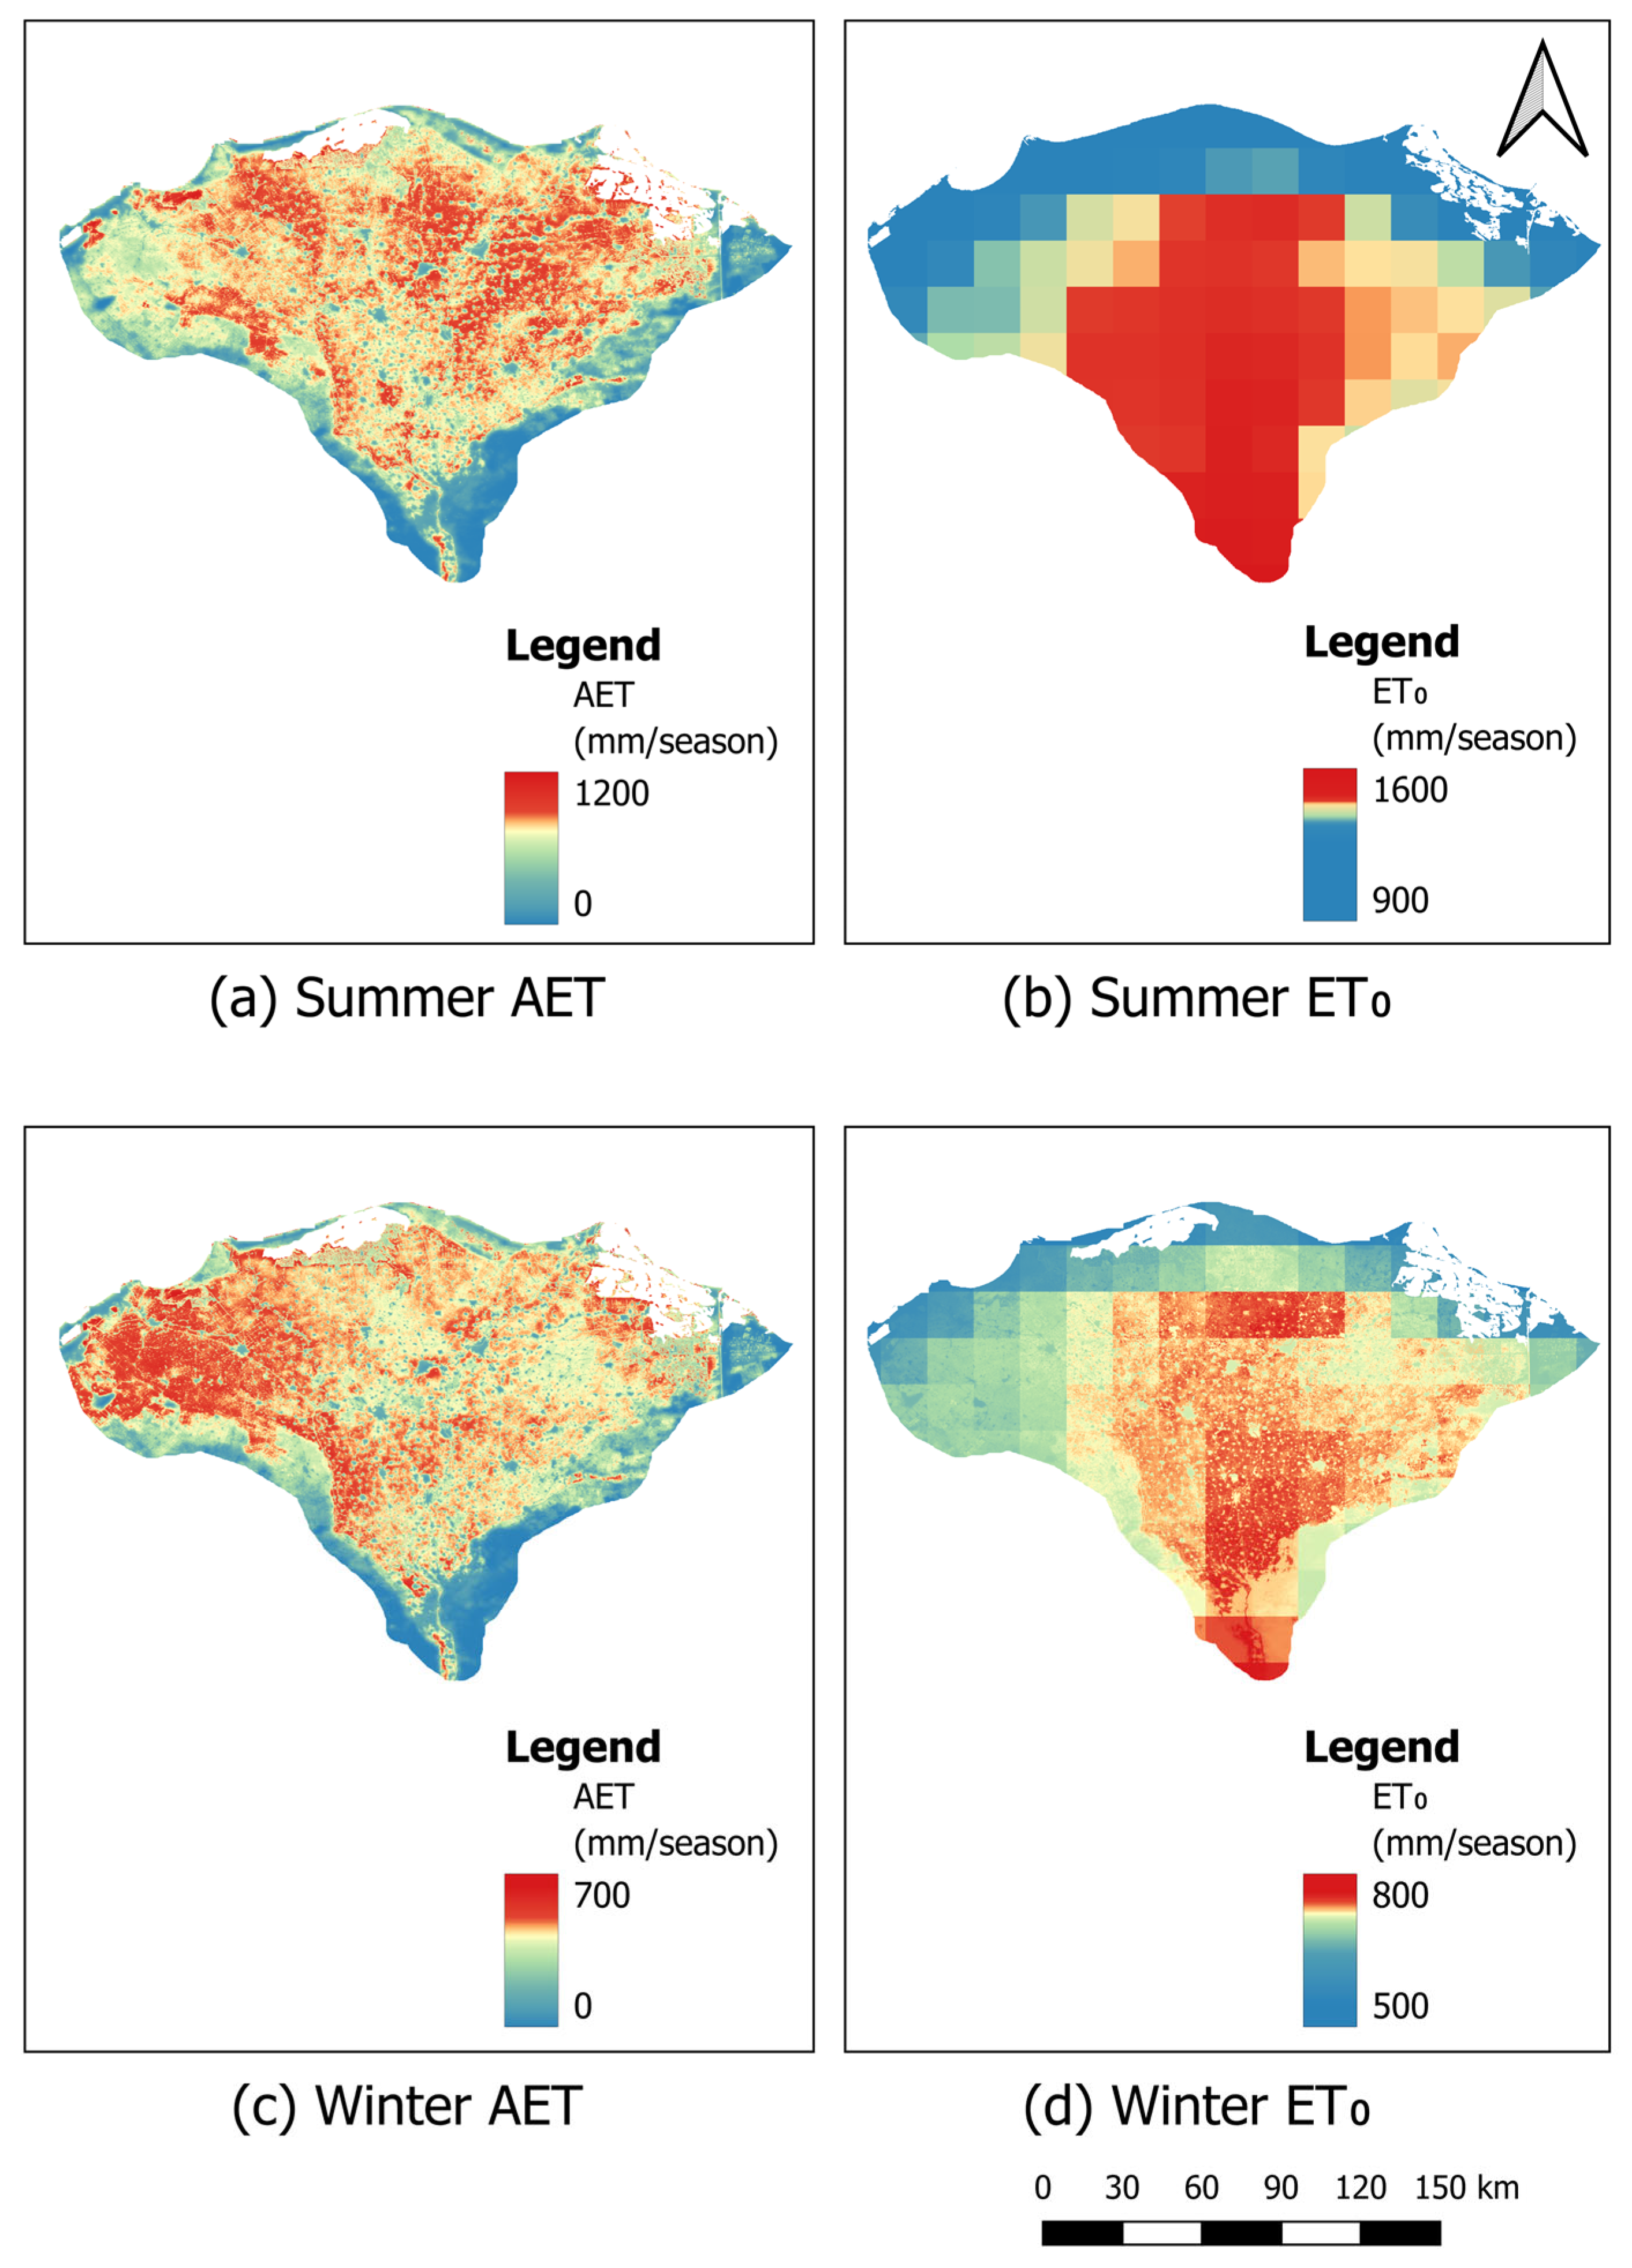
3.3. Irrigation Performance Assessment
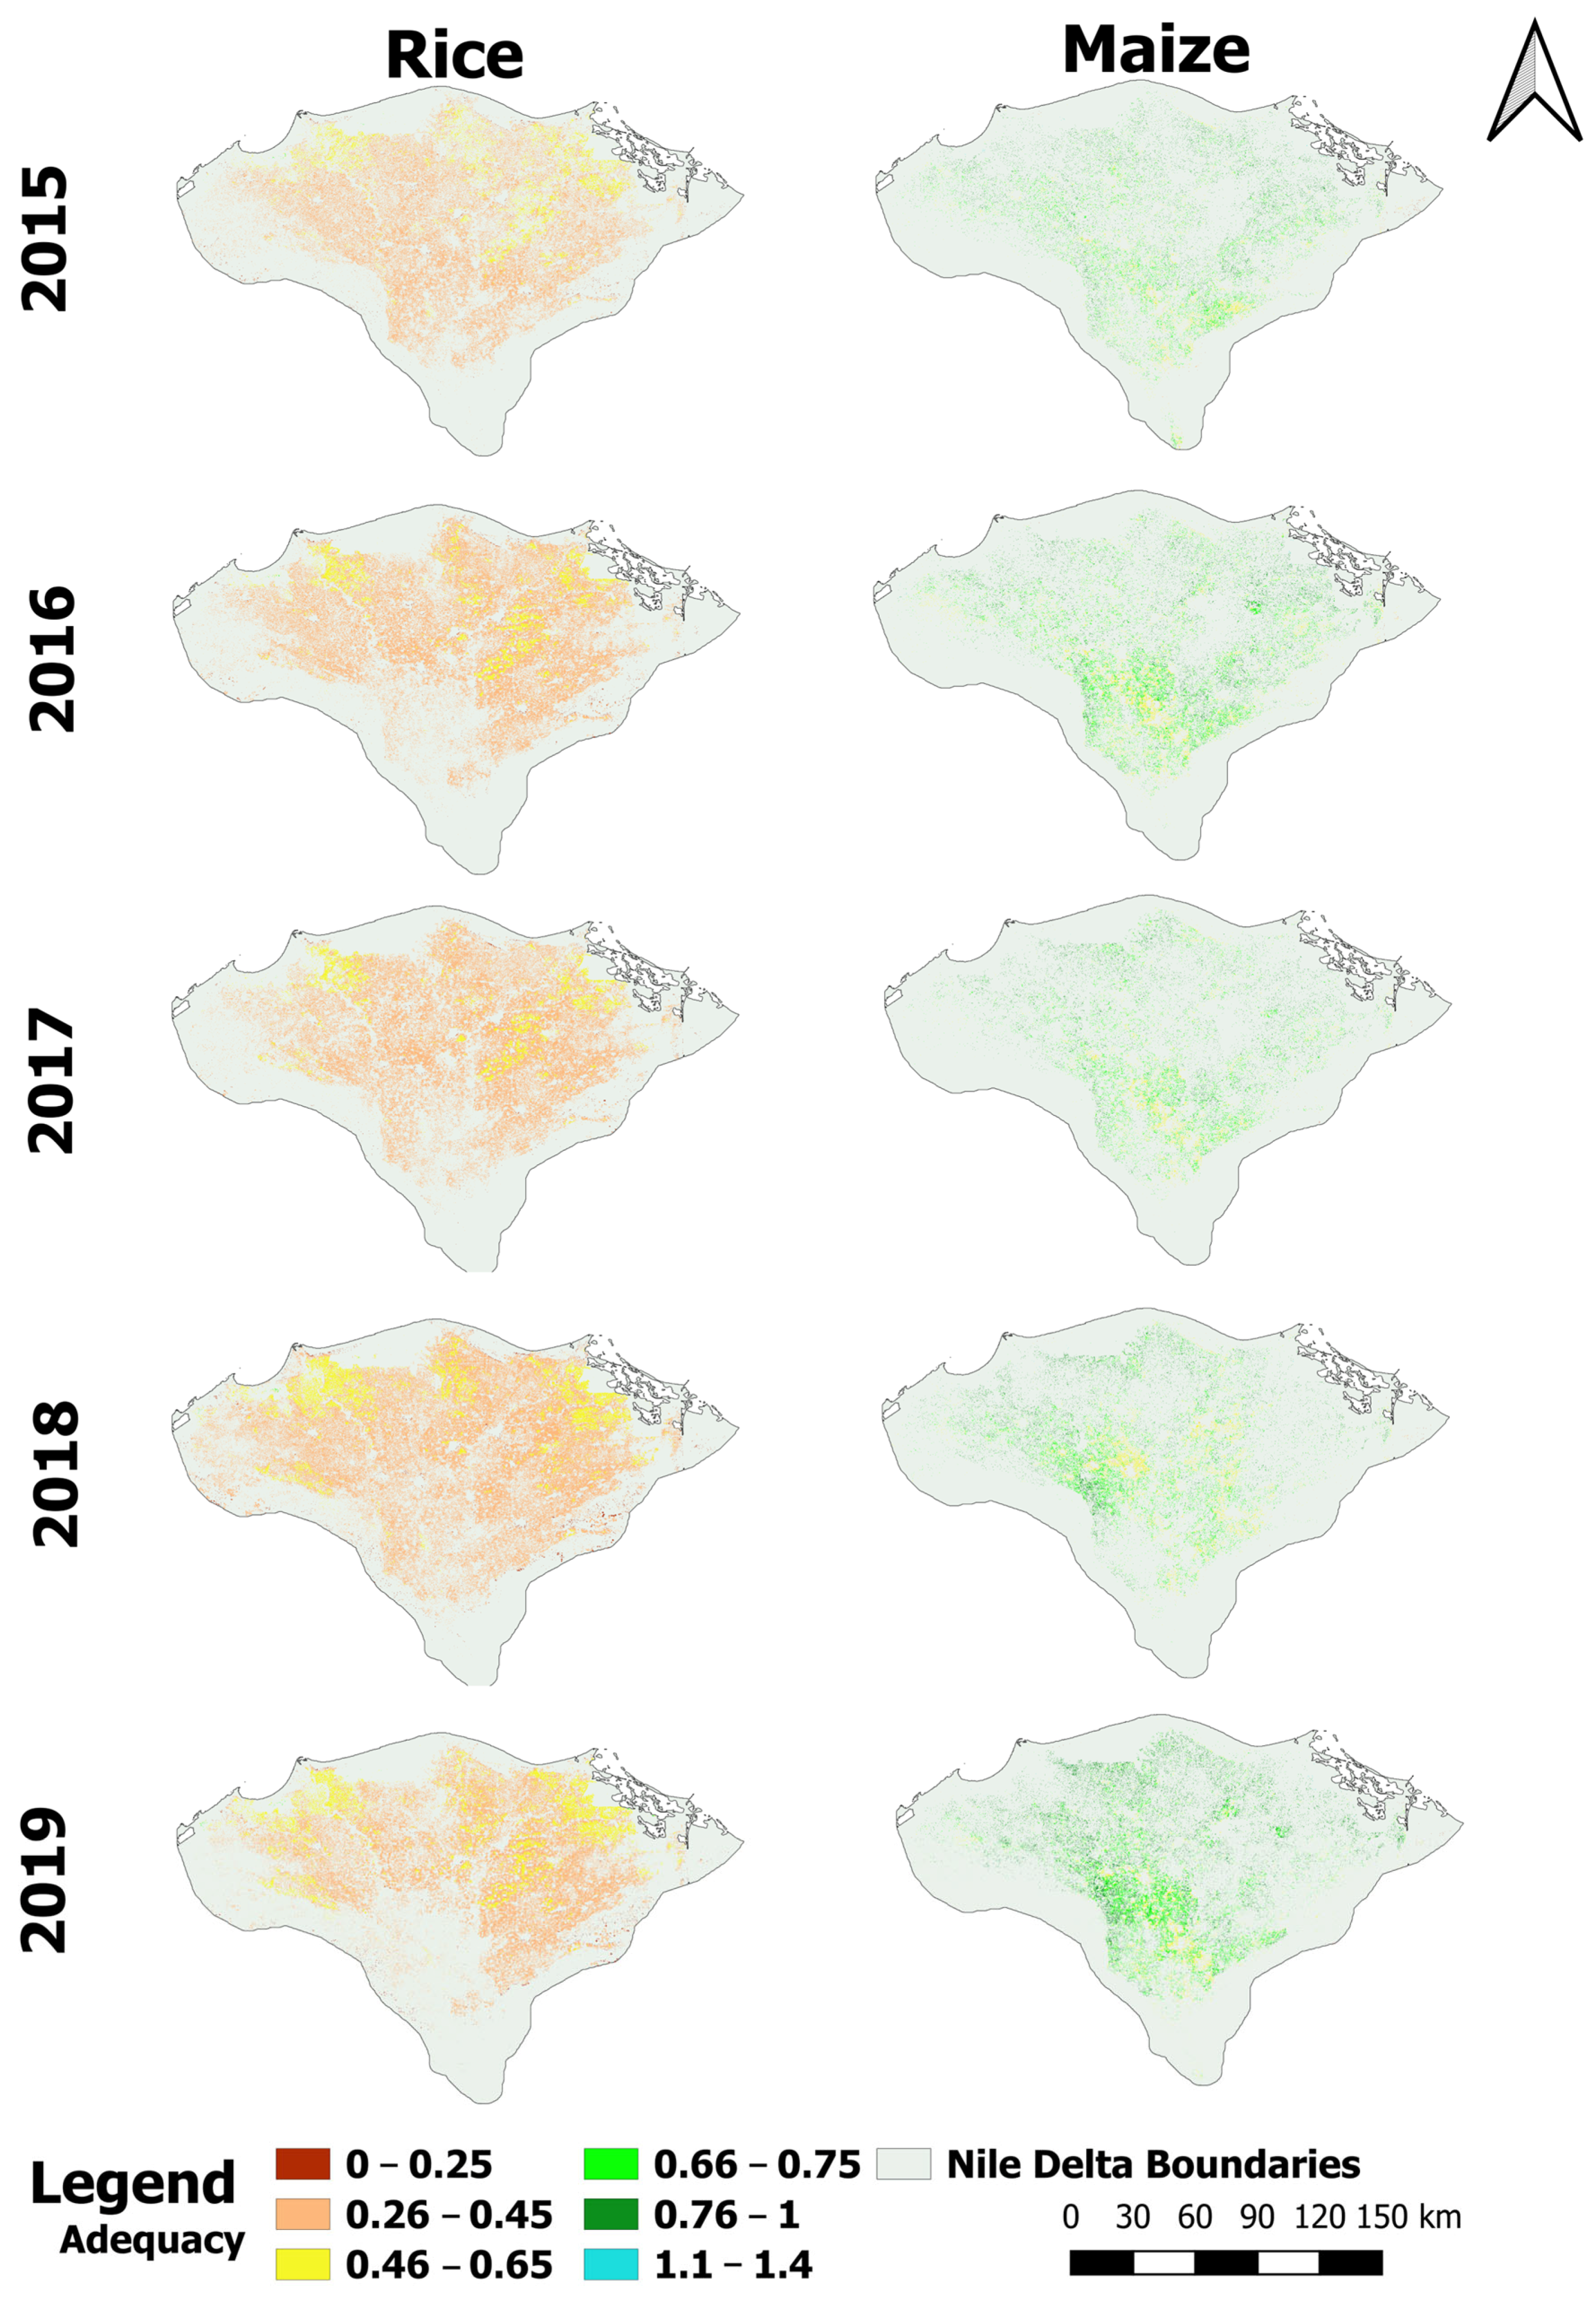
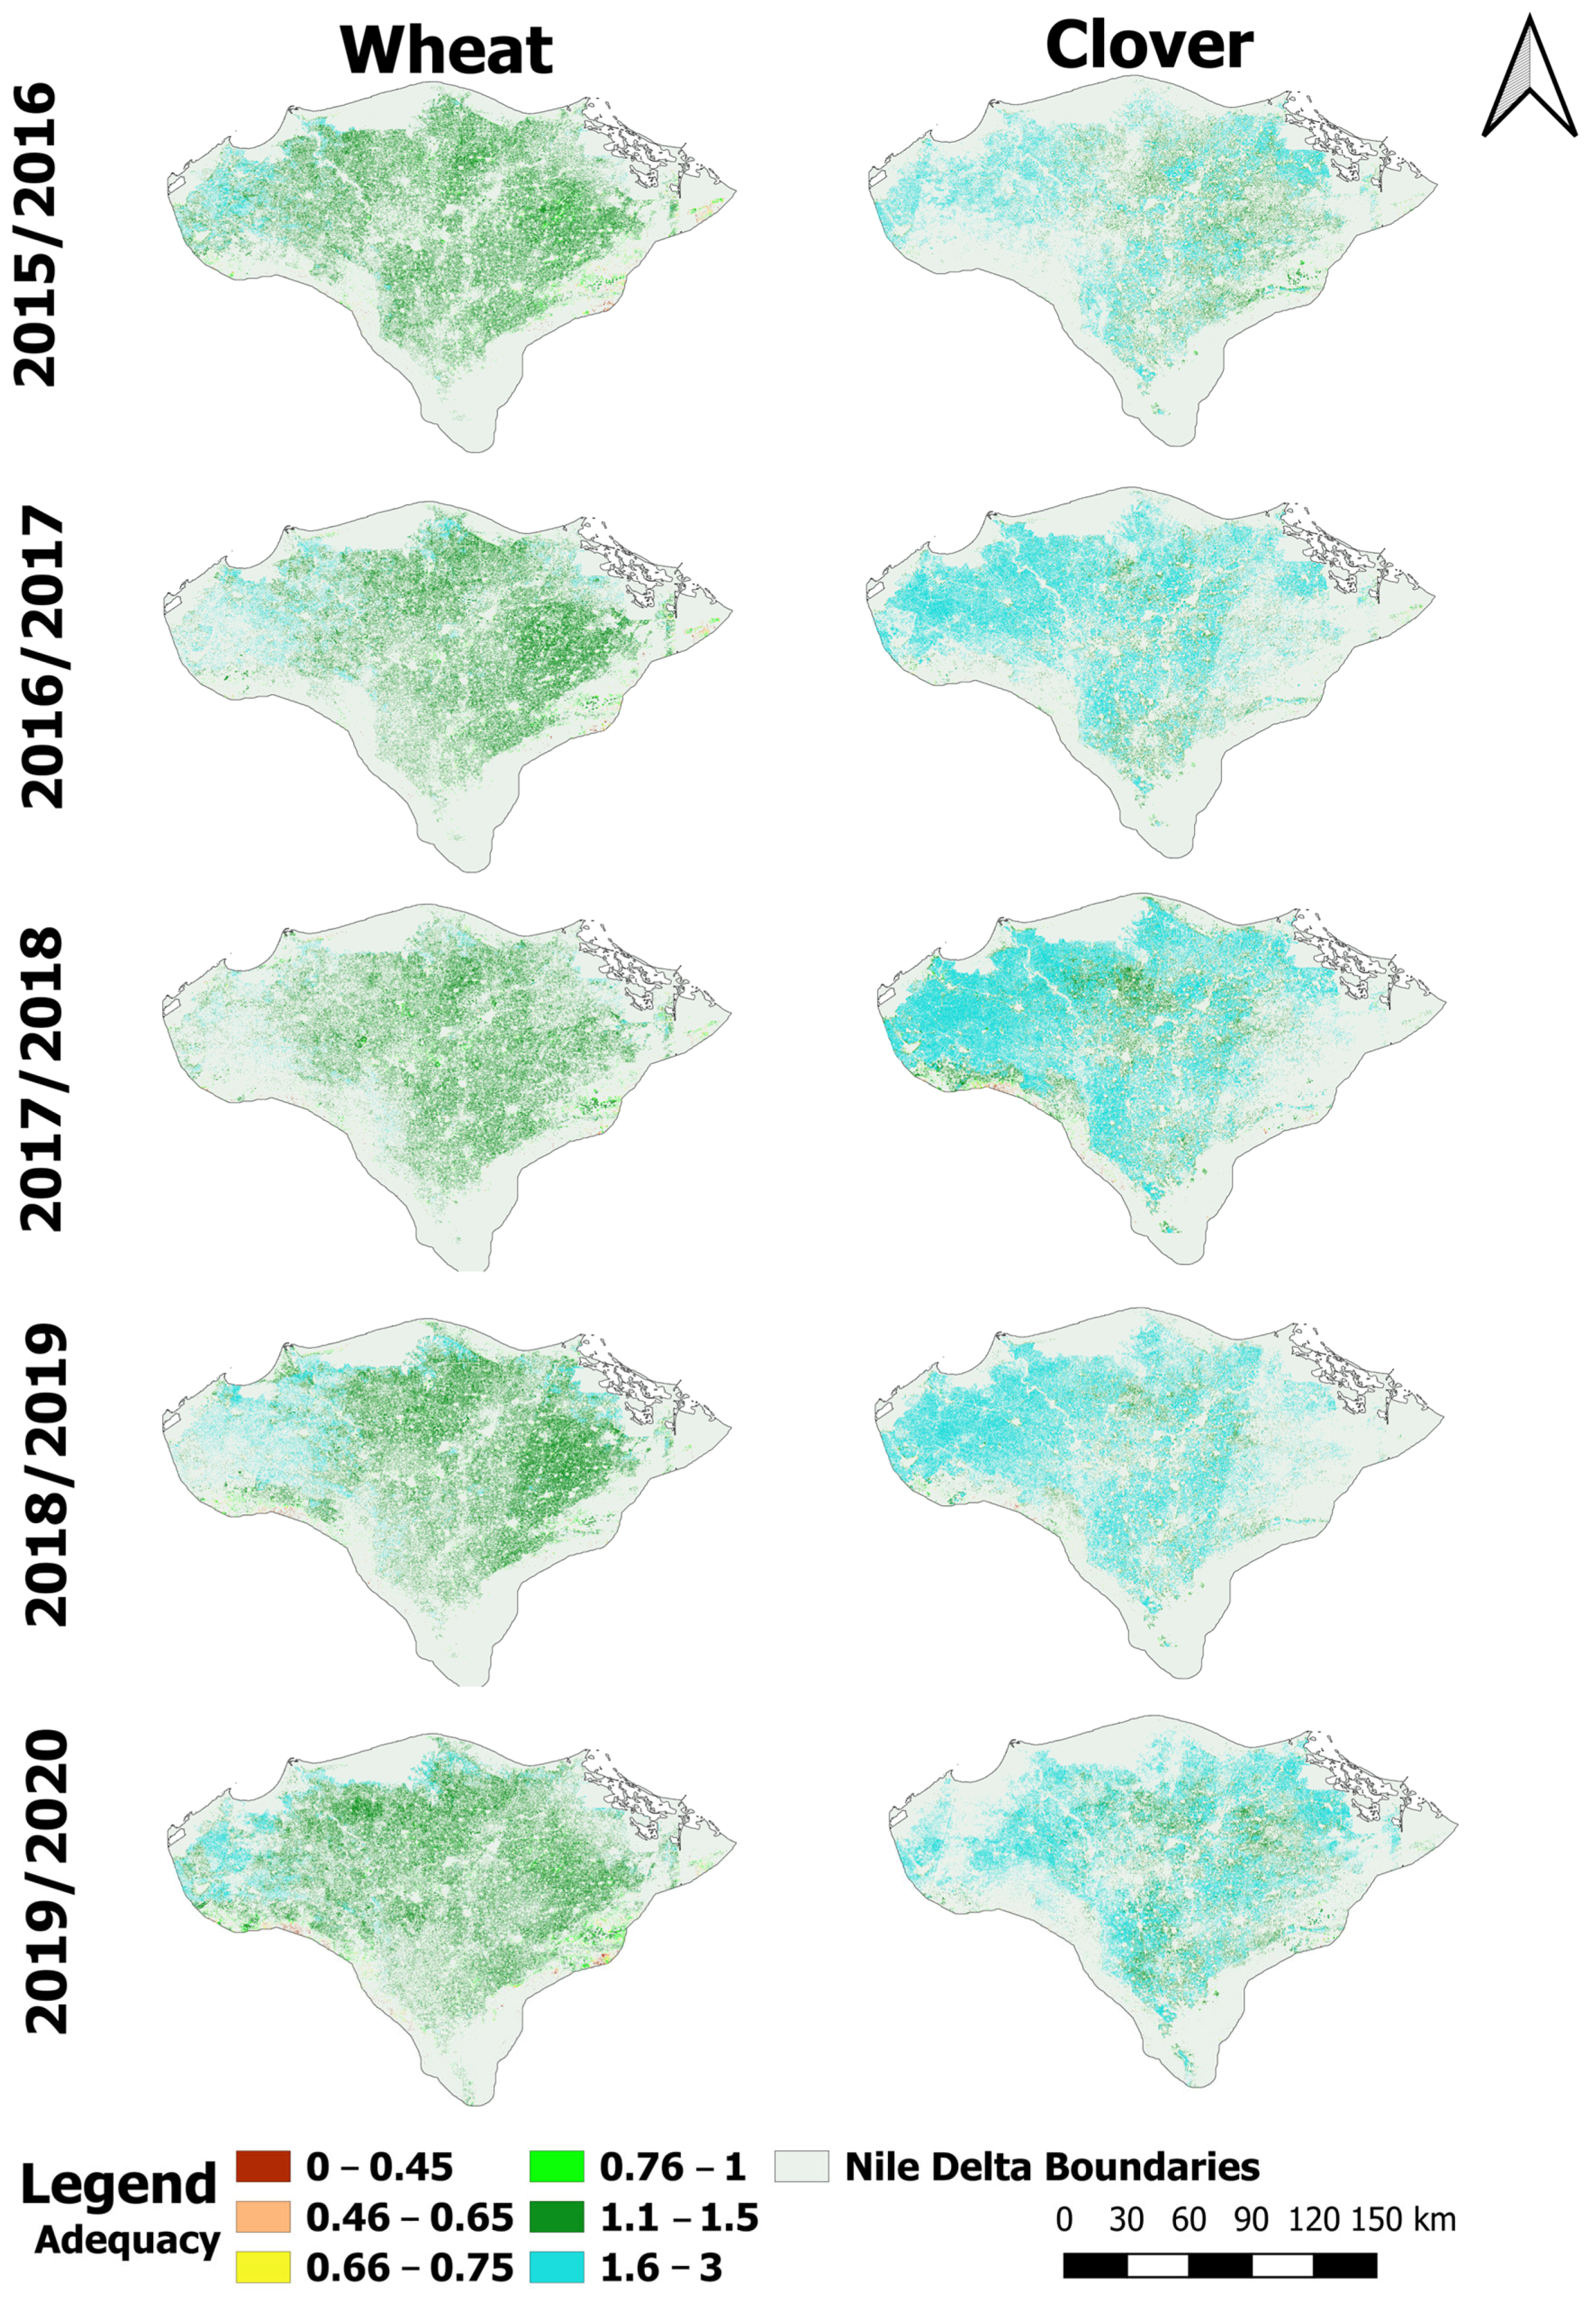
3.3.1. Adequacy
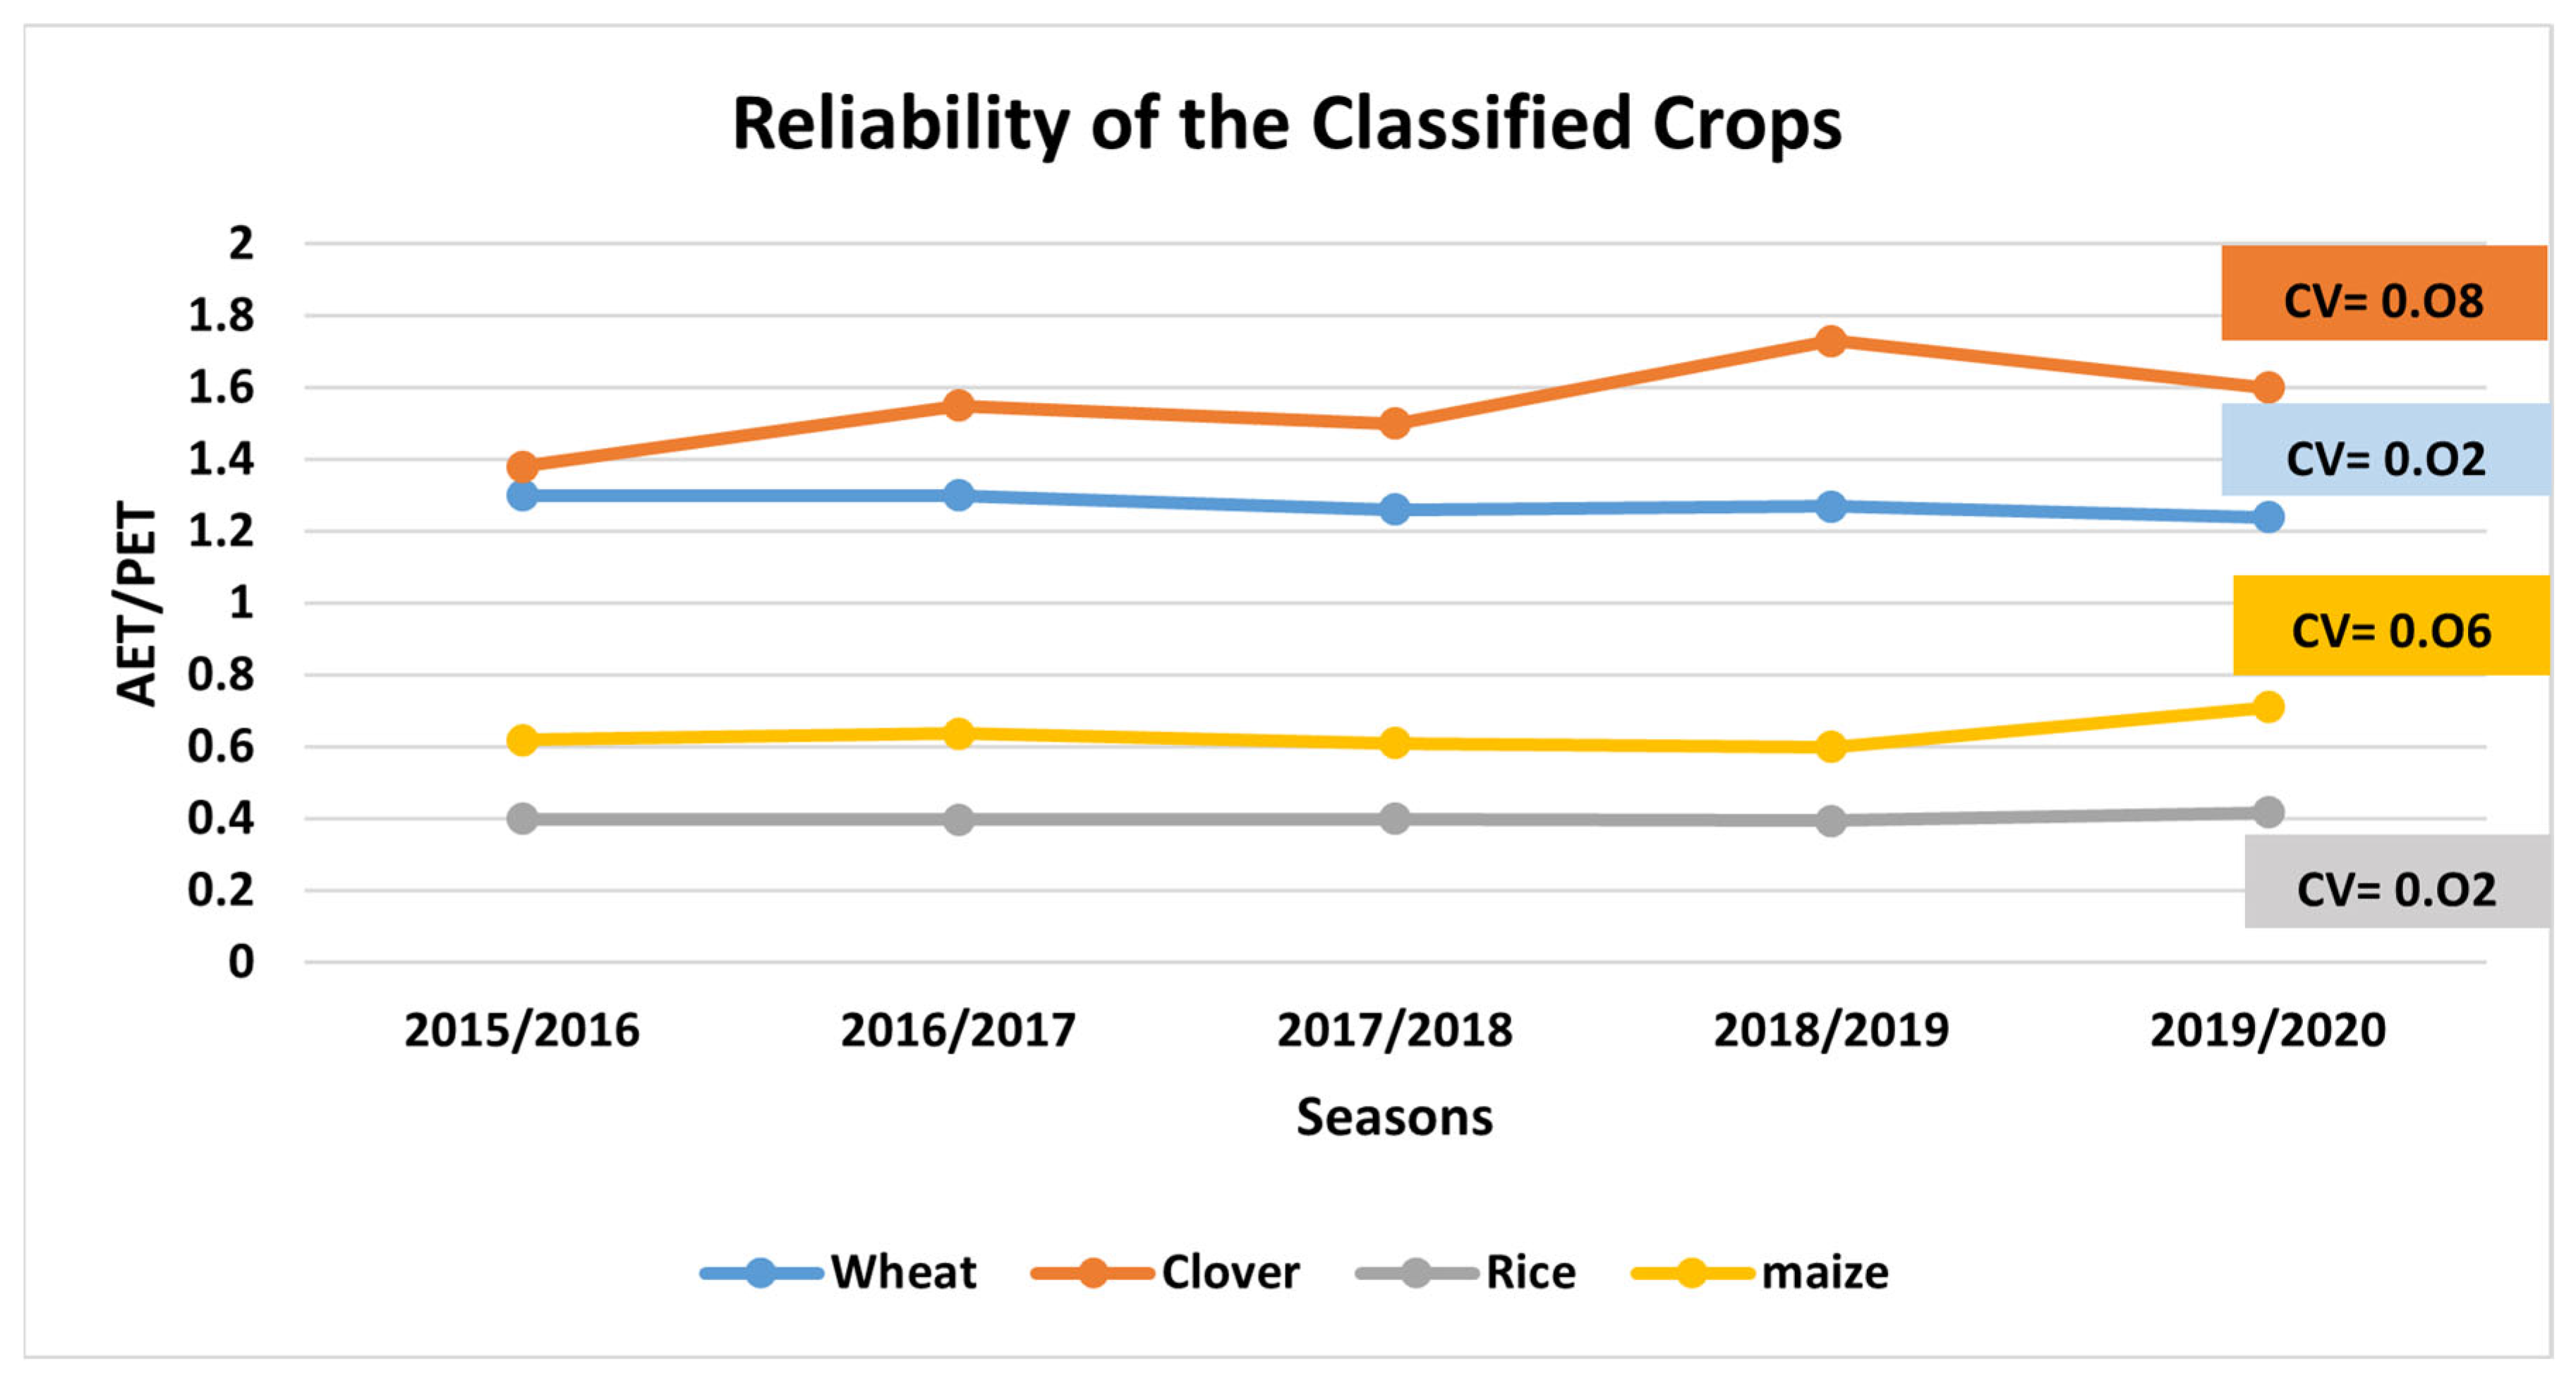
3.3.2. Reliability
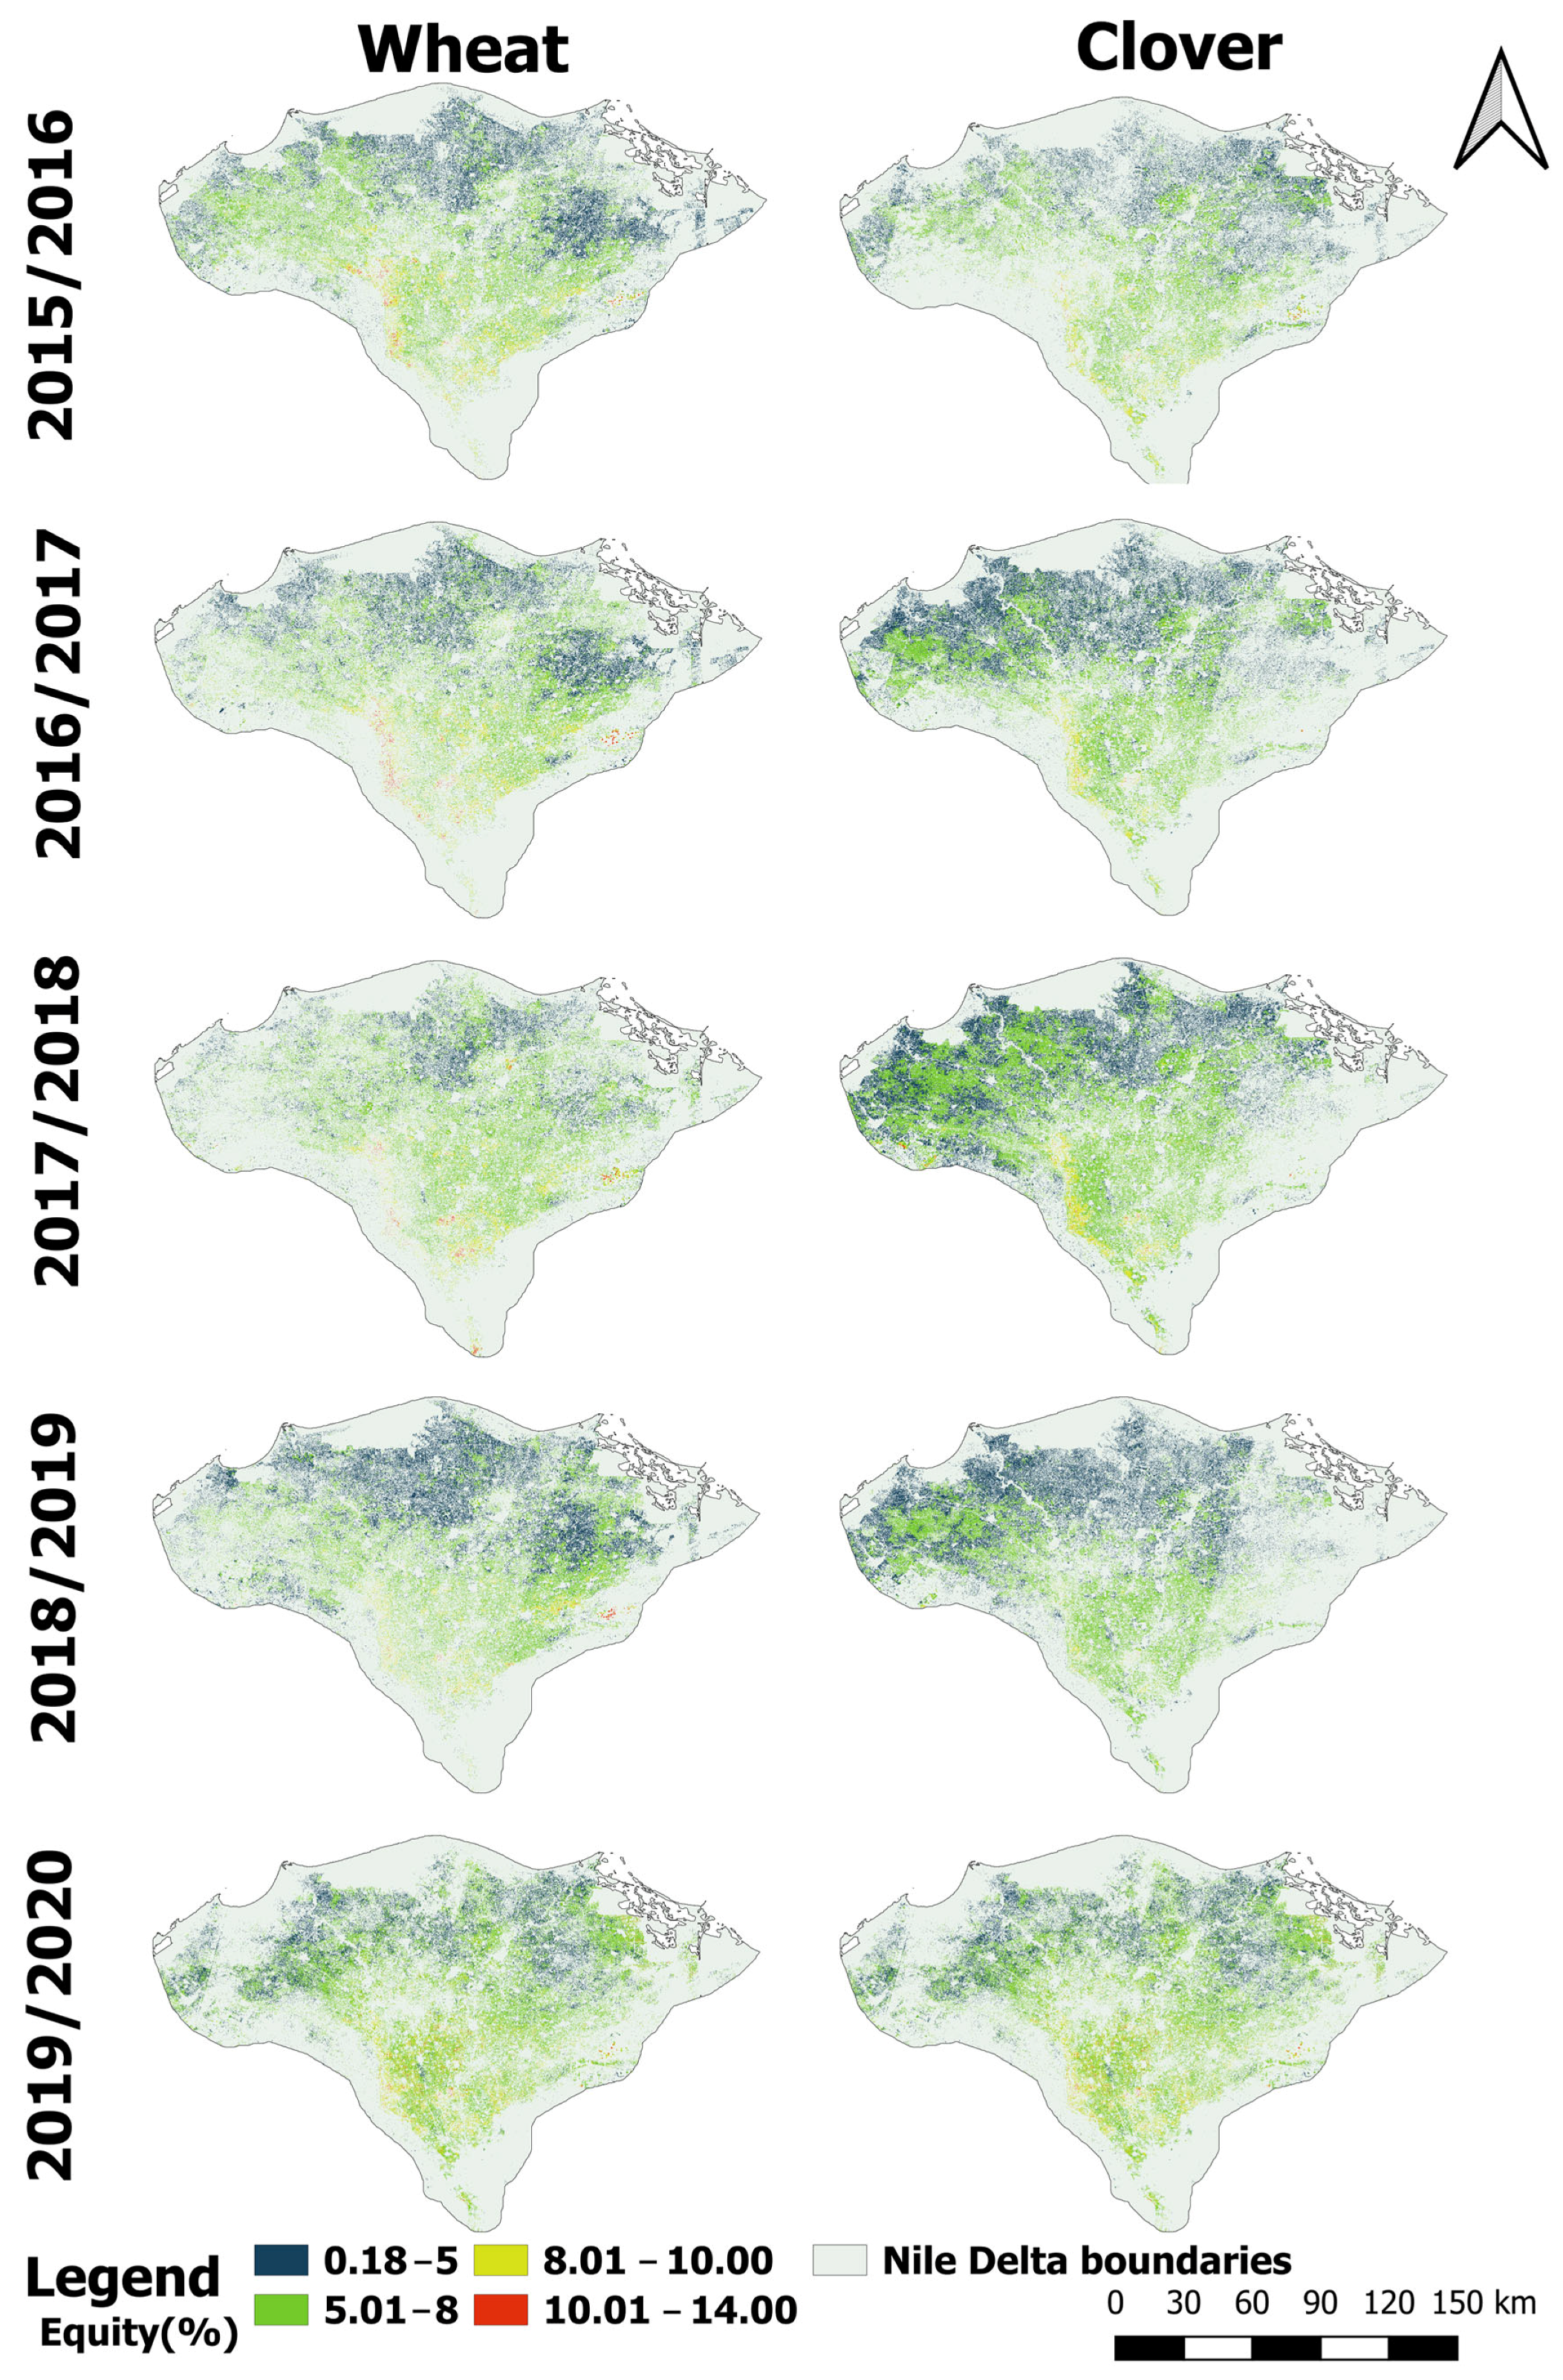
3.3.3. Equity
4. Discussion and Recommendations
4.1. Overview of the Crop Mapping Results
4.1.1. Reference Data Limitations
4.1.2. Challenges from Intercropping and Field Fragmentation
4.1.3. Statistical Data Uncertainties
4.2. Irrigation Performance
5. Conclusions
Author Contributions
Funding
Data Availability Statement
Acknowledgments
Conflicts of Interest
Appendix A
| Governorates | 2015 | 2016 | 2017 | 2018 | 2019 | Average |
|---|---|---|---|---|---|---|
| Bur Said | 3125 | 3159 | 3700 | 6590 | 5152 | 4345 |
| Dumyat | 13,295 | 23,615 | 18,175 | 26,440 | 26,749 | 21,655 |
| Ad Daqahliyah | 94,725 | 158,633 | 154,911 | 170,946 | 173,916 | 150,626 |
| Al Qalyubiyah | 15,811 | 10,244 | 11,147 | 17,946 | 6900 | 12,410 |
| Al Gharbiyah | 63,527 | 70,117 | 73,164 | 76,427 | 61,494 | 68,946 |
| Kafr ash Shaykh | 82,487 | 96,772 | 104,723 | 133,638 | 103,880 | 104,300 |
| Al Buhayrah | 97,294 | 114,557 | 96,933 | 165,457 | 116,780 | 118,204 |
| Al Iskandariyah | 1214 | 1285 | 840 | 4828 | 2043 | 2042 |
| Al Isma’iliyah | 1824 | 2730 | 2467 | 4029 | 3467 | 2903 |
| Al Minufiyah | 50,995 | 17,077 | 36,449 | 49,880 | 9428 | 32,766 |
| Ash Sharqiyah | 100,980 | 130,299 | 132,906 | 157,425 | 146,295 | 133,581 |
| Total | 525,277 | 628,486 | 635,416 | 813,604 | 656,105 | 651,778 |
| Governorates | 2015 | 2016 | 2017 | 2018 | 2019 | Average |
|---|---|---|---|---|---|---|
| Bur Said | 1802 | 2345 | 1206 | 1123 | 2023 | 1700 |
| Dumyat | 1401 | 2523 | 1193 | 1151 | 1334 | 1521 |
| Ad Daqahliyah | 15,277 | 24,206 | 14,230 | 23,088 | 23,455 | 20,051 |
| Al Qalyubiyah | 8363 | 14,399 | 9621 | 5503 | 14,040 | 10,385 |
| Al Gharbiyah | 14,286 | 20,237 | 14,522 | 29,980 | 34,556 | 22,716 |
| Kafr ash Shaykh | 13,370 | 12,723 | 15,026 | 15,728 | 28,097 | 16,989 |
| Al Buhayrah | 19,742 | 23,125 | 13,299 | 30,428 | 30,437 | 23,406 |
| Al Iskandariyah | 248 | 321 | 148 | 374 | 300 | 278 |
| Al Isma’iliyah | 550 | 532 | 288 | 200 | 268 | 367 |
| Al Minufiyah | 15,924 | 31,900 | 18,852 | 14,495 | 40,116 | 24,258 |
| Ash Sharqiyah | 33,269 | 39,743 | 25,566 | 22,105 | 25,142 | 29,165 |
| Total | 124,233 | 172,054 | 113,952 | 144,174 | 199,768 | 150,836 |
| Governorates | 2015 | 2016 | 2017 | 2018 | 2019 | Average |
|---|---|---|---|---|---|---|
| Bur Said | 5474 | 7200 | 6911 | 4667 | 6142 | 6079 |
| Dumyat | 11,044 | 15,514 | 11,964 | 16,914 | 13,263 | 13,740 |
| Ad Daqahliyah | 97,831 | 115,141 | 92,758 | 113,063 | 98,226 | 103,404 |
| Al Qalyubiyah | 17,584 | 14,083 | 16,475 | 13,798 | 17,014 | 15,791 |
| Al Gharbiyah | 46,576 | 52,439 | 47,256 | 56,525 | 60,774 | 52,714 |
| Kafr ash Shaykh | 79,783 | 102,363 | 65,534 | 105,998 | 107,345 | 92,205 |
| Al Buhayrah | 136,514 | 89,012 | 71,788 | 115,802 | 154,130 | 113,449 |
| Al Iskandariyah | 8353 | 3983 | 4363 | 4482 | 9734 | 6183 |
| Al Isma’iliyah | 4036 | 3879 | 3234 | 2137 | 6775 | 4012 |
| Al Minufiyah | 47,253 | 29,654 | 32,166 | 31,209 | 30,959 | 34,248 |
| Ash Sharqiyah | 126,808 | 131,434 | 104,693 | 140,349 | 124,578 | 125,572 |
| Total | 581,257 | 564,703 | 457,143 | 604,944 | 628,940 | 567,397 |
| Governorates | 2015 | 2016 | 2017 | 2018 | 2019 | Average |
|---|---|---|---|---|---|---|
| Bur Said | 3624 | 3888 | 3229 | 1226 | 4853 | 3364 |
| Dumyat | 17,661 | 15,750 | 23,176 | 11,293 | 22,013 | 17,979 |
| Ad Daqahliyah | 101,371 | 105,050 | 125,341 | 93,797 | 123,954 | 109,903 |
| Al Qalyubiyah | 15,412 | 18,412 | 23,627 | 18,852 | 24,970 | 20,255 |
| Al Gharbiyah | 39,645 | 61,598 | 71,093 | 51,284 | 49,174 | 54,559 |
| Kafr ash Shaykh | 52,974 | 108,073 | 143,480 | 99,231 | 76,360 | 96,023 |
| Al Buhayrah | 80,828 | 189,180 | 299,313 | 215,302 | 120,715 | 181,068 |
| Al Iskandariyah | 9145 | 10,754 | 18,015 | 13,513 | 7749 | 11,835 |
| Al Isma’iliyah | 3617 | 3117 | 2415 | 2092 | 4264 | 3101 |
| Al Minufiyah | 39,879 | 57,980 | 73,182 | 57,099 | 68,501 | 59,328 |
| Ash Sharqiyah | 84,054 | 59,365 | 58,554 | 55,717 | 100,774 | 71,693 |
| Total | 448,208 | 633,168 | 841,426 | 619,406 | 603,328 | 629,107 |
References
- World Bank. World Development Indicators|The World Bank. Available online: https://wdi.worldbank.org/table/3.5 (accessed on 24 April 2025).
- Steffen, W.; Broadgate, W.; Deutsch, L.; Gaffney, O.; Ludwig, C. The trajectory of the Anthropocene: The Great Acceleration. Anthr. Rev. 2015, 2, 81–98. [Google Scholar] [CrossRef]
- Falkenmark, M.; Rockström, J.; Karlberg, L. Present and future water requirements for feeding humanity. Food Sec. 2009, 1, 59–69. [Google Scholar] [CrossRef]
- Molden, D. Water for Food Water for Life; Routledge: London, UK, 2007; ISBN 9781136548536. [Google Scholar]
- Moursy, M.; ElFetyany, M.; Meleha, A.; El-Bialy, M.A. Productivity and profitability of modern irrigation methods through the application of on-farm drip irrigation on some crops in the Northern Nile Delta of Egypt. Alex. Eng. J. 2023, 62, 349–356. [Google Scholar] [CrossRef]
- Omar, M.E.D.M.; Moussa, A.M.A. Water management in Egypt for facing the future challenges. J. Adv. Res. 2016, 7, 403–412. [Google Scholar] [CrossRef] [PubMed]
- Gabr, M. Wastewater Reuse Standards for Agriculture Irrigation in Egypt. In Proceedings of the 21th International Water Technology Conference, Ismailia, Egypt, 28–30 June 2018. [Google Scholar]
- AbuZeid, K.M. Existing and Recommended Water Policies in Egypt. In Water Policies in MENA Countries; Zekri, S., Ed.; Springer International Publishing: Cham, Switzerland, 2020; pp. 47–62. ISBN 978-3-030-29273-7. [Google Scholar]
- Ayyad, S.; Khalifa, M. Will the Eastern Nile countries be able to sustain their crop production by 2050? An outlook from water and land perspectives. Sci. Total Environ. 2021, 775, 145769. [Google Scholar] [CrossRef]
- Heggy, E.; Sharkawy, Z.; Abotalib, A.Z. Egypt’s water budget deficit and suggested mitigation policies for the Grand Ethiopian Renaissance Dam filling scenarios. Environ. Res. Lett. 2021, 16, 74022. [Google Scholar] [CrossRef]
- FAOSTAT. Food and Agriculture Data. Available online: https://www.fao.org/faostat/en/#home (accessed on 23 May 2025).
- Capmas. Central Agency for Public Mobilization and Statistics. Available online: https://www.capmas.gov.eg/HomePage.aspx (accessed on 23 May 2025).
- Ayyad, S.; Karimi, P.; Ribbe, L.; Becker, M. Potential Improvements in Crop Production in Egypt and Implications for Future Water and Land Demand. Int. J. Plant Prod. 2024, 18, 313–334. [Google Scholar] [CrossRef]
- Gorantiwar, S.D.; Smout, I.K. Performance assessment of irrigation water management of heterogeneous irrigation schemes: 1. A framework for evaluation. Irrig. Drain. Syst. 2005, 19, 1–36. [Google Scholar] [CrossRef]
- Bastiaanssen, W.; Bos, M.G. Irrigation Performance Indicators Based on Remotely Sensed Data: A Review of Literature. Irrig. Drain. Syst. 1999, 13, 291–311. [Google Scholar] [CrossRef]
- Rajput, J.; Kothari, M.; Bhakar, S.R. Performance Evaluation of Water Delivery System for Command Area of Left Main Canal of Bhimsagar Irrigation Project, Rajasthan. J. Agric. Eng. 2019, 54, 57–66. [Google Scholar] [CrossRef]
- Kharrou, M.H.; Le Page, M.; Chehbouni, A.; Simonneaux, V.; Er-Raki, S.; Jarlan, L.; Ouzine, L.; Khabba, S.; Chehbouni, G. Assessment of Equity and Adequacy of Water Delivery in Irrigation Systems Using Remote Sensing-Based Indicators in Semi-Arid Region, Morocco. Water Resour. Manag. 2013, 27, 4697–4714. [Google Scholar] [CrossRef]
- Ahmad, M.D.; Turral, H.; Nazeer, A. Diagnosing irrigation performance and water productivity through satellite remote sensing and secondary data in a large irrigation system of Pakistan. Agric. Water Manag. 2009, 96, 551–564. [Google Scholar] [CrossRef]
- Molden, D.J.; Sakthivadivel, R.; Perry, C.J.; de Fraiture, C.; Kloezen, W.H. Indicators for Comparing Performance of Irrigated Agricultural Systems; International Water Management Institute: Colombo, Sri Lanka, 1998; p. 1026-0862. [Google Scholar]
- Gowda, P.H.; Chavez, J.L.; Colaizzi, P.D.; Evett, S.R.; Howell, T.A.; Tolk, J.A. ET mapping for agricultural water management: Present status and challenges. Irrig. Sci. 2008, 26, 223–237. [Google Scholar] [CrossRef]
- El-Agha, D.E.; Molden, D.J.; Ghanem, A.M. Performance assessment of irrigation water management in old lands of the Nile delta of Egypt. Irrig. Drain. Syst. 2011, 25, 215–236. [Google Scholar] [CrossRef]
- Kluger, D.M.; Wang, S.; Lobell, D.B. Two shifts for crop mapping: Leveraging aggregate crop statistics to improve satellite-based maps in new regions. Remote Sens. Environ. 2021, 262, 112488. [Google Scholar] [CrossRef]
- Wang, S.; Azzari, G.; Lobell, D.B. Crop type mapping without field-level labels: Random forest transfer and unsupervised clustering techniques. Remote Sens. Environ. 2019, 222, 303–317. [Google Scholar] [CrossRef]
- Zhang, C.; Di, L.; Lin, L.; Li, H.; Guo, L.; Yang, Z.; Yu, E.G.; Di, Y.; Yang, A. Towards automation of in-season crop type mapping using spatiotemporal crop information and remote sensing data. Agric. Syst. 2022, 201, 103462. [Google Scholar] [CrossRef]
- Chukalla, A.D.; Mul, M.L.; van der Zaag, P.; van Halsema, G.; Mubaya, E.; Muchanga, E.; Besten, N.D.; Karimi, P. A framework for irrigation performance assessment using WaPOR data: The case of a sugarcane estate in Mozambique. Hydrol. Earth Syst. Sci. 2022, 26, 2759–2778. [Google Scholar] [CrossRef]
- Bastiaanssen, W.; Brito, R.; Bos, M.G.; Souza, R.A.; Cavalcanti, E.B.; Bakker, M.M. Low Cost Satellite Data for Monthly Irrigation Performance Monitoring: Benchmarks from Nilo Coelho, Brazil. Irrig. Drain. Syst. 2001, 15, 53–79. [Google Scholar] [CrossRef]
- Sawadogo, A.; Kouadio, L.; Traoré, F.; Zwart, S.J.; Hessels, T.; Gündoğdu, K.S. Spatiotemporal Assessment of Irrigation Performance of the Kou Valley Irrigation Scheme in Burkina Faso Using Satellite Remote Sensing-Derived Indicators. IJGI 2020, 9, 484. [Google Scholar] [CrossRef]
- Karimi, P.; Bongani, B.; Blatchford, M.; de Fraiture, C. Global Satellite-Based ET Products for the Local Level Irrigation Management: An Application of Irrigation Performance Assessment in the Sugarbelt of Swaziland. Remote Sens. 2019, 11, 705. [Google Scholar] [CrossRef]
- Wamala, F.; Gidudu, A.; Wanyama, J.; Nakawuka, P.; Bwambale, E.; Chukalla, A.D. Assessment of irrigation water distribution using remotely sensed indicators: A case study of Doho Rice Irrigation Scheme, Uganda. Smart Agric. Technol. 2023, 4, 100184. [Google Scholar] [CrossRef]
- Taghvaeian, S.; Neale, C.M.U.; Osterberg, J.C.; Sritharan, S.I.; Watts, D.R. Remote Sensing and GIS Techniques for Assessing Irrigation Performance: Case Study in Southern California. J. Irrig. Drain Eng. 2018, 144, 05018002. [Google Scholar] [CrossRef]
- Fishar, M.R. Nile Delta (Egypt). In The Wetland Book; Springer: Dordrecht, The Netherlands, 2016; pp. 1–10. ISBN 9789400761735. [Google Scholar]
- Elnmer, A.; Khadr, M.; Tawfik, A. Using Remote Sensing Techniques for Estimating Water Stress Index for Central of Nile Delta. IOP Conf. Ser. Earth Environ. Sci. 2018, 151, 12026. [Google Scholar] [CrossRef]
- Negm, A.M. The Nile Delta; Springer: New York, NY, USA, 2017; ISBN 978-3-319-56122-6. [Google Scholar]
- Elnmer, A.; Khadr, M.; Kanae, S.; Tawfik, A. Mapping daily and seasonally evapotranspiration using remote sensing techniques over the Nile delta. Agric. Water Manag. 2019, 213, 682–692. [Google Scholar] [CrossRef]
- Molle, F.; Gaafar, I.; El-Agha, D.E.; Rap, E. Irrigation Efficiency and the Nile Delta Water Balance; Australian Government Australian Centre for International Agricultural Research: Canberra, Australia, 2016. [Google Scholar]
- Hammam, A.A.; Mohamed, E.S. Mapping soil salinity in the East Nile Delta using several methodological approaches of salinity assessment. Egypt. J. Remote Sens. Space Sci. 2020, 23, 125–131. [Google Scholar] [CrossRef]
- Gamal, G.; Samak, M.; Shahba, M. The Possible Impacts of Different Global Warming Levels on Major Crops in Egypt. Atmosphere 2021, 12, 1589. [Google Scholar] [CrossRef]
- Capmas. Publications—Annual Statistical Reports. Central Agency for Public Mobilization and Statistics. Available online: https://www.capmas.gov.eg/Pages/Publications.aspx?page_id=5104&Year=23541 (accessed on 24 May 2025).
- Ayyad, S.; Al Zayed, I.S.; van Ha, T.T.; Ribbe, L. The Performance of Satellite-Based Actual Evapotranspiration Products and the Assessment of Irrigation Efficiency in Egypt. Water 2019, 11, 1913. [Google Scholar] [CrossRef]
- Blatchford, M.L.; Mannaerts, C.M.; Njuki, S.M.; Nouri, H.; Zeng, Y.; Pelgrum, H.; Wonink, S.; Karimi, P. Evaluation of WaPOR V2 evapotranspiration products across Africa. Hydrol. Process. 2020, 34, 3200–3221. [Google Scholar] [CrossRef]
- McNamara, I.; Baez-Villanueva, O.M.; Zomorodian, A.; Ayyad, S.; Zambrano-Bigiarini, M.; Zaroug, M.; Mersha, A.; Nauditt, A.; Mbuliro, M.; Wamala, S.; et al. How well do gridded precipitation and actual evapotranspiration products represent the key water balance components in the Nile Basin? J. Hydrol. Reg. Stud. 2021, 37, 100884. [Google Scholar] [CrossRef]
- Weerasinghe, I.; Bastiaanssen, W.; Mul, M.; Jia, L.; van Griensven, A. Can we trust remote sensing evapotranspiration products over Africa? Hydrol. Earth Syst. Sci. 2020, 24, 1565–1586. [Google Scholar] [CrossRef]
- Zhang, K.; Kimball, J.S.; Running, S.W. A review of remote sensing based actual evapotranspiration estimation. WIREs Water 2016, 3, 834–853. [Google Scholar] [CrossRef]
- Ayyad, S.; Karimi, P.; Langensiepen, M.; Ribbe, L.; Rebelo, L.-M.; Becker, M. Remote sensing assessment of available green water to increase crop production in seasonal floodplain wetlands of sub-Saharan Africa. Agric. Water Manag. 2022, 269, 107712. [Google Scholar] [CrossRef]
- Xuan, F.; Dong, Y.; Li, J.; Li, X.; Su, W.; Huang, X.; Huang, J.; Xie, Z.; Li, Z.; Liu, H.; et al. Mapping crop type in Northeast China during 2013–2021 using automatic sampling and tile-based image classification. Int. J. Appl. Earth Obs. Geoinf. 2023, 117, 103178. [Google Scholar] [CrossRef]
- Shelestov, A.; Lavreniuk, M.; Kussul, N.; Novikov, A.; Skakun, S. Exploring Google Earth Engine Platform for Big Data Processing: Classification of Multi-Temporal Satellite Imagery for Crop Mapping. Front. Earth Sci. 2017, 5, 232994. [Google Scholar] [CrossRef]
- Waleed, M.; Mubeen, M.; Ahmad, A.; Habib-ur-Rahman, M.; Amin, A.; Farid, H.U.; Hussain, S.; Ali, M.; Qaisrani, S.A.; Nasim, W.; et al. Evaluating the efficiency of coarser to finer resolution multispectral satellites in mapping paddy rice fields using GEE implementation. Sci. Rep. 2022, 12, 13210. [Google Scholar] [CrossRef] [PubMed]
- Luo, Y.; Zhang, Z.; Zhang, L.; Han, J.; Cao, J.; Zhang, J. Developing High-Resolution Crop Maps for Major Crops in the European Union Based on Transductive Transfer Learning and Limited Ground Data. Remote Sens. 2022, 14, 1809. [Google Scholar] [CrossRef]
- Zhen, Z.; Chen, S.; Yin, T.; Gastellu-Etchegorry, J.-P. Improving Crop Mapping by Using Bidirectional Reflectance Distribution Function (BRDF) Signatures with Google Earth Engine. Remote Sens. 2023, 15, 2761. [Google Scholar] [CrossRef]
- Schultz, B.; Immitzer, M.; Formaggio, A.; Sanches, I.; Luiz, A.; Atzberger, C. Self-Guided Segmentation and Classification of Multi-Temporal Landsat 8 Images for Crop Type Mapping in Southeastern Brazil. Remote Sens. 2015, 7, 14482–14508. [Google Scholar] [CrossRef]
- Azar, R.; Villa, P.; Stroppiana, D.; Crema, A.; Boschetti, M.; Brivio, P.A. Assessing in-season crop classification performance using satellite data: A test case in Northern Italy. Eur. J. Remote Sens. 2016, 49, 361–380. [Google Scholar] [CrossRef]
- Song, X.-P.; Huang, W.; Hansen, M.C.; Potapov, P. An evaluation of Landsat, Sentinel-2, Sentinel-1 and MODIS data for crop type mapping. Sci. Remote Sens. 2021, 3, 100018. [Google Scholar] [CrossRef]
- He, Y.; Wang, C.; Chen, F.; Jia, H.; Liang, D.; Yang, A. Feature Comparison and Optimization for 30-M Winter Wheat Mapping Based on Landsat-8 and Sentinel-2 Data Using Random Forest Algorithm. Remote Sens. 2019, 11, 535. [Google Scholar] [CrossRef]
- Tucker, C.J. Red and photographic infrared linear combinations for monitoring vegetation. Remote Sens. Environ. 1979, 8, 127–150. [Google Scholar] [CrossRef]
- Foerster, S.; Kaden, K.; Foerster, M.; Itzerott, S. Crop type mapping using spectral–temporal profiles and phenological information. Comput. Electron. Agric. 2012, 89, 30–40. [Google Scholar] [CrossRef]
- Gitelson, A.A.; Viña, A.; Ciganda, V.; Rundquist, D.C.; Arkebauer, T.J. Remote estimation of canopy chlorophyll content in crops. Geophys. Res. Lett. 2005, 32, L08403. [Google Scholar] [CrossRef]
- McFEETERS, S.K. The use of the Normalized Difference Water Index (NDWI) in the delineation of open water features. Int. J. Remote Sens. 1996, 17, 1425–1432. [Google Scholar] [CrossRef]
- Xiao, X.; Boles, S.; Liu, J.; Zhuang, D.; Liu, M. Characterization of forest types in Northeastern China, using multi-temporal SPOT-4 VEGETATION sensor data. Remote Sens. Environ. 2002, 82, 335–348. [Google Scholar] [CrossRef]
- Dong, J.; Xiao, X. Evolution of regional to global paddy rice mapping methods: A review. ISPRS J. Photogramm. Remote Sens. 2016, 119, 214–227. [Google Scholar] [CrossRef]
- Tran, K.H.; Zhang, H.K.; McMaine, J.T.; Zhang, X.; Luo, D. 10 m crop type mapping using Sentinel-2 reflectance and 30 m cropland data layer product. Int. J. Appl. Earth Obs. Geoinf. 2022, 107, 102692. [Google Scholar] [CrossRef]
- FAO. WaPOR Database Methodology: Level 3 Data; FAO and IHE Delft: Rome, Italy, 2019. [Google Scholar]
- Zhang, C.; Di, L.; Hao, P.; Yang, Z.; Lin, L.; Zhao, H.; Guo, L. Rapid in-season mapping of corn and soybeans using machine-learned trusted pixels from Cropland Data Layer. Int. J. Appl. Earth Obs. Geoinf. 2021, 102, 102374. [Google Scholar] [CrossRef]
- Hao, P.; Di, L.; Zhang, C.; Guo, L. Transfer Learning for Crop classification with Cropland Data Layer data (CDL) as training samples. Sci. Total Environ. 2020, 733, 138869. [Google Scholar] [CrossRef] [PubMed]
- de Simone, L.; Gennari, P. Earth observations for official crop statistics in the context of scarcity of in-situ data. SJI 2022, 38, 1009–1019. [Google Scholar] [CrossRef]
- Ghazaryan, G.; Dubovyk, O.; Löw, F.; Lavreniuk, M.; Kolotii, A.; Schellberg, J.; Kussul, N. A rule-based approach for crop identification using multi-temporal and multi-sensor phenological metrics. Eur. J. Remote Sens. 2018, 51, 511–524. [Google Scholar] [CrossRef]
- Defourny, P.; Bontemps, S.; Bellemans, N.; Cara, C.; Dedieu, G.; Guzzonato, E.; Hagolle, O.; Inglada, J.; Nicola, L.; Rabaute, T.; et al. Near real-time agriculture monitoring at national scale at parcel resolution: Performance assessment of the Sen2-Agri automated system in various cropping systems around the world. Remote Sens. Environ. 2019, 221, 551–568. [Google Scholar] [CrossRef]
- Song, Q.; Hu, Q.; Zhou, Q.; Hovis, C.; Xiang, M.; Tang, H.; Wu, W. In-Season Crop Mapping with GF-1/WFV Data by Combining Object-Based Image Analysis and Random Forest. Remote Sens. 2017, 9, 1184. [Google Scholar] [CrossRef]
- Li, T.; Leng, J.; Kong, L.; Guo, S.; Bai, G.; Wang, K. DCNR: Deep cube CNN with random forest for hyperspectral image classification. Multimed. Tools Appl. 2019, 78, 3411–3433. [Google Scholar] [CrossRef]
- Breiman, L. Random Forests. Mach. Learn. 2001, 45, 5–32. [Google Scholar] [CrossRef]
- Inglada, J.; Arias, M.; Tardy, B.; Hagolle, O.; Valero, S.; Morin, D.; Dedieu, G.; Sepulcre, G.; Bontemps, S.; Defourny, P.; et al. Assessment of an Operational System for Crop Type Map Production Using High Temporal and Spatial Resolution Satellite Optical Imagery. Remote Sens. 2015, 7, 12356–12379. [Google Scholar] [CrossRef]
- Ghassemi, B.; Izquierdo-Verdiguier, E.; Verhegghen, A.; Yordanov, M.; Lemoine, G.; Moreno Martínez, Á.; de Marchi, D.; van der Velde, M.; Vuolo, F.; d’Andrimont, R. European Union crop map 2022: Earth observation’s 10-meter dive into Europe’s crop tapestry. Sci. Data 2024, 11, 1048. [Google Scholar] [CrossRef] [PubMed]
- Jiang, D.; Chen, S.; Useya, J.; Cao, L.; Lu, T. Crop Mapping Using the Historical Crop Data Layer and Deep Neural Networks: A Case Study in Jilin Province, China. Sensors 2022, 22, 5853. [Google Scholar] [CrossRef] [PubMed]
- Congalton, R.G. A review of assessing the accuracy of classifications of remotely sensed data. Remote Sens. Environ. 1991, 37, 35–46. [Google Scholar] [CrossRef]
- Story, M.; Congalton, R.G. Accuracy Assessment: A User’s Perspective. Photogramm. Eng. Remote Sens. 1986, 52, 397–399. [Google Scholar]
- Cohen, J. A Coefficient of Agreement for Nominal Scales. Educ. Psychol. Meas. 1960, 20, 37–46. [Google Scholar] [CrossRef]
- Alexandridis, T.; Asif, S.; Ali, S. Water Performance Indicators Using Satellite Imagery for the Fordwah Eastern Sadiqia (South) Irrigation and Drainage Project; International Water Management Institute: Colombo, Sri Lanka, 1999; Available online: https://econpapers.repec.org/paper/iwtrerpts/h024895.htm (accessed on 22 April 2024).
- Allan, R.; Pereira, L.; Smith, M. Crop evapotranspiration-Guidelines for computing crop water requirements-FAO Irrigation and drainage paper 56. Fao Rome 1998, 300, D05109. [Google Scholar]
- Kirkham, M.B. Principles of Soil and Plant Water Relations; Elsevier: Amsterdam, The Netherlands, 2005. [Google Scholar]
- Bandara, K.M.P.S. Assessing Irrigation Performance by Using Remote Sensing. Doctoral Dissertation, Wageningen University & Research, Wageningen, The Netherlands, 2006. [Google Scholar]
- Malano, H.M.; van Hofwegen, P.J.M. Management of Irrigation and Drainage Systems: A Service Approach; Balkema: Rotterdam, The Netherlands, 1999; ISBN 905410483X. [Google Scholar]
- Khater, A.; Kitamura, Y.; Shimizu, K.; Abou El Hassan, W.; Fujimaki, H. Quantitative analysis of reusing agricultural water to compensate for water supply deficiencies in the Nile Delta irrigation network. Paddy Water Environ. 2015, 13, 367–378. [Google Scholar] [CrossRef]
- Akhtar, F.; Awan, U.; Tischbein, B.; Liaqat, U. Assessment of Irrigation Performance in Large River Basins under Data Scarce Environment—A Case of Kabul River Basin, Afghanistan. Remote Sens. 2018, 10, 972. [Google Scholar] [CrossRef]
- Roerink, G.J.; Bastiaanssen, W.G.M.; Chambouleyron, J.; Menenti, M. Relating Crop Water Consumption to Irrigation Water Supply by Remote Sensing. Water Resour. Manag. 1997, 11, 445–465. [Google Scholar] [CrossRef]
- Bastiaanssen, W.G.M.; van der Wal, T.; Visser, T.N.M. Diagnosis of regional evaporation by remote sensing to support irrigation performance assessment. Irrig. Drain. Syst. 1996, 10, 1–23. [Google Scholar] [CrossRef]
- El-Nashar, W.Y.; Hussien, E.A. Estimating the potential evapo-transpiration and crop coefficient from climatic data in Middle Delta of Egypt. Alex. Eng. J. 2013, 52, 35–42. [Google Scholar] [CrossRef]
- Landis, J.R.; Koch, G.G. The Measurement of Observer Agreement for Categorical Data. Biometrics 1977, 33, 159–174. [Google Scholar] [CrossRef] [PubMed]
- Burke, M.; Driscoll, A.; Lobell, D.B.; Ermon, S. Using satellite imagery to understand and promote sustainable development. Science 2021, 371, eabe8628. [Google Scholar] [CrossRef] [PubMed]
- Tolba, R.A.; El-Shirbeny, M.A.; Abou-Shleel, S.M.; El-Mohandes, M.A. Rice Acreage Delineation in the Nile Delta Based on Thermal Signature. Earth Syst. Environ. 2020, 4, 287–296. [Google Scholar] [CrossRef]
- Khadr, M.; Zeidan, B.A.; Elnmer, A. On-Farm Water Management in the Nile Delta. In The Nile Delta; Negm, A., Ed.; Springer: Berlin/Heidelberg, Germany, 2016. [Google Scholar]
- FAO. WaPOR Quality Assessment; FAO and IHE Delft: Rome, Italy, 2019. [Google Scholar]
- Mohsen Aly, A.; Kitamura, Y.; Shimizu, K. Assessment of irrigation practices at the tertiary canal level in an improved system—A case study of Wasat area, the Nile Delta. Paddy Water Environ. 2013, 11, 445–454. [Google Scholar] [CrossRef]
- El-Shirbeny, M.A.; Ali, A.M.; Rashash, A.; Badr, M.A. Wheat Yield Response to Water Deficit under Central Pivot Irrigation System Using Remote Sensing Techniques. WJET 2015, 03, 65–72. [Google Scholar] [CrossRef]
- Ghany, S.H.A.E.; Nassar, A.; Swelam, A.; ElFetyany, M. Assessment of Irrigation Water and Water Delivery Performance at Branch Canal Level in the Nile Delta. Int. J. Civ. Eng. Technol. 2020, 11, 17–34. [Google Scholar] [CrossRef]
- El-Din, M.M.N. Climate Change Adaptation Strategy for the Water Sector in Egypt. In Joint Programme for Climate Change Risk Management in Egypt; MDG Achievement Fund: Madrid, Spain, 2013. [Google Scholar]
- Huang, H.; Chen, Y.; Clinton, N.; Wang, J.; Wang, X.; Liu, C.; Gong, P.; Yang, J.; Bai, Y.; Zheng, Y.; et al. Mapping major land cover dynamics in Beijing using all Landsat images in Google Earth Engine. Remote Sens. Environ. 2017, 202, 166–176. [Google Scholar] [CrossRef]
- Yigezu, Y.A.; Abbas, E.; Swelam, A.; Sabry, S.R.; Moustafa, M.A.; Halila, H. Socioeconomic, biophysical, and environmental impacts of raised beds in irrigated wheat: A case study from Egypt. Agric. Water Manag. 2021, 249, 106802. [Google Scholar] [CrossRef]
- Amer, M.H.; El-Hafez, S.A.A.; Ghani, M.B.A. Water Saving in Irrigated Agriculture in Egypt; LAP LAMBERT Academic Publishing: Saarbrücken, Germany, 2017; ISBN 9786202024020. [Google Scholar]


| Data | Spatial Resolution | Temporal Resolution |
|---|---|---|
| Crop Type Classification Data | ||
| Landsat-8 Level 2, Collection 2, Tier 1 | 30 m | 16 days |
| WaPOR Land Cover Classification (Zankalon, Egypt) | 30 m | Dekadal |
| Irrigation Performance Assessment Data | ||
| WaPOR Actual Evapotranspiration and Interception | 100 m | Monthly |
| SSEBop Actual Evapotranspiration and Interception | ≈1 km | Monthly |
| WaPOR Reference Evapotranspiration (ET0) | ≈20 km | Monthly |
| Name | Band |
|---|---|
| Blue | SR_B2 |
| Green | SR_B3 |
| Red | SR_B4 |
| NIR | SR_B5 |
| SWIR-1 | SR_B6 |
| SWIR-2 | SR_B7 |
| NDVI | (NIR-RED)/(NIR + RED) |
| GCVI | (NIR/GREEN) − 1 |
| NDWI | (GREEN-NIR)/(GREEN + NIR) |
| LSWI | (NIR-SWIR1)/(NIR + SWIR1) |
| Summer season | Year | Crop | Crop | PA | UA | OA | Kappa | ||
| Rice | Maize | Other | |||||||
| 2015 | Rice | 390 | 30 | 52 | 0.82 | 0.69 | 0.77 | 0.66 | |
| Maize | 45 | 428 | 21 | 0.86 | 0.84 | ||||
| Other | 126 | 49 | 277 | 0.61 | 0.79 | ||||
| 2016 | Rice | 678 | 60 | 55 | 0.85 | 0.74 | 0.77 | 0.64 | |
| Maize | 39 | 536 | 87 | 0.8 | 0.79 | ||||
| Other | 144 | 76 | 324 | 0.59 | 0.77 | ||||
| 2017 | Rice | 675 | 55 | 61 | 0.85 | 0.76 | 0.78 | 0.66 | |
| Maize | 83 | 444 | 28 | 0.8 | 0.81 | ||||
| Other | 119 | 47 | 330 | 0.66 | 0.78 | ||||
| 2018 | Rice | 675 | 87 | 54 | 0.82 | 0.77 | 0.77 | 0.65 | |
| Maize | 77 | 528 | 34 | 0.82 | 0.79 | ||||
| Other | 123 | 48 | 275 | 0.61 | 0.75 | ||||
| 2019 | Rice | 499 | 40 | 38 | 0.86 | 0.82 | 0.8 | 0.7 | |
| Maize | 24 | 344 | 32 | 0.86 | 0.78 | ||||
| Other | 82 | 52 | 290 | 0.68 | 0.8 | ||||
| Winter season | Year | Crop | Crop | PA | UA | OA | Kappa | ||
| Wheat | Clover | Other | |||||||
| 2015/ 2016 | Wheat | 213 | 16 | 6 | 0.9 | 0,83 | 0.87 | 0.8 | |
| Clover | 19 | 155 | 0 | 0.89 | 0.9 | ||||
| Other | 24 | 0 | 94 | 0.79 | 0.94 | ||||
| 2016/ 2017 | Wheat | 170 | 15 | 8 | 0.88 | 0.88 | 0.88 | 0.82 | |
| Clover | 10 | 124 | 0 | 0.92 | 0.98 | ||||
| Other | 13 | 0 | 74 | 0.85 | 0.9 | ||||
| 2017/ 2018 | Wheat | 386 | 44 | 9 | 0.87 | 0.82 | 0.87 | 0.79 | |
| Clover | 65 | 351 | 0 | 0.84 | 0.88 | ||||
| Other | 15 | 0 | 124 | 0.89 | 0.93 | ||||
| 2018/ 2019 | Wheat | 155 | 4 | 1 | 0.96 | 0.93 | 0.95 | 0.93 | |
| Clover | 8 | 175 | 0 | 0.95 | 0.97 | ||||
| Other | 3 | 0 | 51 | 0.94 | 0.98 | ||||
| 2019/ 2020 | Wheat | 114 | 5 | 1 | 0.95 | 0.85 | 0.89 | 0.83 | |
| Clover | 6 | 111 | 0 | 0.94 | 0.95 | ||||
| Other | 13 | 0 | 101 | 88 | 0.99 | ||||
| Crop | Year | RMSE (ha) | MAE (ha) |
|---|---|---|---|
| Rice | 2015 | 18,243 | 15,826 |
| Rice | 2016 | 20,126 | 17,569 |
| Rice | 2017 | 15,875 | 13,329 |
| Rice | 2018 | 13,477 | 11,159 |
| Rice | 2019 | 16,103 | 13,710 |
| Maize | 2015 | 10,154 | 8944 |
| Maize | 2016 | 11,297 | 9923 |
| Maize | 2017 | 9411 | 7968 |
| Maize | 2018 | 8306 | 6861 |
| Maize | 2019 | 10,125 | 8734 |
| Wheat | 2015/2016 | 11,050 | 9774 |
| Wheat | 2016/2017 | 12,279 | 10,948 |
| Wheat | 2017/2018 | 10,167 | 8566 |
| Wheat | 2018/2019 | 9511 | 7604 |
| Wheat | 2019/2020 | 10,838 | 9311 |
| Clover | 2015/2016 | 13,382 | 11,413 |
| Clover | 2016/2017 | 14,917 | 12,518 |
| Clover | 2017/2018 | 12,301 | 10,195 |
| Clover | 2018/2019 | 11,241 | 9063 |
| Clover | 2019/2020 | 13,074 | 10,961 |
Disclaimer/Publisher’s Note: The statements, opinions and data contained in all publications are solely those of the individual author(s) and contributor(s) and not of MDPI and/or the editor(s). MDPI and/or the editor(s) disclaim responsibility for any injury to people or property resulting from any ideas, methods, instructions or products referred to in the content. |
© 2025 by the authors. Licensee MDPI, Basel, Switzerland. This article is an open access article distributed under the terms and conditions of the Creative Commons Attribution (CC BY) license (https://creativecommons.org/licenses/by/4.0/).
Share and Cite
Saleh, S.; Ayyad, S.; Ribbe, L. Satellite-Based Approach for Crop Type Mapping and Assessment of Irrigation Performance in the Nile Delta. Earth 2025, 6, 80. https://doi.org/10.3390/earth6030080
Saleh S, Ayyad S, Ribbe L. Satellite-Based Approach for Crop Type Mapping and Assessment of Irrigation Performance in the Nile Delta. Earth. 2025; 6(3):80. https://doi.org/10.3390/earth6030080
Chicago/Turabian StyleSaleh, Samar, Saher Ayyad, and Lars Ribbe. 2025. "Satellite-Based Approach for Crop Type Mapping and Assessment of Irrigation Performance in the Nile Delta" Earth 6, no. 3: 80. https://doi.org/10.3390/earth6030080
APA StyleSaleh, S., Ayyad, S., & Ribbe, L. (2025). Satellite-Based Approach for Crop Type Mapping and Assessment of Irrigation Performance in the Nile Delta. Earth, 6(3), 80. https://doi.org/10.3390/earth6030080