Article

Grasslands in Flux: A Multi-Decadal Analysis of Land Cover Dynamics in the Riverine Dibru-Saikhowa National Park Nested Within the Brahmaputra Floodplains

1
Department of Zoology, Bodoland University, Kokrajhar 783370, Assam, India
2
Estuarine Biology Regional Centre, Zoological Survey of India, Gopalpur-on-Sea, Ganjam 761002, Odisha, India
3
Ocean and Fisheries Development International Cooperation Institute, College of Fisheries Science, Pukyong National University, Busan 48513, Republic of Korea
4
International Graduate Program of Fisheries Science, Pukyong National University, Busan 48513, Republic of Korea
5
Department of Botany, Bodoland University, Kokrajhar 783370, Assam, India
6
Department of Geography, Bodoland University, Kokrajhar 783370, Assam, India
7
Women’s College Tinsukia, Tinsukia 786125, Assam, India
8
Centre for Wildlife Research and Biodiversity Conservation, Bodoland University, Kokrajhar 783370, Assam, India
*
Author to whom correspondence should be addressed.
Earth 2025, 6(3), 78; https://doi.org/10.3390/earth6030078
Submission received: 10 June 2025 / Revised: 9 July 2025 / Accepted: 10 July 2025 / Published: 12 July 2025

Abstract

In recent years, remote sensing and geographic information systems (GISs) have become essential tools for effective landscape management. This study utilizes these technologies to analyze land use and land cover (LULC) changes in Dibru-Saikhowa National Park, a riverine ecosystem in Assam, India, from its designation as a national park in 2000 through 2024. The satellite imagery was used to classify LULC types and track landscape changes over time. In 2000, grasslands were the dominant land cover (28.78%), followed by semi-evergreen forests (25.58%). By 2013, shrubland became the most prominent class (81.31 km2), and degraded forest expanded to 75.56 km2. During this period, substantial areas of grassland (29.94 km2), degraded forest (10.87 km2), semi-evergreen forest (12.33 km2), and bareland (10.50 km2) were converted to shrubland. In 2024, degraded forest further increased, covering 80.52 km2 (23.47%). This change resulted since numerous areas of shrubland (11.46 km2) and semi-evergreen forest (27.48 km2) were converted into degraded forest. Furthermore, significant shifts were observed in grassland, shrubland, and degraded forest, indicating a substantial and consistent decline in grassland. These changes are largely attributed to recurring Brahmaputra River floods and increasing anthropogenic pressures. This study recommends a targeted Grassland Recovery Project, control of invasive species, improved surveillance, increased staffing, and the relocation of forest villages to reduce human impact and support community-based conservation efforts. Hence, protecting the landscape through informed LULC-based management can help maintain critical habitat patches, mitigate anthropogenic degradation, and enhance the survival prospects of native floral and faunal assemblages in DSNP.

1. Introduction

The terrestrial surface of Earth serves not only as a habitat for all land-based flora and fauna but also as a crucial foundation for the delivery of essential ecosystem services [1,2]. However, it is important to recognize that human activities have significantly transformed nearly 75% of the Earth’s land surface over the past millennium [3,4]. In this context, it becomes evident that addressing major global sustainability challenges such as anthropogenic pressure, climate change, biodiversity loss, and food security requires a nuanced understanding of land use dynamics [5,6,7,8,9]. Against this backdrop, land use and land cover (LULC) changes have emerged as key drivers of global ecosystem service alterations. In particular, South and Southeast Asia are undergoing some of the most rapid LULC transformations, largely driven by demographic shifts [10,11,12,13]. This, in turn, has become a major driver of ongoing LULC changes across the region and also at the global scale [12,13,14,15,16].
In addition to anthropogenic drivers, natural dynamic processes also play a significant role in shaping land use and land cover patterns [17,18]. Among these, ecological succession, i.e., the gradual replacement of one plant community by another, can lead to long-term transformations in habitat structure and function, thereby influencing land use both directly and indirectly [19,20]. Similarly, hydrological processes such as natural river meandering and avulsion can rapidly reshape terrestrial landscapes through erosion, sediment deposition, and the formation of new floodplains and wetlands [21,22]. Although these processes are part of the inherent geomorphological dynamics of Earth, they can induce abrupt habitat changes that many terrestrial species are unable to adapt to [17]. Specifically, species with narrow ecological niches such as obligate grassland specialists, floodplain forest endemics, and fossorial mammals restricted to specific soil types are particularly vulnerable to the abrupt changes in landforms and vegetation caused by such natural disturbances [23,24].
Consequently, the detection of LULC change has become a fundamental component in contemporary strategies for environmental monitoring and natural resource management [25,26]. LULC information is widely utilized by researchers, policymakers, and planners to assess changes in natural resources, including the evaluation of spatial growth patterns and landscape dynamics [27,28]. Empirical studies across various disciplines have consistently demonstrated that LULC change plays a central role in effective landscape management practices [29,30]. As such, the study of LULC change detection continues to attract considerable scientific attention [28,31,32,33,34,35,36,37]. Furthermore, these studies underscore the importance of evidence-based interventions, stressing the need for detailed information on the extent, rate, and spatial–temporal distribution of LULC changes. Such insights are essential for formulating effective environmental policies and for designing targeted strategies to mitigate adverse impacts on ecosystems and natural resources [38].
In recent years, the integration of geographic information systems (GISs) and remote sensing technologies has been widely adopted for LULC mapping and change detection across the globe [39,40,41,42,43]. LULC classification techniques are broadly categorized into supervised and unsupervised approaches [44]. Unsupervised classification groups image pixels into clusters based on their spectral properties without prior knowledge of land cover types, making it useful for exploratory analysis [45]. In contrast, supervised classification utilizes pre-identified training data, allowing the algorithm to assign pixels to defined land cover categories with greater thematic accuracy [44]. Due to its reliance on ground-truth or reference data, supervised classification is generally preferred for producing accurate and interpretable LULC maps. Among supervised methods, the Maximum Likelihood Classifier (MLC) remains one of the most widely used and accepted techniques [46,47]. The MLC assumes a normal distribution of spectral signatures and applies a probabilistic approach to assign pixels to the class with the highest likelihood, effectively accounting for spectral variability within classes [48]. Its statistical rigor and ease of implementation make it particularly suitable for a wide range of LULC applications in GIS and remote sensing. These advances in remote sensing, particularly in digital image processing techniques, have significantly enhanced the application of satellite imagery for monitoring LULC changes across varying spatial and temporal scales [42,49,50]. Nonetheless, the combined use of GIS and remote sensing has proven to be a powerful approach, greatly contributing to the effective management of land and natural resources. Moreover, it has facilitated a deeper understanding of the intricate relationships between spatial patterns and the underlying processes driving landscape transformations [51,52,53].
Dibru-Saikhowa National Park (DSNP) is a distinctive riverine protected area situated within the Brahmaputra floodplains of Northeast India. It represents a crucial component of this ecologically important landscape, harboring a diverse assemblage of threatened flora and fauna [54]. Notably, the park lies within the globally recognized Indo-Burma biodiversity hotspot and forms a part of the Dibru-Saikhowa Important Bird Area (IBA) complex [55,56]. Despite its ecological importance, the park experiences significant environmental dynamism due to its close proximity to the Brahmaputra River, which is characterized by high braiding intensity and highly variable hydrological regimes [57]. The river’s shifting channels and intense erosion continuously reshape the landscape, presenting ongoing challenges for habitat stability and effective management. In addition to these geomorphological pressures, the park’s ecosystems are increasingly threatened by the spread of invasive plant species, which degrade specialized habitats such as grasslands [58,59]. Notable invasive species include Chromolaena odorata (L.) R.M.King & H.Rob., Mikania micrantha Kunth., Parthenium hysterophorous L., and Ageratum conyzoides L., all of which have been observed to outcompete native vegetation. Furthermore, even certain native species, such as Bombax ceiba and Lagerstroemia speciosa, are acting as grassland invaders, altering the natural structure and function of the landscape. This poses a serious threat to the survival of grassland-obligate species, many of which are already globally threatened due to ongoing habitat loss. The concern is heightened by the fact that numerous species are endemic to the grasslands found in the floodplains of this region. Notable species which are rapidly decreasing include the Bengal Florican (Houbaropsis bengalensis), Hog Deer (Axis porcinus), Swamp Grass Babbler (Prinia cinerascens), etc., all of which are classified as “critically endangered” and “endangered” according to the International Union for Conservation of Nature (IUCN) Red List assessment [60,61,62]. Moreover, the park also experiences significant anthropogenic pressures from forest villages located within its boundaries. Given these ongoing ecological and anthropogenic transformations, it is essential to identify and monitor LULC changes, as well as to understand the underlying drivers, in order to inform adaptive management and conservation strategies. Accordingly, the present study aims to (i) detect LULC changes since the year 2000, when DSNP was designated as a national park; (ii) analyze the spatial patterns and ecological drivers of these changes, and (iii) propose evidence-based recommendations for future conservation interventions. Hence, by studying the spatiotemporal LULC dynamics, the study will provide critical insights into landscape-level changes that threaten native flora and fauna, thereby contributing to the development of targeted, science-driven conservation and management strategies for DSNP in the Brahmaputra Floodplains.

2. Materials and Methods
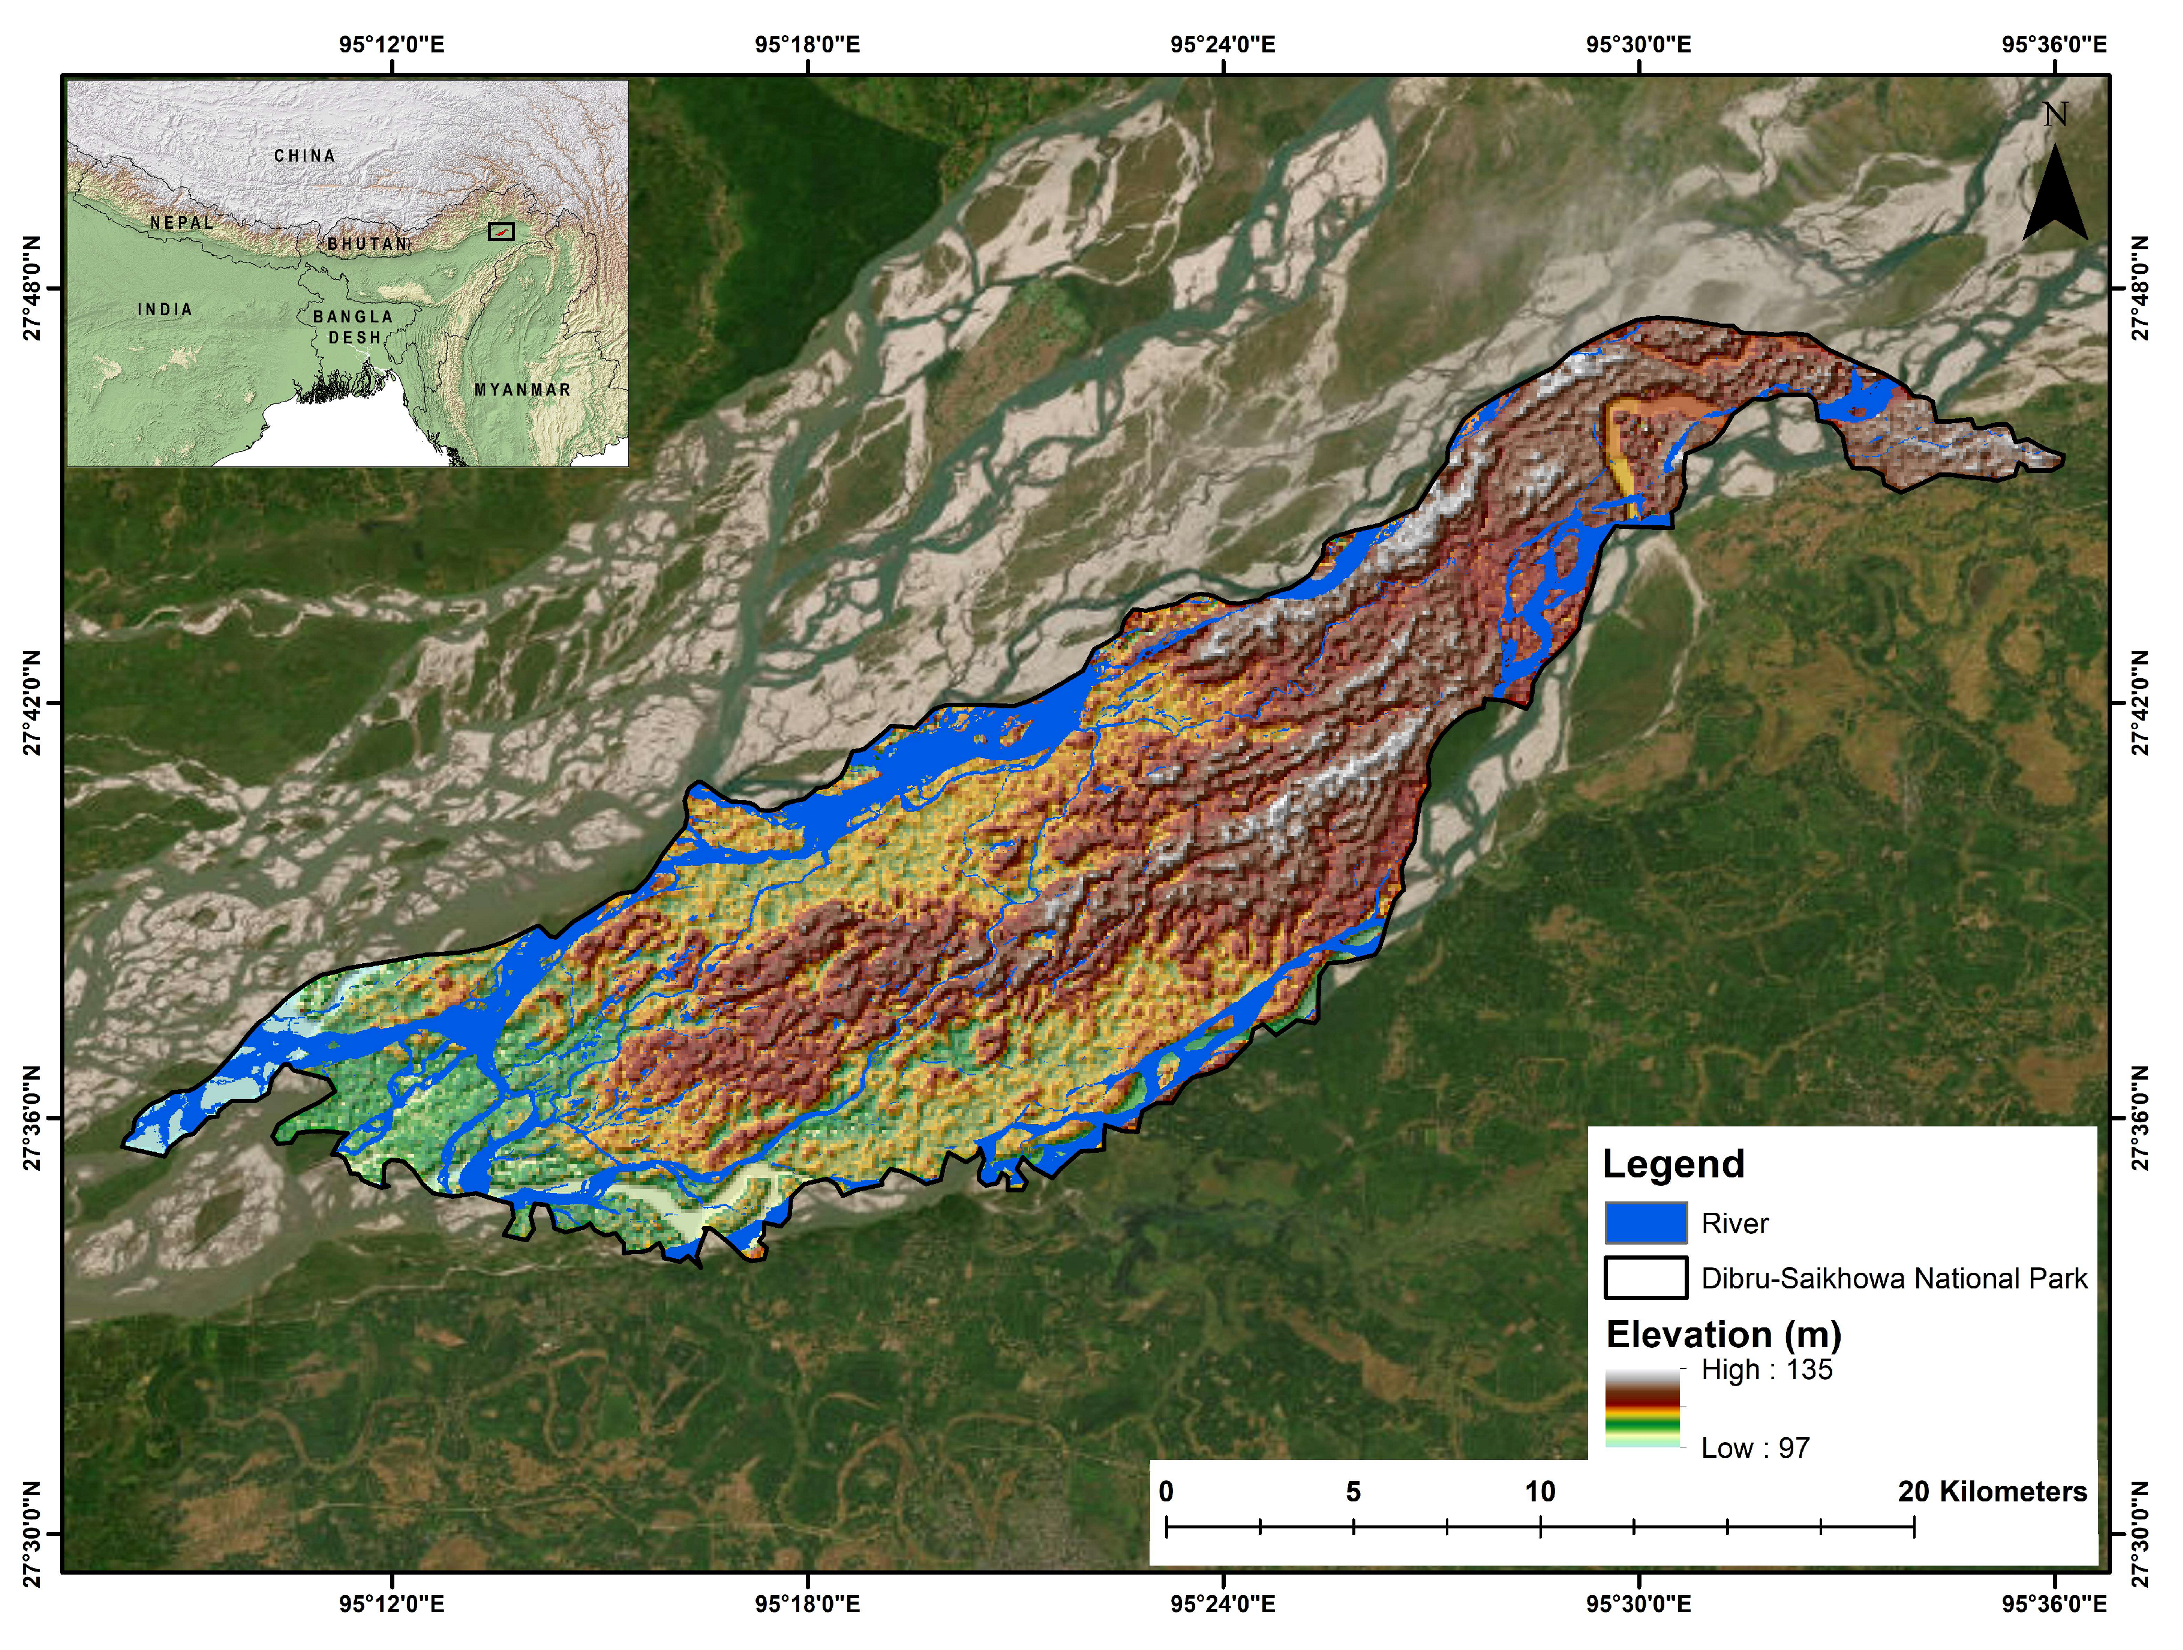
2.1. Study Area

The name “Dibru-Saikhowa” originates from the amalgamation of two forest reserves, namely the Dibru Reserve Forest and the Saikhowa Reserve Forest, when the region was declared a Wildlife Sanctuary in 1995, encompassing a core area of approximately 340 km2. Subsequently in 1997, the area was further recognized by UNESCO as a Biosphere Reserve, incorporating an additional buffer zone of 425 km2. Thereupon in 1999, the wildlife sanctuary was upgraded to DSNP, maintaining the original core area extent. The nomenclature of the park also reflects the presence of the Dibru River, which delineates its southern boundary. Geographically, DSNP is situated within the Tinsukia and Dibrugarh districts of Assam, India, spanning latitudes 27°30′ to 27°50′ N and longitudes 95°10′ to 95°36′ E, ranking as the fourth-largest national park in the state (Figure 1) [63]. The park is hydrologically bounded by several major rivers, including the Brahmaputra, Dihang, and Dibang to the north, and the Lohit and Dibru to the east and south. The landscape is further influenced by the confluence of six additional tributaries, viz. Noa Dihing, Kundil, Tengapani, Dotung, Dhola, and Dangori, which discharge into the Brahmaputra River. The Lohit River notably exerts geomorphological control by capturing the courses of the Dibru and Dangori rivers, creating a complex fluvial network. Geologically, the northern region of the park adjoins the extended foothills of the Eastern Himalayas. The substratum comprises primarily shale, sandstone, and fossilized vegetal remains, while the floodplains are dominated by recent alluvial deposits. The elevated southern areas are characterized by older alluvium, including sand, cobbles, pebbles, and gravel deposits [63]. The park experiences a tropical monsoon climate, characterized by warm summers with maximum temperatures reaching approximately 34 °C and mild winters with minimum temperatures around 6 °C. The temperature regime shows a gradual increase starting in March, peaking in July, and declining through November and December, thus shaping the ecological and phenological cycles within the park.

2.2. Data Acquisition and Land Use/Land Cover Classification Scheme

The preliminary reconnaissance surveys were carried out in October and December 2024 and February 2025, with local permissions from the range office. The process also included consultations with local authorities, subject matter experts, and community members residing in the fringe areas of DSNP. Additionally, previous maps from the management plan and Google Earth imagery were used to identify historical land cover patterns for the years 2000 and 2013, following previously established methodologies [64,65]. The preliminary field visits also aimed to identify and record sampling locations representative of distinct habitat types, which were later used for training the classification model and conducting an accuracy assessment of the year 2024. Subsequently, upon obtaining formal authorization from the Chief Wildlife Warden, Department of Environment, Forest and Climate Change, Government of Assam (Permission No. WL/FG.31/RS/38th T.C./2025-Pt, dated 11 April 2025), the identified sites were revisited and extensively surveyed in April and May 2025 for on-ground validation of the classified map. Additionally, multi-temporal satellite imagery for the years 2000, 2013, and 2024 was freely obtained from the USGS Earth Explorer platform for the delineated study area (Table 1). The satellite data were sourced primarily from the Landsat program, specifically using the Thematic Mapper (TM) sensor on Landsat 5 and the Operational Land Imager/Thermal Infrared Sensor (OLI/TIRS) on Landsat 8. Furthermore, 7 reflective spectral bands were utilized, i.e., Bands 1 to 5 and Band 7 from Landsat 5 TM and Bands 1 to 7 from Landsat 8 OLI. These bands span the visible, near-infrared (NIR), and shortwave infrared (SWIR) regions of the electromagnetic spectrum, which are particularly effective for applications such as vegetation discrimination, surface moisture analysis, and land cover classification. Specifically, the year 2013 was selected because no suitable satellite imagery was available for the study area in 2012 from the Landsat 7 ETM+ sensor. This was due to data loss caused by the Scan Line Corrector (SLC) failure, which has affected image coverage since 2003, resulting in incomplete or missing data for certain regions.

2.3. Data Processing and Analysis

The retrieved satellite images were preprocessed to correct for image distortions and enhance interpretability of the images prior to classification. The preprocessing workflow included geometric correction, selection of bands and subsetting, layer stacking, and image enhancement through histogram equalization techniques based on standard protocols [40,42,66,67]. Furthermore, to ensure consistency for temporal change detection at the pixel level, Landsat 5 TM images were co-registered with the corresponding Landsat 8 OLI images using automated image-to-image registration methods, anchored by a set of 10 ground control points. The Root Mean Square Error (RMSE) was 2.50 m for the year 2000 and 2.35 m for 2013. All images were geo-referenced to the Universal Transverse Mercator (UTM)—46N projection, WGS 84 datum, as provided by the data source. The satellite imagery of each year was independently classified using a supervised classification approach informed by ground-truth data on existing LULC classes along with existing maps and Google Earth imagery. The Maximum Likelihood Classification (MLC) algorithm was employed for this purpose within ArcGIS v10.6 software [68]. The MLC for the year 2024 was trained using 450 independent training samples collected during field surveys which represented the distinct LULC classes. However, it is acknowledged that classification errors in area estimates may arise due to limitations in the spatial and spectral resolution of the satellite imagery used [69]. Therefore, accuracy assessment of the classified outputs was conducted using validation datasets to evaluate the reliability of the classification results [70]. The accuracy assessment of the classified result for the year 2024 was conducted using 370 independent ground-truthed locations representing the various LULC classes. Subsequently, a post-classification comparison method was implemented, involving the comparative analysis of the separately classified LULC maps from the years 2000, 2013, and 2024 to detect and quantify temporal changes in land cover.

2.4. Quantitative Assessment of Temporal LULC Dynamics

The significance of temporal variations in LULC over the study period (2000, 2013 and 2024) was assessed using the chi-square (χ2) test. This statistical approach is commonly applied in LULC studies to determine whether observed changes in categorical land cover data are statistically significant or result from random variation [71,72]. The analysis was conducted in two phases: first, the overall distribution of LULC classes was evaluated independently for each of the three selected years (2000, 2013, and 2024); second, changes within individual LULC categories were examined across these periods to identify classes exhibiting significant transitions. This approach has proven effective in various land change studies to quantify landscape transformations and support spatiotemporal assessments [63,64].

3. Results

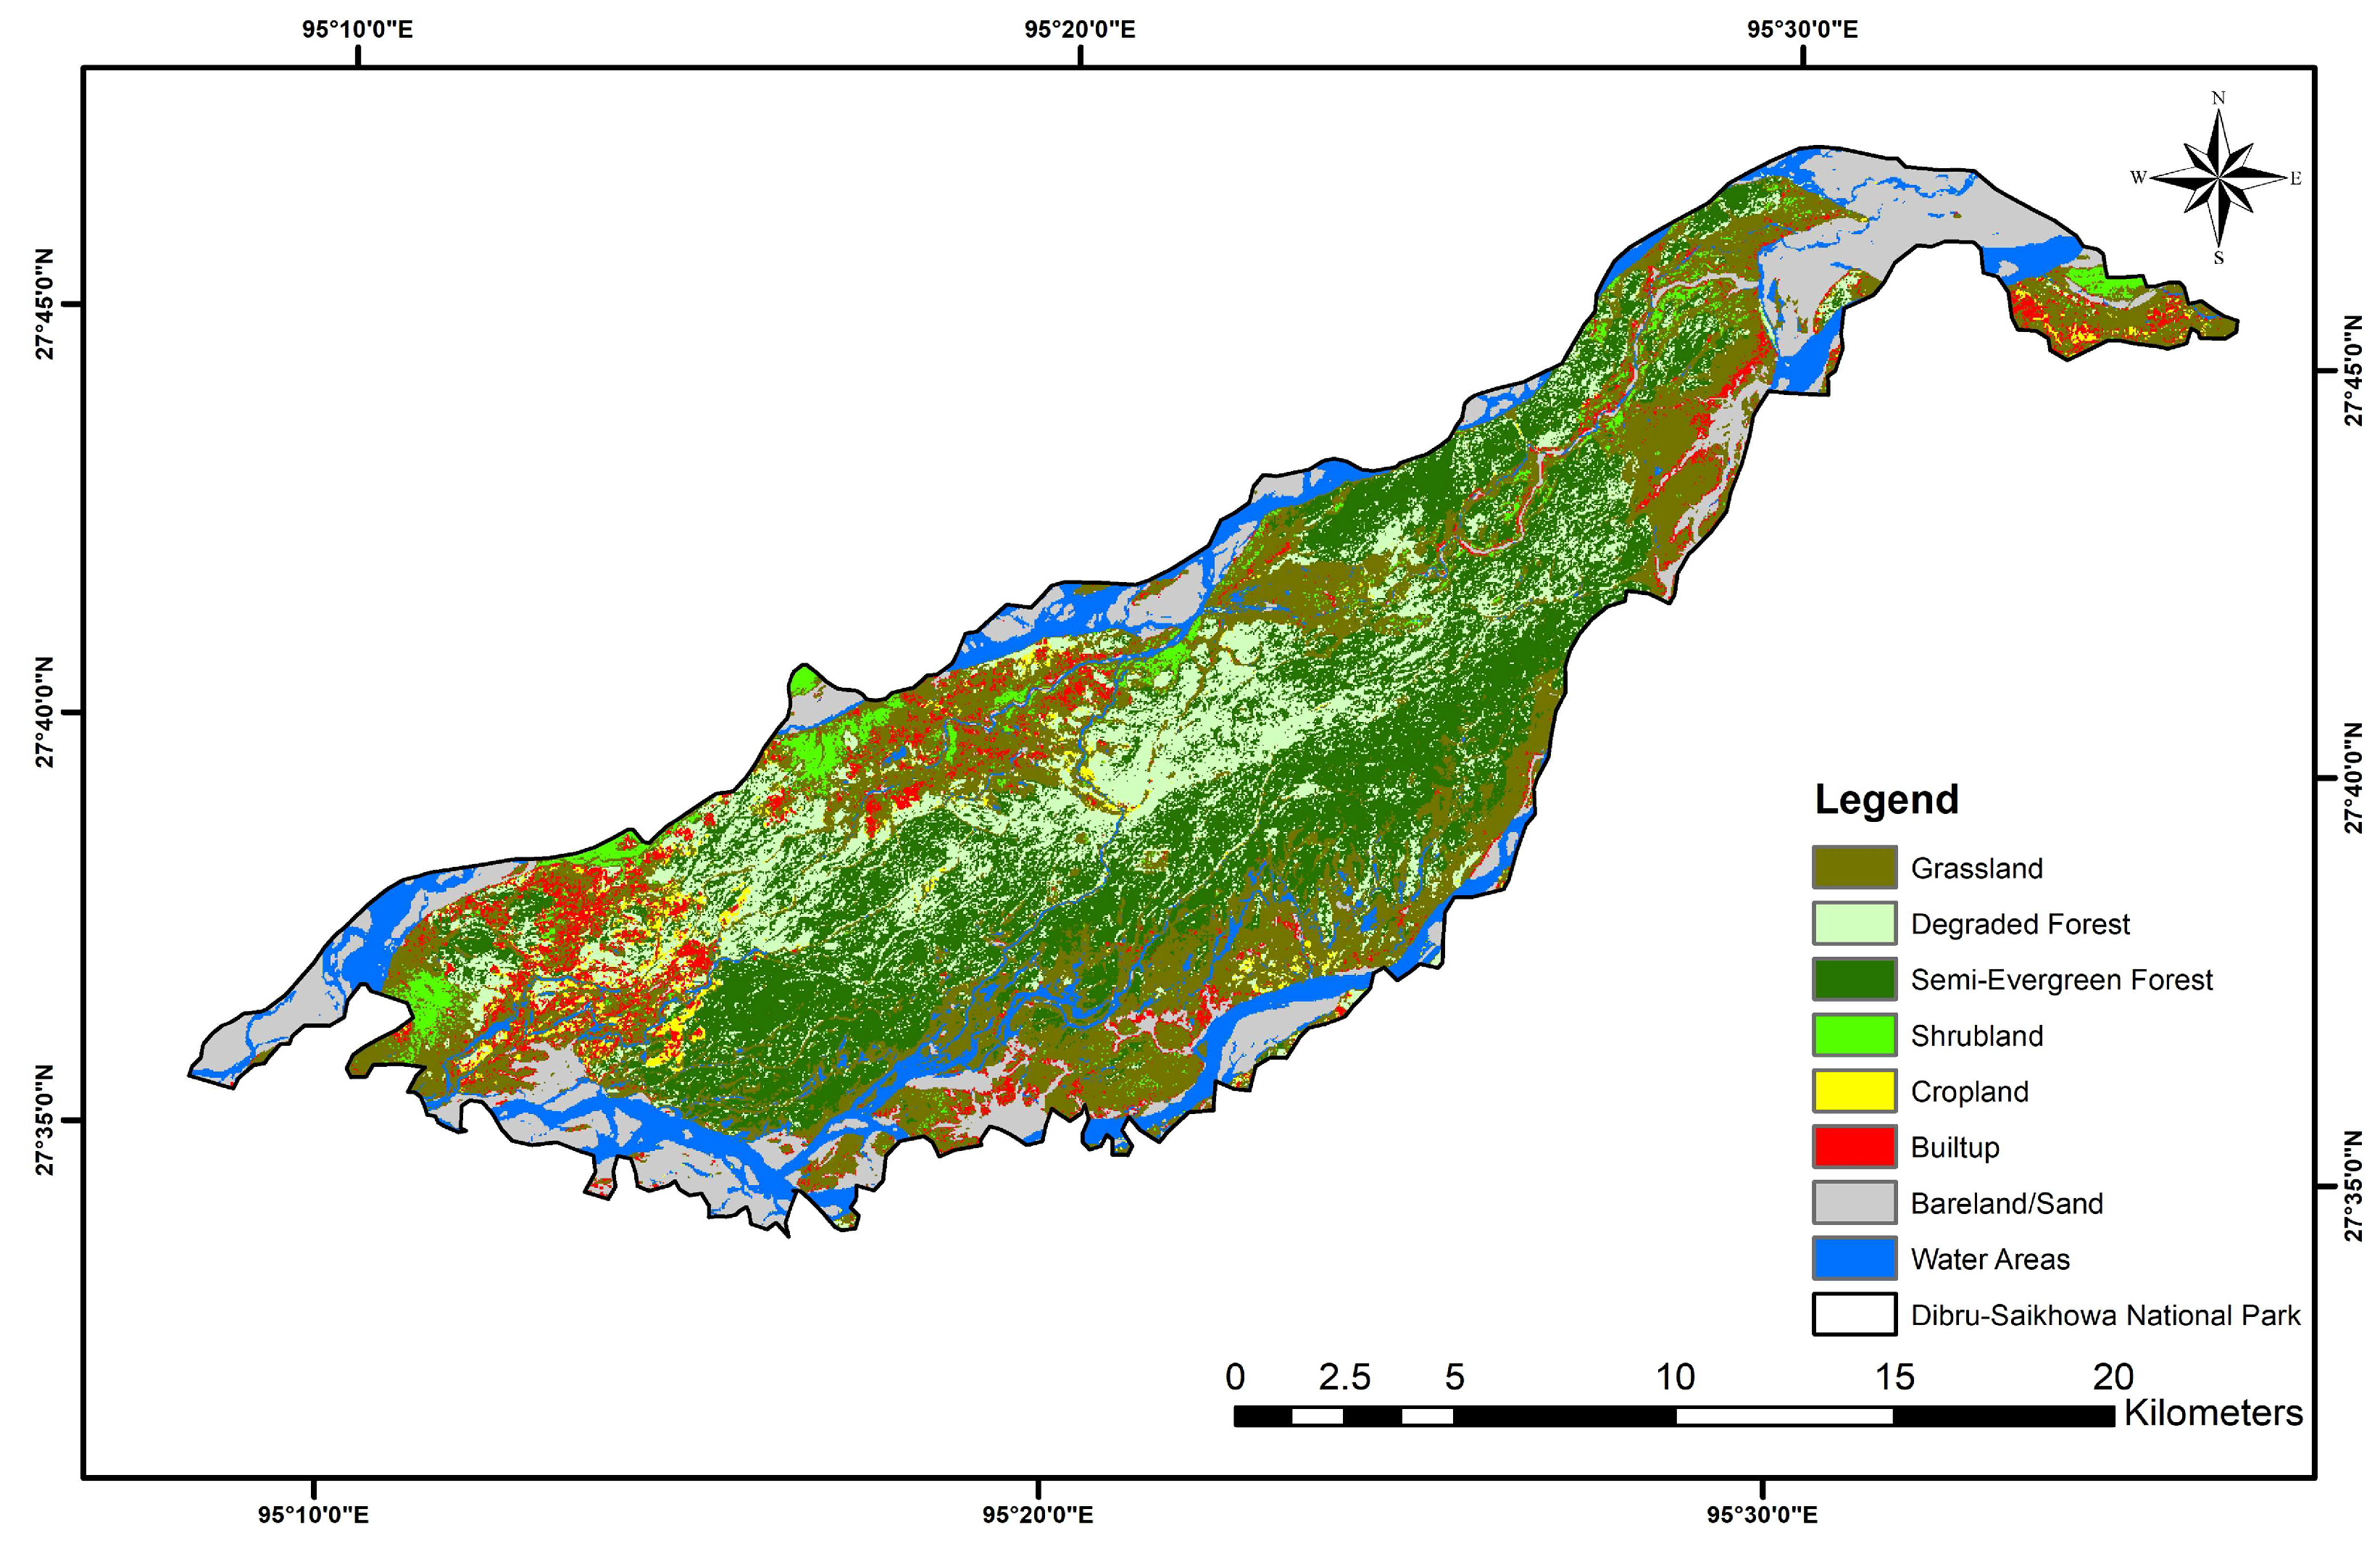
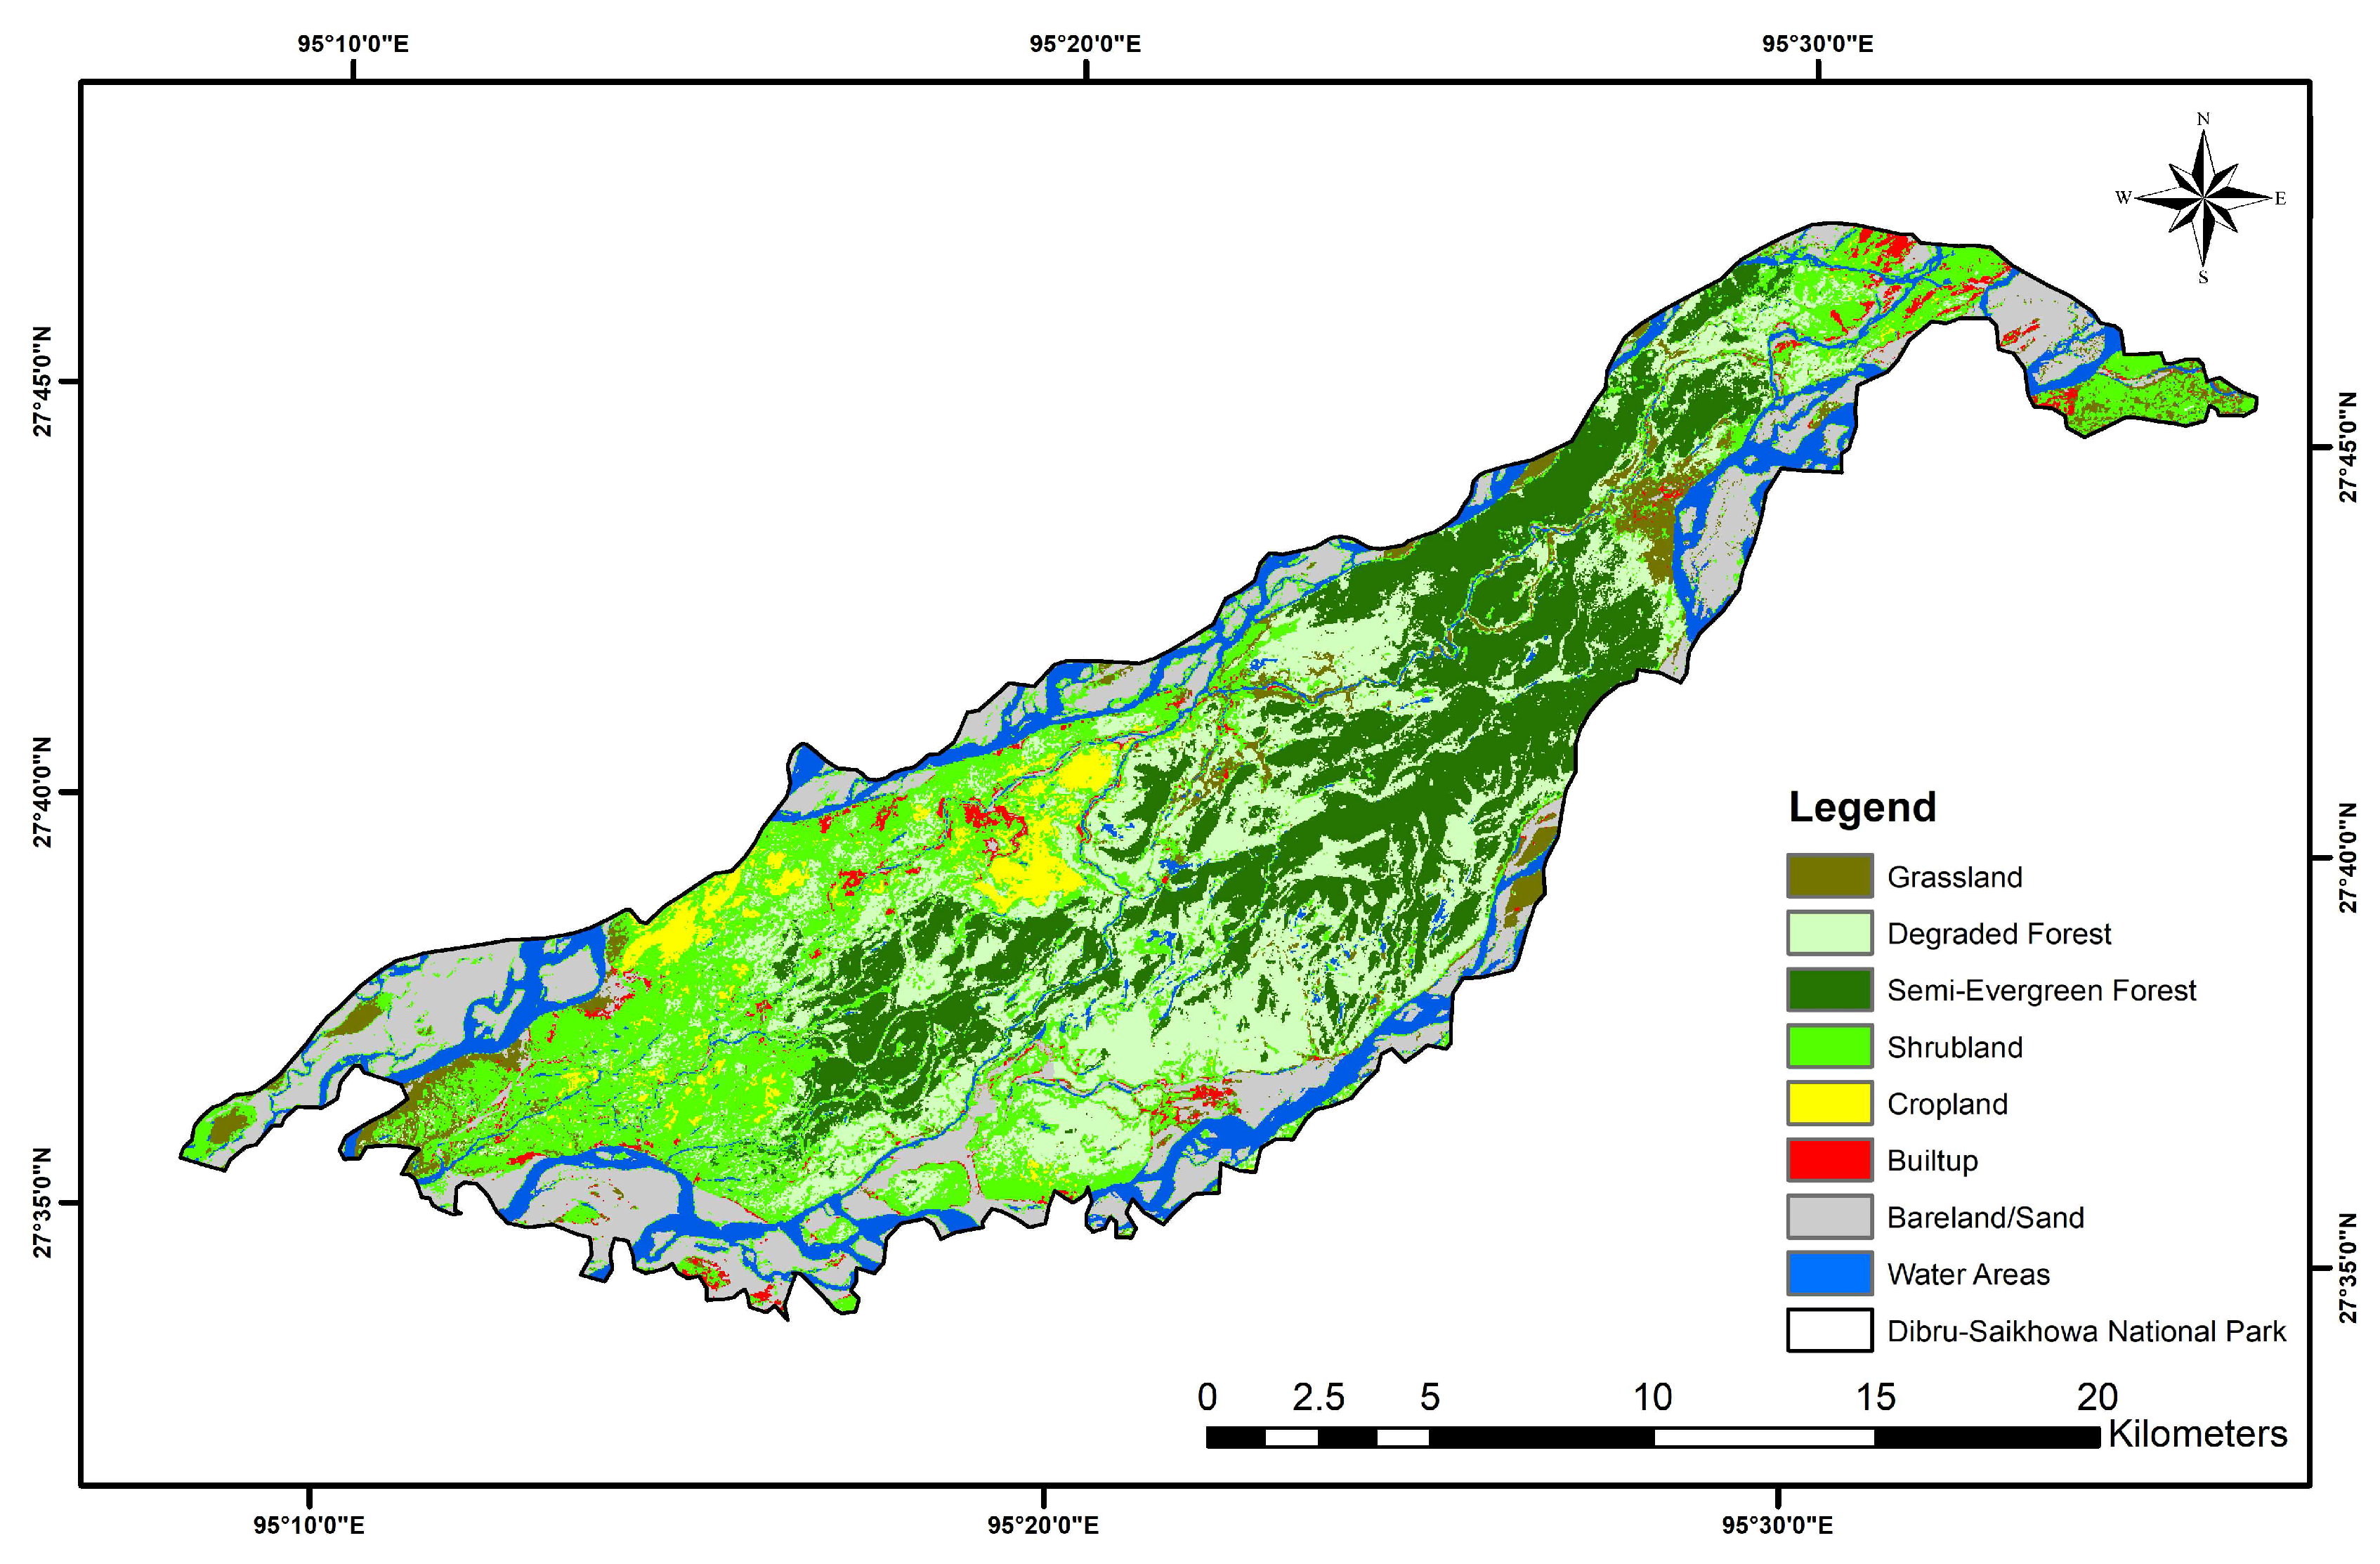
3.1. Land Use and Land Cover Classification

The multi-temporal satellite images were classified into eight major LULC categories for the years 2000, 2013, and 2024 (Figure 2, Table S1). The classification was constrained within the officially notified core area of DSNP, encompassing a total area of 340 km2. This spatial framework facilitated a consistent temporal comparison to assess shifts in land cover patterns across nearly two and a half decades. The LULC classes delineated included grassland, semi-evergreen forest, degraded forest, shrubland, bareland, cropland, water areas, and built-up areas. In the baseline year 2000, which immediately followed the declaration of the region as a national park, grasslands were the most dominant land cover type (Figure 3, Table 2). They occupied an estimated 97.88 km2, constituting approximately 28.78% of the park’s area. This was followed by semi-evergreen forests, which covered 87 km2 (25.58%). The smallest land cover category during this period was cropland, occupying only 5.21 km2, or 1.53% of the total area. Furthermore, by 2013, the LULC composition had undergone notable shifts (Figure 4, Table 2). The shrubland became the most prominent land cover type, covering 81.31 km2 and comprising 23.87% of the total area. This was closely followed by degraded forests, which spanned 75.56 km2 (22.18%). In contrast, built-up areas constituted the smallest proportion, covering 7.19 km2 or 2.11% of the park. In the most recent assessment year, 2024, degraded forest continued to dominate, covering 80.52 km2 and accounting for 23.67% of the park’s area (Figure 5, Table 2). It was followed by semi-evergreen forests, which occupied 59.8 km2 (17.58%). The smallest category remained built-up area, with a spatial extent of 4.72 km2, making up just 1.39% of the total land area.

3.2. Accuracy Assessment of the Classified LULC

The accuracy assessment of the land cover classification for DSNP for the year 2024 was conducted using a confusion matrix based on 370 ground-truthed reference samples, representing eight land cover classes. The classification achieved an overall accuracy of 82.70% and a Kappa coefficient of 0.802, indicating a strong level of agreement between the classified map and reference data (Table S2). The weighted Kappa statistic was 0.874, which refers to an almost perfect agreement when the severity of classification errors is taken into account. The user’s accuracy, which reflects the likelihood that a pixel classified as a certain land cover type actually represents that class on the ground, ranged from 60.66% for shrubland to 95.83% for semi-evergreen forest. The producer’s accuracy, which assesses the probability that a reference pixel was correctly classified, varied from 72% for degraded forest to 92% for semi-evergreen forest. The high classification performance was observed for water areas (user’s accuracy: 86.54%; producer’s accuracy: 90%), bareland (93.33%, 84%), and semi-evergreen forest (95.83%, 92%). Moreover, moderate accuracies were obtained for built-up areas (user’s accuracy: 82.93%; producer’s accuracy: 85%), grassland (82.93%, 85%), and shrubland (60.66%, 74%), respectively (Table S2).

3.3. Multi-Decadal Land Use and Land Cover Change Dynamics

Between 2000 and 2024, DSNP exhibited substantial spatial and proportional shifts in its LULC patterns (Table 3). One of the most prominent changes was observed in grasslands, which covered 97.88 km2 in the year 2000, but by 2013, grassland area had declined by approximately 82.95%, representing a decrease of 81.19 km2 (Figure 3 and Figure 4, Table 2). This observed reduction in grassland areas between 2000 and 2013 can be largely attributed to significant land cover transitions, as a substantial portion of grassland was converted to shrubland (29.94 km2), degraded forest (29.56 km2), water areas (10.78 km2), and bareland (9.63 km2) in the year 2013 (Table 4, Figure S1). In contrast, shrubland cover showed a considerable increase over the same period as it expanded from 8.27 km2 in 2000 to 81.31 km2 in 2013, amounting to an 883.19% increase (a gain of 73.04 km2). This substantial increase in shrubland area can be attributed to the widespread conversion of various land cover types, as large areas of grassland (29.94 km2), degraded forest (10.87 km2), semi-evergreen forest (12.33 km2), and bareland (10.50 km2) were transformed into shrubland by 2013, contributing significantly to this expansion. Similarly, the degraded forest areas also showed a steady rise, increasing by 50.55% from 50.19 km2 in 2000 to 75.56 km2 in 2013 (Figure 3 and Figure 4, Table 2). In contrast, the semi-evergreen forest area decreased by 19.79%, resulting in a loss of 17.22 km2 during this period. The contrasting trends of an increase in degraded forest area and a decline in semi-evergreen forest can be explained by the substantial conversion of semi-evergreen forest (21.99 km2) and grassland (29.56 km2) into degraded forest during the study period. Furthermore, the built-up areas recorded a decrease of 4.85 km2 in 2013 compared to 2000, whereas cropland areas experienced an increase of 3.3 km2. Moreover, both bareland and water areas expanded, each by 4.85 km2 and 0.79 km2, respectively, in 2013 compared to 2000. Notably, the period from 2013 to 2024 revealed further dynamic changes in LULC within DSNP (Figure 4 and Figure 5, Table 2). The grassland areas showed a marked recovery, increasing by 18.6 km2, which is equivalent to a 111.44% rise between 2013 and 2024. However, shrubland areas showed a significant decline of 53.47 km2, representing a 65.76% reduction by 2024 (Figure 4 and Figure 5, Table 2). This trend is primarily driven by the conversion of shrubland into grassland, with a significant area of 17.67 km2 undergoing this transition in the year 2024 (Table 4, Figure S2). Subsequently, the degraded forest continued to expand, increasing by approximately 4.96 km2 between 2013 and 2024. Intriguingly, the semi-evergreen forest showed a further decline of 9.98 km2 during this period. In this context, the bidirectional conversion between semi-evergreen forest and degraded forest was notable, with 27.48 km2 of semi-evergreen forest converted to degraded forest and 17.85 km2 of degraded forest transitioning back to semi-evergreen forest. Notably, the built-up areas also decreased by 2.47 km2, whereas cropland showed an increase of 5.1 km2 by 2024 compared to 2013. In addition, both bareland and water areas recorded sudden increases in their spatial extent, as bareland increased by 17.99 km2 and water areas expanded by 18.8 km2 between 2013 and 2024. These land cover increases are primarily attributed to the significant transformation of shrubland into these categories. A considerable area of shrubland was converted into bareland (15.20 km2), water bodies (15.11 km2), and cropland (8.37 km2) by the year 2024.

3.4. Statistical Evaluation of the Classified LULC

A chi-square test was performed to evaluate the statistical significance of differences in LULC distribution across the three study years: 2000, 2013, and 2024. The results revealed highly significant variations among LULC classes in each of the study years: 2000 (χ2 = 203.20, df = 7, p < 0.01), 2013 (χ2 = 154.41, df = 7, p < 0.01), and 2024 (χ2 = 120.31, df = 7, p < 0.01). Subsequent chi-square tests were conducted to assess the significance of changes within individual LULC categories over the three time periods. The grassland (χ2 = 223.95, df = 2, p < 0.01) and shrubland (χ2 = 73.04, df = 2, p < 0.01) showed highly significant changes across the years. Additionally, degraded forest (χ2 = 7.69, df = 2, p < 0.05), built-up areas (χ2 = 7.09, df = 2, p < 0.05), and water areas (χ2 = 6.09, df = 2, p < 0.05) exhibited statistically significant changes. In contrast, no statistically significant changes were observed in semi-evergreen forest (χ2 = 4.95, df = 2, p > 0.05), cropland (χ2 = 3.93, df = 2, p > 0.05), and bareland (χ2 = 5.61, df = 2, p > 0.05) over the same period.

4. Discussion

In recent decades, research on LULC has increased globally, driven by the need for improved conservation and management strategies [73]. Specifically, LULC studies provide critical insights for policy planning and targeted interventions, particularly within protected areas, to mitigate the adverse impacts of rapid land use and cover changes [74]. While research on LULC change has expanded considerably worldwide, including significant work across Asia [75]. However, certain developing areas within South Asia still remain relatively understudied [75]. This geographic disparity has prompted calls for increased research efforts in these underrepresented regions to support more effective land management practices [75]. In this context, the present study investigates the LULC dynamics of DSNP, a lesser-known protected area situated in Northeastern India. The study focuses on changes that have occurred since the area’s designation as a protected site under the Wildlife Protection Act (WPA) of 1972. The findings from this research are expected to inform and enhance future land cover management and conservation strategies by park authorities.
This study revealed that in the year 2000, DSNP was predominantly covered by grasslands, which supported a range of endemic, grassland-obligate species in the region [76]. The semi-evergreen forests were the second most dominant land cover type within the park. Interestingly, this period also recorded the highest built-up area among the three years, covering approximately 15.6 km2. This elevated built-up extent may be attributed to the recent declaration of the area as a national park. Although DSNP had previously held the status of a wildlife sanctuary, several forest villages and cattle farming units, known locally as ‘khutis’, were still present within its boundaries. However, by 2013, the LULC of the park had changed significantly. The grassland areas had declined markedly, while shrubland became the dominant land cover, occupying approximately 23.73% of the park. This shift may be attributed to the major flooding events of 2012, which likely altered the landscape, further highlighting the significant role of extreme events in driving LULC changes [77]. This observation is further supported by the substantial conversion of grasslands into bareland and water areas, indicating the likelihood of increased soil erosion and land degradation processes. The significant conversion from grassland to shrubland aligns with this major flooding event, which likely altered and degraded the area. Additionally, during such flood events, erosion is a significant concern, often displacing settlements and contributing to the decline in built-up areas as witnessed in the subsequent years [78]. The region is known to be highly susceptible to flooding from the Brahmaputra River and its tributaries [79]. Hence, the hydrological dynamics of the Brahmaputra River also play a significant role in influencing vegetation patterns and land use changes within the park. Moreover, the grasslands in the region are extensively utilized by local communities for various purposes, including fodder collection for livestock and seasonal agriculture [79,80,81]. While these practices support local livelihoods, they also contribute to the gradual degradation and conversion of native grassland ecosystems [81]. This degradation is particularly evident in the conversion of grasslands into degraded forest observed in 2013, which may also indicate the subsequent likelihood of invasion by grassland-invasive plant species [82,83].
Furthermore, by 2024, some regeneration of grassland was observed, although not to its original extent. This recovery may be linked to the concurrent decline in shrubland and the natural tendency for grasses to recolonize floodplains, where conditions favor rapid growth [58]. Another contributing factor to the decline in shrubland cover may be its conversion into degraded forest areas, particularly due to the rapid spread of species such as Tamarix dioica, a pioneer species common in the region [84,85,86]. This pattern is delineated by the substantial conversion of shrubland into grasslands and degraded forest, thus reflecting shifts in vegetation cover and succession. Furthermore, the subsequent transformation of extensive shrubland areas into water bodies and bareland suggests active erosion processes. These are likely driven by the persistent dynamics of riverine systems, particularly the Brahmaputra River and its tributaries, thereby representing a permanent stress factor influencing the landscape. Consequently, the area of degraded forest has increased over time. The changes were also observed in the semi-evergreen forest cover over the past two decades, potentially reflecting rising anthropogenic impacts due to human activities in the area. This also underscores the fact that the forest villages within DSNP contain approximately 1500 households, which remain dependent on forest produce for their daily needs [87]. The grassland, shrubland, and degraded forest exhibited statistically significant changes across the three study years, confirming the magnitude and consistency of grassland decline. In contrast, land cover types such as semi-evergreen forest, cropland, and bareland did not show statistically significant changes, possibly due to their relatively stable spatial distribution or limitations in the scale of analysis. Nevertheless, despite the lack of statistical significance, these categories still exhibited notable changes in their entire extent over the study period.
Overall, the findings highlight a concerning trajectory of increasing habitat degradation and declining ecological integrity in DSNP, despite its designation as a protected area. This underscores the urgent need for site-specific interventions aimed at enhancing the ecological management of the park (Table 5). A comprehensive vegetation assessment is strongly recommended to evaluate the condition and quality of various land cover types within the reserve. In particular, there is a pressing need to survey the extent and density of invasive plant species, especially within grassland patches and adjacent habitats, to inform targeted management strategies. The grasslands in this floodplain landscape have declined significantly over the years, not only due to riverine dynamics but also as a result of invasive species encroachment [58,88]. Numerous studies in the region have shown that invasive plants can completely displace native grasses, thereby threatening grassland-obligate species [58,59]. Despite these known threats, no systematic invasive species survey has yet been conducted in DSNP, making this a critical research and management priority. Hence, to support long-term conservation and restoration of grasslands, the initiation of a dedicated Grassland Recovery Project is recommended. A specialized management team should be formed, guided by a well-defined action plan. The restoration strategies should include the removal of invasive species, replanting with native grass species, and the use of controlled burning techniques to halt undesirable ecological succession, as successfully implemented in other Indian grassland ecosystems. The grassland recovery interventions can be initiated in sites such as Sobha Nala, Raidang, Dighaltarang, School Gora, Kolomi, and Pomua, where remnant patches of grassland still persist. Additionally, degraded forest and shrubland patches should be assessed and prioritized as potential sites for grassland restoration and halting illegal logging and tree felling. It is recommended to enhance surveillance and monitoring at key locations such as Kolomi Nala, Sobha Nala, Hamukjan, Saikhowa, and Doijan, which serve as major ingress and egress points of the park. This strengthening of surveillance in these areas is crucial to curb illegal activities and ensure effective enforcement. Addressing this requires strengthening the presence of forest personnel with proper training, logistical support, and access to essential equipment, including mechanized boats, given the riverine geography of the park and the lack of road access. Moreover, it is also necessary to increase surveillance along park boundaries, as well as at key entry and exit points. Community-based conservation should be prioritized through active engagement with Joint Forest Management Committees (JFMCs), Biodiversity Management Committees (BMCs), and Eco-Development Committees (EDCs). These groups should be equipped with awareness training and involved as critical stakeholders in the protection and monitoring of the park. Furthermore, the government should expedite the relocation of forest villages within DSNP, as continued human settlement contributes to significant anthropogenic pressures, including livestock grazing, illegal timber extraction, and unregulated fishing. Notably, providing training to the residents of these forest villages and involving them in conservation efforts as additional workforce/support staff of the forest department would serve as an effective measure for protecting the park. The residents of forest villages and fringe areas would benefit from training in ecotourism-related activities, such as bird guiding, nature guiding, etc. These alternative livelihood options could help reduce their direct dependence on forest resources and support broader conservation initiatives. Furthermore, effective management strategies are urgently needed to mitigate the impacts of the dynamic behavior of the Brahmaputra River, particularly to control erosion and prevent further loss of land area in this riverine national park. Hence, long-term, landscape-level monitoring combined with adaptive management approaches will be crucial for halting ecological degradation and preserving the biodiversity and ecosystem services of DSNP.

5. Conclusions

This study highlights the substantial and dynamic LULC changes that have occurred in DSNP over the past two decades since its designation as a national park. The research documents a significant decline in native grasslands, which historically represented the dominant habitat type within the area. Concurrently, there has been a notable increase in shrubland and degraded forest cover, largely driven by a combination of natural processes such as flooding and anthropogenic issues. These shifts are particularly concerning because this area supports many threatened grassland-obligate and endemic species. The findings underscore the limitations of passive conservation measures and emphasize the urgent need for active, site-specific management interventions. The study recommends the initiation of a targeted Grassland Recovery Project, systematic control of invasive species, enhanced surveillance and enforcement, increased logistical support and staffing for forest personnel, and the relocation of forest villages to mitigate human-induced pressures. Furthermore, the empowerment of local communities through participatory conservation mechanisms such as JFMCs, BMCs, and EDCs is necessary. Ultimately, the outcomes of this research not only fill a crucial gap in the LULC literature for South and Southeast Asia but also build a vital foundation for adaptive management planning of DSNP in this unique floodplain ecosystem.

6. Limitations

This study has several limitations inherent to LULC change detection using satellite imagery. Since each pixel represents a single land cover class, microhabitat features and fine-scale habitat heterogeneity are not efficiently captured, potentially overlooking small-scale ecological variations. Additionally, subtle landscape alterations and fine-scale diversity may not be fully resolved due to the spatial resolution constraints of the satellite images. Moreover, the classification accuracy is also dependent on the quality of training data and image preprocessing; thus, misclassification errors may slightly influence the quantification of certain LULC categories. Furthermore, while satellite imagery effectively detects land cover changes, it may not capture minute anthropogenic drivers directly, which may have an influence on landscape dynamics and require complementary ground-based assessments for comprehensive understanding.

Supplementary Materials

The following supporting information can be downloaded at https://www.mdpi.com/article/10.3390/earth6030078/s1. Figure S1. Land use/land cover change detection map from the year 2000 to 2013. Figure S2. Land use/land cover change detection map from the year 2013 to 2024. Table S1. Description and classification categories of each land use/land cover (LULC) type within the DSNP for the three study years. Table S2. The accuracy assessment of land cover classification for the year 2024.

Author Contributions

Conceptualization, I.A. and H.S.; methodology, I.A., T.M., and S.B.; software, I.A. and T.M.; validation, S.K., S.B., and P.K.N.; formal analysis, I.A., S.K., and P.K.N.; investigation, T.M., S.K., and S.B.; resources, I.A., J.A., and H.S.; data curation, I.A., T.M., P.K.N., and J.A.; writing—original draft preparation, I.A., S.K., and H.S.; writing—review and editing, T.M., S.K., and J.A.; visualization, S.K., S.B., J.A., and H.S.; supervision, H.S. All authors have read and agreed to the published version of the manuscript.

Funding

This study received no external funding.

Data Availability Statement

The data supporting the findings of this study are available within the manuscript. Additional details or clarifications can be obtained from the first author or the corresponding author upon reasonable request.

Acknowledgments

The authors acknowledge the Chief Wildlife Warden, Department of Environment, Forest and Climate Change, Government of Assam, for granting permission to carry out the fieldwork (Permission No. WL/FG.31/RS/38th T.C./2025-Pt, dated 11 April 2025). The authors are thankful to Dipul Duarah and Sourav Boruah for their assistance in fieldwork. The authors also thank the forest personnel of the Tinsukia Wildlife Division for their valuable support during the field study. Further, the authors are grateful to the Head of the Department of Zoology, Bodoland University, for providing scientific support. This study forms a part of the Ph.D. research of the first author (I.A.).

Conflicts of Interest

The authors declare no conflicts of interest.

References

  1. Chen, H.; Chen, C.; Zhang, Z.; Lu, C.; Wang, L.; He, X.; Chu, Y.; Chen, J. Changes of the Spatial and Temporal Characteristics of Land-Use Landscape Patterns Using Multi-Temporal Landsat Satellite Data: A Case Study of Zhoushan Island, China. Ocean Coast. Manag. 2021, 213, 105842. [Google Scholar] [CrossRef]
  2. Ewunetu, A.; Simane, B.; Teferi, E. Mapping and Quantifying Comprehensive Land Degradation Status Using Spatial Multicriteria Evaluation Technique in the Headwaters Area of Upper Blue Nile River. Sustainability 2021, 13, 2244. [Google Scholar] [CrossRef]
  3. Arneth, A.; Denton, F.; Agus, F.; Elbehri, A.; Erb, K.; Elasha, B.O.; Rahimi, M.; Rounsevell, M.; Spence, A.; Valentini, R.; et al. Framing and Context. In Climate Change and Land: An IPCC Special Report on Climate Change, Desertification, Land Degradation, Sustainable Land Management, Food Security, and Greenhouse Gas Fluxes in Terrestrial Ecosystems; Shukla, P.R., Skea, J., Buendia, E.C., Masson-Delmotte, V., Pörtner, H.-O., Roberts, D.C., Zhai, P., Slade, R., Connors, S., van Diemen, R., et al., Eds.; IPCC: Geneva, Switzerland, 2019; Chapter 1. [Google Scholar]
  4. Luyssaert, S.; Jammet, M.; Pongratz, J.; Cescatti, A.; Bastos, A.; Scholze, M. Land Management and Land-Cover Change Have Impacts of Similar Magnitude on Surface Temperature. Nat. Clim. Change 2014, 4, 389–393. [Google Scholar] [CrossRef]
  5. Arneth, A.; Brown, C.; Rounsevell, M.D.A. Global Models of Human Decision-Making for Land-Based Mitigation and Adaptation Assessment. Nat. Clim. Change 2014, 4, 550–557. [Google Scholar] [CrossRef]
  6. Lambin, E.F.; Meyfroidt, P. Global Land Use Change, Economic Globalization, and the Looming Land Scarcity. Proc. Natl. Acad. Sci. USA 2011, 108, 3465–3472. [Google Scholar] [CrossRef]
  7. Le Quéré, C.; Andres, R.J.; Boden, T.; Conway, T.; Houghton, R.A.; House, J.I.; Marland, G.; Peters, G.P.; van der Werf, G.R.; Ahlström, A. The Global Carbon Budget 1959–2011. Earth Syst. Sci. Data 2013, 5, 165–185. [Google Scholar] [CrossRef]
  8. Popp, A.; Humpenöder, F.; Weindl, I.; Bodirsky, B.L.; Bonsch, M.; Lotze-Campen, H.; Müller, C.; Biewald, A.; Rolinski, S.; Stevanovic, M.; et al. Land-Use Protection for Climate Change Mitigation. Nat. Clim. Change 2014, 4, 1095–1098. [Google Scholar] [CrossRef]
  9. Powers, R.P.; Jetz, W. Global Habitat Loss and Extinction Risk of Terrestrial Vertebrates under Future Land-Use-Change Scenarios. Nat. Clim. Change 2019, 9, 323–329. [Google Scholar] [CrossRef]
  10. Hertog, S.; Gerland, P.; Wilmoth, J. India Overtakes China as the World’s Most Populous Country; Department of Economic and Social Affairs, United Nations: New York, NY, USA, 2023; Policy Brief No. 153. [Google Scholar]
  11. Sodhi, N.S.; Posa, M.R.C.; Lee, T.M.; David, B.; Koh, L.P.; Brook, B.W. The State and Conservation of Southeast Asian Biodiversity. Biodivers. Conserv. 2010, 19, 317–328. [Google Scholar] [CrossRef]
  12. Chowdhury, M.; Hasan, M.E.; Abdullah-Al-Mamun, M.M. Land Use/Land Cover Change Assessment of Halda Watershed Using Remote Sensing and GIS. Egypt. J. Remote Sens. Space Sci. 2020, 23, 63–75. [Google Scholar] [CrossRef]
  13. Gaigbe-Togbe, V.; Bassarsky, L.; Gu, D.; Spoorenberg, T.; Zeifman, L. World Population Prospects; Department of Economic and Social Affairs, Population Division: New York, NY, USA, 2022. [Google Scholar]
  14. Jat, M.K.; Garg, P.K.; Khare, D. Monitoring and Modelling of Urban Sprawl Using Remote Sensing and GIS Techniques. Int. J. Appl. Earth Obs. Geoinf. 2008, 10, 26–43. [Google Scholar] [CrossRef]
  15. Mondal, I.; Thakur, S.; Ghosh, P.; De, T.K.; Bandyopadhyay, J. Land Use/Land Cover Modeling of Sagar Island, India Using Remote Sensing and GIS Techniques. In Emerging Technologies in Data Mining and Information Security: Proceedings of IEMIS 2018; Springer: Singapore, 2019; pp. 771–785. [Google Scholar]
  16. Mushtaq, F.; Pandey, A.C. Assessment of Land Use/Land Cover Dynamics vis-à-vis Hydrometeorological Variability in Wular Lake Environs, Kashmir Valley, India Using Multitemporal Satellite Data. Arab. J. Geosci. 2014, 7, 4707–4715. [Google Scholar] [CrossRef]
  17. IPBES. Global Assessment Report on Biodiversity and Ecosystem Services; Intergovernmental Science-Policy Platform on Biodiversity and Ecosystem Services: Bonn, Germany, 2019. [Google Scholar]
  18. Reid, A.J.; Carlson, A.K.; Creed, I.F.; Eliason, E.J.; Gell, P.A.; Johnson, P.T.J.; Kidd, K.A.; MacCormack, T.J.; Olden, J.D.; Ormerod, S.J.; et al. Emerging Threats and Persistent Conservation Challenges for Freshwater Biodiversity. Biol. Rev. 2019, 94, 849–873. [Google Scholar] [CrossRef] [PubMed]
  19. Chang, C.C.; Turner, B.L. Ecological Succession in a Changing World. J. Ecol. 2019, 107, 503–509. [Google Scholar] [CrossRef]
  20. Perring, M.P.; Standish, R.J.; Hobbs, R.J. Incorporating Novelty and Novel Ecosystems into Restoration Planning and Practice in the 21st Century. Ecol. Process. 2013, 2, 18. [Google Scholar] [CrossRef]
  21. Arefin, R.; Meshram, S.G.; Seker, D.Z. River Channel Migration and Land-Use/Land-Cover Change for Padma River at Bangladesh: A RS- and GIS-Based Approach. Int. J. Environ. Sci. Technol. 2021, 18, 3109–3126. [Google Scholar] [CrossRef]
  22. Naha, S.; Rico-Ramirez, M.A.; Rosolem, R. Quantifying the Impacts of Land Cover Change on Hydrological Responses in the Mahanadi River Basin in India. Hydrol. Earth Syst. Sci. 2021, 25, 6339–6357. [Google Scholar] [CrossRef]
  23. Betts, M.G.; Wolf, C.; Pfeifer, M.; Banks-Leite, C.; Arroyo-Rodríguez, V.; Ribeiro, D.B.; Barlow, J.; Eigenbrod, F.; Faria, D.; Fletcher, R.J., Jr.; et al. Extinction Filters Mediate the Global Effects of Habitat Fragmentation on Animals. Science 2019, 366, 1236–1239. [Google Scholar] [CrossRef]
  24. Jiguet, F.; Gadot, A.-S.; Julliard, R.; Newson, S.E.; Couvet, D. Climate Envelope, Life History Traits and the Resilience of Birds Facing Global Change. Glob. Change Biol. 2007, 13, 1672–1684. [Google Scholar] [CrossRef]
  25. Kumar, M.; Arup, D.; Richa, S.; Supratik, S. Change Detection Analysis Using Multi-Temporal Satellite Data of Poba Reserve Forest, Assam and Arunachal Pradesh. Int. J. Geomat. Geosci. 2014, 4, 517–527. [Google Scholar]
  26. Rawat, J.S.; Biswas, V.; Kumar, M. Changes in Land Use/Cover Using Geospatial Techniques: A Case Study of Ramnagar Town Area, District Nainital, Uttarakhand, India. Egypt. J. Remote Sens. Space Sci. 2013, 16, 111–117. [Google Scholar] [CrossRef]
  27. Adeel, M. Methodology for Identifying Urban Growth Potential Using Land Use and Population Data: A Case Study of Islamabad Zone IV. Procedia Environ. Sci. 2010, 2, 32–41. [Google Scholar] [CrossRef]
  28. Ayele, G.T.; Demessie, S.S.; Mengistu, K.T.; Tilahun, S.A.; Melesse, A.M. Multitemporal Land Use/Land Cover Change Detection for the Batena Watershed, Rift Valley Lakes Basin, Ethiopia. In Landscape Dynamics, Soils and Hydrological Processes in Varied Climates; Springer: Cham, Switzerland, 2016; pp. 51–72. [Google Scholar]
  29. Hassan, Z.; Rabia, S.; Sheikh, A.; Amir, H.M.; Neelam, A.; Amna, B.; Summra, E. Dynamics of Land Use and Land Cover Change (LULCC) Using Geospatial Techniques: A Case Study of Islamabad, Pakistan. SpringerPlus 2016, 5, 812. [Google Scholar] [CrossRef]
  30. Weng, Q.A. A Remote Sensing-GIS Evaluation of Urban Expansion and Its Impacts on the Temperature in the Zhujiang Delta, China. Int. J. Remote Sens. 2001, 22, 1999–2014. [Google Scholar]
  31. Alemayehu, F.; Taha, N.; Nyssen, J.; Girma, A.; Zenebe, A.; Behailu, M.; Deckers, S.; Poesen, J. The Impacts of Watershed Management on Land Use and Land Cover Dynamics in Eastern Tigray (Ethiopia). Resour. Conserv. Recycl. 2009, 53, 192–198. [Google Scholar] [CrossRef]
  32. Cheruto, M.C.; Kauti, M.K.; Kisangau, P.D.; Kariuki, P. Assessment of Land Use and Land Cover Change Using GIS and Remote Sensing Techniques: A Case Study of Makueni County, Kenya. J. Remote Sens. GIS 2016, 5, 175. [Google Scholar] [CrossRef]
  33. Ginblett, R. Modelling Human-Landscape Interactions in Spatially Complex Settings: Where Are We and Where Are We Going? In Proceedings of the MODSIM05, Melbourne, Australia, 12–15 December 2005; pp. 11–20. [Google Scholar]
  34. Lambin, E.F.; Geist, H.J. Global Land-Use and Land-Cover Change: What Have We Learned So Far? Glob. Change Newsl. 2001, 46, 27–30. [Google Scholar]
  35. Liang, S.; Fang, H.; Morisette, J.T.; Chen, M.; Shuey, C.J.; Walthall, C.L.; Daughtry, C.S. Atmospheric Correction of Landsat ETM+ Land Surface Imagery. II. Validation and Applications. IEEE Trans. Geosci. Remote Sens. 2002, 40, 2736–2746. [Google Scholar] [CrossRef]
  36. Meshesha, T.W.; Tripathi, S.K.; Khare, D.M. Analyses of Land Use and Land Cover Change Dynamics Using GIS and Remote Sensing During 1984 and 2015 in the Beressa Watershed, Northern Central Highland of Ethiopia. Model. Earth Syst. Environ. 2016, 2, 1–12. [Google Scholar] [CrossRef]
  37. Woldeamlak, B. Land Cover Dynamics Since the 1950s in Chemoga Watershed, Blue Nile Basin, Ethiopia. Mt. Res. Dev. 2002, 22, 263–269. [Google Scholar]
  38. Tiwari, M.K.; Saxena, A. Change Detection of Land Use/Land Cover Pattern in and around Mandideep and Obedullaganj Area, Using Remote Sensing and GIS. Int. J. Technol. Eng. Syst. 2011, 2, 398–402. [Google Scholar]
  39. Bunyangha, J.; Majaliwa, M.J.G.; Muthumbi, A.W.; Gichuki, N.N.; Egeru, A. Past and Future Land Use/Land Cover Changes from Multi-Temporal Landsat Imagery in Mpologoma Catchment, Eastern Uganda. Egypt. J. Remote Sens. Space Sci. 2021, 24, 675–685. [Google Scholar] [CrossRef]
  40. Chamling, M.; Bera, B. Spatio-Temporal Patterns of Land Use/Land Cover Change in the Bhutan–Bengal Foothill Region between 1987 and 2019: Study towards Geospatial Applications and Policy Making. Earth Syst. Environ. 2020, 4, 117–130. [Google Scholar] [CrossRef]
  41. Kafy, A.A.; Naim, M.N.H.; Subramanyam, G.; Ahmed, N.U.; Al Rakib, A.; Kona, M.A.; Sattar, G.S. Cellular Automata Approach in Dynamic Modelling of Land Cover Changes Using RapidEye Images in Dhaka, Bangladesh. Environ. Chall. 2021, 5, 100278. [Google Scholar] [CrossRef]
  42. Mohamed, M.A.; Anders, J.; Schneider, C. Monitoring of Changes in Land Use/Land Cover in Syria from 2010 to 2018 Using Multitemporal Landsat Imagery and GIS. Land 2020, 9, 226. [Google Scholar] [CrossRef]
  43. Rafiq, M.; Mishra, A.K.; Meer, M.S. On Land-Use and Land-Cover Changes over Lidder Valley in Changing Environment. Ann. GIS 2018, 24, 275–285. [Google Scholar] [CrossRef]
  44. Talukdar, S.; Singha, P.; Mahato, S.; Shahfahad; Pal, S.; Liou, Y.-A.; Rahman, A. Land-Use Land-Cover Classification by Machine Learning Classifiers for Satellite Observations—A Review. Remote Sens. 2020, 12, 1135. [Google Scholar] [CrossRef]
  45. Halder, A.; Ghosh, A.; Ghosh, S. Supervised and unsupervised landuse map generation from remotely sensed images using ant-based systems. Appl. Soft Comput. 2011, 11, 5770–5781. [Google Scholar] [CrossRef]
  46. Yuh, Y.G.; Dongmo, Z.N.; N’Goran, P.K.; Ekodeck, H.; Mengamenya, A.; Kuehl, H.; Sop, T.; Tracz, W.; Agunbiade, M.; Elvis, T. Effects of Land Cover Change on Great Apes Distribution at the Lobéké National Park and Its Surrounding Forest Management Units, South-East Cameroon: A 13-Year Time Series Analysis. Sci. Rep. 2019, 9, 1445. [Google Scholar] [CrossRef]
  47. Lu, D.; Weng, Q. A Survey of Image Classification Methods and Techniques for Improving Classification Performance. Int. J. Remote Sens. 2007, 28, 823–870. [Google Scholar] [CrossRef]
  48. Szuster, B.W.; Chen, Q.; Borger, M. A Comparison of Classification Techniques to Support Land Cover and Land Use Analysis in Tropical Coastal Zones. Appl. Geogr. 2011, 31, 525–532. [Google Scholar] [CrossRef]
  49. Aplin, P.; Atkinson, P.M. Predicting Missing Field Boundaries to Increase Per-Field Classification Accuracy. Photogramm. Eng. Remote Sens. 2004, 70, 141–149. [Google Scholar] [CrossRef]
  50. Talukdar, S.; Uddin, K.; Akhter, S.; Ziaul, S.; Reza, A.; Islam, T.; Mallick, J. Modeling Fragmentation Probability of Land-Use and Land-Cover Using the Bagging, Random Forest and Random Subspace in the Teesta River. Ecol. Indic. 2021, 132, 108341. [Google Scholar] [CrossRef]
  51. Bhattacharya, R.K.; Das Chatterjee, N.; Das, K. Land Use and Land Cover Change and Its Resultant Erosion Susceptible Level: An Appraisal Using RUSLE and Logistic Regression in a Tropical Plateau Basin of West Bengal, India. Environ. Dev. Sustain. 2021, 23, 1411–1446. [Google Scholar] [CrossRef]
  52. Thakkar, A.K.; Desai, V.R.; Patel, A.; Potdar, M.B. Post-Classification Corrections in Improving the Classification of Land Use/Land Cover of Arid Region Using RS and GIS: The Case of Arjuni Watershed, Gujarat, India. Egypt. J. Remote Sens. Space Sci. 2017, 20, 79–89. [Google Scholar] [CrossRef]
  53. Nagendra, H.; Munroe, D.K.; Southworth, J. From Pattern to Process: Landscape Fragmentation and the Analysis of Land Use/Land Cover Change. Agric. Ecosyst. Environ. 2004, 101, 111–115. [Google Scholar] [CrossRef]
  54. Dwivedi, K.K. Incredible Dibru-Saikhowa National Park; Dibru Saikhowa Conservation Society: Assam, India, 2009. [Google Scholar]
  55. Myers, N.; Mittermeier, R.A.; Mittermeier, C.G.; da Fonseca, G.A.B.; Kent, J. Biodiversity hotspots for conservation priorities. Nature 2000, 403, 853–858. [Google Scholar] [CrossRef]
  56. Rahmani, A.R. Threatened Birds of India: Their Conservation Requirements; Bombay Natural History Society, Oxford University Press: Mumbai, India, 2012. [Google Scholar]
  57. Gogoi, P.; Sharma, N. Spatio-Temporal Study of Morpho-Dynamics of the Brahmaputra River along Its Majuli Island Reach. Environ. Chall. 2021, 5, 100217. [Google Scholar]
  58. Sharma, M.; Devi, A.; Badola, R.; Sharma, R.K.; Hussain, S.A. Impact of Management Practices on the Tropical Riverine Grasslands of Brahmaputra Floodplains: Implications for Conservation. Ecol. Indic. 2023, 151, 110265. [Google Scholar] [CrossRef]
  59. Sinha, A.; Nath, A.; Lahkar, B.P.; Brahma, N.; Sarma, H.K.; Swargowari, A. Understanding the Efficacy of Different Techniques to Manage Chromolaena odorata L., an Invasive Alien Plant in the Sub-Himalayan Tall Grasslands: Toward Grassland Recovery. Ecol. Eng. 2022, 179, 106618. [Google Scholar] [CrossRef]
  60. BirdLife International. Houbaropsis bengalensis. The IUCN Red List of Threatened Species 2018, e.T22692015A130184896. Available online: https://www.iucnredlist.org/species/22692015/130184896 (accessed on 27 June 2025).
  61. Timmins, R.; Duckworth, J.W.; Samba Kumar, N.; Anwarul Islam, M.; Sagar Baral, H.; Long, B.; Maxwell, A.; Axis porcinus. The IUCN Red List of Threatened Species 2015, e.T41784A22157664. Available online: https://www.iucnredlist.org/species/41784/22157664 (accessed on 27 June 2025).
  62. BirdLife International. Laticilla cinerascens (Amended Version of 2016 Assessment). The IUCN Red List of Threatened Species 2017, e.T22735351A111366336. Available online: https://www.iucnredlist.org/species/22735351/111366336 (accessed on 27 June 2025).
  63. Das, R.K. Diversity, Distribution and Density of Tropical Grassland Birds in Dibru-Saikhowa Biosphere Reserve, Assam. Ph.D. Thesis, Department of Geography, Gauhati University, Assam, India, 2011. [Google Scholar]
  64. Abebe, G.; Getachew, D.; Ewunetu, A. Analysing land use/land cover changes and its dynamics using remote sensing and GIS in Gubalafito district, Northeastern Ethiopia. SN Appl. Sci. 2022, 4, 30. [Google Scholar] [CrossRef]
  65. Mukherjee, T.; Sharma, L.K.; Thakur, M.; Saha, G.K.; Chandra, K. Changing landscape configuration demands ecological planning: Retrospect and prospect for megaherbivores of North Bengal. PLoS ONE 2019, 14, e0225398. [Google Scholar] [CrossRef] [PubMed]
  66. Demissie, F.; Yeshitila, K.; Kindu, M.; Schneider, T. Land Use/Land Cover Changes and Their Causes in Libokemkem District of South Gonder, Ethiopia. Remote Sens. Appl. Soc. Environ. 2017, 8, 224–230. [Google Scholar] [CrossRef]
  67. Ewunetu, A.; Simane, B.; Teferi, E.; Zaitchik, B.F. Land Cover Change in the Blue Nile River Headwaters: Farmers’ Perceptions, Pressures, and Satellite-Based Mapping. Land 2021, 10, 68. [Google Scholar] [CrossRef]
  68. Xie, H.; Huang, H. Classification of Land Cover Remote-Sensing Images Based on Pattern Recognition. Sci. Program. 2022, 2022, 8319692. [Google Scholar] [CrossRef]
  69. Olofsson, P.; Foody, G.M.; Stehman, S.V.; Woodcock, C.E. Making Better Use of Accuracy Data in Land Change Studies: Estimating Accuracy and Area and Quantifying Uncertainty Using Stratified Estimation. Remote Sens. Environ. 2013, 129, 122–131. [Google Scholar] [CrossRef]
  70. Ozdogan, M.; Woodcock, C.E. Resolution Dependent Errors in Remote Sensing of Cultivated Areas. Remote Sens. Environ. 2006, 103, 203–217. [Google Scholar] [CrossRef]
  71. Adhiambo, M.P.; Kironchi, G.; Mureithi, S.; Kathumo, V. Assessing Land Use and Land Cover Change Using Participatory Geographical Information System (PGIS) Approach in Nguruman Sub-Catchment, Kajiado North Subcounty, Kenya. J. Geogr. Reg. Plan. 2017, 10, 219–228. [Google Scholar]
  72. Gaur, S.; Singh, R. A Comprehensive Review on Land Use/Land Cover (LULC) Change Modeling for Urban Development: Current Status and Future Prospects. Sustainability 2023, 15, 903. [Google Scholar] [CrossRef]
  73. Afuye, G.A.; Nduku, L.; Kalumba, A.M.; Santos, C.A.G.; Orimoloye, I.R.; Ojeh, V.N.; Thamaga, K.H.; Sibandze, P. Global Trend Assessment of Land Use and Land Cover Changes: A Systematic Approach to Future Research Development and Planning. J. King Saud Univ. Sci. 2024, 36, 103262. [Google Scholar] [CrossRef]
  74. Buyadi, S.N.A.; Mohd, W.M.N.W.; Misni, A. Green Space’s Growth Impact on the Urban Microclimate. Procedia Soc. Behav. Sci. 2013, 105, 547–557. [Google Scholar] [CrossRef]
  75. Fedderke, J.W.; Goldschmidt, M. Does Massive Funding Support of Researchers Work? Evaluating the Impact of the South African Research Chair Funding Initiative. Res. Policy 2015, 44, 467–482. [Google Scholar] [CrossRef]
  76. BirdLife International. Site Factsheet: Dibru-Saikhowa Complex. Available online: https://datazone.birdlife.org/site/factsheet/dibru-saikhowa-complex (accessed on 5 June 2025).
  77. Bhatt, C.M.; Srinivasa Rao, G.; Begum, A.; Sree, P.M.; Shivaprasadsharma, S.; Prasanna, L.; Veerubhotla, B. Satellite Images for Extraction of Flood Disaster Footprints and Assessing the Disaster Impact: Brahmaputra Floods of June–July 2012, Assam, India. Curr. Sci. 2013, 104, 1692–1700. [Google Scholar]
  78. Bhuyan, N.; Sajjad, H.; Sharma, Y.; Sharma, A.; Ahmed, R. Assessing Socio-Economic Vulnerability to Riverbank Erosion in the Middle Brahmaputra Floodplains of Assam, India. Environ. Dev. 2024, 51, 101027. [Google Scholar] [CrossRef]
  79. Abedin, I.; Mukherjee, T.; Kang, H.E.; Yoon, T.H.; Kim, H.W.; Kundu, S. Unraveling the Unknown: Adaptive Spatial Planning to Enhance Climate Resilience for the Endangered Swamp Grass-Babbler (Laticilla cinerascens) with Habitat Connectivity and Complexity Approach. Heliyon 2024, 10, e30273. [Google Scholar] [CrossRef]
  80. Bora, S.S.; Sharma, K.K.; Borah, K.; Saud, R.K. Opportunities and Challenges of Forage Cultivation in Assam—A Review. Forage Res. 2020, 45, 251–257. [Google Scholar]
  81. Tamang, W.; Ghosh, A.; Sarkar, S.; Gurung, N.; Subba, S.; Sahu, S. Broom Grass: A Valuable Yet Overlooked Crop in Sikkim and Darjeeling Himalayas. Agri-India Today 2024, 4, 148–153. [Google Scholar]
  82. Das, D.; Kalita, J.; Rajbongshi, K.; Saikia, H. Assessing the Impact of Domestic Cattle Influx on Grassland Habitat Using Remote Sensing and Soil Physical Parameters: A Study in Manas National Park. Indian For. 2024, 150, 17. [Google Scholar]
  83. Lahiri, S.; Roy, A.; Fleischman, F. Grassland Conservation and Restoration in India: A Governance Crisis. Restor. Ecol. 2022, 31, e13858. [Google Scholar] [CrossRef]
  84. Birken, A.S.; Cooper, D.J. Processes of Tamarix Invasion and Floodplain Development along the Lower Green River, Utah. Ecol. Appl. 2006, 16, 1103–1120. [Google Scholar] [CrossRef]
  85. Flood and Erosion Management Agency of Assam. India: Climate Resilient Brahmaputra Integrated Flood and Riverbank Erosion Risk Management Project in Assam; Project No. 56283-001; Asian Development Bank: Manila, Philippines, 2025. [Google Scholar]
  86. Nath, S.K. Concern and Conservation Perspective in Laokhowa Wildlife Sanctuary of Nagaon District, Assam, India. Int. J. Innov. Res. Sci. Eng. Technol. 2013, 2, 6295. [Google Scholar]
  87. Nongmaithem, R.; Lodhi, M.S.; Samal, P.K.; Dhyani, P.P.; Sharma, S. Faunal Diversity and Threats of the Dibru-Saikhowa Biosphere Reserve: A Study from Assam, India. Int. J. Conserv. Sci. 2016, 7, 523–532. [Google Scholar]
  88. Saeed, U.; Das, R.; Ali, S.Z.; Mani, A.; Badola, R.; Hussain, S.A. Evolving Landscapes: Long-Term Land Use and Climate-Induced Changes in the Brahmaputra Floodplain, India. Front. Environ. Sci. 2025, 13, 1550450. [Google Scholar] [CrossRef]
Figure 1. Elevation map of Dibru-Saikhowa National Park, located in Assam, India. Base layer source: ESRI, Maxar, Earthstar Geographics, and the GIS User Community.
Earth 06 00078 g001
Figure 2. Representative photographs of the land use/land cover (LULC) categories used for satellite image classification. (A) Grassland; (B) degraded forest; (C) semi-evergreen forest; (D) shrubland; (E) cropland; (F) built-up area; (G) bareland/bare area; and (H) water areas. Photo: Imon Abedin.
Earth 06 00078 g002
Figure 3. Land use/land cover (LULC) map of DSNP for the year 2000, illustrating the spatial distribution of land cover categories.
Earth 06 00078 g003
Figure 4. Land use/land cover (LULC) map of DSNP for the year 2013, illustrating the spatial distribution of land cover categories.
Earth 06 00078 g004
Figure 5. Land use/land cover (LULC) map of DSNP for the year 2024, illustrating the spatial distribution of land cover categories.
Earth 06 00078 g005
Table 1. Dataset acquisition information for the satellite images for the respective years.
YearSatelliteSensorPath/RowDate of AcquisitionCloud Cover (%)
2024Landsat 8OLI/TIRS135/04124 December 20244.60
Landsat 8OLI/TIRS134/04124 December 20244.53
2013Landsat 8OLI/TIRS135/04126 December 201328.76
Landsat 8OLI/TIRS134/04126 December 20138.38
2000Landsat 5TM135/04122 December 20006.00
Landsat 5TM134/04122 December 20006.00
Table 2. Land cover changes in the study area from 2000 to 2024, showing the area (in km2) and corresponding proportion (%) for each land cover category.
Category2000 (in km2)Proportion in 2000 (in %)2013 (in km2)Proportion in 2013 (in %)2024 (in km2)Proportion in 2024 (in %)
Grasslands97.8828.7816.694.9035.2910.38
Degraded Forests50.1914.7675.5622.1880.5223.67
Semi-Evergreen Forest8725.5869.7820.4959.817.58
Shrubland8.272.4381.3123.8727.848.18
Cropland5.211.538.512.5013.614.00
Built-up15.64.597.192.114.721.39
Bareland42.3912.4647.2413.8765.2319.18
Water Areas33.549.8634.3310.0853.1315.62
Table 3. Land use and land cover (LULC) changes in DSNP across the years 2000, 2013, and 2024, showing area (in km2) and absolute changes (Δ) over two time intervals: 2000–2013 and 2013–2024.
Category200020132024Δ from 2000 to 2013Δ from 2013 to 2024
Grasslands97.8816.6935.29−81.1918.6
Degraded Forests50.1975.5680.5225.374.96
Semi-Evergreen Forest8769.7859.8−17.22−9.98
Shrubland8.2781.3127.8473.04−53.47
Cropland5.218.5113.613.35.1
Built-Up15.67.194.72−8.41−2.47
Bareland42.3947.2465.234.8517.99
Water Areas33.5434.3353.130.7918.8
Table 4. Transition matrix showing land cover changes between the study years in DSNP (values represent area in sq. km.).
Transition Matrix of Change Detection from 2000 to 2013
2013GrasslandDegraded ForestSemi-Evergreen ForestShrublandCroplandBuilt-UpBarelandWater Areas
2000
Grassland8.1529.565.2929.943.172.639.6310.78
Degraded Forest1.1616.9213.0010.872.020.250.931.57
Semi-Evergreen Forest0.5521.9951.4312.331.140.171.561.84
Shrubland1.011.290.202.900.360.160.601.38
Cropland0.240.800.072.730.400.110.270.32
Built-Up1.061.640.216.351.070.472.251.81
Bareland2.191.820.0010.500.152.1117.358.26
Water Areas1.931.380.015.690.031.0314.888.40
Transition Matrix of Change Detection from 2013 to 2024
2024GrasslandDegraded ForestSemi-Evergreen ForestShrublandCroplandBuilt-UpBarelandWater Areas
2013
Grassland4.972.400.583.601.250.453.663.19
Degraded Forest3.2437.7817.854.851.040.572.403.58
Semi-Evergreen Forest1.7727.4838.580.050.160.020.071.08
Shrubland17.6711.462.8811.918.372.1915.2015.11
Cropland0.570.090.002.851.420.300.931.18
Built-Up0.990.450.022.330.240.301.680.92
Bareland3.740.120.001.740.770.4724.2415.41
Water Areas2.781.020.030.540.300.2416.9112.57
Table 5. Strengths, Weaknesses, Opportunities, and Threats (SWOT) analysis of Dibru-Saikhowa National Park based on field studies, consultations and earlier reports.
StrengthsWeaknesses
-Designated as both a national park and a biosphere reserve.
-High biodiversity, including several threatened and endemic species.
-Presence of community-based governance structures and local conservation groups
-Limited enforcement capacity and inadequate staff presence for monitoring.
-Insufficient logistical support, equipment, and surveillance infrastructure.
-Limited scientific research and ecological monitoring.
OpportunitiesThreats
-Targeted habitat restoration and invasive species management
-Improving collaboration between local communities and the forest department through training, awareness, and trust-building initiatives
-Development of ecotourism and sustainable livelihood opportunities
-Delayed rehabilitation of forest villages outside of the national park.
-Continued erosion and siltation due to the dynamic riverine processes of Brahmaputra and its tributaries.
-Logging and unregulated fishing within and around its boundary.
Disclaimer/Publisher’s Note: The statements, opinions and data contained in all publications are solely those of the individual author(s) and contributor(s) and not of MDPI and/or the editor(s). MDPI and/or the editor(s) disclaim responsibility for any injury to people or property resulting from any ideas, methods, instructions or products referred to in the content.

