Abstract
In recent decades, the River Ganges in India has been heavily contaminated with domestic waste and industrial toxins because of cultural activities, a lack of community awareness, an absence of sewage disposal facilities, and rapid population growth. Previous studies have focused separately on either the physical or social factors associated with River Ganges pollution but have not combined these elements in a single study. To fill this research gap, our study assesses the bio-physical and social vulnerability of the River Ganges by using a holistic approach. The following four sampling stations were selected: Rishikesh, Haridwar, Kanpur, and Varanasi. These locations were chosen to test the water quality in bio-physical aspects and to assess the social perceptions of river vulnerability among the residents and visitors. Perceptions of river water quality and likely sources of pollution were gathered via the distribution of over 1000 questionnaires. Data collection took place in the winter and summer of 2022 and 2023. The results showed that river water quality is not suitable for drinking purposes at any of the four cities without conventional treatment, and that the river is unsuitable for bathing at all locations, except upstream of Rishikesh. Nearly 50% of those questioned agreed that the river is polluted, whilst 74% agreed that pollution has increased in recent decades, particularly in the last 10 years. These compelling results are critical for policymakers and decision makers. They highlight the urgent need for novel strategies that address Ganges pollution while fostering community health education and environmental management. By dispelling myths surrounding river quality, this study strengthens the ongoing efforts to restore the Ganges, ensuring that it remains a vital lifeline for present and future generations.
1. Introduction
River pollution is severe in many emerging economies when compared with that of industrialized economies [1]. Rivers play an important role in the development of any society to meet agricultural, domestic, marine, manufacturing, and hydro-electric needs [2]. The rapid development of urbanized areas in emerging economies, combined with a lack of sufficient sanitation, causes overwhelming river pollution that severely damages riverine and riparian health [3]. Rivers and their channels are exploited for industrial and domestic uses. The discharge of untreated wastewater into rivers and river channels leads to a range of pollutants that impact water quality, the composition of the soil, groundwater, ecosystems, and human communities [4,5,6,7,8,9]. Diverse anthropogenic stresses are the notable factors for rising pollution in rivers [10,11,12]. The deterioration of river water quality has become an important issue across the globe, particularly in developing countries [13,14,15]. More than 80% of sewage originating from anthropogenic activities is released into rivers and oceans without treatment, contributing significantly to water and environmental pollution [16]. The pollutants that have been discovered in water are heavy and toxic metals, thermal and radioactive substances, suspended solids, microbes, etc. [17,18,19]. From these, toxic metals generate severe problems because they travel through and accumulate within the food chain, impacting on human health.
The River Ganges is trans-boundary and the world’s most sacred river on the Indian sub-continent, originating in the northern Indian state of Uttarakhand and covering 26.3% of India’s geographical area [20]. With a total length of more than 2500 km, 60% of water discharge is from the river itself, with 40% from tributaries [21]. The River Ganges Basin area is the one of the most heavily inhabited zones in the world. In addition to supplying water for drinking, agriculture, animal husbandry, and fisheries [22], the river is a site for religious activities and events, laundry, the watering of animals, the disposal of human corpses and cremation, and large cultural gatherings [23]. Approximately 1.3 billion liters of sewage (>70% of all pollution), >250 million liters of industrial waste, 6 million tons of fertilizers, 9000 tons of pesticides, and huge amounts of solid waste are released into the river on a daily basis [24]. It is estimated that 32,000 human corpses are incinerated every year, with up to 300 tons of half-burnt human flesh released into the River Ganges water [25]. The quality of the river water has also been degraded in recent decades owing to the development of a large number and variety of new industrial plants and the redevelopment of infrastructure along the banks of the river [26,27]. Acids and alkalis, anions and cations, metals, nutrients, toxic organic wastes, pesticides, domestic sewage containing fecal matter, detergents, bacteria, and a number of other related substances affect the river and freshwater environment and make the water unsuitable to drink, significantly increasing ecological risks [28,29,30].
There are very few studies that consider the impact of or how the poor water quality of the River Ganges is perceived by adjacent communities. According to De (2018) [31], most of the public agreed that the River Ganges is polluted due to heavy human activities and rapid infrastructure development, particularly in the Dakhineswar region. Basu Roy (2017) [32] revealed that the quality of the Ganges River remained the same even after implementing the Ganga Action Plan (GAP). The river water is still unsuitable for bathing and other beneficial uses, such as drinking, cooking, washing, etc., mainly due to visually dirty surroundings and the unacceptable bacteriological quality of the water [33]. Mathur (2020) [34] discusses the Namami Gange project, a conservation mission launched by the Indian government in 2014 to revitalize the Ganges River and reduce pollution. The author concludes that the program is failing to achieve the desired outcomes, the government’s promises remain unfulfilled, and that future goals remain unclear [35]. In this study, 40% of international and 44% of national tourists perceive the river to be dirty in the Varanasi region [36]. Riverine vulnerability comprises several aspects, such as physical, social, socio-economic, and combined aspects. Here, physical riverine vulnerability defines the identification of the intensity of risk and water quality status from various hazards, including pollution [37]. Social riverine vulnerability refers to the susceptibility of populations living in or near river environments to adverse impacts from hydrological hazards such as flooding, erosion, or riverbank collapse, as well as anthropogenic factors [38]. Social vulnerability significantly influences community perceptions of river water quality, shaping their awareness of its impacts and the urgent need for collective action [39,40].
Considerable literature exists [41,42,43,44,45,46,47,48,49,50,51] from around the world on riverine vulnerability, some of which focuses on River Ganges vulnerability [26,31,36,52,53,54,55,56]. While only a few studies adopt a transdisciplinary approach, it is imperative for communities and policymakers to stay up to date on riverine vulnerability. This knowledge is essential for effectively tackling water quality issues and mitigating the negative consequences faced by populations that depend on the river for their livelihoods, health, and overall well-being.
Moreover, there is a significant research gap regarding the vulnerability of the Ganges River, one of India’s most critical waterways, which sustains millions of lives and ecosystems. To date, no comprehensive studies have evaluated the combined bio-physical and social vulnerabilities of the Ganges River in the crucial case study areas of Rishikesh, Hardwar, Kanpur, and Varanasi. This oversight severely hinders the understanding of how environmental challenges, such as pollution and climate change, impact local communities in terms of socio-economic status, health, and cultural practices. It is essential to address this gap in order to develop robust strategies for managing and conserving the river while protecting the interests of those who rely on it. Accordingly, this study rigorously assesses the vulnerability of the River Ganges by thoroughly investigating both its bio-physical and social dimensions through comprehensive laboratory tests and in-depth surveys. To the best of our knowledge, this study is one of the first to comprehensively assess water quality in terms of physical riverine vulnerability using diverse bio-physical parameters (BOD, COD, and bacteriological), as well as social perceptions through a survey with a sample size of over 1000 participants. This study is distinctive due to its robust assessment of a wide range of elements and characteristics. By effectively integrating multiple dimensions, it delivers critical insights and makes a significant and original contribution to the existing literature. The novel insights of this study will support impactful policy making that provides decision makers with the agency to improve the water quality and community awareness about Ganges pollution in the selected case study areas.
2. Material and Methods
2.1. Study Areas
The following four significant Indian locations were strategically selected for this assessment: Rishikesh and Haridwar in Uttarakhand State, along with Kanpur and Varanasi in Uttar Pradesh State (refer to Figure 1). A comprehensive literature review has highlighted these areas as some of the most profoundly devotional and sacred places in India. They are also internationally recognized sites, with the notable exception of Kanpur, which struggles with pollution. The selection criteria not only emphasize the rich cultural and spiritual heritage of these locales, but also consider their population sizes and the willingness of local communities to engage actively in the study. These sites together create a rich and interconnected framework for examining the critical interplay between environmental degradation, socio-cultural practices, and community perspectives on the Ganga River. Accordingly, water quality monitoring was carried out in these areas to assess physical vulnerability, and surveys were conducted to assess participants’ perception of the severity of pollution and its sources as a part of social riverine vulnerability.
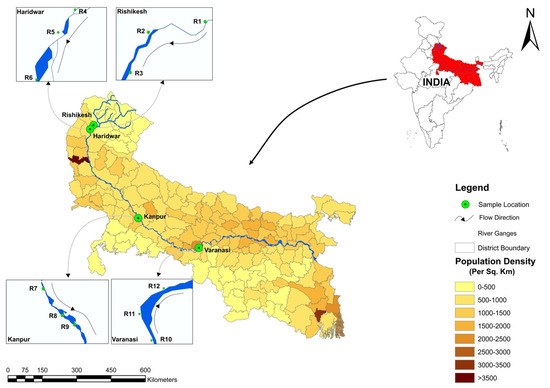
Figure 1.
Map of study areas. Source: The map was created by the authors using Census Data from 2011 [57,58] and GeoMedia Professional GIS Software version 6.1.
Rishikesh is a holy place that is in the state of Uttarakhand, northwest India. It is densely surrounded by the Himalayan Mountains on three sides and has the holy River Ganges flowing through it. There are towns and settlements on both sides of the river. For more than a century, Rishikesh has been a pilgrimage destination central to Hinduism. Rishikesh has a population of approximately 8000 [59], with several thousand pilgrims and tourists visiting the city each month. Haridwar is situated on the bank of the Ganges River, and it has a population of approximately 1.8 million [60]. It is a prominent site of pilgrimage for Hindus and is well known for its temples and ghats, where devotees bathe to atone for their sins and seek salvation. Kanpur is an industrial city, has >4 million residents [61], and is well known for its Ganges ghats. Kanpur is situated in the central Ganges Basin, on the southern rim of the core Ganges Basin. The city is well known for its industries, which are having a negative impact on Ganges pollution levels. Many small-scale businesses in Kanpur City, including those producing leather, textiles, detergents, etc., release their untreated or minimally treated waste into the Ganges River. As a result, Kanpur is responsible for 20% of the Ganges’ overall water pollution [62]. Varanasi is in the southeastern Uttar Pradesh State of northern India [63] and is positioned in the middle of the Ganges valley [64] with an area of 1535 per km2 and a population of approximately 1.7 million [65]. Varanasi, one of the oldest cities in the world [66], is recognized for its asceticism, tourism, and historical significance as a learning center, and takes around half of the water used for domestic consumption from the Ganges. According to the World Health Organization (WHO), Varanasi is the third most polluted city in the world [67]. Varanasi derives its name from the names of two rivers, Varuna and Assi [68]. In India, Varanasi is famous for its river shoreline, which offers miles of ghats, religious bathing, and aarti. More than one million pilgrims and foreign visitors travel to Varanasi every year to take a sacred bath in the Ganges River and visit temples, mosques, and universities [69,70].
2.2. Methodology
This study assessed the vulnerability of the Ganges River using a comprehensive approach. It assessed river pollution from both a bio-physical perspective (focusing on water quality by using diverse parameters) and a social perspective (considering a public perception survey). This combined analysis thoroughly investigates the issue of river pollution from various angles, providing integrated results that highlight key aspects, as outlined below.
2.2.1. Bio-Physical Vulnerability Assessment
The water samples were collected from 12 stations from the four study areas in two seasons, i.e., winter and summer of 2023. Water samples were collected in BOD bottles and plastic jerry cans and brought to the laboratory with necessary precautions. All samples were labeled properly in pre-washed plastic bottles to avoid confusion and contamination during analysis. A total of 12 sampling stations, 3 from each of the four cities, as upstream (U/S), midstream (M/S), and downstream (D/S), have been selected for collecting the water samples. Details are given in Table 1.

Table 1.
Study areas with sampling stations.
The CPCB (Central Pollution Control Board) India, guidelines have been followed when selecting the parameters for surface water quality monitoring [71] (Table 2) to evaluate river vulnerability. The water samples were transferred to PSI’s (People’s Science Institute) laboratory, India, for the physico-chemical and biological tests. Consequently, biological oxygen demand (BOD); chemical oxygen demand (COD); total hardness (TD); other elements, including chloride, fluoride, nitrogen, and sodium; and bacteriological parameters like Total coliform and fecal coliform contents were analyzed. Dissolved oxygen was analyzed by the Azide modification method; alkalinity by the acid titration method; total hardness and calcium by the EDTA titration method; chloride by the Argentometric titration method; and the PDA method was used for nitrate. For the biological parameters, like total coliform and fecal coliform, the APHA AWWA WEF-2012 standard method was used. The observed results were compared with the prescribed standard by the Central Pollution Control Board of India (CPCB, 1979) 50-51 and the Bureau of Indian Standard [72].
Table 2.
Elements of physical, chemical, and biological Tests.
2.2.2. Social Vulnerability Assessment
Public Perception Survey
To assess public perception regarding the perceived importance and extent of the pollution of the River Ganges, surveys were conducted in the four selected case study areas, between November and December 2022. The selected participant groups were invited to complete the survey in the four case study areas. In the survey, a total of 1079 participants took part, representing different age groups (19 to >65), all genders (M-871, F-207, TG-1), and various occupations, such as police officers, hotel owners, sweepers, spiritual leaders (pandit), and students. Out of the total number of participants, 804 were locals and 275 were tourists. We define “tourists” as those participants who came for a holy bath to fulfill their rituals, especially in Haridwar, Varanasi, and Kanpur. Rishikesh is a popular tourist destination for spiritual fulfilment and adventure activities. The survey questions were rigorously validated through comprehensive internal and external expert reviews, thorough pilot testing, and reliability analysis. To maintain the highest standards of data integrity, we implemented stringent quality control measures, including diligent response checks and the removal of any incomplete or inconsistent submissions. The questions asked related to the perceived sources of pollution, perceived water quality during the past decades, perceived pollution impact on human health, and the best prevention methods. Demographic data were also collected to allow the stratification of the results, as per the case study areas. Informed consent was obtained from all participants. All data collection and methods were conducted in accordance with the University of Central Lancashire (UCLan) ethics guidelines and regulations. Both qualitative and quantitative data were analyzed using MS Excel for statistical analysis and content analysis.
2.2.3. The Study Limitations
The current study assessed four case study areas but was unable to extend to more areas due to time limitation and financial constraints. Some groups did not actively participate in the survey due to various pressures, such as cultural and regional differences. Also, some local communities do not use water from the River Ganges for their needs, and, therefore, were not involved in this study. This study did not take into consideration the percentage of yearly effluents released into the river due to the unavailability of data. Due to the limited available data, the current study did not have a chance to analyze the time series data on pollution.
3. Results
3.1. Bio-Physical Vulnerability Assessment—Transparency and Total Dissolved Solids
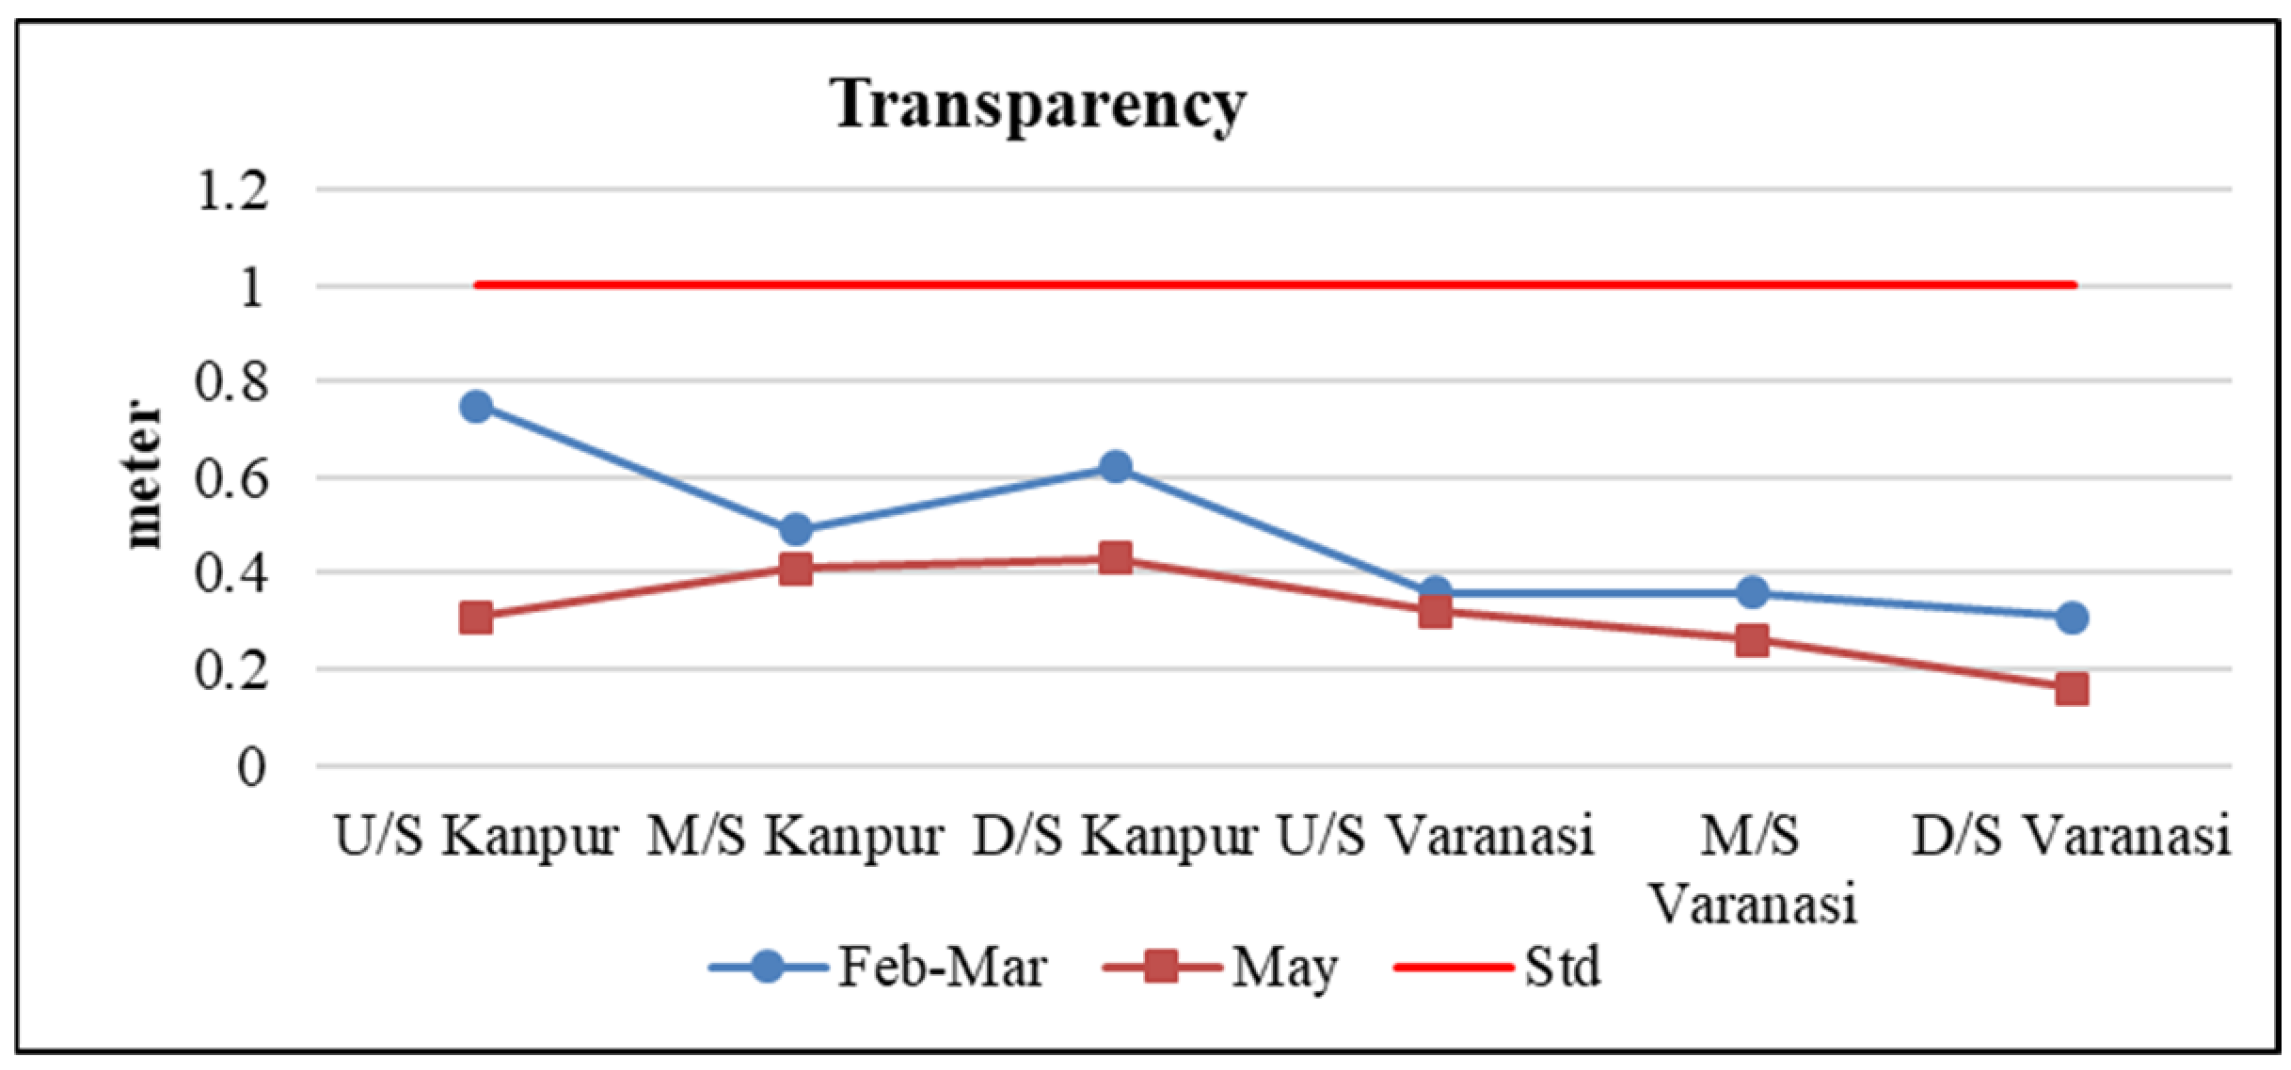
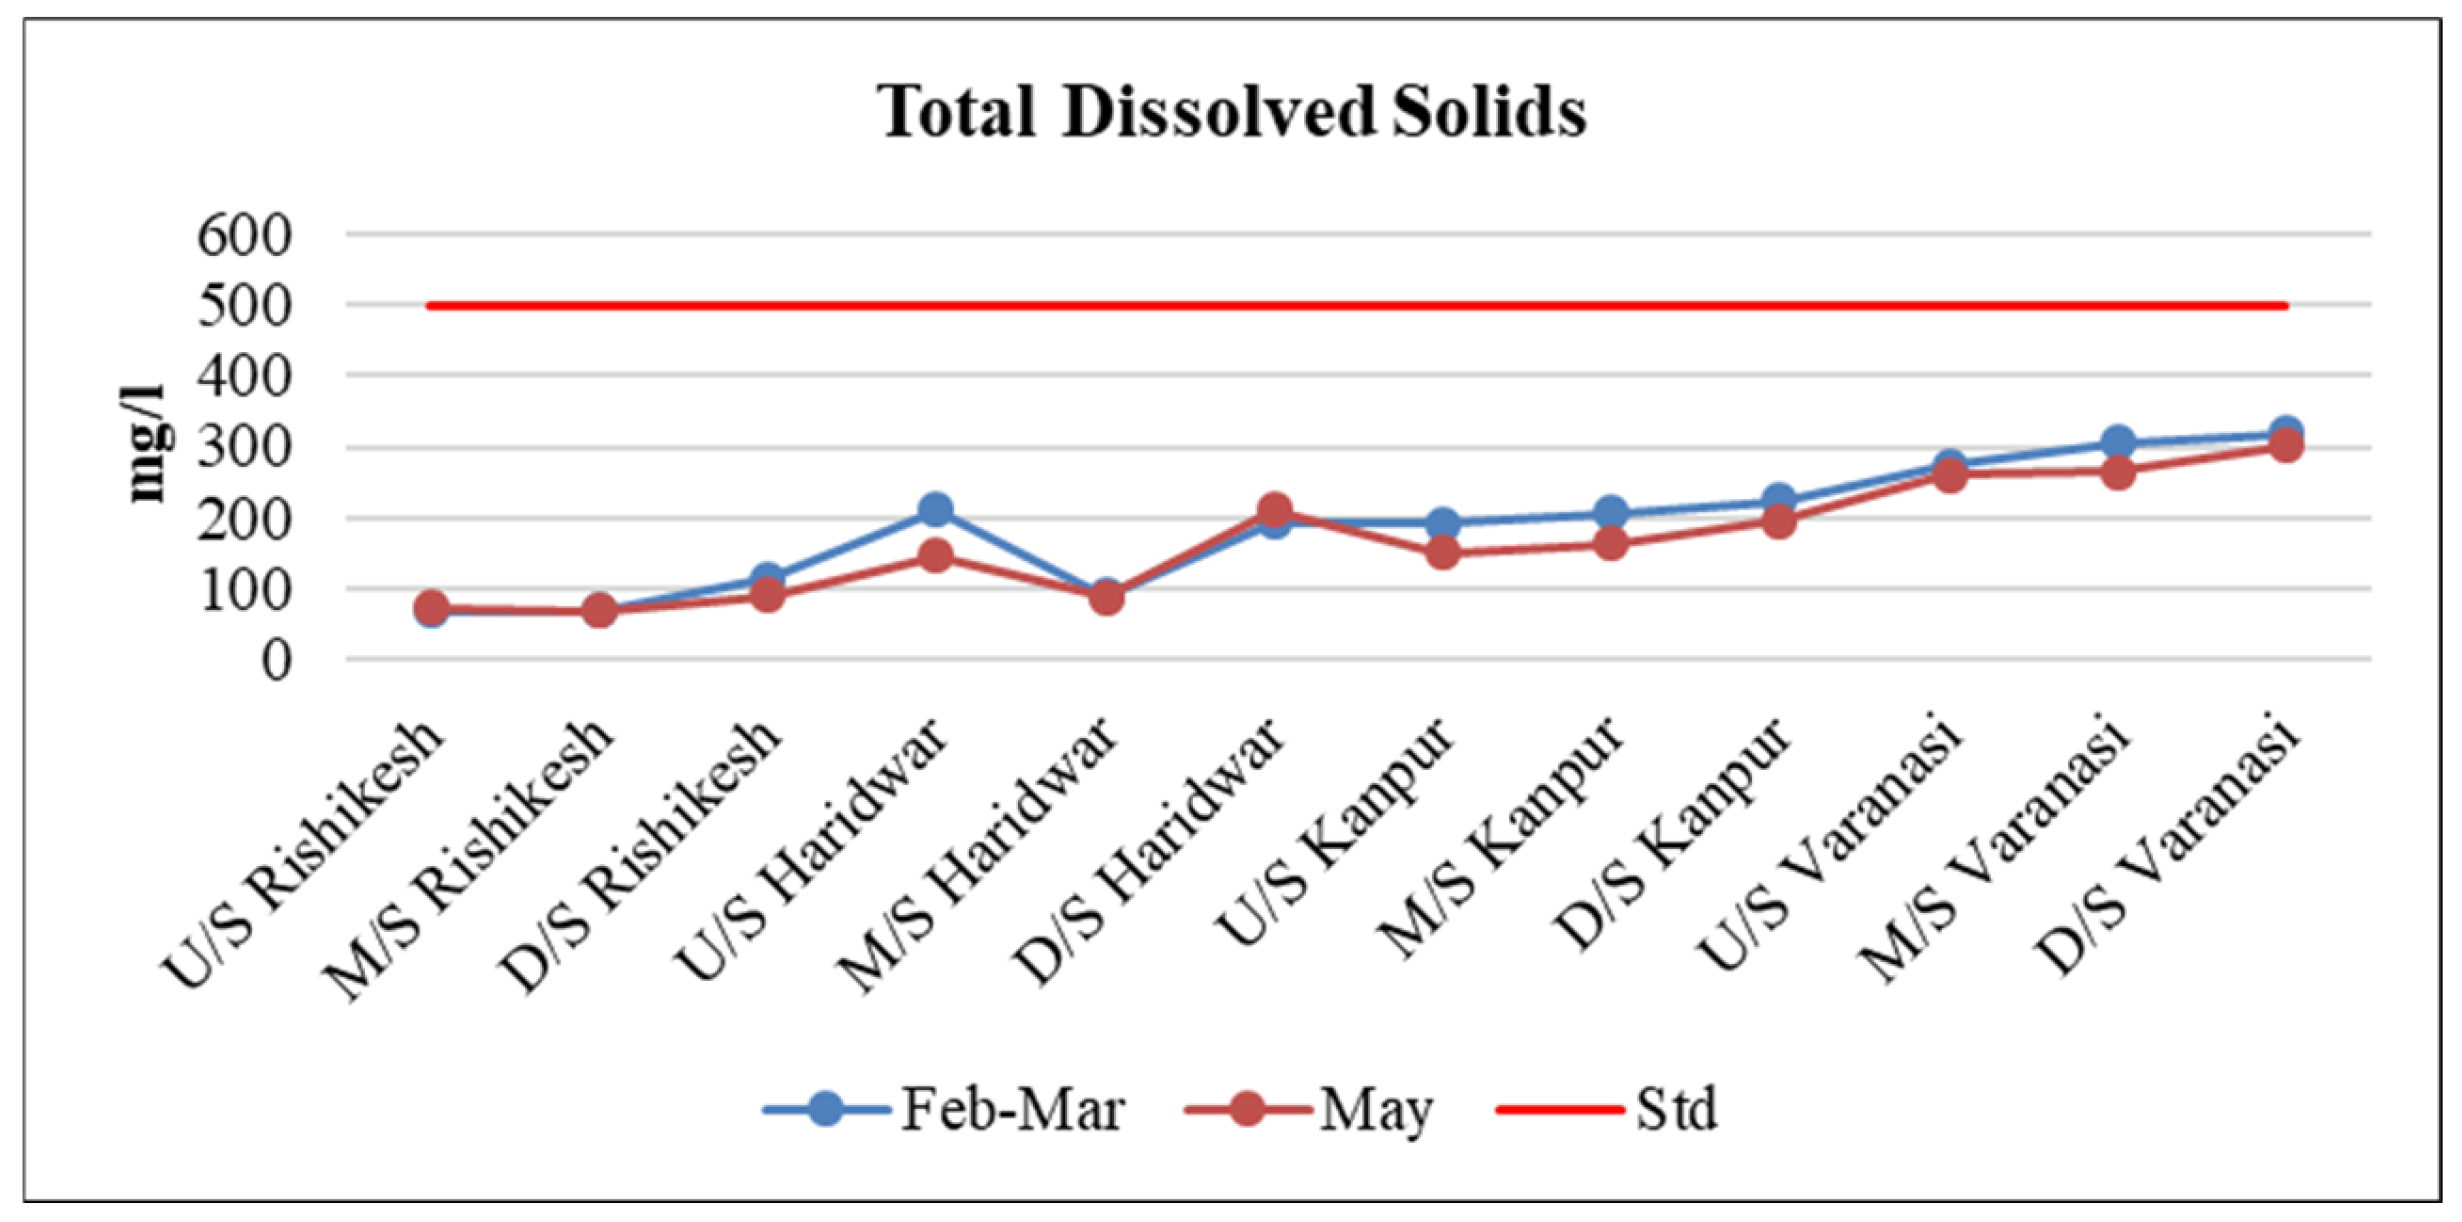
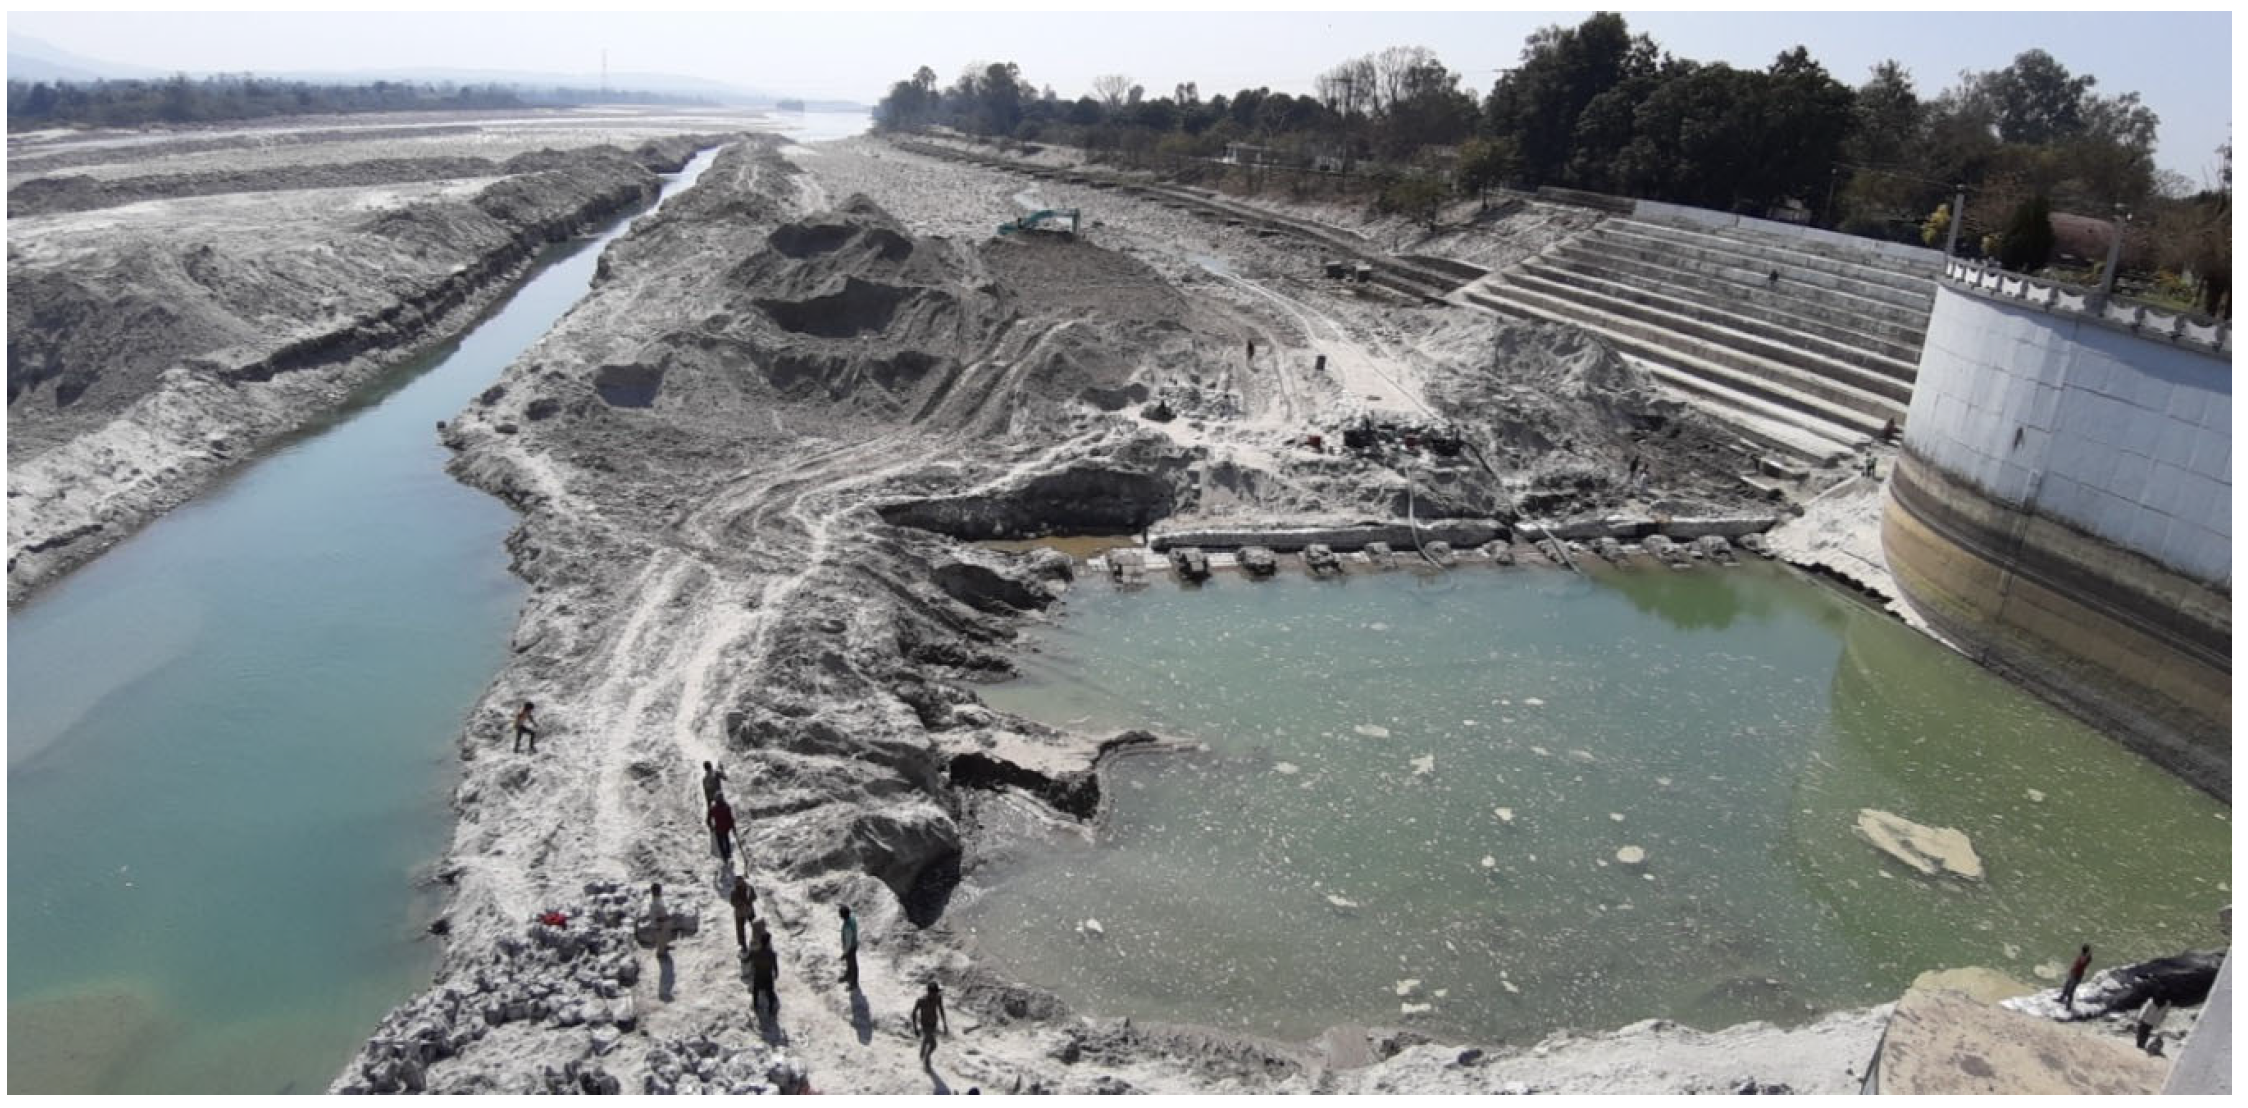
Transparency is a crucial factor when assessing the quality of water, as light will scatter when the water is more turbid because there are more dissolved, suspended particles [73]. Due to high velocity and lower depth, the measurement of transparency was not possible in the upper stretch at Rishikesh and Haridwar. In Kanpur and Varanasi, transparency was measured as 0.5 ± 0.16 and 0.3 ± 0.08 m, respectively, which was less than the standard limit (1.0 m) prescribed by the CPCB (Central Pollution Control Board, India), 1979, for drinking purposes from surface water at all six sampling sites in both sampling phases (Table 3) (Figure 2). TDS was recorded between 68 mg/L and 319 mg/L in February–March 2023 and 73 and 302 mg/L in May 2023 (Figure 3). The mean value of TDS was observed from 80 ± 18.2 to 288 ± 24.5, which was well within the prescribed standard (500 mg/L) at all sampling stations in both of the seasons, which is considered to be good. The minimum TDS was found upstream and midstream of Rishikesh in both study months. TDS and electrical conductivity were well within the standard limit at all sampling stations for each of the study months. The palatability of the water, with a TDS level of less than 500 milligram per liter in water, is considered to be good. TDS was found in increasing amounts from Rishikesh towards Varanasi, except midstream of Haridwar. This is due to the meeting of the uncontaminated Ganges River water, which was diverted to a canal for Chila hydropower plant from Pashulok Barrage (downstream of Rishikesh). At the same time, there were some other maintenance and construction activities going on downstream of Pashulok Barrage, and construction material, such as cement, entered and became dissolved in the water, increasing the amount of total dissolved solids (Figure 4).
Table 3.
Physcio-chemical characteristics of the Ganges River (mean value of two seasons and three sampling points of each city, upstream, midstream, and downstream).
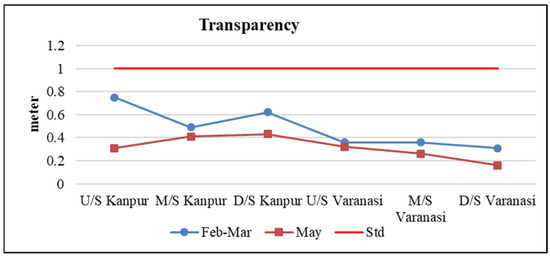
Figure 2.
Transparency in the River Ganges at Kanpur and Varanasi.
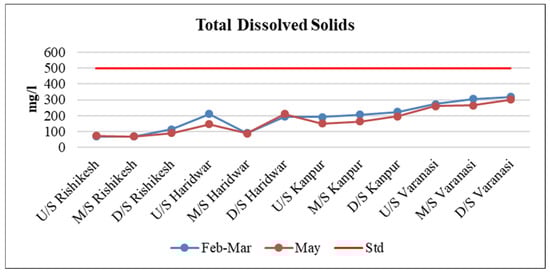
Figure 3.
Total dissolved solids (TDS) in the River Ganges.
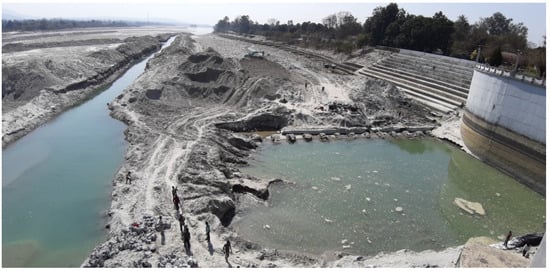
Figure 4.
Construction and maintenance activity downstream of Pashulok Barrage, Rishikesh (photographs were taken by the authors during the data collection in 2022).
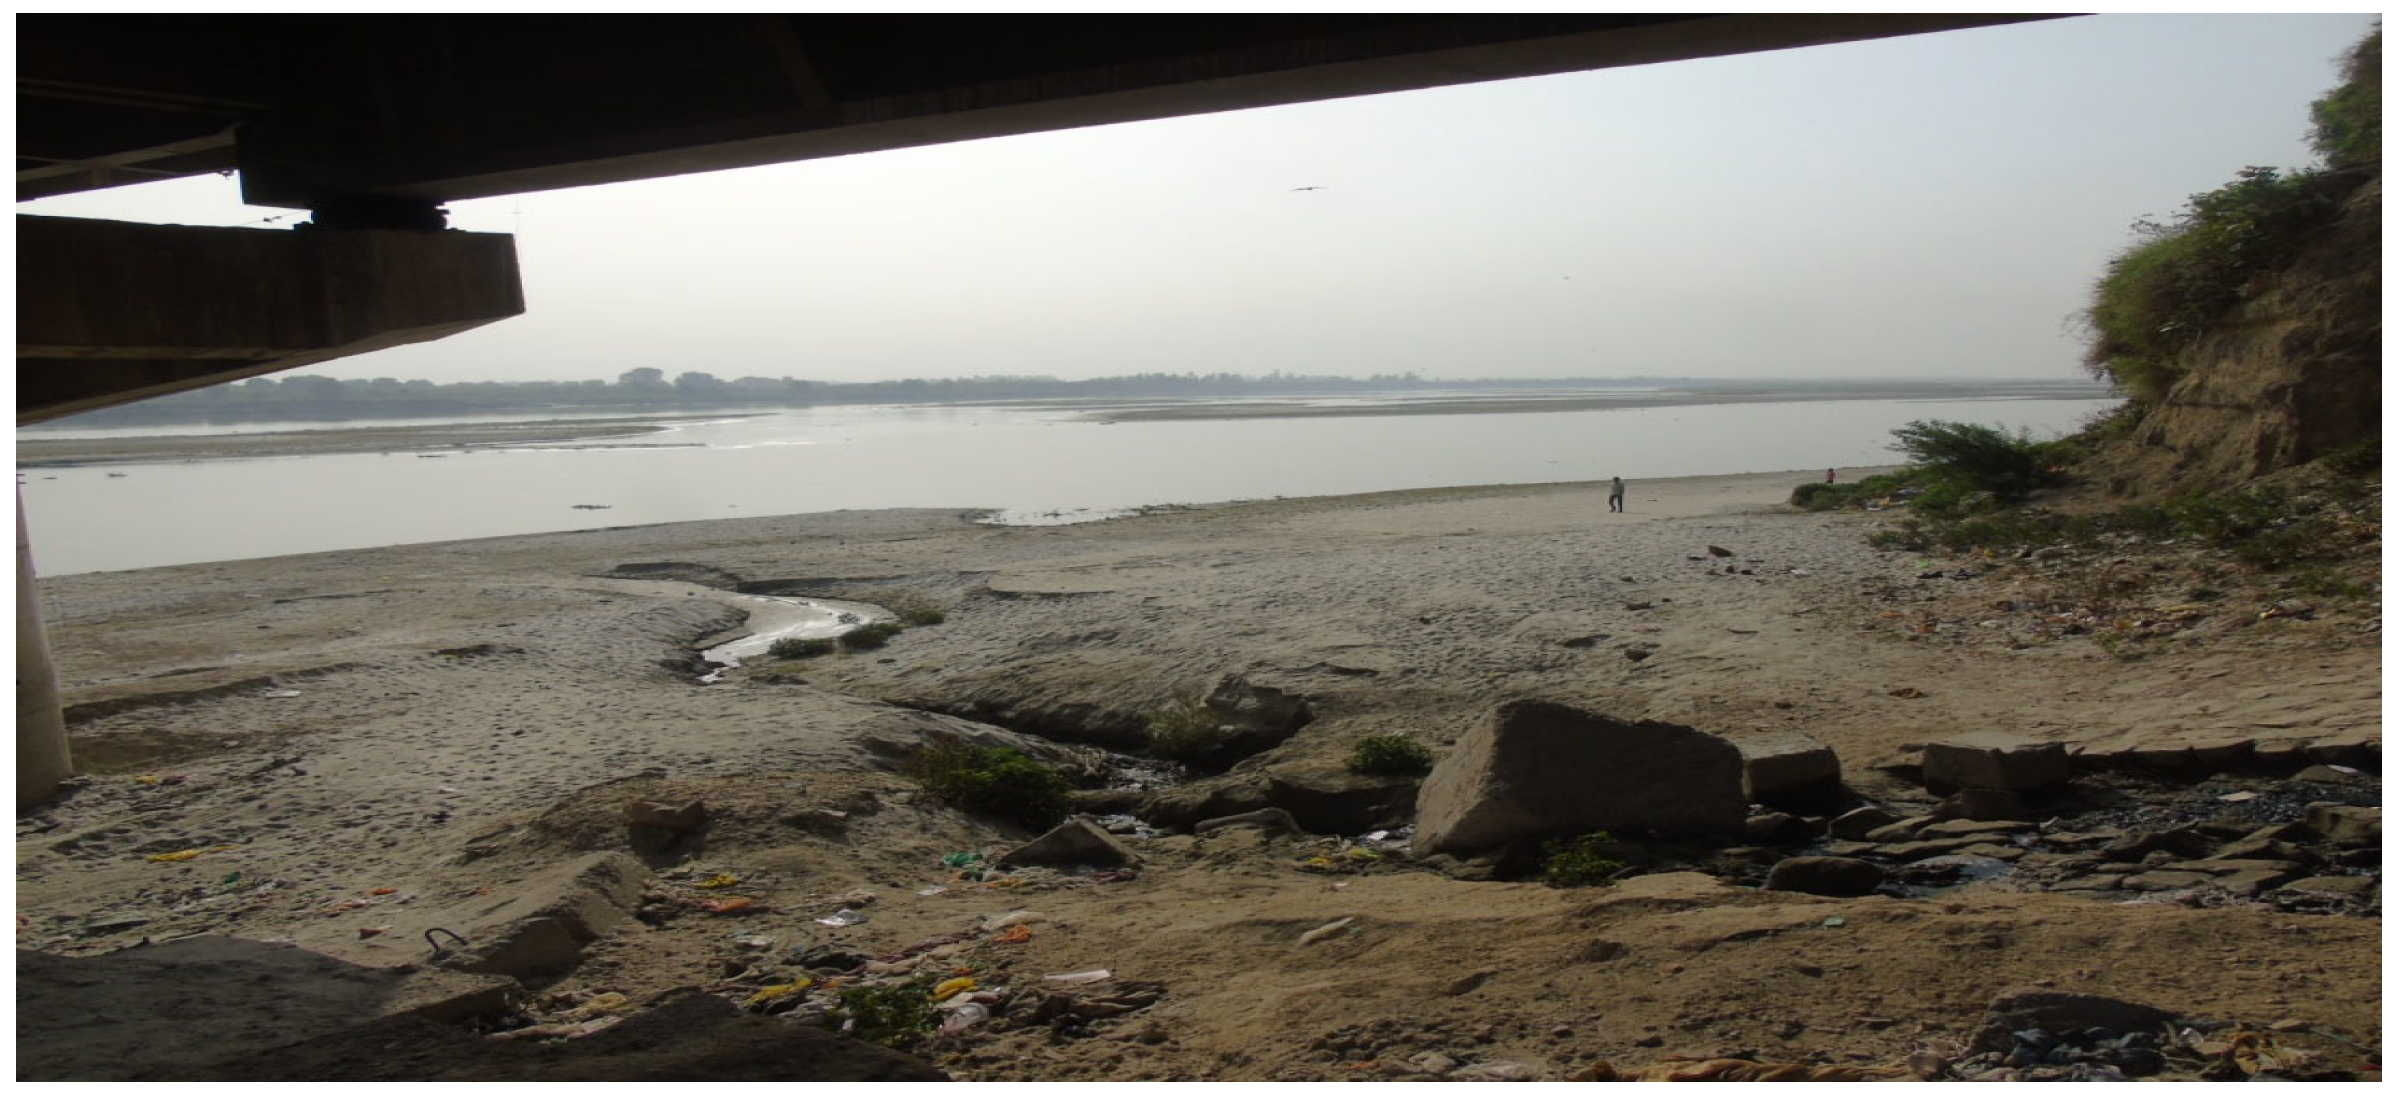
TDS was found in increasing amounts from Rishikesh towards Varanasi, except midstream of Haridwar, which is an indication of the mixing of either municipal or industrial untreated wastewater (Table 3 and Figure 5). In Kanpur, TDS was recorded in increasing amounts. This was mainly due to the joining of municipal and industrial wastewater through the small channels (Figure 5). In Varanasi, TDS was also observed in increasing amounts, especially downstream of Varanasi, where it reaches its higher concentration, which was mainly due to the joining of the Varuna River, which carries all types of wastewater, like treated and untreated sewage and industrial effluent of Varanasi city.

Figure 5.
Small wastewater channels joining the Ganges River at Kanpur near Jajmau, Kanpur, (photographs were taken by the authors during the data collection in 2022).
3.2. Bio-Physical Vulnerability Assessment—Chemical Tests
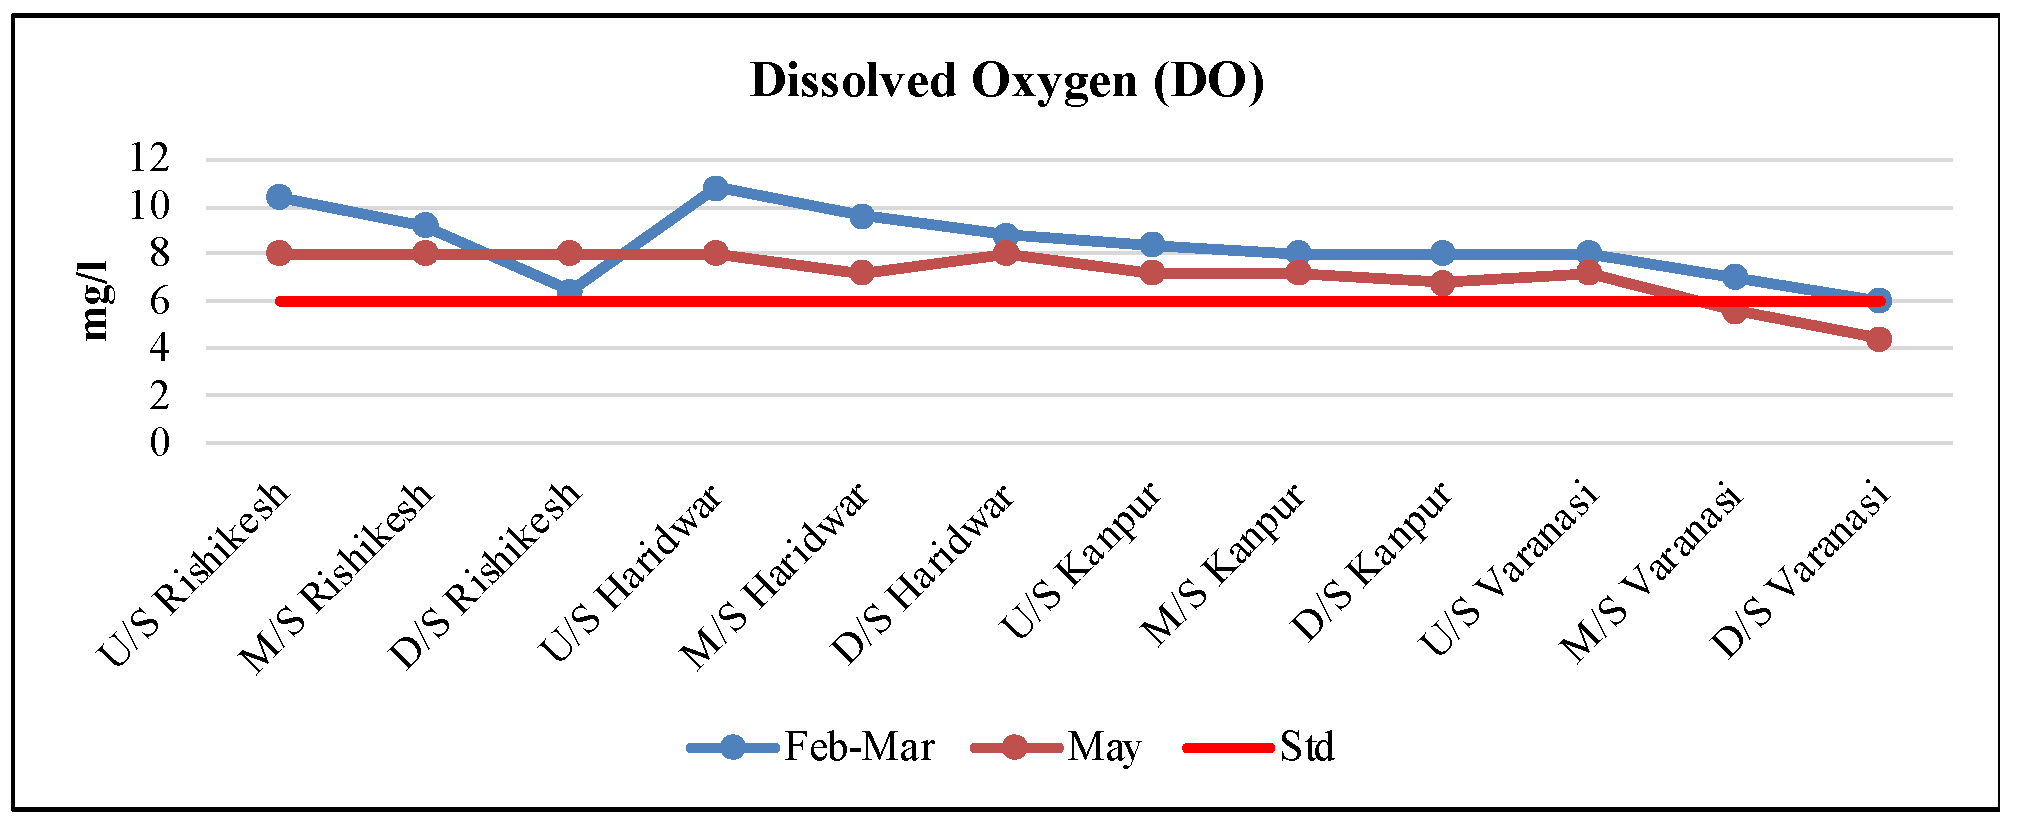
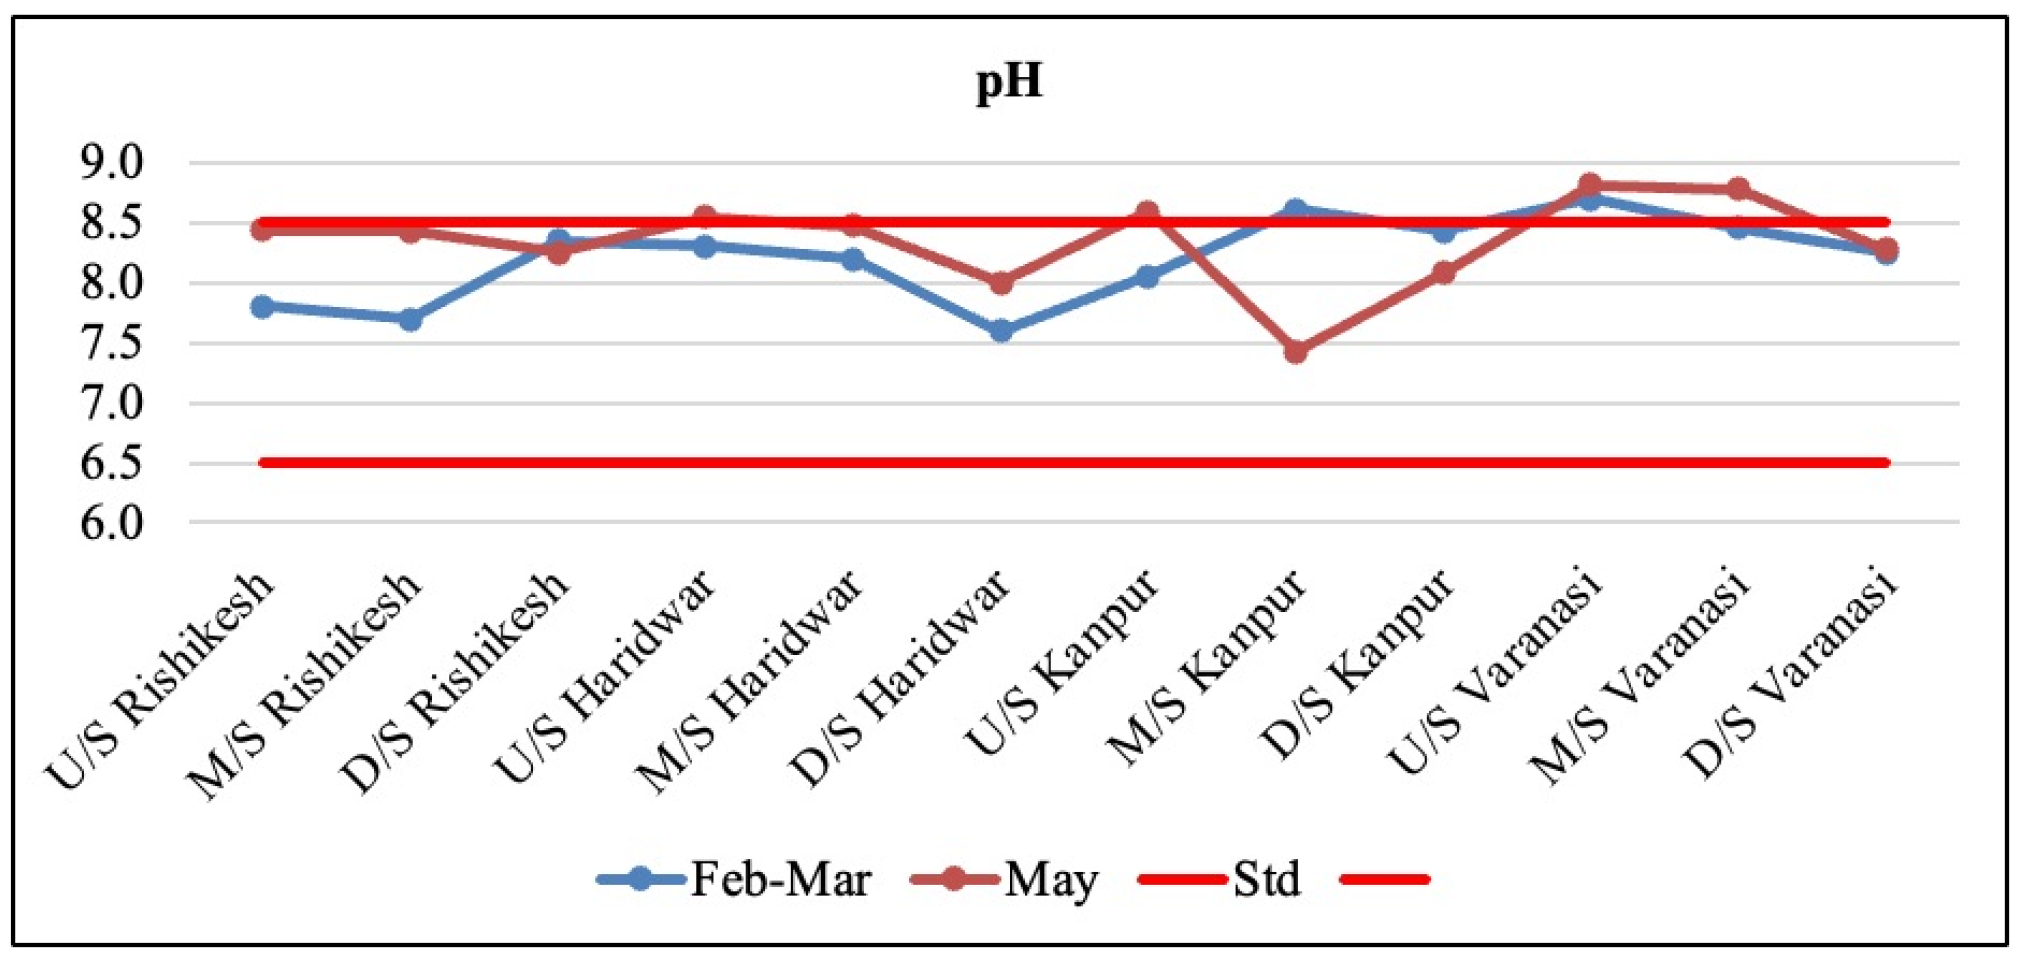
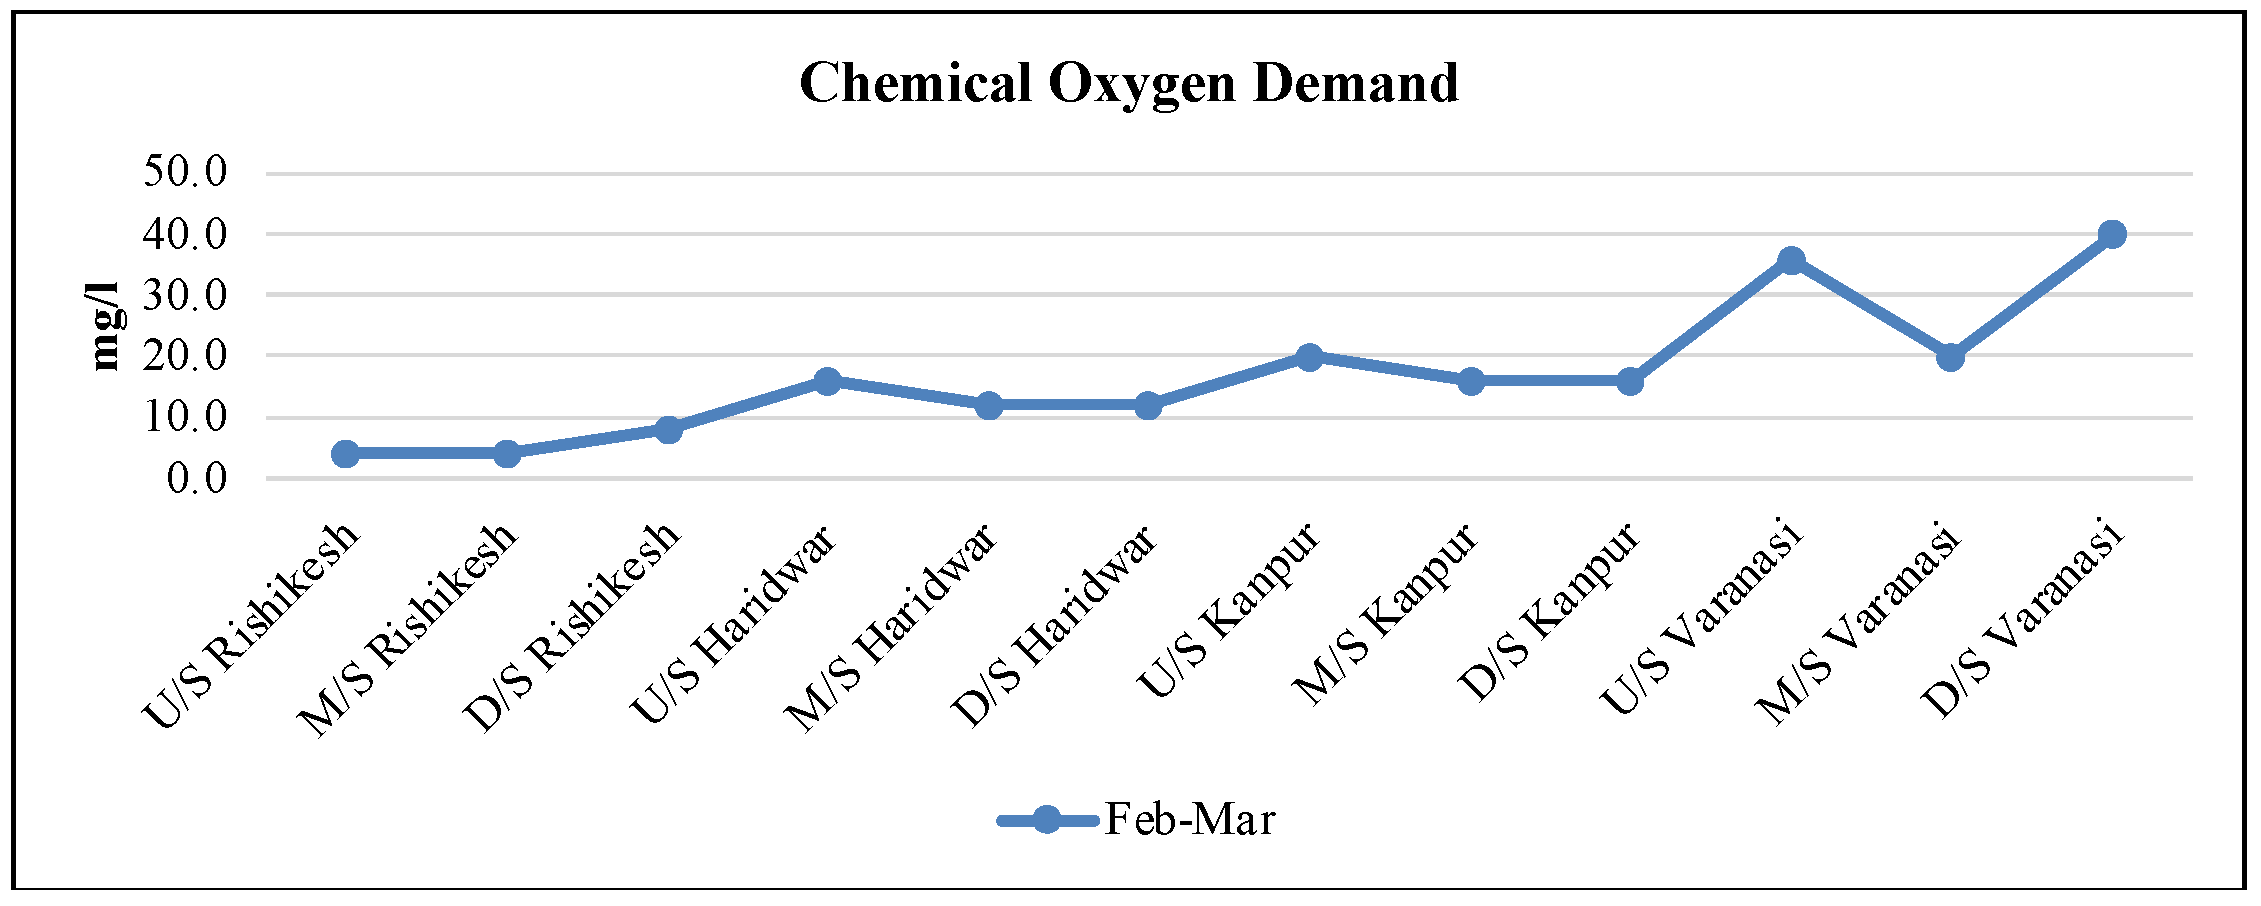
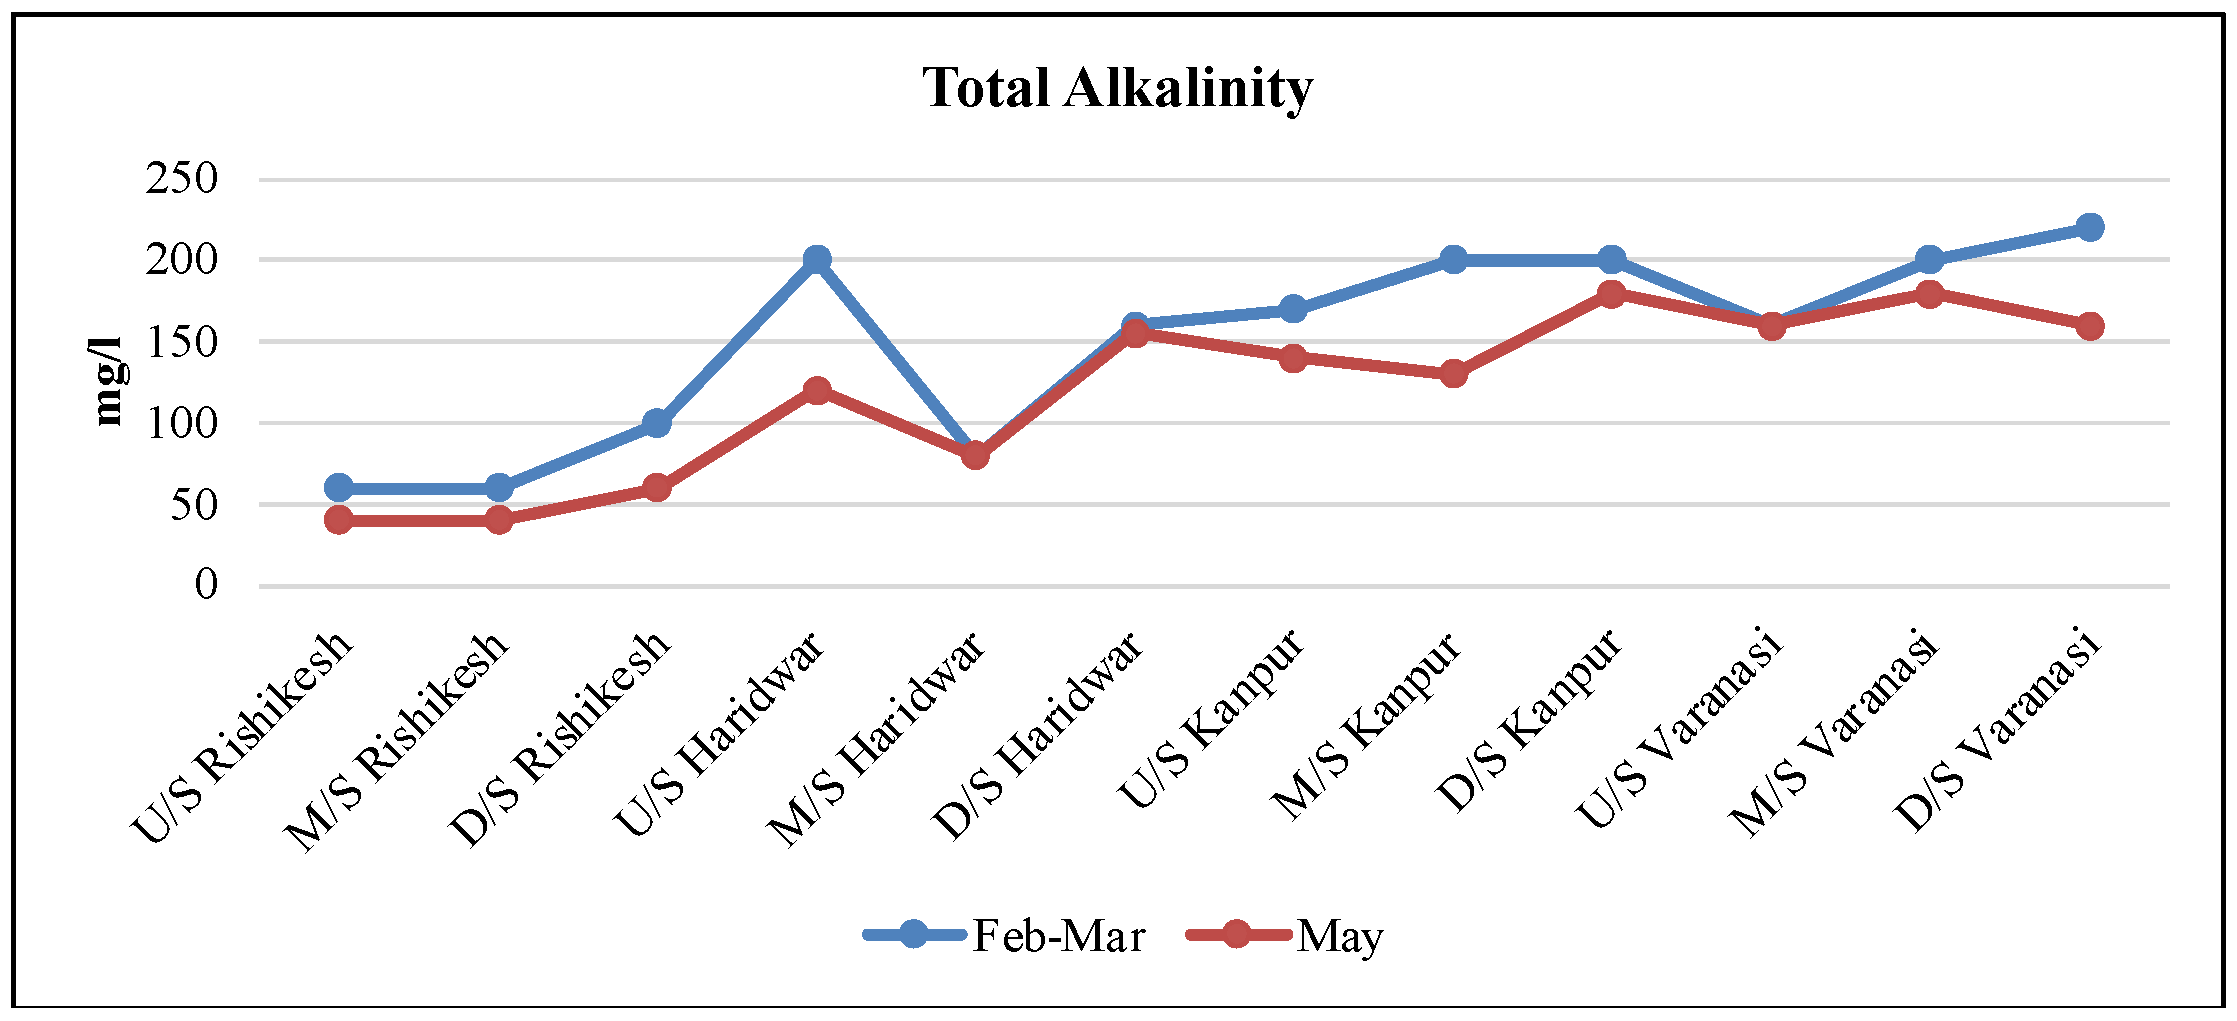
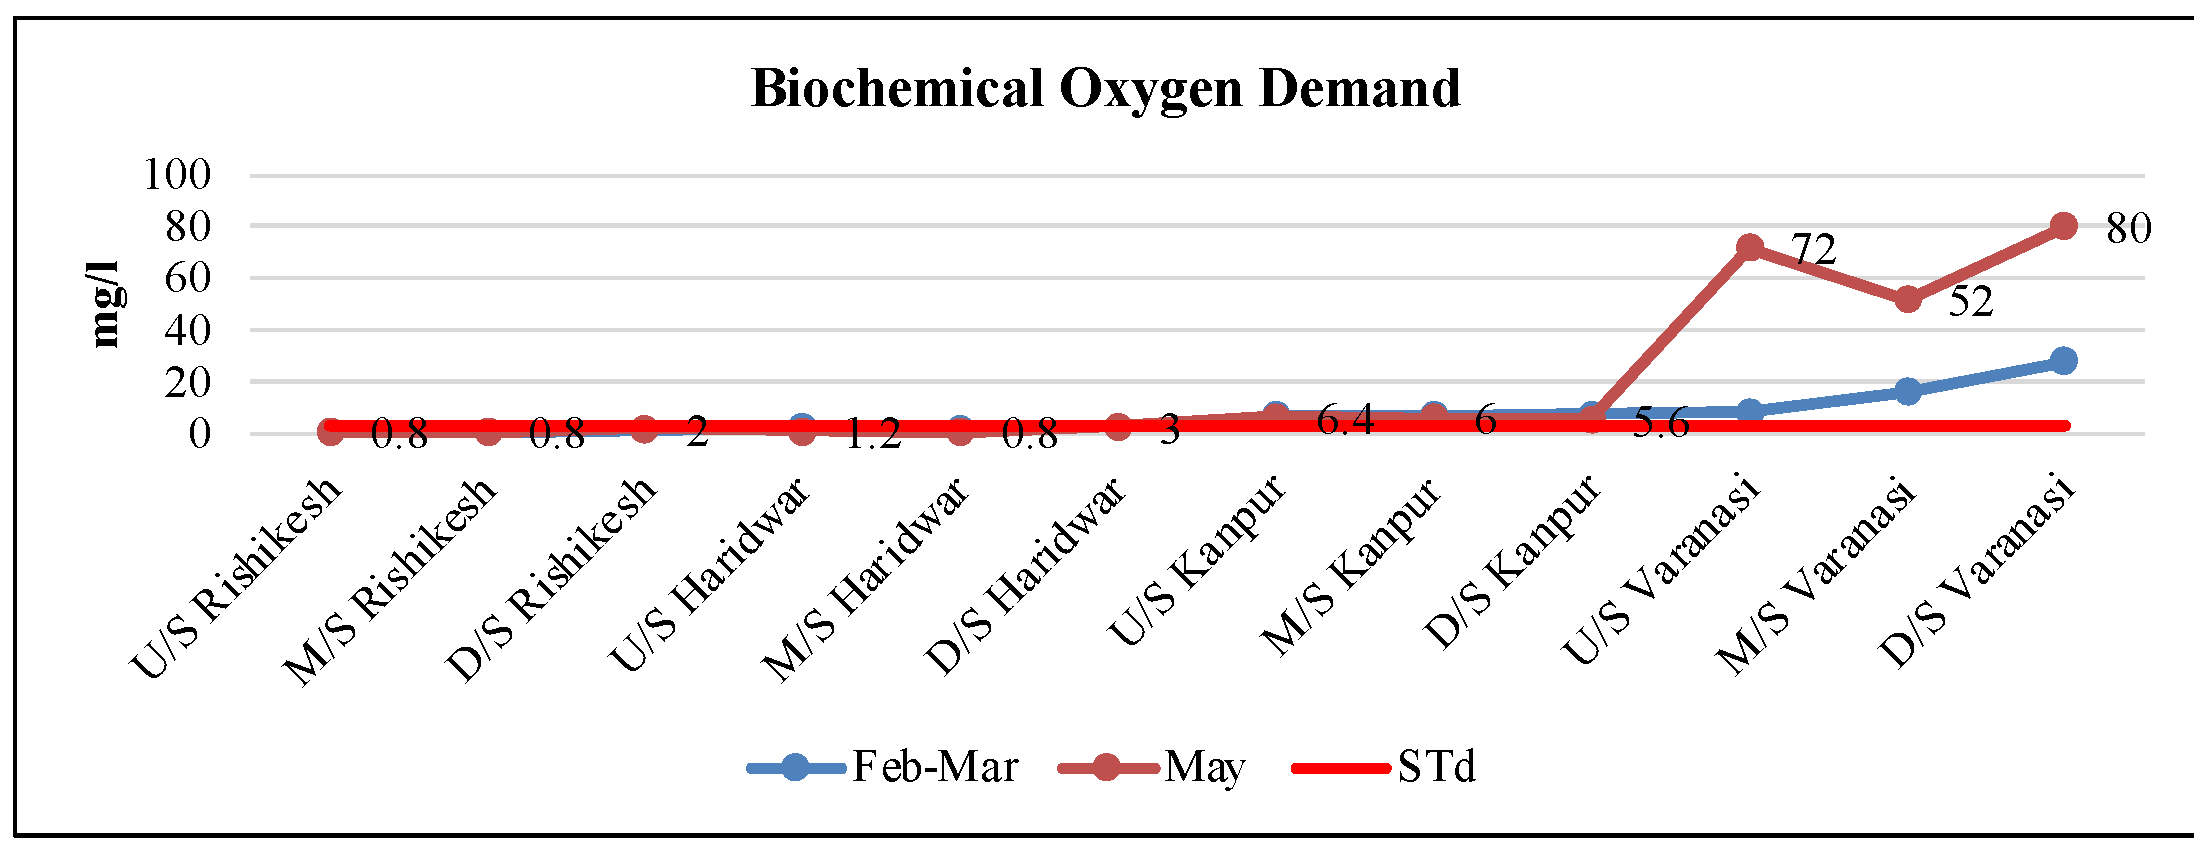
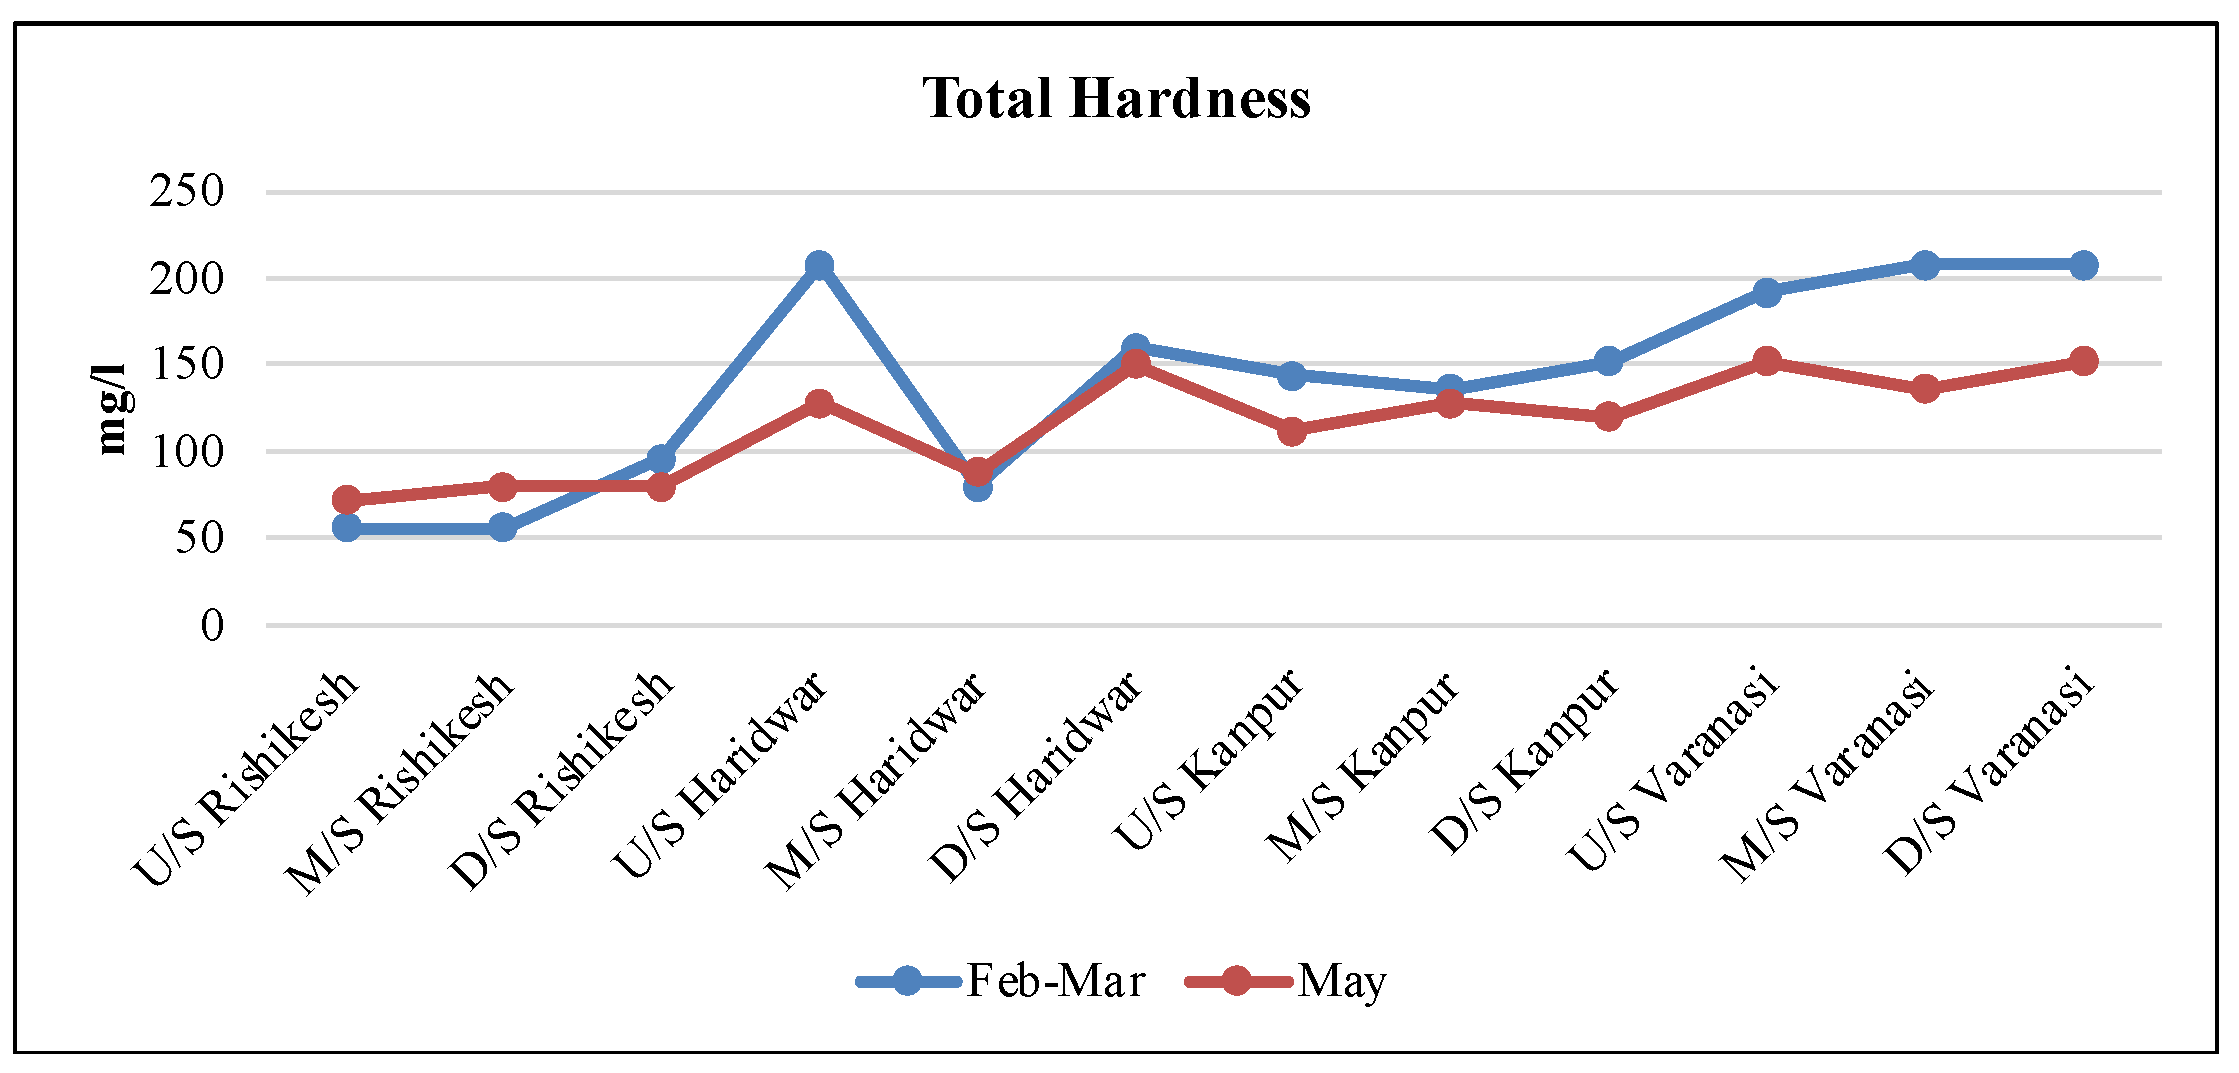
The average dissolved oxygen (DO) levels ranged from 6.4 ± 1.3 to 8.7 ± 1.3. DO levels were lower downstream of Rishikesh compared to those upstream and midstream, primarily due to impounding activity. The results indicate that, in Varanasi, the DO levels were below the standard limit (5.0 mg/L) in May midstream and downstream in both studied months (Figure 6). This could be due to the adjoining of various drains and the Varuna River, suggesting that the river water is not suitable for bathing. The average pH value was observed from 8.2 ± 0.3 to 8.5 ± 0.3 in all four cities (Table 3). The pH was recorded between 7.60 and 8.78 in our study in February–March and May 2023 at all sampling stations. The pH was observed to be slightly higher than the standard limit by the CPCB 1979 (6.5–8.5) in May, as compared to that of February and March (Figure 7). COD is a helpful test to assess pollution in water bodies and was analyzed from February to March. The results confirmed an increasing trend in all case study areas, particularly in Varanasi and Kanpur (Figure 8). Alkalinity was recorded between 60 and 220 mg/L in February and March and from 40 to 180 mg/L in May (Figure 9). It also shows increasing trends in all case study areas in both months. BOD was recorded below the limit in all sites of Rishikesh and Haridwar in both seasons (Table 3). The average value of BOD of each of the cities from upstream to downstream ranged from 1.1 ± 0.6 to 42.7 ± 29.8, which was 2 to 25 times higher than the standard limit of 3.0 mg/L in Kanpur and Varanasi (Figure 10). The observed results represent the influence of organic impurities derived through municipal and industrial wastewater. The observed increasing trend of TH (total hardness) was very similar to that seen in TDS from Rishikesh to Varanasi (Figure 11).
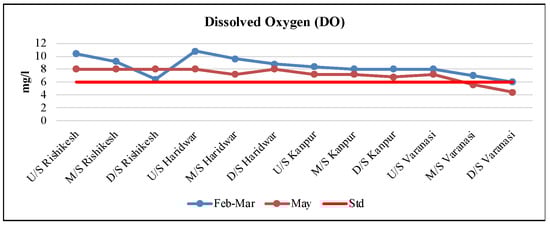
Figure 6.
Dissolved oxygen in the River Ganges.
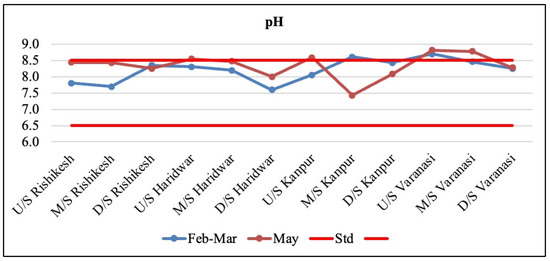
Figure 7.
pH in the River Ganges.
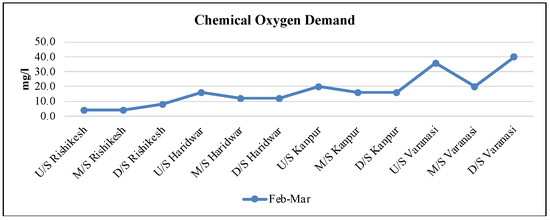
Figure 8.
Chemical oxygen demand.
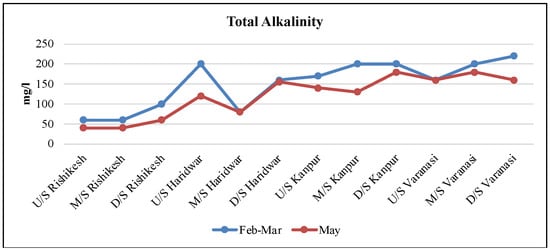
Figure 9.
Total alkalinity in the River Ganges.
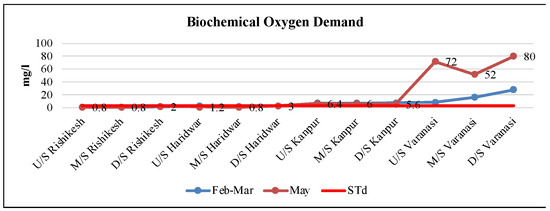
Figure 10.
BOD of the River Ganges.
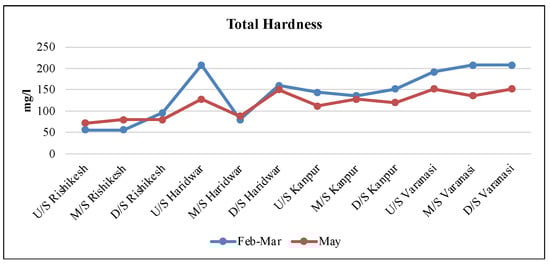
Figure 11.
Total hardness in the River Ganges.
Others: The average chloride levels in the different cities ranged from 9.0 ± 3.3 to 57.3 ± 5.3. These values were within the standard limit of 250 mg/L, but there was an increasing trend of chloride from Rishikesh to Varanasi, indicating the influence of wastewater. When the chloride content was correlated with sodium, a similar trend was observed, suggesting the presence of salt. The main source of salt (NaCl) in surface water bodies is sewage. Other parameters, such as COD, total alkalinity, total hardness, calcium, magnesium, fluoride, potassium, nitrate, and ammoniacal nitrogen, were also analyzed and found to be within the standard limits prescribed by the Central Pollution Control Board (CPCB) for surface water (refer to Table 3).
3.3. Bio-Physical Vulnerability Assessment—Biological Elements
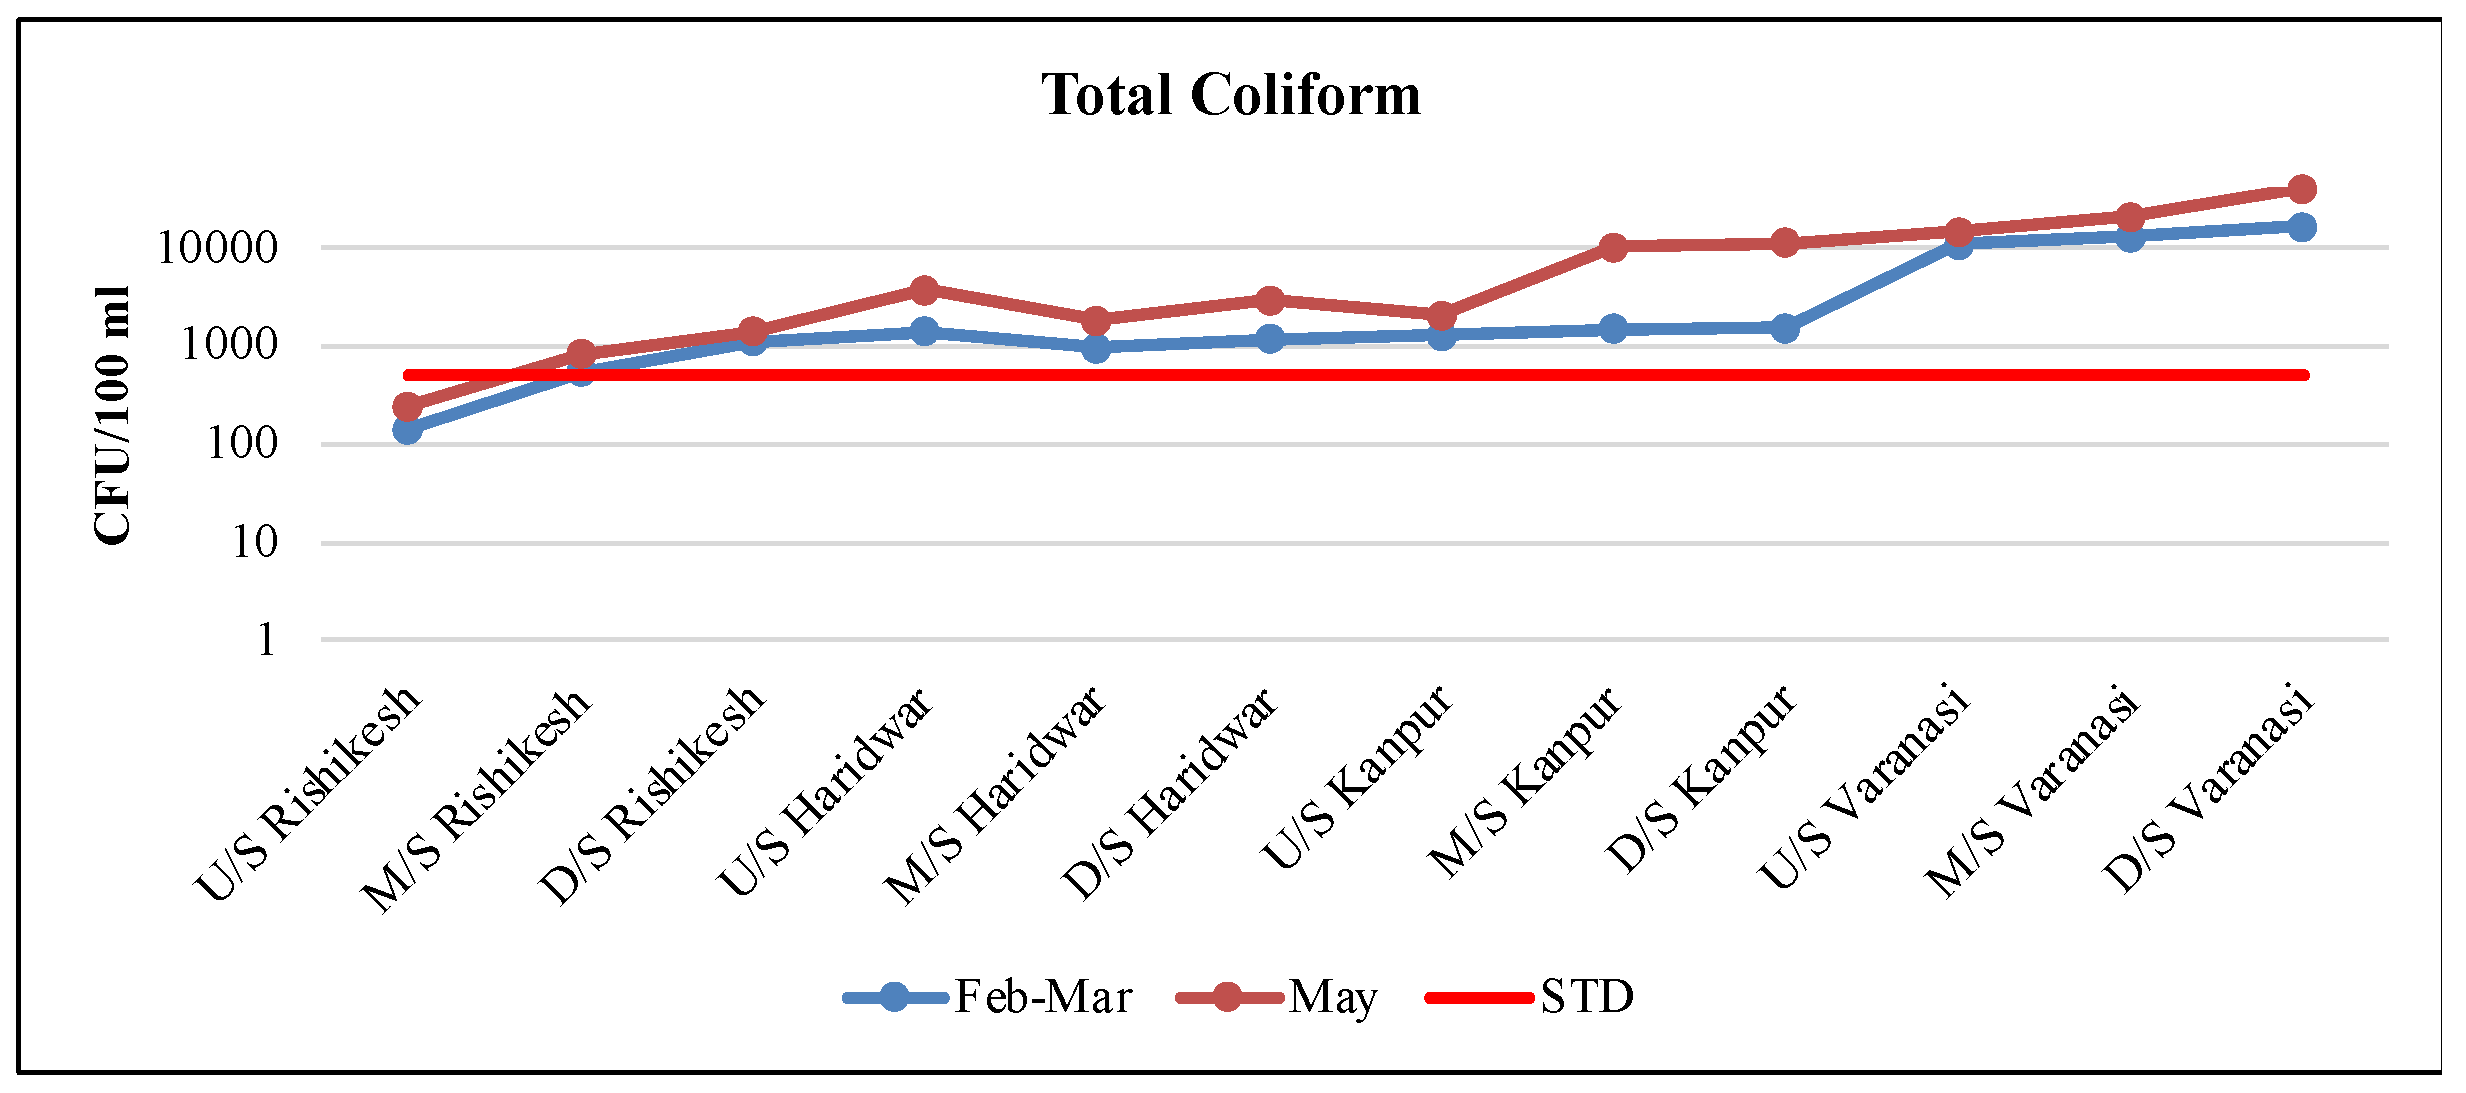
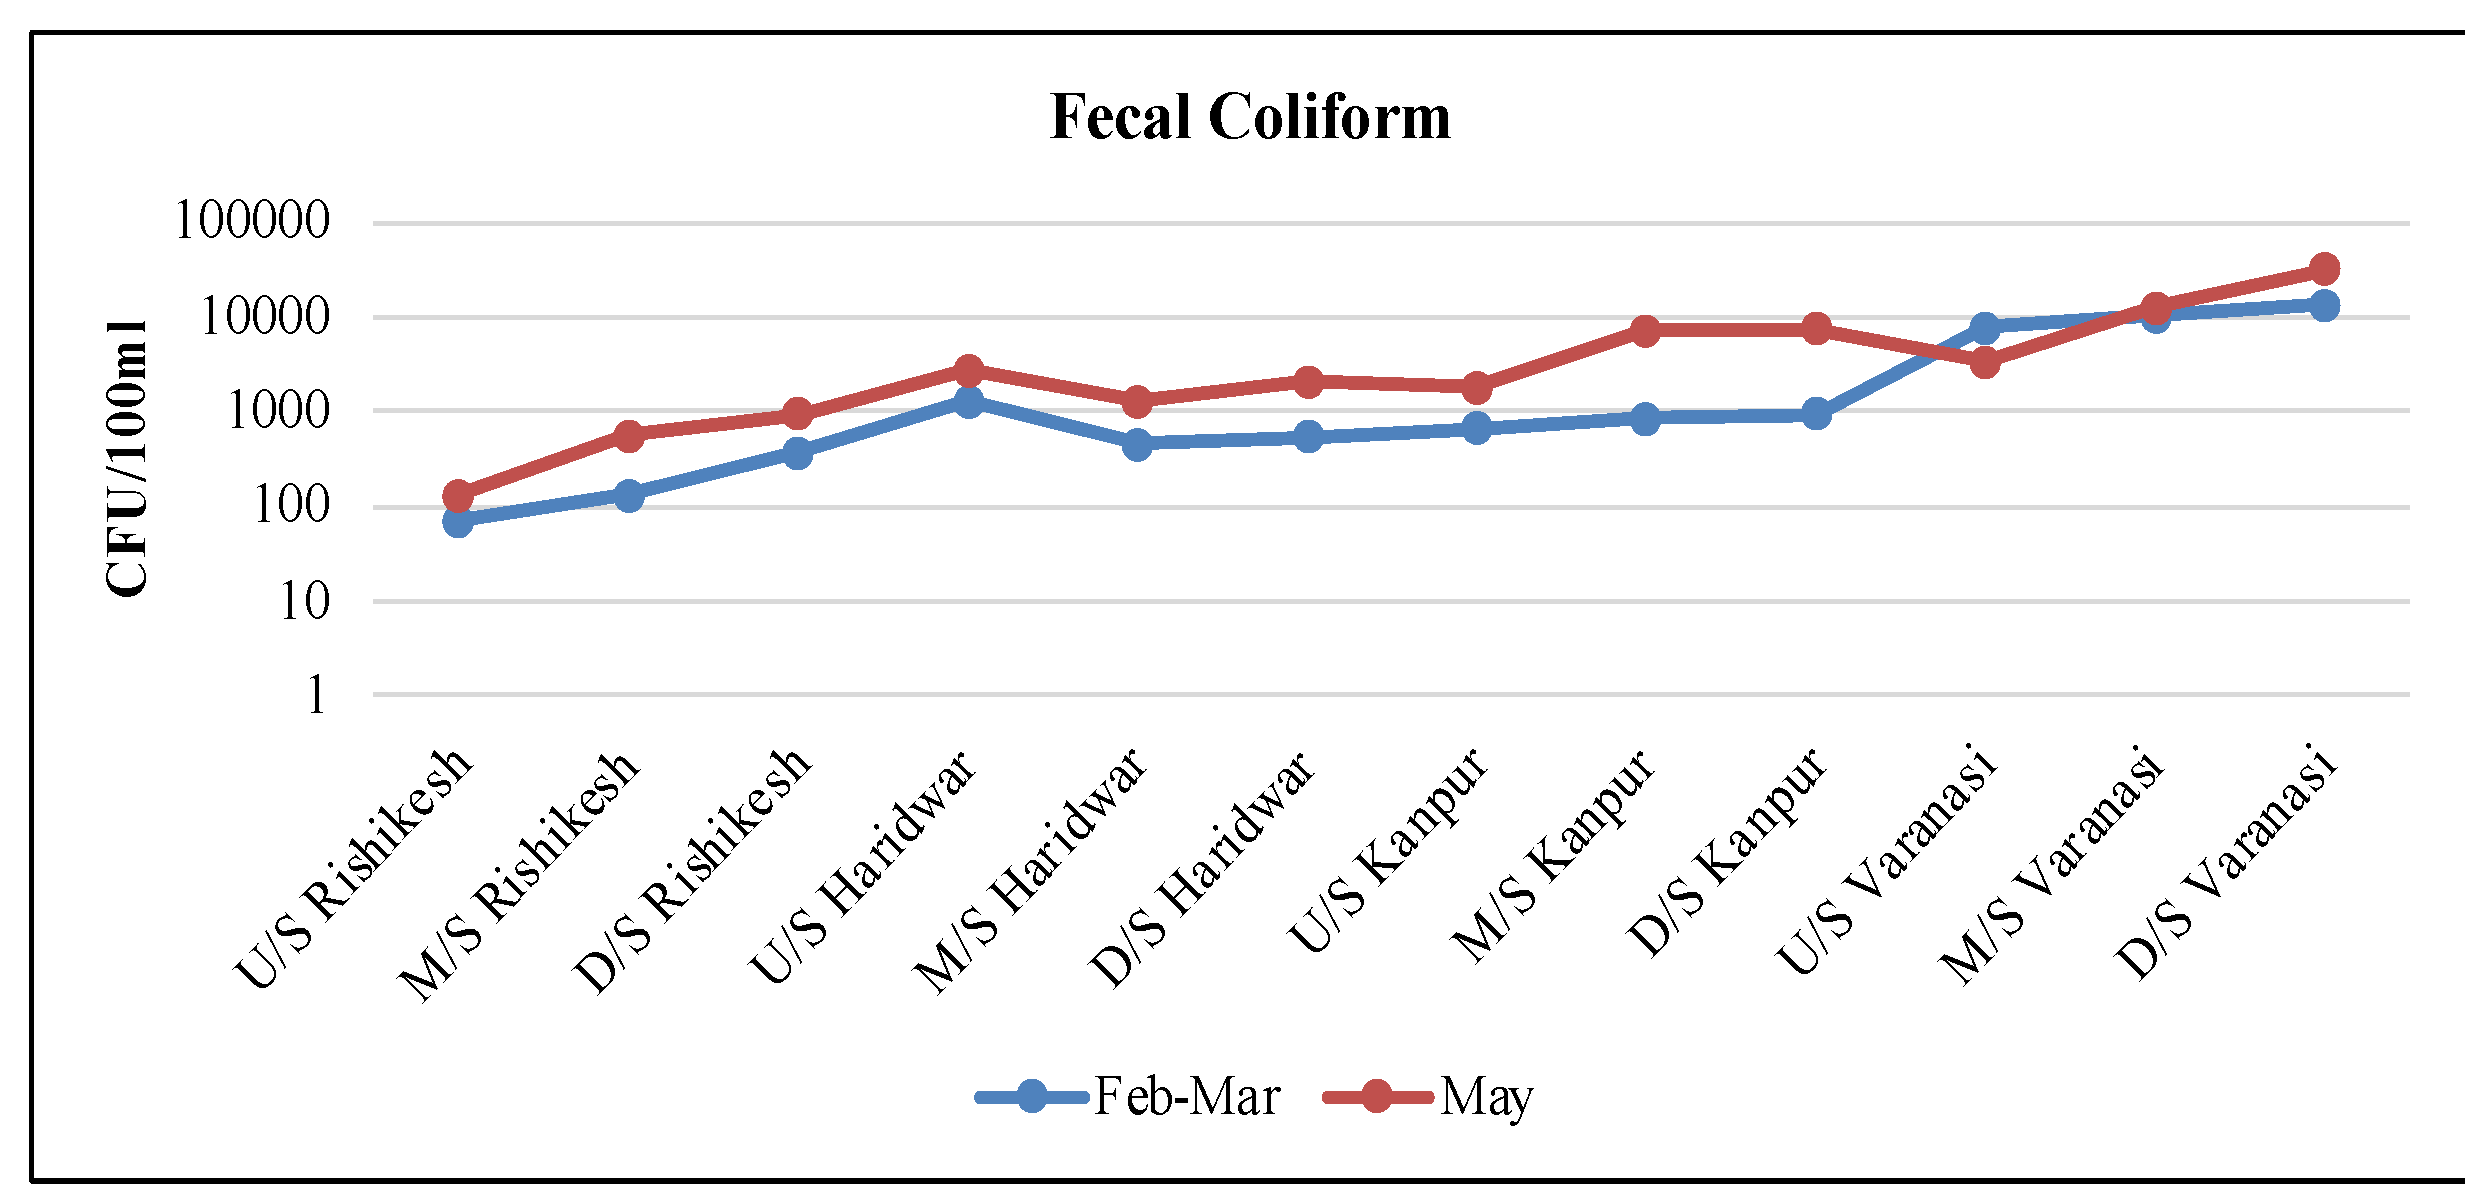
Coliform bacteria indicate the presence of disease-causing organisms in water (sanitary quality of food and water). In this study, the average value of total coliform and fecal coliform colonies in each city ranged from 703 ± 491 to 18,883 ± 10,504 and 365 ± 333 to 13,233 ± 9913, respectively. The total coliform and fecal coliform colony counts were observed as an increasing trend. The total coliform counts of bacteria (Figure 12) were under the permissible limit (500 CFU/100 mL) only at the site upstream of Rishikesh in both study months. The presence of fecal coliform bacteria, or E. coli, hints that water has been contaminated with fecal waste, which may also carry other bacteria, viruses, or parasites like Giardia, which is the cause of beaver fever. Similar to the total coliform count, fecal coliform was also found as an increasing trend (Figure 13).
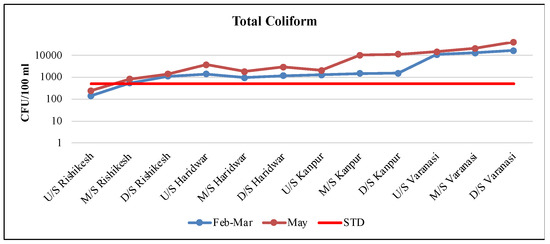
Figure 12.
Total coliform count in the River Ganges.
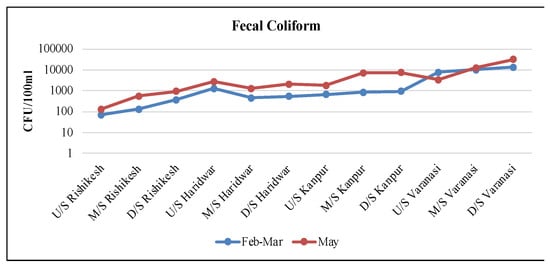
Figure 13.
Fecal coliform count in the River Ganges.
4. Social Vulnerability Assessment
4.1. Survey Results
The social vulnerability survey was conducted in each of the following cities:
- i.
- Rishikesh;
- ii.
- Haridwar;
- iii.
- Kanpur;
- iv.
- Varanasi.
The survey was carried out between November and December 2022 and involved a total of 1079 participants.
4.2. Pollution of the Ganges in Rishikesh
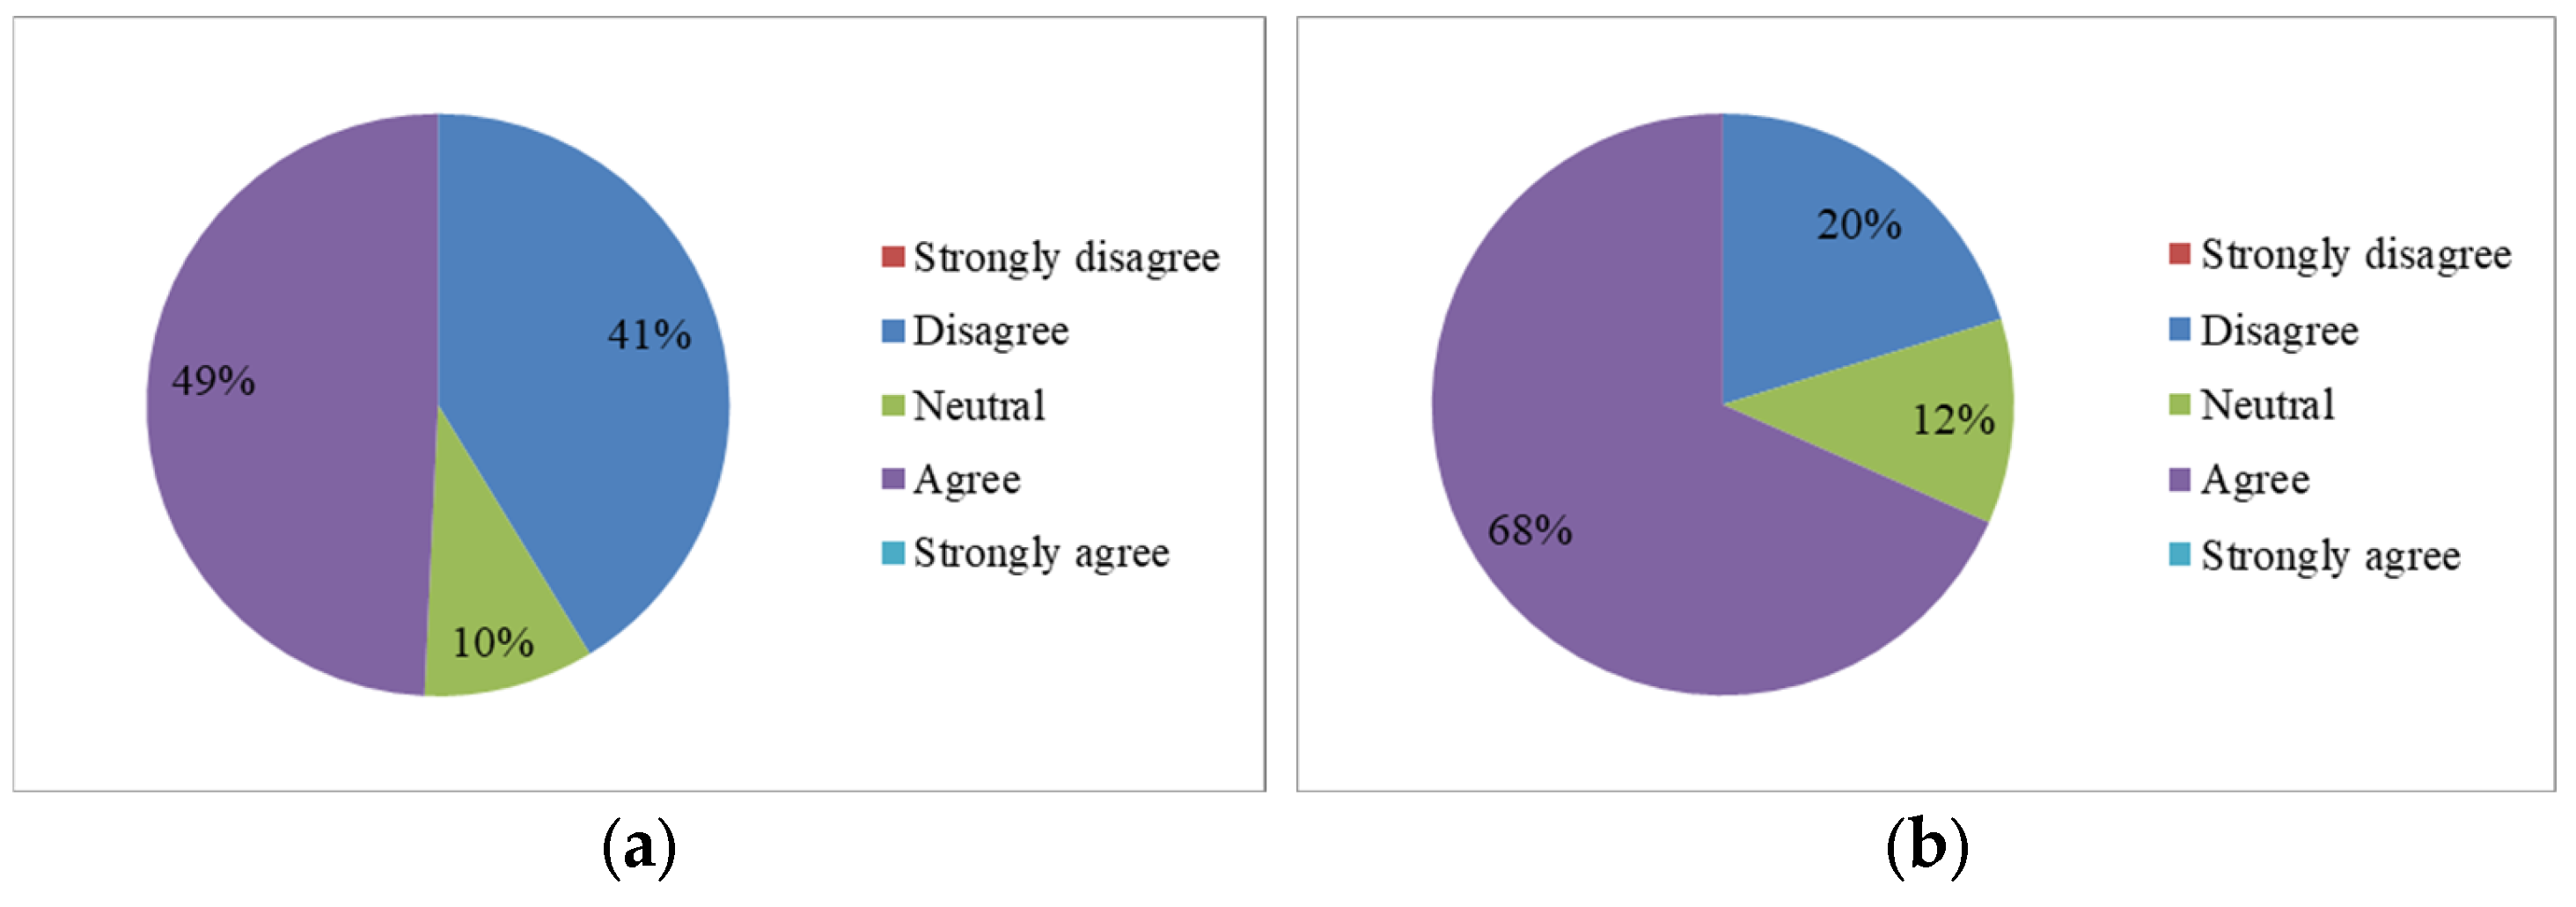
Almost all locals come to the River Ganges in Rishikesh for religious and cultural purposes, such as taking a bath before going to temples for puja (worship) and collect Ganges water to offer to the gods and their deities in homes, rather than for any other needs. A total of 49% of respondents agreed that the River Ganges is polluted, compared to 41% who disagreed, while 10% people were neutral (Figure 14a). However, this local perception was cross-checked with the status of pollution at present compared to that found a decade ago. Here, a different picture emerged, as approximately 75 percent of locals perceived an increase in pollution from slight, a decade ago, to severe, now. This study also included the opinions of tourits (Figure 14b), as Rishikesh attracts both pilgrims and nature lovers. This study recorded their perception of pollution in the Ganges at Rishikesh and, whilst 68% of tourists perceive the river to be polluted, this is compared to only 41% of locals.

Figure 14.
(a) Rishikesh: Local’s perception of river pollution. (b) Rishikesh: Tourist’s perception of river pollution.
4.3. Pollution of the Ganges in Haridwar
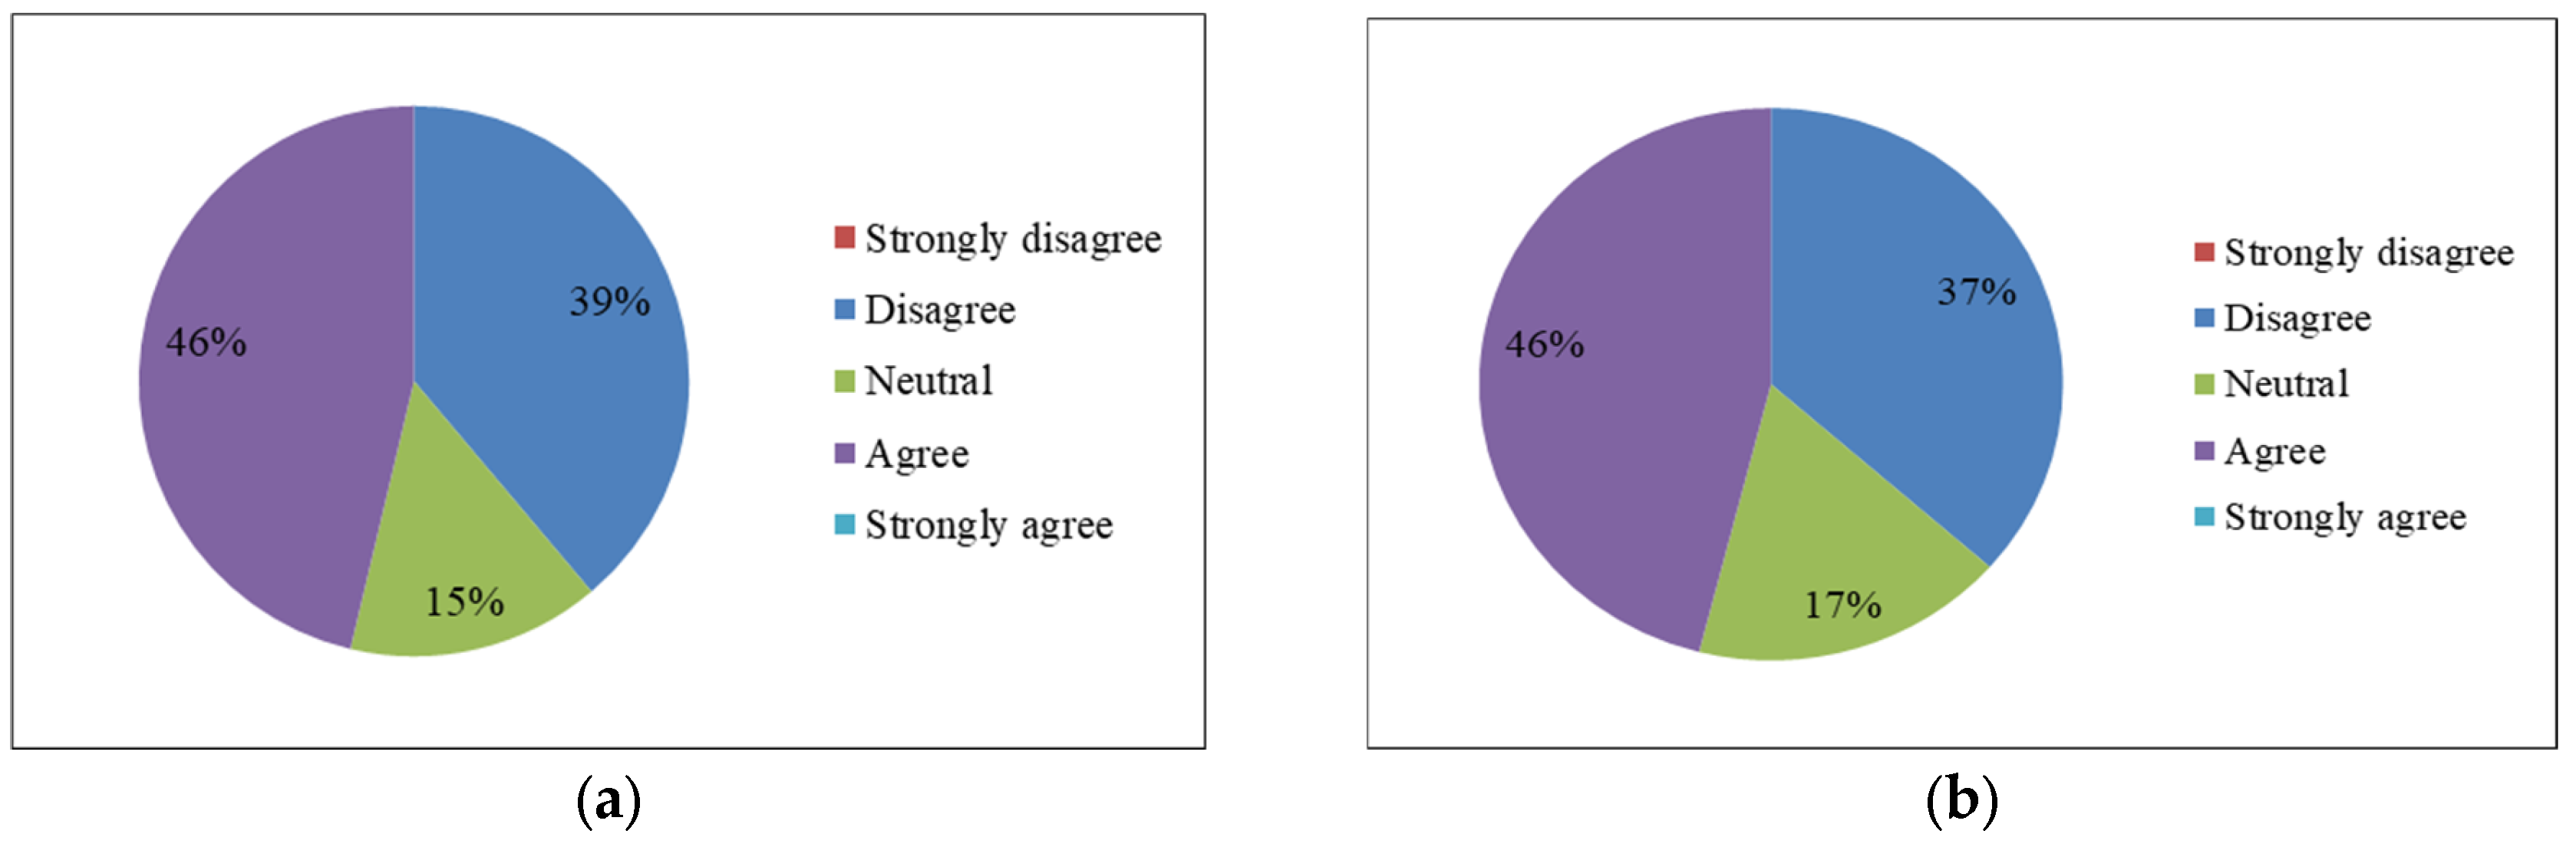
Haridwar is the first main town where the Ganges descends down from the hills, a center for pilgrims, who land there in considerable numbers. The perception of locals about the status of pollution in Haridwar is as follows: less than one-half (46%) of locals consider the Ganges as being polluted (Figure 15a), while slightly fewer (39%) think that the river is not polluted. The perception of tourists is similar to that of the locals, as an identical percentage (46%) of tourists think the river is polluted, and just slightly fewer (37%) think it is not polluted (Figure 15b). While locals’ and tourists’ perceptions about the water quality during the past decade were evaluated, and the results revealed that about 80% of locals think the pollution in the Ganges has increased from slight to severe during the past 10 years, still only 46% see the Ganges being polluted, and a far lesser percentage (just 22%) are affected by it. Interestingly, this almost matched with the perception of tourists, where 78% of tourists think that the pollution in the Ganges has increased from slight to severe during the past 10 years; however, only 46% see the Ganges being polluted, and a far lesser percentage (just 26%) are affected by it.

Figure 15.
(a) Haridwar: Local’s perception of pollution in Ganges water. (b) Haridwar: Tourist’s perception of river pollution.
Both locals and tourists perceive the pollution of the Ganges at Haridwar to have increased during the last decade, eight years of which has been during the period of the current government and the Namami Gange program (an Integrated Conservation Mission approved by the Union Government of India in June 2014). Hence, it should be the logical interpretation that the government’s strategy for reducing the pollution of the Ganges has not been effective. As far as the locals were concerned, only about 44% think that the Namami Gange is effective and will help to reduce the pollution of the Ganges River by 2024. It is interesting that almost 43% of local people either did not respond or did not want to talk about this.
4.4. Pollution of the Ganges in Kanpur
A majority of locals (61%) agree (Figure 16a) that the Ganges is still polluted, and only 18% think otherwise. A total of 32% of locals also said that they were affected by the pollution. An explanation for this could be that Kanpur is not a tourist or religious city, so few people use the Ganges for religious purposes and use this water for drinking and domestic uses. A total of 32% of locals think that there has been no change in the last 10-year period, while 60% of locals perceived a slight to moderate pollution increase.
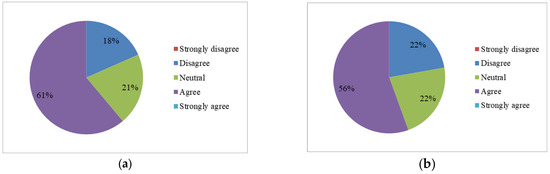
Figure 16.
(a) Kanpur: Local’s perception of river pollution. (b) Kanpur: Tourist’s perception of river pollution.
A higher percentage of tourists (37%) are affected by this pollution than the locals (19%), which is quite perplexing, as the city is not a tourist destination, and no logical explanation could be found for it. Tourists’ perception about the water quality in the last ten years matches that of the locals’ perception, in that it increased from moderate to severe. The government programs, such as Namami Ganage, are not dealing with pollution effectively. Despite the 59% that either agree or strongly agree with these programs and strategies, they appear to be failing, despite 59% of tourist thinking that they are working effectively. A high percentage (56%) of tourists (Figure 16b) think that the Ganges in Kanpur is polluted, almost matching the perception of the locals, at 61%. Clearly, a majority of both locals and tourists perceive the Ganges in Kanpur as being polluted, but they do not feel affected by it. It is likely that the Ganges water is not used by those who responded to our survey.
4.5. Pollution of the Ganges in Varanasi
Varanasi is the most sacred city for the Hindus in India and a very ancient one, visited by thousands of pilgrims and tourists from all over India and the world. Varanasi is politically represented by a prominent leader, likely influencing the responses to our survey, which was generated from a variety of communities with diverse opinions. Only 31% of locals (Figure 17a) think that the Ganges is polluted, even though our findings have confirmed that it is significantly polluted. Despite this, 37% of locals perceive the river as not polluted. A significantly smaller percentage (7%) of the local population strongly agree that they are affected by pollution. This suggests that the majority of people are hesitant to acknowledge being affected by pollution, possibly due to political and associated or other influences. When asked about the effectiveness of the government’s Namami Gange program, just 8% disagreed that the program was effective, whilst 73% agreed or strongly agreed that the program has been a success. When locals were asked about the extent of pollution in the last ten years, very much like in other places, in Varanasi, few perceived the pollution to have decreased, rather, 82% considered it to have increased, from slight to severe. We conclude that either the discharge of pollutants into the Ganges continued during the lock-down or negative perceptions were reinforced by the dumping of hundreds of human corpses into the river during the second wave of the pandemic, in addition to the hundreds of mass cremations on the banks of the Ganges in Varanasi.
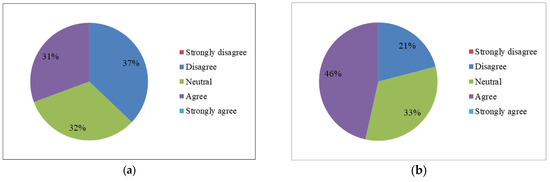
Figure 17.
(a) Varanasi: Local’s perception of river pollution. (b) Varanasi: Tourist’s perception of the effect of the Ganges River water on humans.
Contrary to local perception, a greater number of tourists (46%) perceive the Ganges as being polluted (Figure 17b). However, only a slightly larger number of tourists (19%) are affected, whereas just 7% of locals consider themselves to be. Whilst locals do not use the Ganges’ water for their domestic needs, many tourists bottle and carry Ganga-jal back home as a souvenir and want clean, unpolluted water.
5. Discussion
Over the past 50 years, water quality has generally improved, particularly in upper-income countries, mainly due to enhanced monitoring, treatment technologies, and stricter local and national regulatory frameworks. Key legislative measures contributing to this progress include the EU Water Framework Directive, the US Clean Water Act, China’s Water Pollution Control Law, and Ghana’s National Water Policy [74]. Many rivers have significant ecological, cultural, and agricultural value. In a similar way, the Ganges River holds immense cultural, religious, and socio-economic significance. It is the focal point of Hindu pilgrimages and hosts important events, such as mass gatherings (khumbamela), death ceremonies, and holy dips. The Ganges Basin is home to over 450 million people, residing in approximately 1949 cities and towns [75]. The region faces high demand for natural resources, particularly water for domestic and irrigation purposes. To address these needs, numerous irrigation canals and barrages have been constructed along the Ganges and its tributaries. Additionally, the river supports livelihoods through activities such as fishing, boat tourism, selling sacred water, and small-scale businesses. The pollution of a wide range of environments and ecosystems in developing countries, exemplified by the Ganges River catchment, is reaching critical levels. The presence of fecal waste, pesticides, and heavy metal pollution has led to the failure of numerous pollution control efforts [76,77]. The main issue stems from the inability to control the discharge of general and industrial waste into the Ganges. Both industries and the public are ignoring government legislation and discharge volumes, directly impacting the physical environment and the social, cultural, and religious significance of the Ganges.
5.1. Overview of Bio-Physical Vulnerability of the River Ganges
There are several factors that generate physical riverine vulnerability, such as mass religious gatherings. Kumbh Mela, a significant Hindu religious festival and one of the world’s largest, result in a substantial amount of waste, including fecal matter, that ultimately contaminates the river [78,79]. This leads to elevated levels of coliform bacteria, ammonia, BOD, and turbidity [80]. The most recent Kumbh Mela, held in 2013, lasted over 50 days and drew nearly 120 million participants [81]. Khant et al. [82] assessed the water quality of the Jamuna River in Bangladesh at five locations. Their findings, similar to ours, have revealed that levels of dissolved oxygen (DO), pH, turbidity, ammonia, nitrate, sulfate, chloride, calcium, biological oxygen demand (BOD5), chemical oxygen demand (COD), and temperature surpassed the permissible limits across both seasons. Wang et al. (2024) [83] conducted a critical analysis of global water pollution, revealing that it significantly exacerbates water scarcity in more than 2000 sub-basins around the world. These findings underscore the need for immediate action to address the intertwined issues of water quality and availability.
The observed results of this study reveal that water quality is deteriorating continuously from upstream of Rishikesh to downstream of Varanasi, showing the significant influence of municipal and industrial wastewater, which is continuously mixing with the river water. Another factor associated with water quality deterioration is observed during the impounding of water (barrages), the diversion of water to canals, and major effluent joining through drains, such as at Haridwar D/S (Jagjitpur STP) and Varanasi D/S (Varuna River). By assessing the results of the testing against prescribed government standards, we have determined that the river water is not fit for human consumption at any of the four cities without conventional treatment. We also conclude that the river water is unfit for bathing at all of the locations, except upstream of Rishikesh.
5.2. Social Perception: Combined Data Synthesis
In this study, we observed that the majority of those who responded associated Ganges water with religious observance, such as prayer, bathing for purification, or to immerse the ashes and bones of their dead family members so that they can attain salvation. When the perceptions of all respondents from the four cities are consolidated, almost 50% of people agreed that the Ganges River is polluted. A total of 74% perceived the pollution in the Ganges to have increased from slight to severe, which means that the water quality has deteriorated over the last decade.
As per the observation, pollution seems to be increasing, although 65% of those questioned believe that the Government’s Namami Ganges program will help to clean the River Ganges by 2024. A total of 17% of participants think that strict rules should be implemented, and another 17% suggested that a heavy penalty should be charged for littering on the banks or in the Ganges River and wastewater should be released only after adequate treatment. A ban on the construction of new dams was also suggested to allow the Ganges to flow freely. It was also suggested by 18% of participants that people should take the responsibility to maintain a clean and healthy River Ganges (Figure 18).
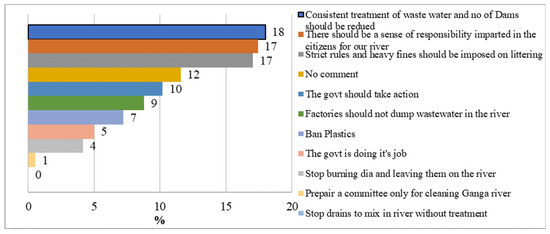
Figure 18.
People’s perception of intervention should be investigated to clean the Ganges River.
5.3. Comparison of Physical and Social Vulnerability Results
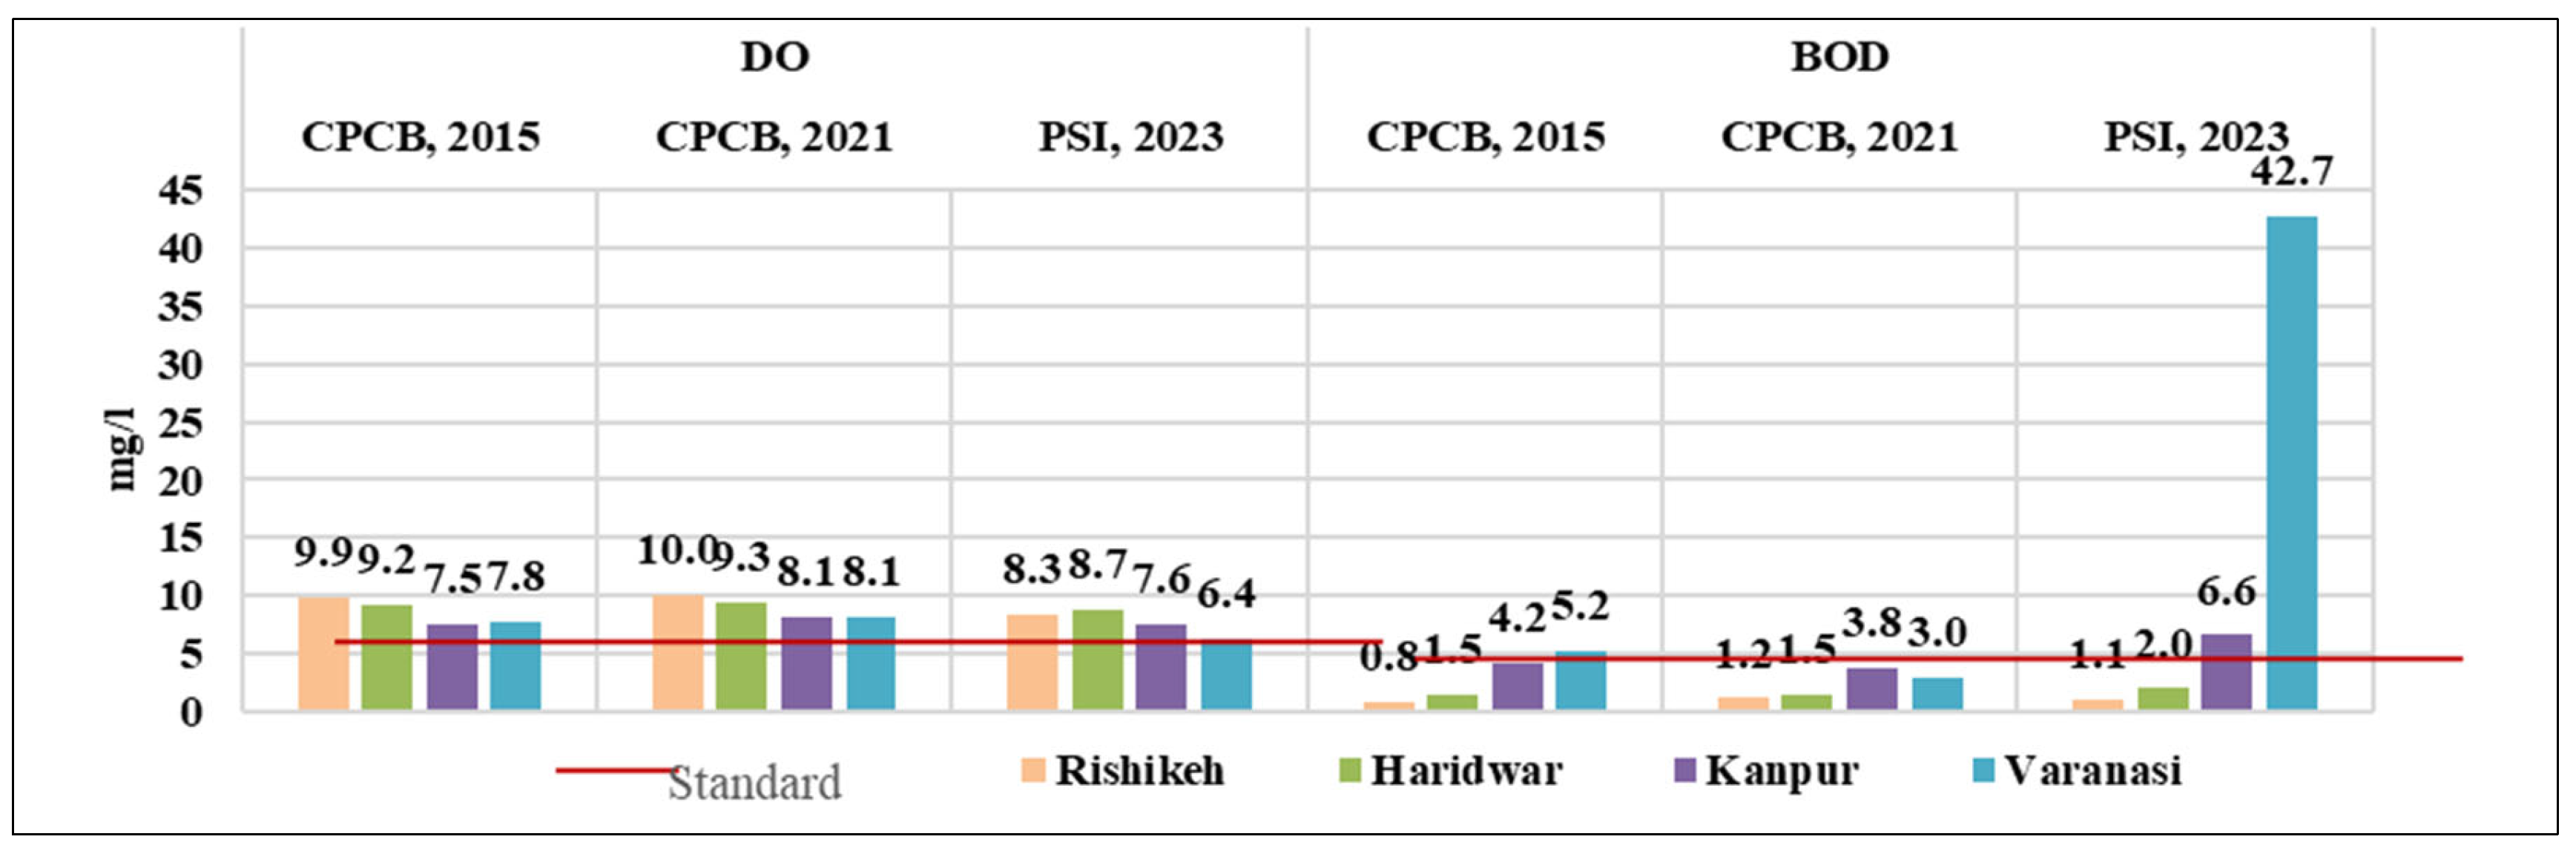
We compared the water quality results of the CPCB (Central pollution control board, India) from 2015, 2021, and the current water quality results of the Ganga River. The observed results of this study have revealed that water quality is deteriorating continuously from upstream of Rishikesh to downstream of Varanasi, showing the significant influence of municipal and industrial wastewater, which is continuously mixing with river water. In the context of DO and BOD, there was no significant change in Rishikesh or Haridwar from 2015 to 2023 (Figure 19). When the observed results of 2021 and 2023 were compared, it was observed that DO was decreasing and BOD was increasing, however, average DO was within the limit at all stations. Similarly, total coliform and Fecal coliform data were also compared, finding that total coliform and fecal coliform counts continuously increased from 2015 to 2023 in Rishikesh, but in Kanpur they decreased (Figure 20) due to a variety of reasons. The rise in cultural activities in Rukesh marked by large public gatherings, the construction of cultural venues, and a significant uptick in tourism clearly increases the region’s vulnerability to bio-physical risks. This surge in cultural engagement is not merely a trend. It fundamentally heightens the area’s exposure to natural hazards and exacerbates its sensitivity to environmental degradation. Also, it may be due to tapping and diverting the main drain of Kanpur, named Sisamau Nala, to Binganva sewage treatment plant. After treatment, the outlet discharges water into the Pandu River, a small tributary of the Ganges, which confluences with the Ganges River around 60 km downstream of Kanpur. When 2023 data were compared with 2021 data, it was observed that total coliform and fecal coliform are increasing at all locations except Kanpur. Overall, the results reveal that physical water quality is deteriorating, and social perception is tracking this change, i.e., observers perceive this increase in pollution. In Varanasi, total dissolved solids (TDS) are unequivocally rising, especially in the downstream areas of the city. The most alarming concentrations occur where the Varuna River merges with the Ganges. This situation is directly linked to the Varuna River receiving substantial amounts of wastewater, both treated and untreated sewage, as well as industrial effluents from Varanasi. The continuous discharge of these pollutants is severely compromising the water quality in the downstream stretch of the river and poses serious threats to public health and the environment.

Figure 19.
Comparison of observed data of DO and BOD with CPCB data.
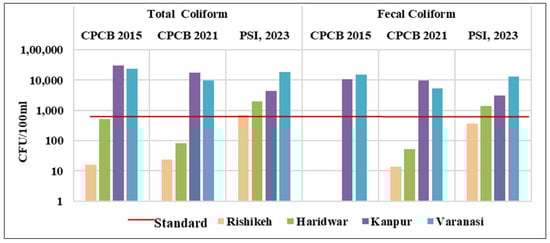
Figure 20.
Comparison of observed data of total and fecal coliform with CPCB data.
While the correlation between bio-physical and social results is evident, some community groups still struggle to provide clear answers, despite being well aware of the pollution affecting the Ganges. This disparity highlights the complexities surrounding the issue and emphasizes the need for deeper engagement with these communities to fully understand their perspectives.
6. Recommendations
The following recommendations are proposed to reduce river pollution and further enhance community health:
- Submission of a Policy Briefing (workbook) with the purpose of educating and influencing national and regional policy and decision makers;
- Work with communities to educate and raise awareness of behaviors and practices that will improve water quality in the river, such as the promotion of good sanitation;
- Work with and encourage local communities to become citizen scientists, involved in the River Ganges cleaning program;
- Set achievement targets for cultural programs over specific time periods (e.g., 5–10 years);
- Install signboards near Ganga ghats to display live water quality information;
- Implement a ban on the release of industrial effluents directly into the river;
- Arrange a green corridor along the riverfront;
- Enforce significant penalties for breaking rules and regulations and improve enforcement;
- Implement a water quality monitoring program;
- Promote the Namami Gange program through various channels, including public, private, and NGOs;
- Regularly conduct camps and training programs on water pollution and river water quality;
- Provide more detailed information on culture and water quality to national and international tourists;
- Regulate and strictly prohibit river water contamination at all levels;
- Promote sustainable sea waste disposal facilitates at village levels;
- Invest in operation research to understand river water pollution and water quality management.
7. Scope for Future Research
In our future research, we will expand our study to include additional areas and increase our sample size. Taking a transdisciplinary approach, we aim to gain a comprehensive understanding of how river water quality impacts human health. Our goal is to promote community-based research to actively involve people in enhancing river health. We are committed to involving a wide range of participants in promoting and monitoring river water quality. By analyzing 30 years of time series data using AI, we will predict pollution trends in the River Ganges for the next 30 years. This will enable us to implement effective prevention methods, increase water usability and reusability, and prevent acute water shortages. Our future surveys aim to reach 5000 to 8000 participants, ensuring that diverse perspectives are represented and providing robust recommendations to the government. Additionally, our future research will involve a more diverse range of stakeholders, including local and national policymakers, and include the perceptions of tourists and those who work in the tourism economy.
8. Conclusions
This study used a combination of physical attributes, chemical and biological parameters, and a social science survey method to apprise the River Ganges’ Bio-physical and social vulnerability at four locations. Novel insights from this study show that River Ganges pollution shows increasing trends due to the ongoing release of industrial, domestic, and human waste into the river. The average value for all four cities, when comparing upstream and downstream samples, confirm that pollution levels increase when the River Ganges passes through a city. The pollution is very high in Varanasi, among all of those stations. The bio-physical and chemical tests concluded that the River Ganges water is not suitable for drinking or bathing without treatment. Our social survey concluded that 50% of those questioned perceived the River Ganges to be polluted, and 74% of people stated that the level of pollution has increased from slight to severe. A considerable percentage of the respondents perceived the government’s program, “Namami Ganges,” as being effective in mitigating river pollution, despite evidence to the contrary. This study also emphasizes that a significant portion of surveyed communities expressed that reducing the pollution is everyone’s responsibility, and not solely the responsibility of the government. The insights from this research will assist the local and national policy decision makers to improve the river’s health by implementing new strategies and involving citizens from river communities as both participants and citizen researchers. This study also highlights the urgency of addressing the critical environmental issue and suggests that a multifaceted approach involving both government initiatives and community involvement is necessary to mitigate pollution and improve the river’s health.
Author Contributions
Conceptualization: K.K. Data Curation, Formal Analysis, and Investigation: I.A., A.G. and D.S. Methodology: K.K., J.W., S.P., I.A. and A.G. Visualization: I.A., A.G., and D.S. Writing an Original Draft: K.K. Editing and Reviewing: J.W., K.K. and S.P. Validation: K.K., S.P., J.W. and D.S. Supervision and Project Administration: K.K. and D.S. All authors have read and agreed to the published version of the manuscript.
Funding
We thank the Centre for Sustainable Transitions at the University of Central Lancashire (UCLan) for providing a grant to support this research.
Institutional Review Board Statement
This study was ethically approved by University of Central Lancashire (UCLan) Science Ethics Review Panel on 22nd October 2022 (REF: SCIENCE 0204). All data collection and methods were conducted in accordance with the University of Central Lancashire (UCLan) guidelines and regulations.
Data Availability Statement
Certain level of data will be available from the corresponding author upon reasonable request.
Conflicts of Interest
The authors declare no conflict of interest.
References
- Paul, D. Research on heavy metal pollution of river Ganga: A review. Ann. Agrar. Sci. 2017, 15, 278–286. [Google Scholar] [CrossRef]
- Kumar, N. 3Ps (population, poverty and pollution) and the pious poor Ganga. In Our National River Ganga: Lifeline Millions; Springer: Berlin/Heidelberg, Germany, 2014; pp. 307–319. [Google Scholar]
- Wang, J.; Liu, X.; Lu, J. Urban river pollution control and remediation. Procedia Environ. Sci. 2012, 13, 1856–1862. [Google Scholar] [CrossRef]
- Agarwal, A.K.; Rajwar, G.S. Physico-chemical and microbiological study of Tehri dam reservoir, Garhwal Himalaya, India. J. Am. Sci. 2010, 6, 65–71. [Google Scholar]
- Gaur, S. An updated review on quantitative and qualitative analysis of water pollution in west flowing Tapi River of Gujarat, India. In Environmental Pollution: Select Proceedings of ICWEES-2016; Springer: Berlin/Heidelberg, Germany, 2018; pp. 525–547. [Google Scholar]
- Mariya, A.; Kumar, C.; Masood, M.; Kumar, N. The pristine nature of river Ganges: Its qualitative deterioration and suggestive restoration strategies. Environ. Monit. Assess. 2019, 191, 542. [Google Scholar] [CrossRef]
- Dutta, A.; Karmakar, S.; Das, S.; Banerjee, M.; Ray, R.; Hasher, F.F.B.; Mishra, V.N.; Zhran, M. Modeling the River Health and Environmental Scenario of the Decaying Saraswati River, West Bengal, India, Using Advanced Remote Sensing and GIS. Water 2025, 17, 965. [Google Scholar] [CrossRef]
- Singh, N.; Tung, S. Assessment of Water Quality of Gomti River at Lucknow. Air Soil Water Res. 2025, 18, 11786221251328589. [Google Scholar] [CrossRef]
- Sanad, H.; Moussadek, R.; Mouhir, L.; Lhaj, M.O.; Dakak, H.; Zouahri, A. Geospatial analysis of trace metal pollution and ecological risks in river sediments from agrochemical sources in Morocco’s Sebou basin. Sci. Rep. 2025, 15, 16701. [Google Scholar] [CrossRef]
- Best, J. Anthropogenic stresses on the world’s big rivers. Nat. Geosci. 2019, 12, 7–21. [Google Scholar] [CrossRef]
- Xu, L.; Mao, Q.; Li, C.; Tu, B.; Li, X. Natural factors outweigh anthropogenic impact on aquatic phoD-harboring communities along Yangtze River basin. Ecol. Indic. 2025, 170, 112995. [Google Scholar] [CrossRef]
- Assie, A.F.; Arimoro, F.O.; Nantege, D.; Ndatimana, G.; Action, S.; Keke, U.N.; Ayanwale, A.V.; Edia, E.O. Exploring macroinvertebrate traits along anthropogenic disturbed gradient in West African Savanna River systems: A case study of Niger state, North central region of Nigeria. Biologia 2025, 80, 853–875. [Google Scholar] [CrossRef]
- Liu, L.; Liu, D.; Johnson, D.M.; Yi, Z.; Huang, Y. Effects of vertical mixing on phytoplankton blooms in Xiangxi Bay of Three Gorges Reservoir: Implications for management. Water Res. 2012, 46, 2121–2130. [Google Scholar] [CrossRef] [PubMed]
- Gao, Q.; Li, Y.; Cheng, Q.; Yu, M.; Hu, B.; Wang, Z.; Yu, Z. Analysis and assessment of the nutrients, biochemical indexes and heavy metals in the Three Gorges Reservoir, China, from 2008 to 2013. Water Res. 2016, 92, 262–274. [Google Scholar] [CrossRef] [PubMed]
- Ahmed, A.S.; Hossain, M.B.; Babu, S.O.F.; Rahman, M.M.; Sarker, M.S.I. Human health risk assessment of heavy metals in water from the subtropical river, Gomti, Bangladesh. Environ. Nanotechnol. Monit. Manag. 2021, 15, 100416. [Google Scholar]
- Lin, L.; Yang, H.; Xu, X. Effects of water pollution on human health and disease heterogeneity: A review. Front. Environ. Sci. 2022, 10, 880246. [Google Scholar] [CrossRef]
- Wasewar, K.L.; Singh, S.; Kansal, S.K. Process intensification of treatment of inorganic water pollutants. In Inorganic Pollutants in Water; Elsevier: Amsterdam, The Netherlands, 2020; pp. 245–271. [Google Scholar]
- Liosis, C.; Papadopoulou, A.; Karvelas, E.; Karakasidis, T.E.; Sarris, I.E. Heavy metal adsorption using magnetic nanoparticles for water purification: A critical review. Materials 2021, 14, 7500. [Google Scholar] [CrossRef]
- Kumar, A.; Sidharth, S.; Kandasubramanian, B. A review on algal biosorbents for heavy metal remediation with different adsorption isotherm models. Environ. Sci. Pollut. Res. 2023, 30, 39474–39493. [Google Scholar] [CrossRef]
- Dutta, V.; Dubey, D.; Kumar, S. Cleaning the River Ganga: Impact of lockdown on water quality and future implications on river rejuvenation strategies. Sci. Total Environ. 2020, 743, 140756. [Google Scholar] [CrossRef]
- Sarkar, S.K.; Saha, M.; Takada, H.; Bhattacharya, A.; Mishra, P.; Bhattacharya, B. Water quality management in the lower stretch of the river Ganges, east coast of India: An approach through environmental education. J. Clean. Prod. 2007, 15, 1559–1567. [Google Scholar] [CrossRef]
- Das, P.; Tamminga, K.R. The Ganges and the GAP: An assessment of efforts to clean a sacred river. Sustainability 2012, 4, 1647–1668. [Google Scholar] [CrossRef]
- Dwivedi, S.; Mishra, S.; Tripathi, R.D. Ganga water pollution: A potential health threat to inhabitants of Ganga basin. Environ. Int. 2018, 117, 327–338. [Google Scholar] [CrossRef]
- Markandya, A.; Murty, M.N. Cleaning-Up the Ganges: A Cost-Benefit Analysis of the Ganga Action Plan; Oxford University Press: New York, NY, USA, 2000. [Google Scholar]
- Tripathi, B.D. Ganges superbugs are threat to world health, in Future OF Water 2016, RACONTEUR. Available online: https://www.raconteur.net/future-of-water-2016/ganges-superbugs-are-threat-to-world-health (accessed on 24 June 2025).
- Roy, M.; Shamim, F. Research on the impact of industrial pollution on River Ganga: A Review. Int. J. Prev. Control Ind. Pollut. 2020, 6, 43–51. [Google Scholar]
- Haque, M.M.; Niloy, N.M.; Nayna, O.K.; Fatema, K.J.; Quraishi, S.B.; Park, J.-H.; Kim, K.-W.; Tareq, S.M. Variability of water quality and metal pollution index in the Ganges River, Bangladesh. Environ. Sci. Pollut. Res. 2020, 27, 42582–42599. [Google Scholar] [CrossRef] [PubMed]
- Manganye, B. Evaluation of Water Quality in Surface Water Bodies near Industrial Areas in the East Rand, Gauteng, South Africa; University of Johannesburg: Johannesburg, South Africa, 2020. [Google Scholar]
- Aggarwal, M.; Anbukumar, S.; Vijaya Kumar, T. Assessment of pollution risks posed by trace elements in the riverbed sediment of the Ganges River in Eastern Uttar Pradesh, India. Water Supply 2025, 25, 628–646. [Google Scholar] [CrossRef]
- Sulaiman, M.A.; Kumari, A. Unveiling the rising threat of cadmium pollution and alarming health risks associated with the consumption of 15 commercially important fish species in the middle stretch of River Ganga, at Patna, India. Biol. Trace Elem. Res. 2025, 203, 422–441. [Google Scholar] [CrossRef]
- De, D. Public perception regarding pollution of the river Ganga: Case study at Dakhineswar. Int. J. Res. Soc. Sci. 2018, 8, 449–463. [Google Scholar]
- Basu Roy, S. Ganga Action Plan (GAP): The Challenge of ‘Regulatory Quality’. 2017. Available online: https://mpra.ub.uni-muenchen.de/81148/1/MPRA_paper_81148.pdf (accessed on 24 June 2025).
- Tare, V.; Bose, P.; Gupta, S.K. Suggestions for a modified approach towards implementation and assessment of Ganga action plan and other similar river action plans in India. Water Qual. Res. J. 2003, 38, 607–626. [Google Scholar] [CrossRef]
- Mathur, A. Namami Gange Scheme—A Success or mere propaganda? GLS Law J. 2020, 2, 54–64. [Google Scholar] [CrossRef]
- Balkrishna, A.; Singh, S.K.; Pathak, R.; Arya, V. Namami Gange: An Opinion based framework and possible resolution. Authorea 2022. [Google Scholar] [CrossRef]
- Sharma, S.; Agrawal, M. The river Ganga and its pollution-tourists’ perception visiting Ghats of Varanasi. Turizam 2021, 25, 55–71. [Google Scholar] [CrossRef]
- Wohl, E. Connectivity in rivers. Prog. Phys. Geogr. 2017, 41, 345–362. [Google Scholar] [CrossRef]
- Blaikie, P.; Cannon, T.; Davis, I.; Wisner, B. At Risk: Natural Hazards, People’s Vulnerability and Disasters; Routledge: Milton Park, UK, 2014. [Google Scholar]
- Chen, W.; Cutter, S.L.; Emrich, C.T.; Shi, P. Measuring social vulnerability to natural hazards in the Yangtze River Delta region, China. Int. J. Disaster Risk Sci. 2013, 4, 169–181. [Google Scholar] [CrossRef]
- Cutter, S.L.; Boruff, B.J.; Shirley, W.L. Social vulnerability to environmental hazards. Soc. Sci. Q. 2003, 84, 242–261. [Google Scholar] [CrossRef]
- Li, Y.; Zhou, Q.; Ren, B.; Luo, J.; Yuan, J.; Ding, X.; Bian, H.; Yao, X. Trends and health risks of dissolved heavy metal pollution in global river and lake water from 1970 to 2017. In Reviews of Environmental Contamination and Toxicology; Springer: Berlin/Heidelberg, Germany, 2020; Volume 251, pp. 1–24. [Google Scholar]
- Meybeck, M.; Helmer, R. The quality of rivers: From pristine stage to global pollution. Palaeogeogr. Palaeoclimatol. Palaeoecol. 1989, 75, 283–309. [Google Scholar] [CrossRef]
- Niu, Y.; Chen, F.; Li, Y.; Ren, B. Trends and sources of heavy metal pollution in global river and lake sediments from 1970 to 2018. In Reviews of Environmental Contamination and Toxicology; Springer: Berlin/Heidelberg, Germany,, 2021; Volume 257, pp. 1–35. [Google Scholar]
- Munafo, M.; Cecchi, G.; Baiocco, F.; Mancini, L. River pollution from non-point sources: A new simplified method of assessment. J. Environ. Manag. 2005, 77, 93–98. [Google Scholar] [CrossRef]
- He, B.; Kanae, S.; Oki, T.; Hirabayashi, Y.; Yamashiki, Y.; Takara, K. Assessment of global nitrogen pollution in rivers using an integrated biogeochemical modeling framework. Water Res. 2011, 45, 2573–2586. [Google Scholar] [CrossRef]
- Beusen, A.; Dekkers, A.; Bouwman, A.; Ludwig, W.; Harrison, J. Estimation of global river transport of sediments and associated particulate C, N, and P. Glob. Biogeochem. Cycles 2005, 19, GB4S05. [Google Scholar] [CrossRef]
- van Vliet, M.T.; Franssen, W.H.; Yearsley, J.R.; Ludwig, F.; Haddeland, I.; Lettenmaier, D.P.; Kabat, P. Global river discharge and water temperature under climate change. Glob. Environ. Change 2013, 23, 450–464. [Google Scholar] [CrossRef]
- Mani, T.; Hauk, A.; Walter, U.; Burkhardt-Holm, P. Microplastics profile along the Rhine River. Sci. Rep. 2015, 5, 17988. [Google Scholar] [CrossRef]
- Xie, Q.; Ren, B. Pollution and risk assessment of heavy metals in rivers in the antimony capital of Xikuangshan. Sci. Rep. 2022, 12, 14393. [Google Scholar] [CrossRef]
- Mateo-Sagasta, J.; Zadeh, S.M.; Turral, H.; Burke, J. Water Pollution from Agriculture: A Global Review. Executive Summary; FAO: Rome, Italy, 2017. [Google Scholar]
- Nriagu, J.O. Global metal pollution: Poisoning the biosphere? Environ. Sci. Policy Sustain. Dev. 1990, 32, 7–33. [Google Scholar] [CrossRef]
- Chaudhary, M.; Walker, T.R. River Ganga pollution: Causes and failed management plans (correspondence on Dwivedi et al. 2018. Ganga water pollution: A potential health threat to inhabitants of Ganga basin. Environment International 117, 327–338). Environ. Int. 2019, 126, 202–206. [Google Scholar] [CrossRef] [PubMed]
- Matta, G. A study on physico-chemical Characteristics to assess the pollution status of river Ganga in Uttarakhand. J. Chem. Pharm. Sci. 2014, 7, 210–217. [Google Scholar]
- Chaudhary, M.; Mishra, S.; Kumar, A. Estimation of water pollution and probability of health risk due to imbalanced nutrients in River Ganga, India. Int. J. River Basin Manag. 2017, 15, 53–60. [Google Scholar] [CrossRef]
- Rai, P.; Mishra, A.; Tripathi, B. Heavy metal and microbial pollution of the River Ganga: A case study of water quality at Varanasi. Aquat. Ecosyst. Health Manag. 2010, 13, 352–361. [Google Scholar] [CrossRef]
- Khanna, D.; Bhutiani, R.; Kulkarni, D.B. A study on pollution status and its impact on water quality of River Ganga at Haridwar. Environ. Conserv. J. 2011, 12, 9–15. [Google Scholar] [CrossRef]
- Government of India. Census Data—Districts of Uttar Pradesh. 2011. Available online: https://www.census2011.co.in/census/state/districtlist/uttar+pradesh.html (accessed on 3 March 2022).
- Government of India. Census Data -Districts of Uttarakhand. 2011. 2011. Available online: https://www.census2011.co.in/census/state/districtlist/uttarakhand.html (accessed on 3 March 2022).
- Government of India. Census Data—2011-Rishikesh Population Census 2011–2024. 2011. Available online: https://www.census2011.co.in/census/metropolitan/30-rishikesh.html (accessed on 3 March 2022).
- Government of India. Census Data—2011-Haridwar District—Population 2011–2024. 2011. Available online: https://www.census2011.co.in/census/district/586-haridwar.html (accessed on 3 February 2023).
- Government of India. Census Data—2011-Districts of Uttar Pradesh. 2011. Available online: https://www.census2011.co.in/census/district/535-kanpur-nagar.html (accessed on 2 January 2023).
- Thareja, S.; Choudhury, S.; Trivedi, P. Assessment of water quality of Ganga River in Kanpur by using principal components analysis. Adv. Appl. Sci. Res. 2011, 2, 84–91. [Google Scholar]
- Bhatnagar, S.; Sharma, A.; Kumar, A. Impact assessment of ground water quality at Varanasi, Uttar Pradesh. Int. J. Environ. Rehabil. Conserv. 2021, 12, 1–9. [Google Scholar]
- Singh, Y.; Bharteey, P.K.; Singh, K.; Borah, S.R.; Kumar, A.; Pal, S.; Barla, F.X. Assessment of Water Quality in Ganga River Ghats of Varanasi District, Uttar Pradesh, India. Int. J. Environ. Clim. Change 2023, 13, 231–239. [Google Scholar] [CrossRef]
- Census. Varanasi Population. 2024. Available online: https://indiagraphy.com/uttar-pradesh/varanasi.html (accessed on 15 April 2023).
- Rai, P.K.; Mohan, K. Remote sensing data & GIS for flood risk zonation mapping in Varanasi District, India. Forum Geogr. 2014, 13, 25–33. [Google Scholar]
- World Health Organisation (WHO). 9 out of 10 People Worldwide Breathe Polluted Air, But More Countries Are Taking Action. 2018. Available online: https://www.who.int/news/item/02-05-2018-9-out-of-10-people-worldwide-breathe-polluted-air-but-more-countries-are-taking-action (accessed on 16 April 2023).
- Basak, S.; Sarkar, A.; Ghosh, R.; Chaudhuri, A. Ghats of Varanasi—An emerging centre of pollution. IOSR J. Humanit. Soc. Sci. 2015, 20, 19–24. [Google Scholar]
- Rana, P.S. Pilgrimage Tourism: A Study of Varanasi; SRME Publishers: Sagar, MP, India, 2014. [Google Scholar]
- Singh, R.P. Varanasi, the Heritage Capital of India: Valuing the Sacredscapes. In Proceedings of the International Seminar on Indian Art Heritage in a Changing World: Challenges and Prospects, Varanasi, India, 27 February–1 March 2017. [Google Scholar]
- Central Pollution Control Board. India. Guidelines for Water Quality Monitoring. 2024. Available online: https://cpcb.nic.in/openpdffile.php?id=UmVwb3J0RmlsZXMvTmV3SXRlbV8xMTZfR3VpZGVsaW5lc29mIHdhdGVycXVhbGl0eW1vbml0b3JpbmdfMzEuMDcuMDgucGRm (accessed on 11 January 2024).
- IS 2296-1982; Indian Standard for Surface Water Prescribed by Bureau of Indian Standards. Central Water Commission: New Delhi, India, 2024.
- Adjovu, G.E.; Stephen, H.; James, D.; Ahmad, S. Measurement of Total Dissolved Solids and Total Suspended Solids in Water Systems: A Review of the Issues, Conventional, and Remote Sensing Techniques. Remote Sens. 2023, 15, 3534. [Google Scholar] [CrossRef]
- Hannah, D.M.; Abbott, B.W.; Khamis, K.; Kelleher, C.; Lynch, I.; Krause, S.; Ward, A.S. Illuminating the ‘invisible water crisis’ to address global water pollution challenges. Hydrol. Process. 2022, 36. [Google Scholar] [CrossRef]
- Kumar, D. River Ganges–Historical, cultural and socioeconomic attributes. Aquat. Ecosyst. Health Manag. 2017, 20, 8–20. [Google Scholar] [CrossRef]
- Leaf-Nosed Bat. Encyclopædia Britannica. 2009. Available online: https://www.britannica.com/animal/leaf-nosed-bat (accessed on 11 January 2024).
- Tripathi, B.; Tripathi, S. Issues and challenges of river Ganga. In Our National River Ganga: Lifeline of Millions; Springer: Berlin/Heidelberg, Germany, 2014; pp. 211–221. [Google Scholar]
- Singh, S.; Rai, J. Pollution studies on river Ganga in Allahabad district. Pollut. Res. 2003, 22, 469–472. [Google Scholar]
- Ramesh, P. Sacred Yet Polluted: Ganges Pollution During Mahakumbh 2025. Indian J. Integr. Res. Law 2025, 5, 13. [Google Scholar]
- Mishra, A. Assessment of water quality using principal component analysis: A case study of the river Ganges. J. Water Chem. Technol. 2010, 32, 227–234. [Google Scholar] [CrossRef]
- Vortmann, M.; Balsari, S.; Holman, S.R.; Greenough, P.G. Water, sanitation, and hygiene at the world’s largest mass gathering. Curr. Infect. Dis. Rep. 2015, 17, 5. [Google Scholar] [CrossRef]
- Khan, M.H.R.B.; Ahsan, A.; Imteaz, M.; Shafiquzzaman, M.; Al-Ansari, N. Evaluation of the surface water quality using global water quality index (WQI) models: Perspective of river water pollution. Sci. Rep. 2023, 13, 20454. [Google Scholar] [CrossRef]
- Wang, M.; Bodirsky, B.L.; Rijneveld, R.; Beier, F.; Bak, M.P.; Batool, M.; Droppers, B.; Popp, A.; van Vliet, M.T.; Strokal, M. A triple increase in global river basins with water scarcity due to future pollution. Nat. Commun. 2024, 15, 880. [Google Scholar] [CrossRef]


Disclaimer/Publisher’s Note: The statements, opinions and data contained in all publications are solely those of the individual author(s) and contributor(s) and not of MDPI and/or the editor(s). MDPI and/or the editor(s) disclaim responsibility for any injury to people or property resulting from any ideas, methods, instructions or products referred to in the content. |
© 2025 by the authors. Licensee MDPI, Basel, Switzerland. This article is an open access article distributed under the terms and conditions of the Creative Commons Attribution (CC BY) license (https://creativecommons.org/licenses/by/4.0/).