1. Introduction
Anthropogenic activities are affecting the Earth’s atmosphere, leading to global climate change [
1]. Hydrological catchment systems are currently facing increasing challenges associated with climate change, marked by shifts in precipitation patterns and runoff dynamics [
2]. Medium- and long-term hydrological forecasts are crucial for the planning, management, and sustainable use of water resources [
3]. Quantifying the impacts of climate change on river flow is essential for future water development and dealing with potential risks [
4], particularly the expected effects on drought frequency, duration, and severity [
5]. However, anticipating these impacts on hydrological processes in ungauged or poorly monitored catchments remains a delicate and uncertain task due to limited hydrometeorological data and high spatial variability [
6].
Impact assessments are particularly important for the Mediterranean region, which is considered a hot spot of climate change [
7] and characterized by declining water resources due to decreased precipitation and increased temperatures [
8]. The rate of climate change in this region exceeds the global average, and it will continue to be affected by extreme warmth, drought, and aridity [
9]. One of the main challenges of climate change projections is accurately simulating precipitation characteristics for hydrological applications. While increasing spatial resolution can enhance simulation accuracy, it does not guarantee improvement for all precipitation features. Beyond a certain threshold, model performance relies more on the physical representation of atmospheric processes than on resolution alone [
10,
11]. A very severe impact of climate change is, for instance, expected for Tunisia, which is considered by the World Resources Institute (WRI) to be among the countries exposed to high water stress [
12]. The variability of rainfall and extreme hydrometeorological phenomena in Tunisia increases the risk of droughts and floods [
13] and the need for additional water development to reach appropriate water security levels [
14]. Tunisia, like many regions of North Africa and the Mediterranean, currently faces major challenges due to data scarcity and a sparse hydrometeorological observation network [
15]. Drought monitoring, forecasting, and risk management are therefore of major interest in achieving the Sustainable Development Goals in this region [
16].
Climate change impact assessments of the hydrological system typically follow a modeling chain where an appropriate hydrological model is needed for future flow generation [
17]. Projected hydrological time series must only be provided by a hydrological model that has been properly calibrated and validated under current climate conditions [
18]. Spatially distributed physical-based hydrological models serve to better simulate hydrological processes [
19], but they require extensive input data and numerous parameters, which leads to uncertainty and inefficiency, especially under a fluctuating climate [
20]. In contrast, conceptual models are simpler and require only a time series of observable hydrometeorological data and a limited set of lumped basin-specific parameters, which makes them more efficient in impact assessment studies in data-scarce regions [
21]. The uncertainties in conceptual modeling and the predicted hydrological impacts are mostly related to the parameter and model structure uncertainty [
22]. Usually, hydrological model parameter estimation through calibration is imperative to minimize forecasting uncertainty due to parameter uncertainty [
23]. The research in the field of hydrological forecasting has, however, shifted from considering the climate as stationary to considering it as non-stationary [
24]. The parameter uncertainty associated with conceptual hydrological models, calibrated using long-term hydrometeorological data and considering the climate as stationary, will therefore encompass a model structural uncertainty component due to the non-stationarity of the real climate. Highlighting the need for continued investigation into model robustness under non-stationary conditions due to climate change remains a matter of scientific debate, particularly in data-scarce regions where the scarcity of long-term, high-resolution observational data limits the calibration and validation of climate and hydrological models.
In this research, we propose a simple and effective methodology for dealing with this issue by exploring practical tools and accessible data. We evaluate the predictive performance of a conceptual hydrological model and lump the structural modeling uncertainty due to a non-stationary climate into the parameter uncertainty. Monthly water balance models are very often used for long-term water resource management and planning [
25]. We therefore used in this study the GR2m version of the R package, airGR. The package allows for an easy calibration and assessment of modeling performance [
26]. The GR2m model is often used to assess rainfall–runoff modeling in the context of hydroclimatic variability and climatic changes [
27]. To evaluate the effect of the non-stationarity of the climate on hydrological parameter quality and model performance, stationary periods were defined from long-term hydrometeorological observations. The Pettitt break test and the Standardized Precipitation Index (SPI) were used to define stationary wet and dry periods. A cross-calibration and cross-validation method was used to find the best set of parameters to simulate the hydrological process under stationary and non-stationary climatic conditions. Then, climate projections were used to simulate projected flow using the GR2m model. The climate projections encompassed projections of rainfall and temperature according to the Representative Concentration Pathways scenarios RCP 4.5 and RCP 8.5, with the global climate model MIROC5 to the horizon 2100. Finally, standardized climate indices (SCIs) were calculated over the historical and projected periods to forecast drought phenomena and assess their potential future impacts on water resource availability and variability. This approach was applied to three subcatchments that are representative of the hydrological variability and water regime within Tunisia’s largest and most strategic hydrosystem, the Medjerda catchment. This study makes an innovative and practical contribution to the climate change impact studies on water resources in data-scarce regions. One of the main novelties of this work is the use of observed and projected hydrometeorological data, calibrated by cross-validation on stationary wet and dry periods, thus providing a more robust model in a non-stationary climate context. However, to the authors’ knowledge, few studies have calibrated hydrological models using a cross-validation approach based explicitly on observed stationary wet and dry periods, a technique that improves robustness under non-stationary climatic conditions. This approach contrasts with most conventional methods, which apply calibration to entire datasets without distinguishing climate changes, potentially masking model bias under changing conditions. Furthermore, the integration of standardized climate indices (SCIs) into hydrological simulations for drought forecasting remains limited in the existing literature, particularly at the watershed scale in North Africa. This coupling provides a better understanding of the hydrological extremes generated by climate. The novelty of this study also lies in the development of a simple, accessible, and adaptable methodology that can be implemented in data-scarce catchments such as the Medjerda, thus providing a reproducible framework for similar regions facing increased climatic pressures.
2. Materials and Methods
The focus of this methodology, summarized in
Figure 1, was to assess the performance of the GR2m hydrological model through the application of cross-validation on historical datasets representing various climatic conditions. This approach enabled a detailed evaluation of the model’s reliability and adaptability across a range of hydrometeorological contexts, thereby reinforcing the assessment of its robustness. Modeling river flows under varying historical conditions allowed for a critical evaluation of the model’s ability to respond to climatic fluctuations. Once validated, the model was applied to projected climate data to simulate future flows and evaluate the potential evolution of drought risk under climate change scenarios.
2.1. Study Area
The study area was the Medjerda catchment in Tunisia, which represents the largest hydrological system in Tunisia and constitutes a vital component of the national water supply. The catchment contributes approximately 37% of the country’s surface water and 22% of its renewable water resources [
28]. The region is subject to a Mediterranean climate, characterized by hot and dry summers with elevated evapotranspiration rates and recurrent droughts contrasted by short, mild winters, which are frequently the cause of intense precipitation and floods [
29]. The Medjerda catchment is characterized by its topographic variety and the high spatial and temporal rainfall variability. The catchment can be subdivided into four sub-regions with distinct rainfall regimes, considering rainfall gauge location and temporal trends [
13]. In this work, we chose a subcatchment representative of each sub-region (
Figure 2). We considered the subcatchment of the Bou Hertma dam located in the governorate of Jendouba; this subcatchment spans two climatic classes, with portions classified as “Moderately Dry and Humid” and others as “Moderately Dry and Semi-Arid.” The subcatchment of Sarrath is located in the governorate of Le Kef, belonging to the class “Hilly and mountainous”, and the subcatchment of the Siliana dam is located in the governorate of Siliana and belongs to the class of “Medjerda valley”. All selected subcatchments are dammed and are key elements of water resource management for the Medjerda.
The Sarrath is a transboundary subcatchment with an area of 1850 km
2. It is located in the governorates of Le Kef and Kasserine in Tunisia and the Wilaya of Tebessa in Algeria. It has an average annual flow of 26 mm
3 and an average annual rainfall of 430 mm. This subcatchment is characterized by a contrasted climate varying from semi-humid to semi-arid. The climate has a high inter-annual rainfall variability [
30]. The Siliana subcatchment is located in the southeast of the Medjerda catchment and has an area of 1040 km
2. This subcatchment is drained by the Siliana River, which is a main tributary of the right bank of the Medjerda and has been controlled by the Siliana dam since 1987. This reservoir is intended for the irrigation of the Gaafour-Laroussa plains, with an average annual flow of 57.9 mm
3 and an average annual rainfall of 550 mm. This subcatchment is characterized by a rugged relief with steep slopes due to geology, which generally consists of very hard Cretaceous and Eocene geological units. Its pedology consists mainly of fine-textured soils, rich in organic matter and limestone [
31]. The land use in the region of Siliana is dominated by cereals. The subcatchment of Bou Hertma, with an area of 390 km
2, is located in the northwest of the country, 20 km from the city of Jendouba. It is drained by the Bou Hertma River, which is a main tributary of the left bank of the Medjerda. The river flow has been controlled by the Bou Hertma dam since 1976. This reservoir is intended for drinking water supply and irrigation, with an average annual flow of 75.7 mm
3 and an average annual precipitation of 685 mm.
2.2. Database and Processing
A hydrometeorological database was constructed. The monthly flow and precipitation data were collected from the General Directory of Water Resources in Tunisia (DGRE) and the monthly temperature data were obtained from the National Institute of Meteorology in Tunisia (INM) database. Runoff was derived from the hydraulic monitoring of the reservoirs of Bou Hertma and Siliana by the General Directory of Dams and Studies of Hydraulic Structures (DGBGTH). These observations were combined with the hydrometric observations from DGRE.
The choice of stations was based on the appropriate spatial distribution as well as the availability of data for an acceptable duration. The selected stations for each subcatchment area are shown in
Table 1.
Monthly potential evapotranspiration (PET) was calculated from the monthly mean temperature time series by applying the Thornthwaite formula (Equation (1)). The choice of this method was based on the considered time step and availability of data for PET calculations. The efficiency of the Thornthwaite formula was demonstrated by Canceill [
32].
Thornthwaite’s formula is as follows:
where
PET (m): the average PET of month m (m = 1 to 12) [mm];
: the interannual average of monthly temperatures [°C];
;
I: the annual thermal index:
F (m,φ): corrective factor based on month (m) and latitude, which represents the maximum duration of insolation.
The meteorological data were spatialized using Thiessen’s polygon method. This method partitioned each catchment into a set of polygons corresponding to the set of meteorological stations. Subsequently, a spatially homogeneous value for each meteorological variable corresponding to the observed value was assigned to each polygon.
The surfaces of the Thiessen polygons (Equation (4)) allowed for the weighting of the observations for the calculation of the regionalized variable:
where
Z is the regionalized meteorological variable (e.g., regionalized precipitation);
Zi is the local meteorological variable (e.g., local precipitation);
Ai [m
2] is the area of the polygon associated with the polygon,
i; and
[m
2] is the area of the catchment.
2.3. Projected Climate Data
Within the framework of the project “5M—Regional Coordination on Improved Water Resources Management and Capacity Building in Cooperation with NASA” implemented across the Middle East and North Africa (MENA) region, the Regional Center for Remote Sensing of North African States (CRTEAN), in collaboration with the National Institute of Meteorology of Tunisia, has developed high-resolution climate change projections. These projections are intended to support national authorities and experts in understanding regional climate variability and developing adaptation strategies. The project details and outputs are described in a document of the World Bank Report No: ICR00003517 [
33]. Among these projections, the present research used the outputs of the empirical statistical downscaling of the Global Climate Model (GCM) MIROC5 (Model for Interdisciplinary Research on Climate 5) for precipitation and temperature by the year 2100 for both the RCP 4.5 and RCP 8.5 scenarios at the level of three meteorological stations. We thus considered Jendouba, which characterizes the Bou Hertma subcatchment; Le Kef, which characterizes the Sarrath subcatchment; and Siliana, which characterizes the Siliana subcatchment. These projections were developed and validated as part of the project.
2.4. Hydrological Model Génie Rural (GR2m, AirGR Package)
In this research, the conceptual monthly water balance model “Génie Rural à 2 paramètres au pas du temps Mensuel, GR2m” developed by Mouelhi et al. [
34] was used. The GR2m model has proven to be a reliable and efficient conceptual hydrological model for simulating monthly flows and assessing water resource dynamics across various hydrological regimes [
35]. The major advantages of GR2m revolve around low data requirements, simplicity of implementation, high performance, and high accuracy [
36]. This conceptual model is widely considered for assessing climate change impacts in data-scarce regions such as Africa and the southern Mediterranean [
35,
36,
37].
The GR2m is a monthly water balance model developed under different versions, while the Mouelhi et al. [
34] version is the most recent and the most efficient [
25]. It is a lumped model for a monthly time step, which provides a simple, robust, and computationally efficient tool for hydrological modeling, particularly suitable for data-scarce and climatically diverse regions [
35]. GR2m comprises two reservoirs, a soil storage reservoir (S) and a routing reservoir (R), defined by two parameters: the production storage capacity (X1) and the groundwater exchange coefficient (X2). The input data series required for performing GR2m includes average monthly rainfall and evapotranspiration (PET). To enhance this model, the IRSTEA team has made it available as an R package called airGR [
38]. This R package facilitates the implementation of the model [
39]. It provides a user interface for applying the GR2m model, including data preprocessing, automatic calibration routines, and performance assessment tools [
26]. The package allows for easy evaluation of the performance and includes automatic optimization algorithms [
26]. It provides as output a series of simulated flows, as well as a set of optimized parameters, observed and simulated flow hydrographs, and performance evaluation criteria and graphs [
40].
The automatic calibration procedure was based on the algorithm of Michel [
41]. The procedure optimizes the Nash–Sutcliffe (NSE) criterion [
42], which represents the ratio between the model error and the deviation of the observed discharge from its mean. The NSE was calculated as follows (Equation (5)):
where
Qobs corresponds to the observed discharge values [mm/month],
Qsim corresponds to the modeled discharge values at time or location [mm/month], and
and
are the mean of observed and simulated monthly values, respectively [mm/month]. Nash–Sutcliffe values could range from −∞ to < 100. An
NSE equal to 100 indicated a perfect correspondence between the simulated values and the observations; the model was more accurate for an
NSE close to 100.
In addition to the Nash–Sutcliffe criterion, a large set of performance evaluation criteria was provided by the airGR package. This included the Kling Gupta indicator (Equation (6)):
where
Qsim(i) and
Qobs(i) are respectively the simulated flow and the observed flow at date
i. is the mean over the entire period considered.
ρ, α, and
β are the ratio of standard deviations, the correlation ratio, and the volume ratio, respectively. If the
KGE was closer to 100, this model was more accurate.
The
RSR was calculated, as shown in Equation (10), as the ratio of the
RMSE and the standard deviation of the observations.
The root mean square error (
RMSE) allowed for a combined evaluation of variance and bias. The optimal value was zero. The
RMSE formula was calculated as follows (Equation (11)):
Hence,
RSR could be developed as follows (Equation (12)):
For each performance indicator, different thresholds could be considered (
Table 2). The combination of these three indices enabled a highly multidimensional assessment of model performance in terms of accuracy (
NSE), statistical coherence (
KGE), and magnitude of error (
RSR). This triangulation ensured that model evaluation was not biased by specific flow regimes or data distributions.
Moreover, the airGR package provided graphs to evaluate the model’s performance. For the GR2m model, these graphs consisted of a time series of observed precipitation, observed and simulated discharge, the flow duration curve, and the hydro-rainfall regime.
2.5. Calibration–Validation Process
A calibration and validation process is usually required to evaluate the performance of a hydrological model [
45]. This process allowed us to assess any residual errors and ensure the reliability of the model under different periods and conditions from the calibration periods, thereby allowing for a robust evaluation of its ability to simulate hydrological processes within the catchment [
36].
In this work, the split-sample test method was adopted to calibrate and evaluate model performance in predicting simulated flows. This test consisted of dividing the observed data series into two periods. The first period was used to determine a parameter set. The second period was used to validate the selected parameter set using the different performance criteria [
46].
With the aim of proving the robustness of the model in a non-stationary and variable climate context, the suggested calibration–validation approach in this research included two steps. Firstly, the model was calibrated on the dry period and validated on the wet period and then calibrated on the wet period and validated on the dry period. Secondly, calibration was performed over the whole observed period, which was characterized by variable climatic conditions, and validation was performed on the dry period and then on the wet period. The observed data series was divided into contrasted periods with contrasted weather conditions. To identify the humid and dry periods from observed monthly precipitation data, the Pettitt test was applied. Pettitt’s test consists of dividing the main series of N elements into two sub-series at each instant t between 1 and N −1 [
47]. The main series presents a break at time t if the two sub-series have different distributions. This test has been used in many studies to detect changes in stationarity due to its power, especially concerning the mean break test, and robustness. Subsequently, the Standardized Precipitation Index (SPI) was calculated to characterize the climate condition of each period.
2.6. Drought Forecasting
The increasing vulnerability of drought regimes to climate change is a significant challenge. Drought forecasting is, therefore, crucial for optimizing water resource management [
48]. In this research study, the standardized climate indices (SCIs) were used, consisting of the Standardized Precipitation Index (SPI) and the Standardized Precipitation–Evapotranspiration Index (SPEI) to assess meteorological drought and the Standardized Runoff Index (SRI) to assess hydrological drought.
The SPI establishes rainfall deficit and surplus [
49]. The SRI is used to quantify runoff fluctuations [
50]. The SPEI is similar to the SPI but refers to the difference between precipitation and potential evapotranspiration [
51]. The SCI indices can be calculated for different time steps. They were calculated using the SCI package developed under the free software R (version: R-4.2.2).
The SPI and SRI were calculated according to the “Gamma distribution” for standardization (Equation (13)), while the SPEI was calculated according to the “GEV distribution” (Generalized Extreme Value distribution) (Equation (16)).
The cumulative distribution function of the Gamma was
where
: the scale parameter;
: the shape parameter;
the Gamma function.
The inverse cumulative function
of the standard normal distribution was subsequently used to assess the SPI as follows (Equation (14)):
where
P: accumulated precipitation over the selected time period (mm);
H(P): the cumulative probability of precipitation from the fitted gamma distribution.
Similarly, the SRI was calculated as follows (Equation (15)):
where
Q: the accumulated runoff over the selected time scale (m3);
H(Q): the cumulative probability of runoff from the fitted gamma distribution.
The cumulative distribution function of the GEV distribution was as follows:
where
μ: a location parameter;
σ > 0: a scale parameter;
ξ: a shape parameter.
The SPEI was calculated as follows (Equation (17)):
where
where
P: the precipitation (mm/month);
PET: potential evapotranspiration (mm/month).
The adopted classification of SCI was approved for neighboring areas [
52]. An SCI greater than 2 indicated extreme wetness, while values between 1 and 2 denoted severe wetness and those between 0 and 1 denoted moderate wetness. Conversely, SCI values between −1 and 0 indicated moderate drought, those between −2 and −1 indicated severe drought, and values below −2 corresponded to extreme drought.
3. Results
3.1. Data Treatment
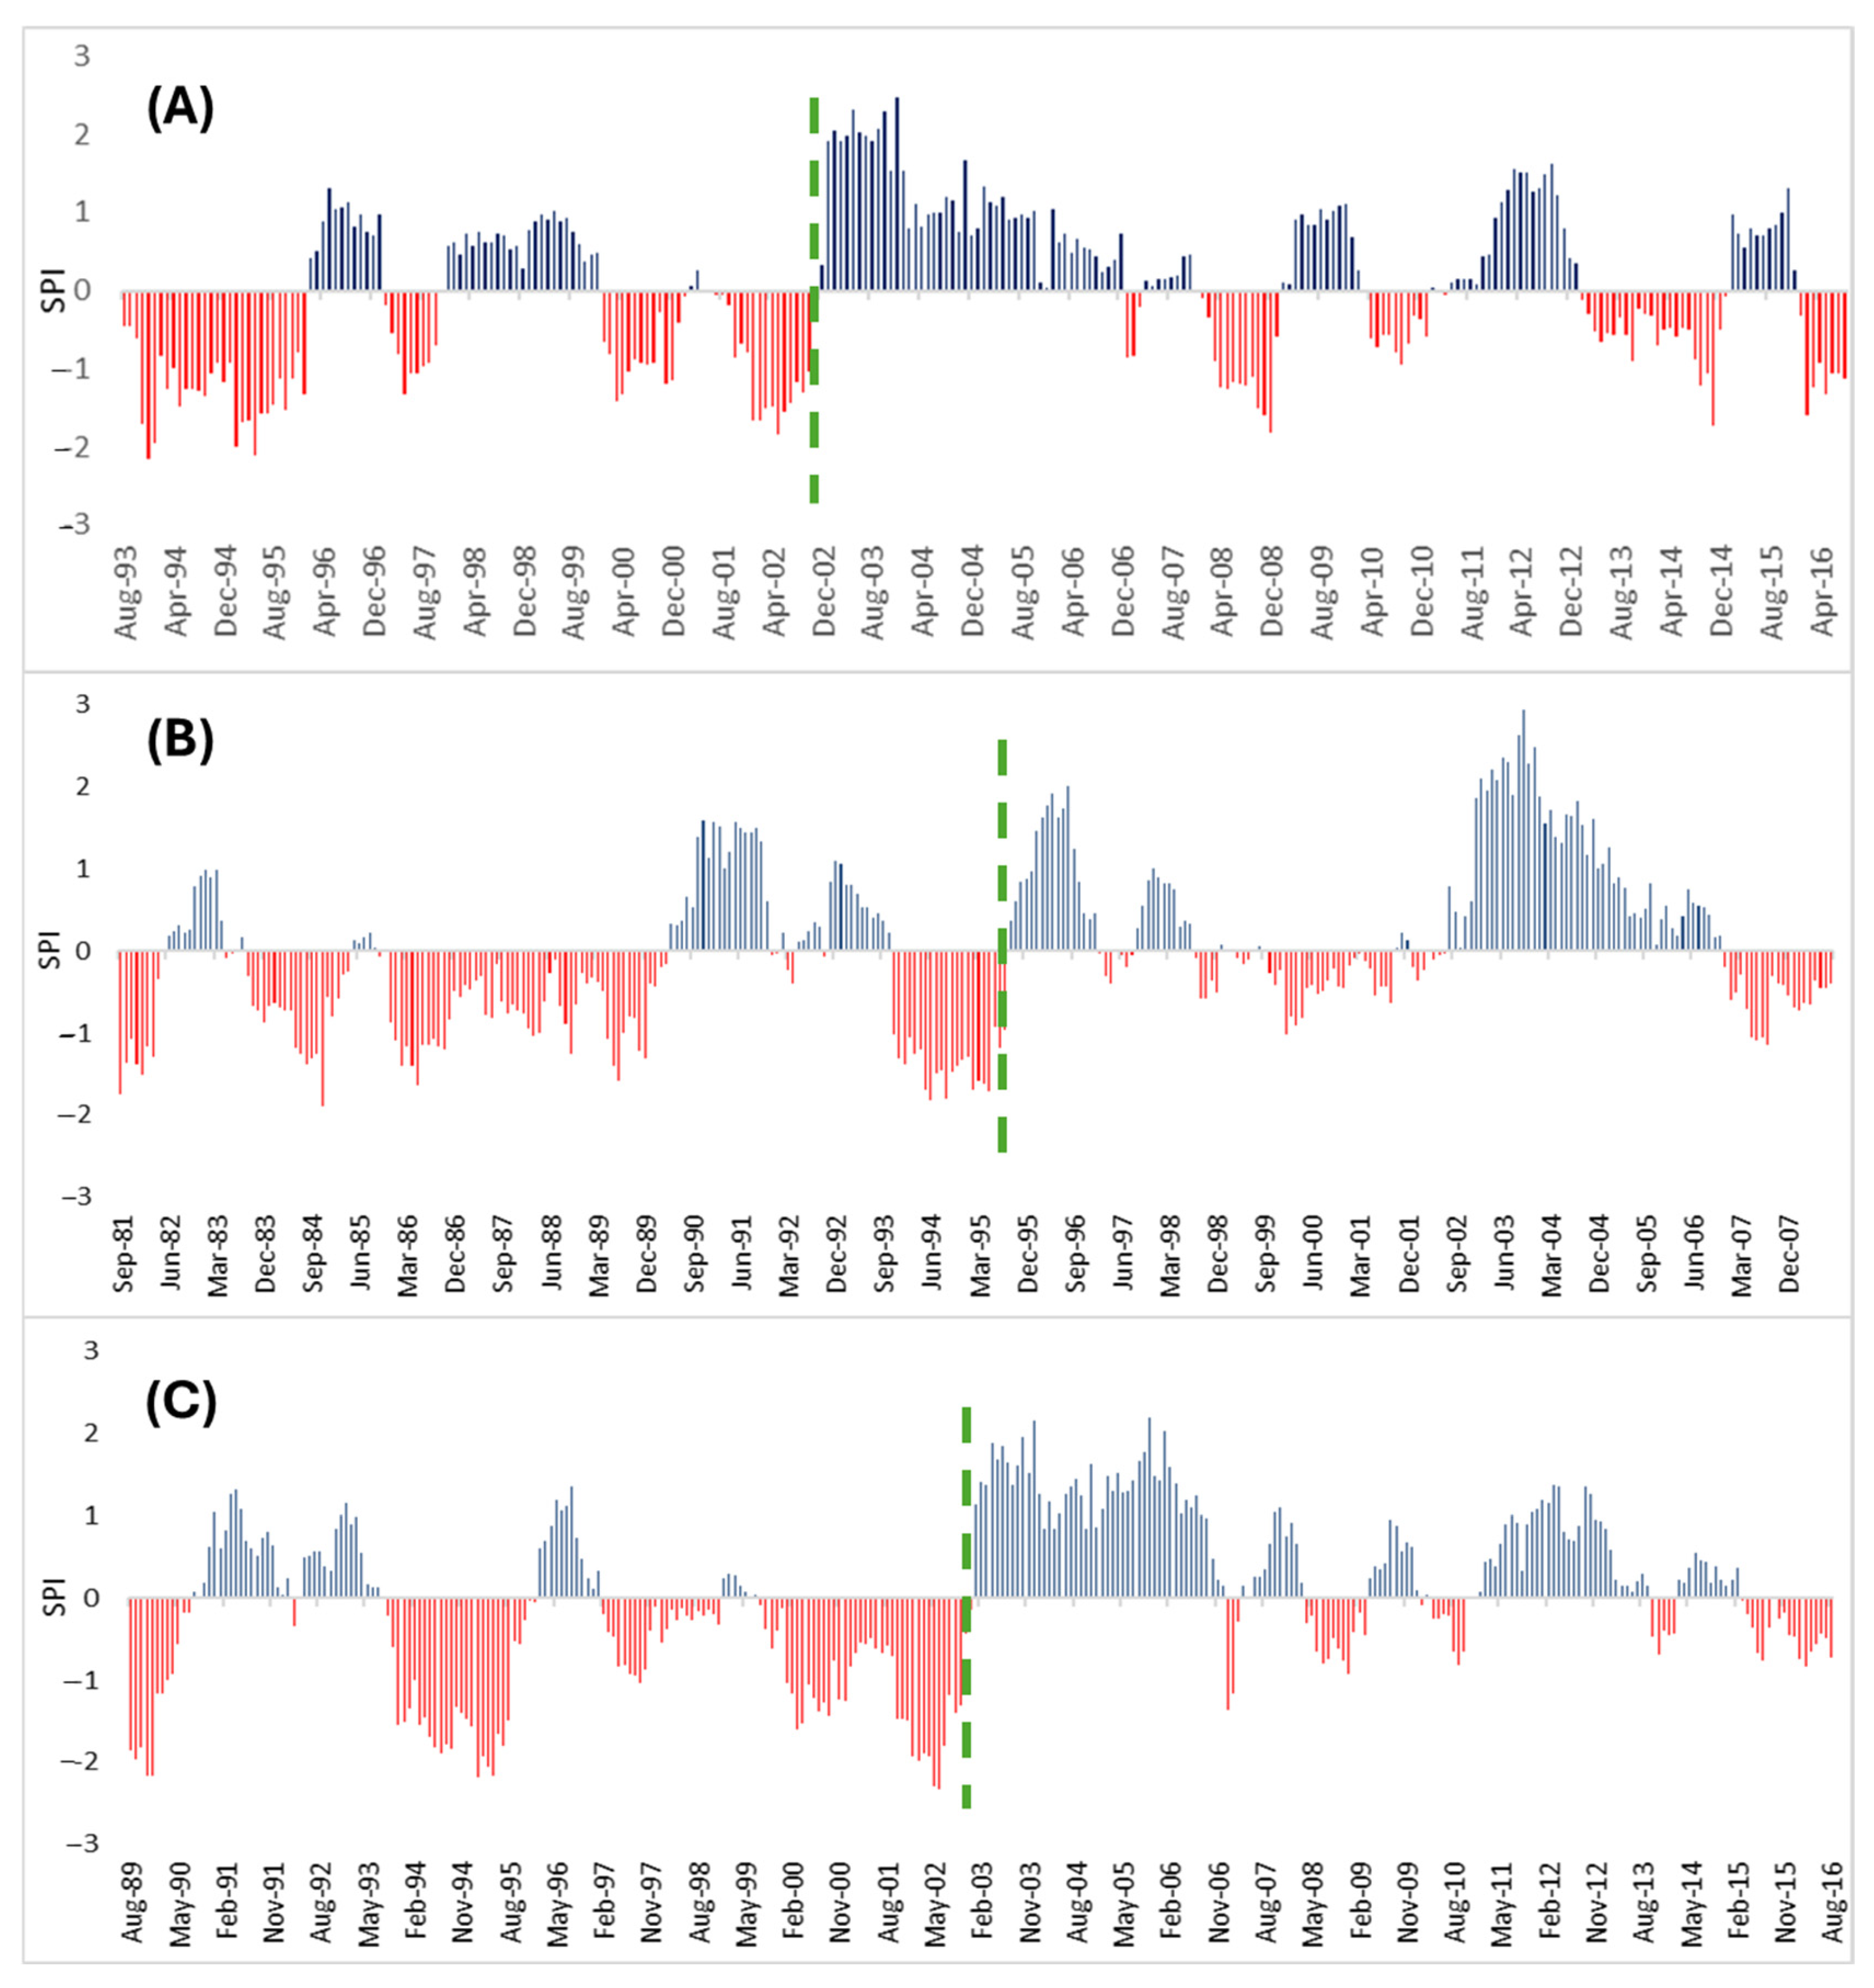
The application of the Pettitt test to the precipitation time series of the selected subcatchment indicated the existence of breakpoints. The identified breakpoints coincided with the date of September 1995 for the Sarrath subcatchment and that of September 2002 for the Bou Hertma subcatchment and the Siliana subcatchment. The identified breakpoints allowed us to divide the time series into two distinct sub-periods (
Figure 3). The calculation of the SPI based on the precipitation time series of the selected subcatchments indicated significant shifts in the precipitation regime. There was a significant change in climatic conditions at the detected change point. This suggested that before the identified breakpoint, the climate in all subcatchments was characterized by dry conditions, whereas after this point, a shift to humid conditions became evident.
The calculation of the average flows observed over each period before and after the breakpoint showed a difference of 32% for the Bou Hertma subcatchment, 39% for the Sarrath subcatchment, and 119% for the Siliana subcatchment.
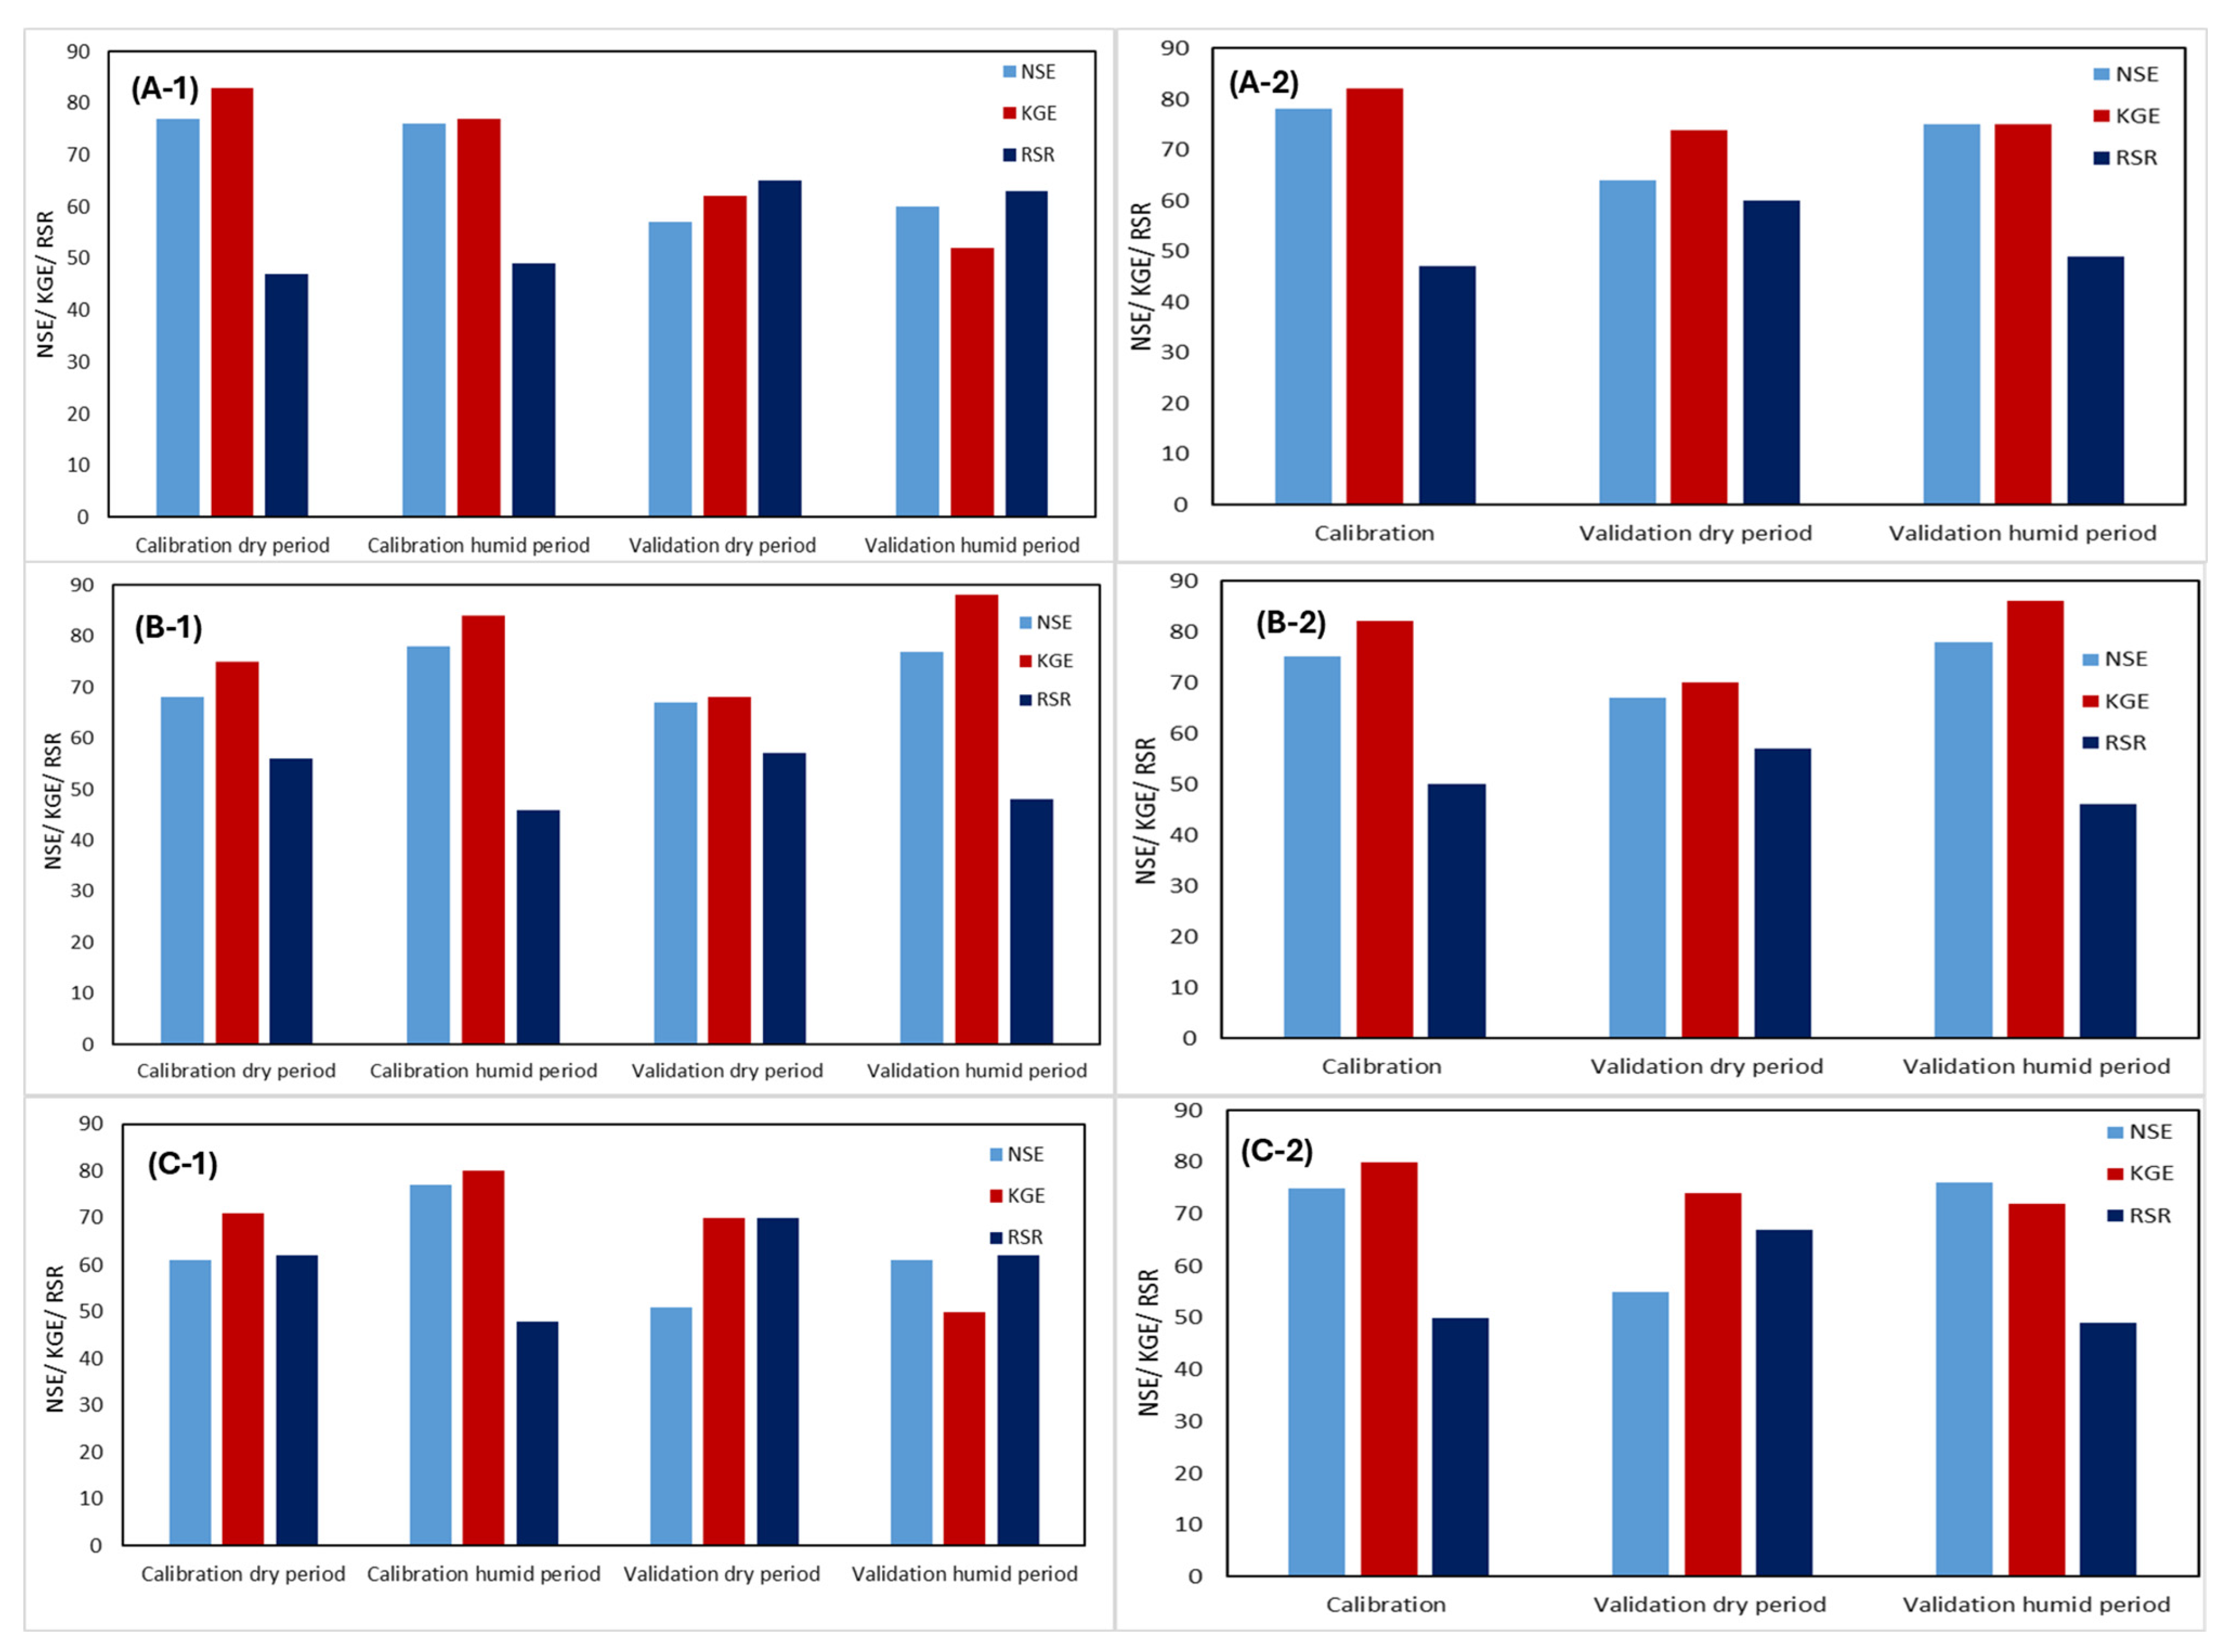
3.2. Model Performance
The cross-calibration and validation process used the identified wet and dry periods. Model performance was evaluated by the determination of Goodness of Fit through various statistical performance criteria (
Figure 4) and graphical tools (
Figure 5 and
Figure 6).
Statistical performance indicators for calibration on the dry period showed a satisfactory to very good fit across all subcatchments. The performance of the Bou Hertma subcatchment varied between good for the KGE value, which was equal to 83%, and very good for the NSE and RSR values, respectively equal to 77 and 47%. Furthermore, the calculated criteria at the Sarrath subcatchment were good, with an NSE criterion equal to 68%; the KGE value reached 75% and the RSR value yielded 56%. The Siliana subcatchment had satisfactory value fits with 61, 71, and 62%, respectively, for NSE, KGE, and RSR. Similarly, during model calibration during the humid period, all catchments showed a good-to-very-good fit. In fact, the NSE criterion ranged from 76% to 78% and the KGE value varied between 77% and 84% across the Bou Hertma subcatchment and Sarrath subcatchment, respectively. The RSR values were less than 49%.
In the validation phase, a cross-evaluation approach was adopted. We considered two contrasting climatic periods, in which model parameters calculated for the dry period calibration were used for validation on the humid period, and vice versa. The validation on dry spells showed good performance for the Sarrath subcatchment, except for the KGE value (KGE = 68%), which was inside the range of satisfactory results. At the Siliana subcatchment (NSE = 51%, KGE and RSR = 70%) and Bou Hertma subcatchment (NSE = 57%, KGE = 62%, RSR = 65%), the values of the calculated criteria showed a satisfactory performance. During the validation in the humid period, the model performance was good to very good for the Sarrath subcatchment. The NSE yielded 77%, the KGE was 88%, and the RSR values did not exceed 48%, while fit results were satisfactory for this period across the Siliana and Bou Hertma subcatchments. The NSE was around 60%, the KGE criterion was about 50%, and the RSR was close to 60%.
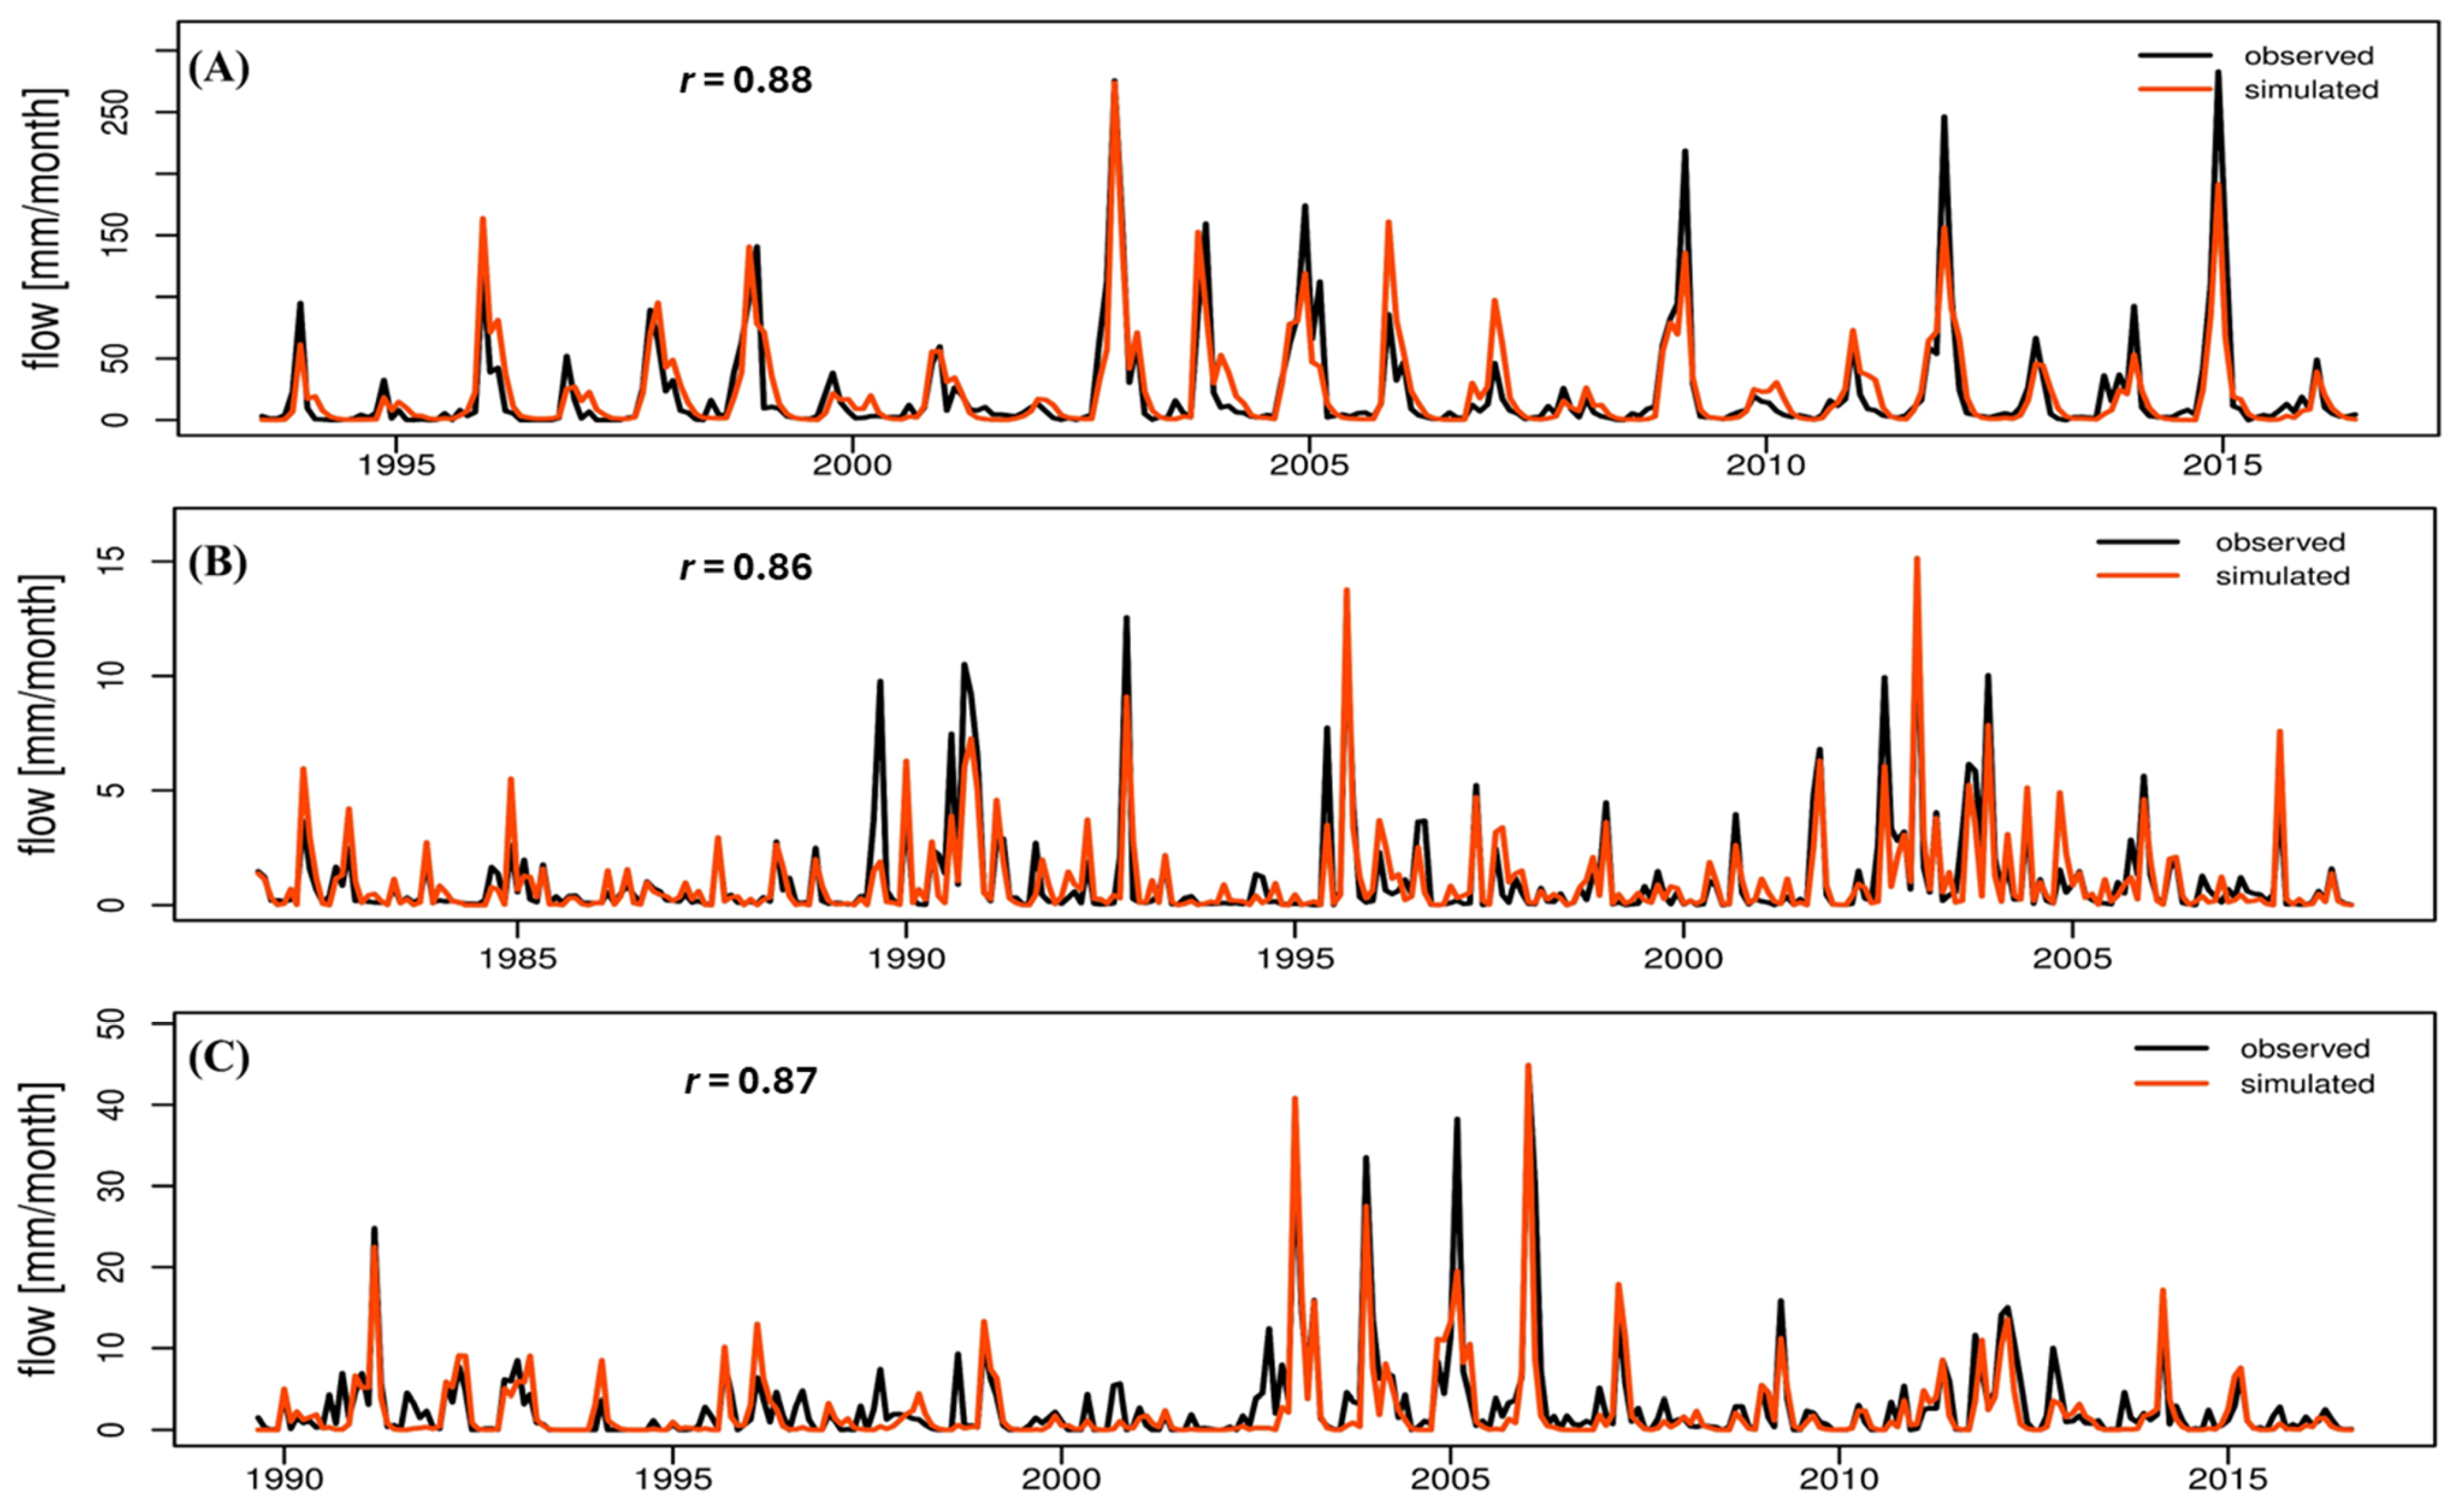
The graphical calibration/validation results indicated good model efficiency for all subcatchments and confirmed the good simulations since most of the peak flows were well preserved. The flow and precipitation regimes (
Figure 5) usually agreed well. For the Bou Hertma subcatchment (
Figure 5A), the model showed excellent agreement during the calibration period, with observed and simulated flows closely overlapping throughout the year. However, during the validation period, a little delay occurred in the months of February, March, and April. Across the Sarrath subcatchment, a slight lag was observed during the dry period calibration and validation (
Figure 5(B-1,B-2)), though the overall performance remained satisfactory. During the humid period, the model captured the flow dynamics well (
Figure 5(B-3,B-4)), indicating reliable behavior under humid conditions. In the Siliana subcatchment (
Figure 5C), an acceptable time lag was observed in the simulation of flows during the dry season, particularly between August and September, and also during the validation phase of the humid period, notably in February and March. The model demonstrated a capability to replicate the monthly flow patterns across all subcatchments, with excellent performance during the humid season and satisfactory simulation of flow peaks caused by rainfall events.
The graph of the Flow Duration Curves (FDCs) for observed and simulated monthly flows (
Figure 6) confirms that the GR2m model performed well in reproducing the flow distribution across all subcatchments and periods, with a particularly good fit during the humid season. The divergence between observed and simulated curves in the low flow segments suggests that the model slightly underestimated high flows and overestimated low flows, particularly in the dry period. This bias was most pronounced for the Sarrath (
Figure 6B) and Siliana (
Figure 6C) subcatchments. However, during the humid period, calibration and validation stages showed closer alignment between observed and simulated flows, indicating improved model performance under humid conditions. These results highlight the model’s robustness in capturing seasonal hydrological dynamics.
3.3. Model Performance in Non-Stationary Climate Conditions
To evaluate the effect of climate non-stationarity on hydrological parameter quality and model performance, the GR2m model was calibrated across all subcatchments over the full observation period characterized by varied climate conditions, and cross-validation was tested over the two periods with different climate conditions, the humid and the dry ones.
During the calibration, the comparison between observed and simulated monthly runoff across all subcatchments (
Figure 7) confirmed that the GR2m model captured the temporal variability and seasonal dynamics of streamflow well across all subcatchments. The timing and magnitude of peak flows were generally well reproduced, particularly in Bou Hertma (
Figure 7A). However, some anomalies were observed during high-flow events, where peak values were sometimes underestimated, and in low-flow periods, particularly for the Sarrath (
Figure 7B) and Siliana (
Figure 7C) subcatchments, where the model tended to slightly overestimate baseflow. Despite these limitations, the simulation closely followed the observed data, indicating the model’s robustness in representing monthly runoff.
During the calibration process, the model showed good performance for all subcatchments (
Figure 4). The calculated NSE criteria were good for the Sarrath and Siliana subcatchments, with values of 75%, and very good for the Bou Hertma subcatchment, with 78%. All the KGE values were good, varying between 80 and 82%, and all the RSR values were very good, varying between 47 and 50%.
The validation results over the dry period indicated that the NSE value showed good performance for the Sarrath (NSE = 67%) and satisfactory performance for the Siliana and Bou Hertma subcatchments. The RSR value was considered good for the Bou Hertma and Sarrath subcatchments and satisfactory for the Siliana subcatchment (RSR = 67%). The KGE values were satisfactory across all subcatchments.
The statistical criteria during the validation over the humid period were usually satisfactory to very good. The NSE value for the Bou Hertma subcatchment was 75%, which was considered good; it varied between 76 and 78% for the other subcatchments, which confirmed a very good fit. The KGE values were good for all subcatchments except for Siliana, which was satisfactory (KGE = 72%). It should also be noted that the RSR values were good for all subcatchments.
These results suggest that the GR2m model performs reliably for both humid and dry conditions; the overall consistency of the results confirms its suitability for hydrological simulations in the studied region.
To identify the best period to calibrate the GR2m model in the context of a mixed and fluctuating climate, the validation of the calibration processes was examined in detail. According to the two sets of used cross-calibration parameters, for the Bou Hertma subcatchment, the most robust performance criteria corresponded to the cross-validation process using calibration over the long and heterogeneous climate period. Let us take the example of the NSE criterion. For the dry and wet periods, it was respectively equal to 64% and 75% for validation over the whole period and 57% and 60% for validation over the contrasting periods. For the Sarrath subcatchment, statistical criteria gave almost the same results for the validation in the dry period in the two cases of model parameters. Nevertheless, for the validation of the humid period, it was better to calibrate the model using longer and more varied time series. Indeed, the NSE criterion was 78%, KGE remained at 86%, and RSR yielded 46% for validation using the calibration parameters of the whole observed data. These criteria were 77, 88, and 48%, respectively, for NSE, KGE, and RSR when validating using model parameters issued from calibration on the dry period. For the Siliana subcatchment, the statistical performance criteria during the validation on the dry period with the calibration parameters calculated on the longest period yielded 55% for NSE, 74% for KGE, and 67% for RSR. These values were more robust than those with the calibration parameters calculated on the humid period (NSE = 51%, KGE = 70%, RSR = 70%). The validation on the humid period yielded 76% for NSE, 72% for KGE, and 49% for RSR using the whole observed period for calibration, and they were less efficient (NSE = 61%, KGE = 50%, RSR = 62%) using the parameters for dry period calibration.
3.4. Future Climate Projections Within the Medjerda Catchment, Tunisia
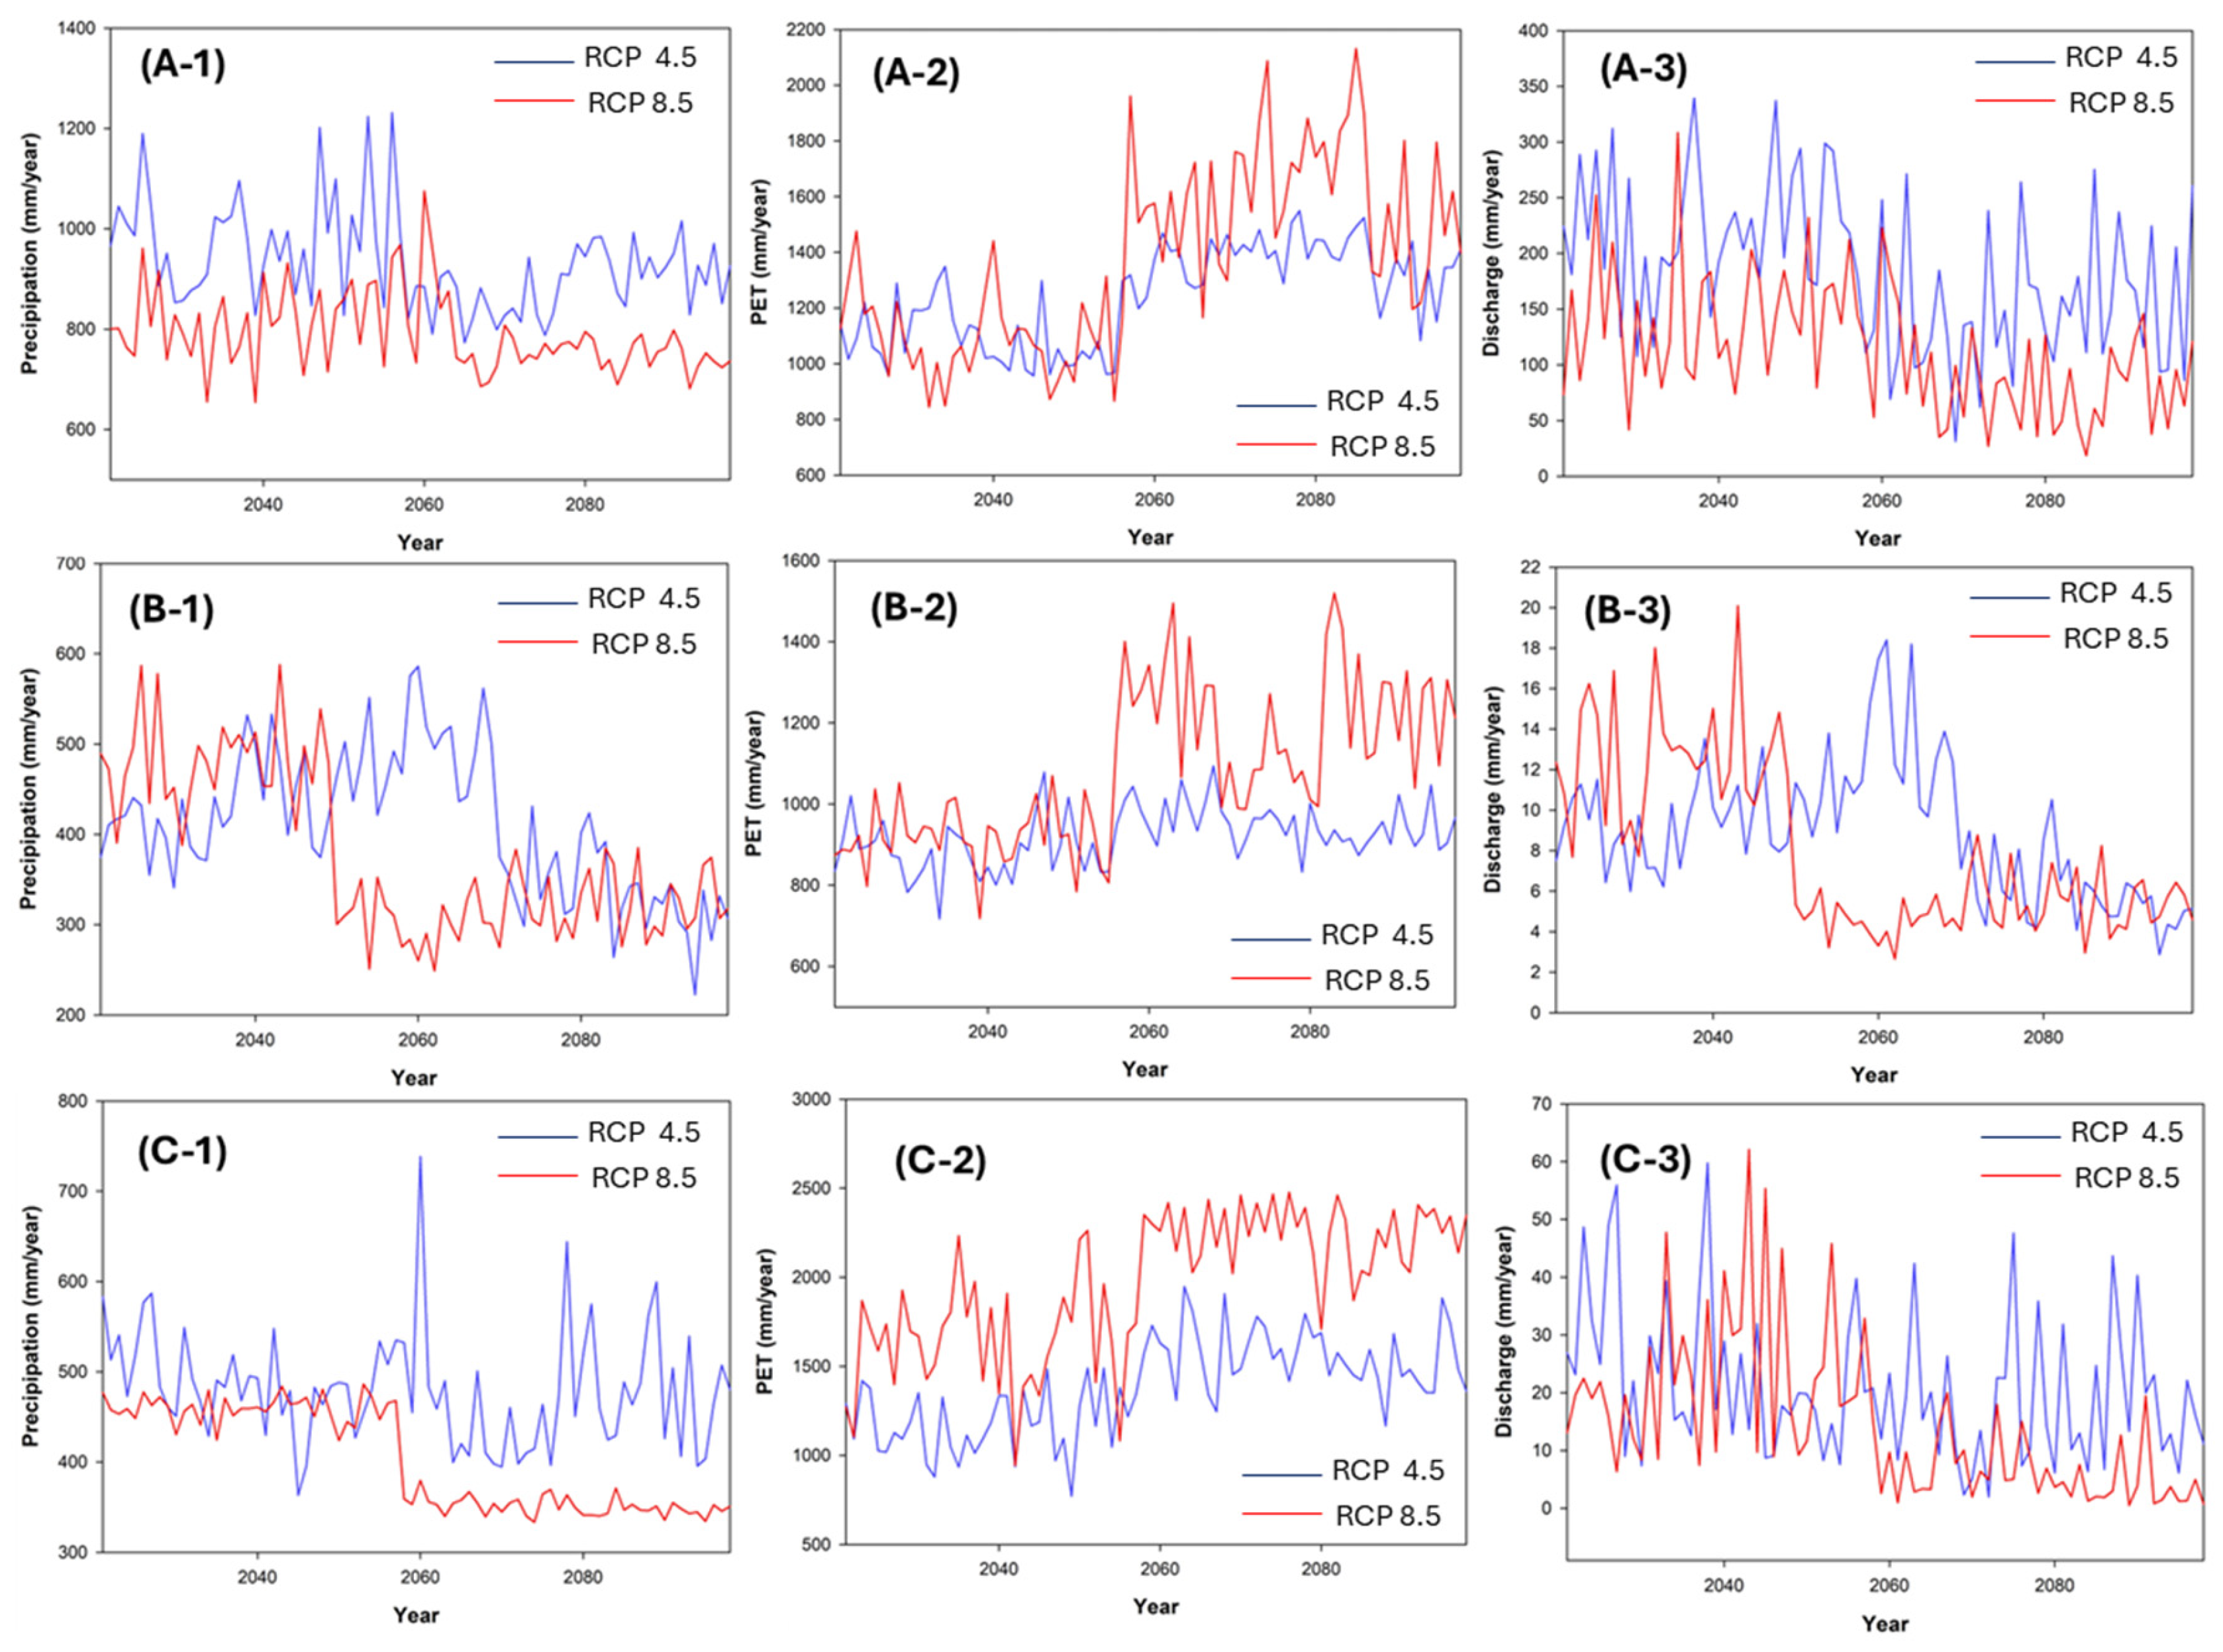
An assessment of the GR2m modeling results for the Medjerda catchment showed that GR2m calibration parameters over a non-stationary period with a variable climate were the most appropriate for predicting runoff in the context of climate change impact. Based on these results, the calibration parameters over the entire period of the observed data at each studied subcatchment were adopted to project future flows until 2100 according to the two scenarios RCP 4.5 and RCP 8.5. Precipitation and temperature projections by GCM MIROC 5 disaggregated at the local station level were adopted. Projected evapotranspiration series were calculated using the projected temperature series according to Thornthwaite’s method. The analysis of future climate projections was structured around three time horizons commonly used in climate change impact assessments: a short-term period (2021–2050), designated as P1; a medium-term period (2051–2070), referred to as P2; and a long-term period (2071–2100), identified as P3.
Across the Bou Hertma subcatchment (
Figure 8(A-1)), under RCP 4.5, average monthly precipitation dropped by ~80 mm in P1, with peaks reaching 535 mm/month in February 2046. In P2 and P3, averages declined to 75 mm/month and maxima fell to 381 mm and 332 mm. Under RCP 8.5, the decrease was sharper, with averages dropping to 66 mm in P1 and maxima declining to 415, 280, and 257 mm. PET increased due to rising temperatures (
Figure 8(A-2)), reaching monthly averages of 91, 104, and 115 mm under RCP 4.5 and 90, 117, and 136 mm under RCP 8.5, with maximum peaks rising to 471 mm in P3. Runoff followed this trend. Under RCP 4.5, average monthly flow stayed below 45 mm in P1 and under 30 mm in P2 and P3; under RCP 8.5, it dropped to 11, 10, and 6 mm, with maximums declining to 50 mm in P3. A growing share of runoff values fell below 20 mm/month, reaching 80% under RCP 4.5 and below 10 mm/month under RCP 8.5. Overall, annual flow declined by 23.5% (RCP 4.5) and up to 55% (RCP 8.5) (
Figure 8(A-3)). For the Sarrath subcatchment (
Figure 8(B-1)) under RCP 4.5, a slight decline in average monthly rainfall was projected in P1, P2 values were similar to the historical period, and by P3, rainfall dropped significantly to around 27.5 mm/month. Under RCP 8.5, precipitation decreased steadily across all periods, indicating increased aridity. PET rose in all future periods (
Figure 8(B-2)), reaching 74 mm/month in P1 under RCP 4.5 and increasing further in P2 and P3. Under RCP 8.5, this trend intensified. Runoff also declined: under RCP 4.5, it slightly decreased in P1, rose briefly in P2, and then dropped to 0.5 mm/month in P3. Under RCP 8.5, the decline was more severe and consistent. In P1, 80% of runoff values fell below 2 mm/month, dropping below 1 mm/month in P2 and 0.5 mm/month in P3. Annual flow was projected to decline by 30.6% under RCP 4.5 (26.3% in P1, 55% in P3) and 37% under RCP 8.5 (38% in P1, 56% in P3) (
Figure 8(B-3)), highlighting high vulnerability to long-term hydrological stress and drought. For the Siliana subcatchment (
Figure 8(C-1)) under RCP 4.5, average monthly precipitation was projected to decline to 41 mm in P1 and stabilize around 39.5 mm in P2 and P3. Under RCP 8.5, rainfall continued decreasing to 38 mm in P1, 32.9 mm in P2, and 29 mm in P3. PET rose steadily (
Figure 8(C-2)), reaching 95.7, 123, and 217 mm/month under RCP 4.5 and increasing more sharply under RCP 8.5 to 141.5, 203, and 263.6 mm/month in P1, P2, and P3. Runoff followed a consistent decline (
Figure 8(C-3)). Under RCP 4.5, average monthly flow dropped to 2 mm in P1 and 1.5 mm in P2 and P3; under RCP 8.5, values fell to 1.9, 1.2, and 0.5 mm/month. By 2100, annual flow was expected to decrease by 36% under RCP 4.5 (24.4% in P1, 42% in P3) and 56% under RCP 8.5 (34% in P1, 80% in P3), confirming severe water availability threats in the subcatchment.
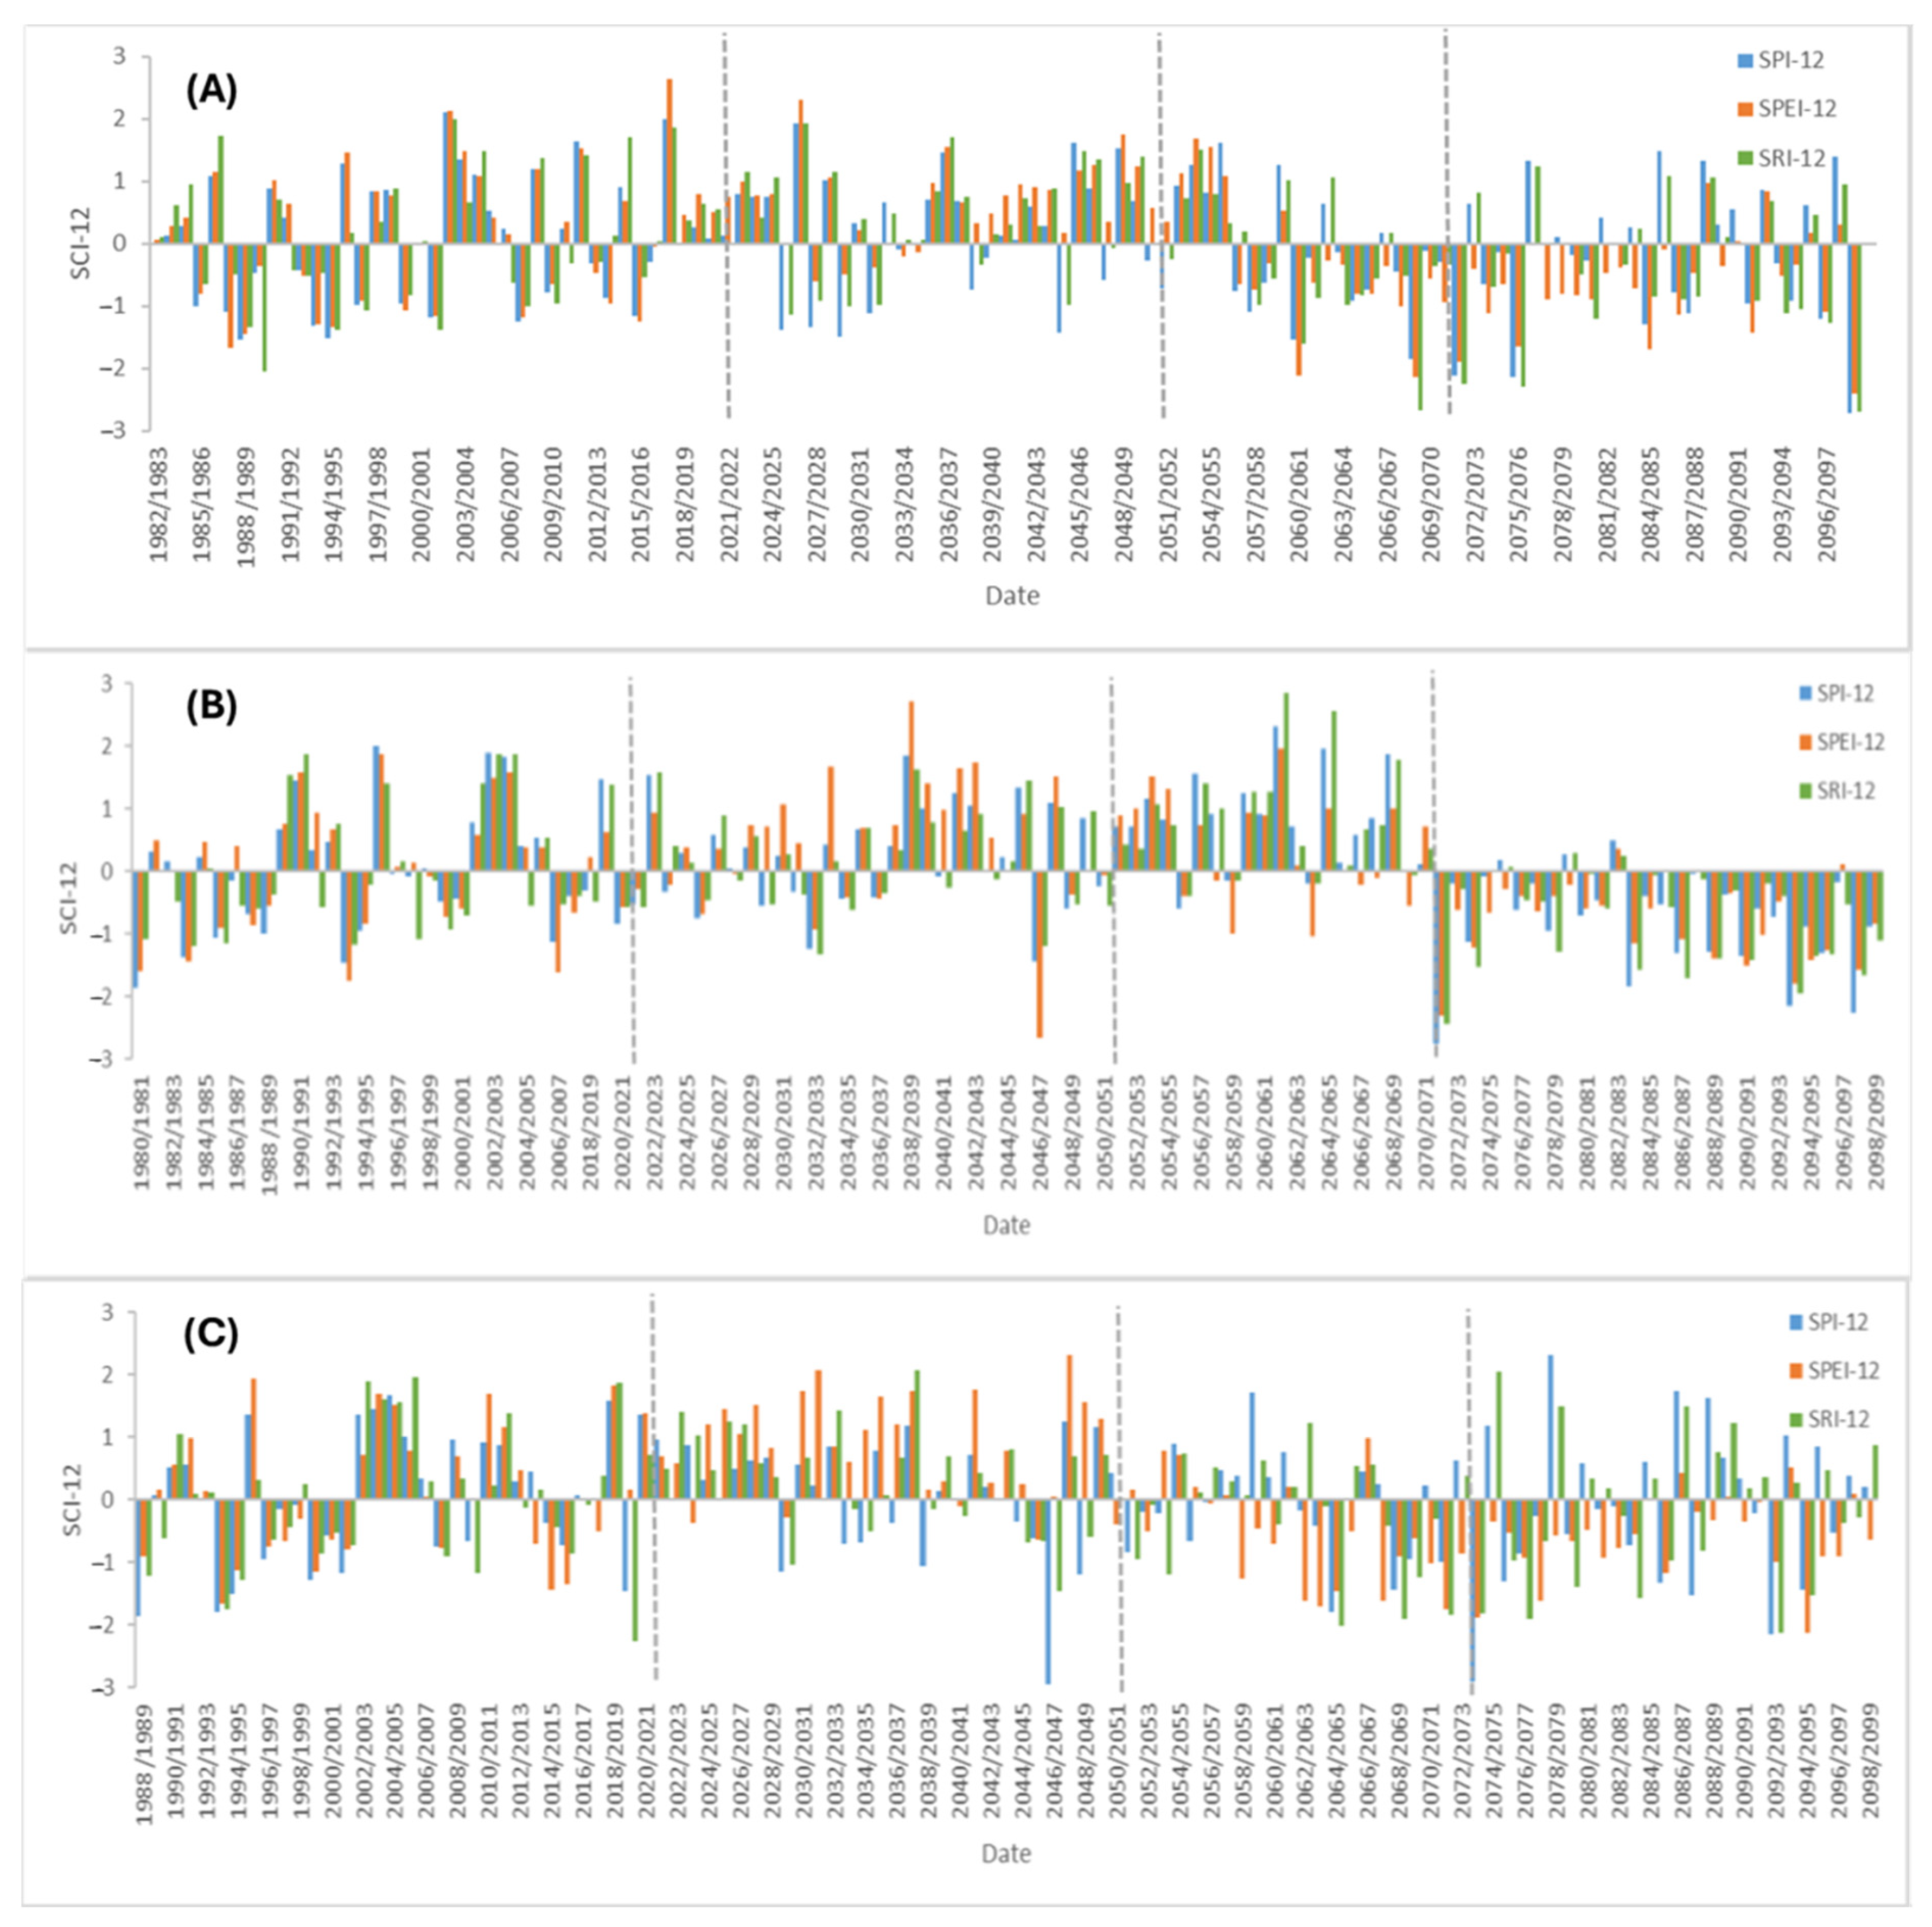
3.5. Observed and Projected Standardized Climate Indices (SCIs) Within the Medjerda Catchment
During the historical period, the SCI calculated at a 12-month step generally fell within the range of −1 to 1, with median values close to zero across all subcatchments. This reflected relatively balanced climatic variability, marked by moderate alternations between wet and dry periods. Some extreme events, whether drought or humidity, were also observed through values approaching −2 and 2.
In the Bou Hertma subcatchment, historical SCI values showed fluctuations between moderate to severe wetness and moderate to severe drought. Under the RCP 4.5 scenario (
Figure 9A), the projected period 2021–2050 (P1) exhibited a continuation of these historical climatic conditions. However, during the subsequent periods 2051–2070 (P2) and 2071–2099 (P3), a progressive shift toward moderate and severe drought conditions was expected, though there were occasional years with moderate humidity. During P3, SPEI values were consistently more negative than SPI, even when precipitation (SPI) remained close to normal. This reflected evaporative demand-driven droughts not captured by SPI alone. Under the RCP 8.5 scenario (
Figure 10A), similar trends were perceived, particularly in the first half of the century. Nevertheless, P2 was marked by an intensification of wet extremes, which could signal an increased risk of flooding events. By P3, extreme drought values dominated the SCI series, indicating that climate change will amplify the frequency and intensity of hydrological extremes in this subcatchment under a high-emissions pathway. From 2050 onward, several drought events appeared in SPEI but not in SPI, indicating PET-driven drought.
For the Sarrath subcatchment, historical climate variability was marked by alternating wet and dry conditions, with some extreme values recorded. This pattern of alternation continued under the RCP 4.5 scenario (
Figure 9B) during the first two future periods, P1 and P2, with moderate fluctuations between humid and dry years. However, by P3, the SCI values generally turned negative, suggesting a reduction in precipitation, a decline in water availability, and a temperature rise. Around 2043, 2052, 2068, and 2085, SPI indicated near-zero anomalies, but SPEI showed moderate to severe drought (values below −1), highlighting the role of high PET in intensifying drought. A similar trend was expected under the RCP 8.5 scenario (
Figure 10B), where the alternation between dry and wet conditions persisted until the end of P1. In P2 and P3, however, most SCI values remained consistently negative, indicating a transition toward prolonged moderate to severe drought conditions. During the P3 period, the SPI and SPEI diverged significantly. In fact, around 4–5 moderate to severe events were not detected by the SPI index, as in 2078 and 2086. The SPEI index showed more persistent and severe droughts, which were not reflected in the SPI index, indicating that droughts due to high PET content were more evident in the SPEI index.
For the Siliana subcatchment, the historical period was predominantly humid, with values ranging from moderate to severe humidity with occasional drought episodes. Under the RCP 4.5 scenario (
Figure 9C), future projections suggested a continued alternation between extremely humid and dry conditions. Although some relatively humid periods remained, extreme drought events, reflected by SPI values reaching 3, were anticipated. Furthermore, the SPEI series was increasingly negative. Furthermore, it was noticeable that the SPEI index identified additional drought episodes after 2050, highlighting the expected influence of rising temperatures on water availability. According to the RCP 8.5 scenario (
Figure 10C), SCI values indicated a growing trend to dry climatic conditions starting from 2057, with increasingly intense and successive drought events dominating the end-of-century period. After 2070, this subcatchment showed an increasing number of droughts specific to the SPEI index, such as in 2082 and 2088; the SPEI index fell significantly, while the SPI index remained close to normal, suggesting temperature-induced water stress.
4. Discussion
The present study evaluated the performance of the conceptual rainfall–runoff model GR2m using the airGR package to simulate long-term flow in the Medjerda catchments under stationary and non-stationary precipitation regimes.
Non-parametric Pettitt tests applied to the precipitation series confirmed a shift toward non-stationarity across the study area. Concurrently, an analysis of the SPI indicated a notable increase in its values over the past two decades. This supports the assertion that the annual precipitation patterns have become more pronounced in the region. These findings are consistent with the results of previous studies in the region [
13,
53,
54]. The convergence of results across various studies strengthens the robustness and consistency of the identified shifts in precipitation dynamics, underscoring the significance of the observed non-stationarity.
The performance of the GR2m model across all subcatchments, as assessed through cross-calibration and cross-validation under contrasting precipitation regimes, ranged from satisfactory to very good. Most statistical performance indicators confirmed the model’s ability to reproduce monthly runoff. Graphical results showed good simulation performance, except for the Flow Duration Curve, which displayed some anomalies for the low flows that the great interannual rainfall variability could explain. The GR2m model performed well in simulating monthly runoff in various subcatchments of the Medjerda for different and contrasting periods. The results confirm that the GR2m is appropriate for climate change impact assessment at monthly time scales. Previous studies conducted GR2m performance simulations for a changing climate [
27,
55,
56,
57]. Our results are in contrast with the study by Dakhlaoui et al. [
55], who found poor performance of the GR4J for simulating daily flow in some catchments in Northern Tunisia. This result can be explained by the higher variability of daily rainfall and the greater difficulty of measuring daily rainfall and flow.
Furthermore, model accuracy was further enhanced by incorporating improved rainfall estimates using the Thiessen polygon method, which provided more spatially representative and coherent precipitation data. Combined with the reliability of flow data, mainly from catchments monitored by dam stations that often provide well-regulated and reliable flow measurements, the simulation performance of the GR2m model was enhanced. These results are in line with several studies [
36,
58,
59,
60] that emphasized the value of spatial interpolation techniques in improving hydrological model performance and predictive accuracy.
The analysis of the validation process showed that a large and non-stationary series of observed data needs to be adopted to simulate the runoff in the Medjerda catchment with the GR2m model in the context of climate change impact. Several climate change impact studies have adopted this methodology of selecting longer calibration periods to ensure robustness [
56,
61,
62]. These results follow those of Wei et al. [
63], who argued that since precipitation is an indispensable input for hydrological models, a long-term precipitation dataset is needed for hydrological studies, particularly in regions where precipitation records are scarce. In addition, Vormoor et al. [
64] found that the performance of a conceptual hydrological model was preserved under contrasting conditions. Krysanova et al. [
65] proved that the satisfactory performance of hydrological models over the historical period improves the credibility of climate change impact projections and reduces the uncertainty associated with projections.
The GR2m was used as a model of impact at the level of the three subcatchments representative of the hydrometeorological regime of the Medjerda. The results demonstrated that projected runoff responses to climate change vary across both spatial (subcatchment) and temporal (future period) scales. According to RCP4.5, the decline in runoff ranged from 8% for Bou Hertma to 26.3% for Sarrath over the future period 2021–2050. Between 2051 and 2070, the decline was 32.8% across the Bou Hertma subcatchment. By 2100, the projected decrease in runoff was 37% for Bou Hertma and over 55% for Sarrath, which is consistent with the findings of Dakhlaoui et al. [
66], who estimated that river discharge in northern Tunisia could fall by 58% because of the impact of climate change. According to RCP 8.5, the impact of climate change on runoff was most pronounced over the period 2071–2099. Indeed, forecasts for this period, compared with the historical period, estimated a decrease ranging from 56% for Sarrath to 80% for Siliana. Over the entire projected period (2021–2099), the decrease varied between 23.5% for Bou Hertma and 36% for Siliana according to RCP 4.5 and between 37% for Sarrath and 56% for Siliana according to RCP 8.5. These projections are in line with the results of El Ghoul et al. [
67], who estimated a flow reduction in the Siliana subcatchment of around 44% under RCP4.5 and 69% under RCP8.5. The results predict trends toward lower water supplies. The predicted decrease in runoff is in line with the results of various studies in the Mediterranean and North African regions [
68,
69,
70]. In Morocco, Tuel et al. [
71], showed that under both the RCP4.5 and RCP8.5 scenarios, significant decreases of between 20% and 70% in river discharge are predicted. Likewise, Lahnik et al. [
72] confirmed that anticipated losses of discharge could reach 80% by 2100, and the duration and frequency of droughts will double under RCP8.5.
To minimize the uncertainties associated with climate change impact studies, these analyses can be supplemented by comparing results using different, more complex hydrological models, even though the difficulty associated with the data requested by these models remains a major obstacle [
73]. The adoption of a complex impact model requires the prediction of possible changes in agricultural practices, vegetation cover degradation, and soil degradation capable of affecting the hydrological process of the catchment. Indeed, increasing complexity without the necessary data to support the hydrological process could lead to increased uncertainty as well as longer runtimes [
74]. Black-box models, such as GR2m, are therefore favored as climate change impact models as they are often considered sufficiently complex to capture dominant hydrological processes, while their data requirements are relatively moderate [
74].
During the near-future period (2021–2050), the shape of the SCI distributions remained relatively stable across subcatchments under both scenarios, with values typically ranging from −1 to 2. This suggests that moderate climatic conditions will prevail, with only localized extreme events, particularly in Bou Hertma and Siliana. During the mid-century period (2051–2070), SCI values under RCP 4.5 continued to fluctuate within the range of −1 to 1, indicating relatively stable and moderate conditions. In contrast, under RCP 8.5, a gradual transition toward drier conditions emerged, particularly for Sarrath. By the end of the century (2071–2099), under RCP 4.5, drought conditions became dominant across most subcatchments, although some moderate wet phases persisted in Bou Hertma. Notably, Siliana exhibited signs of wetter conditions, possibly related to future flood risks, as indicated by SPI and SRI. Under RCP 8.5, all subcatchments were expected to experience persistent drought, with SCI values reflecting a marked increase in the frequency, duration, and severity of extreme hydrological events.
The projected SCI results are in agreement with several studies that confirm the major impact of climate change on drought vulnerability in North African countries. Schilling et al. [
75] studied the vulnerability to climate change of Algeria, Egypt, Libya, Morocco, and Tunisia, suggesting that all countries are exposed to strong temperature increases and a high risk of drought. Ahmadalipour et al. [
76], analyzing the projected SPEI-12 under the two scenarios, RCP4.5 and RCP8.5, over Africa, indicated that, spatially, the effect of climate change is similar for both scenarios, with more intense droughts projected under RCP8.5. These results are also endorsed by the study of Hertig and Tramblay [
77]. According to this scenario, future projections of SPI values indicate an increase in the severity and occurrence of droughts for the entire Mediterranean region from 2070 to 2100. Tramblay et al. [
78] proved the complexity of the problem of future droughts and the need to combine scientific research and adaptation solutions to manage the water situation in the future.
5. Conclusions
This study aimed to quantify the applicability and robustness of the conceptual hydrological model GR2m on the Medjerda catchment in Tunisia under changing climate conditions. First, performance was assessed, with an alternation between dry and wet periods. Subsequently, the GR2m was calibrated for the complete non-stationary climate period and validated on the dry and wet periods. For each subcatchment, specific hydrometeorological periods were assessed by the Pettitt break test and further analyzed using the time course of the SPI. Both statistical and graphical criteria were used to assess model performance.
The results proved the good performance of the simple water balance model GR2m to simulate runoff for the different historical climate conditions, having non-stationary physiographic and climate conditions, at the level of the different studied subcatchments in the Medjerda. In addition, the findings of this research confirm that calibration over a long period with a changing climate that fits better the prediction is recommended to be used for future climate impact studies. This is an important finding that helps ensure the rigorous quantification of climate change impact on the hydrological regime at a catchment scale using a simple hydrological model and a minimum data requirement.
Climate projections and the validation results of the GR2m model’s robustness were adopted to project flows and analyze hydrometeorological parameters for the horizon 2100 according to the RCP4.5 and RCP8.5 scenarios.
The projected flows according to RCP4.5 by 2100 showed a general decline, ranging from −23.5% for the Bou Hertma subcatchment to −36% for the Siliana subcatchment. According to RCP 8.5, the predicted decline was −37% for the Sarrath subcatchment and more than −56% for the Siliana subcatchment. The standardized SCI drought indicators confirmed the impact of climate change in the studied subcatchments. In effect, a decreasing trend was reported, even though the climatic situation remained characterized by moderate humidity and drought conditions until 2070. By 2100, droughts were expected to become more frequent and more intense, reflecting an extremely altered rainfall and hydrological pattern in the Medjerda. These findings could be helpful in future strategies for adapting to and preventing the risks of extremes, especially prolonged and intense droughts. To address the projected runoff declines in the Medjerda catchment, policy actions should prioritize integrated water resource management, the adoption of smart agriculture, improved drought planning, enhanced hydrometeorological monitoring, and ecosystem-based adaptation strategies.
Ultimately, this research fills some critical gaps in climate impact studies by providing a robust and reproducible modeling strategy to support sustainable water resource management and climate adaptation planning. Looking forward, the uncertainties associated with this type of research should be minimized through future research. Indeed, further studies need to take into consideration probable changes in other hydrometeorological variables, as well as vegetation cover, possible changes in cropping strategies, and future soil degradation, to be able to adopt more complex hydrological models. The use of the Thornthwaite method for future projections is limited as it relies only on temperature and does not take into account other key climate variables such as radiation, humidity, and wind, which are likely to change due to climate change. Similarly, Thiessen polygons may poorly represent precipitation variability in catchments with complex topography such as the Medjerda. Relying on a single GCM (MIROC5) further adds to the uncertainty, as results depend on the model used. A multi-model ensemble would provide a more robust basis for impact assessments.


