Abstract
Flooding poses significant challenges in semi-arid regions, where irregular rainfall patterns increase environmental vulnerability. This study explicitly aims to improve flood susceptibility mapping by integrating advanced machine learning (ML) algorithms with geographic information systems (GIS) and remote-sensing data. Using data from the Upper Drâa Basin in southern Morocco, we applied boosting algorithms, including XGBoost, CatBoost, LightGBM, and Hist Gradient Boosting, to enhance the accuracy of flood risk assessment. Quantitative model evaluation shows that Hist Gradient Boosting achieved the best performance, with the lowest mean squared error (MSE = 0.06897) and root mean squared error (RMSE = 0.2626). It also attained the highest F1 score (0.8), overall accuracy (93.1%), and area under the curve (AUC = 0.833), indicating its superior predictive capability. These findings highlight the strong potential of novel boosting ensemble learning methods in flood susceptibility prediction and contribute valuable, data-driven insights for policymakers and urban planners to support effective flood mitigation strategies in southern Morocco.
1. Introduction
Floods pose a significant risk to communities, particularly in semi-arid regions where precipitation can be unpredictable [1,2,3,4,5,6]. Recent advancements in machine learning (ML) techniques have demonstrated promising potential for improving assessments of disasters (e.g., landslides and flood susceptibility) by integrating geographic information systems (GIS) and remote-sensing data [7,8,9,10,11,12,13]. These methodologies enable more accurate predictions of flood-prone areas by analyzing various environmental factors contributing to flood risk [14].
Commonly used ML methods in flood susceptibility mapping include artificial neural networks (ANNs) [15], support vector machines (SVMs) [16], random forests (RFs) [17], and logistic regression (LR) [18]. These algorithms have demonstrated strong predictive capabilities by capturing non-linear relationships between flood conditioning factors such as elevation, land cover, slope, and rainfall [19,20].
In recent years, boosting algorithms have gained increasing attention in flood modeling due to their robustness, efficiency, and high predictive power in several regions worldwide [9,11,21,22,23]. The evolution of boosting algorithms began shortly after the introduction of the original boosting concept in the late 1990s. One of the earliest practical formulations was developed using decision stumps, simple one-level decision trees, and weak learners [24]. A significant advancement came in 1997, when Leo Breiman proposed Gradient Boosting, introducing a new perspective on boosting as an optimization problem over a differentiable loss function [25,26]. This marked a departure from AdaBoost, which focused on misclassified samples, and paved the way for more flexible ensemble models. Gradient Boosting supports various loss functions and constructs trees sequentially to minimize residual error through gradient descent [27,28].
Despite their advantages, boosting algorithms also face challenges such as overfitting, especially in the presence of noisy data or overlapping class distributions [26]. Nevertheless, their adaptability and precision make them highly attractive for geospatial applications, including flood susceptibility mapping [29].
This study seeks to enhance the accuracy and reliability of flood susceptibility maps by systematically analyzing the performance and explainability of traditional and novel boosting models. We apply a range of gradient boosting algorithms, XGBoost, CatBoost, LightGBM, and Hist Gradient Boosting, to a diverse dataset encompassing key flood conditioning factors. Our approach integrates rigorous validation using multiple performance metrics, providing a holistic framework for flood risk assessment. The novelty of our work lies in its focus on comparative analysis and interpretability, aiming to identify high-performing, explainable models suitable for real-world decision-making [30]. The current study’s findings serve to provide policymakers and urban planners with actionable insights, particularly in flood-prone regions. By leveraging advanced machine learning methods and robust validation protocols, this research contributes to the development of scalable decision-support tools for flood risk management, with potential applicability beyond the Moroccan context [31]. Ensemble methods such as XGBoost have attracted considerable attention in recent years for their strong performance in predictive modeling, including flood susceptibility assessment. Introduced by Chen and Guestrin [32], XGBoost builds upon the gradient boosting framework by incorporating several innovations that improve speed, accuracy, and scalability [32]. These include parallelized tree construction, efficient handling of sparse data, and regularization techniques that reduce overfitting [33,34]. Such features make XGBoost a robust and efficient tool for processing large geospatial datasets, enabling more reliable flood susceptibility prediction.
In Morocco, the application of machine learning techniques for flood analysis has gained growing attention, particularly in regions such as the Tensift watershed and the Haouz plain. Despite several existing studies exploring these methods [35,36], there remains a lack of comprehensive evaluation comparing both traditional and emerging boosting algorithms in the context of flood susceptibility mapping. Recent research has demonstrated the potential of ensemble algorithms, including XGBoost and random forests, for assessing flood susceptibility, particularly in Morocco’s semi-arid environments. These studies have emphasized the role of key geomorphological and hydrological factors in the development of effective flood susceptibility maps [11,37,38]. However, few have systematically evaluated the explainability and comparative strengths of newer boosting techniques in this domain.
2. Materials and Methods
2.1. Study Area
The Drâa Oued Noun (DON) watershed is situated between latitudes 32° N and 29.3° N and longitudes 9.88° W and 5.5° W in southern Morocco. It is one of the largest watersheds of the Kingdom and has an area of greater than 103,460 km2, covering 1/7 of the total area of Morocco. The DON is bounded by the High Atlas Mountains to the north, the Atlantic Ocean to the west, the Sahara to the south, and Algeria to the east (Figure 1). In the DON settled agriculture developed around underground water sources and dry riverbeds that flood during the rainy season. In the Drâa watershed, settled agriculture has traditionally developed around underground water sources and ephemeral riverbeds that flood during the rainy season. The region has a semi-arid to arid climate, with an average annual temperature of 22 °C, though this may vary between 19 °C and 21 °C depending on elevation and season. Rainfall is highly variable, with the High Atlas Mountains receiving up to 600 mm/year, while the surrounding plains receive as little as 100 mm/year. The watershed is divided into four main sub-basins: the Upper Drâa (the focus of the current study), Middle Drâa, Lower Drâa, and Guelmim (Figure 1) [39]. The Upper Drâa Basin extends across parts of the Ouarzazate, Tinghir, and Zagora provinces. The total population within the watershed is estimated at 250,000 to 300,000, distributed among urban centers, oases, and rural communities, depending largely on the availability of water resources. The Upper Drâa Basin has a long history of traditional oasis agriculture. Historically, agriculture in this region developed around Ksour (fortified villages) and relied heavily on qanats (Khettaras)—a system of underground channels used to tap groundwater for irrigation [40]. This technique enabled the cultivation of date palms, cereals, and vegetables in otherwise harsh desert conditions.
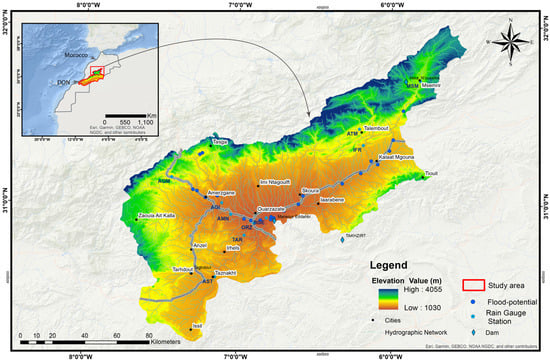
Figure 1.
Geographical situation of the study area: Upper Drâa basin and in situ gauge stations.
2.2. Data Used and Methodology Applied
2.2.1. Data
The development of accurate flood susceptibility models relies heavily on the integration of high-quality, multi-source geospatial datasets and their systematic processing. In this study, we selected and compiled a comprehensive set of environmental, geological, and hydrological variables that have been consistently identified as key flood conditioning factors in previous research across the Upper Drâa watershed. Table 1 provides a detailed overview of the data layers and their sources, as well as a summary of the processing methods used. The dataset includes a wide range of variables, namely lithology, fault density, elevation, slope, Topographic Wetness Index (TWI), plan and profile curvature, aspect, hydrographical network metrics, precipitation distribution, and flood occurrence sites. These parameters were selected based on their documented significance in flood susceptibility modeling and validated in prior studies conducted in similar semi-arid environments, particularly within the Drâa River Basin context. Elevation data were extracted from the ASTER DEM with 30 m spatial resolution, processed, and georeferenced to delineate the watershed accurately. Version 2 of ASTER, which includes significant enhancements over Version 1 (e.g., improved spatial resolution and vertical accuracy through additional stereo-pairs), was used [41]. The vertical RMSE is estimated at 8.68 m, as reported by Tachikawa et al. [41], ensuring the reliability of derived morphometric parameters such as slope and curvature. Lithological data capture the complexity of the watershed’s geological structure, encompassing Quaternary deposits, sedimentary formations, and volcanic and metamorphic rocks (see Figure 2). Fault density was integrated due to its hydrological relevance in controlling water flow paths and influencing surface and subsurface water accumulation [42,43]. In the context of the Upper Drâa Basin, the presence of tectonic structures such as Anti-Atlas faults and NE–SW-oriented fractures [44] provides a favorable setting for this phenomenon. These zones of geological weakness have shaped the current basin morphology, influencing the alignment of Thalwegs and the development of the drainage network. Slope and curvature metrics (both plan and profile) provide insights into runoff dynamics, infiltration potential, and erosion susceptibility, while the aspect layer characterizes the directional exposure of slopes, influencing microclimatic conditions and surface hydrology. The Topographic Wetness Index (TWI), which represents the upstream contributing area and β the local slope, was used to quantify the spatial distribution of soil moisture potential. Hydrographical information, particularly drainage density (stream length per unit area), was derived from the DEM and further analyzed in GIS environments to understand the hydrological response and landscape dissection. High drainage density values (up to 2.1 No/km2) typically indicate areas of enhanced runoff and erosion risk. Precipitation data, interpolated to produce a spatially continuous rainfall map, revealed significant variation across the basin, with values ranging from 101.9 mm to 258.4 mm annually. Notably, higher rainfall concentrations were observed in the eastern and western margins, which are consistent with orographic and climatic influences. Lastly, historical flood site data were sourced from the Hydraulic Basin Agency and enriched through on-site verification campaigns, enabling the identification of flood-prone and unaffected zones. This dual-source approach ensures a higher precision in validating the model outputs. Altogether, the chosen datasets represent the most robust and contextually relevant inputs available for flood susceptibility assessment in the region. Their selection was guided not only by their physical relevance and prior use in regional studies but also by their proven capacity to yield reliable and interpretable results. By synthesizing these variables, our modeling approach captures the multifactorial nature of flood risk and offers a scientifically grounded basis for flood hazard management in the Upper Drâa watershed.

Table 1.
Data sources and processing methods used in this study.
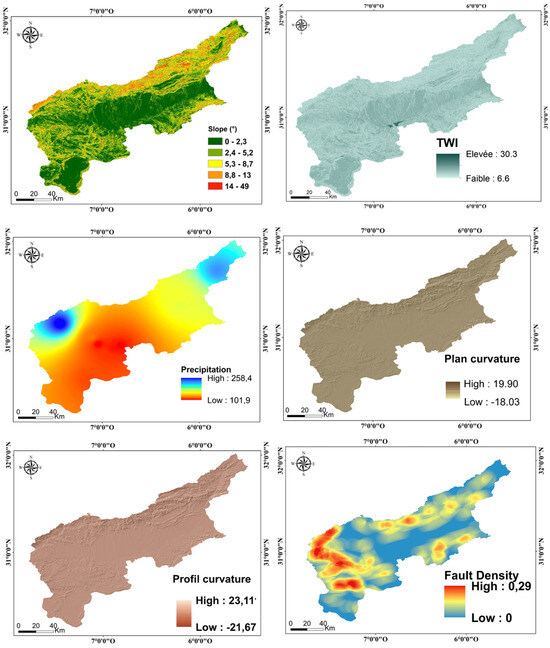
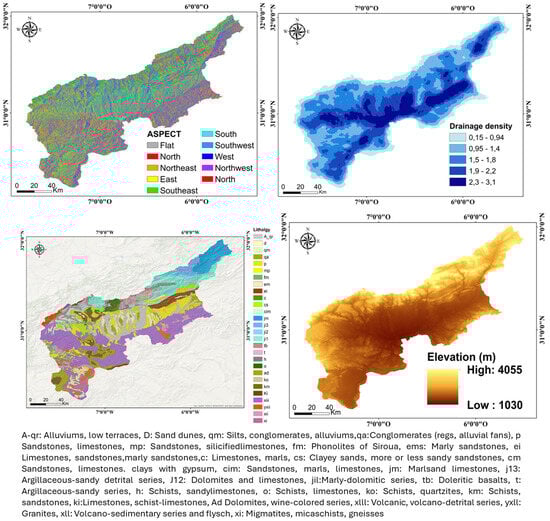
Figure 2.
The environmental factors used in flood susceptibility modeling.
2.2.2. Methodology
This study presents a methodology that integrates advanced machine learning algorithms with geographic information systems (GIS) and remote-sensing data to improve flood susceptibility mapping in the Upper Drâa Basin, a semi-arid region characterized by erratic rainfall patterns and heightened vulnerability to flooding. The dataset encompasses various geomorphological and environmental factors, including lithology, fault density, aspect, Topographic Wetness Index (TWI), elevation, river density, slope, as well as planimetric and profile curvatures. A multicollinearity analysis was conducted to eliminate highly correlated variables and ensure the robustness of the training data.
Several boosting algorithms were employed to enhance the accuracy of flood risk prediction, including XGBoost, CatBoost, LightGBM, and Hist Gradient Boosting. These algorithms were compared to traditional models such as RF and AdaBoost. Model performance was evaluated using metrics such as mean squared error (MSE), root mean squared error (RMSE), F1 score, overall accuracy, area under the ROC curve (AUC), and Cohen’s kappa coefficient. The selection of XGBoost, CatBoost, LightGBM, and Hist Gradient Boosting was based on the fact that these models represent some of the most advanced and widely adopted ensemble learning algorithms in recent years in various studies [45,46,47]. Boosting models were selected over traditional machine learning algorithms due to their superior ability to handle complex, non-linear relationships and their proven effectiveness in various predictive modeling tasks. Boosting algorithms, such as LightGBM, CatBoost, and Hist Gradient Boosting, work by sequentially combining multiple weak learners (typically decision trees) to create a strong predictive model [45]. They were primarily selected for their established effectiveness as state-of-the-art boosting-based ensemble learning algorithms and in accordance with this study’s aim to conduct a comparative analysis of these advanced models for geospatial analysis problems, such as flood susceptibility mapping. Boosting algorithms, such as LightGBM, CatBoost, and Hist Gradient Boosting, work by sequentially combining multiple weak learners (typically decision trees) to create a strong predictive model (Table 2). This approach allows them to correct errors made by previous learners, resulting in a higher accuracy and robustness, particularly in datasets with heterogeneity and noise. These methods are known for their high accuracy, scalability, and ability to handle structured/tabular data with missing values and categorical features efficiently, making them particularly well-suited for geospatial classification problems [48].
Moreover, by comparing these algorithms, we aimed to conduct a systematic benchmark of the leading contemporary gradient boosting frameworks. These algorithms implement advanced machine learning techniques, including histogram-based learning (i.e., Hist Gradient Boosting) and native categorical encoding (CatBoost), which make them robust and competitive in terms of both prediction performance and computational efficiency [49,50]. To ensure a reliable and comprehensive evaluation of model performance, we used standard metrics including MSE, RMSE, F1 score, accuracy, AUC, and Cohen’s kappa. These metrics cover prediction error, class balance, and overall performance, even in cases of data imbalance. Their use is well-supported in the flood modeling literature [36,51,52,53], which justifies our methodological choice. This comparison ensures a fair and relevant evaluation of performance and model behavior across the most advanced and practically relevant boosting methods.
For optimal tuning, the hyperparameters are model-specific settings that must be defined before training, as they cannot be learned directly from the data. Proper hyperparameter tuning is critical for enhancing model performance and predictive accuracy. Common approaches include grid search, random search, and manual tuning [54]. In this study, we applied a grid search to systematically optimize the hyperparameters of all machine learning models used, aiming to achieve the optimal performance. A summary of the hyperparameter ranges and the best-performing configurations is presented in Table A1 and Table A2.
The models were utilized to generate an enhanced flood susceptibility map for the study area (Figure 3). The resulting maps provide data-driven insights for policymakers and urban planners, enabling improved planning and effective mitigation of flood risks. This methodological approach highlights the importance of ensemble methods in flood risk prediction and demonstrates the effectiveness of boosting algorithms in enhancing model accuracy.
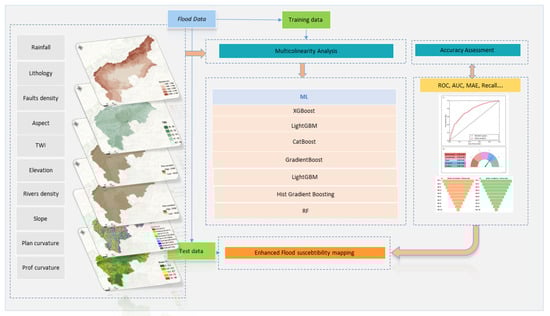
Figure 3.
Flow chart of the methodological framework implemented in this study.
Table 2.
Models used in this study.
Table 2.
Models used in this study.
| Model | Description | Sources |
|---|---|---|
| AdaBoost | AdaBoost is a popular ensemble learning method that combines multiple weak learners to create a strong classifier. It works by iteratively assigning higher weights to misclassified samples, focusing the model’s attention on difficult instances. While effective for binary classification and simple data distributions, AdaBoost may struggle with complex datasets and can be sensitive to noise. | [24] |
| Gradient Boosting Machine (GBM) | GBM is a powerful machine learning algorithm that builds an additive model by sequentially adding weak learners. It minimizes the loss function at each iteration, making it suitable for various tasks, including regression and classification. GBM is robust to noise and can handle non-linear relationships effectively. | [26] |
| Extreme Gradient Boosting Machine (XGBM) | XGBoost is a scalable and efficient implementation of GBM that incorporates several optimization techniques. It handles missing values gracefully, supports parallel computation, and employs regularization to prevent overfitting. XGBoost has gained significant popularity due to its high performance and flexibility. | [32] |
| LightGBM | LightGBM is a fast and efficient gradient-boosting framework that uses a novel leaf-wise tree growth algorithm. It can handle large datasets and categorical features directly, making it suitable for various machine learning tasks. LightGBM’s speed and accuracy have made it a popular choice for many applications. | [55] |
| CatBoost | CatBoost is a gradient-boosting algorithm specifically designed to handle categorical features effectively. It employs a unique algorithm for categorical feature encoding and handles missing values automatically. CatBoost has shown a strong performance in various machine learning tasks and is particularly well-suited to datasets with mixed data types. | [56] |
| Histogram-based Gradient Boosting Classification Tree (HistGradientBoosting) | Hist Gradient Boosting is a modern gradient-boosting implementation that leverages histogram-based algorithms for efficient training and prediction. It is inspired by the success of LightGBM and XGBoost and provides a user-friendly interface within the Scikit-learn library. Hist Gradient Boosting is well-suited to large datasets and can handle complex machine learning tasks. | [56] |
| RF | Utilizing bootstrap aggregation (bagging) and random feature selection, a meta-estimator known as the random forest refines multiple decision tree classifiers. This approach strengthens the model’s ability to generate accurate predictions. | [5,57] |
2.3. Validation
Model assessment is a crucial step in evaluating the performance and effectiveness of machine learning techniques. In the context of flash flood susceptibility mapping, the processing is typically treated as a binary classification problem. The model provides two outputs: whether the zone is susceptible to flooding or not. To assess the model’s predictive ability, several standard metrics are used, including accuracy, precision, recall (sensitivity), specificity, and the F1 score. Additionally, the receiver operating characteristic (ROC) curve is employed as a threshold-independent metric to visualize the trade-off between true positive (TP), true negative (TN), false positive (FP), and false positive (FP) rates. These evaluation metrics are derived from the confusion matrix, which compares predicted results with actual observations [58,59,60].
where represents the predicted value, is the actual value, and n is the total number of samples [58].
Here, .
3. Results
3.1. Multicollinearity Assessment and Relevant Factor Selection
Figure 4 presents a correlation matrix (a) and a Variance Inflation Factor (VIF) analysis (b) for the flood conditioning factors used in this study. The correlation matrix reveals the relationships between key variables, such as river density, Topographic Wetness Index (TWI), lithology, rainfall, slope, and curvature metrics. The values indicate the strength and direction of these relationships, with the highest positive correlation (0.59) observed between river density and the TWI. Other notable correlations include those between the TWI and inventory (0.38), slope and fault density (0.45), and rainfall and lithology (0.55). These correlations provide valuable insights into how these factors interact and influence flood susceptibility.
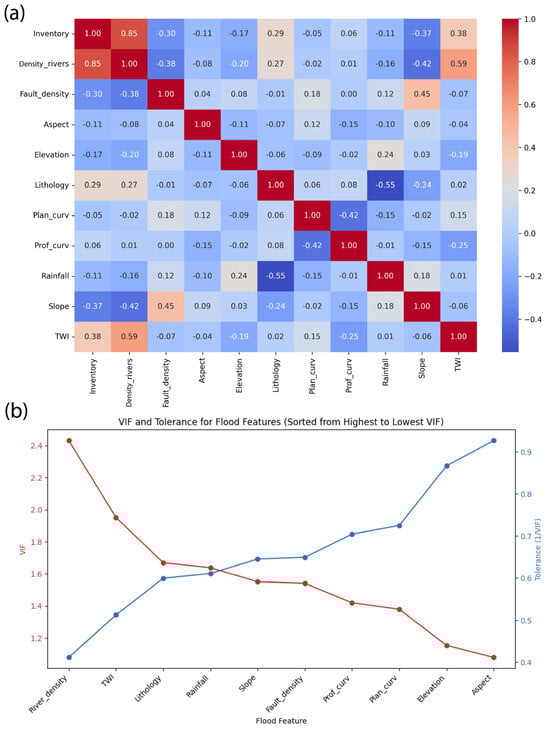
Figure 4.
Correlation analysis and multicollinearity diagnostics among flood-conditioning factors used in the Flood Prediction Model (FPM). In subfigure (a), the color scale indicates the strength and direction of Pearson’s correlation (from −1 to +1). In subfigure (b), the red and blue lines represent the Variance Inflation Factor (VIF) and Tolerance values, respectively.
The VIF analysis (b) was conducted to evaluate multicollinearity among the factors, ensuring the robustness of the model by identifying potential redundancies. The results indicate that the river density has the highest VIF value, followed by the TWI, lithology, and rainfall. This suggests that these variables may share overlapping information, which could compromise the model’s reliability. To address this, factors with high multicollinearity, such as river density and the TWI, were carefully assessed and considered for exclusion in subsequent analyses.
The VIF quantifies the extent of multicollinearity by measuring how much the variance of a regression coefficient is inflated due to correlations with other independent variables. It is calculated as
where R2i is the coefficient of determination when regressing the predictor on all other predictors. Commonly accepted VIF thresholds:
VIF = 1/1 − R2i
- VIF < 5: Indicates low or acceptable multicollinearity.
- VIF between 5 and 10: Suggests moderate multicollinearity; caution advised.
- VIF > 10: Indicates high multicollinearity and potential issues in regression modeling [61,62].
Tolerance is defined as the reciprocal of VIF:
TOL = 1 − R2i = 1/VIF
Tolerance interpretation: TOL > 0.2: Generally considered acceptable.
TOL < 0.1: Suggests severe multicollinearity and justifies exclusion of the variable [63].
Table 3 presents VIF and tolerance values for the flood conditioning factors used in this study. The VIF values, which range from 1.08 (aspect) to 2.43 (river density), indicate the level of multicollinearity among the variables. Tolerance values, ranging from 0.41 (river density) to 0.93 (aspect), further confirm the independence of the factors. These metrics were used to identify and address potential redundancies, ensuring the robustness of the flood susceptibility model. Furthermore, the Mutual Information (MI) analysis of the remaining factors highlights their relative importance in predicting flood susceptibility. For example, slope and elevation demonstrate a significant influence, as evidenced by their moderate correlation values (0.37 and 0.17, respectively).
Table 3.
Variance Inflation Factor (VIF) and tolerance values for flood conditioning factors. The tolerance is optimal with values higher than 0.25.
3.2. FPM Using Various Boosting and RF Algorithms
The results indicate that the central region of the Upper Drâa Basin, particularly around the cities and oases of Taznakht, Skoura, and Ouarzazate, shows an increased susceptibility to flooding (Figure 5), especially in areas with a higher population density and agricultural activity. This vulnerability is particularly pronounced in the maps generated by the GBM, CATBT, and LBT algorithms, where extensive areas are highlighted in red with a very high susceptibility (refer to Figure 5). These models reveal a broader distribution of critical areas, as well as suggesting greater sensitivity to extreme hydrological events according to the last flooding events [8].
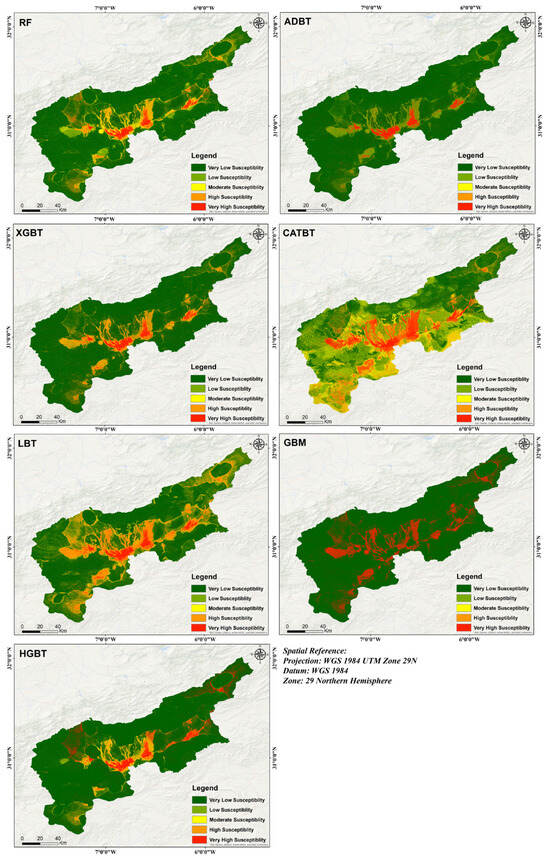
Figure 5.
FPM extracted using RF, AdaBoost, XGB, CatBoost, LightBoost, GBM, and HistGBT.
In the northwest, the Taznakht area exhibits a high concentration of moderate to very high-susceptibility zones (refer to Figure 5), due to its rugged topography and proximity to ephemeral watercourses. The Skoura region, located centrally within the basin and known for its oases and agricultural areas, also shows high susceptibility, particularly along major irrigation channels and urban zones. Ouarzazate, situated in the southeastern part of the basin (refer to Figure 5), is highly exposed to flash floods originating from the surrounding mountains, with significant susceptibility to flooding events identified around major infrastructures and residential surfaces.
Comparatively, the GBM and CATBT models exhibit greater sensitivity to densely populated and hydrologically active regions, including Taznakht, Skoura, and Ouarzazate, while the RF and ADBT models tend to underestimate critical zones, particularly in peripheral areas. XGBT, LBT, and HGBT (Figure 5) offer a balanced solution, accurately locating major risk areas while maintaining spatial accuracy. These findings highlight the importance of using multiple algorithms to enhance flood susceptibility mapping and the identification of risk areas for effective urban planning. The comparison highlights the importance of a multi-model ensemble in flood susceptibility mapping. High-sensitivity models like GBM and CATBT are suited to detailed risk detection in populated or critical areas. Conservative models such as RF and ADBT identify only the most evident risk zones, serving as stable references. Meanwhile, balanced models like XGBT, LBT, and HGBT offer reliable generalization across varied landscapes. This justifies combining multiple boosting algorithms within the FPM framework to improve accuracy and support flood risk planning.
3.3. Feature Importance Analysis
Across the six ensemble and booting ML models, river density consistently emerges as the most influential factor in flood susceptibility in the UDB, underscoring its critical role in predicting flood occurrence (Figure 6). Other factors, such as TWI, slope, and rainfall, also show significant importance (Figure 7), though their rankings vary depending on the algorithm, as indicated by the analysis as well as its SHAP explainability (refer to Section 3.6). These variations highlight how different boosting models prioritize variables, providing valuable insights for selecting optimal features to enhance prediction accuracy, as previously highlighted in the extracted maps (Figure 5). The consistent prominence of river density across all models reinforces its reliability as a key predictor in flood risk modeling (Figure 6). To validate and calibrate the flood susceptibility models, historical flood event locations were identified across the study area based on field observations, official reports, and local media sources. The main affected areas include Ouarzazate city center, Taznakht, Kelaat M’Gouna, and surrounding communes. These sites represent a range of physiographic and urban conditions within the Upper Drâa Basin. Figure 6 illustrates the spatial distribution of these flood-prone zones and provides visual evidence from past flood events.
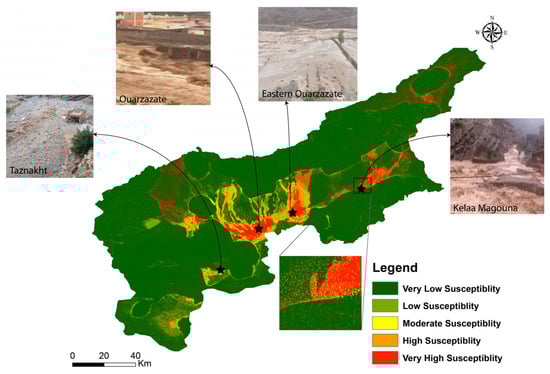
Figure 6.
Flood susceptibility mapping in the Upper Drâa Basin using the HGBT model, validated by field observations.
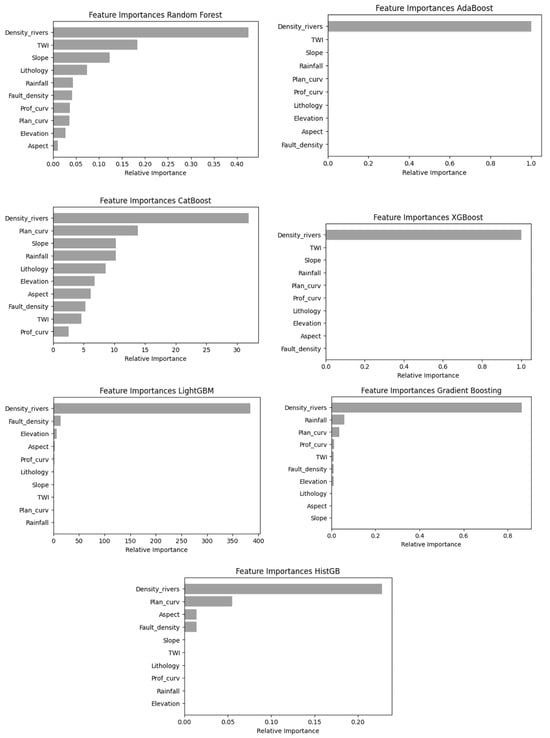
Figure 7.
Feature extraction analysis of flood controlling variables for applied models.
3.4. Analysis of FPM Using Various Boosting and RF Algorithms Using Performance Metrics
HistGB, CatBoost, and LightGBM stand out as the top-performing models in terms of predictive accuracy, largely due to their sophisticated ensemble methods that enhance both recognition rates and generalization abilities. By combining the predictions of multiple base learners, these models excel at capturing complex patterns within the data (Figure 8).
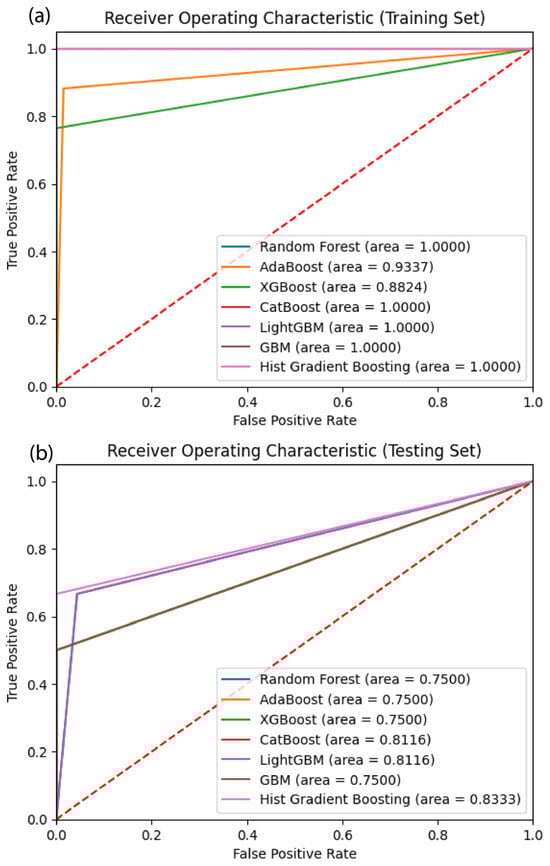
Figure 8.
(a,b) ROC curve results.
Table 4 compares the performance of several ML models of random forest (RF), AdaBoost, XGBoost, CatBoost, LightBoost, GBM, and Hist Gradient Boosting on a test dataset. The first six models share an MSE of 0.103 and an RMSE of 0.321, while Hist Gradient Boosting achieves a lower MSE of 0.068 and an RMSE of 0.262, demonstrating a superior regression performance. Metrics including accuracy, precision, recall, F1 score, and AUC-ROC are used to evaluate the models’ ability to handle imbalanced datasets and classify samples correctly (Table 4). Hist Gradient Boosting stands out for regression, while other models may excel in specific classification contexts. Since lower MSE and RMSE values indicate a better performance by minimizing the average squared difference between predicted and actual values, Hist Gradient Boosting demonstrates a clear advantage.
Table 4.
Performance analysis findings extracted for testing/training data.
3.5. Evaluation of Classification Models and Prioritization Analysis
Models are evaluated using a comprehensive set of metrics, including precision, recall, F1 score, specificity, Cohen’s kappa, MCC, sensitivity, FPR, OA, and area under the curve (AUC). These metrics provide a detailed understanding of a model’s ability to correctly classify samples, handle imbalanced datasets, and generalize to unseen data [59,60]. Precision, which measures the proportion of true positives among predicted positives, is perfect (1.0) for most models (Table 4). However, CatBoost and LightGBM achieve a slightly lower precision of 0.8. Recall, which evaluates a model’s ability to correctly identify actual positives, is 0.5 for the first six models but improves to 0.667 for CatBoost, LightGBM, and Hist Gradient Boosting (Table 4). The F1 score, a harmonic mean of precision and recall, is 0.667 for the first six models (Table 4), increases to 0.727 for CatBoost and LightGBM, and peaks at 0.8 for Hist Gradient Boosting, highlighting its superior classification performance [58]. Specificity, which quantifies the proportion of true negatives correctly identified, is 1.0 for most models but slightly lower at 0.956522 for CatBoost and LightGBM. Cohen’s kappa coefficient, a measure of agreement beyond chance, is 0.613 for the first six models but improves to 0.664 for CatBoost and LightGBM. Hist Gradient Boosting achieves the highest kappa score of 0.760, demonstrating its robustness. Similarly, MCC, another robust measure of classification accuracy, follows the same trend, with values of 0.665 for the first six models, 0.668 for CatBoost and LightGBM, and a peak of 0.783 for Hist Gradient Boosting (Table 4). Sensitivity, equivalent to recall, remains at 0.5 for the first six models but improves to 0.667 for CatBoost, LightGBM, and Hist Gradient Boosting. The FPR, representing the proportion of incorrect positive classifications, is 0 for most models but slightly higher at 0.043 for CatBoost and LightGBM. Lower FPR values are preferable, as they indicate fewer false positives. In terms of overall accuracy, the first six models achieve an accuracy of 0.896, while Hist Gradient Boosting outperforms them with a higher accuracy of 0.931 (Table 4). Additionally, AUC is a single scalar value that summarizes the overall performance of a classifier across all possible thresholds. An AUC of 1.0 indicates a perfect classifier, while an AUC of 0.5 suggests a classifier no better than random. Generally, a higher AUC value signifies a better model performance. The AUC score is 0.75 for the first six models, increases to 0.811 for CatBoost and LightGBM, and reaches a maximum of 0.833 for Hist Gradient Boosting (Table 4), further confirming its superior performance [60]. Based on all the metric values, almost all boosting ML models used reveal perfect values in their accuracy metric results on training data (Table 4).
Prioritization analysis for optimal model selection to identify the optimal model was conducted. Hist Gradient Boosting emerged as the top-performing model, demonstrating a high performance on both training and testing datasets. The analysis revealed that Hist Gradient Boosting exhibits a strong predictive capability, as indicated by high-rank values. Additionally, the model exhibits minimal overfitting, as the “Final R-test” bar is close in height to the “Final R-train” bar, outperforming all the other models. This close alignment indicates that the model generalizes effectively to unseen data and mitigates overfitting, a common problem where models excel on training data but perform poorly on new data due to excessive adaptation to noise (Figure 9) [58].
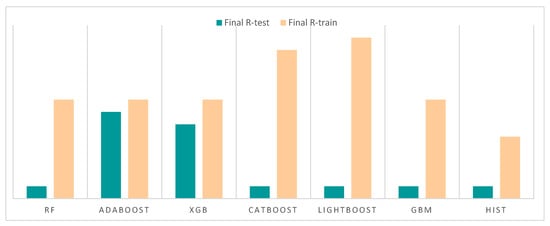
Figure 9.
Prioritization graph extracted for the applied models.
3.6. Shapely-Based ML Explainability
The results show that the river density is the most influential variable in predicting the flood risk. Low values of this variable, corresponding to proximity to watercourses, significantly increase the probability of flooding in the study area [2,8]. Similarly, fault density has a significant effect: higher values of this variable increase flood risk, suggesting a connection between geological structures and water accumulation or infiltration [64]. The variables rainfall and Topographic Wetness Index (TWI) also have a positive impact on predictions. Higher values of these factors increase the probability of flooding, reflecting their role in soil saturation and surface runoff [49]. In contrast, variables such as aspect and slope have a more limited effect, suggesting a lesser contribution to flood risk prediction (Figure 10). A comparison between the two models reveals consistency in the importance of the main explanatory variables. This overall stability in the results reinforces the relevance of proximity to rivers and fault density as major factors in predicting the flood risk [65,66]
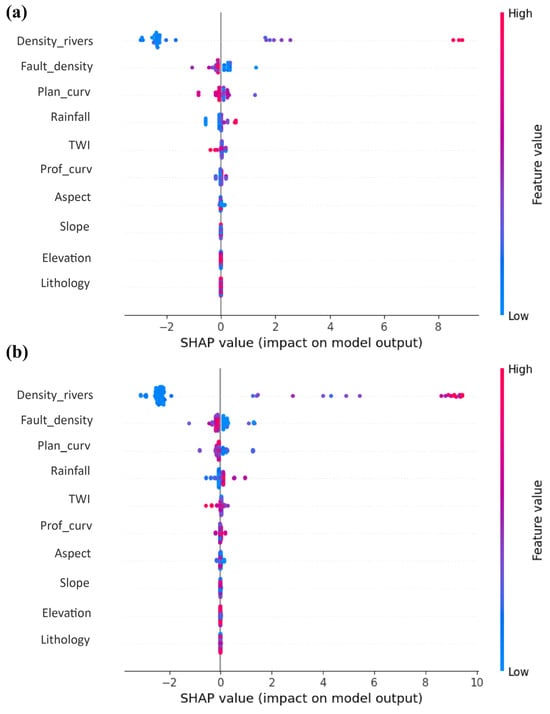
Figure 10.
HistGBoost explainability from test (a), and training data (b).
4. Discussion
In summary, Hist Gradient Boosting consistently outperforms the other models across both regression and classification metrics, demonstrating a superior predictive power. While the first six models exhibit a comparable performance, Hist Gradient Boosting achieves substantial improvements, particularly in regression metrics and overall classification accuracy. Additionally, CatBoost and LightGBM offer slight enhancements in several classification measures compared to the initial six models. These findings highlight the advantages of employing Hist Gradient Boosting for the given dataset and task. Furthermore, both models integrate regularization techniques and support customizable loss functions, effectively reducing overfitting and streamlining the learning process. As a result, CatBoost and LightGBM consistently achieve superior simulation outcomes, proving their reliability and effectiveness for flood susceptibility mapping. This makes them highly practical and suitable for real-world applications in flood risk assessment and management. The ROC curve analysis for both the training and testing sets further validates the robustness of Hist Gradient Boosting, with an AUC of 1 on the training set and 0.83 on the testing set. This indicates that the model not only fits the training data exceptionally well but also generalizes effectively to unseen data. While RF, AdaBoost, XGBoost, and GBM achieve perfect scores on the training set, their performance drops significantly on the testing set, with AUC values of 0.750. This suggests potential overfitting issues in these models, which Hist Gradient Boosting successfully mitigates through its advanced regularization techniques. A test AUC of 0.833 is obtained, underscoring its discriminative efficacy. Notably, this aligns with the superior performance of Boosting-based models such as the XGBoost, in prior studies such as Bammou et al. [11], wherein AUC metrics exceeded 0.930 (compared to RF, SVM, K-Nearest Neighbor, Decision Trees, ANN, and LR), confirming its consistent generalizability across different geoclimatic contexts. Furthermore, the methodological rigor of this study is also corroborated by Hitouri et al.’s [37] integrative ML-RS framework in the Metlili watershed, although our performance metrics notably exceed those reported for XGBoost in that study (AUC = 0.727) (compared to CART and SVM), thereby reinforcing the demonstrable enhancement in predictive fidelity exhibited by the present models, and illuminating the broader methodological contribution of this study in its systematic appraisal of both foundational and state-of-the-art boosting-based models, within the geospatial hydrological flood threat modeling domain.
The feature importance analysis reveals that river density is consistently the most influential factor across all models, underscoring the critical role of proximity to water bodies in flood susceptibility. Other significant factors include slope, rainfall, and TWI (Topographic Wetness Index), which align with findings from previous studies [52,67]. For instance, areas with low slopes and high TWI values are more prone to flooding due to their reduced capacity to drain water efficiently. These insights are crucial for identifying high-risk zones and implementing targeted mitigation strategies. These results are consistent with the work of [68], who also emphasized the importance of topographic and hydrological factors in flood prediction. The highlighted important factors are consistent with the environmental characteristics of the study area, characterized by flash floods [2,22,68]. Following the feature importance analysis, the rainfall and the closeness to the river are identified as the most controlling factors in analogous regions around the world [21]. Accordingly, the importance of the rainfall factor is well justified against other environments where topography is more relevant in the flood occurrence.
Despite the strong performance of Hist Gradient Boosting, CatBoost, and LightGBM, certain limitations must be acknowledged. The reliance on high-quality and comprehensive datasets remains a challenge, particularly in regions with limited hydrological data. Additionally, the computational complexity of these models, especially CatBoost, can be a barrier to their widespread adoption in resource-constrained settings. Future research should focus on optimizing these algorithms for efficiency and exploring hybrid approaches that combine their strengths with simpler, interpretable models. Further studies should incorporate both temporal (e.g., seasonal rainfall variability, antecedent soil moisture) and spatial (e.g., high-resolution terrain attributes, land-use changes) features to further enhance flood susceptibility assessment in the study area. Such advancements would improve dynamic risk modeling and better capture the hydro-meteorological drivers of flooding in semi-arid regions.
5. Conclusions
This study highlights the effectiveness of advanced boosting algorithms, particularly Hist Gradient Boosting, CatBoost, and LightGBM, in flood susceptibility mapping. These models demonstrate a remarkable ability to handle complex datasets, mitigate overfitting, and deliver accurate predictions, making them invaluable tools for flood risk assessment and management. By integrating these models into decision-making processes, stakeholders can better prepare for and mitigate the impacts of flooding, ultimately enhancing community resilience and safety. Future work should explore the integration of additional environmental and socio-economic factors to further refine these models and expand their applicability to diverse geographical contexts. The findings of this study align with previous research that emphasizes the importance of factors such as elevation, rainfall, and slope in flood susceptibility mapping. The high accuracy achieved by boosting algorithms like Hist Gradient Boosting and Gradient Boosting underscores their potential for flood risk prediction in various regions. Similarly, the effectiveness of advanced machine learning techniques in diverse environments has been validated, highlighting their broader applicability in natural hazard assessment. This study provides a comprehensive evaluation of boosting-based machine learning models for flood susceptibility mapping in the Upper Drâa Basin. Several key scientific conclusions emerge from our analysis:
- Among the tested models, Hist Gradient Boosting exhibited the highest predictive accuracy, with an overall accuracy of 93.1% and an AUC of 0.833, significantly outperforming traditional ensemble techniques such as random forest and AdaBoost.
- Hist Gradient Boosting achieved the lowest MSE (0.069) and RMSE (0.262), indicating its robustness in handling continuous flood susceptibility predictions.
- The use of boosting algorithms improved classification performance, particularly in precision (1.0 for most models), with a high AUC, OA, and F1 score (0.8 for Hist Gradient Boosting), ensuring reliable flood-prone area identification.
- Compared to traditional classifiers, boosting-based models, particularly CatBoost, LightGBM, and Hist Gradient Boosting, showed improved generalization, reducing false positive rates and enhancing kappa values from 0.613 to 0.7603, indicating a higher agreement with ground truth data.
- These results provide critical insights for flood risk management in data-scarce regions. The integration of sophisticated boosting ML, GIS, and remote-sensing data enables precise mapping, aiding decision-makers in proactive flood mitigation and urban planning.
The methodology and insights from this study demonstrate the importance of accurate susceptibility mapping for informed decision-making and risk management. Future research should focus on incorporating temporal data, climate change projections, and dynamic factors like urbanization trends to enhance the accuracy and applicability of these models. In this way, we can develop more comprehensive tools for real-time monitoring and risk mitigation, ultimately contributing to safer and more resilient communities worldwide. Additionally, integrating real-time satellite data could enhance the adaptability of these models in dynamic flood forecasting scenarios. This study confirms that boosting algorithms, particularly Hist Gradient Boosting, provide a reliable, scalable approach to flood susceptibility mapping, bridging gaps in ML-based flood risk assessments.
Author Contributions
Conceptualization, L.G. and S.H. (Soufiane Hajaj); methodology, L.G., B.E.M., A.M., M.K. and S.H. (Soufiane Hajaj); software, L.G. and S.H. (Soufiane Hajaj); validation, L.G., B.E.M., S.H. (Soufiane Hajaj) and S.H. (Souad Haida); formal analysis, L.G. and M.K.; investigation, L.G.; resources, L.G. and B.E.M.; data curation, L.G.; writing—original draft preparation, L.G., B.E.M., A.M., M.K., and S.H. (Soufiane Hajaj); writing—review and editing, L.G., A.E.H., M.K., and B.E.M.; visualization, L.G., A.J., and Y.K.; supervision, B.E.M.; project administration, L.G. All authors have read and agreed to the published version of the manuscript.
Funding
This research received no external funding.
Data Availability Statement
The used data in the present manuscript are confidential.
Conflicts of Interest
The authors declare no potential conflicts of interest.
Appendix A
Table A1.
Hyperparameter tuning for grid search optimization.
Table A1.
Hyperparameter tuning for grid search optimization.
| Model | Hyperparameters |
|---|---|
| RF | n_estimators: 50–200 criterion: gini, entropy bootstrap: True, False |
| AB | n_estimators = 10–500 learning_rate = 0.0001–1.0 |
| XGB | n_estimators = 10–500 learning_rate = 0.0001–1.0 max_depth = 3–9 |
| CatBoost | iterations: 10–500 learning_rate: 0.0001–1.0 depth: 3–9 |
| LightGBM | n_estimators: 10–500 learning_rate: 0.0001–1.0 max_depth: 3–9 min_child_samples: 5–20 |
| GBM | n_estimators = 10–500 learning_rate = 0.0001–1.0 max_depth = 3–9 min_samples_split = 2–10 min_samples_leaf = 1–4 |
| HGB | max_iter = 10–500 learning_rate = 0.0001–1.0 max_depth = 3–9 min_samples_leaf = 1–4 |
Table A2.
Best hyperparameters.
Table A2.
Best hyperparameters.
| Model | Best hyperparameters |
|---|---|
| RF | bootstrap: False, criterion: gini, n_estimators: 50 |
| AB | learning_rate = 0.001, n_estimators = 100 |
| XGB | learning_rate: 0.01, max_depth: 3, n_estimators: 100 |
| CatBoost | depth: 9, iterations: 50, learning_rate: 1.0 |
| LightGBM | n_estimators: 10, min_child_samples: 10, max_depth: 9, learning_rate: 0.1 |
| GBM | learning_rate: 0.01, max_depth: 3, min_samples_leaf: 2, min_samples_split: 2, n_estimators: 500 |
| HGB | learning_rate: 0.01, max_depth: 5, max_iter: 500, min_samples_leaf: 4 |
References
- Tehrany, M.S.; Pradhan, B.; Jebur, M.N. Flood susceptibility mapping using a novel ensemble weights-of-evidence and support vector machine models in GIS. J. Hydrol. 2014, 512, 332–343. [Google Scholar] [CrossRef]
- Khaddari, A.; Jari, A.; Chakiri, S.; El Hadi, H.; Labriki, A.; Hajaj, S.; El Harti, A.; Goumghar, L.; Abioui, M. A Comparative analysis of analytical hierarchy process and fuzzy logic modeling in flood susceptibility mapping in the Assaka Watershed, Morocco. J. Ecol. Eng. 2023, 24, 62–83. [Google Scholar] [CrossRef] [PubMed]
- Abedi, R.; Costache, R.; Shafizadeh-Moghadam, H.; Pham, Q.B. Flash-flood susceptibility mapping based on XGBoost, random forest and boosted regression trees. Geocarto Int. 2021, 37, 5479–5496. [Google Scholar] [CrossRef]
- Cao, Y.; Jia, H.; Xiong, J.; Cheng, W.; Li, K.; Pang, Q.; Yong, Z. Flash flood susceptibility assessment based on geodetector, certainty factor, and logistic regression analyses in Fujian Province, China. ISPRS Int. J. Geo-Inf. 2020, 9, 748. [Google Scholar] [CrossRef]
- Hosseini, F.S.; Choubin, B.; Mosavi, A.; Nabipour, N.; Shamshirband, S.; Darabi, H.; Haghighi, A.T. Flash-flood hazard assessment using ensembles and Bayesian-based machine learning models: Application of the simulated annealing feature selection method. Sci. Total Environ. 2020, 711, 135161. [Google Scholar] [CrossRef]
- Mashaly, J.; Ghoneim, E. Flash flood hazard using optical, radar, and stereo-pair derived dem: Eastern Desert, Egypt. Remote Sens. 2018, 10, 1204. [Google Scholar] [CrossRef]
- Zhao, B.; Su, L.; Xu, Q.; Li, W.; Xu, C.; Wang, Y. A review of recent earthquake-induced landslides on the Tibetan Plateau. Earth-Sci. Rev. 2023, 244, 104534. [Google Scholar] [CrossRef]
- Goumghar, L.; Fri, R.; Hajaj, S.; Taia, S.; El Mansouri, B. Integrating geospatial data and analytic hierarchy process for flood-prone zones mapping in the Upper Draa basin, Morocco. Ecol. Eng. Environ. Technol. 2025, 26, 251–268. [Google Scholar] [CrossRef]
- Islam, T.; Zeleke, E.B.; Afroz, M.; Melesse, A.M. A Systematic Review of Urban Flood Susceptibility Mapping: Remote Sensing, Machine Learning, and Other Modeling Approaches. Remote Sens. 2025, 17, 524. [Google Scholar] [CrossRef]
- Aghenda, M.; Labbaci, A.; Hssaisoune, M.; Bouchaou, L. Flood Susceptibility Mapping Using Neural Network Based Models in Morocco: Case of Souss Watershed. Copernicus Meetings 2024. Available online: https://ui.adsabs.harvard.edu/abs/2024EGUGA..26.3447A/abstract (accessed on 29 June 2025).
- Bammou, Y.; Benzougagh, B.; Igmoullan, B.; Ouallali, A.; Kader, S.; Spalevic, V.; Sestras, P.; Billi, P.; Marković, S.B. Optimizing flood susceptibility assessment in semi-arid regions using ensemble algorithms: A case study of Moroccan High Atlas. Nat. Hazards 2024, 120, 7787–7816. [Google Scholar] [CrossRef]
- Jari, A.; Khaddari, A.; Hajaj, S.; Bachaoui, E.M.; Mohammedi, S.; Jellouli, A.; Mosaid, H.; El Harti, A.; Barakat, A. Landslide Susceptibility Mapping Using Multi-Criteria Decision-Making (MCDM), Statistical, and Machine Learning Models in the Aube Department, France. Earth 2023, 4, 698–713. [Google Scholar] [CrossRef]
- Tabarestani, E.S.; Hadian, S.; Pham, Q.B.; Ali, S.A.; Phung, D.T. Flood potential mapping by integrating the bivariate statistics, multi-criteria decision-making, and machine learning techniques. Stoch. Environ. Res. Risk Assess. 2022, 37, 1415–1430. [Google Scholar] [CrossRef]
- Chapi, K.; Singh, V.P.; Shirzadi, A.; Shahabi, H.; Bui, D.T.; Pham, B.T.; Khosravi, K. A novel hybrid artificial intelligence approach for flood susceptibility assessment. Environ. Model. Softw. 2017, 95, 229–245. [Google Scholar] [CrossRef]
- Dou, J.; Yamagishi, H.; Pourghasemi, H.R.; Yunus, A.P.; Song, X.; Xu, Y.; Zhu, Z. An integrated artificial neural network model for the landslide susceptibility assessment of Osado Island, Japan. Nat. Hazards 2015, 78, 1749–1776. [Google Scholar] [CrossRef]
- Nguyen, H.D.; Nguyen, V.H.; Du, Q.V.V.; Nguyen, C.T.; Dang, D.K.; Truong, Q.H.; Dang, N.B.T.; Tran, Q.T.; Nguyen, Q.-H.; Bui, Q.-T. Application of hybrid model-based machine learning for groundwater potential prediction in the north central of Vietnam. Earth Sci. Inform. 2024, 17, 1–21. [Google Scholar] [CrossRef]
- Kawabata, D.; Bandibas, J. Landslide susceptibility mapping using geological data, a DEM from ASTER images and an Ar-tificial Neural Network (ANN). Geomorphology 2009, 113, 97–109. [Google Scholar] [CrossRef]
- Chauhan, V.; Gupta, L.; Dixit, J. Landslide susceptibility assessment for Uttarakhand, a Himalayan state of India, using multi-criteria decision making, bivariate, and machine learning models. Geoenvironmental Disasters 2025, 12, 1–25. [Google Scholar] [CrossRef]
- Bui, D.T.; Hoang, N.-D.; Martínez-Álvarez, F.; Ngo, P.-T.T.; Hoa, P.V.; Pham, T.D.; Samui, P.; Costache, R. A novel deep learning neural network approach for predicting flash flood susceptibility: A case study at a high frequency tropical storm area. Sci. Total Environ. 2020, 701, 134413. [Google Scholar] [CrossRef]
- Kia, M.B.; Pirasteh, S.; Pradhan, B.; Mahmud, A.R.; Sulaiman, W.N.A.; Moradi, A. An artificial neural network model for flood simulation using GIS: Johor River Basin, Malaysia. Environ. Earth Sci. 2011, 67, 251–264. [Google Scholar] [CrossRef]
- Islam, A.R.M.T.; Mia, M.U.; Nova, N.A.; Chakrabortty, R.; Khan, M.S.I.; Ghose, B.; Costache, R. Enhancing flood susceptibility mapping in Meghna River basin by introducing ensemble Naive Bayes with stacking algorithms. Geomat. Nat. Hazards Risk 2025, 16, 2464049. [Google Scholar] [CrossRef]
- Talha, S.; Maanan, M.; Atika, H.; Rhinane, H. Prediction of flash flood susceptibility using fuzzy analytical hierarchy process (fahp) algorithms and gis: A study case of guelmim region in southwestern of Morocco. ISPRS—Int. Arch. Photogramm. Remote Sens. Spat. Inf. Sci. 2019, XLII-4/W19, 407–414. [Google Scholar] [CrossRef]
- Negese, A.; Worku, D.; Shitaye, A.; Getnet, H. Potential flood-prone area identification and mapping using GIS-based multi-criteria decision-making and analytical hierarchy process in Dega Damot district, northwestern Ethiopia. Appl. Water Sci. 2022, 12, 1–21. [Google Scholar] [CrossRef]
- Freund, Y.; Schapire, R.E. A decision-theoretic generalization of on-line learning and an application to boosting. J. Comput. Syst. Sci. 1997, 55, 119–139. [Google Scholar] [CrossRef]
- Breiman, L. Arcing Classifiers (with discussion and a rejoinder by the author). Ann. Stat. 1998, 26, 801–849. [Google Scholar] [CrossRef]
- Friedman, J.H. Greedy function approximation: A gradient boosting machine. Ann. Stat. 2001, 29, 1189–1232. [Google Scholar] [CrossRef]
- Rätsch, G.; Onoda, T.; Müller, K.-R. Soft margins for AdaBoost. Mach. Learn. 2001, 42, 287–320. [Google Scholar] [CrossRef]
- Mason, L.; Bartlett, P.L.; Baxter, J. Improved generalization through explicit optimization of margins. Mach. Learn. 2000, 38, 243–255. [Google Scholar] [CrossRef]
- Dietterich, T.G. Ensemble methods in machine learning. In International Workshop on Multiple Classifier Systems; Springer: Berlin/Heidelberg, Germany, 2000. [Google Scholar]
- Tehrany, M.S.; Pradhan, B.; Jebur, M.N. Flood susceptibility analysis and its verification using a novel ensemble support vector machine and frequency ratio method. Stoch. Environ. Res. Risk Assess. 2015, 29, 1149–1165. [Google Scholar] [CrossRef]
- Merz, B.; Hall, J.; Disse, M.; Schumann, A. Fluvial flood risk management in a changing world. Nat. Hazards Earth Syst. Sci. 2010, 10, 509–527. [Google Scholar] [CrossRef]
- Chen, T.; Guestrin, C. Xgboost: A scalable tree boosting system. In Proceedings of the 22nd ACM SIGKDD International Con-ference on Knowledge Discovery and Data Mining, San Francisco, CA, USA, 13–17 August 2016. [Google Scholar]
- Natekin, A.; Knoll, A. Gradient boosting machines, a tutorial. Front. Neurorobotics 2013, 7, 21. [Google Scholar] [CrossRef]
- Mathur, P.; Mathur, M. Machine learning ensemble species distribution modeling of an endangered arid land tree Tecomella undulata: A global appraisal. Arab. J. Geosci. 2023, 16, 1–28. [Google Scholar] [CrossRef]
- Bammou, M.; Bouhlali, E.D.T.; Sellam, K.; Derouich, M.; El-Rhaffari, L.; Ibijbijen, J.; Nassiri, L. Chemical profile and antimicrobial properties of liquid and vapor phases of the essential oil of Cladanthus eriolepis: An endemic asteraceae growing in the Moroccan oases. J. Essent. Oil Bear. Plants 2020, 23, 1042–1053. [Google Scholar] [CrossRef]
- El Khalki, E.M.; Tramblay, Y.; Massari, C.; Brocca, L.; Simonneaux, V.; Gascoin, S.; Saidi, M.E.M. Challenges in flood modeling over data-scarce regions: How to exploit globally available soil moisture products to estimate antecedent soil wetness conditions in Morocco. Nat. Hazards Earth Syst. Sci. 2020, 20, 2591–2607. [Google Scholar] [CrossRef]
- Hitouri, S.; Mohajane, M.; Lahsaini, M.; Ali, S.A.; Setargie, T.A.; Tripathi, G.; D’antonio, P.; Singh, S.K.; Varasano, A. Flood susceptibility mapping using SAR data and machine learning algorithms in a small watershed in northwestern Morocco. Remote Sens. 2024, 16, 858. [Google Scholar] [CrossRef]
- Fels, A.E.A.E.; Alaa, N.; Bachnou, A.; Rachidi, S. Flood frequency analysis and generation of flood hazard indicator maps in a semi-arid environment, case of Ourika watershed (western High Atlas, Morocco). J. Afr. Earth Sci. 2018, 141, 94–106. [Google Scholar] [CrossRef]
- Fico, J. Watering the Desert, Draining the Oasis: Navigating Drought, Development, and Irrigation Politics in the Draa Valley, Morocco; Syracuse University: New York, NY, USA, 2022; p. 147. [Google Scholar]
- Tachikawa, T.; Kaku, M.; Iwasaki, A.; Gesch, D.B.; Oimoen, M.J.; Zhang, Z.; Carabajal, C.; ASTER Global Digital Elevation Model Version 2-Summary of Validation Results. Available online: https://lpdaac.usgs.gov/documents/220/Summary_GDEM2_validation_report_final.pdf (accessed on 29 June 2025).
- Bense, V.; Gleeson, T.; Loveless, S.; Bour, O.; Scibek, J. Fault zone hydrogeology. Earth-Sci. Rev. 2013, 127, 171–192. [Google Scholar] [CrossRef]
- Ghosh, A.; Dey, P.; Ghosh, T. Integration of RS-GIS with frequency ratio, fuzzy logic, logistic regression and decision tree models for flood susceptibility prediction in lower gangetic plain: A study on malda district of West Bengal, India. J. Indian Soc. Remote Sens. 2022, 50, 1725–1745. [Google Scholar] [CrossRef]
- Choubert, G. Histoire géologique du domaine de l’Anti-Atlas. Notes Mém. Serv. Géol. Maroc. 1952, 100, 77–172. [Google Scholar]
- Ferreira, A.; Figueiredo, M.A.; Figueiredo, T. Boosting algorithms: A review of methods, theory, and applications. In Ensemble Machine Learning. Methods Applications; Springer: Berlin/Heidelberg, Germany, 2012. [Google Scholar] [CrossRef]
- Azour, F.; Boukerche, A. An efficient transfer and ensemble learning based computer aided breast abnormality diagnosis system. IEEE Access 2022, 11, 21199–21209. [Google Scholar] [CrossRef]
- Chen, T.; Wei, W.; Jiao, J.; Zhang, Z.; Li, J. Machine learning-based identification for the main influencing factors of alluvial fan development in the Lhasa River Basin, Qinghai-Tibet Plateau. J. Geogr. Sci. 2022, 32, 1557–1580. [Google Scholar] [CrossRef]
- Roder, L.R.; Guerrini, I.A.; Sivisaca, D.C.L.; Puglla, C.A.Y.; de Moraes, F.G.; da Silva, J.P.; Fonseca, R.C.B.; Umbelino, M.T.; James, J.N.; Capra, G.F.; et al. Atlantic rainforest natural regeneration in fragmented formations affected by increasing human disturbance. J. Environ. Manag. 2022, 325, 116521. [Google Scholar] [CrossRef] [PubMed]
- Mosavi, A.; Ozturk, P.; Chau, K.-W. Flood Prediction Using Machine Learning Models: Literature Review. Water 2018, 10, 1536. [Google Scholar] [CrossRef]
- Ashrafi, S.; Kerachian, R.; Pourmoghim, P.; Behboudian, M.; Motlaghzadeh, K. Evaluating and improving the sustainability of ecosystem services in river basins under climate change. Sci. Total Environ. 2022, 806, 150702. [Google Scholar] [CrossRef]
- Undurraga, R.; Vicuña, S.; Melo, O. Compensating Water Service Interruptions to Implement a Safe-to-Fail Approach to Climate Change Adaptation in Urban Water Supply. Water 2020, 12, 1540. [Google Scholar] [CrossRef]
- Arabameri, A.; Rezaei, K.; Cerdà, A.; Conoscenti, C.; Kalantari, Z. A comparison of statistical methods and multi-criteria decision making to map flood hazard susceptibility in Northern Iran. Sci. Total Environ. 2019, 660, 443–458. [Google Scholar] [CrossRef]
- Rachdane, M.; El Khalki, E.M.; Saidi, M.E.; Nehmadou, M.; Ahbari, A.; Tramblay, Y. Comparison of High-Resolution Satellite Precipitation Products in Sub-Saharan Morocco. Water 2022, 14, 3336. [Google Scholar] [CrossRef]
- Bergstra, J.; Bengio, Y. Random search for hyper-parameter optimization. J. Mach. Learn. Res. 2012, 13, 281–305. [Google Scholar]
- Ke, G.; Meng, Q.; Finley, T.; Wang, T.; Chen, W.; Ma, W.; Liu, T.Y. Lightgbm: A highly efficient gradient boosting decision tree. Adv. Neural Inf. Process. Syst. 2017, 30, 1–9. [Google Scholar]
- Dorogush, A.V.; Ershov, V.; Gulin, A. CatBoost: Gradient boosting with categorical features support. arXiv 2018, arXiv:1810.11363. [Google Scholar]
- Mosavi, A.; Golshan, M.; Janizadeh, S.; Choubin, B.; Melesse, A.M.; Dineva, A.A. Ensemble models of GLM, FDA, MARS, and RF for flood and erosion susceptibility mapping: A priority as-sessment of sub-basins. Geocarto Int. 2022, 37, 2541–2560. [Google Scholar] [CrossRef]
- James, G.; Witten, D.; Hastie, T.; Tibshirani, R. An Introduction to Statistical Learning; Springer: Berlin/Heidelberg, Germany, 2013; Volume 112. [Google Scholar]
- Powers, J.S.; Corre, M.D.; Twine, T.E.; Veldkamp, E. Geographic bias of field observations of soil carbon stocks with tropical land-use changes precludes spatial extrapolation. Proc. Natl. Acad. Sci. USA 2011, 108, 6318–6322. [Google Scholar] [CrossRef] [PubMed]
- Fawcett, L.; Walshaw, D. Improved estimation for temporally clustered extremes. Environmetrics Off. J. Int. Environmetrics Soc. 2007, 18, 173–188. [Google Scholar]
- Neter, J.; Kutner, M.H.; Nachtsheim, C.J.; Wasserman, W. Applied Linear Statistical Models; McGraw-Hill: Columbus, OH, USA, 2005; ISBN 0-07-238688-6. [Google Scholar]
- Murtagh, F.; Heck, A. Multivariate data analysis. In Multivariate Data Analysis; Springer Science & Business Media: Berlin/Heidelberg, Germany, 2010; p. 785. [Google Scholar]
- Zhu, E.; Wang, Y.; Yuan, X. Changes of terrestrial water storage during 1981–2020 over China based on dynamic-machine learning model. J. Hydrol. 2023, 621, 129576. [Google Scholar] [CrossRef]
- Zheng, W.; Cao, Y.; Fan, W.; Liang, X.; Yuan, S.; Gao, W.; Zhang, J. Formation processes and mechanisms of a fault-controlled colluvial landslide in the Qinling-Daba Mountains, China. Sci. Rep. 2024, 14, 1–18. [Google Scholar] [CrossRef]
- Kratzert, F.; Gauch, M.; Klotz, D.; Nearing, G. HESS Opinions: Never train a Long Short-Term Memory (LSTM) network on a single basin. Hydrol. Earth Syst. Sci. 2024, 28, 4187–4201. [Google Scholar] [CrossRef]
- Zhang, H.; Jia, H.; Li, C.; Zhang, Q. Exploring the driving factors of urban flood at the catchment Scale: A case study of multitype megacities in China. Ecol. Indic. 2024, 166, 112513. [Google Scholar] [CrossRef]
- Meliho, M.; Khattabi, A.; Driss, Z.; Orlando, C.A. Spatial prediction of flood-susceptible zones in the Ourika watershed of Morocco using machine learning algorithms. Appl. Comput. Inform. 2022; ahead-of-print. [Google Scholar] [CrossRef]
- Saravanan, S.; Abijith, D.; Reddy, N.M.; Kss, P.; Janardhanam, N.; Sathiyamurthi, S.; Sivakumar, V. Flood susceptibility mapping using machine learning boosting algorithms techniques in Idukki district of Kerala India. Urban Clim. 2023, 49, 101503. [Google Scholar] [CrossRef]
- Rachdane, M.; Saidi, M.E.; El Khalki, E.M.; Hadri, A.; Boughdadi, S.; Nehmadou, M.; Ahbari, A.; Tramblay, Y. Unraveling flood dynamics at sub-daily time scales in semi-arid to arid basins in south Morocco. Nat. Hazards 2024, 121, 5413–5433. [Google Scholar] [CrossRef]
Disclaimer/Publisher’s Note: The statements, opinions and data contained in all publications are solely those of the individual author(s) and contributor(s) and not of MDPI and/or the editor(s). MDPI and/or the editor(s) disclaim responsibility for any injury to people or property resulting from any ideas, methods, instructions or products referred to in the content. |
© 2025 by the authors. Licensee MDPI, Basel, Switzerland. This article is an open access article distributed under the terms and conditions of the Creative Commons Attribution (CC BY) license (https://creativecommons.org/licenses/by/4.0/).