Abstract
Sustainable development is increasingly challenged by the growing threats of climate change. There is a close relationship between climate change, public health, and Sustainable Development Goals (SDGs). This study investigates the temperature anomalies in the Kingdom of Bahrain and their potential effects on human health. Furthermore, it proposes solutions to support Bahrain’s SDG-related goals. Data were collected from global studies and statistics and the Bahrain Meteorological Directorate over 50 years, which were then used to calculate the temperature anomalies and the heat indices, thereby exploring the past and present monthly and annual national temperature and sociated risks to human health. The results show that Bahrain is located in an area of high temperature anomalies and high rates of cardiovascular diseases. Furthermore, anomaly calculations indicate a critical rise in temperature, ranging from 1 to 4 °C higher than the averages recorded in the 1960s, 1970s, and 1980s. Such an increase could significantly affect human health, particularly since the heat index results show that summers consistently fall within the extreme danger ranges. In contrast, other seasons have occasionally reached the danger level or required extreme caution in certain years. Consequently, this study offers recommendations to help mitigate the rise in temperature and associated risks in the future.
1. Introduction
Climate change is one of the most pressing environmental issues of our era [1]. Long-term changes in temperature and weather patterns are referred to as climate change [2]. Climate change affects food production, water availability, and weather patterns, thereby posing serious risks to human health [3]. The effects of current warming on human health are already significant, which increases the difficulty of reaching the Sustainable Development Goals (SDGs). Numerous scholarly works provide valuable perspectives on the interplay of various SDGs. There is, however, comparatively little research that focuses on the trade-offs and synergies between other SDGs and climate mitigation strategies [4].
According to the IPCC (high confidence data), between 2011 and 2020, the global surface temperature increased by 1.09 °C more than between 1850 and 1900. Moreover, since 1970, the global surface temperature has risen more quickly than during any other 50-year period in the last 2000 years [5]. Evidence suggests that unless global action is taken, increasing average global temperatures and common, severe, and prolonged heat waves will continue [6]. Warm and hot weather is prevalent in Northern Hemisphere countries, increasing by around 16% for every degree Celsius that global temperatures rise [7].
The COP29 conference increased the importance of understanding and treating extreme heat and its effects on human health. Moreover, prolonged periods of exceptionally high temperatures are having an increasingly negative impact on people’s lives worldwide. In July 2024, the UN Secretary-General launched a global Call to Action on Extreme Heat in response to this escalating disaster. It urges the world community to take action in four crucial areas: take care of those who are vulnerable, safeguard workers, strengthen our communities and the economy by leveraging scientific knowledge and data, and keep the increase in temperature below 1.5 °C [8].
Climate change is increasing people’s exposure to heat, a trend expected to persist. Between 2000 and 2016, the number of people exposed to heatwaves (HWs) rose by approximately 125 million [9]. Humans must maintain thermoregulation, which requires controlling core body temperature at around 37 °C. Excessively high or low temperatures cause discomfort [10]. Since 2015, around 175 million people have been exposed to HWs. Prolonged exposure to high temperatures affects all individuals physiologically, exacerbating pre-existing illnesses and leading to premature death and disability. The World Health Organization (WHO) has released public health recommendations for managing intense heat for the general population and medical professionals [9].
The primary cause of weather-related fatalities is heat stress, which can also worsen underlying conditions, including mental health issues, diabetes, cardiovascular disease, and asthma [11]. It can also raise the likelihood of accidents and the spread of various infectious diseases. A related medical problem with a high death rate is heatstroke. Climate change is causing an exponential increase in the number of individuals exposed to excessive heat in every part of the planet [12]. Extreme temperatures surpassing the body’s thermoregulatory capability can harm the body physiologically and lead to the onset of heat-related illness (HRI) [7]. For those over 65, the risk of dying from heat-related causes rose by over 85% between 2000 and 2004 and 2017 and 2021. Due to climate change, severe heat events and waves will occur more frequently and with greater severity in the 21st century [3].
Temperature and other climatic factors affect infectious diseases, including vector-borne illnesses like dengue fever and malaria, waterborne illnesses like cholera, and foodborne illnesses like salmonellosis. This has led to an increased disease burden and related medical expenses [13], and the WHO declared that around 489,000 yearly heat-related mortalities occurred from 2000 to 2019 worldwide [14]. Alcayna and others from the Red Cross Red Crescent Climate Centre published in 2023 that most morbidity and mortality cases categorised by the high-temperature and humidity effects were respiratory, cardiovascular, and kidney diseases [15].
Furthermore, the environmental and social determinants of physical and mental health are deteriorated by climate shocks and increasing pressures such as rising sea levels, drought, floods, and altered temperature and precipitation patterns [16]. The symptoms of pre-existing mental health disorders might also be made worse by high temperatures. Since high temperature can exacerbate symptoms for those with problems like anxiety disorders, depression, or bipolar disorder, their mental health must be well managed [17]. Although the consequences of climate change on health are now well acknowledged, there is limited data about these implications in developing countries [6].
Many studies have employed the wet-bulb temperature and wet-bulb globe temperature (WBGT) to predict the physiological effects of excessive heat linked to climate change. However, none of the physiological models of thermoregulation that these measurements are based on allow their values to be directly mapped onto physiological states. In contrast, the commonly used heat index relies on a model of human thermoregulation, meaning that each number corresponds to a distinct state of the body [18].
The heat index (HI) is one of the most frequently used indices in environmental health research to indicate thermal comfort. It is employed in studies on exposure to outdoor temperatures and in creating regional-scale heat advisory systems [10]. The index calculates the apparent temperature—how hot it feels to humans—by combining the air temperature and relative humidity. These measures indicate the stress that high air temperatures and moisture levels impose on individuals. Prolonged, abnormally high heat stress may adversely affect public health. The HI is also one of the most common indices used in studying HWs [19]. Populations are becoming increasingly vulnerable to the harmful effects of heat due to ageing populations and rising rates of non-communicable illnesses (such as diabetes, dementia, kidney disease, musculoskeletal disorders, and respiratory and cardiovascular disorders) [3].
Global warming can vary in intensity due to the impact of weather dynamics on local temperatures. The yearly global land temperature anomaly has fluctuated since 1880, although it has generally shown an increasing trend. The peak yearly temperature anomaly was recorded in 2020 at 1.65 °C above normal [20]. Since 1880, the Earth’s average surface temperature has increased by 0.07 °C per decade. Since 1981, this increase has nearly tripled to 0.18 °C [21]. A temperature anomaly is a practical calculation used to assess the severity of the temperature changes; it represents a departure from the long-term average or reference value. Positive temperature anomalies indicate warmer temperatures than the baseline, while negative anomalies suggest colder temperatures [22]. The temperature difference for a particular month from the average monthly value calculated from a long-term data collection is known as a monthly temperature anomaly [23].
In 2022, there was a global 1.4 °C shift in the mean annual land temperature globally. More than 170 nations and territories recorded mean annual temperatures higher than average. Of these 125 experienced remarkable warming compared to the reference climatology [24]. It has been estimated that 3.6 billion people already reside in regions particularly vulnerable to climate change. It is projected that between 2030 and 2050, undernutrition, malaria, diarrhoea, and heat stress alone would account for an extra 250,000 fatalities annually due to climate change. By 2030, it is projected that the direct costs of health harm, excluding expenses in areas that determine health, such as agriculture and water and sanitation, will range from USD 2 billion to USD 4 billion annually [16].
The Gulf Cooperation Council (GCC) region’s average temperature has increased dramatically over the past 40 years, leading to higher summer temperatures and more frequent and intense heat waves [25]. The Climate Impact Lab and the United Nations Human Development Program data show that the Middle East and the GCC countries will face critical challenges in addressing the heat-related mortality rates caused by future non-optimal temperatures. Their calculations show that GCC countries’ heat-related mortality rates could climb from 4 to more than 11 individuals per 100,000 in 2030. Their results also show that the rate will increase from 14 to more than 36 per 100,000 in 2050 and from 27 to more than 65 per 100,000 in 2090 [14] (Figure 1). Despite these findings, a review study conducted in 2023 showed that studies on the relationship between the heat-related morbidity and mortality in the Middle East and GCC countries are scarce, and there was less than one study per country. Global studies were mainly conducted in Southeast Asia, followed by North America, Europe, and South America. There was just one study covering the Middle East and the North Africa region [15].
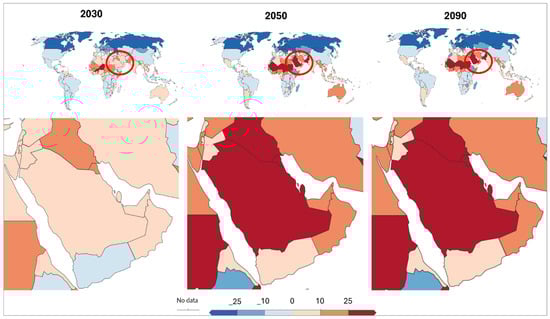
Figure 1.
The estimated mortality rates from non-optimal temperatures worldwide in 2030, 2050, and 2090 per 100,000 people. The red circles in the upper panels highlight the Middle East and surrounding regions, emphasizing the area of focus for the detailed regional analysis shown in the bottom panels. These circled regions correspond to the GCC countries (Bahrain, Kuwait, Oman, Qatar, Saudi Arabia, and the United Arab Emirates), which are among the most affected by heat-related mortality increases. The lower section shows the GCC countries’ estimations. The legend illustrates the increased death rates because of the non-optimal increase in temperature, and the negative death rates are due to the non-optimal decrease in temperature. Increasing temperatures in these estimations were based on the Representative Concentration Pathway, RCP4.5 (2 °C) and RCP2.5 (2.5 °C). The scale has two sides that illustrate the increasing mortality rates related to high increases or decreases in global temperatures: 0 indicates no changes, the red ramp scale indicates increasing heat-related mortality rates, and the blue colour ramp scale indicates cold-related mortality rates.
The Kingdom of Bahrain, a GCC country, is not isolated from exposure to risks posed by climate change. It is considered a highly sensitive island and requires extensive preparation, adaptation, and mitigation studies to help the country adopt and implement suitable policies and strategies to reduce the effects of climate change or alleviate any potential future hazards. The Bahraini population is expected to be affected in various ways, including increased exposure to extreme temperatures, altered dynamics of disease vectors, and a rise in food- and waterborne infections. However, older individuals are likely the most vulnerable, followed by patients with pre-existing medical conditions and children [26]. Heat-related morbidity and mortality were not measured and counted in the Kingdom of Bahrain in detail.
This study seeks to explore the following research question: To what extent do rising temperature anomalies and extreme heat conditions pose a potential risk to human health in Bahrain? Therefore, this study identifies the pattern of temperature changes and anomalies in Bahrain and explores the impact of rising temperature and humidity on human health, using the temperature anomalies and heat index. This will significantly aid in preparing healthcare and services needed to avoid future health hazards related to the dangerous heat stress caused by increasing temperatures. Furthermore, this study is highlighting that the kingdom and its governmental bodies responsible for health statistics should consider the increasing role of steadily rising temperatures in increasing heat-related morbidity and mortality, which calls for an urgent call to accumulate the efforts and cooperation. Importantly, this is one of the few GCC studies that considers rising temperatures and suggests recommendations for policymakers to improve the achievement of the SDGs.
2. Materials and Methods
2.1. Study Area
This study was conducted in the Kingdom of Bahrain, which is an archipelago of more than 40 islands situated centrally on the southern shores of the Arabian Gulf (latitude 25°32′ & 26°20′ N and longitude 50°20′ and 50°50′ E), to the eastern side of the Kingdom of Saudi Arabia and north of the State of Qatar [27]. This study covers the five main Islands: Bahrain’s main island, Muharraq, Nabih Saleh, Sitra, and Um Al-Nassan. Bahrain is located in a hyper-arid region, as shown in (Figure 2), and its climate is characterised by high average temperatures, limited precipitation, and high evapotranspiration [28].
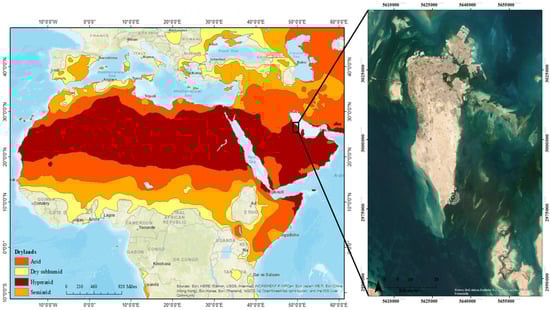
Figure 2.
Bahrain (denoted by the black rectangle), situated in the hyper-arid region extending from the west of Africa to the Arabian Peninsula (created by the researchers with reference to [29] and the Esri base map).
The two main aspects of Bahrain’s climate are hot summers with high humidity and warm, relatively mild winters with little rainfall [27,30]. The annual maximum and minimum temperature averages rose exponentially at the end of the 1980s, ranging between 28 °C and 30 °C in terms of annual maximum temperature averages, reaching 32.55 °C in 2021, as shown in (Figure 3). The minimum temperature average rose from 23.22 °C in 1961 to 25.23 °C in 2021 (Figure 3). The annual average of the maximum relative humidity for the period from 1961 to 2022 was not less than 68%, which is relatively high, as illustrated in (Figure 4).
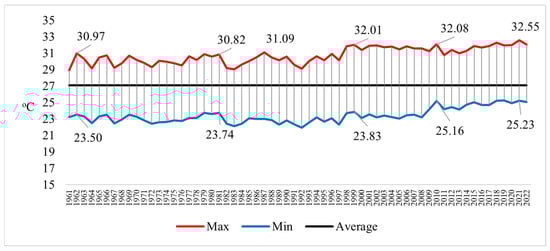
Figure 3.
The annual temperature averages from 1961 to 2022, presented in °C (created by the researchers using data from the [30]).
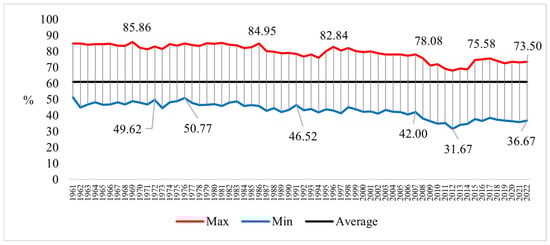
Figure 4.
The annual averages of the relative humidity from 1961 to 2022, presented in % (created by the researchers using data from [30]).
The average annual rainfall from 1961 to 2021 was only about 76.9 mm. The highest amount of rainfall was recorded in 1995, amounting to about 226.7 mm, while the lowest was in 1970, only 9.1 mm, followed by the year 2021, when the rainfall did not exceed 13.4 mm, as shown in Figure 5.
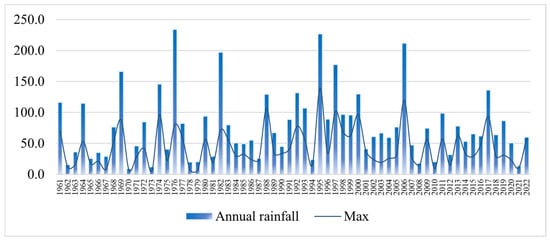
Figure 5.
The total annual precipitation in Bahrain from 1961 to 2021, presented in millimetres [mm] (created by the researchers using data from [27]).
In October 2008, Bahrain’s government unveiled Vision 2030, a programme designed to promote sustainable development and raise inhabitants’ standards of living. Following the introduction of Vision 2030, the appropriate public and private sector authorities held discussions on how to carry out and accomplish the objectives of the vision. The 2030 SDGs are a core part of the vision [31]. With the goal named “From Recovery to Sustainable Development” in the current Government Plan (2023–2026), the Kingdom has also continued to integrate sustainability into its policies. At the halfway point of the 2030 Agenda and the SDGs’ implementation [32].
The Kingdom of Bahrain has ranked 113 out of 166 member states of the United Nations in the Sustainable Development Report in 2024, and it is making significant progress in achieving the SDGs. But in SDG 3—Good health and well-being—the report shows that challenges remain in achieving this goal, and its score is stagnating or increasing at less than 50% of the required rate [33]. Bahrain emphasised in COP29 that they steadfastly adhere to regional and global environmental accords, stressing initiatives to fortify laws and regulations meant to preserve the environment and save resources and Bahrain’s commitment to sustainable development by praising its proactive approach to combating climate change [34].
2.2. Data
Maps and data of 2021 global annual temperature anomalies in °C and the incidence rate of cardiovascular diseases, new cases per 100 people, and the prevalence rate of cardiovascular disease cases per 100,000 people were used to explore the hotspots with high rates of cardiovascular diseases and high temperature anomalies. The global annual temperature anomaly data was created using the data on the average surface temperature deviations of each year from 1991 to 2020, along with the annual surface temperature averages from 1940 to 2024, which was last updated on 7 January 2025 [35].
Cardiovascular disease data sources included all diseases of the heart and blood vessels, such as heart attacks and strokes, atherosclerosis, ischemic heart disease, hypertensive diseases, cardiomyopathy, and rheumatic heart disease. These data are mainly related to sensitive groups, such as elders and children, particularly if they have risk factors, such as high blood pressure and other conditions [36]. Incident data refers to the estimated share of the population that develops the disease in a specific time, and the prevalence indicates the rate of the population of old and new cases [37].
Also, meteorological data of the Kingdom of Bahrain were collected from the Climate Section in the Meteorological Directorate of the Ministry of Transportation and Telecommunications in Bahrain. These data were measured by a meteorological station located two metres above ground at Bahrain International Airport. The data included the monthly average temperature, monthly mean maximum temperatures (°C), and mean maximum relative humidity (in %) from 1961 to 2023 in Excel format.
2.3. Methods
The heat-health situation of countries in 2021, represented by cardiovascular diseases, was explored by standardising the global maps and data from 1 to 6, where 1 represents the lowest temperature anomaly and cardiovascular rate ranges, and 6 indicates the highest rates. After, they were joined using the join function in the ArcGIS software 10.8, and then the countries with temperature anomalies ≥0.5, incidents ≥1%, and prevalence ≥8% in 2021 were extracted in different layers. As there is a lack of data related to heat-related diseases in Bahrain, Bahrain maps and data from the global data were used, analysed, and plotted in maps to show the potential impact of high temperature anomalies on cardiovascular disease.
Furthermore, standardised coefficients (Z-score based) in regression analysis are used to investigate the relation between the countries’ temperature anomalies and the incidence rate of cardiovascular diseases around the world. All variables were standardised to Z-scores prior to regression analysis. Standardised coefficients (βstd) were derived to quantify the change in the outcome (in standard deviations) per 1-SD increase in each predictor. Model fit was assessed using R2 and residual diagnostics. Statistical significance was evaluated at α = 0.05.
To eliminate scale differences between temperature anomalies and the incidence rate of cardiovascular disease, each predictor (X) and the outcome variable (Y) was standardised using Z-scores with the following equation [38]:
where
- X = the temperature anomaly of a country.
- Y = the incidence rate of cardiovascular disease in the same country.
- Z = the Z-score of the variable.
- µ = The mean.
- σ = The standard deviation.
Then, a linear regression model was fitted to the standardised variables using the following equation [39]:
where
- βstd = The standardised coefficient, interpreted as the change in the outcome (in SD units) per 1SD increase in the predictor.
- ϵ = The error term.
A variable’s deviation from the climatological normal is called an anomaly, where normal serves as a baseline value derived from the long-term average of the same climatic variable. Temperature anomalies are one of the main drivers necessitating adaptation and mitigation measures and strategies to combat the impacts of climate change resulting from anthropogenic activities [40]. Typically, climatology is performed over a minimum of 30 years (the climate normality period) to determine the normality. A positive temperature anomaly indicates that recorded temperatures are higher than the reference point, while a negative temperature anomaly indicates that recorded temperatures are lower than the average over a period [41]. To identify the patterns of temperature changes in Bahrain and the extent of their rise over the past years, anomaly calculations and matrices were employed to assess the severity of warming in Bahrain.
The anomaly calculation equation is as follows [42]:
where
Anom = X − Xbar
- Anom = the temperature anomaly value or degree.
- X = the actual value of the average temperature.
- Xbar = the long-term average temperature.
Most recent studies that calculated temperature anomalies used a baseline from 1950s to the 1980s to investigate the temperature anomalies in the 1990s and 2000s. This was because space agencies and climatic centres’ studies show that most warming has occurred since the 1970s [43,44,45,46,47,48]; therefore, based on the available governmental data, this study included the 1960s, 1970s, and 1980s’ monthly and annual maximum temperature averages as the baseline to represent the Xbar in the previous equation. Then, each monthly average from this period was subtracted from all the months to obtain the monthly temperature anomaly degree. A colour-ramped matrix of the values was created using Excel’s conditional formatting rule manager functionality, as shown in Table 1. The minimum value resulting from the anomaly calculation was −3.8, which was used as the minimum value of the colour ramp (blue). The midpoint in this scale is 0 (light blue), and very high anomalies are illustrated in red, with the maximum anomaly value equal to 4 °C.

Table 1.
The anomaly matrix colour scale.
The extended period of unusually high temperatures and often high humidity that causes temporary lifestyle changes and potentially adverse health effects on the sensitive population is termed a heatwave. Due to global warming, the frequency, duration, and severity of HWs are predicted to increase in most parts of the world [49]. The heat index measures the degree of human tolerance to temperature and relative humidity.
Therefore, this study used this research to assess the severe weather conditions that might affect human health in Bahrain. The National Oceanic and Atmospheric Administration (NOAA) National Weather Service equation was used to calculate the heat index [50]:
where
(HI) = c1 + c2T + c3R + c4TR + c5T2 + c6R2 + c7T2R + c8TR2 + c9T2R2
- HI = the heat index in (in °F).
- T = the temperature (in °F).
- R = the relative humidity.
- c1 to c9 = constants, where c1 = −42.379, c2 = −2.04901523, c3 = −10.14333127, c4 = −0.22475541, c5 = −6.83783 × 10⁻³, c6 = −5.481717 × 10⁻², c7 = −1.22874 × 10⁻³, c8 = 8.5282 × 10⁻⁴, c9 = −1.99 × 10⁻⁶.
Consequently, the equation is:
Since the collected temperature data were in °C, it was converted to Fahrenheit using the following equation:
where
- Tf = is the temperature (in °C).
- Tc = is the temperature (in °F).
After calculations, the NOAA heat index and heat disorders matrix were applied to the results to assess the effects of weather hazards on the human body, as shown in Figure 6.
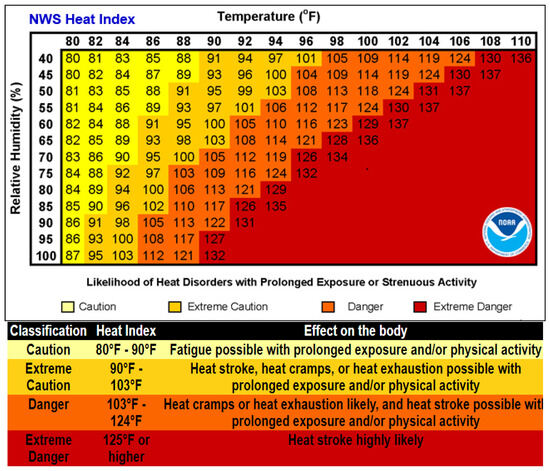
Figure 6.
The NOAA heat index/ disorders matrix [50].
The Bahrain heat index matrix was created by applying the conditional formatting rules in Excel, as shown in Table 2. Five classes of heat severity and disorders were created with different colours. Low values (less than 80 on the heat index) were coloured light blue (the normal heat index). The beginning of the heat hazard is caution or sunburn heat disorders, starting with values between 80 and 90, which were coloured yellow. The extreme caution or heat cramps range (values between 90 and 105) was coloured beige. The danger or heat exhaustion range (values from 105 to 130) was coloured orange. Finally, the extreme danger or heat stroke range (values over 130) was coloured red.
Table 2.
The conditional rules implemented in the Bahrain heat index, which created the heat matrix and the colour scale.
3. Results
3.1. Heat-Health Hotspots
Standardised global maps show that around 72 countries face high-temperature anomalies, that is, ≥0.5, most of them in South and Southeast Asia, North and Middle Africa, and North America. Algeria had the highest anomaly in 2021, an increase in more than 1.5 °C. Countries with temperature anomalies of 1 to 1.5 °C included Afghanistan, Armenia, Greenland, Iran, Iraq, Israel, Jordan, Kuwait, Lebanon, Mali, Palestine, Qatar, Saudi Arabia, Syria, Tunisia, Turkmenistan, United Arab Emirates, and Uzbekistan. Around 53 countries’ annual temperatures have increased from 0.5 to 1 °C. Most GCC countries have had temperature increases from 1 to 1.5 °C, except Bahrain, which increased in the range of 0.5 to 1 °C (standardised as 5), while Oman had an increase in less than 0.5 °C (Figure 7).
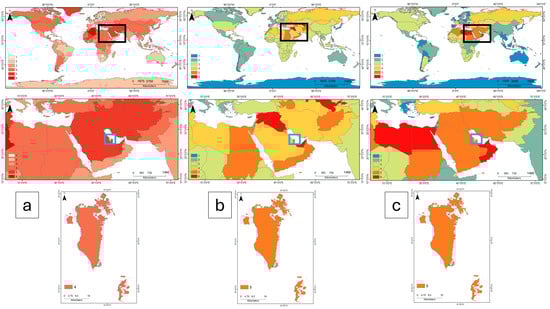
Figure 7.
Global, GCC countries, and Bahrain (a) temperature anomalies maps, (b) cardiovascular disease incidence rate maps, (c) cardiovascular prevalence rate maps. Maps were standardised on a scale from 1 to 6. The first map row shows the global maps of the annual temperature anomalies, where the score of 1 represents the lowest anomaly ranges, and 6 represents the highest anomaly ranges. The second and third maps illustrate the global cardiovascular incidence rates and their prevalence rates. The lowest cardiovascular rate ranges and prevalence are shown in blue for the value of 1, while the highest rates are shown in red for the value of 6. The black box shows the GCC’s location. The second row illustrates the GCC countries with a blue box to show the Kingdom of Bahrain’s location, while the last row illustrates maps of Bahrain.
High cardiovascular incidence rates were mainly in North Asia and the MENA region; there were around 30 countries that had a high rate of incidents. Iraq, Syria, the United Arab Emirates, and Uzbekistan had the highest rates, more than 1.4% per 100 people of the population. Around 11 countries had an incidence rate from 1.2% to less than 1.4%, and about 15 countries had rates of 1% to 1.2%. On the level of the GCC countries, the United Arab Emirates had the highest rate (1.4%), then Saudi Arabia (1.2%), and other GCC countries between >1.2% and <1.4%. Similar locations were found for high rates of cardiovascular prevalence: North Asia and the MENA region. Two of the GCC countries had the highest rates of cardiovascular prevalence (>10% of the population for every 100,000 people), Oman and the United Arab Emirates, while other GCC countries had a cardiovascular prevalence rate of 10%. Bahrain was standardised as 5 for the cardiovascular incidence and prevalence rates (Figure 7).
The linear regression analysis found a statistically significant correlation between the incidence of cardiovascular illnesses and temperature anomalies. A considerable amount of the variability in cardiovascular outcomes may be attributed to temperature anomalies, as the model predicted 23.1% of the variation in the incidence of cardiovascular disease (R2 = 0.231). According to the standardised coefficient (β = 0.48), the incidence rates of cardiovascular disease increase by 0.48 standard deviations for every standard deviation increase in local temperature anomalies. The two variables were statistically significant, and the positive coefficient indicated that greater temperature anomalies were associated with a higher incidence of cardiovascular diseases. The study population’s reasonable range for this climate health association is represented by the slope’s 95% confidence interval [1.41, 2.45].
The results show that physiological theories of temperature stress on cardiovascular systems are consistent with directionality. In environmental epidemiology, the modest impact size (R2 = 0.231) surpasses the standards for practical importance [51,52,53]. These results prove that temperature anomalies, which fluctuate in the climate, are a significant environmental factor influencing the population’s cardiovascular health. Figure 8 shows a scatterplot of the correlation between the temperature anomalies and the incidence of cardiovascular diseases.
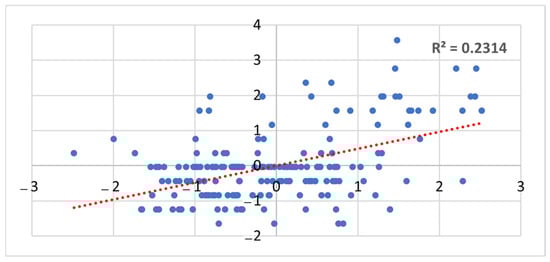
Figure 8.
A scatterplot of the correlational analysis of standardised temperature anomalies (x-axis) and standardised incidence rates of the cardiovascular disease (y-axis). The dotted red line represents the fitted linear regression trend (β = 0.48, p < 0.001), with shading indicating 95% confidence intervals.
When combining the annual temperature anomalies map and the cardiovascular incidence and prevalence rates, two maps were generated. The first map shows the hotspots of the locations in the world that face high-temperature anomalies and a high cardiovascular incidence rate; this map includes 25 countries, including all the GCC countries except Oman. The second map includes countries with high-temperature anomalies and high cardiovascular incidence and prevalence rates; this map includes 23 countries and also includes all GCCs, excluding Oman, because Oman’s annual temperature anomaly was less than 0.5 °C (0.3 °C). The results show that Bahrain is a country that may have a future risk of an increase in cardiovascular diseases or deterioration in the sensitive groups that are diagnosed with such diseases (Figure 9).
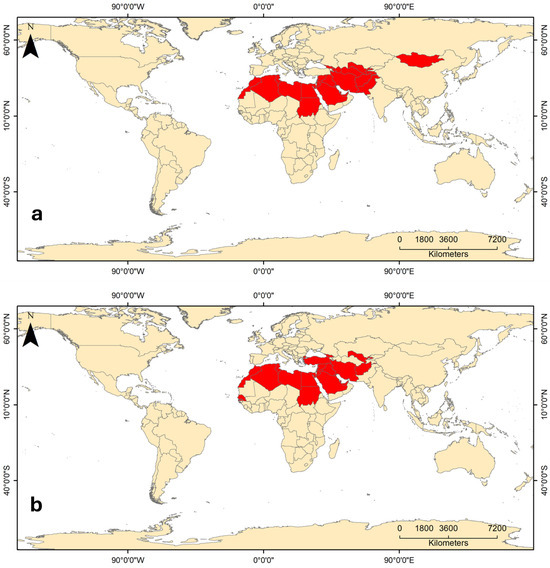
Figure 9.
Heat and cardiovascular hotspots in the world. (a) Countries that have high-temperature anomalies and high cardiovascular incidence rates; and (b) countries that have high-temperature anomalies and high cardiovascular prevalence rates in 2021.
3.2. Bahrain Temperature Anomaly
Anomaly analysis of Bahrain temperatures from the 1960s to 2023 shows that hotter years have become more frequent since mid-1997. Figure 10 illustrates that annual anomalies became hotter after 2000. The annual maximum temperature anomalies have increased by more than 1 °C since 1998 and have risen to around 2 °C since 2010.
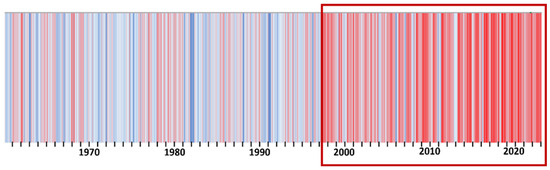
Figure 10.
Annual temperature anomalies in the Kingdom of Bahrain (graduated colours from dark blue (−3.8), the minimum resulting value; to light blue (0); and then red for the highest resulting value (4)). The red box highlights the period from around 2000 onwards, indicating a shift toward more frequent and intense temperature anomalies.
It is also evident that the monthly temperature anomalies since 1998 have changed to higher temperatures in all seasons, as shown in Figure 11. Summer months have been the most affected by the increase in temperature, rising from 1.0 °C to more than 3.0 °C compared to base years. The maximum anomaly was recorded in June 2019, increasing by around 4.0 °C. Winter months have also experienced significant temperature increases, with an increase of around 3.6 °C in December 2001, fluctuating between 1.5 °C and more than 2.0 °C since 2018. April and May, marking spring, increase by around 1.0 to 3.7 degrees. Furthermore, the two months at the beginning of the autumn season have increased by around 1.0 °C to 3.5 °C. These anomaly results confirmed that Bahrain, despite its semi-desert climate, is significantly affected by climate change and is experiencing a substantial increase in temperatures compared to those recorded in the 1960s, 1970s, and 1980s.
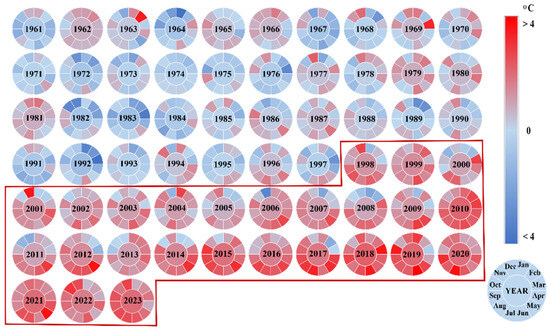
Figure 11.
Monthly temperature anomalies in Bahrain from 1961 to 2023. The radio chart sections represent months, and the centre illustrates years. Red indicates months and years with higher anomalies, while blue indicates months with lower anomalies compared to the mean temperatures of the base years. The red box highlights the period from 1995 onward, marking a clear and sustained shift toward predominantly warmer conditions.
3.3. Bahrain Heat Index
The heat index calculations for Bahrain indicate that most of the months fall within the heat disorder range, which could be very harmful to human health. As shown in Figure 12, the summer heat index predominantly falls within the extreme danger range. The first month of spring (March) typically falls within the normal range; however, the heat index for Bahrain shows that this month has frequently shifted into the caution and extreme caution ranges since 1999. The second month of spring (April) fluctuated between extreme caution and danger ranges, while May, the final month of spring, transitioned between danger and extreme danger till 1995, when it became more likely to be classified as extreme danger. Autumn’s first month (September) consistently falls within extreme danger ranges throughout the study period, while October, the middle month of autumn, was classified as danger and extreme danger. November’s heat index ranged between caution and extreme caution. Although winter months generally remained outside of the heat disorder ranges, 1998 and 2001 recorded cautionary heat index levels in December. These shifts in heat disorders across the seasons highlight the importance of raising awareness among the most vulnerable groups likely to be severely affected.
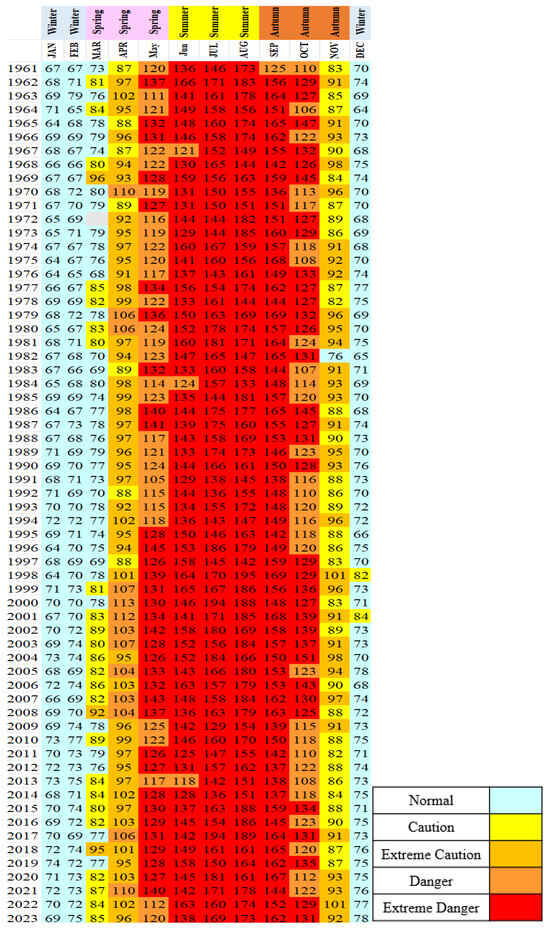
Figure 12.
Bahrain’s heat matrix from 1961 to 2023, representing the heat index results. The colours of the cells are adopted from NOAA references, with some customisation, where the normal range is indicated by light blue.
4. Discussion
IPCC Scenario A, which implemented a business-as-usual approach to calculating future temperatures based on recent GHG emissions, predicts that the average rate of global mean temperature will increase by about 0.3 °C per decade over the next century. This scenario suggests a likely increase of around 1 °C above the present value by 2025, about 2 °C more than the increase observed in the pre-industrial period. It could rise by around 3 °C more than today’s temperature before the end of the next century, amounting to approximately 4 °C more than the pre-industrial period [54]. Previously, in 2022, the IPCC, in its Special Report on Climate Change and Land, stated that from the pre-industrial era (1850–1900) to the present (1999–2018), there is little doubt that the global mean land surface air temperature (LSAT) has increased more rapidly than the global mean surface temperature (GMST), which combines LSAT and sea surface temperature. Long-term temperature datasets indicate that while the GMST rose by 0.87 °C (likely ranging from 0.75 °C to 0.99 °C) between 1850 and 1900 and 2006 and 2015, the mean LSAT increased by 1.53 °C (likely ranging from 1.38 °C to 1.68 °C) [55].
Based on IPCC scenario A and Bahrain’s anomaly results, the temperature in Bahrain has increased faster than what the IPCC anticipated globally in 1992. However, it aligns closely with the recent findings regarding the significant temperature increases after 2000, where Bahrain has exceeded the global surface air temperature increase, reaching 1.9 °C in 2015. This may be attributed to several factors, including Bahrain’s location within a hyper-arid region and specific land use types. Moreover, the results indicate that Bahrain’s rapid increase in temperatures has now reached levels predicted for the next century’s global temperature. Furthermore, the GHG emissions statistics in Bahrain show a rise in emissions since the 1990s, with GHG emissions sharply increasing in 2008 to five times more than the levels recorded in the 1960s and 1970s, escalating to around 71 million tons of CO2 equivalent in 2021. This increase in GHG emissions coincides with the rising temperatures, as illustrated in Figure 13.
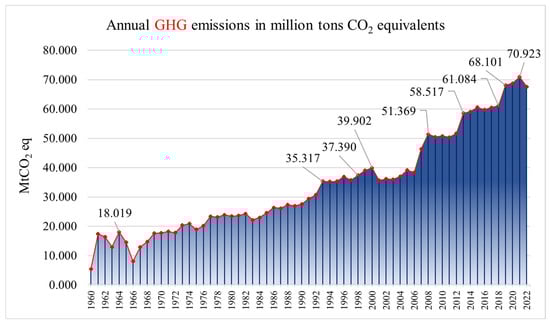
Figure 13.
Annual GHG emissions in Bahrain, including carbon dioxide (CO2), methane (CH4), and nitrous oxide (N2O) emitted from all sources, such as fossil fuel, the cement industry, and other land uses [56].
Additionally, the rise in temperatures in Bahrain corresponds with increases in energy consumption, as evidenced in Figure 14, where the anomalies increased by 5.0 °C at the beginning of the 1990s. Consequently, energy consumption rose from 2911 kW to approximately 8210 kW in 1990 and about 9280 kW in 1994. The increase in energy consumption rates continued in the years with greater temperature rises, with anomalies reaching about 1.3 °C in 1998, coinciding with a consumption rate of about 10008 kW and approximately 10420 kW in 2001. The rate of anomalies rose to about 2.1 °C in 2010, corresponding with a greater increase in consumption rates, which amounted to about 12142 kW. Consumption continued to rise steadily, reaching about 17241 kW in 2018 and 18020 kW in 2021. This matches the high temperatures in these years, when the temperature anomaly reached a maximum of 3.5 °C or 4 °C in the summer months. This, in turn, significantly impacts the change in the volume of GHG emissions, as Bahrain relies primarily on oil and gas to generate energy. Therefore, there might be a direct relationship between energy generation and rising temperatures: the higher the temperature, the greater the energy consumption, and vice versa.
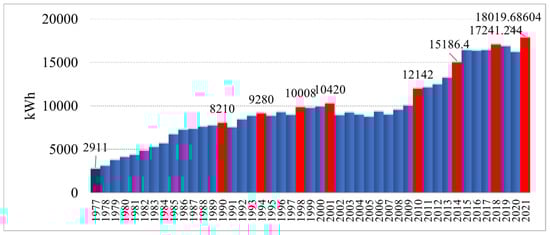
Figure 14.
Bahrain’s annual energy consumption (kWh) from 1977 to 2021. The dark blue bar represents the first year of the statistics, while the red bars indicate significant increases in consumption over the years. The overall trend shows steadily rising consumption in the 1970s and 1980s, followed by rapid growth in the second decade of the 2000s [27].
According to the British Cardiovascular Society in 2022, there is a considerable likelihood that climate change will worsen global cardiovascular outcomes, including an increase in myocardial infarction (MI), stroke, heart failure, and mortality. More individuals are beginning to view climate change as a medical issue. Recent UN studies indicate that the current state of affairs is a “code red” for humankind, potentially endangering billions of people. Moreover, the medical community has been advocating for immediate action to halt the rise in global temperatures and prevent disasters [57]. For instance, extreme heat and humidity can significantly impact the health of individuals with high blood pressure or heart disease [58].
Most studies that calculated the future of heat-related diseases in the MENA and GCC region calculated the total number of current deaths, which includes all types of death causes. These recent studies, which were not conducted before 2023, where COP28 highlighted the importance of highlighting the relationship between the number of deaths resulting from heat-related diseases and the steady rise in temperatures, relied on future climate change scenarios specific to the region to predict future risks. The results of this study, which relied on data for all countries on cardiovascular diseases and actual surface temperature data for 2021, showed that the areas considered as heat hotspots and exposed to heat anomalies are the same areas with the highest rates of cardiovascular diseases. It is noteworthy that the official data for Bahrain on the number of deaths resulting from circulatory and heart diseases, as noted in Figure 15 despite the improvements in health and awareness services, are more prevalent than any other cause of disease-related deaths in Bahrain. The number of deaths caused by circulatory and heart diseases at the beginning of the 2000s did not exceed 581. By 2018, this number had tripled to around 1438, and in 2020, it reached 1578. These statistics correlate with high temperatures and humidity levels in Bahrain, suggesting they may be significant contributing factors to such health conditions, which could worsen the situation for affected individuals during extreme weather conditions. Unfortunately, health statistics in Bahrain do not adequately consider this critical factor. There is no doubt about the importance of including high temperature increases in the diagnoses and classifications of deaths resulting from diseases in which high temperatures play a major role in their exacerbation.
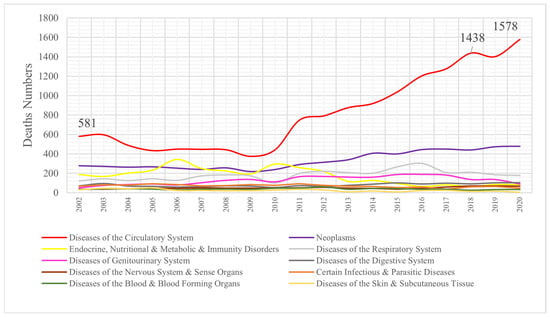
Figure 15.
Number of deaths by disease types in Bahrain from 2002 to 2020 [27].
Hot and humid months can be particularly critical for ensuring worker’s health. According to the Ministry of Labour, employment in open areas and direct sunlight is prohibited from noon to four o’clock during two of the three summer months (July and August). This regulation aims to reduce occupational accidents during the warmest months of the year and protect employees from heat exhaustion, heat stroke and other summer-time illnesses. The Labour Minister emphasised the importance of implementing occupational safety regulations and guidelines to ensure a secure, accident-free, and efficient work environment. Dedicated teams conduct field trips and monitoring campaigns in July and August to ensure compliance with the 2013 Edict (3), which prohibits employment in open spaces [59].
Moreover, high temperatures and humidity are linked to other indirect causes of diseases, such as the spread of insects and the accelerated transmission of viruses in hot and humid climates. For example, mosquitoes are more prevalent during the hotter months, typically from May to September [60]. Mosquito activity significantly increases when temperatures consistently rise above 10 °C (50 °F). Consequently, mosquitoes may appear earlier in February or March. Therefore, mosquitoes can be present year-round if the weather remains hot and humid [61,62].
The hottest months constitute active seasons for the reproduction and spread of insects and mosquitoes, which are among the most important carriers of epidemic and infectious diseases. A case of malaria was recorded in the United States in 2023 for the first time in 20 years. Infections will likely increase worldwide due to rising temperatures and the increased risk of spreading and reproducing insects and mosquitoes [63,64,65].
Simple modelling indicates that global warming will broaden the geographic range of mosquito-borne diseases and increase their transmission rates; a rise in malaria has been recognised as a possible consequence of climate change. There is conflicting evidence regarding the relationship between malaria and climate change. Some research suggests that malaria is becoming more prevalent in previously eradicated or controlled areas, while others indicate that the illness is re-emerging in endemic regions [66].
In the contiguous United States, there has recently been an evaluation of long-term changes in mosquito days in a Climate Central investigation. According to this research, a mosquito day is defined as having both minimum and maximum daily temperatures between 50 °F and 95 °F (10–35 °C), with an average relative humidity of 42% or higher [63]. Bahrain’s warm (≥35 °C) and humid (≥42%) weather creates an ideal environment for mosquitoes to develop and remain active year-round. Mosquito bites can cause skin irritation or an allergic response to the mosquito’s saliva, and more dangerously, some bites may spread serious illnesses and viruses, including the West Nile virus, dengue virus, malaria, and Zika, which can have fatal and incapacitating consequences [67].
The number of mosquitoes has significantly increased recently in Bahrain, and many citizens have frequently complained in the newspapers and other media. Table 3 shows how the number of active hotspots containing mosquitoes of disease-carrying species is increasing. This increase corresponds with the hottest and most humid years, where winters, autumns, and springs are becoming warmer and more humid. The number of active hotspots containing disease-carrying mosquitoes increased in 2018 to about 7.26% of the total hotspots, and in 2019 it reached about 12.44%. These increases in the number of active mosquito hotspots and the notable spread of mosquitoes recently may raise the risk of a resurgence of infections with diseases transmitted by these insects. Bahrain has been free from these diseases in recent years, as declared by the Ministry of Health’s statistics on malaria cases and other diseases transmitted by mosquitoes.
Table 3.
Annually examined mosquito breeding spots around Bahrain between 1997 and 2019 [68]. The color gradient ranges from light yellow to deep red, indicating increasing percentages of positive mosquito breeding spots. Lighter shades represent lower percentages, while darker red shades highlight years with higher proportions of positive Culex and Anopheles breeding spots, emphasizing years of heightened mosquito activity.
Based on the results of this study, several recommendations were proposed to contribute to developing solutions that could help achieve the SDGs in Bahrain, along with the impact of each recommendation on the interconnectedness of various goals. The most relevant goal to the findings of this study is SDG 3 (Good Health and Well-Being), while other related SDGs, such as SDG 4, 11, 13, and 17, could be improved. This study has ten recommendations organised in three main categories as follows:
- Evidence and Monitoring:
- 1.
- Climate change increases the risk of cardiovascular disease. Even under the best-case climate scenario, rising temperatures are anticipated to elevate morbidity and mortality rates [57]. Results related to the comparison of increasing temperature with disease-related deaths in Bahrain indicate that such diseases have caused the highest number of fatalities. Therefore, there is an urgent need to collect evidence, health data, and statistics with greater accuracy and in more detail, particularly concerning diseases affected by high temperatures. Data should encompass the number of deaths from these diseases, daily temperatures, and the time when patients relapsed and were admitted to the hospital or died due to these conditions. Detailed information regarding heat stress, the duration of exposure to hot and humid weather, the ages of the affected individuals, and their residential locations is essential to help achieve SDG 3, which aims to reduce mortality from non-communicable diseases through prevention, such as indicator (3.4.1), which focuses on minimising mortality rates attributed to cardiovascular or chronic respiratory diseases.
- 2.
- A locational interactive warning system should be established to alert individuals about high temperature and humidity periods, including specific days and months. Patients, particularly vulnerable groups such as the elderly, children, and those with pre-existing health conditions, should be notified during hotter and more humid weather, which poses a greater risk to their health. This aligns with achieving SDG 3, specifically target 3.d, which focuses on strengthening the capacity of all countries for early warning, risk reduction, and the management of national and global health risks.
- 3.
- It is important to count and determine the number of students suffering from diseases exacerbated by heat stress so that necessary precautions can be implemented. It is also important to inform students’ families about the dangers of exposure to high temperatures and humidity during peak hours when students leave school.
- 4.
- Target 3.3 of SDG 3 focuses on ending the epidemics of AIDS, tuberculosis, malaria, and neglected tropical diseases, as well as combating hepatitis, waterborne diseases, and other communicable diseases. This target includes a direct indicator of the number of malaria incidences per 1000 population. All malaria cases in Bahrain are imported [69,70]. Malaria is a vector-borne disease, and the number of mosquitoes capable of transmitting it is increasing. There is a risk of disease transmission re-emerging in Bahrain, jeopardising the progress made in combating this disease. Consequently, the Ministry of Health must intensify its efforts to combat mosquitoes, raise awareness of the dangers posed by increasing mosquito populations due to temperature and humidity changes, and encourage researchers to conduct extensive studies on the recent rise in mosquito numbers across different seasons.
- Capacity Building and Country Support:
- 1.
- Enhancing the capacity and capability of medical staff to manage cases and provide timely interventions is crucial. Their knowledge in accurately recording cases of patients and deaths related to heat stress includes detailed information by month, day, and hour. The health effects associated with HWs and prolonged exposure to high temperatures remain poorly understood. Health professionals must adapt their plans and actions in response to HWs and rising temperatures. Actions at the individual, community, organisational, governmental, and societal levels that are realistic, feasible, and often inexpensive can save lives. This would contribute to achieving SDG 3 under target (3.c), which pertains to health development and the training of the health workforce.
- 2.
- Legislation and regulations should be developed to prevent children from being exposed to high temperatures during school breaks or sports activities, especially during peak periods in the hottest and most humid months. This approach is similar to measures already implemented by the Kingdom of Bahrain concerning outdoor work. This recommendation links SDG 3 to SDGs 4, 13, and 11.
- 3.
- As the hot spot results show, this problem could be regional. Therefore, cooperation and solidarity are required to solve this problem by exchanging data, expertise, and financial assistance between the GCC countries. This enhances the efficiency of achieving Goal 17 regarding partnership in achieving the goals.
- Raising Awareness:
- 1.
- Community awareness should be raised particularly in schools, universities, and workplaces regarding the importance of being cautious during high temperatures in the summer months and periods of elevated heat stress. The dangers of high temperatures and humidity and their effects on human health must be integrated into educational curricula to prepare children and young people to confront these risks and provide timely assistance. Additionally, fostering creative thinking and innovation to develop more effective mitigation solutions is essential. This supports the achievement of SDG 4 (Quality Education), which is also linked to SDGs 13 (Climate Action) and 11 (Sustainable Cities and Communities).
- 2.
- Harnessing modern media through communication platforms and new programs can help spread awareness extensively about the risks of high temperatures on human health, the symptoms of heat-related diseases, ways to avoid the risks of high temperatures, and how to provide first aid to those exposed.
- 3.
- Work on additional studies and research on this topic can be achieved through research cooperation between researchers in the field of climate change and researchers in the field of human health, especially diseases in regions of the world that are directly affected by rising temperatures. Research should also be increased on the relationship between the spread of epidemics and insect vectors and their ties to rising temperatures in the Kingdom of Bahrain. Such cooperation between the research institutions and the health sector could help improve the achievement of SDG 3 and SDG 17 (Partnerships for the Goals).
5. Limitations and Suggested Future Studies
The primary limitations impeding robust validation of these findings include (1) data scarcity, particularly concerning heat-related morbidity indicators, and (2) insufficient literature examining the geoclimatic nexus between regional positioning, thermal anomalies, and cardiovascular disease epidemiology. These constraints hinder both cross-methodological comparisons and the identification of context-appropriate analytical frameworks for arid-regions populations.
Moreover, the availability of precise, granular data on incidence and mortality rates for both physiological and psychological diseases would enable more robust epidemiological investigations into their associations with the well-documented temperature increases observed in the Kingdom of Bahrain.
Future studies should detect groups more prone to heat stress, such as manual workers, those with chronic diseases, elderly people (65+), and small children (under 5). Incorporating these categories into the study may help create focused public health recommendations and enable more accurate risk modelling. Furthermore, future studies might examine synergistic effects with air quality, urban heat islands, or socioeconomic features, as this study showed that 77% of the cardiovascular incidents were due to factors other than the temperature.
6. Conclusions
This study indicates that countries in the MENA and GCC regions could face health risks related to increased heat-related mortality and morbidity due to rising temperatures. The spatial analysis results of the annual temperature anomalies and the cardiovascular disease rates show that hotspots with increases in both categories are located in most MENA and GCC countries.
Moreover, the correlation test between temperature anomalies and cardiovascular disease incidence showed a moderate correlation, indicating that temperature changes resulting from climate change clearly impact cardiovascular disease incidence worldwide.
Furthermore, the population in Bahrain is at risk from increasing temperatures, as the changes in anomalies and the anomaly analysis results indicate critical temperature changes over the past 50 years that could affect human health. The mean annual temperature anomalies increased from approximately 1.0 °C to 2.0 °C between 1990 and 2020 based on the mean annual temperatures of the 1960s, 1970s, and 1980s. During the research period, the hottest season was summer, which recorded the highest increases in temperature anomalies, ranging from 1.4 °C to 4.0 °C. Spring followed, with increases ranging from 1.0 °C to 3.7 °C more than the past 30 years (the 1960s, 1970s, and 1980s). Winter experienced increases of 1.5 °C to 3.6 °C in the anomalies, which were not far from autumn’s increases, between approximately 1.0 °C and 3.5 °C.
These increases may be linked to GHG emissions and energy consumption in Bahrain. The statistics and the results of this study from 1961 to 2021 align, leading to the conclusion that rising temperatures in Bahrain are influenced by global climate change and simultaneously affected by GHG emissions and anthropogenic activities, particularly those reliant on fossil fuels for energy.
This study shows that rising temperatures and humidity levels could adversely affect human health in Bahrain. Generally, the Bahrain heat index shows that most of the months fall within the heat disorder ranges. The extreme risk range could lead to heatstroke and sunstroke during the summer months, while individuals may be exposed to sunstroke, heat cramps, or heat exhaustion due to the extreme caution and danger ranges associated with high temperature and humidity. Winter months in some years have recorded extreme caution ranges due to the high temperatures and humidity that could directly or indirectly affect the most vulnerable groups, such as individuals with circulatory and heart diseases, children, and the elderly. Additionally, the increase in insects in hot and humid weather could contribute to spreading diseases such as those transmitted by mosquitoes.
Additionally, the increase in high temperatures and humidity, which causes most months to fall within the heat stress and disorder levels, corresponds with the number of deaths due to circulatory and heart diseases. This indicates that these factors are critical causes of mortality among populations suffering from such diseases. Moreover, statistics on annual mosquito breeding sites show an increase in mosquito populations synchronised with rising temperatures in Bahrain, and these populations can transmit diseases such as malaria. This alarming situation indicates a risk of failing to contain and reduce these numbers.
In addition, this study can serve as a cornerstone for improving the achievement of SDG 3 and strengthen its alignment with other SDGs if the conclusions and recommendations contained therein are acted upon. It is crucial to draw the attention of decision makers to the importance of working to develop national plans, laws and strategies that would mitigate the future health impacts that may result from increasing temperatures.
Author Contributions
Conceptualization, G.K.; methodology, G.K.; software, G.K.; validation, S.A. and G.K.; formal analysis, G.K.; investigation, G.K.; resources, G.K. and S.A.; data curation, G.K.; writing—original draft preparation, G.K.; writing—review and editing, G.K., S.A. and H.N.; visualization, G.K.; supervision, S.A. and H.N.; project administration, S.A., G.K. and H.N.; funding acquisition, G.K., S.A. and H.N. All authors have read and agreed to the published version of the manuscript.
Funding
This research received no external funding.
Data Availability Statement
Some of the data used in this study were obtained from previously published sources, as cited in the article. Additional data generated and analysed during this study are available from the corresponding author upon reasonable request.
Conflicts of Interest
The authors declare no conflicts of interest.
References
- European Environment Agency. Climate Change Is One of the Biggest Challenges of Our Times. Available online: https://www.eea.europa.eu/themes/climate/climate-change-is-one-of (accessed on 1 January 2024).
- UN. What Is Climate Change? Available online: https://www.un.org/en/climatechange/what-is-climate-change (accessed on 2 December 2023).
- Almazroui, M. Changes in temperature trends and extremes over Saudi Arabia for the period 1978–2019. Adv. Meteorol. 2020, 2020, 8828421. [Google Scholar] [CrossRef]
- Dagnachew, A.G.; Hof, A.; van Soest, H.; Vuuren, D.V. Climate Change Measures and Sustainable Development Goals; PBL Netherlands Environmental Assessment Agency: The Hague, The Netherlands, 2021; Available online: https://sdgs.un.org/sites/default/files/2023-01/pbl-2021-climate-change-measures-and-sustainable-development-goals_4639.pdf (accessed on 11 January 2024).
- IPCC. Climate Change 2023: Synthesis Report. In Proceedings of the AR6 Synthesis Report Climate Change 2023, Interlaken, Switzerland, 13–19 March 2023; pp. 35–115. Available online: https://www.ipcc.ch/report/sixth-assessment-report-cycle/ (accessed on 1 January 2024).
- Chandra N, S.V.S.; Khandekar, A.; Maringanti, A. Towards a climate-health approach in Indian healthcare: Perspectives of specialist doctors on health impacts of extreme heat in Hyderabad. J. Clim. Change Health 2023, 14, 100269. [Google Scholar] [CrossRef]
- Li, M. Research on the effects of extreme heat exposure on human health. Theor. Nat. Sci. 2024, 29, 194–199. [Google Scholar] [CrossRef]
- UNDRR. COP29 Event Raises the Bar on Understanding and Addressing Extreme Heat. Available online: https://www.undrr.org/news/cop29-event-raises-bar-understanding-and-addressing-extreme-heat (accessed on 12 December 2024).
- WHO. Heat and Health. Available online: https://www.who.int/news-room/fact-sheets/detail/climate-change-heat-and-health (accessed on 4 November 2022).
- Desai, M.; Navale, A.; Dhorde, A.G. Evolution of the heat index (Hi) and physiological equivalent temperature (PET) index at Mumbai and Pune cities, India. Mausam 2021, 72, 915–934. [Google Scholar] [CrossRef]
- Amoadu, M.; Ansah, E.W.; Sarfo, J.O.; Hormenu, T. Impact of climate change and heat stress on workers’ health and productivity: A scoping review. J. Clim. Change Health 2023, 12, 100249. [Google Scholar] [CrossRef]
- Climate Central Climate Change and the Escalation of Global Extreme Heat: Assessing and Addressing the Risks; Climate Central: Princeton, NJ, USA; Red Cross Red Crescent Climate Centre: The Hague, The Netherlands; World Weather Attribution: London, UK, 2024; p. 13. Available online: https://www.climatecentral.org/report/climate-change-and-the-escalation-of-global-extreme-heat (accessed on 9 August 2024).
- Anikeeva, O.; Hansen, A.; Varghese, B.; Borg, M.; Zhang, Y.; Xiang, J.; Bi, P. The impact of increasing temperatures due to climate change on infectious diseases. BMJ 2024, 387, e079343. [Google Scholar] [CrossRef] [PubMed]
- WHO. Heatwaves. Available online: https://www.who.int/health-topics/heatwaves#tab=tab_1 (accessed on 20 January 2025).
- Alcayna, T.; Chandaria, S.; Kim, J.; O’Donnell, D.; Poole, L. c; Red Cross Red Crescent Climate Centre: The Hague, The Netherlands, 2023. Available online: https://www.climatecentre.org/wp-content/uploads/RCCC-Heat-Humidity-AP-Scoping-Review-Final-4.pdf (accessed on 20 March 2024).
- WHO. Climate Change; World Health Organisation: Geneva, Switzerland, 2023; pp. 1–6. Available online: https://www.who.int/news-room/fact-sheets/detail/climate-change-and-health (accessed on 26 January 2025).
- Rony, M.K.K.; Alamgir, H.M. High temperatures on mental health: Recognizing the association and the need for proactive strategies-A perspective. Health Sci. Rep. 2023, 6, e1729. [Google Scholar] [CrossRef] [PubMed]
- Romps, D.; Lu, Y.-C. The heat index as a measure of future heat stress with climate change. Physiology 2023, 38, 1–10. [Google Scholar] [CrossRef]
- Rajeevan, M.; Rohini, P.; Nair, S.A.; Tirkey, S.; Goswami, T.; Kumar, N. Heat and Cold Waves in India; India Meteorological Department: Lodi Road, New Delhi, 2023; Volume IV–6, p. 63. Available online: https://imdpune.gov.in/Reports/Met_Monograph_Cold_Heat_Waves.pdf (accessed on 14 February 2025).
- Salas, E.B. Annual Anomalies in Global Land Surface Temperature from 1880 to 2021, Based on Temperature Departure. Statista 2023, 13–16. Available online: https://www.statista.com/statistics/224893/land-and-ocean-temperature-anomalies-based-on-temperature-departure/ (accessed on 23 February 2024).
- Gosh, I. Visualized: Historical Trends in Global Monthly Surface Temperatures (1851–2020). Vis. Capital. 2021, 1–9. Available online: https://www.visualcapitalist.com/global-temperature-graph-1851-2020/ (accessed on 18 September 2024).
- NOAA Global SurfaceTemperature Anomalies. Available online: https://www.ncei.noaa.gov/access/monitoring/global-temperature-anomalies/ (accessed on 19 September 2022).
- Spies, R.B. Agents of ecosystem change. In Long-Term Ecological Change in the Northern Gulf of Alaska, 2007; Spies, R.B., Ed.; Elsevier: Amsterdam, The Netherlands, 2007; pp. 171–257. ISBN 978-0-444-52960-2. [Google Scholar]
- FAO. Temperature Change Statistics 1961–2022; FAO: Rome, Italy, 2023; p. 10. Available online: http://www.fao.org/food-agriculture-statistics/en/Food (accessed on 14 February 2025).
- Aeon Collective and Community Jameel. The State of Climate & Health Research in the GCC; Aeon Collective and Community Jameel: Glasgow, Scotland, 2022. Available online: https://www.communityjameel.org/projects/the-state-of-climate-and-health-research-in-gcc (accessed on 14 February 2025).
- Public Commission for the Protection of Marine Resources, Environment and Wildlife. Bahrain’s Second National Communication, Under the United Nations Framework Convention on Climate Change; Public Commission for the Protection of Marine Resources, Environment and Wildlife: Istanbul, Turkey, 2012; pp. 1–92. Available online: http://unfccc.int/resource/docs/natc/bhrnc2.pdf (accessed on 24 August 2024).
- IeGA Bahrain Open Data Portal. Available online: https://www.data.gov.bh/pages/homepage/ (accessed on 24 August 2024).
- Kadhem, G.M.; Zubari, W.K. Identifying optimal locations for artificial groundwater recharge by rainfall in the Kingdom of Bahrain. Earth Syst. Environ. 2020, 4, 551–566. [Google Scholar] [CrossRef]
- Millennium Ecosystem Assessment Graphic Resources. Available online: https://www.millenniumassessment.org/en/GraphicResources.html (accessed on 1 March 2024).
- Ministry of Transportation and Telecommunications Climate Section/Meteorological Directorate. 2023, pp. 1–5. Available online: https://www.bahrainweather.gov.bh/en/web/guest/home (accessed on 5 February 2024).
- Khan, H.M.; Alkhalifa, F.A. Using smart sustainable city indicators to evaluate urban quality in the Kingdom of Bahrain. Int. J. Sustain. Build. Technol. Urban Dev. 2023, 14, 299–319. [Google Scholar] [CrossRef]
- Ministry of Sustainable Development Bahrain’s Efforts to Achieve the Sustainable Development Goals 2030. Available online: https://sdgs.gov.bh/ (accessed on 12 October 2024).
- Sachs, J.; Lafortune, G.; Fuller, G. The SDGs and the UN Summit of the Future. Sustainable Development Report 2024; Dublin University Press: Dublin, Ireland, 2024; pp. 1–512. [Google Scholar] [CrossRef]
- Supreme Council for Environment. Oil Minister participates in UN COP29 opening. In Proceedings of the 29th United Nations Climate Change Conference (COP29); Baku, Azerbaijan, 11–22 November 2024. Available online: https://www.sce.gov.bh/en/1801?cms=q8FmFJgiscL2fwIzON1%2BDnmA9LuQJQfN (accessed on 26 January 2025).
- Rosado, P.; Samborska, V. Climate Change: Annual Temperature Anomalies; Our World in Data, Global Change Data Lab: Oxford, UK, 2024. Available online: https://ourworldindata.org/grapher/annual-temperature-anomalies (accessed on 2 February 2025).
- Esteban, O.-O.; Max, R. Global Health, Incidence Rate of Cardiovascular Diseases. Inst. Health Metrics Eval. IHME. Glob. Burd. Dis. Our World Data 2024. Available online: https://ourworldindata.org/grapher/annual-temperature-anomalies?time=2024 (accessed on 2 February 2025).
- Esteban, O.-O.; Max, R. Global Health, Prevalence rate of cardiovascular diseases, 1990 to 2019. Inst. Health Metrics Eval. IHME. Glob. Burd. Dis. Our World Data 2024. Available online: https://ourworldindata.org/grapher/incidence-rate-of-cardiovascular-disease (accessed on 2 February 2025).
- Cohen, J.; Cohen, P.; West, S.G.; Aiken, L.S. Applied Multiple Regression/Correlation Analysis for the Behavioral Sciences; Routledge: London, UK, 2013; ISBN 0203774442. [Google Scholar]
- Aiken, L.S.; West, S.G.; Reno, R.R. Multiple Regression: Testing and Interpreting Interactions; Sage: Thousand Oaks, CA, USA, 1991; ISBN 0761907122. [Google Scholar]
- Parks, R.M.; Bennett, J.E.; Tamura-Wicks, H.; Kontis, V.; Toumi, R.; Danaei, G.; Ezzati, M. Anomalously warm temperatures are associated with increased injury deaths. Nat. Med. 2020, 26, 65–70. [Google Scholar] [CrossRef] [PubMed]
- European Centre for Medium-Range Weather Forecasts Calculating Climatologies and Anomalies. Available online: https://cds.climate.copernicus.eu/toolbox/doc/how-to/13_how_to_calculate_climatologies_and_anomalies/13_how_to_calculate_climatologies_and_anomalies.html (accessed on 21 January 2024).
- Bell, M. How Are Anomalies Calculated? Available online: https://iridl.ldeo.columbia.edu/dochelp/QA/Basic/anomalies.html (accessed on 21 January 2024).
- Cheng, L.; Abraham, J.; Trenberth, K.E.; Boyer, T.; Mann, M.E.; Zhu, J.; Wang, F.; Yu, F.; Locarnini, R.; Fasullo, J.; et al. New Record Ocean Temperatures and Related Climate Indicators in 2023. Adv. Atmos. Sci. 2024, 41, 1068–1082. [Google Scholar] [CrossRef]
- Rohde, R. Global Temperature Report for 2023. Berkeley Earth 2025. Available online: https://berkeleyearth.org/global-temperature-report-for-2023/ (accessed on 19 June 2025).
- Gavin, A.S.; Robert, B.S.; Reto, A.R. Global Temperature Anomalies from 1880 to 2023. NASA’s Sci. Vis. Stud. 2020. Available online: https://svs.gsfc.nasa.gov/5207#media_group_373191 (accessed on 19 June 2025).
- Beaulieu, C.; Chen, J.; Smith, L. Is a Recent Surge in Global Warming Detectable? arXiv 2024, arXiv:2403.03388. Available online: https://arxiv.org/abs/2403.03388?utm_source=chatgpt.com (accessed on 30 June 2025).
- Diffenbaugh, N.S.; Scherer, M. Observational and model evidence of global emergence of permanent, unprecedented heat in the 20th and 21st centuries. Clim. Change 2011, 107, 615–624. [Google Scholar] [CrossRef] [PubMed]
- NASA Earth Observatory World of Change: Global Temperatures. EOS NASA’s Earth Obs. Syst. 2022. Available online: https://earthobservatory.nasa.gov/world-of-change/global-temperatures (accessed on 16 June 2025).
- International Federation of Red Cross and Red Crescent Societies Public awareness and public education for disaster risk reduction: Extreme heat/heat wave. Red Cross Red Crescent Climate Centre: The Hague, The Netherlands, 2021; pp. 48–52. Available online: https://www.ifrc.org/document/heat-waves-key-messages (accessed on 21 January 2024).
- NOAA. What Is the Heat Index? Available online: https://www.weather.gov/safety/heat-index (accessed on 1 October 2022).
- McMichael, A.J.; Woodruff, R.E.; Hales, S. Climate change and human health: Present and future risks. Lancet 2006, 367, 859–869. [Google Scholar] [CrossRef] [PubMed]
- IPCC. Climate Change 2022—Impacts, Adaptation and Vulnerability: Working Group II Contribution to the Sixth Assessment Report of the Intergovernmental Panel on Climate Change; Cambridge University Press: Cambridge, UK, 2023. [Google Scholar] [CrossRef]
- Khan, S.S.; Coresh, J.; Pencina, M.J.; Ndumele, C.E.; Rangaswami, J.; Chow, S.L.; Palaniappan, L.P.; Sperling, L.S.; Virani, S.S.; Ho, J.E.; et al. Novel Prediction Equations for Absolute Risk Assessment of Total Cardiovascular Disease Incorporating Cardiovascular-Kidney-Metabolic Health: A Scientific Statement from the American Heart Association. Circulation 2023, 148, 1982–2004. [Google Scholar] [CrossRef] [PubMed]
- Intergovernmental Panel on Climate Change. Climate Change: The 1990 and 1992 IPCC Assessments, IPCC First Assessment Report Overview and Policymaker Summaries and 1992 IPCC Supplement. Intergov. Panel Clim. Change 1992, 180. Available online: https://archive.ipcc.ch/publications_and_data/publications_ipcc_90_92_assessments_far.shtml (accessed on 16 June 2025).
- Intergovernmental Panel on Climate Change. Climate Change and Land: IPCC Special Report on Climate Change, Desertification, Land Degradation, Sustainable Land Management, Food Security, and Greenhouse Gas Fluxes in Terrestrial Ecosystems; Cambridge University Press: Cambridge, UK, 2022; ISBN 9781009158015. [Google Scholar]
- Ritchie, H.; Rosado, P.; Roser, M. Greenhouse Gas Emissions. Available online: https://ourworldindata.org/greenhouse-gas-emissions (accessed on 12 September 2023).[Green Version]
- Jacobsen, A.P.; Khiew, Y.C.; Duffy, E.; O’Connell, J.; Brown, E.; Auwaerter, P.G.; Blumenthal, R.S.; Schwartz, B.S.; McEvoy, J.W. Climate Change and the Prevention of Cardiovascular Disease. Am. J. Prev. Cardiol. 2022, 12, 100391. [Google Scholar] [CrossRef] [PubMed]
- Paulino, M. Effects of Hot Weather, Humidity on Blood Pressure, Heart. Mayo Clin. Health Syst. 2023, 1–2. Available online: https://www.mayoclinichealthsystem.org/hometown-health/speaking-of-health/effects-of-high-temperatures-on-blood-pressure-heart#:~:text=Hightemperaturesandhighhumidity,bloodflowtotheskin (accessed on 15 January 2024).[Green Version]
- BNA Bahrain’s Two-Month Outdoor Afternoon Work Ban Begins Saturday. Bahrain News Agency 2023, 2–3. Available online: https://www.bna.bh/en/news?cms=q8FmFJgiscL2fwIzON1%2BDlWmBbkrs1dosGs%2BdLWeIkA%3D (accessed on 14 January 2024).[Green Version]
- Rentokil When Are Mosquitoes Most Active and What Can You Do? Available online: https://www.rentokil.com/sg/blog/mosquitoes/mosquitoes-active-can (accessed on 1 December 2024).[Green Version]
- Pandey, M. Tick and Mosquito Season Is Already Shaping up to Be Severe this Year. NBC NEWS 2023, 1–7. Available online: https://www.nbcnews.com/health/health-news/tick-mosquito-season-summer-rcna91185 (accessed on 15 January 2024).[Green Version]
- Woodstream When Are Mosquitoes Most Active? Available online: https://www.mosquitomagnet.com/articles/when-are-mosquitoes-most-active (accessed on 13 February 2023).[Green Version]
- Climate Central Mosquito Days. 2023, pp. 1–12. Available online: https://www.climatecentral.org/climate-matters/mosquito-days-2023 (accessed on 15 January 2024).[Green Version]
- California Department of Public Health Mosquitoes and Mosquito-Borne Diseases. 2023, pp. 22–24. Available online: https://www.cdph.ca.gov/Programs/CID/DCDC/pages/mosquitoesandmosquitobornediseases.aspx (accessed on 22 February 2024).[Green Version]
- Orkin Orkin’s Top Five Mosquito Facts. 2024, pp. 1–5. Available online: https://www.orkin.com/press-room/orkins-top-five-mosquito-facts (accessed on 22 February 2024).[Green Version]
- Fernando, S.D. Climate change and malaria: A complex relationship. UN Chron. 2012, 47, 21–25. [Google Scholar] [CrossRef]
- EPA General Information About Mosquitoes. Available online: https://www.epa.gov/mosquitocontrol/general-information-about-mosquitoes (accessed on 5 July 2023).[Green Version]
- MOH MOH Statistics. Available online: https://www.moh.gov.bh/Ministry/Statistics?lang=en (accessed on 13 July 2023).[Green Version]
- Ismaeel, A.Y.; Senok, A.C.; Jassim Al-Khaja, K.A.; Botta, G.A. Status of malaria in the Kingdom of Bahrain: A 10-year review. J. Travel Med. 2004, 11, 97–101. [Google Scholar] [CrossRef] [PubMed]
- Health Information Directorate Health statistics of 2020. 2022. Available online: https://www.moh.gov.bh/Ministry/Statistics (accessed on 14 January 2024).[Green Version]
Disclaimer/Publisher’s Note: The statements, opinions and data contained in all publications are solely those of the individual author(s) and contributor(s) and not of MDPI and/or the editor(s). MDPI and/or the editor(s) disclaim responsibility for any injury to people or property resulting from any ideas, methods, instructions or products referred to in the content. |
© 2025 by the authors. Licensee MDPI, Basel, Switzerland. This article is an open access article distributed under the terms and conditions of the Creative Commons Attribution (CC BY) license (https://creativecommons.org/licenses/by/4.0/).