Global Climate Classification and Comparison to Mid-Holocene and Last Glacial Maximum Climates, with Added Aridity Information and a Hypertropical Class
Abstract
1. Introduction
2. Materials and Methods
2.1. Climate Datasets
2.2. Thermal Classes
2.3. Aridity Classes
2.4. Assigning Classes to Current and Past Climates
3. Results
3.1. Thermal Classes
3.2. Current and Past Climates
4. Discussion
5. Conclusions
Supplementary Materials
Funding
Data Availability Statement
Acknowledgments
Conflicts of Interest
References
- Rohli, R.V.; Joyner, T.A.; Reynolds, S.J.; Ballinger, T.J. Overlap of global Köppen–Geiger climates, biomes, and soil orders. Phys. Geogr. 2015, 36, 158–175. [Google Scholar] [CrossRef]
- Hanberry, B.B.; Fraser, J.S. Visualizing current and future climate boundaries of the conterminous United States: Implications for forests. Forests 2019, 10, 80. [Google Scholar] [CrossRef]
- Köppen, W.; Volken, E.; Brönnimann, S. Die Wärmezonen der Erde, nach der Dauer der heissen, gemässigten und kalten Zeit und nach der Wirkung der Wärme auf die organische Welt betrachtet [The thermal zones of the earth according to the duration of hot, moderate and cold periods and to the impact of heat on the organic world)]. Meteorol. Z. 2011, 20, 351–360. [Google Scholar]
- Belda, M.; Holtanová, E.; Halenka, T.; Kalvová, J. Climate classification revisited: From Köppen to Trewartha. Clim. Res. 2014, 59, 1–13. [Google Scholar] [CrossRef]
- Guetter, P.J.; Kutzbach, J.E. A modified Köppen classification applied to model simulations of glacial and interglacial climates. Clim. Chang. 1990, 16, 193–215. [Google Scholar] [CrossRef]
- Beck, H.E.; Zimmermann, N.E.; McVicar, T.R.; Vergopolan, N.; Berg, A.; Wood, E.F. Present and future Köppen-Geiger climate classification maps at 1-km resolution. Sci. Data 2018, 5, 1–12. [Google Scholar] [CrossRef]
- Thornthwaite, C.W. An approach toward a rational classification of climate. Geogr. Rev. 1948, 38, 55–94. [Google Scholar] [CrossRef]
- Feddema, J.J. A revised Thornthwaite-type global climate classification. Phys. Geogr. 2005, 26, 442–466. [Google Scholar] [CrossRef]
- Deutsch, C.A.; Tewksbury, J.J.; Huey, R.B.; Sheldon, K.S.; Ghalambor, C.K.; Haak, D.C.; Martin, P.R. Impacts of climate warming on terrestrial ectotherms across latitude. Proc. Natl. Acad. Sci. USA 2008, 105, 6668–6672. [Google Scholar] [CrossRef]
- Araújo, M.B.; Ferri-Yáñez, F.; Bozinovic, F.; Marquet, P.A.; Valladares, F.; Chown, S.L. Heat freezes niche evolution. Ecol. Lett. 2013, 16, 1206–1219. [Google Scholar] [CrossRef]
- Hanberry, B.B. Global population densities, climate change, and the maximum monthly temperature threshold as a potential tipping point for high urban densities. Ecol. Indic. 2022, 135, 108512. [Google Scholar] [CrossRef]
- Metzger, M.J.; Bunce, R.G.; Jongman, R.H.; Sayre, R.; Trabucco, A.; Zomer, R. A high-resolution bioclimate map of the world: A unifying framework for global biodiversity research and monitoring. Glob. Ecol. Biogeogr. 2013, 22, 630–638. [Google Scholar] [CrossRef]
- United Nations Environment Programme. World Atlas of Desertification. 1997. Available online: https://wedocs.unep.org/handle/20.500.11822/30300 (accessed on 14 February 2021).
- Spinoni, J.; Vogt, J.; Naumann, G.; Carrao, H.; Barbosa, P. Towards identifying areas at climatological risk of desertification using the Köppen–Geiger classification and FAO aridity index. Int. J. Climatol. 2015, 35, 2210–2222. [Google Scholar] [CrossRef]
- Liu, S.; Jiang, D.; Lang, X. Mid-Holocene drylands: A multi-model analysis using Paleoclimate Modelling Intercomparison Project Phase III (PMIP3) simulations. Holocene 2019, 29, 1425–1438. [Google Scholar] [CrossRef]
- Yoo, J.; Rohli, R.V. Global distribution of Köppen–Geiger climate types during the Last Glacial Maximum, Mid-Holocene, and present. Palaeogeogr. Palaeoclimatol. Palaeoecol. 2016, 446, 326–337. [Google Scholar] [CrossRef]
- Willmes, C.; Becker, D.; Brocks, S.; Hütt, C.; Bareth, G. High resolution Köppen-Geiger classifications of paleoclimate simulations. Trans. GIS 2017, 21, 57–73. [Google Scholar] [CrossRef]
- Osman, M.B.; Tierney, J.E.; Zhu, J.; Tardif, R.; Hakim, G.J.; King, J.; Poulsen, C.J. Globally resolved surface temperatures since the Last Glacial Maximum. Nature 2021, 599, 239–244. [Google Scholar] [CrossRef]
- Tierney, J.E.; Zhu, J.; King, J.; Malevich, S.B.; Hakim, G.J.; Poulsen, C.J. Glacial cooling and climate sensitivity revisited. Nature 2020, 584, 569–573. [Google Scholar] [CrossRef]
- Mottl, O.; Flantua, S.G.; Bhatta, K.P.; Felde, V.A.; Giesecke, T.; Goring, S.; Grimm, E.C.; Haberle, S.; Hooghiemstra, H.; Ivory, S.; et al. Global acceleration in rates of vegetation change over the past 18,000 years. Science 2021, 372, 860–864. [Google Scholar] [CrossRef]
- Kageyama, M.; Harrison, S.P.; Kapsch, M.L.; Lofverstrom, M.; Lora, J.M.; Mikolajewicz, U.; Sherriff-Tadano, S.; Vadsaria, T.; Abe-Ouchi, A.; Bouttes, N.; et al. The PMIP4 Last Glacial Maximum experiments: Preliminary results and comparison with the PMIP3 simulations. Clim. Past 2021, 17, 1065–1089. [Google Scholar] [CrossRef]
- Hijmans, R.J.; Cameron, S.E.; Parra, J.L.; Jones, P.G.; Jarvis, A. Very high resolution interpolated climate surfaces for global land areas. Int. J. Climatol. A J. R. Meteorol. Soc. 2005, 25, 1965–1978. [Google Scholar] [CrossRef]
- Title, P.O.; Bemmels, J.B. ENVIREM: An expanded set of bioclimatic and topographic variables increases flexibility and improves performance of ecological niche modeling. Ecography 2018, 41, 291–307. [Google Scholar] [CrossRef]
- Fernández-Delgado, M.; Cernadas, E.; Barro, S.; Amorim, D. Do we need hundreds of classifiers to solve real world classification problems? J. Mach. Learn. Res. 2014, 15, 3133–3181. [Google Scholar]
- Fourcade, Y.; Besnard, A.G.; Secondi, J. Paintings predict the distribution of species, or the challenge of selecting environmental predictors and evaluation statistics. Glob. Ecol. Biogeogr. 2018, 27, 245–256. [Google Scholar] [CrossRef]
- Santini, L.; Benítez-López, A.; Maiorano, L.; Čengić, M.; Huijbregts, M.A. Assessing the reliability of species distribution projections in climate change research. Divers. Distrib. 2021, 27, 1035–1050. [Google Scholar] [CrossRef]
- Breiman, L. Random forests. Mach. Learn. 2001, 45, 5–32. [Google Scholar] [CrossRef]
- Kuhn, M. Building predictive models in R using the caret package. J. Stat. Softw. 2008, 28, 1–26. [Google Scholar] [CrossRef]
- R Core Team. R: A Language and Environment for Statistical Computing; R Foundation for Statistical Computing: Vienna, Austria, 2020. [Google Scholar]
- European Space Agency [ESA]. Land Cover CCI Product User Guide Version 2. 2017. Available online: https://maps.elie.ucl.ac.be/CCI/viewer/download/ESACCI-LC-Ph2-PUGv2_2.0.pdf (accessed on 14 February 2021).
- Natural Earth. Downloads. 2021. Available online: https://www.naturalearthdata.com/downloads (accessed on 12 August 2021).
- Schwalm, C.R.; Glendon, S.; Duffy, P.B. RCP8.5 tracks cumulative CO2 emissions. Proc. Natl. Acad. Sci. USA 2020, 117, 19656–19657. [Google Scholar] [CrossRef]
- Brown, J.L.; Hill, D.J.; Dolan, A.M.; Carnaval, A.C.; Haywood, A.M. PaleoClim, high spatial resolution paleoclimate surfaces for global land areas. Sci. Data 2018, 5, 180254. [Google Scholar] [CrossRef]
- Beyer, R.; Krapp, M.; Manica, A. An empirical evaluation of bias correction methods for palaeoclimate simulations. Clim. Past 2020, 16, 1493–1508. [Google Scholar] [CrossRef]

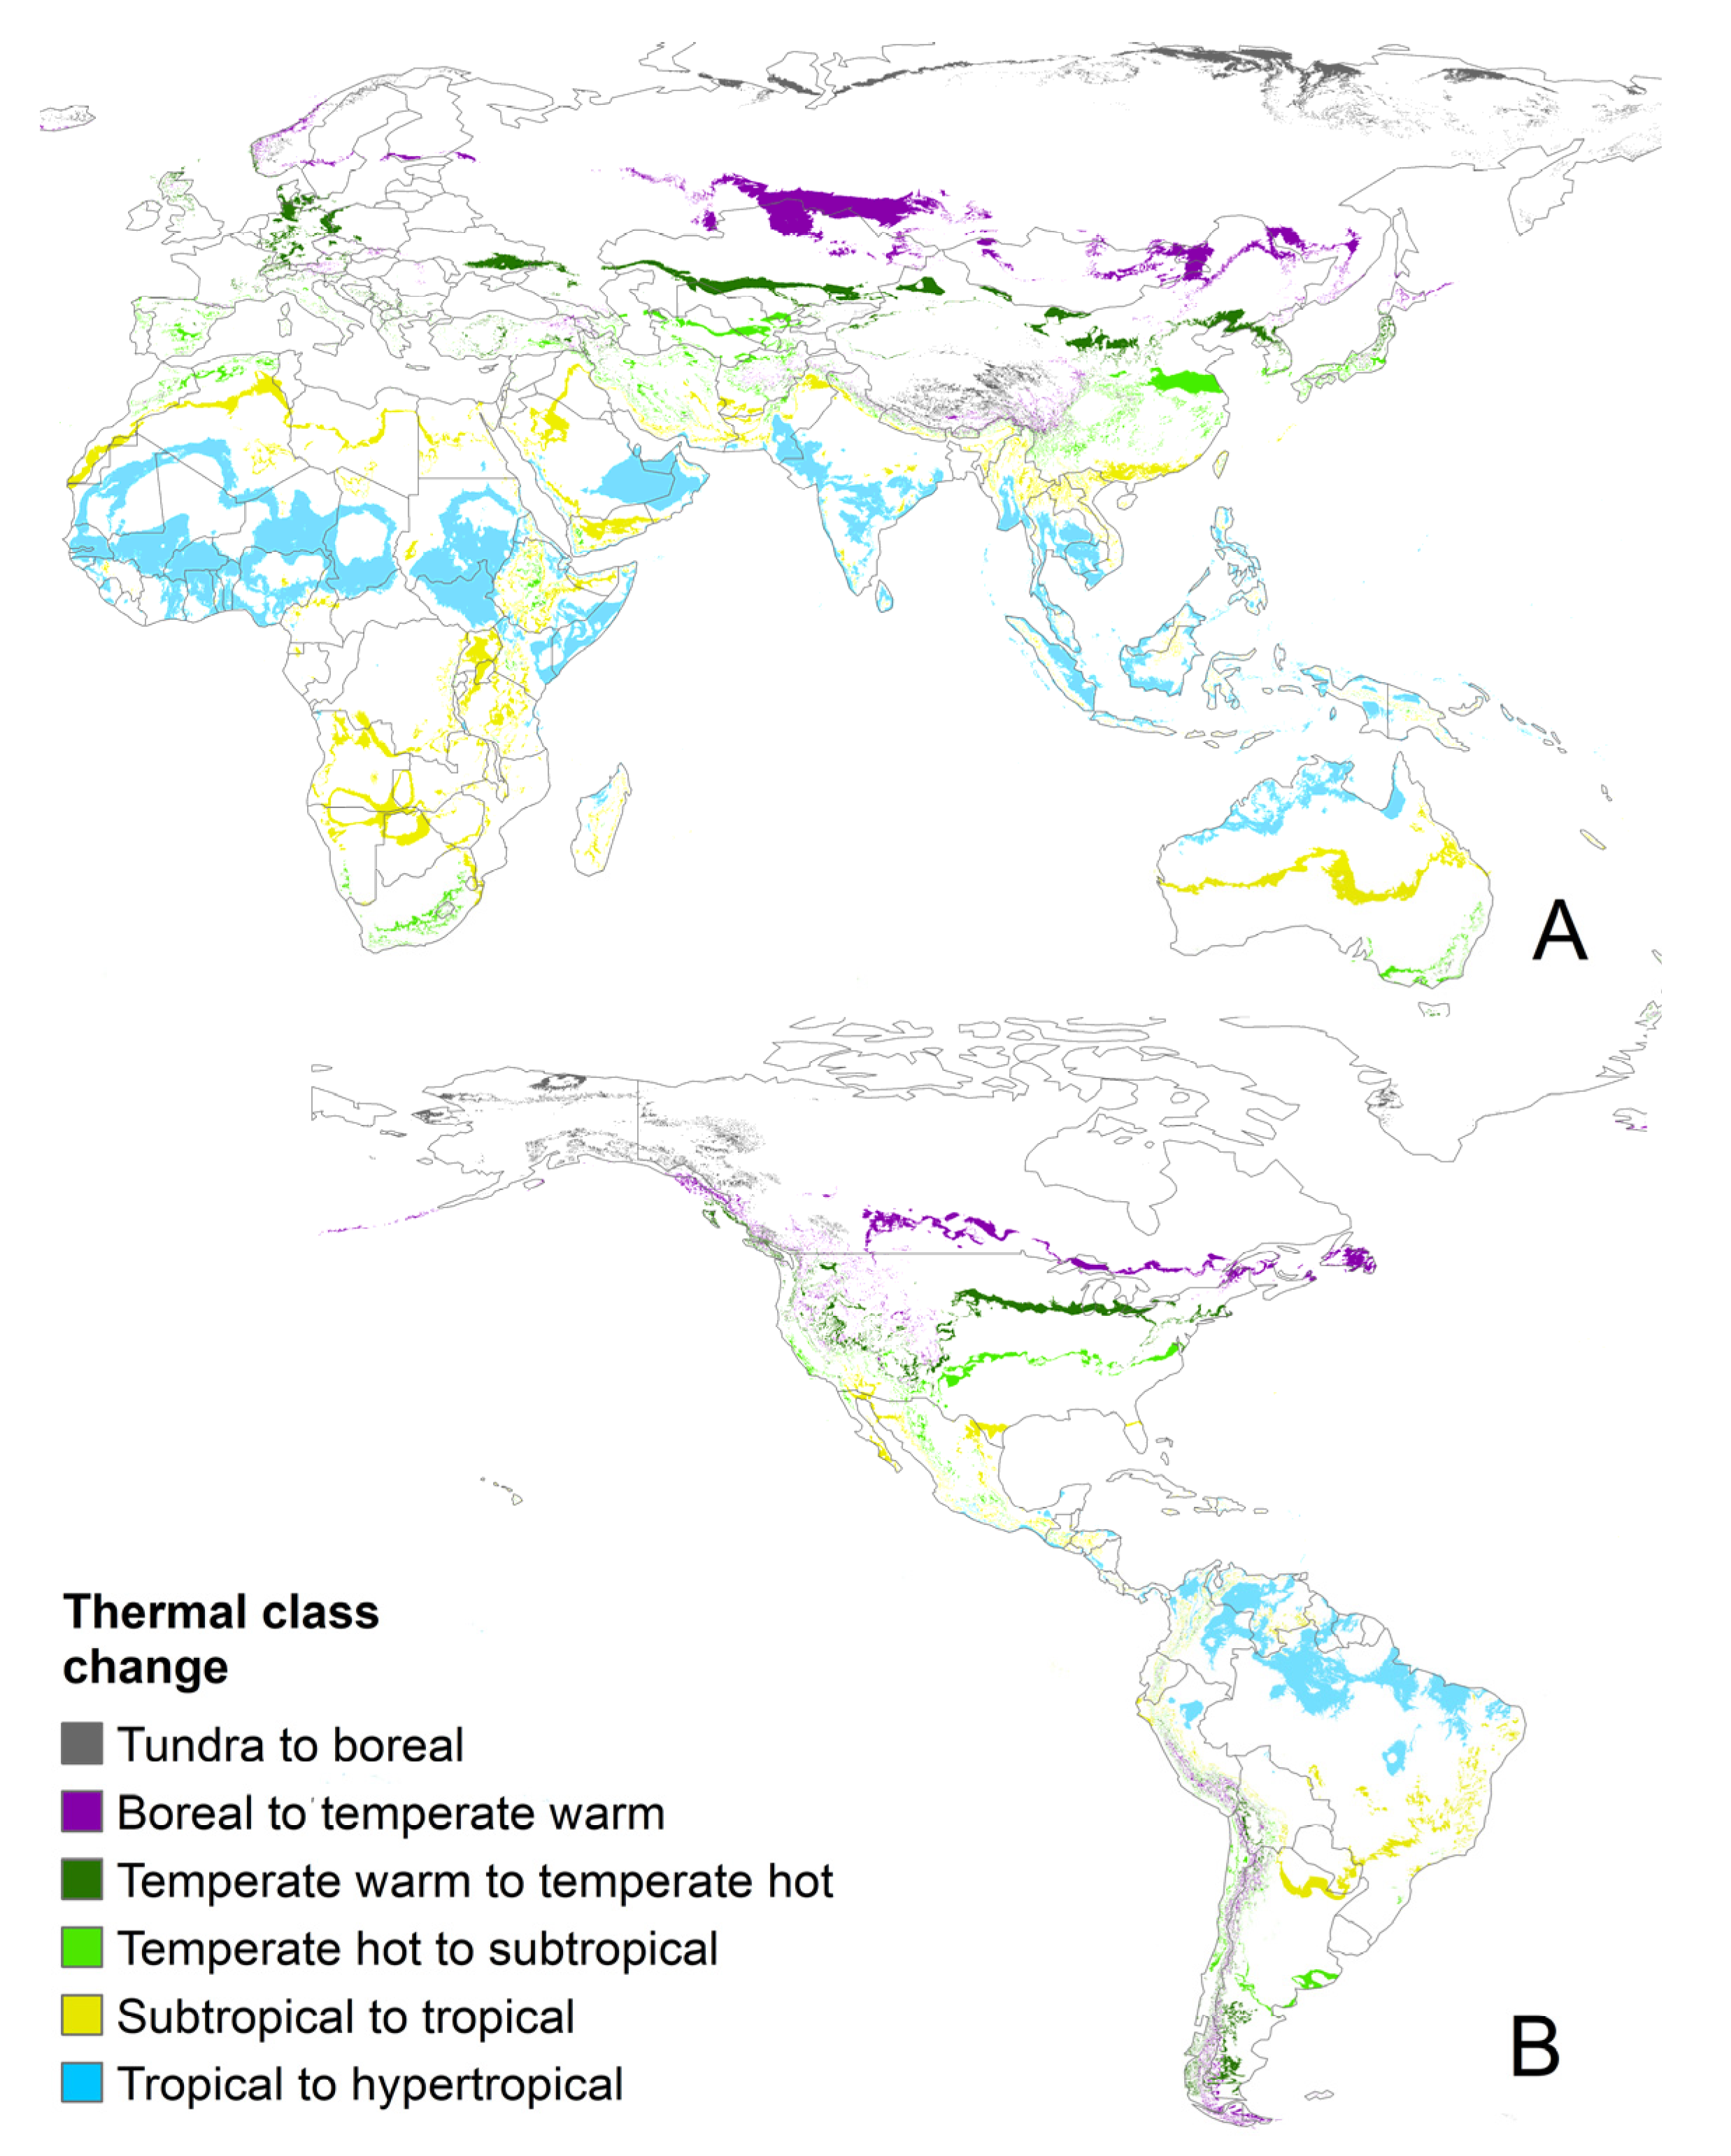

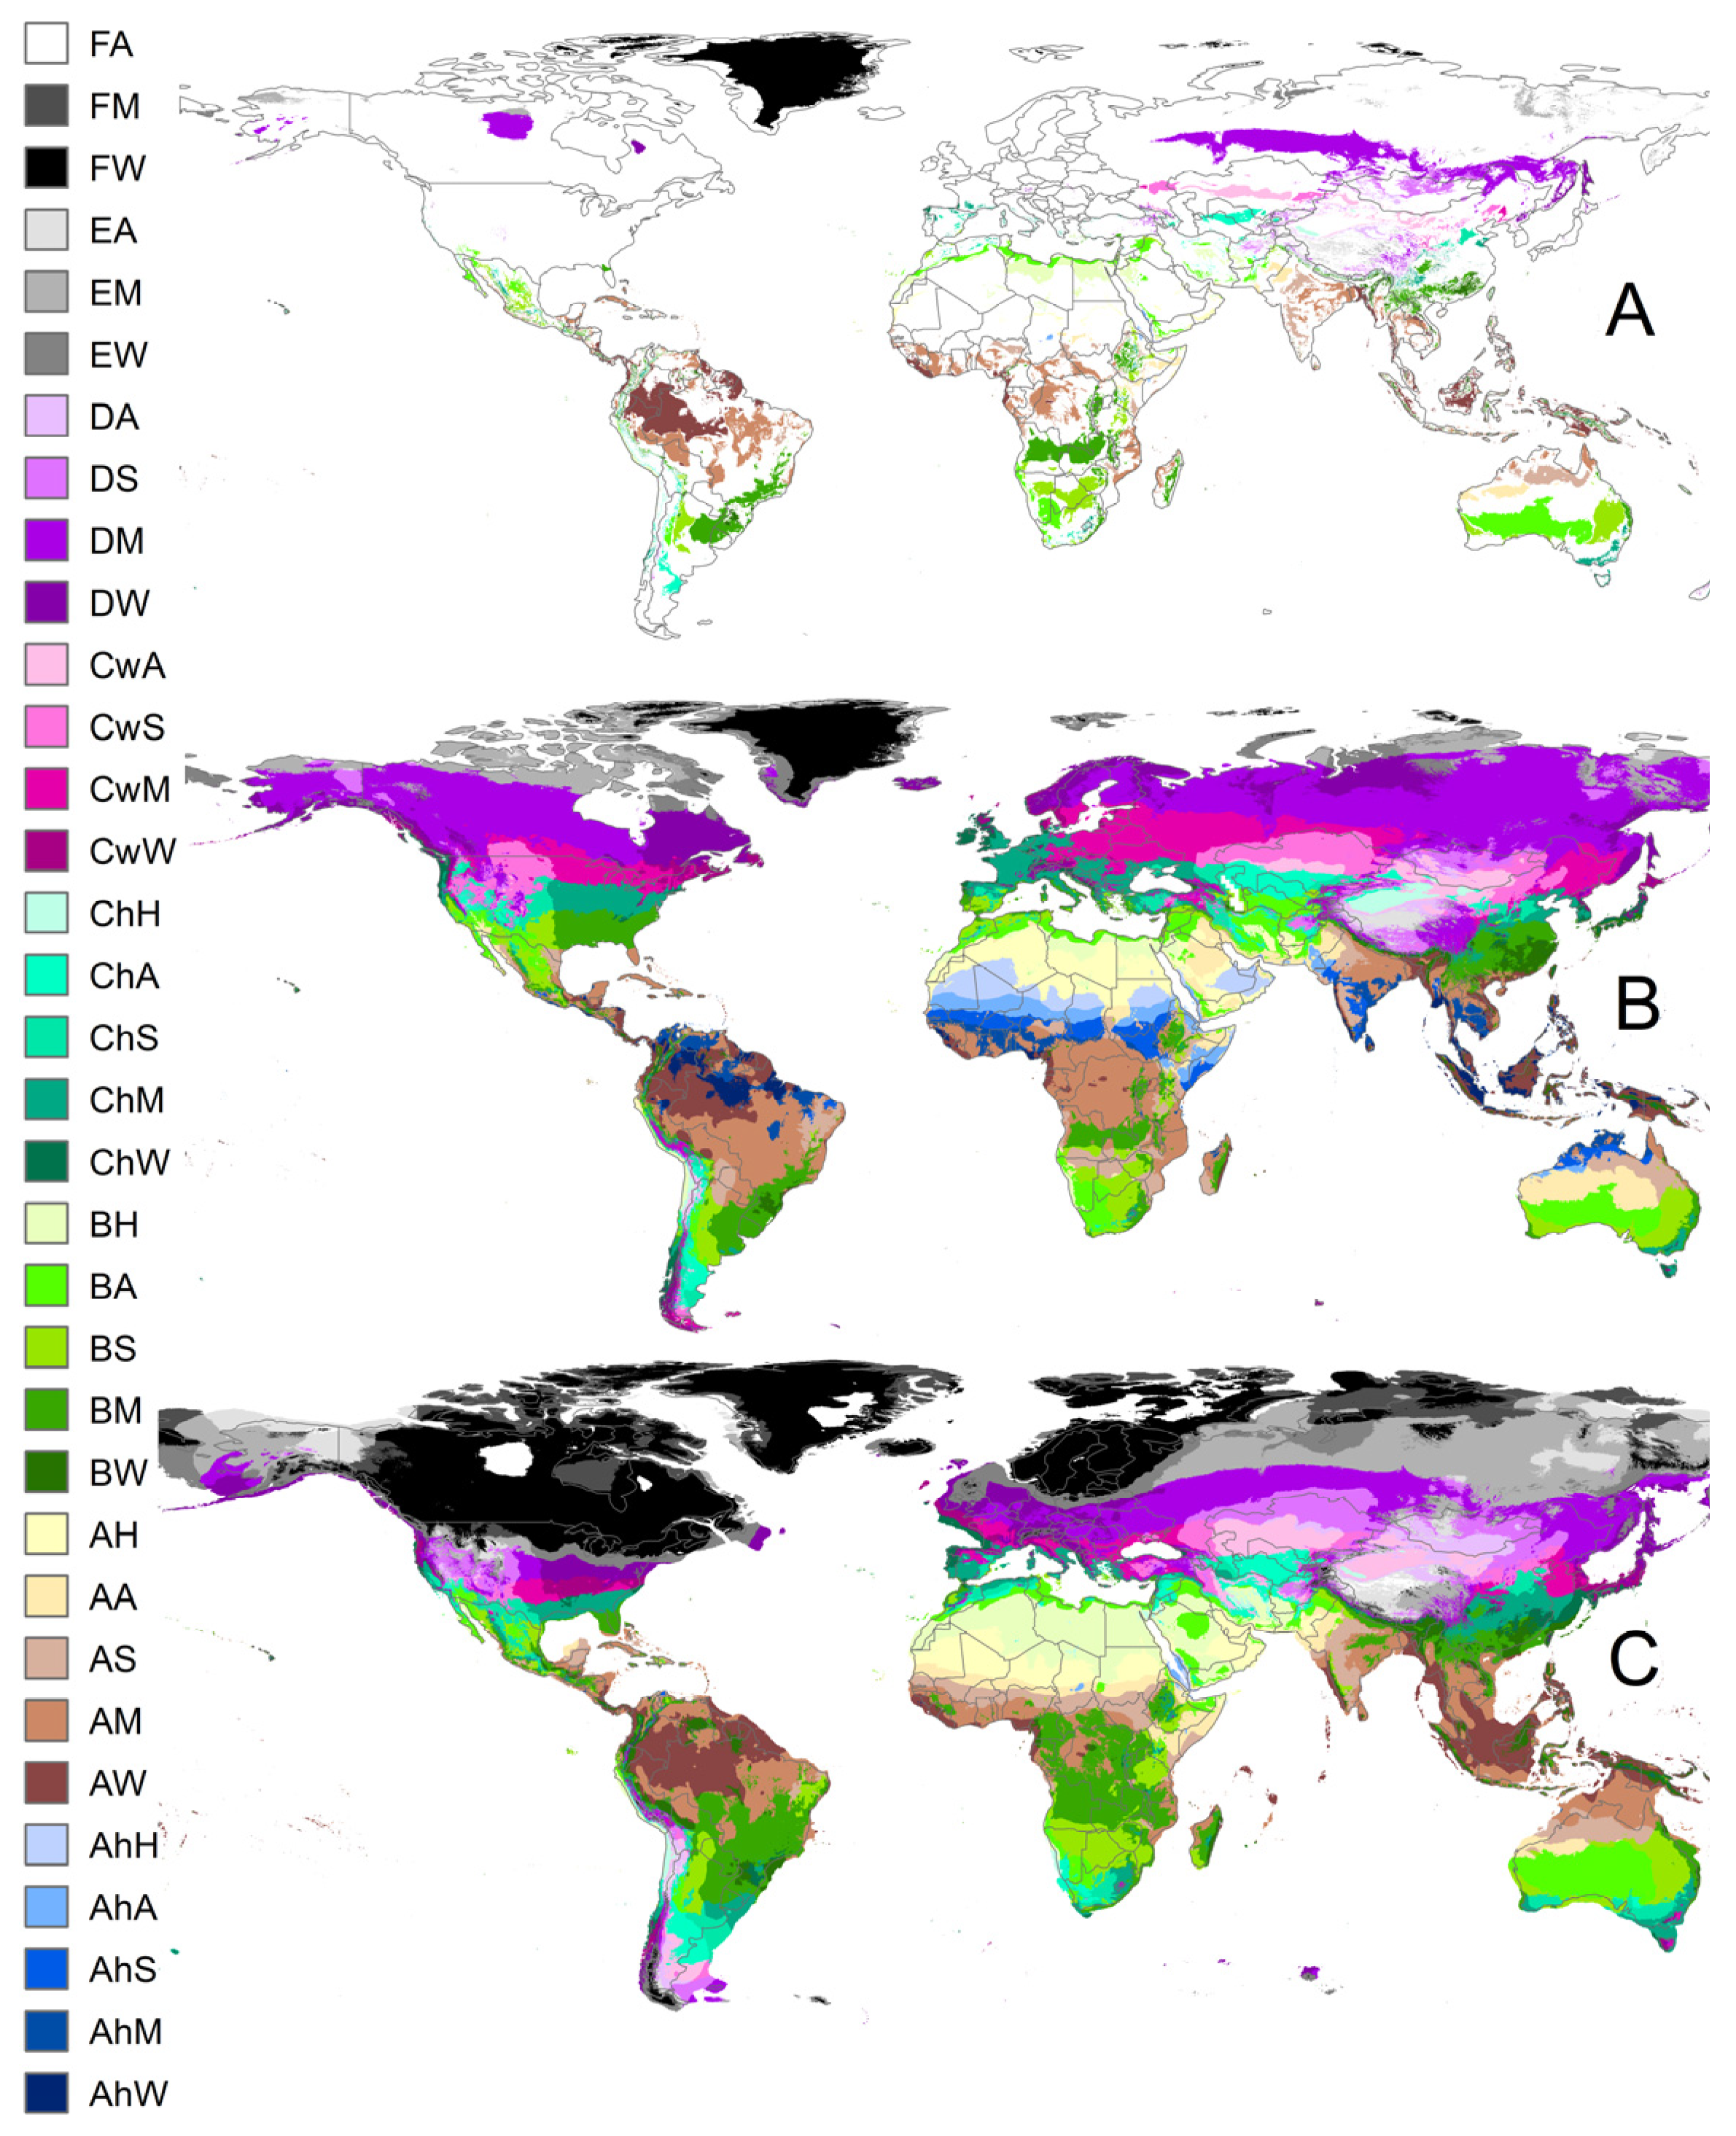
| Thermal Köppen Class | Subclass | % Area | °C | Reduced Thermal Class | Ruleset | |
|---|---|---|---|---|---|---|
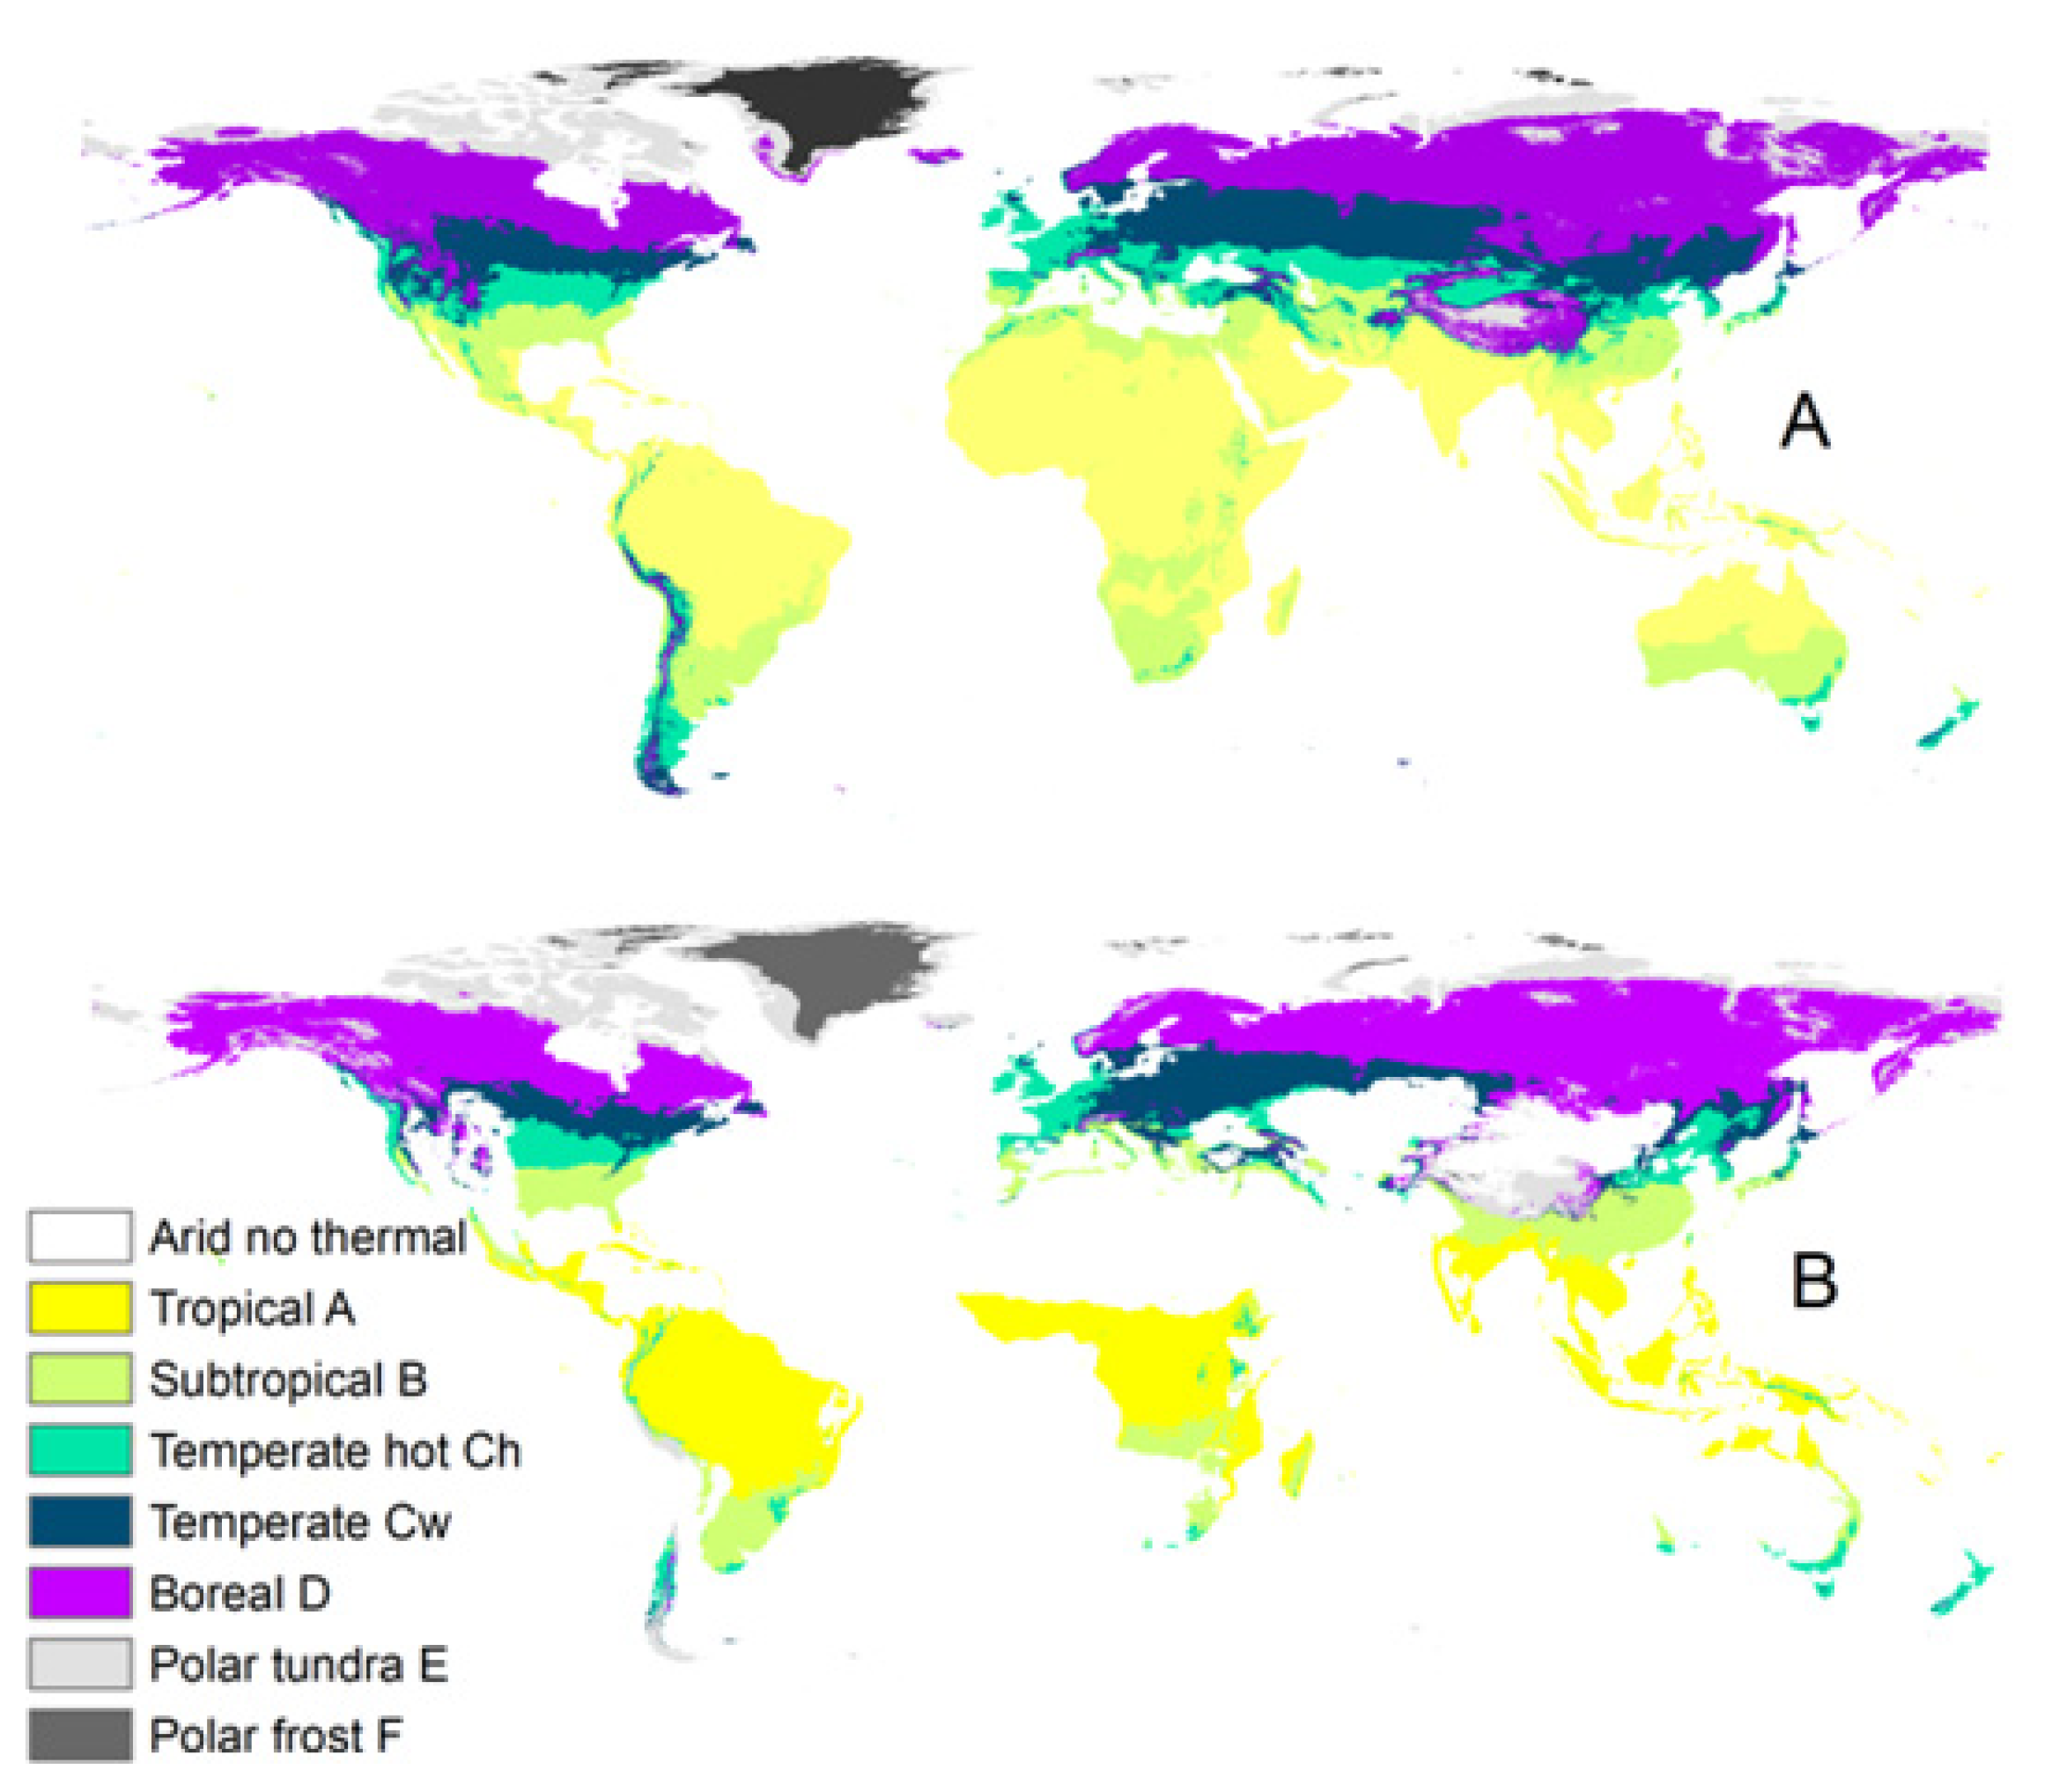
| Tropical, rainforest | Af | 5.4 | 25.5 | Tropical | A | GDD0 > 9250 |
| Tropical, monsoon | Am | 3.8 | 25.4 | |||
| Tropical, savannah | Aw | 12.5 | 24.9 | |||
| Temperate, hot summer | Cwa | 3.1 | 20.6 | Subtropical | B | 5950 < GDD0 ≤ 9250 |
| Temperate, hot summer | Cfa | 4.1 | 17.1 | |||
| Temperate, warm summer | Cwb | 1.3 | 15.9 | |||
| Temperate, hot summer | Csa | 1.1 | 15.8 | |||
| Temperate, warm summer | Csb | 0.6 | 12.4 | Temperate hot | Ch | 3070 < GDD0 ≤ 5950 |
| Cold, hot summer | Dsa | 0.2 | 11.5 | |||
| Temperate, warm summer | Cfb | 1.9 | 11.4 | |||
| Cold, hot summer | Dfa | 1.5 | 9.8 | |||
| Temperate, cold summer | Cwc | 0.0 | 8.7 | |||
| Cold, hot summer | Dwa | 0.9 | 8.1 | |||
| Temperate, cold summer | Csc | 0.0 | 6.9 | Temperate warm | Cw | 1570 < GDD0 ≤ 3070 |
| Temperate, cold summer | Cfc | 0.1 | 6.8 | |||
| Cold, warm summer | Dsb | 0.4 | 6.7 | |||
| Cold, warm summer | Dfb | 5.5 | 4.9 | |||
| Cold, warm summer | Dwb | 0.9 | 2.6 | |||
| Cold, cold summer | Dwc | 2.2 | −4.9 | Boreal | D | 300 < GDD0 ≤ 1570 |
| Cold, cold summer | Dfc | 11.5 | −4.3 | |||
| Cold, very cold winter | Dfd | 0.4 | −12.9 | |||
| Cold, cold summer | Dsc | 1.2 | −6.9 | |||
| Cold, very cold winter | Dsd | 0.0 | −12.2 | |||
| Cold, very cold winter | Dwd | 0.2 | −13.9 | |||
| Polar, tundra | Et | 6.0 | −10.2 | Tundra | E | 3 < GDD0 ≤ 300 |
| Polar, frost | Ef | 1.3 | −35.8 | Polar | F | GDD0 ≤ 3 |
| Classification | Aridity Index | % Area | Precipitation | PET | Aridity | Class |
|---|---|---|---|---|---|---|
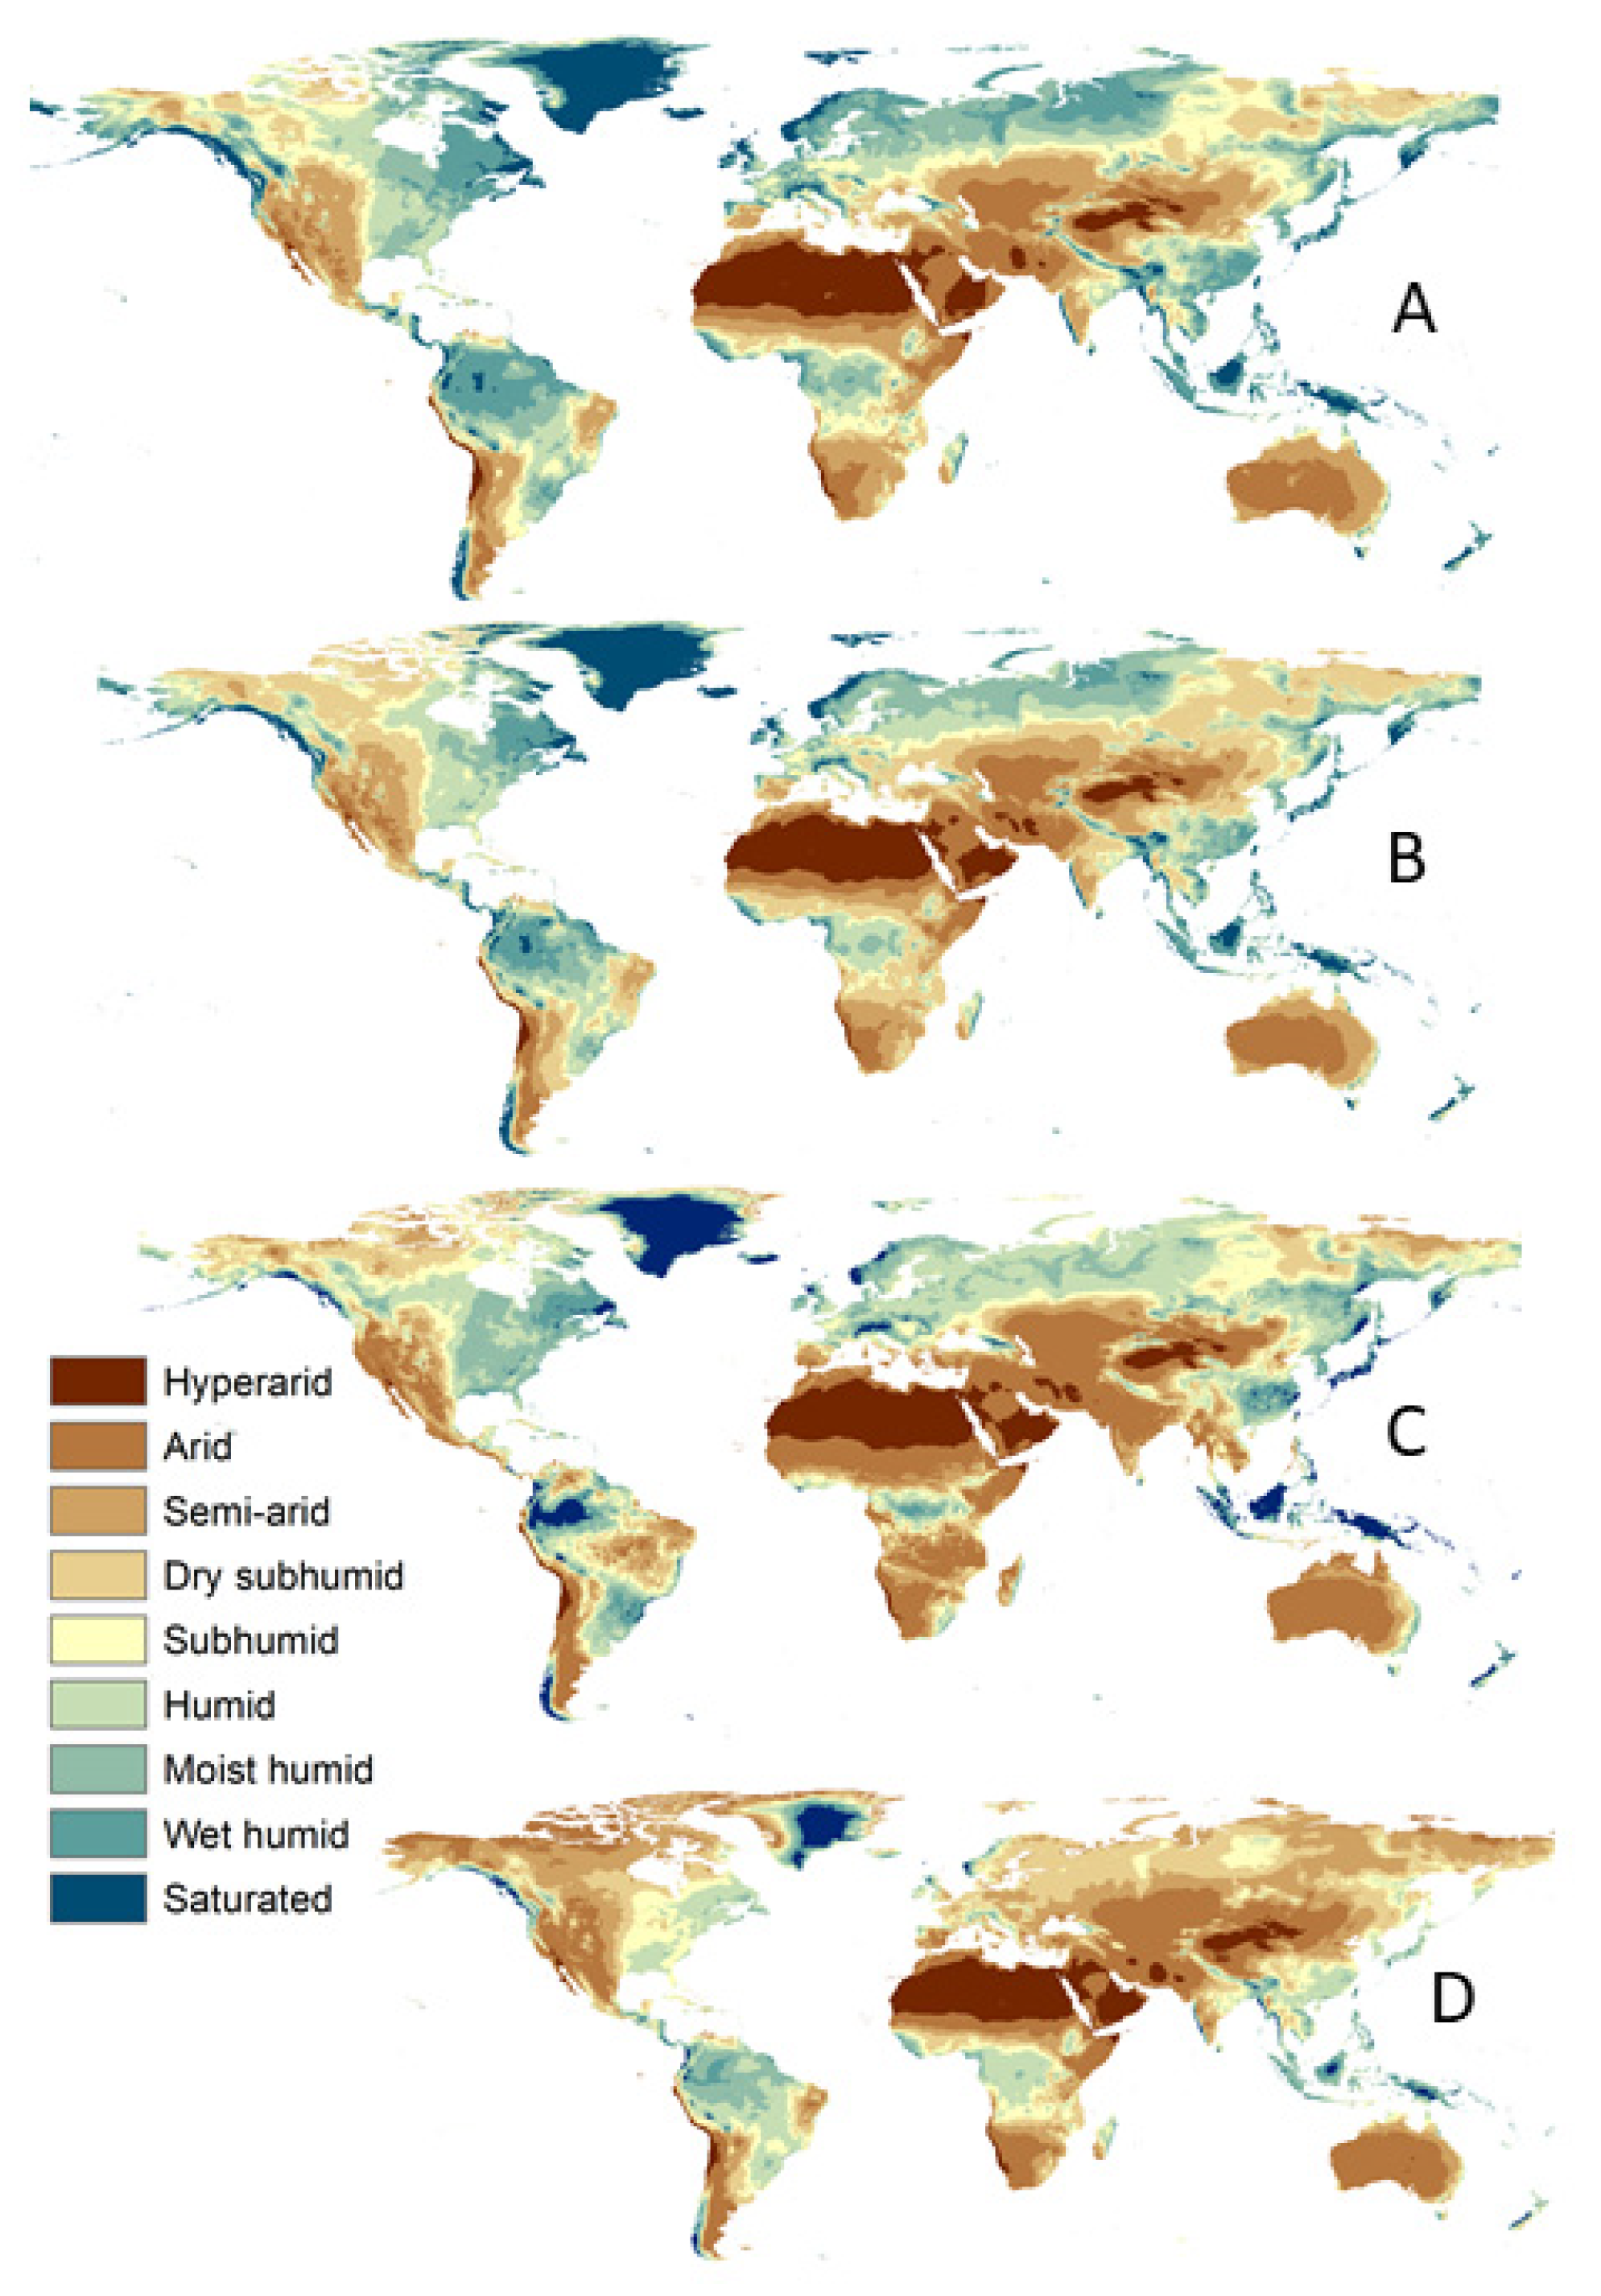
| Hyperarid | <0.05 | 8.45 | 34 | 1823 | 0.02 | H |
| Arid | 0.05 to 0.20 | 13.11 | 192 | 1579 | 0.12 | A |
| Semi-arid | 0.20 to 0.50 | 17.58 | 474 | 1379 | 0.34 | S |
| Dry subhumid | 0.50 to 0.65 | 9.57 | 659 | 1143 | 0.58 | M |
| Subhumid | 0.65 to 0.80 | 10.56 | 756 | 1044 | 0.72 | M |
| Humid | 0.8 to 1.0 | 12.48 | 968 | 1078 | 0.90 | M |
| Moist humid | 1.0 to 1.25 | 11.63 | 1129 | 1016 | 1.11 | M |
| Wet humid | 1.25 to 2 | 12.04 | 1641 | 1068 | 1.54 | W |
| Saturated | ≥2 | 4.58 | 2037 | 724 | 2.81 | W |
| Current | Last Glacial Maximum | |||||||||
|---|---|---|---|---|---|---|---|---|---|---|
| Class | GDD0 | Aridity | % Area | % Thermal | % Arid | GDD0 | Aridity | % Area | % Thermal | % Arid |
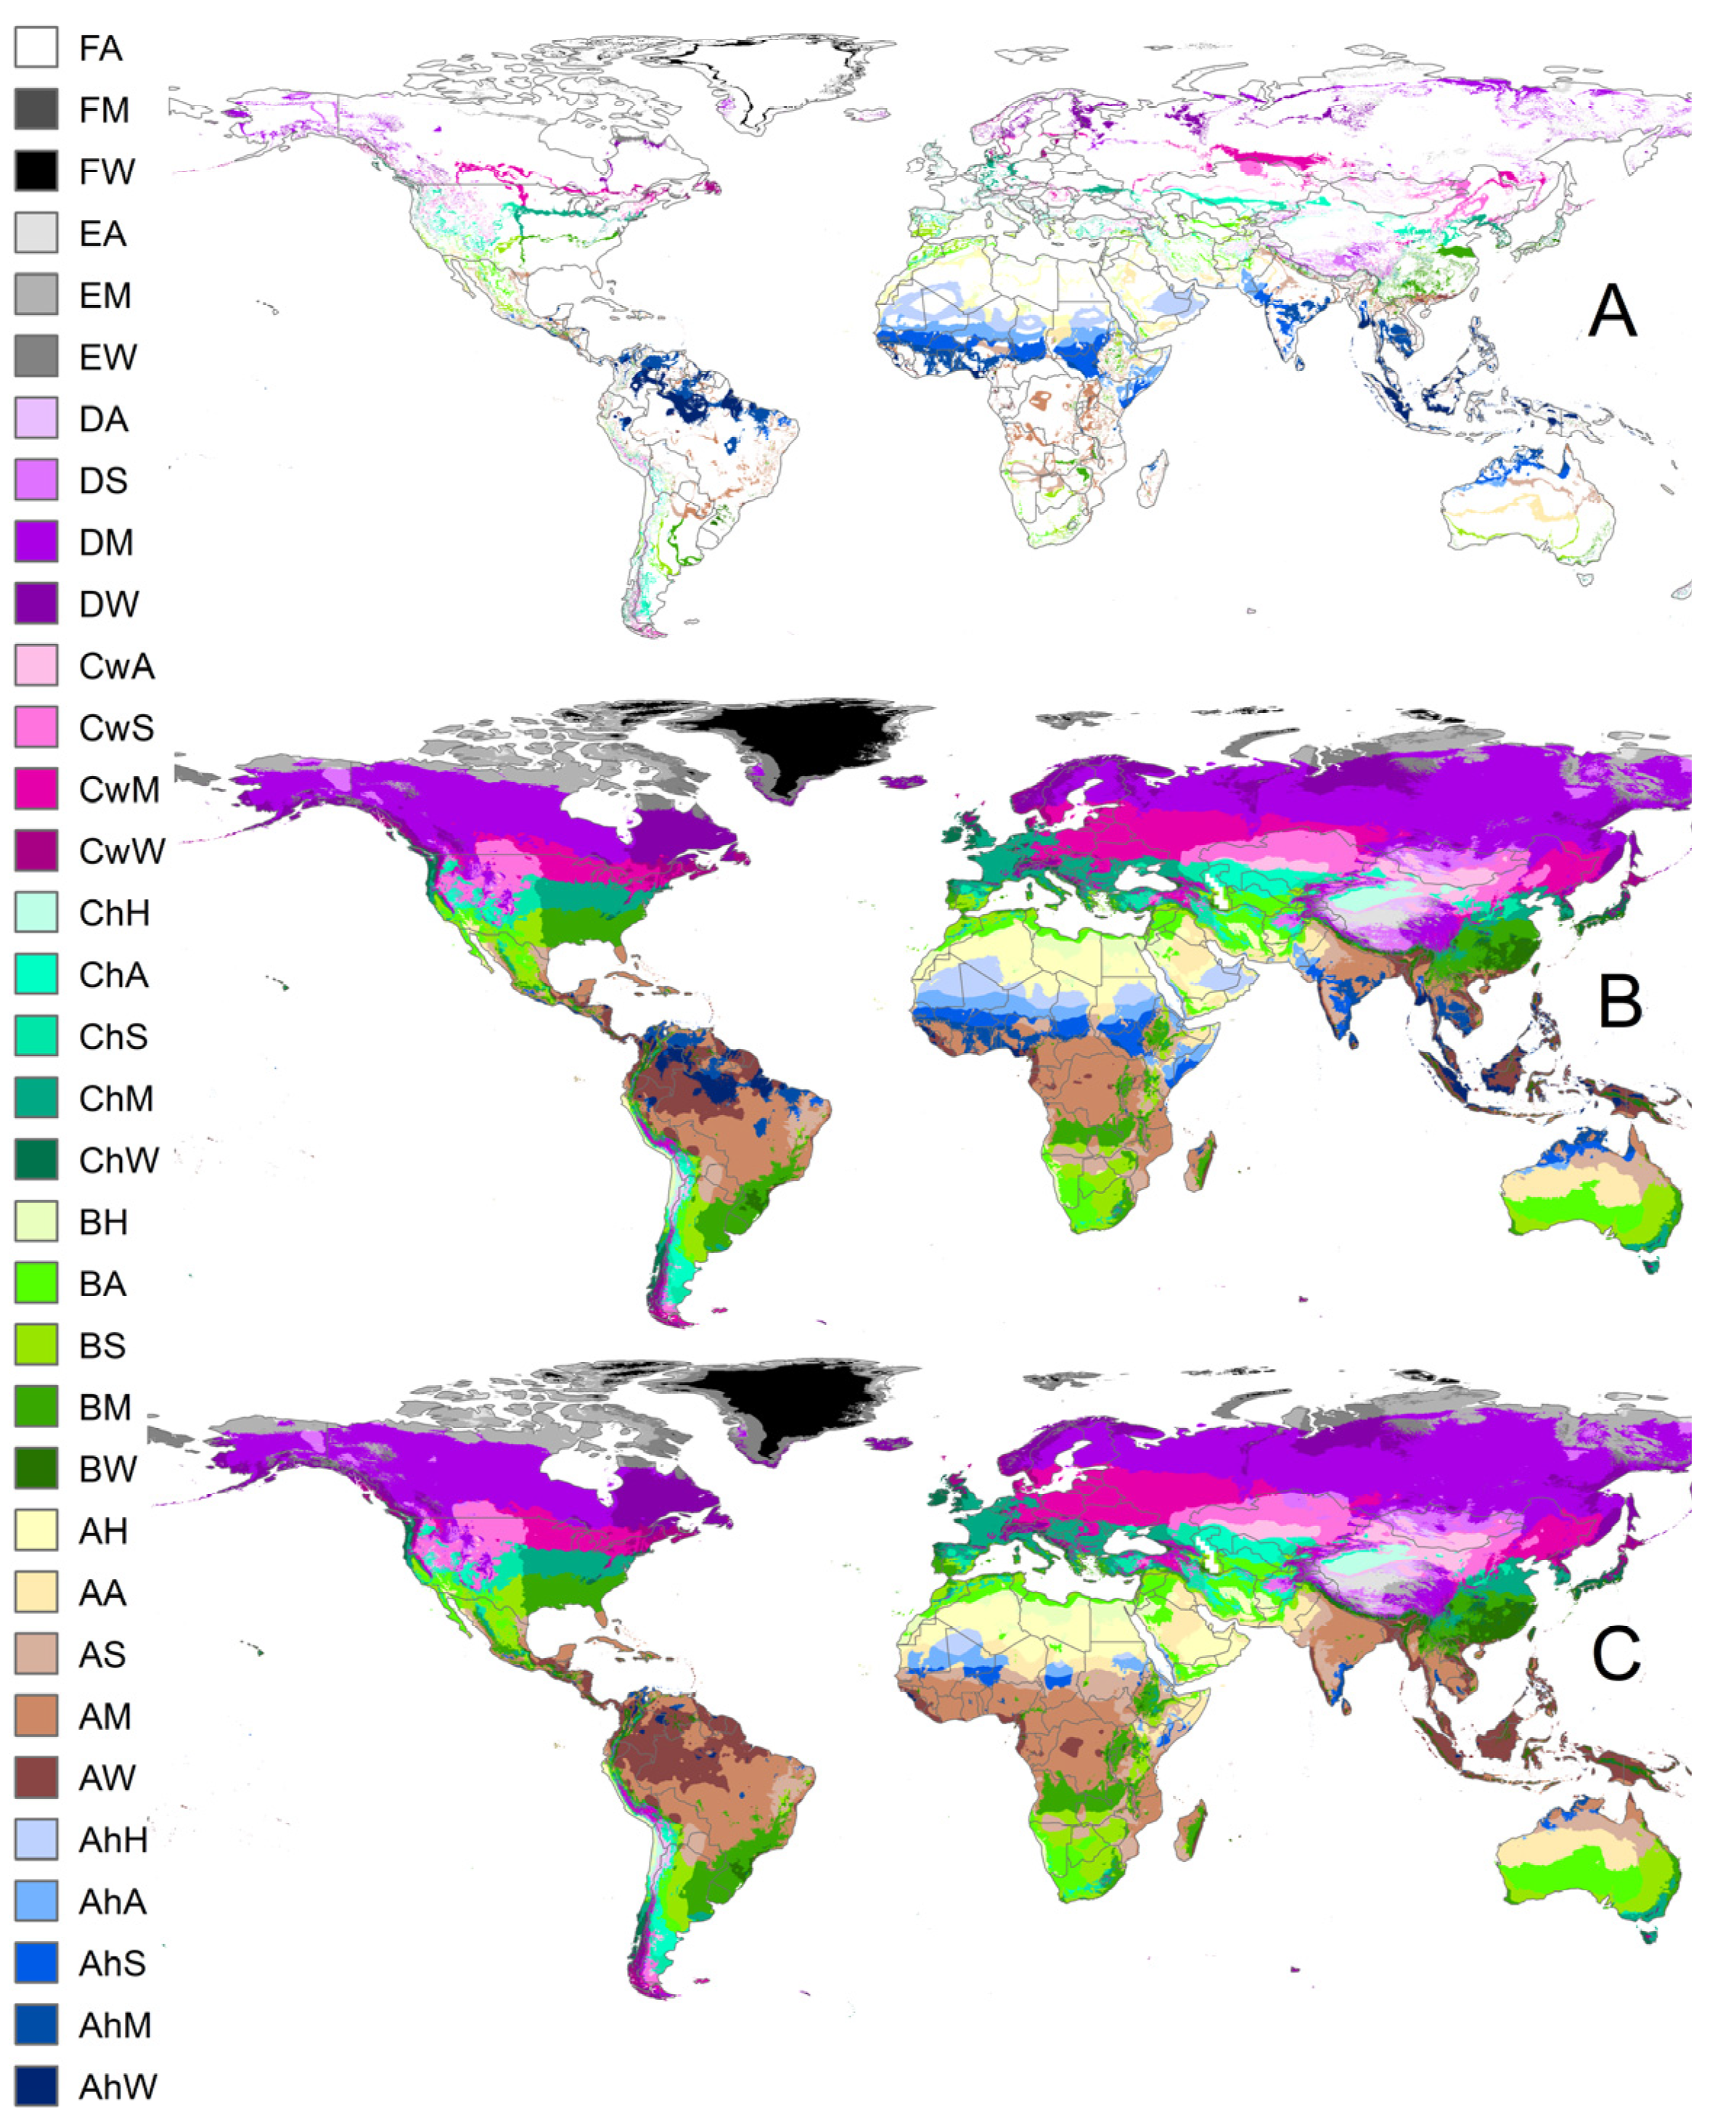
| FA | 0 | 0.319 | 0.003 | 1.21 | 0.23 | 0 | 0.356 | 1.014 | 14.71 | 1.01 |
| FM | 2 | 1.104 | 0.015 | 0 | 0.878 | 2.865 | ||||
| FW | 0 | 8.436 | 1.191 | 0 | 23.713 | 10.831 | ||||
| EA | 164 | 0.360 | 0.651 | 4.97 | 0.32 | 98 | 0.365 | 2.000 | 11.48 | 2.00 |
| EM | 144 | 0.861 | 2.837 | 110 | 0.826 | 6.251 | ||||
| EW | 124 | 2.069 | 1.477 | 90 | 2.742 | 3.225 | ||||
| DA | 946 | 0.119 | 0.331 | 17.73 | 1.68 | 1029 | 0.115 | 1.159 | 11.94 | 4.18 |
| DS | 839 | 0.397 | 1.409 | 838 | 0.349 | 3.018 | ||||
| DM | 811 | 0.856 | 12.270 | 678 | 0.812 | 5.214 | ||||
| DW | 722 | 1.751 | 3.722 | 707 | 2.213 | 2.552 | ||||
| CwA | 2354 | 0.123 | 1.336 | 11.09 | 3.56 | 2180 | 0.104 | 2.065 | 5.91 | 3.19 |
| CwS | 2166 | 0.355 | 3.406 | 2113 | 0.331 | 1.127 | ||||
| CwM | 2096 | 0.832 | 5.364 | 2224 | 0.832 | 1.671 | ||||
| CwW | 2191 | 2.279 | 0.985 | 2215 | 1.897 | 1.046 | ||||
| ChH | 4043 | 0.026 | 0.538 | 9.02 | 4.94 | 4941 | 0.026 | 0.323 | 8.77 | 4.17 |
| ChA | 4277 | 0.137 | 1.642 | 4523 | 0.115 | 1.711 | ||||
| ChS | 4287 | 0.337 | 1.876 | 4757 | 0.342 | 2.132 | ||||
| ChM | 4352 | 0.827 | 3.943 | 4566 | 0.841 | 3.429 | ||||
| ChW | 4222 | 2.175 | 1.025 | 4339 | 1.787 | 1.177 | ||||
| BH | 8510 | 0.023 | 1.248 | 17.22 | 9.69 | 7874 | 0.018 | 5.006 | 23.80 | 12.92 |
| BA | 7959 | 0.124 | 4.238 | 7445 | 0.120 | 3.858 | ||||
| BS | 7625 | 0.329 | 4.208 | 7567 | 0.343 | 4.060 | ||||
| BM | 7708 | 0.841 | 6.075 | 8022 | 0.847 | 8.746 | ||||
| BW | 7635 | 1.655 | 1.454 | 7971 | 1.736 | 2.129 | ||||
| AH | 10,366 | 0.015 | 4.200 | 27.64 | 11.65 | 10,024 | 0.020 | 3.097 | 23.2 | 8.8 |
| AA | 10,355 | 0.113 | 3.487 | 10,276 | 0.120 | 2.204 | ||||
| AS | 10,400 | 0.348 | 3.964 | 10,183 | 0.356 | 3.547 | ||||
| AM | 10,588 | 0.856 | 11.192 | 9962 | 0.856 | 8.102 | ||||
| AW | 10,879 | 1.752 | 4.800 | 9975 | 1.733 | 6.242 | ||||
| AhH | 12,028 | 0.022 | 2.272 | 11.11 | 6.58 | 12,151 | 0.030 | 0.094 | 0.2 | 0.2 |
| AhA | 12,198 | 0.117 | 2.087 | 12,112 | 0.073 | 0.087 | ||||
| AhS | 11,948 | 0.354 | 2.217 | 11,599 | 0.300 | 0.008 | ||||
| AhM | 11,763 | 0.794 | 2.552 | 11,559 | 0.686 | 0.007 | ||||
| AhW | 11,660 | 1.661 | 1.985 | 11,568 | 1.754 | 0.004 | ||||
Disclaimer/Publisher’s Note: The statements, opinions and data contained in all publications are solely those of the individual author(s) and contributor(s) and not of MDPI and/or the editor(s). MDPI and/or the editor(s) disclaim responsibility for any injury to people or property resulting from any ideas, methods, instructions or products referred to in the content. |
© 2023 by the author. Licensee MDPI, Basel, Switzerland. This article is an open access article distributed under the terms and conditions of the Creative Commons Attribution (CC BY) license (https://creativecommons.org/licenses/by/4.0/).
Share and Cite
Hanberry, B.B. Global Climate Classification and Comparison to Mid-Holocene and Last Glacial Maximum Climates, with Added Aridity Information and a Hypertropical Class. Earth 2023, 4, 552-569. https://doi.org/10.3390/earth4030029
Hanberry BB. Global Climate Classification and Comparison to Mid-Holocene and Last Glacial Maximum Climates, with Added Aridity Information and a Hypertropical Class. Earth. 2023; 4(3):552-569. https://doi.org/10.3390/earth4030029
Chicago/Turabian StyleHanberry, Brice B. 2023. "Global Climate Classification and Comparison to Mid-Holocene and Last Glacial Maximum Climates, with Added Aridity Information and a Hypertropical Class" Earth 4, no. 3: 552-569. https://doi.org/10.3390/earth4030029
APA StyleHanberry, B. B. (2023). Global Climate Classification and Comparison to Mid-Holocene and Last Glacial Maximum Climates, with Added Aridity Information and a Hypertropical Class. Earth, 4(3), 552-569. https://doi.org/10.3390/earth4030029


