Article

Examination of Susceptibility to the Deficiency of Soil Water in a Forested Agricultural Area

by
Wiktor Halecki
1,* and
Stanisław Łyszczarz
2
1
Institute of Environmental Engineering, Department of Hydrology, Meteorology and Water Management, Warsaw University of Life Sciences, Nowoursynowska Street 166, 02-787 Warsaw, Poland
2
Department of Ecology and Silviculture, Faculty of Forestry, University of Agriculture in Krakow, Al. 29 Listopada 46, 31-425 Krakow, Poland
*
Author to whom correspondence should be addressed.
Earth 2021, 2(3), 532-543; https://doi.org/10.3390/earth2030031
Submission received: 18 July 2021 / Revised: 15 August 2021 / Accepted: 24 August 2021 / Published: 28 August 2021
(This article belongs to the Special Issue Terraced Landscapes as Models of Ecological Sustainability)

Abstract

:
Mountainous regions present numerous obstacles to agriculture. These include the terrain, which is associated with surface erosion, as well as surface runoff, which washes away plant nutrients and weak soil. Spatial analysis is currently used in the study of various stochastic variables, especially those of high priority for soil water properties. Small watershed and basin-scale models were used to simulate the quantity of surface run-off, groundwater and predict the environmental impact of land use and land management practices. A new generation of the distributed hydrological models has greatly broadened simulation fields to soil and water diversified situations. The study also measured declines in slope and grain size distribution, factors impacting surface erosion and surface runoff. Multivariate statistics (canonical analysis) showed that soil moisture was most correlated both with agricultural land and forests, which is why it was used to create the model of spatial distribution. The model showed that salinity has the smallest forecast error in modeling, and thus best corresponds with the soil moisture. It is important to make a correct diagnosis of soil properties, and the degree of degradation. The assessment of the physiographic parameters of a basin will contribute to the development of proper usage and determine the quality of the water in the soil, which will be essential for forest resources and agricultural land in mountain areas exposed to surface erosion.

1. Introduction

In soil erosion research, it is important to determine the spatial variability (diversity) and spatial continuity (similarities). One uses the assumption that tested objects found closer together are more similar than objects found further apart [1]. A geographic information system (GIS) technique is commonly used in assessing the dynamics of rivers and the physiographic characteristics of a basin [2]. The evaluation of the quality of river basins is important in environmental monitoring [3]. The continuous spatial data of soil are difficult to present uniformly, and therefore new techniques and models are constantly being sought out, while results are verified using calibration [4]. Most frequently, multivariate statistics are used to assess the quality of river basins [5]. In environmental monitoring, the soil should be examined as well as other physical and chemical parameters.
Soil erosion negatively impacts plants by reducing the amount of available water [6,7,8]. It also has an impact on soil microorganisms. That is why the continuous control of the spatial distribution of soil parameters is substantial. Land use, next to soil moisture and precipitation, is one of the most valuable parameters in long-term studies of soil erosion [9,10,11]. For the spatial analysis of a basin, it is easiest to use a digital model of the terrain, on the basis of which rill erosion is assessed, among other things [12]. Monitoring the temperature in the soil contributes to a better understanding of the water content in the soil, especially for rainwater infiltration [13]. Changes in temperature affect porosity and soil particles. In clay soils predominantly consisting of loam, the temperature influences the interaction between the solid phase and liquid phase densities [14]. Temperature plays an important role in plant germination, root growth and respiration, and in the decomposition and mineralization of organic matter. It was also insightful in the weathering of cationic bases, the assimilation of nutrients, and the increase in crop yield times [15]. The spatial distribution for the mean temperature and volumetric soil moisture was noteworthy on arable land. The spatial monitoring and evaluation of EC (electric conductivity) are easiest to carry out using the method of telemetry and remote sensing of the environment. The spatial distribution of EC conducted by geostatistical analysis is very well suited for the modeling and detailed mapping of the soil [16].
The solution proposed in the article is a combination of multivariate statistical methods and a spatial model. The study of spatial properties is based on the interpolation of measuring points. Data interpolation should be performed for objects tested in multiple transects [17]. Hitherto, conventional kriging has been used to predict the content of organic matter in soil [18] and the spatial distribution of total carbon trapped in carbonate rocks [19]. The work uses geostatistical methods for the soil layer from 0 to 20 cm. Electrical conductivity showed greater recognition as high soil salinity. The salinity threshold of most cultivated vegetables is low, and salt tolerance is reduced when saltwater is used in crop irrigation techniques [20]. The latest research on a general predictive model based on the relationship between electrolyte concentration and negative clay soil particles is useful for determining the degree of soil dispersion. The study of soil salinity showed that monitoring of the top layers (0–15 and 15–30 cm) is possible with the use of GIS methods showing spatial differentiation [21].
The article presents the results of measuring soil resistance to penetration, which to some extent showed soil susceptibility to various forms of degradation. It is important from the point of view of irrigation because the hydraulic conductivity decreases due to the deterioration of the soil structure [22]. The aim of this study was to show the difference in soil water retention for small-scale and medium-size mountainous catchments.

2. Materials and Methods

2.1. Study Sites

The Smugawka (Figure 1) and Mszanka (Figure 2) creeks basins are situated in the Outer Western Carpathians and more specifically in Beskid Wyspowy mezoregion (Poland). The focus area is dominated by meadows, farmland, and forests. The dominant slopes in the region range from 10 to 20%. Four groups of soil texture were distinguished in the area of research. The farmland is made up of similar proportions of sandy clay loam and silt loam. Forest areas are dominated by loam, while clay loam appeared only on a small area of research. The bulk density throughout the both basins had a range from 1.42 to 1.72 g cm−1.

2.2. Sampling and Data Handling

Measurements of soil resistance were carried out in three repetitions at one point in arable lands and grasslands at the 0–80 cm layer and in forest soil at the 0–20 cm layer, during subsequent field visits. In total, 27 samples were obtained for each type of use. The measurements were made using an electronic penetrologist with automatic control of the penetration speed by Eijkelkamp. The soil volume density with retained structure was calculated using the cylinder method with a cylinder volume of 100 cm3. The soil mass after drying at 105 °C was determined as well as the soil volume density (ρo)—in the natural state according to the following relationship:
ρo = m/v
where: m—soil dry mass (Mg), v—volume of soil in the natural state (m3).
Soil salinity (EC), moisture and temperature samples were performed at 80 spots by means of a test probe (type-HH2 moisture measure) using the TDR method. This method allows for noninvasive, accurate, and fully automatic measurements of electrical conductivity, moisture and temperature in the soil. For the analysis of particle size, averaged samples were taken (25 samples) at each test area. Each of the test samples was taken from the top layer of the soil (0–25 cm). The collected samples were dried, and then passed through a sieve with an aperture of 2 mm at room temperature. Determination of soil texture was made using Casagrande’s aerometric method with Prószyński’s modification. Multivariate statistics, including canonical analysis (CA) and nonmetric multidimensional scaling based on Euclidean distances (n-MDS), were performed with PAST software ver. 3.12.
A completely revised version of the hydrological model SWAT+ (Soil and Water Assessment Tool) was applied to show spatial distribution of the soil water and hydrological properties. Soil resistance, electrical conductivity, volumetric moisture, hydraulic conductivity and temperature in the soil layer from 0 to 20 cm were shown. Data collected in 2014–2018 were used. The results were averaged and presented in the form of spatial distribution for the entire catchment area. SWAT+ was aimed at optimizing spatial information by selecting the right algorithms. The method used was useful in forecasting measurement points with a similar spatial distribution of the examined features and in selecting those variables with the greatest strength of connection with surface runoff. The maps were generated using the QGIS version 3.16, intended for mapping and modeling the terrain surface. In order to cope with natural disasters, such as floods and droughts, and meet the growing needs of society, it is necessary to develop water resources for irrigation and drinking water supply. SWAT+ is a hydrological model that works over a period of time. The study used data from 1991–2020 to show the results. Validation was also performed for a six-year period (2014–2018) to verify the pool response using calibrated fitted values. In addition, the performance and evaluation of the model were analyzed using statistical parameters such as the correlation coefficient, Nash−Sutcliffe efficiency and mean square deviation coefficient. Additionally, SWAT+ was used to assess the impact of climate change and anthropogenic factors on the flow of water in the aquifer and the outflow of main waters to the canal and the main river.

3. Results and Discussion

3.1. Spatial Distribution of Soil Properties

The EC of the soil in the both basin areas ranged from 10–20 mS m−1 (outside the basin area up to 80 mS m−1). The lowest value was recorded in the meadows, while the highest value of salinity appeared in the soils beneath the agricultural area. Unfavorable climatic conditions in mountainous regions, e.g., temperature inversion, which contributes to delayed vegetation in the valleys was the reason to show the spatial variability of temperature. The salt’s direction of migration depends on the amount of water contained in the soil, as well as weather and climate conditions. This was the reason for the designation of the spatial variability of electrical conductivity (EC; salinity), EC was selected for spatial analysis because salt reduces the number of nutrients and temperature, which inhibits the growth of plant roots. The EC level was compared between agricultural areas (average 14.54 mS/m for Smugawka catchment) and forested areas (average 1.64 mS/m for Smugawka catchment) in the basin of the mountain.
Statistical analysis showed that throughout the study area, the estimated salinity of the basin prevailed at the level of 6 mS m−1. In general, agricultural soils were characterized by the highest rate of salinity. The calculations were performed for the basin area equal to 7.75 km2 and 54.5 km2 for the range of autocorrelation determined using the exponential semivariogram of 2.5 km. The mean values of the soil temperature ranged from 14.38 °C to 17.36 °C for Smugawka catchment (Table 1). The average temperature value comes out at 15.84 °C for the Mszanka catchment (Table 2). An estimate of the temperature for the entire area made using the multivariate statistics showed that the most likely temperature of the soil, which is to be expected throughout the basin area is 16.5 °C.

3.2. Impact of Soil Properties on Land Use

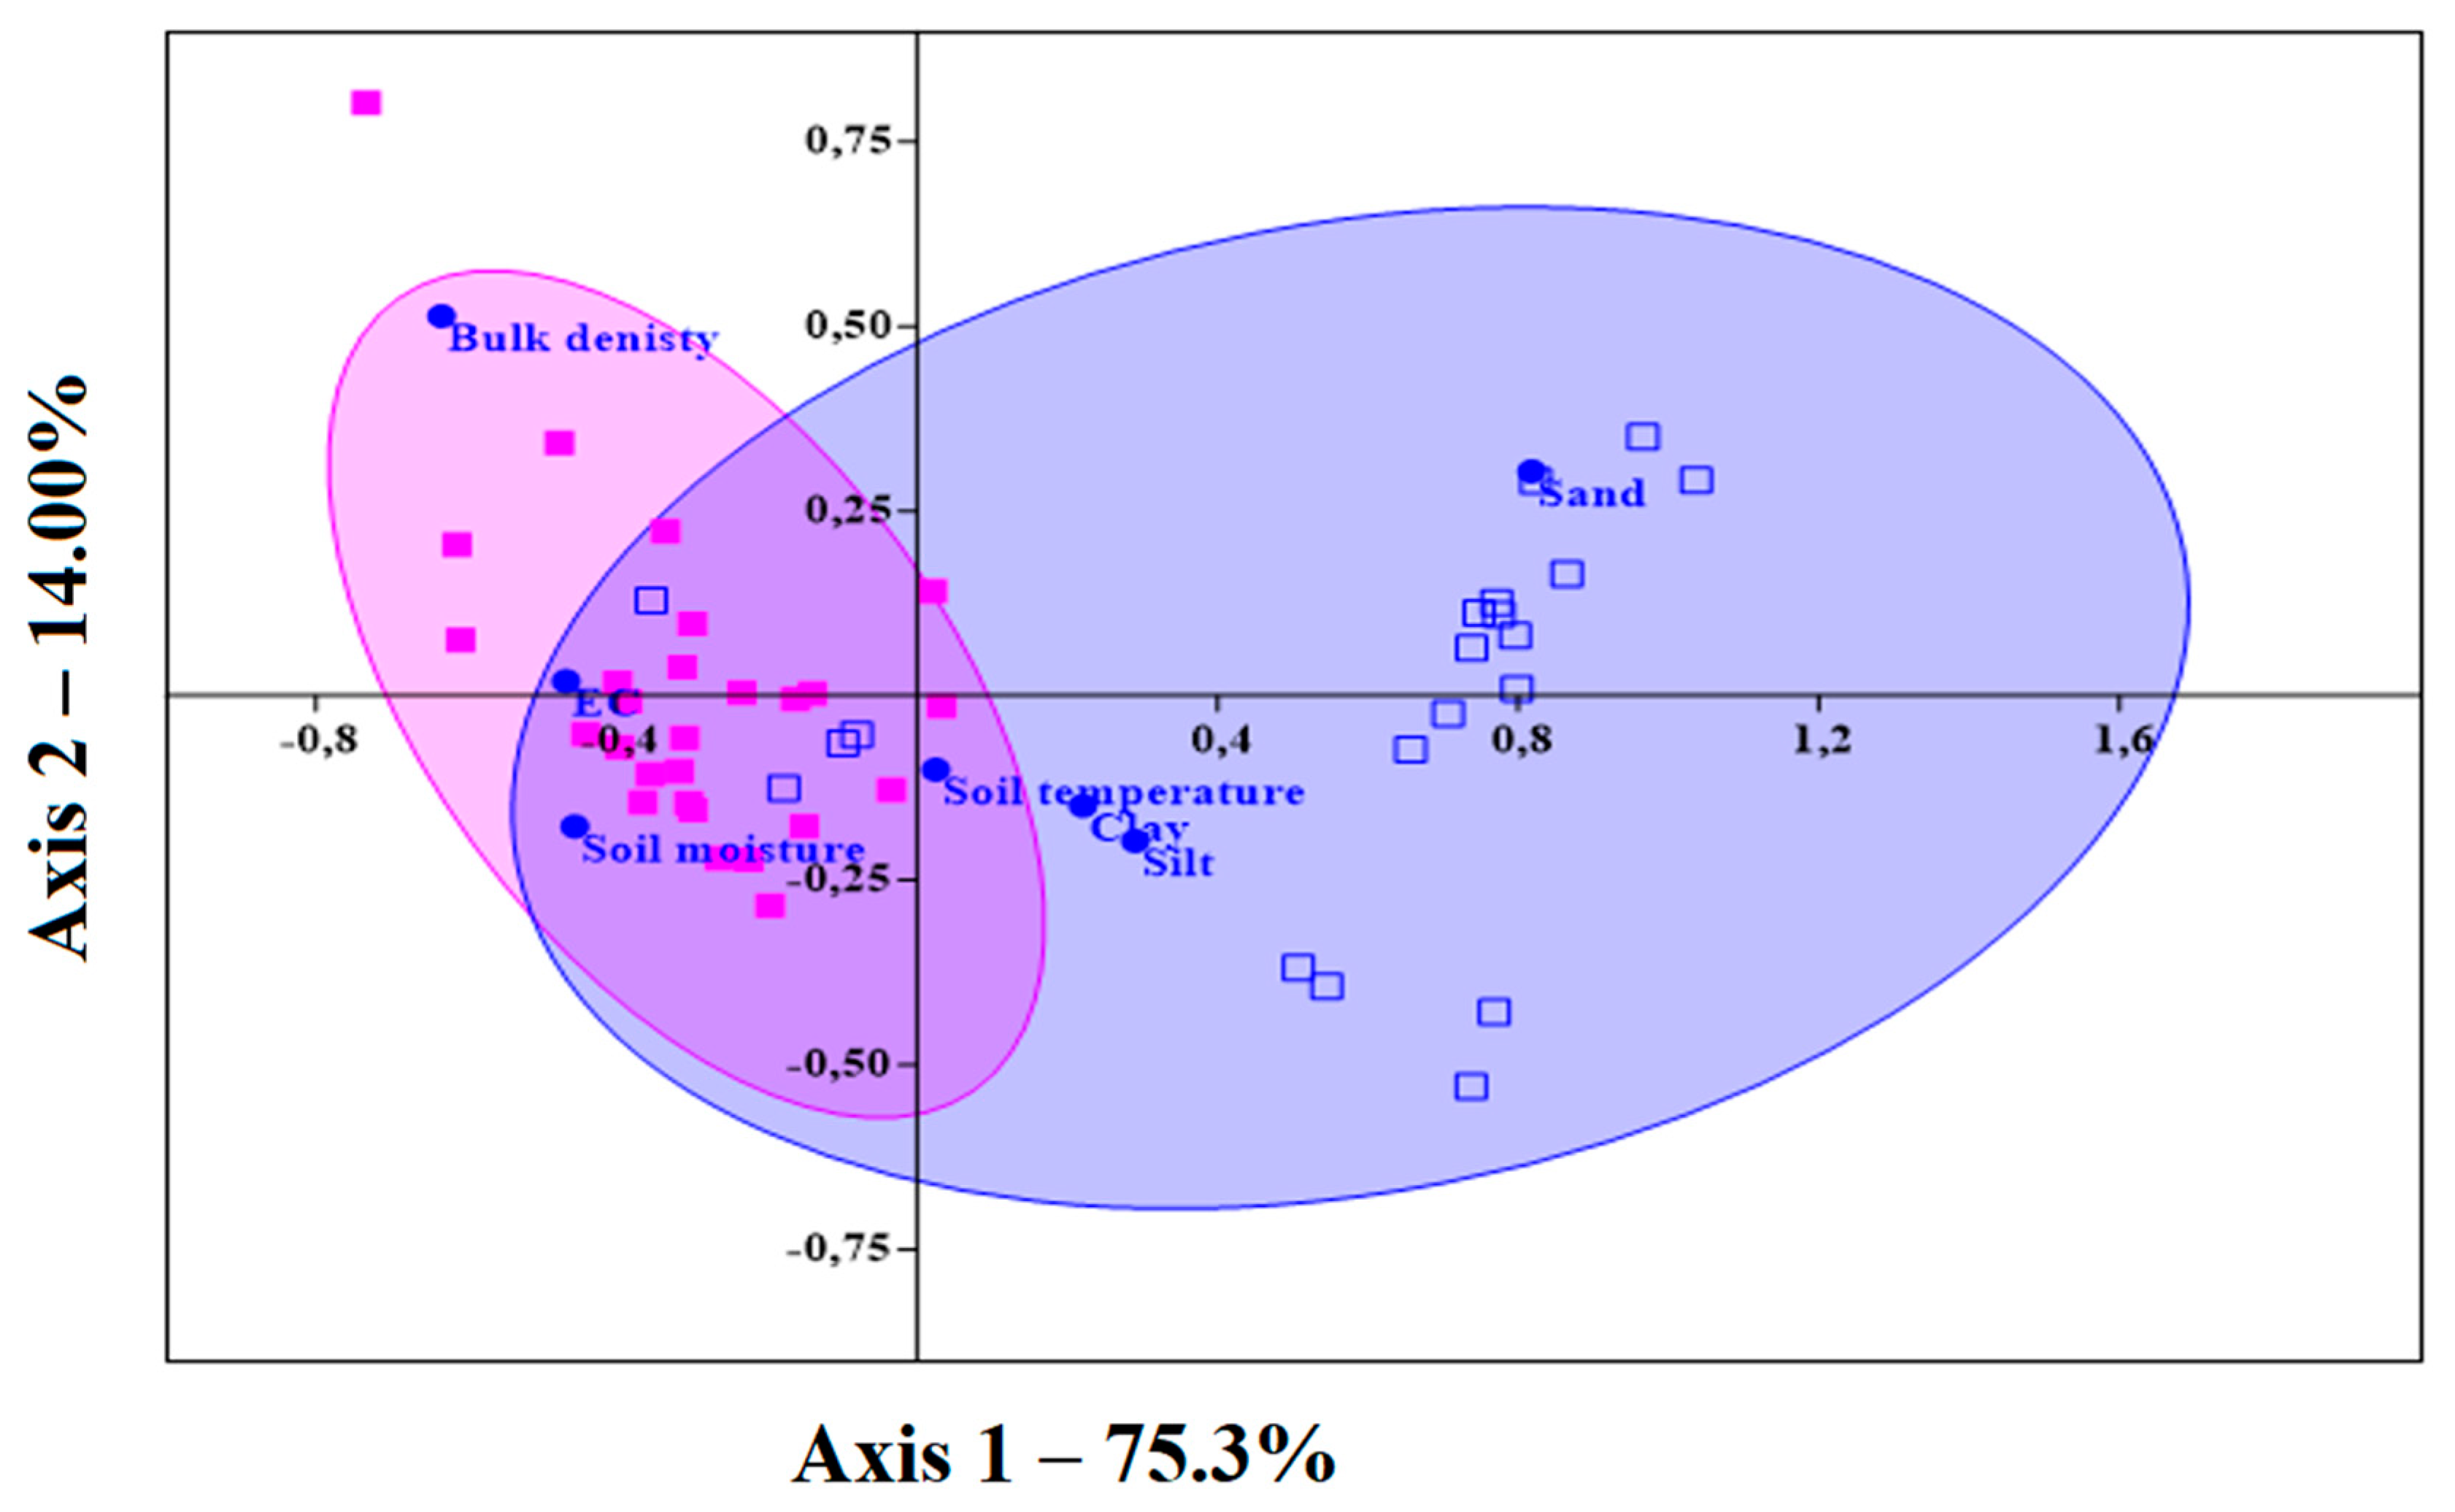
A selection of parameters descriptive of the soils which are related to both agricultural lands and forests was made by correspondence analysis (CA). Soil moisture demonstrated the closest relationship with salinity (EC). Soil temperature correlated positively with axis 1 and negatively with axis 2. Clay and particulate matter in the soils had the greatest impact on the soil temperature. Soil moisture correlated negatively in both the agricultural land and the forests (Figure 3). It should be clarified which factors most determine the outcome and make the choice of soil parameters, and which have the lowest forecast error in determining the moisture.
The total variance for the two axes was close to 89.5%. In order to determine the gradation of the effect of all studied factors on the distribution of moisture in the basin area, multivariate statistics were used. Correspondence analysis (CA) allows for the specification of which parameters affect the size of the test characteristics to the greatest extent, identify, and prioritize the order of the factors, from those with the greatest impact to those with the least. In the case of the basin, land use had the least impact on the amount of soil moisture. Then came bulk density. The parameters with the greatest impact on soil moisture proved to be soil texture, temperature, and EC. The examined soil parameters for meadows and forests were positively correlated for both catchments. The soil data collected for the agricultural areas were negatively correlated. The best type of correspondence to describe the basins proved to be the squares representing sets of points related to forests (Figure 4).
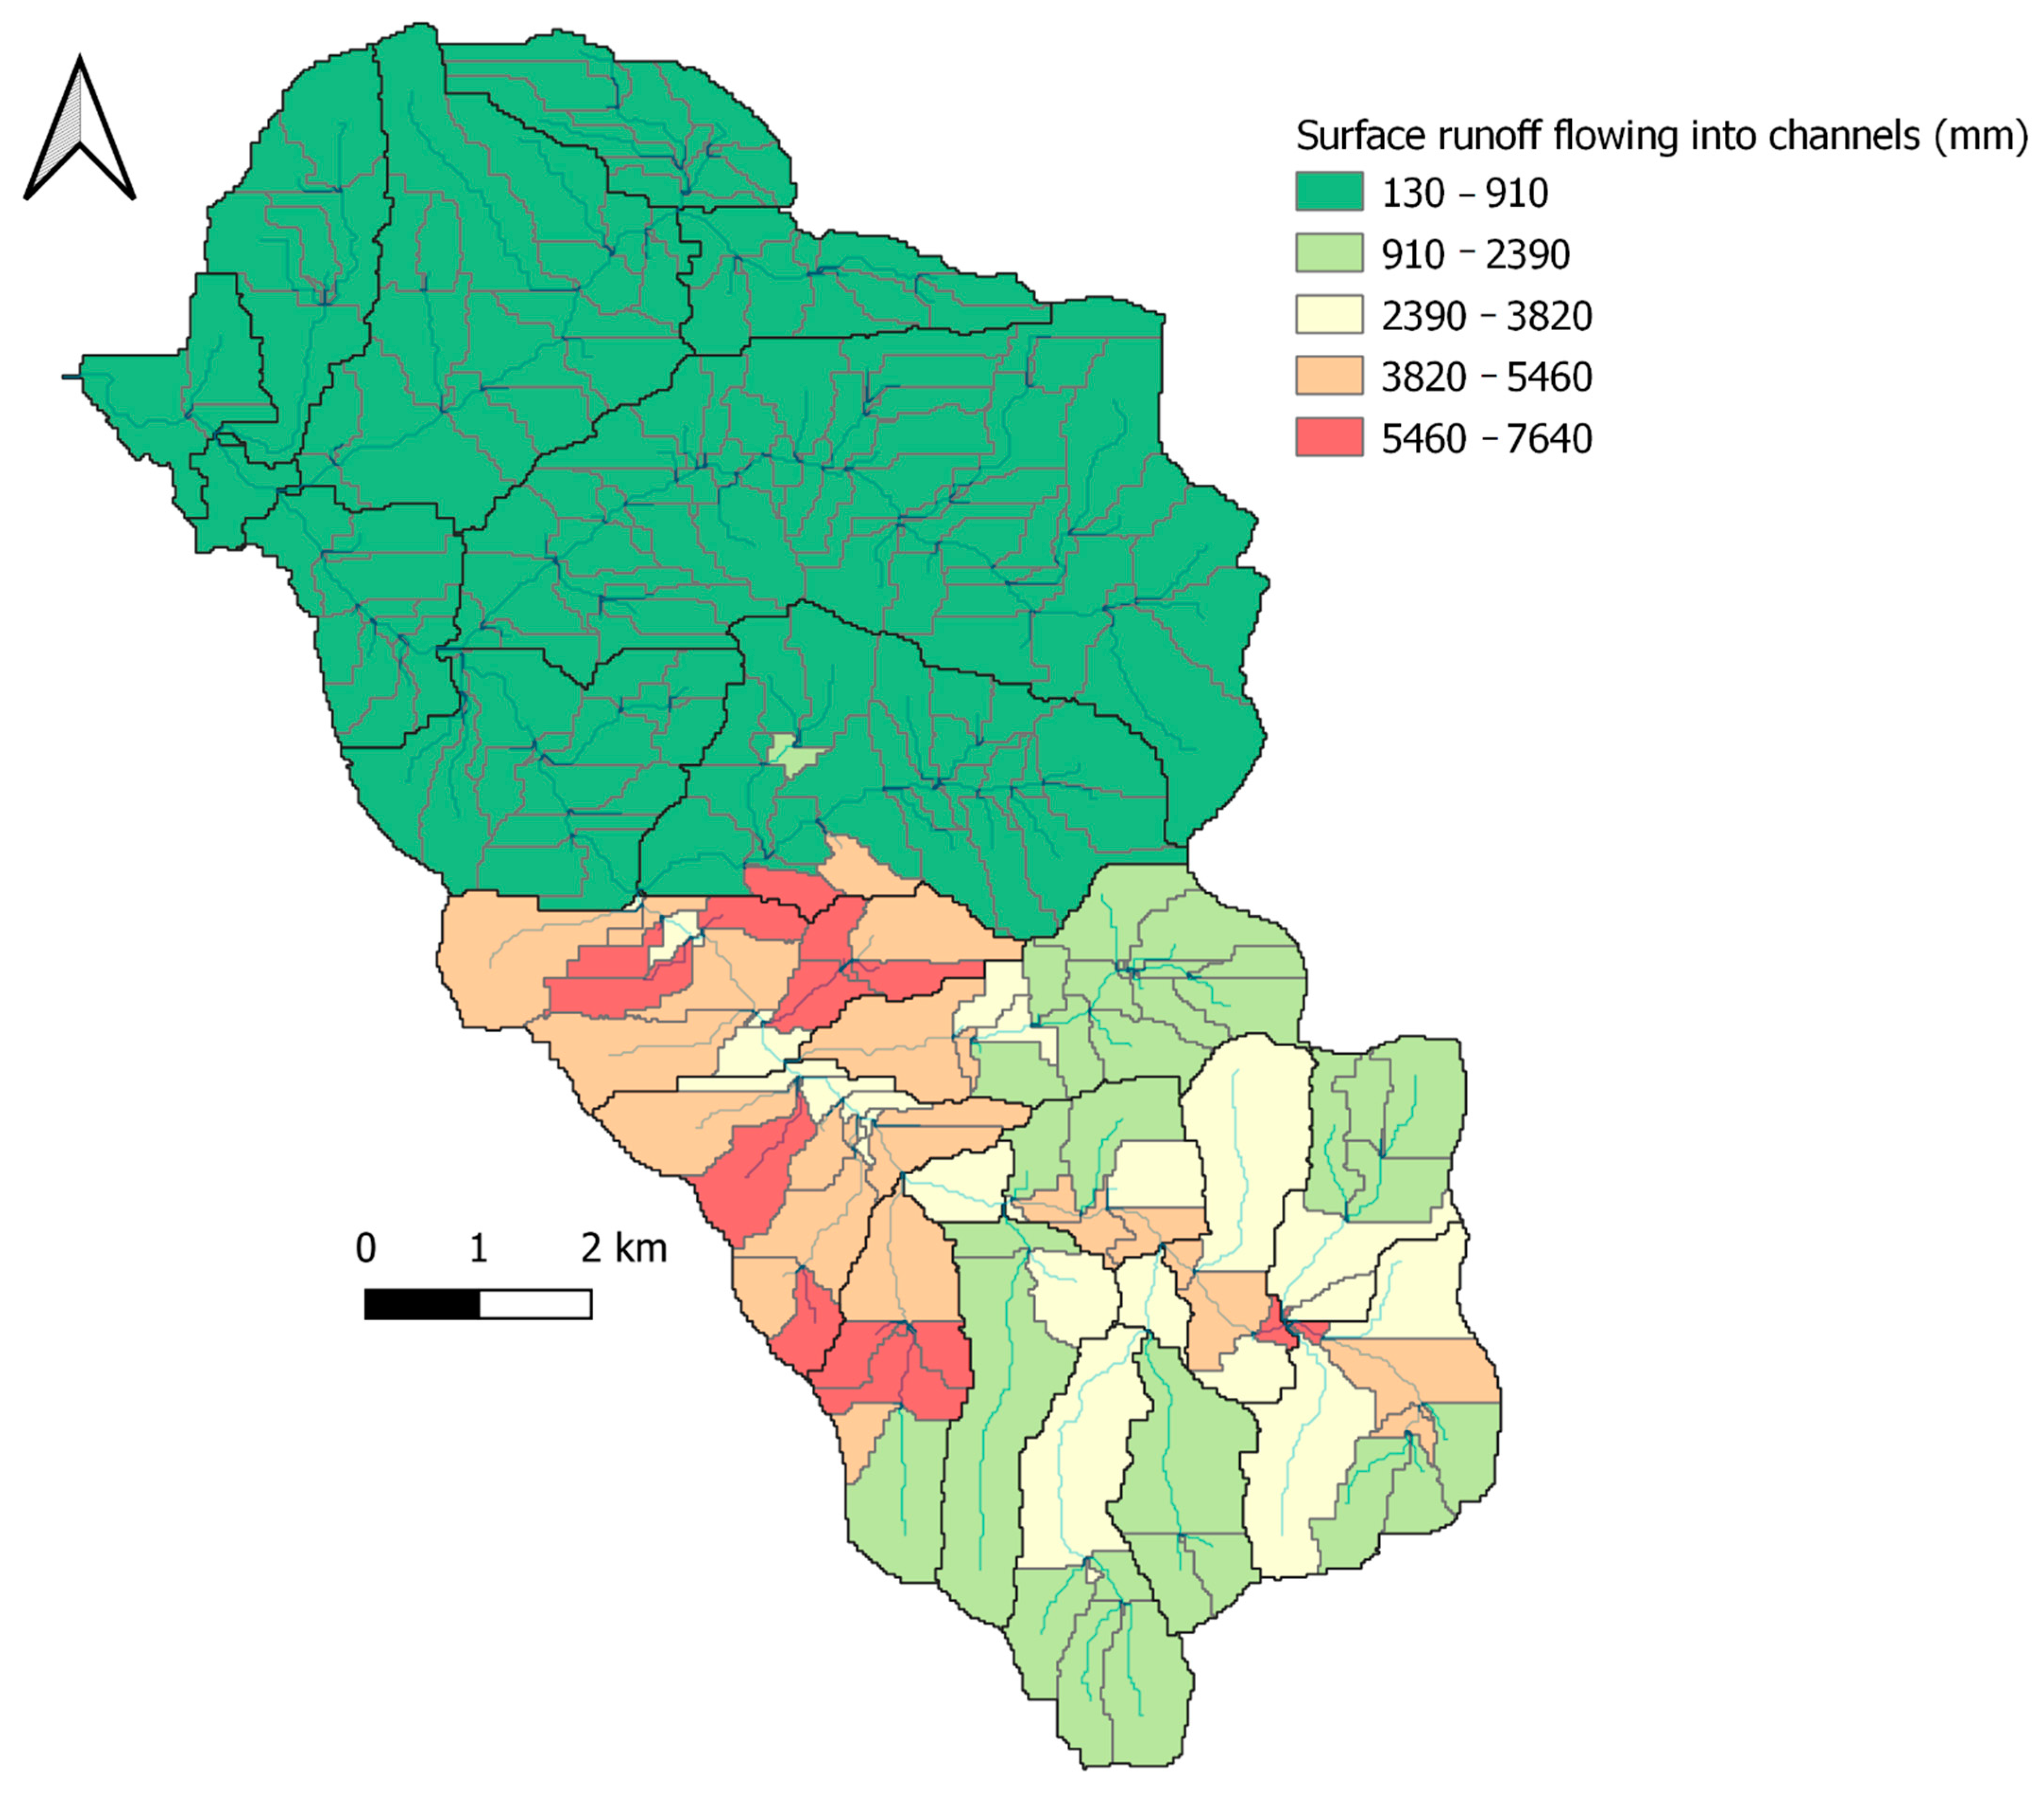
The 1991–2020 simulation showed that the runoff of surface waters is very heterogeneous (Figure 5). This study synthesizes the methods for estimating water movement and storage measured in a set of forested agricultural areas. Moreover, the highest annual surface runoff in the Mszanka catchment was on average from 5460 mm to 7640 mm (Figure 6). Problems are often found with parameter estimation of different space−time scales. Finally, the visual inspection of the water level response to water scarcity greatly promoted the hydrological model in this research.
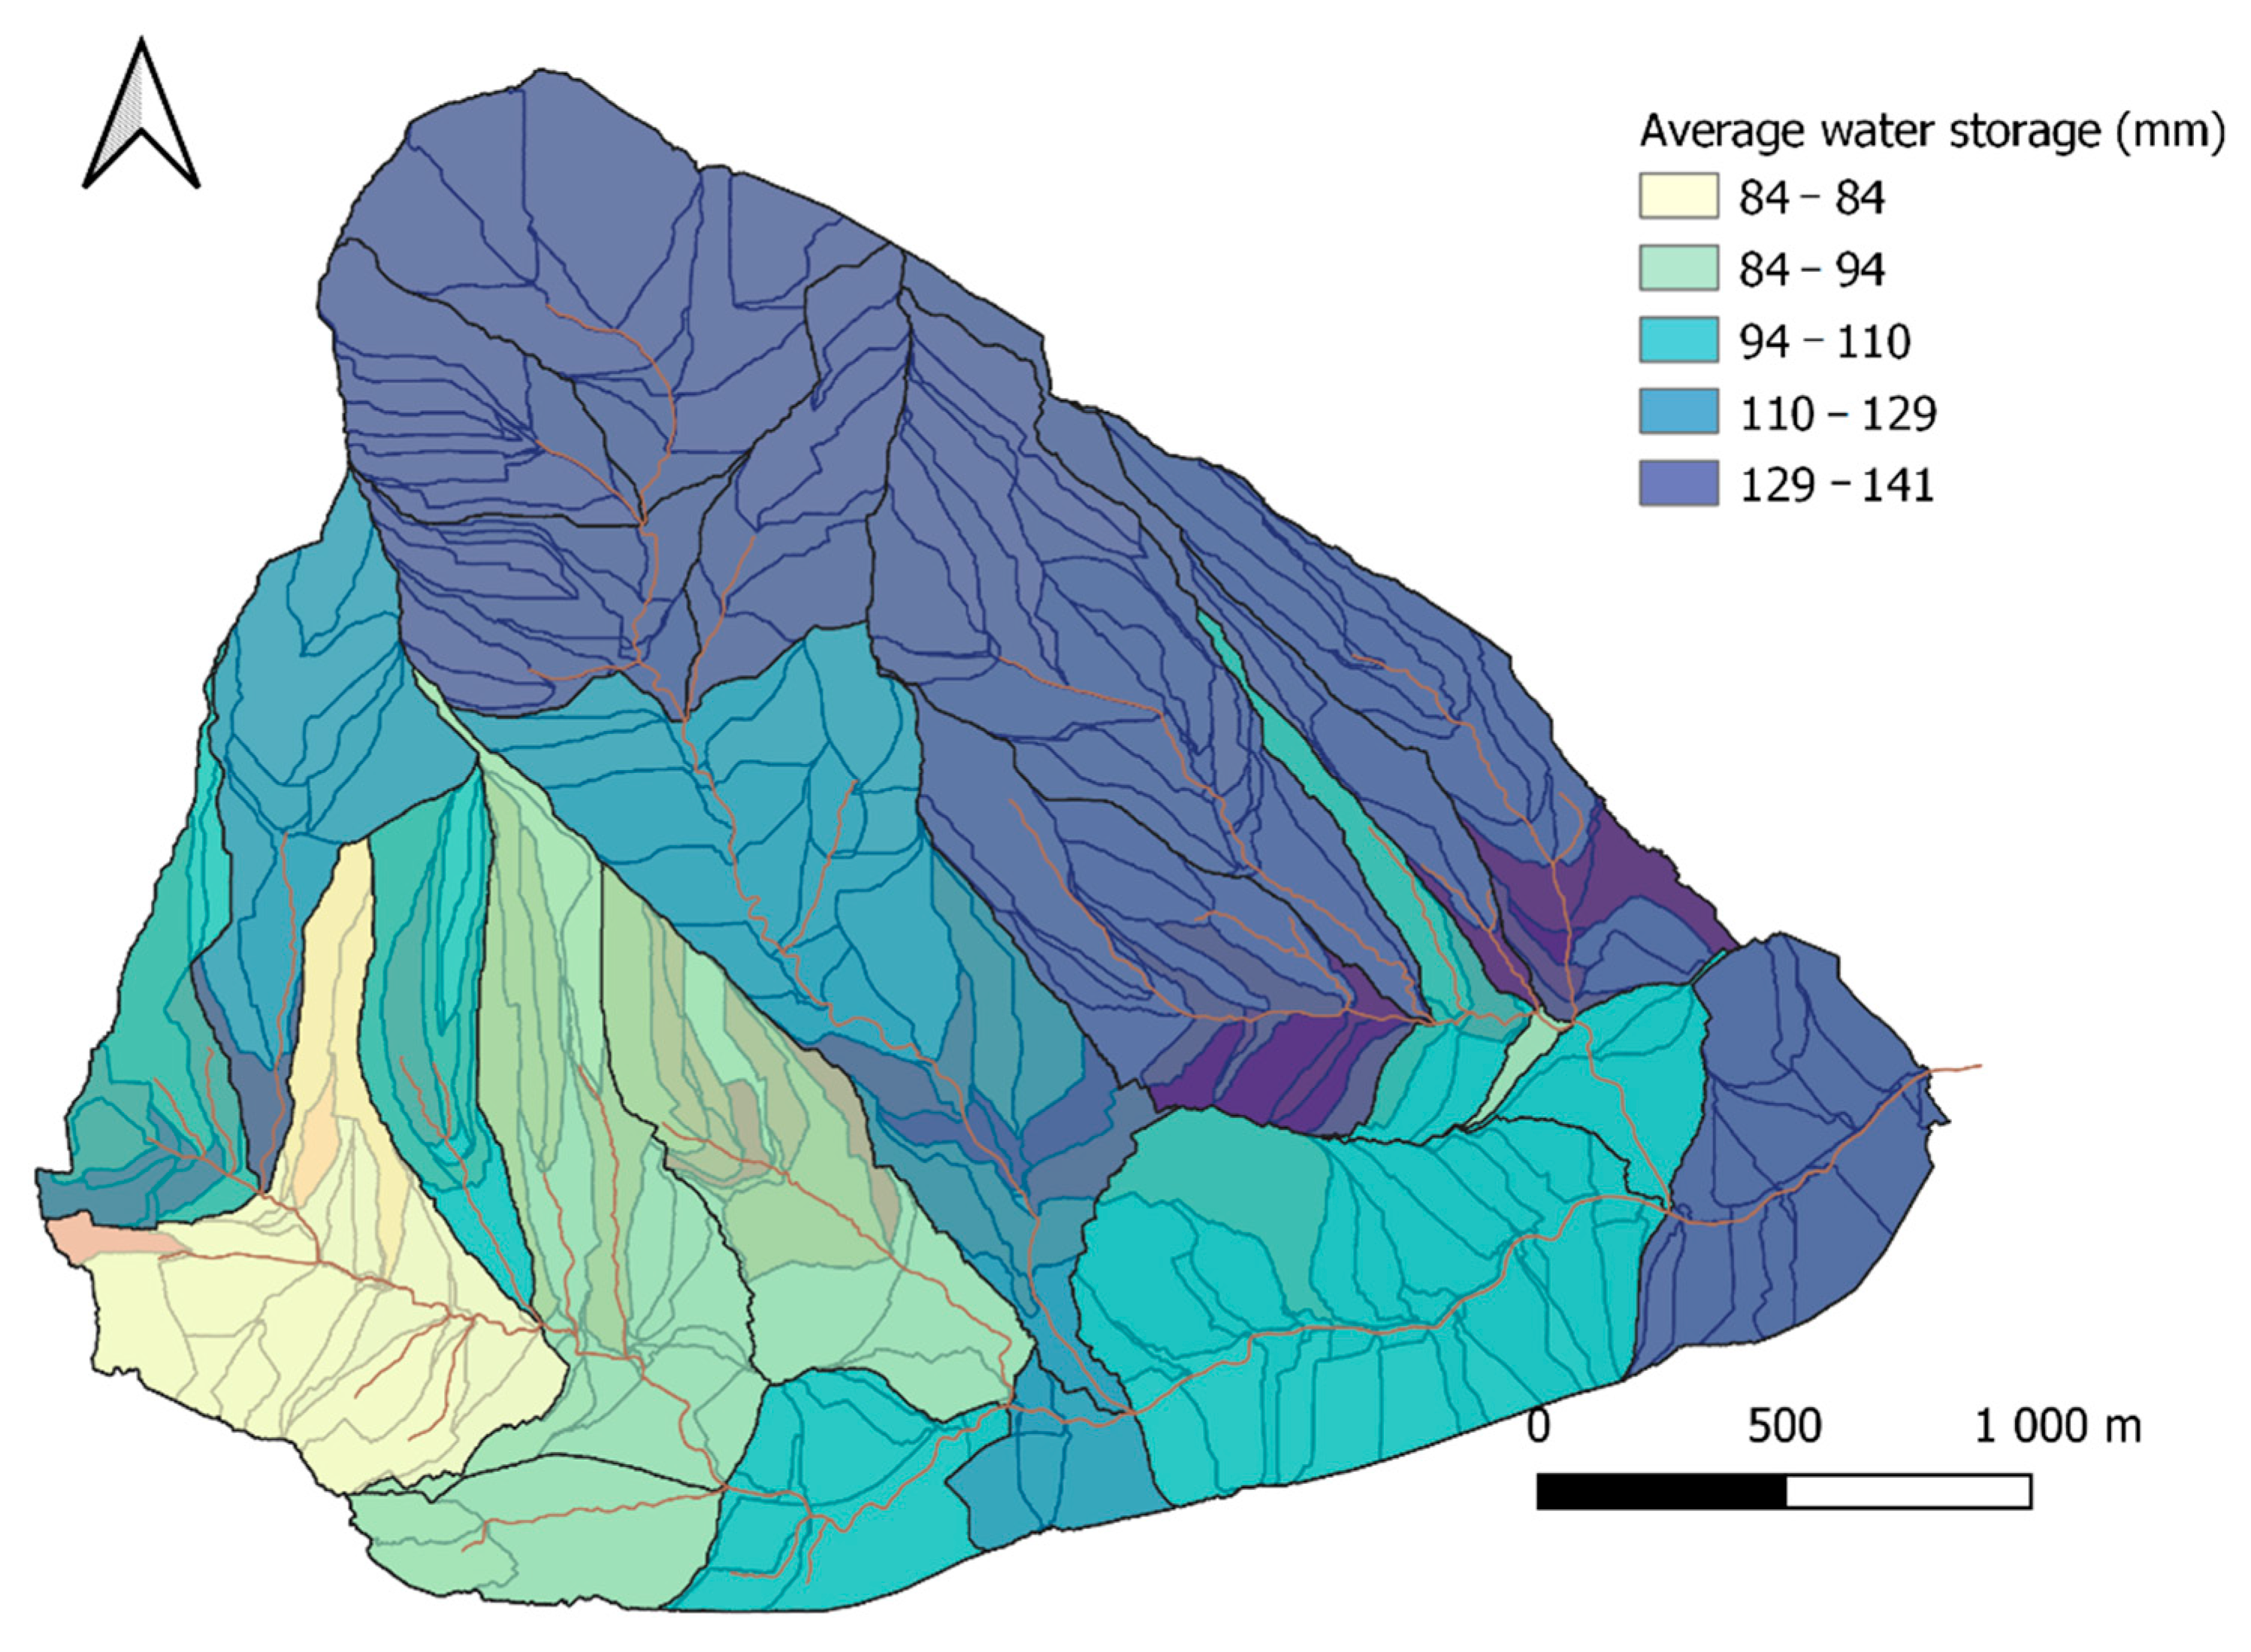
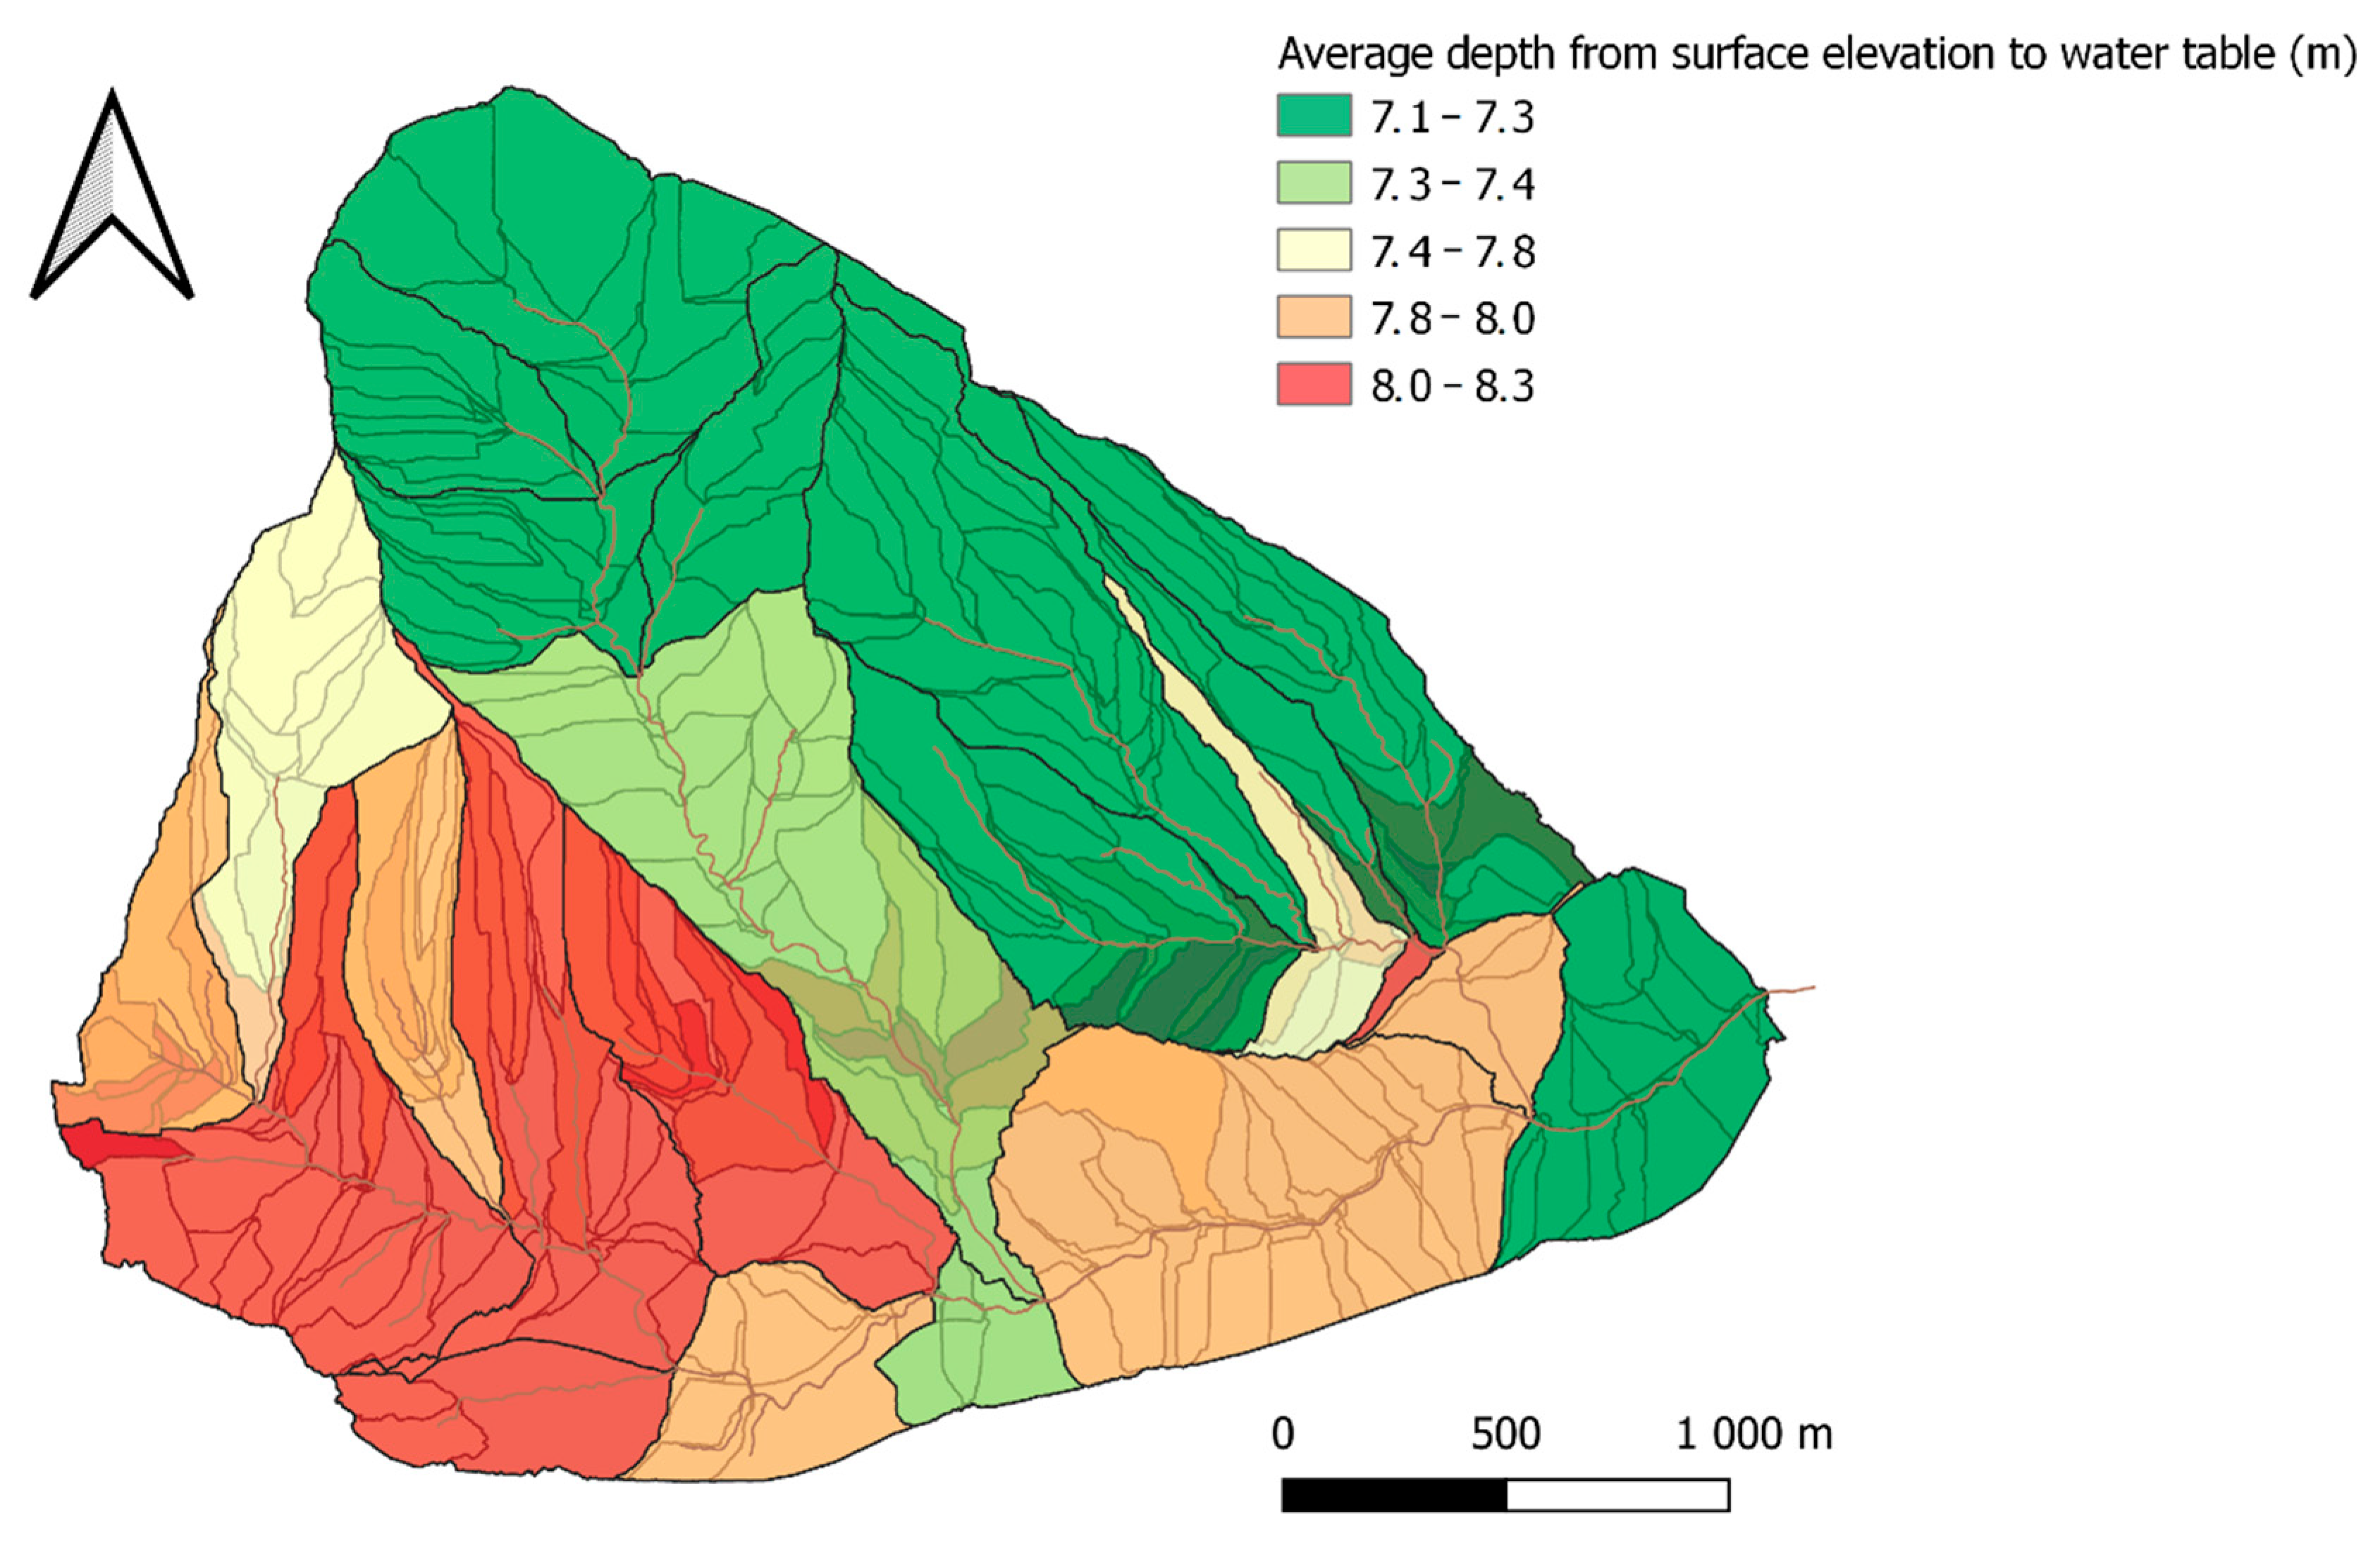
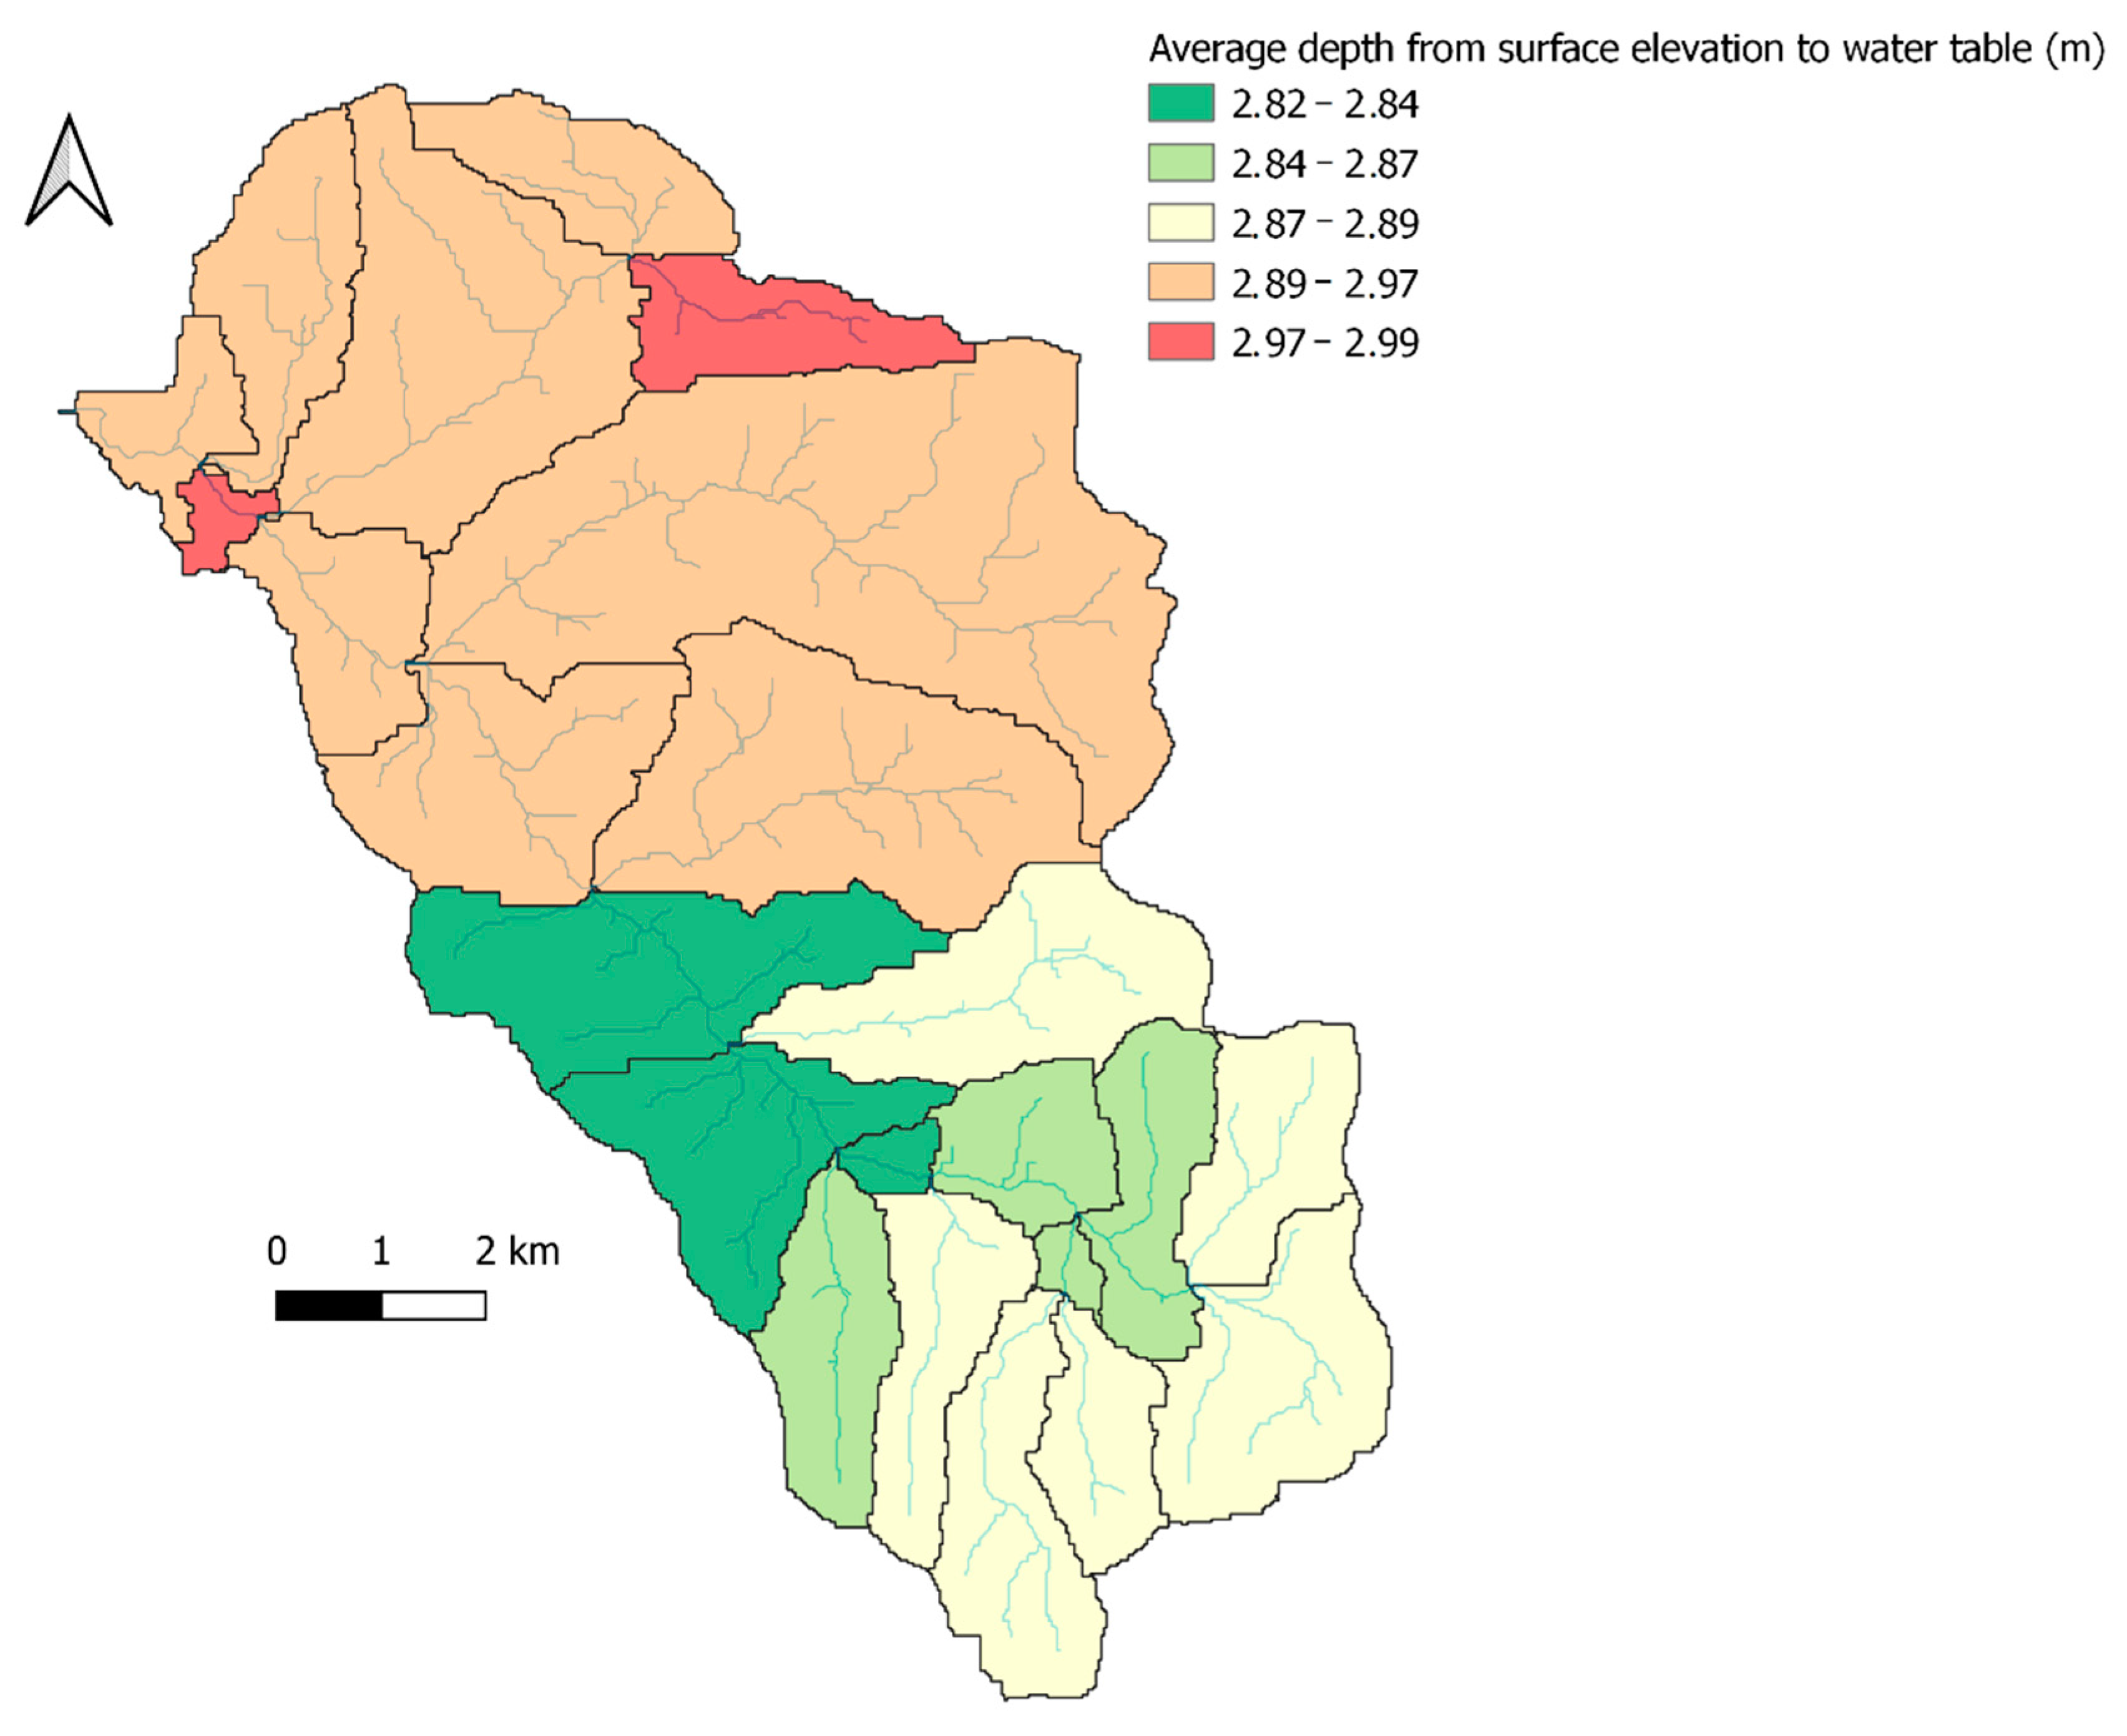
The research revealed that the level of the Smugawka aquifer accumulated rainwater in the range from 84 to 141 mm (Figure 7), and the level of aquifer of the Mszanka catchment area was from 348.6 to 357.1 mm (Figure 8). The average distance from the water table for Smugawka was 7.1–8.3 m (Figure 9). For the Mszanka catchment, the water table depth was at 2.82–2.99 m (Figure 10).
The results clearly showed that the larger catchment area is characterized by useful hydrological parameters for soil water retention. In order to compare the type of soil use on the selected parameters of soil, nonmetric multidimensional scaling based on Euclidean distances were used. The analysis showed that the parameters of forest soil were similar for both grassland and agricultural land. However, meadows were more closely tied to forests, as evidenced by the positive correlation between the measured parameters of the soil (Figure 3). It can therefore be concluded that the assessment of the quality of soil for meadows and forests will be similar because they display similar properties. For agricultural land, other factors, environmental variables, and parameters in the assessment of soil should be considered as well.
For all the presented geostatistical methods, a representative sample selection is required, especially for the runoff trends analysis and future projections of hydrological patterns in small forested catchments [23], mathematical modeling [24], land use [25], spatiotemporal prediction of root zone soil moisture [26], the spatial distribution of the measured features [27,28,29], yield measure [30], integrated monitoring system of water quality [31], agricultural water management [32,33], and an appropriate interpretation of spatial statistics [34].

4. Conclusions

Multivariate analysis can be used to identify factors affecting the amount of land use. Soil parameters such as EC, temperature, moisture, bulk density, and soil texture are suitable for the evaluation of soil quality for land use. Both EC and soil temperature are important parameters that significantly affect the soil moisture, yield, and productivity of soils. By analyzing the level of EC of the soil in the studied basins, it was found that the smallest salinity content was present in the forest, and the largest in the agriculture areas. This can affect the formation of significant differences between forest areas, which in turn creates the need for additional agronomic work in the areas around the basin located near the forest. The differences between the factors affecting land use become apparent from the water analyzed in the soil. Our study applies a methodology for the soil water examination that provides useful information for water resource assessment at catchment scale. In order to demonstrate the productive suitability of the soils, and to improve water accessibility that is important for agriculture, a lot of research should be done in these areas to obtain the data on the variation in the soil properties.

Author Contributions

Conceptualization, W.H.; data curation, W.H. and S.Ł.; investigation, W.H.; methodology, W.H.; project administration, W.H.; writing—original draft, W.H. All authors have read and agreed to the published version of the manuscript.

Funding

This research was funded by the Ministry of Science and Higher Education in Poland.

Institutional Review Board Statement

Not applicable.

Informed Consent Statement

Not applicable.

Data Availability Statement

Not applicable.

Conflicts of Interest

The authors declare no conflict of interest. The funders had no role in the design of the study; in the collection, analyses, or interpretation of data; in the writing of the manuscript, or in the decision to publish the results.

References

  1. Myers, D.E. Basic Linear Geostatistics. Book Reviews. Technometrics 2000, 42, 4. [Google Scholar] [CrossRef]
  2. Yetik, M.K.; Yuceer, M.; Karadurmus, E.; Semizer, E.; Calimli, A.; Berber, R. An Interactive GIS-based Software for Dynamic Monitoring of Rivers. J. Environ. Prot. Ecol. 2014, 15, 1767–1778. [Google Scholar]
  3. Stanescu, E.; Lucaciu, I.; Niculescu, M.; Vosniakos, F.; Stanescu, B. Assessment of the abiotic components of the Danube river and main tributaries form southern part of Romania. J. Environ. Prot. Ecol. 2015, 16, 1371–1379. [Google Scholar]
  4. Feng, Y.; Astin, I. Remote Sensing of Soil Moisture Using the Propagation of Loran-C Navigation Signals. IEEE Geosci. Remote Sens. Lett. 2015, 12, 195–198. [Google Scholar] [CrossRef] [Green Version]
  5. Radu, V.M.; Ionescu, P.; Deak, G.Y.; Ivanov, A.A.; Diacu, E. Multivariate Statistical Analysis for Quality Assesment of Aquatic Ecosystem on the Lower Danube. J. Environ. Prot. Ecol. 2014, 15, 412–424. [Google Scholar]
  6. Nadler, A. Methodologies and the Practical Aspects of the Bulk Soil EC (σa)—Soil Solution EC (σw) Relations. Adv. Agron. 2005, 88, 273–312. [Google Scholar]
  7. Ding, J.; Yu, D. Monitoring and evaluating spatial variability of soil salinity in dry and wet seasons in the Werigan–Kuqa Oasis; China; using remote sensing and electromagnetic induction instruments. Geoderma 2014, 235–236, 316–322. [Google Scholar] [CrossRef]
  8. Wichem, J.; Wichem, F.; Joergensen, R.G. Impact of salinity on soil microbial communities and the decomposition of maize in acidic soils. Geoderma 2006, 137, 100–108. [Google Scholar]
  9. Beyer, W. Zur Bestimmung der Wasserdurchlassigkeit von Kieson und Sanduen aus derKornverteilung. Wasserwirtsch. Wassertech. 1964, 14, 165–169. [Google Scholar]
  10. Rosas, J.; Lopez, O.; Missimer, T.M.; Coulibaly, K.M.; Dehwah, A.H.; Sesler, K.; Lujan, L.R.; Mantilla, D. Determination of hydraulic conductivity from grain-size distribution for different depositional environments. Ground Water 2014, 52, 399–413. [Google Scholar] [CrossRef]
  11. Basha, G.; Ouardat, B.M.J.; Marpu, P.R. Long-term projections of temperature, precipitation and soil moisture using non-stationary oscillation processes over the UAE region. Int. J. Climatol. 2015, 35, 4606–4618. [Google Scholar] [CrossRef]
  12. Reti, K.-O.; Malos, C.V.; Maniciula, I.D. Risk assessment Hydrological Risk Study in the Damuc Village; the Neamt County. J. Environ. Prot. Ecol. 2014, 15, 142. [Google Scholar]
  13. Yoshioka, M.; Takakura, S.; Ishizawa, T.; Sakai, N. Temporal changes of soil temperature with soil water content in an embankment slope during controlled artificial rainfall experiments. J. Appl. Geophys. 2015, 114, 134–145. [Google Scholar] [CrossRef]
  14. Gao, H.; Shao, M. Effects of temperature changes on soil hydraulic properties. Soil Till Res. 2015, 153, 145–154. [Google Scholar] [CrossRef]
  15. Barman, D.; Kundu, D.K.; Chakraborty, A.K.; Saha, A.R.; Ghorai, A.K.; Susanto, P.; Soumen, P. Prediction of soil temperature from air temperature for jute growing alluvial soils of Indo-Gangetic Plain. In Conference: National Seminar on “Resource Based Includive Agriculture & Rural Development: Opportunities & Challenges”; IRDM Faculty Centre, Ramakrishna Mission Vivekananda University: Kolkata, India, 2016. [Google Scholar]
  16. Li, H.Y.; Marchant, B.P.; Webster, R. Modelling the electrical conductivity of soil in the Yangtze delta in three dimensions. Geoderma 2016, 269, 119–125. [Google Scholar] [CrossRef] [Green Version]
  17. Daia, F.; Zhoua, Q.; Lva, Z.; Wang, X.; Liub, G. Spatial prediction of soil organic matter content integrating artificial neural network and ordinary kriging in Tibetan Plateau. Ecol Indic. 2014, 45, 184–194. [Google Scholar] [CrossRef]
  18. Saito, H.; McKenna, A.S.; Zimmerman, A.D.; Coburn, C.T. Geostatistical interpolation of object counts collected from multiple strip transects: Ordinary kriging versus finite domain kriging. Stoch. Env. Res. Risk. A 2005, 19, 71–85. [Google Scholar] [CrossRef]
  19. Prado-Péreza, A.J.; Aracil, E.L.; del Villard, P. A combined methodology using electrical resistivity tomography; ordinary kriging and porosimetry for quantifying total C trapped in carbonate formations associated with natural analogues for CO2 leakage. J. Appl. Geophys. 2014, 105, 21–33. [Google Scholar] [CrossRef]
  20. Machado, R.M.A.; Serralheiro, R.P. Soil salinity: Effect on vegetable crop growth. Management practices to prevent and mitigate soil salinization. Horticulturae 2017, 3, 30. [Google Scholar] [CrossRef]
  21. Narjary, B.; Meena, M.D.; Kumar, S.; Kamra, S.K.; Sharma, D.K.; Triantafilis, J. Digital mapping of soil salinity at various depths using an EM38. Soil Use Manag. 2019, 35, 232–244. [Google Scholar] [CrossRef]
  22. Bennett, J.M.; Marchuk, A.; Marchuk, S.; Raine, S.R. Towards predicting the soil-specific threshold electrolyte concentration of soil as a reduction in saturated hydraulic conductivity: The role of clay net negative charge. Geoderma 2019, 337, 122–131. [Google Scholar] [CrossRef]
  23. Lamačová, A.; Hruška, J.; Krám, P.; Stuchlík, E.; Farda, A.; Chuman, T.; Fottová, D. Runoff trends analysis and future projections of hydrological patterns in small forested catchments. Soil Water Res. 2014, 9, 169–181. [Google Scholar] [CrossRef] [Green Version]
  24. Sadeghi, M.; Jones, S.B.; Philpot, D.W. A Linear Physically-Based Model for Remote Sensing of Soil Moisture using Short Wave Infrared Bands. Remote Sens. Environ. 2015, 164, 66–76. [Google Scholar] [CrossRef]
  25. Jiang, Y.; Fu, P.; Weng, Q. Assessing the Impacts of Urbanization-Associated Land Use/Cover Change on Land Surface Temperature and Surface Moisture: A Case Study in the Midwestern United States. Remote Sens. 2015, 7, 4880–4898. [Google Scholar] [CrossRef] [Green Version]
  26. Zaman, B. Spatio-Temporal Prediction of Root Zone Soil Moisture Using Multivariate Relevance Vector Machines. Open J. Mod. Hydrol. 2014, 4, 80–90. [Google Scholar] [CrossRef] [Green Version]
  27. Ghosh, S.; Bell, M.D.; Clark, S.J.; Gelfand, E.A.; Flikkema, G.P. Process modeling for soil moisture using sensor network data. Stat. Methodol. 2014, 17, 99–112. [Google Scholar] [CrossRef]
  28. Hirschi, M.; Mueller, B.; Dorigo, W.; Seneviratne, S.I. Using remotely sensed soil moisture for land–atmosphere coupling diagnostics: The role of surface vs. root-zone soil moisture variability. Remote Sens. Environ. 2014, 154, 246–252. [Google Scholar] [CrossRef] [Green Version]
  29. Nicolai-Shaw, N.; Hirschi, M.; Mittelbach, H.; Seneviratne, S. Spatial representativeness of soil moisture using in situ; remote sensing; and land reanalysis data. J. Geophys. Res. Atmos. 2015, 120, 9955–9964. [Google Scholar] [CrossRef]
  30. Braunack, M.V.; Johnston, D.B.; Price, J.; Gauthier, E. Soil temperature and soil water potential under thin oxodegradable plastic film impact on cotton crop establishment and yield. Field Crops Res. 2015, 184, 91–103. [Google Scholar] [CrossRef]
  31. Petrescu, V.; Darvas, A.; Darvas, J. Integrated Monitoring System of Water Quality Transported by the Upper Olt River (County Harghita) Case Study—Downstream of the Miercurea Ciuc Town. J. Environ. Prot. Ecol. 2012, 13, 1300. [Google Scholar]
  32. Gergeleya, I.; Opreab, L.; Sion, C. Some Aspects Regarding the Ecological Monitoring of Aquatic Systems in the Crisul Negru River Basin. J. Environ. Prot. Ecol. 2011, 12, 851–860. [Google Scholar]
  33. Gao, X.; Wu, P.; Zhao, X.; Wang, J.; Shi, Y. Effects of Land Use on Soil moisture. Variations in a Semi-arid Catchment: Implications for Land and Agricultural Water Management. Land Degrad. Dev. 2014, 25, 163–172. [Google Scholar] [CrossRef]
  34. Wang, J.-F.; Stein, A.; Gao, B.-B.; Ge, Y. A review of spatial sampling. Spat. Stat. 2012, 2, 1–14. [Google Scholar] [CrossRef]
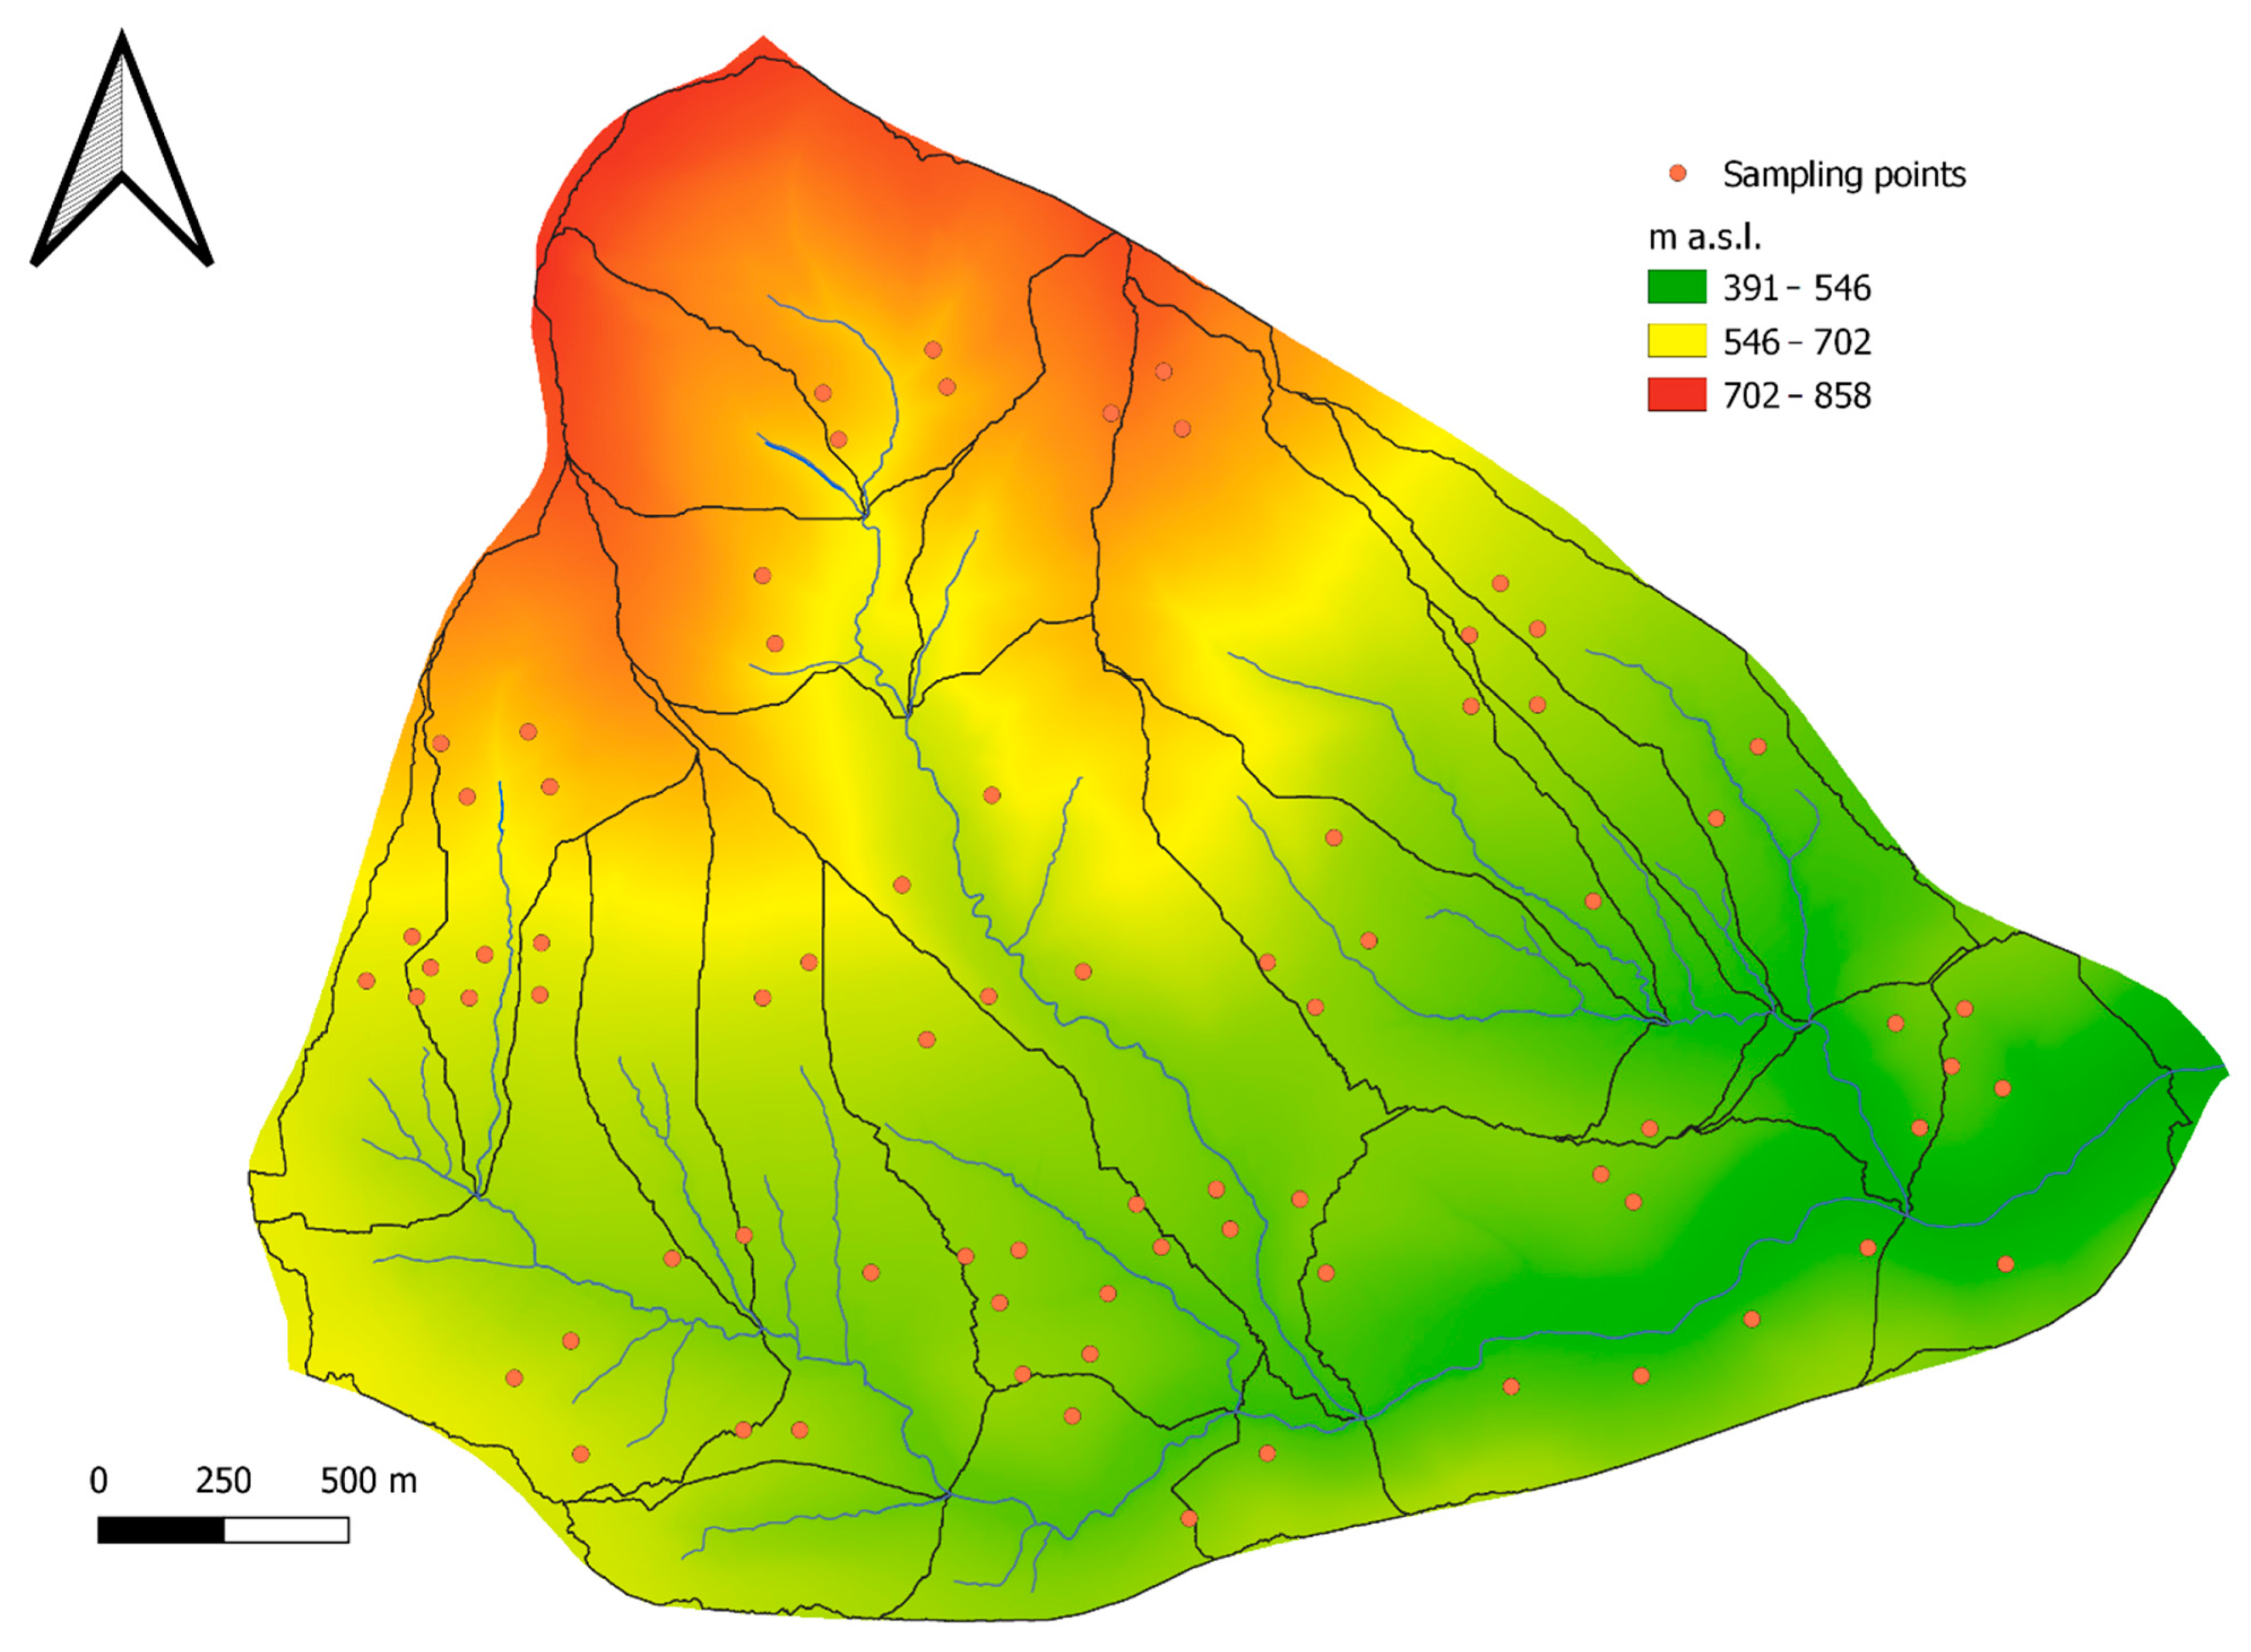
Figure 1. Location of sampling in Smugawka catchment.
Earth 02 00031 g001
Figure 2. Location of sampling in Mszanka catchment.
Earth 02 00031 g002
Figure 3. Correspondence analysis (CA). Painted squares show data set for agricultural land, open squares represent sets of points related to forests. Ellipses indicate the 95% confidence level for all factors.
Earth 02 00031 g003
Figure 4. Nonmetric multidimensional scaling based on Euclidean distances was used (the n–MDS) for land use structure. Painted squares represent data set for agricultural land, open squares represent sets of points related to forests and diamonds are the designation for the meadows (stress = 0.23).
Earth 02 00031 g004
Figure 5. Surface runoff for Smugawka catchment in simulation period 1991–2020.
Earth 02 00031 g005
Figure 6. Surface runoff for Mszanka catchment in simulation period 1991–2020.
Earth 02 00031 g006
Figure 7. Level of water storage in aquifer for Smugawka catchment.
Earth 02 00031 g007
Figure 8. Level of aquifer water storage for Mszanka catchment.
Earth 02 00031 g008
Figure 9. Distance from surface to water table for Smugawka catchment.
Earth 02 00031 g009
Figure 10. Distance from surface to water table for Mszanka catchment.
Earth 02 00031 g010
Table 1. Average values of selected parameters in the soil at the layer 0–20 cm for the Smugawka catchment.
Land UseSoil TextureBulk DensityECTemperatureSoil MoistureSoil Resistance
Agriculture area g·cm−3mS/m−1°C %MPa
Silt loam1.2218.8714.38342.42
Loam1.3212.2621.36244.02
MeadowSilty clay loam1.567.5718.32291.43
Clay loam1.456.9514.23321.07
ForestSilt 1.241.8712.93350.64
Silt loam1.420.8711.53370.31
Table 2. Average values of selected parameters in the soil at the layer 0–20 cm for the Mszanka catchment.
Land UseSoil TextureBulk DensityECTemperatureSoil MoistureSoil Resistance
Agriculture area g·cm−3mS/m−1°C %MPa
Clay loam1.3415.0316.32253.43
Silty clay loam1.4821.9414.35294.26
MeadowLoam1.5617.9416.14252.32
Loamy silt1.728.9818.03302.46
ForestSilt1.452.5414.93391.32
Silt loam1.231.8512.06360.43
Publisher’s Note: MDPI stays neutral with regard to jurisdictional claims in published maps and institutional affiliations.