Article

Role of Agricultural Terraces in Flood and Soil Erosion Risks Control in the High Atlas Mountains of Morocco

1
Ecole Nationale des Sciences Appliquées Kénitra, Laboratoire Ingénierie des Systèmes Avancés (ISA), Université Ibn Tofail, Kénitra 14000, Morocco
2
Ecole Nationale Forestière d’Ingénieur, Salé 11000, Morocco
3
Centre National de l’Energie, des Sciences et des Techniques Nucléaires (CNESTEN), Rabat 10001, Morocco
4
Independent Researcher, Salé 11000, Morocco
*
Author to whom correspondence should be addressed.
Earth 2021, 2(4), 746-763; https://doi.org/10.3390/earth2040044
Submission received: 3 August 2021 / Revised: 17 September 2021 / Accepted: 20 September 2021 / Published: 11 October 2021
(This article belongs to the Special Issue Terraced Landscapes as Models of Ecological Sustainability)

Abstract

:
Terraced farming play several roles, from improving ecosystem services to enhancing associated population livelihoods. In this study, we were interested in evaluating the roles of mountain terraces in controlling floods and erosion risks, in particular in the Ourika watershed, located in the High Atlas mountains of Morocco. Rainfall simulation tests were conducted to measure infiltration, runoff and initial abstraction, while the Cesium-137 isotope technique was used to quantify soil loss. The results highlighted high infiltration for dense forests (78.00 ± 2.65 mm/h) and low for rangelands (27.12 ± 2.82 mm/h). For terraces, infiltration was found to be about 70.36 ± 0.56 mm/h, confirming the role of terraces in promoting infiltration. The runoff coefficient obtained was lowest for dense forests, followed by cultivated terraces, and highest for rangelands (62.71 ± 3.51). Thus, outside dense forests, infiltration and runoff were significantly very high and low, respectively, for agricultural terraces compared to other land use. The assessment of soil erosion rates showed a significant soil loss for rangelands compared to the agricultural terraces, further underlining the role of terraces in soil conservation. Terraces in the Ourika watershed, by increasing water infiltration, reduce the rate of surface runoff, and consequently, flood risks and soil degradation.

1. Introduction

Terraced agriculture is a phenomenon that has existed for a long time throughout the world. From the ancient times to date, this system has represented an agro-technical system for planting in different locations and under various climatic and topographic conditions around the world [1,2,3]. Terraces are a common component of the landscape in regions with the most rugged and steep topography [4,5]. They provide numerous ecosystem services including food production, water and soil retention, biodiversity conservation, and microclimate regulation [6,7,8,9]. This is translated by their role in mitigating the detrimental impacts of soil erosion by limiting the rate of surface runoff and facilitating the infiltration of water into the soil [5,10]. Effectively, they act as sediment traps by storing leached soil materials on steep slopes, with the sediment accumulating behind the dry stonewalls, creating land suitable for agriculture. Terraced landscapes represent one of the oldest and most effective forms of human adaptation to cultivate in harsh environments [11,12], while representing one of the best ways to prevent land degradation in hilly and mountainous landscapes.
Although terraces provide multiple ecosystem services, several negative environmental impacts associated with them have been documented in the literature. They are generally caused by factors such as inappropriate design, inadequate management or complete abandonment of terraces. Indeed, problems such as disruption of water flow, increased runoff and erosion due to poorly designed terraces [13,14,15,16], degradation of soil quality [17] especially on newly constructed terraces have been noted. Thus, although terraces are a recommended and effective measure for soil and water conservation, their potential threat to the stability of natural ecosystems calls into question their overall impact. Indeed, Wei et al. [4] highlighted the potentially damaging environment and ecosystem impacts of poorly designed terracing systems even compared to systems without terracing.
Terracing is a common form of agriculture in arid and semi-arid areas of the Mediterranean region [2,18]. Due to the scarcity of fertile agricultural land in the valleys of the Atlas Mountains in Morocco, the local population has been forced to build terraces and individual terraced beds on the arid mountain slopes to better manage the limited agricultural land [19]. Notwithstanding their role in reducing erosion and surface runoff, and increasing infiltration, the historical and aesthetic nature of the terraced systems has boosted tourism in the region. Consequently, this has led to improved infrastructure and overall livelihoods through increased opportunities. It is therefore essential to encourage the local population to continue to maintain the terrace systems considering the importance of the ecosystem services provided. Recent studies have shown that climate change continues, altering Mediterranean rainfall patterns [20,21]. This, together with land abandonment, could lead to increased risk of soil degradation [22,23], especially since Mediterranean soils are already considered as a fragile part of the regions’ ecosystem [24]. Indeed, a reduction in vegetation cover and increased soil compaction have been observed, linked to the abandonment of terraces in the Anti-Atlas region, with reduction of infiltration up to 301.8 mm/h along with an increase of risk of runoff [25].
Water erosion is a major concern in the High Atlas region, particularly in the Ourika watershed. The decline of the rural population has resulted in the abandonment of the terraces, further accelerating the progressive degradation of the landscape. Flooding is another major concern to which the Ourika watershed is exposed; historically, it has resulted in significant loss of life and damage to infrastructure. To combat these phenomena, it is imperative to preserve forests upstream in the watershed and to encourage farmers to maintain agricultural terraces, as they contribute significantly to reducing runoff and the risk of flooding and erosion. Thus, quantifying runoff, infiltration and erosion in the terraced areas of the region is essential, as it would help define management strategies. The objective of this study is to assess the role of agricultural terraces in reducing the risks of runoff, flooding and water erosion in the Ourika watershed. Specifically, it involves assessing the effects of different land uses, particularly terrace systems in the region, on infiltration, runoff and subsequent erosion and flooding.

2. Materials and Methods
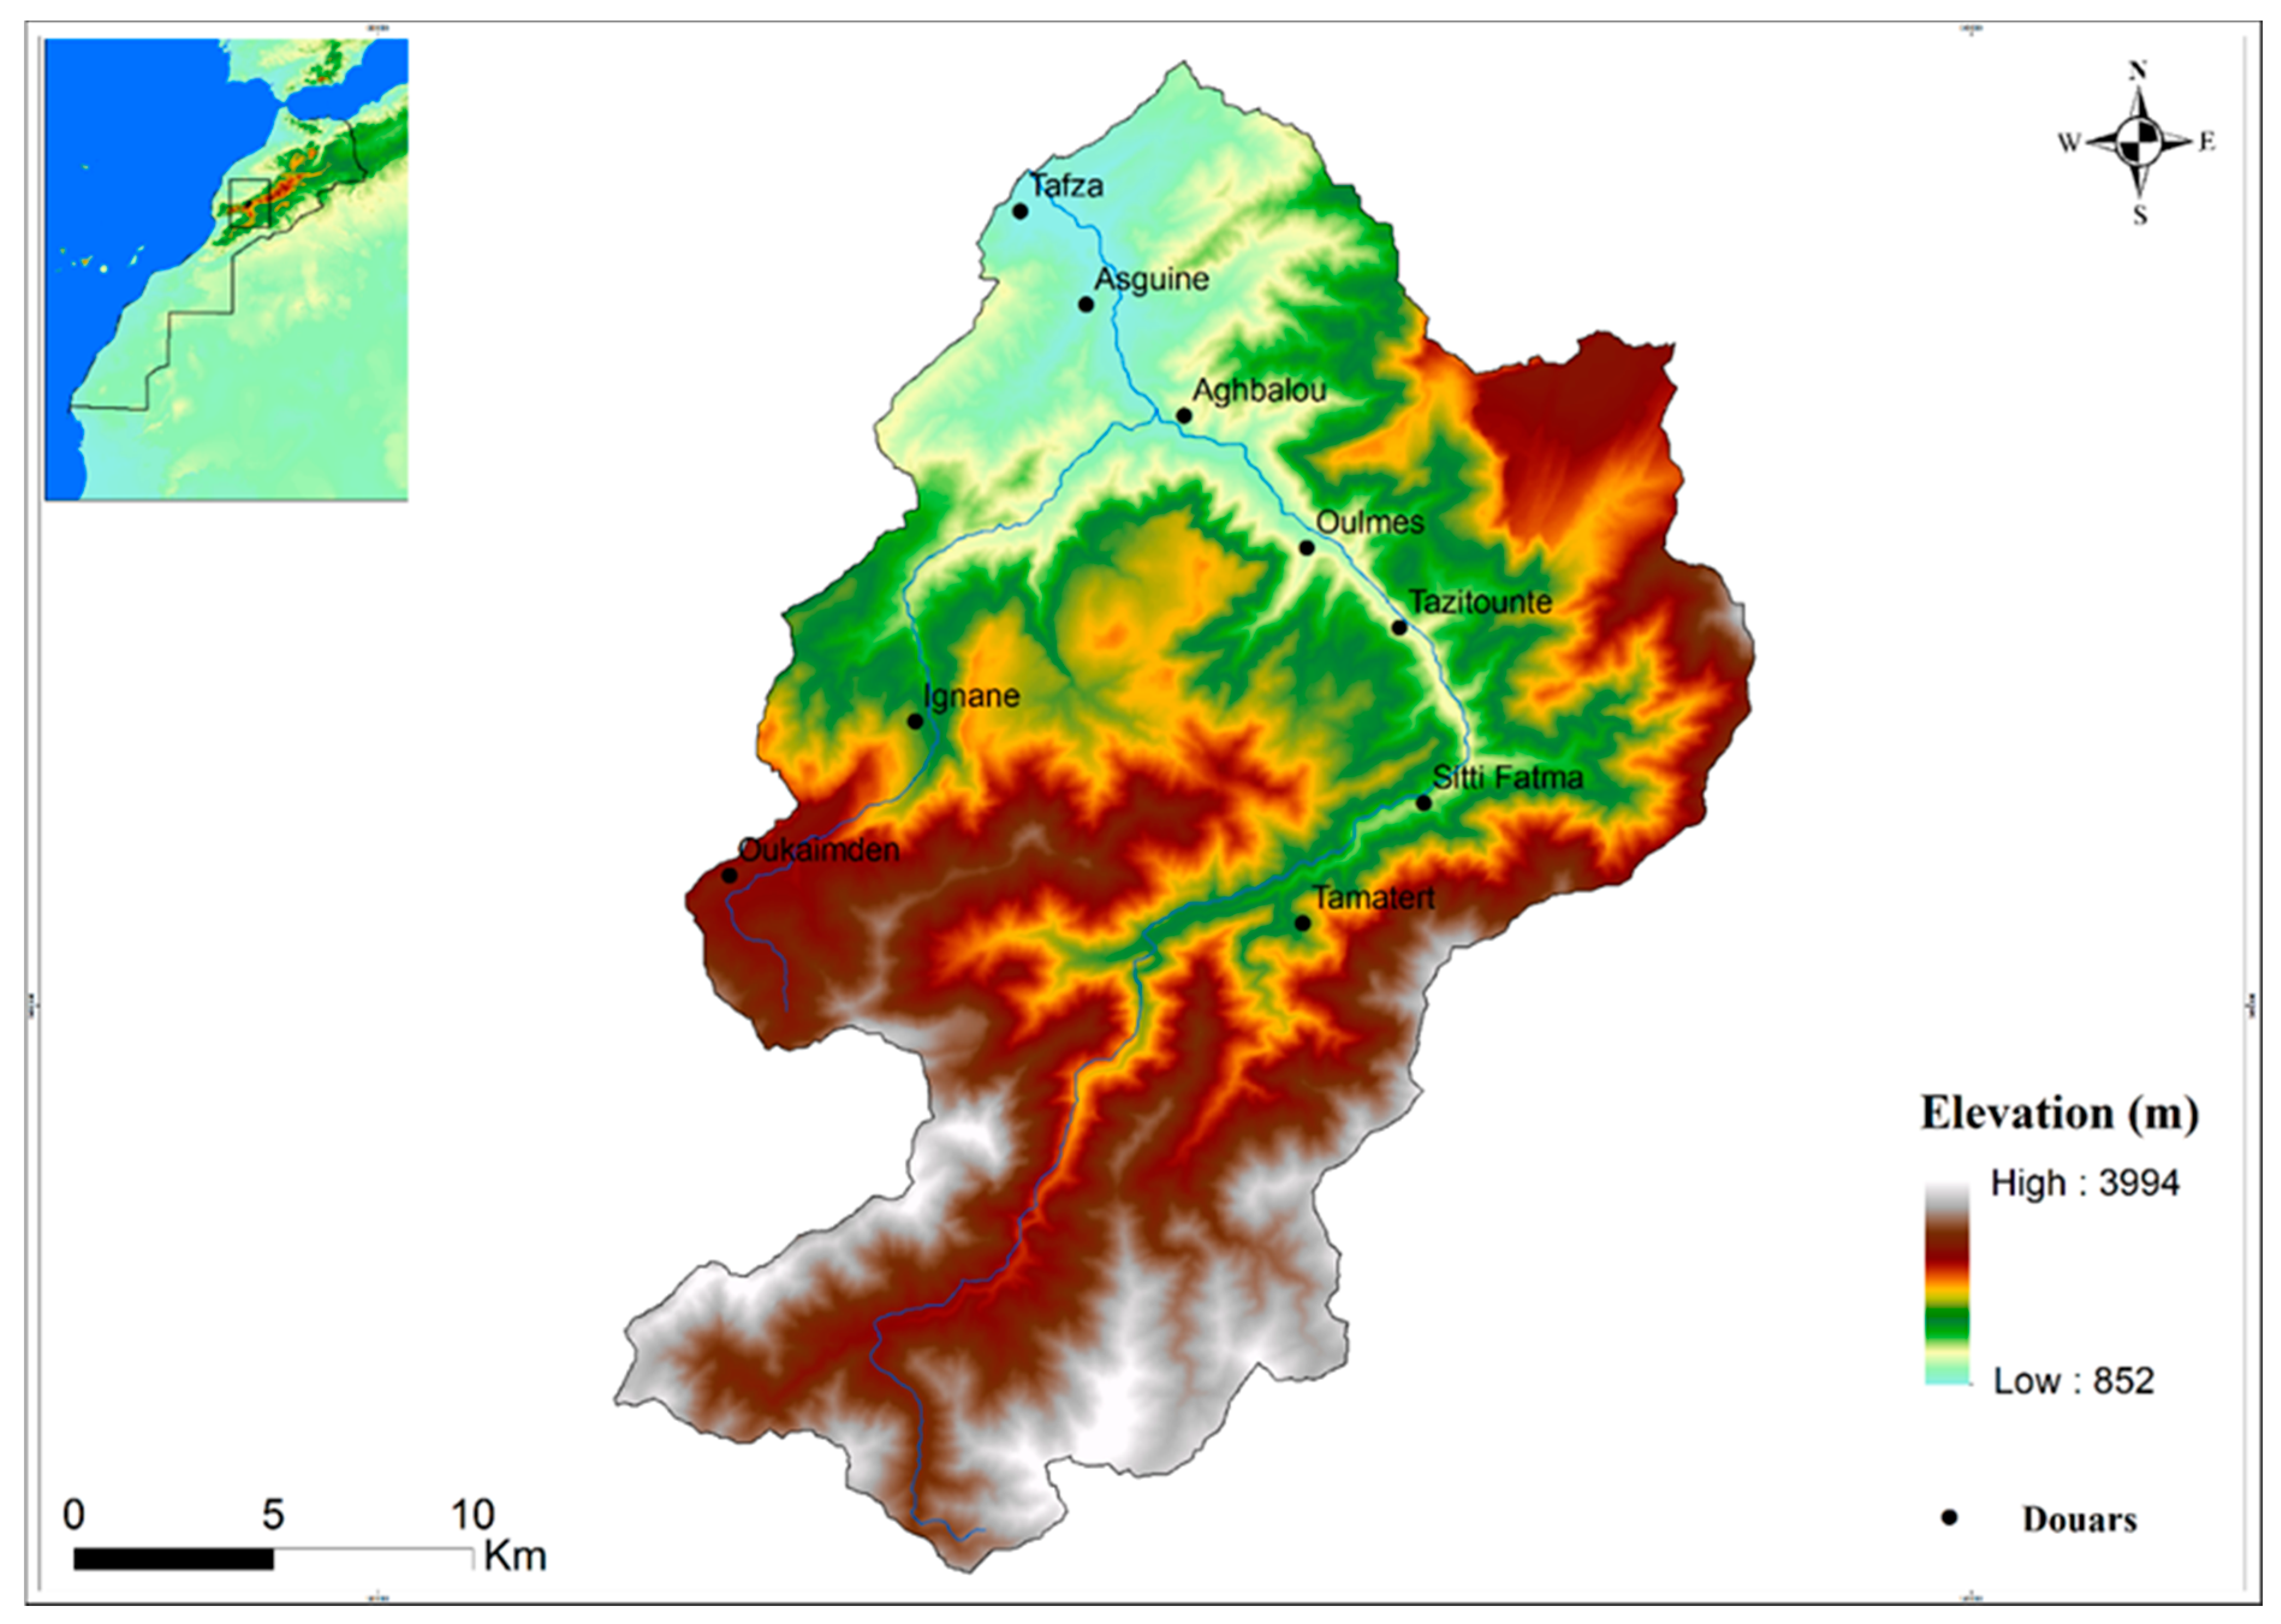
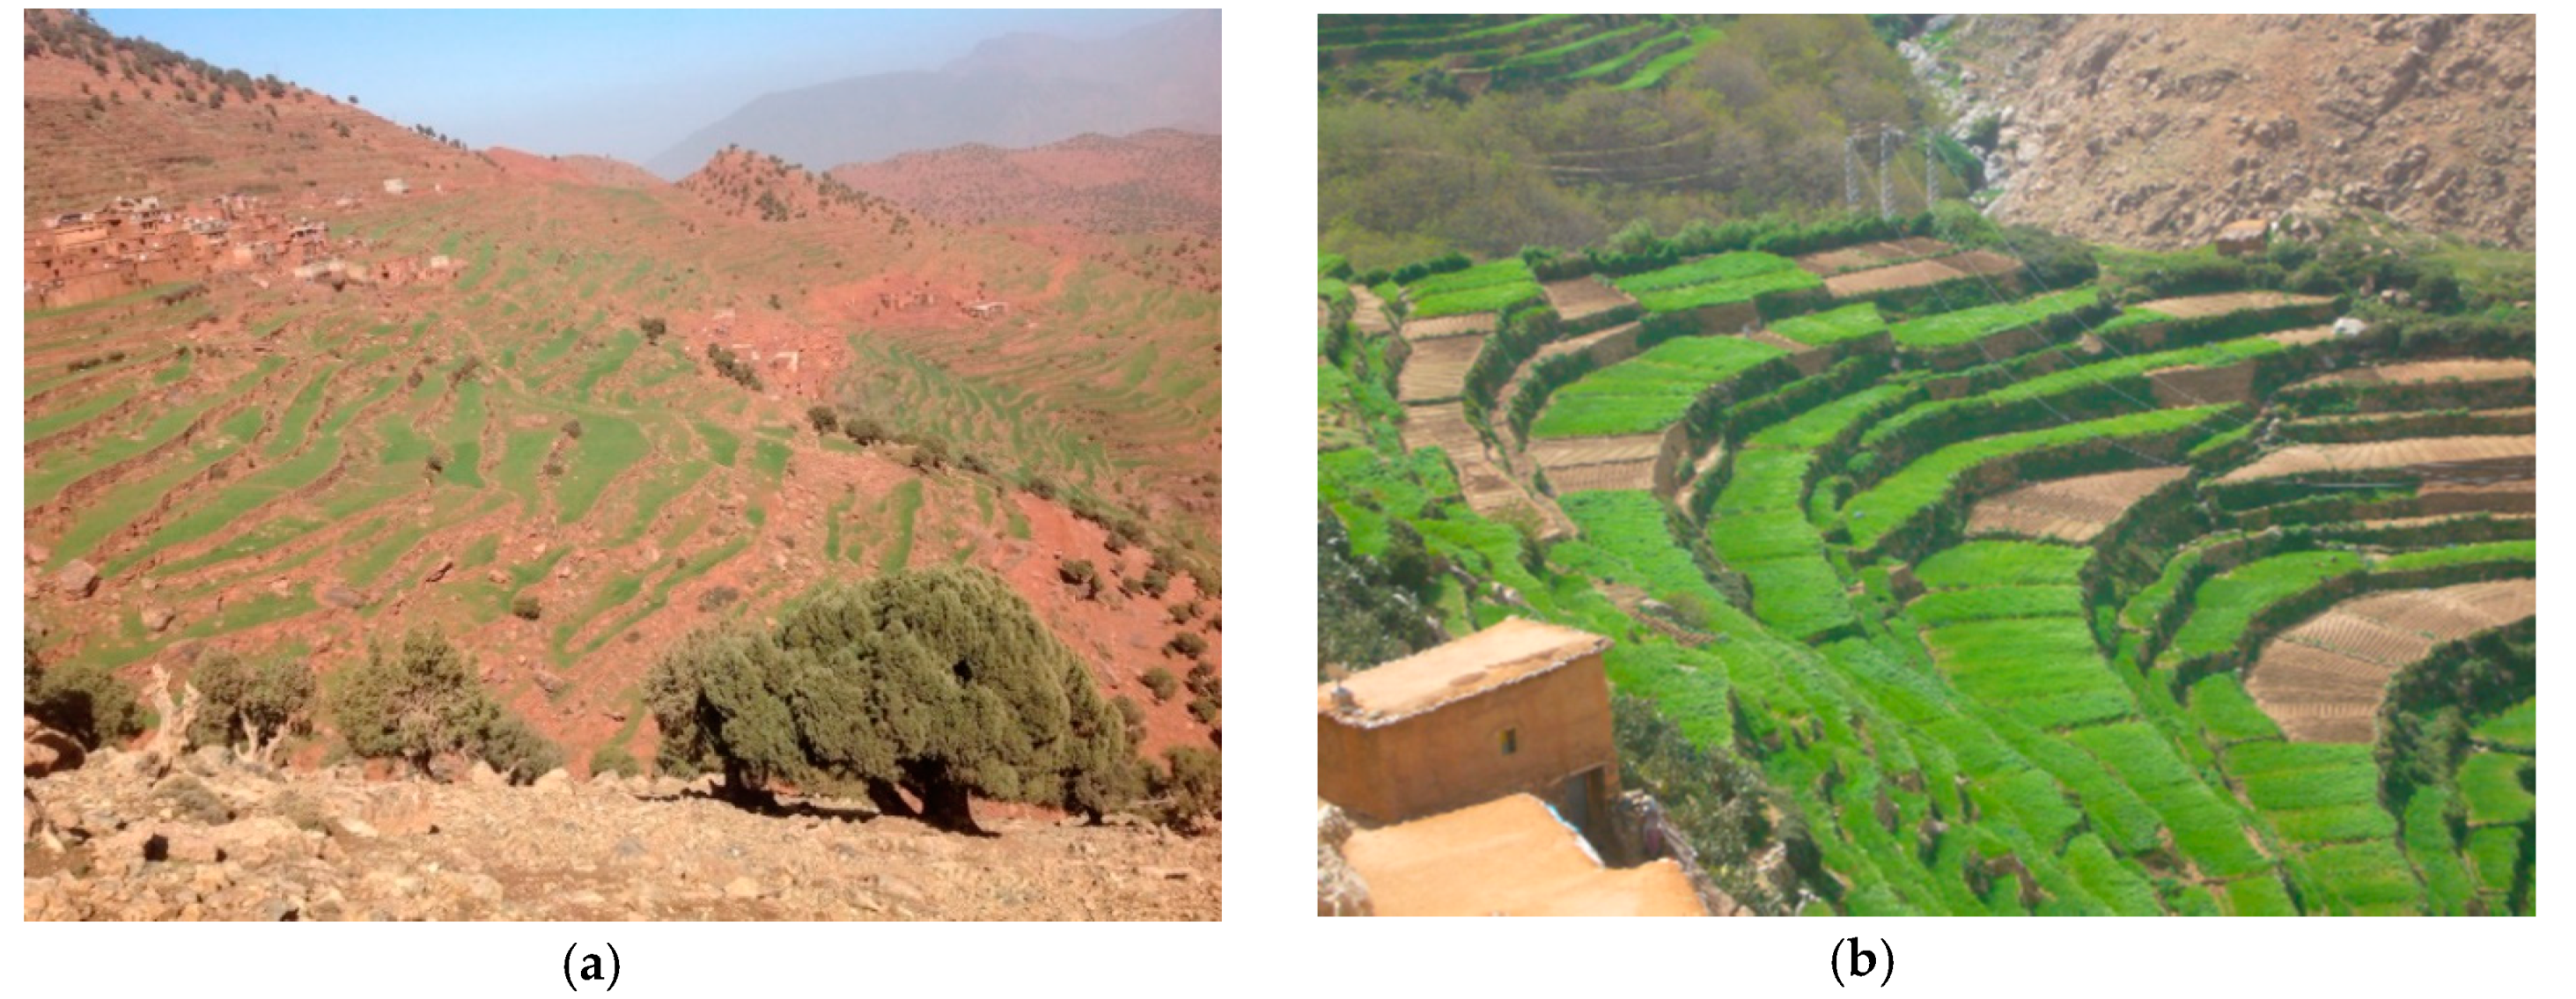
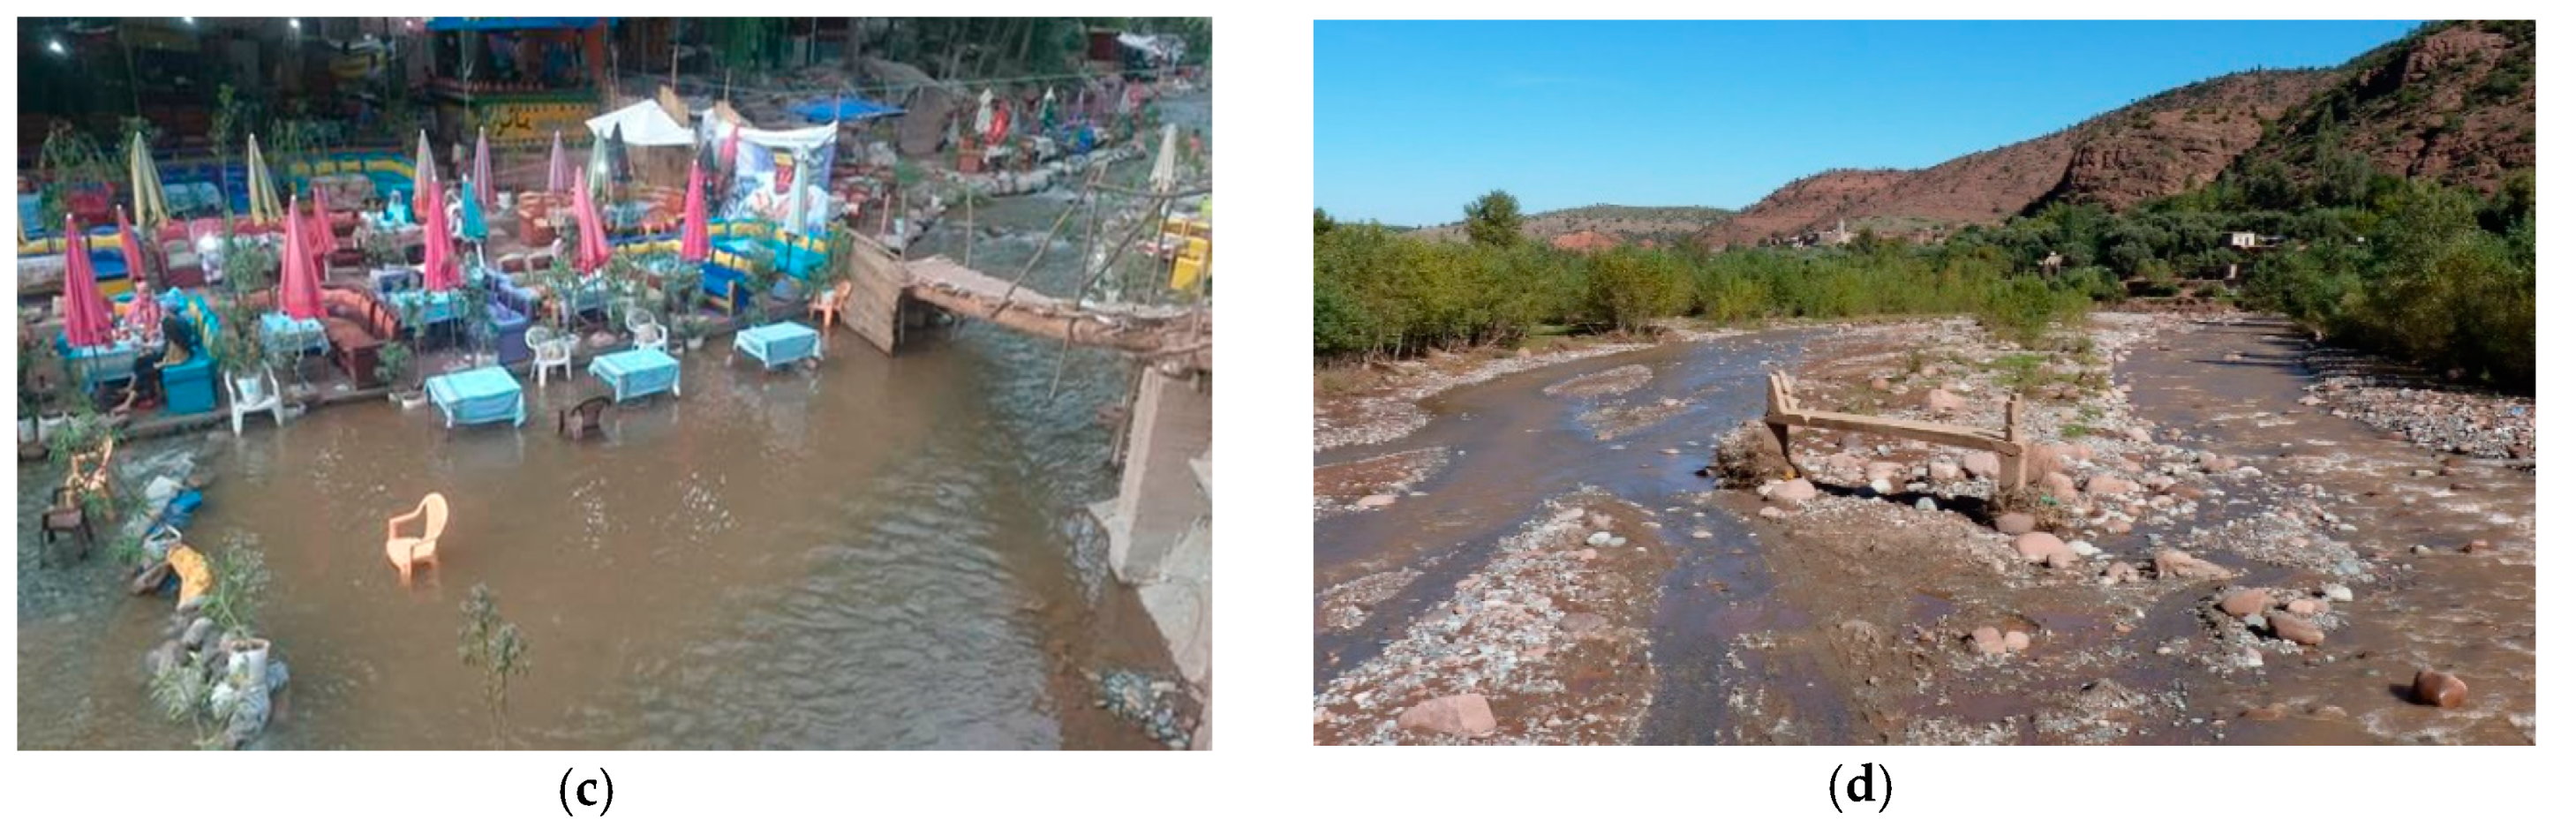
2.1. Study Area

The Ourika watershed (Figure 1), spanning an area of about 576 km2, is located between latitudes 31° N and 31°20′ N and longitudes 7°30′ W and 7°60′ W in the Moroccan region of Marrakech-Safi. It has an altitude ranging from 852 m to about 3994 m at the highest peaks. Almost 75% of the watershed area is located between 1600 and 3200 m, with an average altitude of about 2400 m. Precipitation is distributed along an altitudinal gradient, ranging from 400 mm/year at low altitudes to 700 mm/year at high altitudes. Located at the top of the High Atlas, the watershed is characterized by an impermeable bedrock, composed of magmatic rocks in its upstream part and sedimentary rocks downstream.
The watershed is famed for its distinctive cultivation method based on the principle of terraced farming (Figure 2). These terraces are mainly cultivated with fruit trees, vegetables and cereals crops, and are an extremely important basis for agriculture in the region. Erosion is an important feature of the watershed, with average potential soil loss estimated through RUSLE model at nearly 380 t/ha/year [26].

2.2. Evaluating Infiltration Using Rainfall Simulations Technique

In general, in the Ourika watershed, rangelands are often transformed into agricultural terraces. Thus, they were taken as a reference to study the effect of terraces on runoff and erosion processes. Terraces and rangelands on the two main bedrocks (magmatic and sedimentary) that characterize the watershed were studied. On the terraces, slopes were gentle, ranging from 0 to 2%, while on the rangelands they were much steeper. Accordingly, at these sites, rainfall simulation tests were conducted on the gentle slopes ranging from 5 to 10%. In order to investigate the role of land use in reducing runoff and thus flooding and water erosion risk, rainfall simulation tests were conducted. The rainfall simulation tests were conducted under the different land uses listed in Table 1.
Among the methods used to study soil hydrodynamics, rainfall simulation offers an effective alternative [27]. The rain simulator used is a portable irrigator developed by Roose [27]. Prior to the actual simulation test, the location of the experimental plot was selected within each LULC, taking into account the homogeneity of the soil surface and the degree and direction of the slope. In each selected plot, the setup consisted of placing two 1.66 m long metal angles in the direction of the slope. These angles were driven into the soil to a depth of about 5 cm to avoid lateral water loss. In addition, the use of a double decameter was necessary to keep the two sidebars of the frame parallel to measure the 0.60 m width. As a result, the simulation field measured 1.66 m × 0.60 m (~1 m2). Subsequently, a triangular metal platform was placed downstream of the two angle bars after fixing it in the ground with a hammer. It is through this platform that runoff and sediment are directed to a collection container.
The simulation device consisted of a 50 cm wide watering ramp, connected by a flexible hose to a tank filled with up to 60 L of water located a few meters (1–2 m) above the upstream part of the plot. The intensity of the simulated rainfall (on average 80 mm/h) was then adjusted by a valve at the tank outlet. This intensity is difficult to obtain and requires several trials to stabilize it.
The simulator allows to project drops of relatively low energy on a surface of 1 m2. In this study, the watering process was initiated at a height of 50 cm above the surface and the movement of the operator done in the most regular way possible to adequately spread the water while avoiding watering outside the surface. Water flow values were recorded every 5 min until either the flow rate stabilized or for 1 h, which was the duration of the experiment.
Using these simulation tests, final infiltration (If, mm/h) was determined, which corresponds to the permanent infiltration following the decrease with time of the infiltration capacity of the soil during a rainfall event. It should be noted that it tends progressively towards a constant regime. Indeed, final infiltration corresponds to the average of the last two permanent infiltration values. Initial abstraction (Pi in mm), which corresponds to the height of water infiltrated before the start of runoff, was also determined. It is measured based on the soil reaction time (Tr) and the simulated rainfall intensity Ii (mm/h), which is the time that elapses before the runoff starts. Initial abstraction is calculated as follows:
Pi = (Ii × Tr)/60
As for the runoff coefficient Kr (%), it is calculated based on the following formula:
Kr = (LR/LP) × 100
where:
  • LR: Total runoff (mm) = ∑ LRi;
  • LRi: Runoff layer at each time step (mm) = (Ri/60) × ∆t;
  • Ri: Runoff intensity at each time step (mm);
  • ∆t: Time step (mn);
  • LP: Total precipitated water (mm) = LR + LI;
  • LI: Total infiltrated water blade (mm) = ∑ LIi;
  • LIi: Infiltrated water blade at each time step (mm) = (Ii/60) × ∆t.

2.3. Quantifying Water Erosion Based on Cesium-137 Technique

Some fallout radionuclides, notably cesium-137 (137Cs), are found in trace amounts in the atmosphere. They are often deposited on the earth’s surface by rain. On the ground, they are present in the topsoil. When part of this layer is removed by erosion, their concentration decreases and therefore this can indicate how much soil has been removed from a given area [28].
To study the role of terraces in controlling erosion risks, three types of land use including agriculture, forestry, and rangeland on magmatic and sedimentary rocks were considered (Table 2). Transects were selected within each land use, and soil samples were collected along the slope gradient. The distance between sampling points varied from 10 to 15 m between terraces (only one sampling point was selected per terrace), while a distance of 20 m was used in the forest and rangeland.
As described by Meliho et al. [28], cores were extracted using a core motor consisting of a 9 cm wide and 1 m long cylindrical tube. Samples were taken at a depth of 30 cm. Two reference sites were selected adjacent to the study sites. The first reference site was abandoned for over 100 years (cemetery), undisturbed, in close proximity to the sample sites, and consisted of Pistacia lentiscus. This site was selected for use in calculating soil erosion for the selected transects over sedimentary rock. The second reference site was selected for the calculation of erosion rates for the selected transects over magmatic rock. It consisted of a mountaintop plateau with sparse Quercus rotundifolia and Cistus sp. vegetation. Both reference sites were flat, with a slope gradient ranging from 0 to 1%. At each reference site, 12 samples were collected at a depth of 30 cm using a grid approach. To determine the depth distribution of 137Cs at the reference sites, a soil core from each reference site was sampled at 4 cm intervals [28].
The physical preparation of the samples was performed in the laboratory and the mass activity and inventory of cesium-137 determined by gamma spectrometry [28].
For agricultural terraces, the Mass Balance Model II (MBMII) was used to estimate long-term (50-year) rates of water-induced soil erosion for cultivated sites. This model accounts for both time-varying 137Cs deposition inputs and the fate of freshly deposited 137Cs deposition prior to incorporation into the tillage layer by the crop [29,30]. For uncultivated sites, the profile distribution model (PDM) was used because the depth distribution of 137Cs in an uncultivated soil profile is significantly different from that in cultivated soils where 137Cs is mixed with the tillage or crop layer.

2.4. Statistical Analysis

The effect of land uses on the different parameters studied including infiltration, initial abstraction, runoff coefficient, and net erosion rate was statistically tested using the ANOVA test. The assumption of normality was tested using the Shapiro–Wilk’s test, and to test the assumption of homogeneity of variance, Levene’s test was used. Furthermore, the Tukey post hoc test was used in the analysis to compare the different land uses, with a significance level of p < 0.05 adopted. In this study, descriptive statistical analyses and ANOVA tests were performed with R.

3. Results

3.1. Desciptive Statistics

The descriptive statistics illustrating the effects of land use types on initial abstraction, final infiltration, runoff coefficient and erosion rate are presented in Table 3, Table 4, Table 5 and Table 6 and on Figure A1, Figure A2 and Figure A3 (in Appendix A).
Initial abstraction (Pi) corresponds to the soil-wetting phase, during which the infiltration volume is greater than the rainfall and no runoff is observed. Mean Pi rate was the highest under dense forests (DFO) at 78.00 ± 2.65 mm/h, while rangelands (RAN) recorded the lowest rates at 1.89 ± 0.68 mm/h and 1.80 ± 0.70 mm/h on magmatic and sedimentary bedrocks, respectively (Table 3, Figure A1). Interestingly, cultivated terraces (ARB, CER) had lower mean Pi rates than abandoned terraces (FAL). Indeed, terraced fields with fruit trees, with cereals on magmatic and sedimentary rocks had mean Pi rates of 3.72 ± 1.24 mm/h, 5.53 ± 0.64 mm/h and 6.86 ± 2.84 mm/h, respectively, compared to 8.16 ± 1.36 mm/h and 6.69 ± 3.78 mm/h recorded under abandoned terraces on magmatic and sedimentary bedrocks, respectively. Moreover, abandoned terraces had higher mean Pi rates than moderately dense forests and woodlands.
Final infiltration (If) is the difference between the volume of runoff and the volume of rainwater in a given time. Similar to Pi, average If rates were highest under dense forests with 78.00 ± 2.65 mm/h on both rock types and lowest under rangeland, with values of 39.11 ± 4.11 mm/h and 27.12 ± 2.82 mm/h on magmatic and sedimentary rocks, respectively (Table 4, Figure A2). The role of terrace systems becomes apparent, with these distinct land features being the third and fourth highest performing land uses after dense and moderately dense forests. Indeed, If under cultivated terraces with fruit trees (ARB), cereals on magmatic rocks (CER_MR) and sedimentary rocks (CER_SR) was recorded at 70.36 ± 0.56 mm/h, 65.01 ± 0.23 mm/h and 62.86 ± 1.20 mm/h, respectively. Under abandoned terraces, mean If was recorded at 60.84 ± 0.56 mm/h and 57.81 ± 2.07 mm/h on magmatic and sedimentary bedrocks, respectively
Runoff coefficient (Kr) relates the amount of runoff to the amount of precipitation received. Accordingly, it is higher for areas with low infiltration and high runoff. As expected, Kr was highest under rangelands, with the highest mean Kr values of 62.71 ± 3.51 and 47.07 ± 5.12 under magmatic and sedimentary bedrocks, respectively, while being lowest under dense forests at 1.00 ± 1.00 followed by moderately dense forests (MDF) at 3.21 ± 0.88 and 4.70 ± 0.33 under magmatic and sedimentary bedrocks, respectively (Table 5, Figure A3). Among the non-forested land uses, cultivated terraces had the lowest mean Kr values followed by abandoned terrace.
Erosion rate (Er) indicates the total quantity of soil loss over a given period of time. Erosion was lowest under dense forests (FOR_MR) on magmatic bedrock, with an average soil loss of 3.07 ± 1.27 t/ha/yr, while it was highest under rangeland on sedimentary bedrock (RAN_SR) with an average loss of 17.28 ± 1.95 t/ha/yr (Table 6, Figure A4). Terraces cultivated on sedimentary rocks (AGR_SR) had the second lowest erosion rates, with an average loss of 4.50 ± 5.77 t/ha/yr, while terraces on magmatic rocks (AGR_MR) surprisingly had the second highest soil losses, with an average loss of 6.61 ± 6.67 t/ha/yr. The lower soil erosion rate observed under rangeland on magmatic rock (RAN_MR) could be attributed to the substrate being highly rocky, with little erodible soil. Nevertheless, the runoff rate was very high.

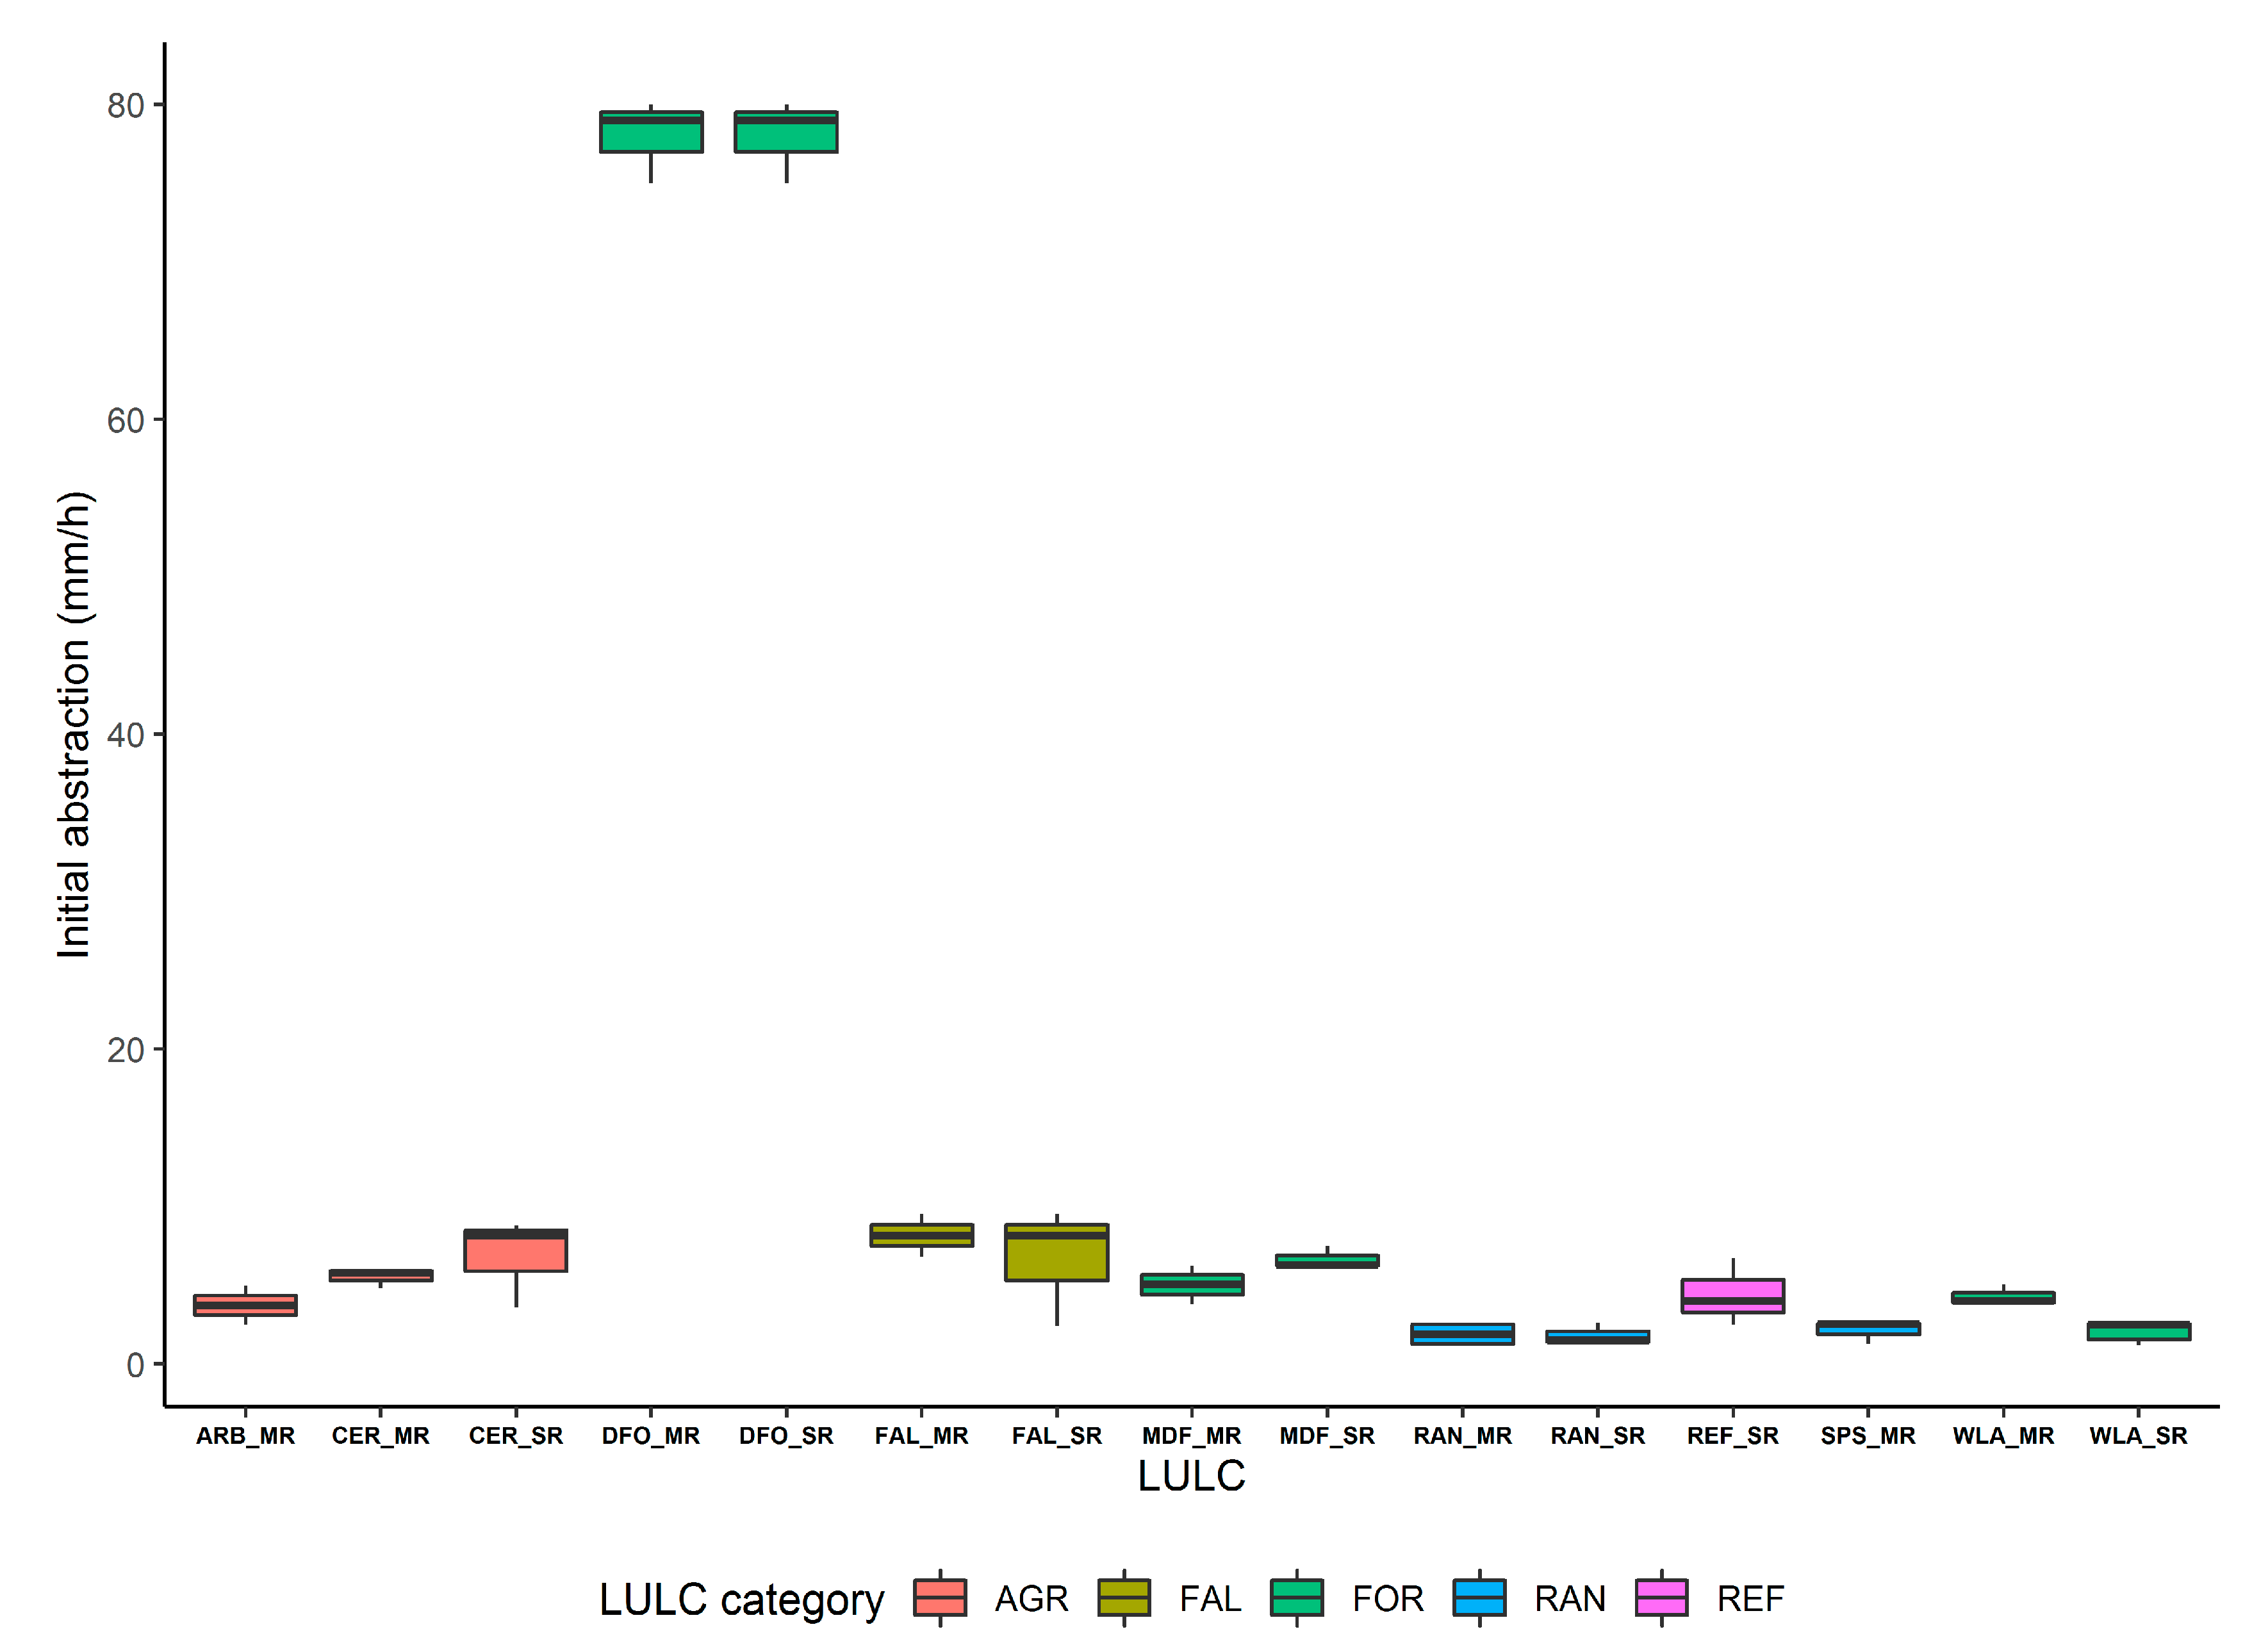
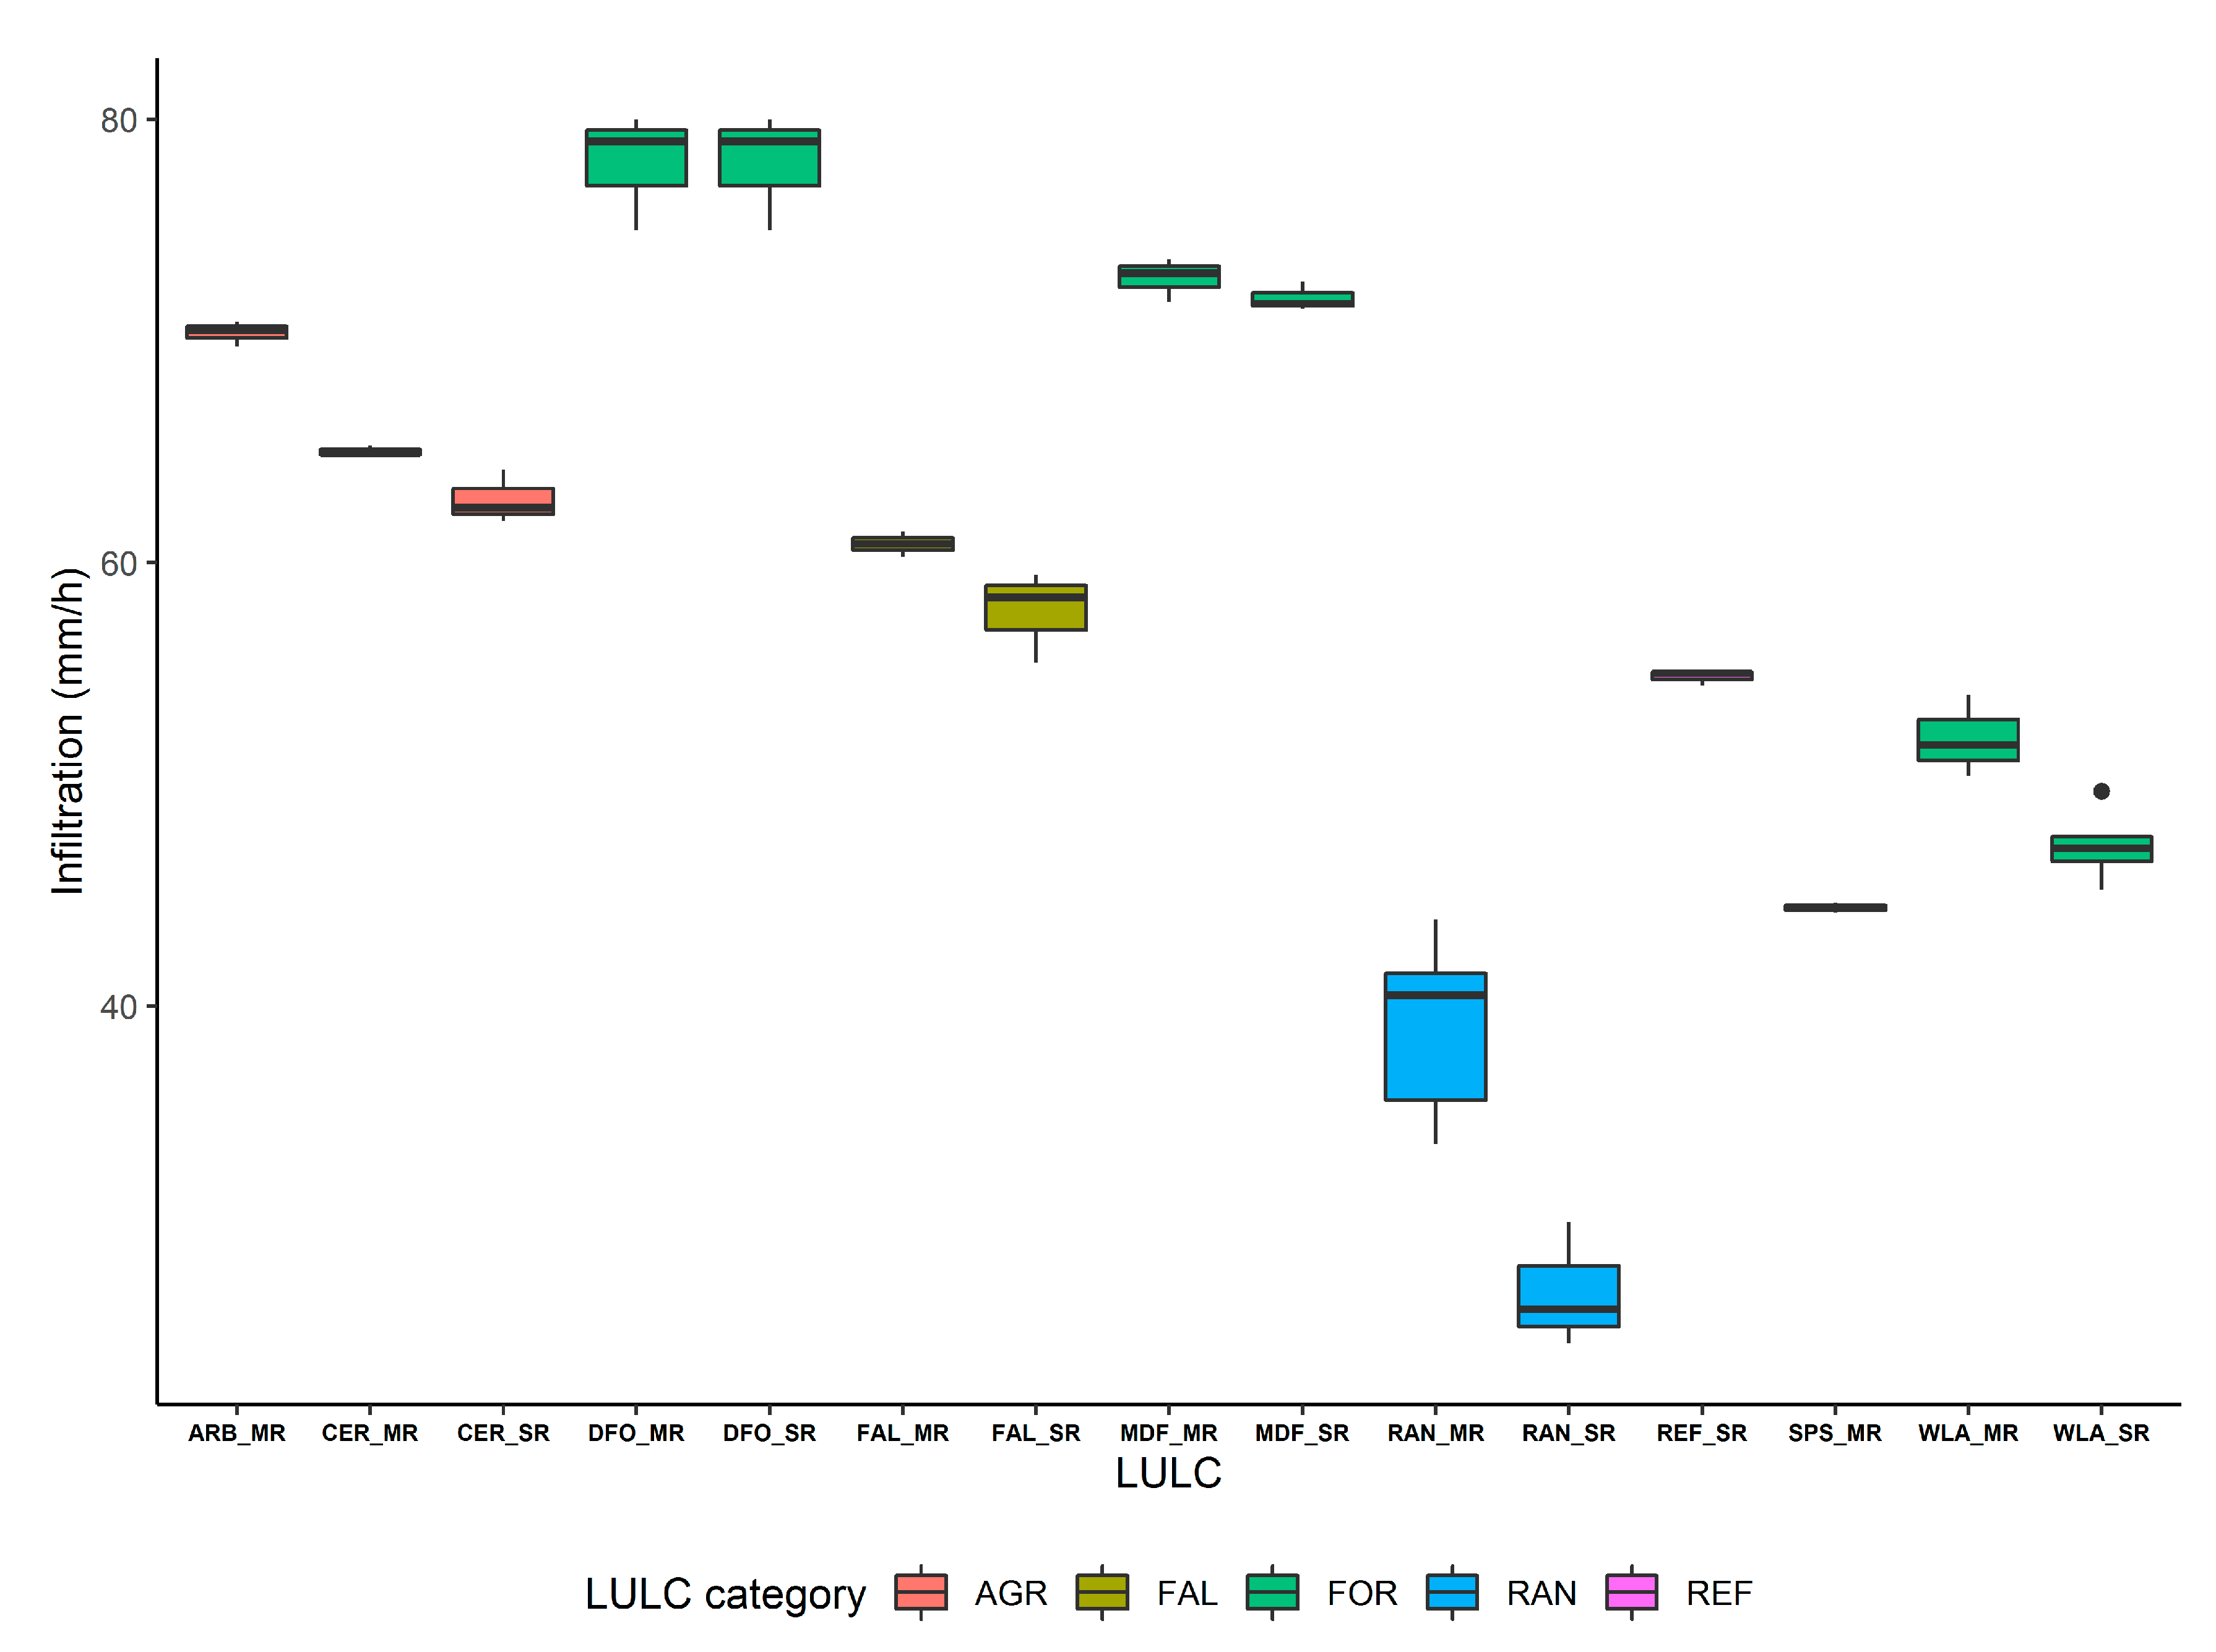
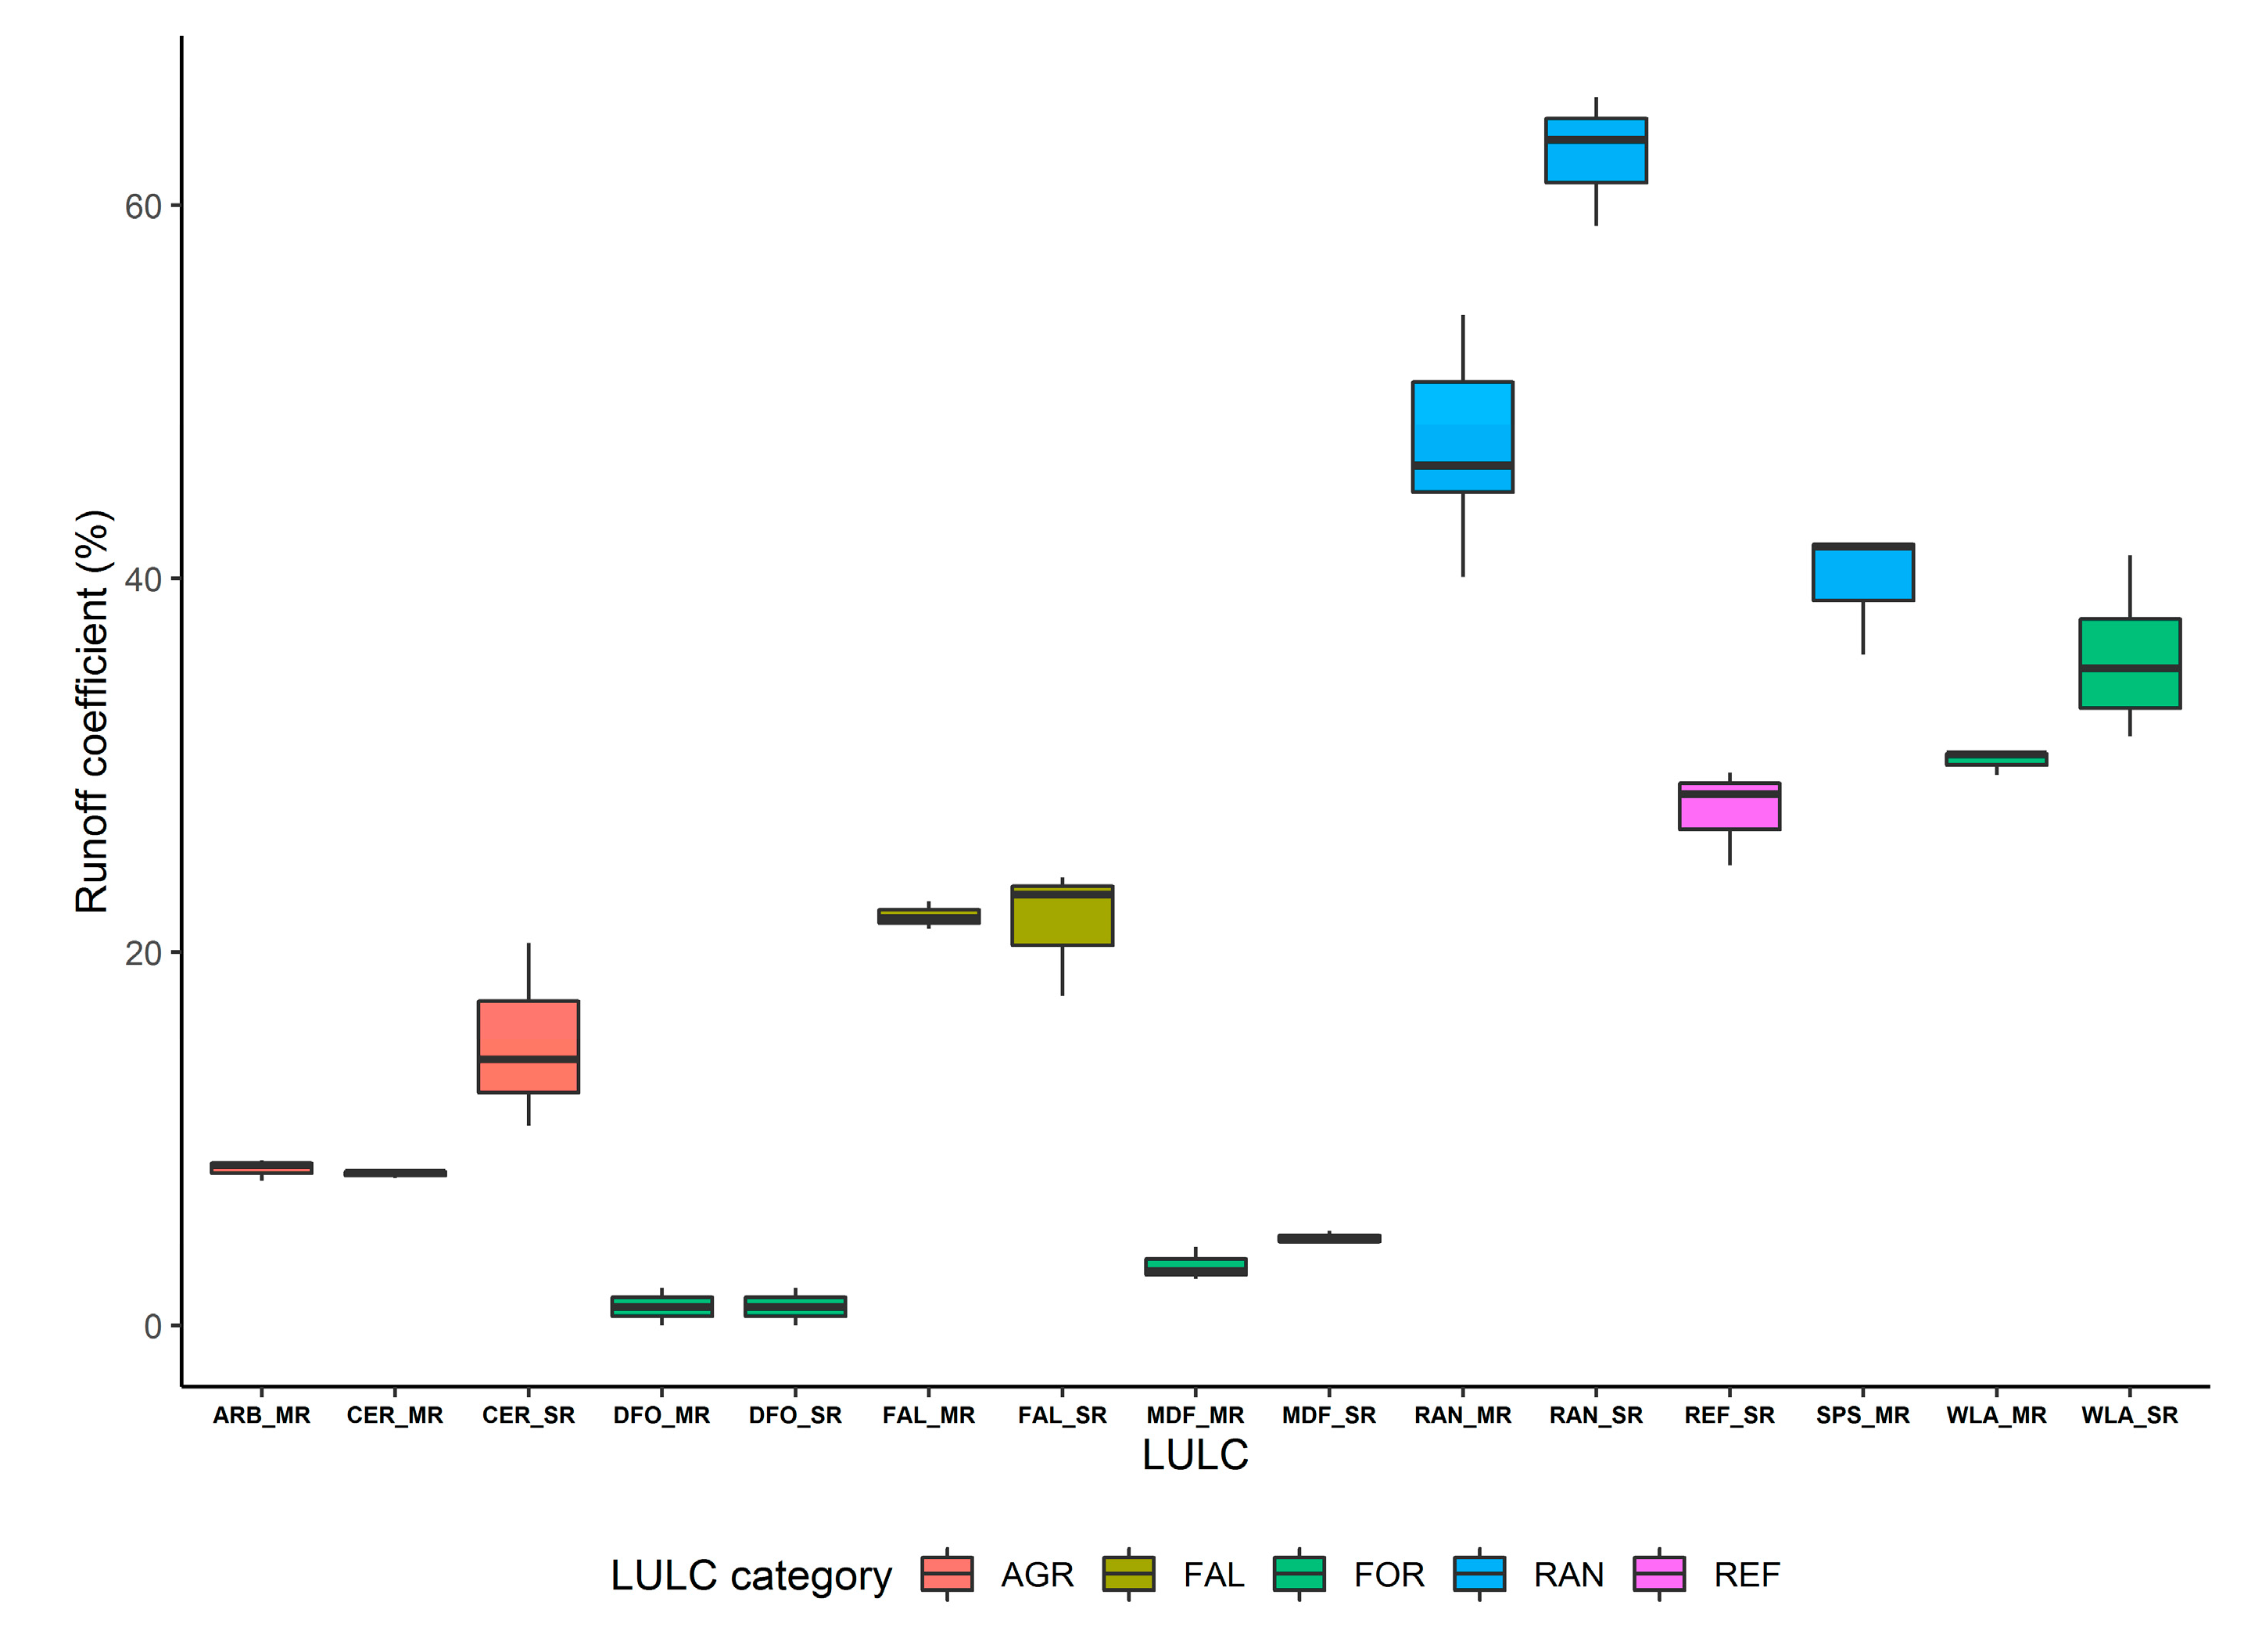
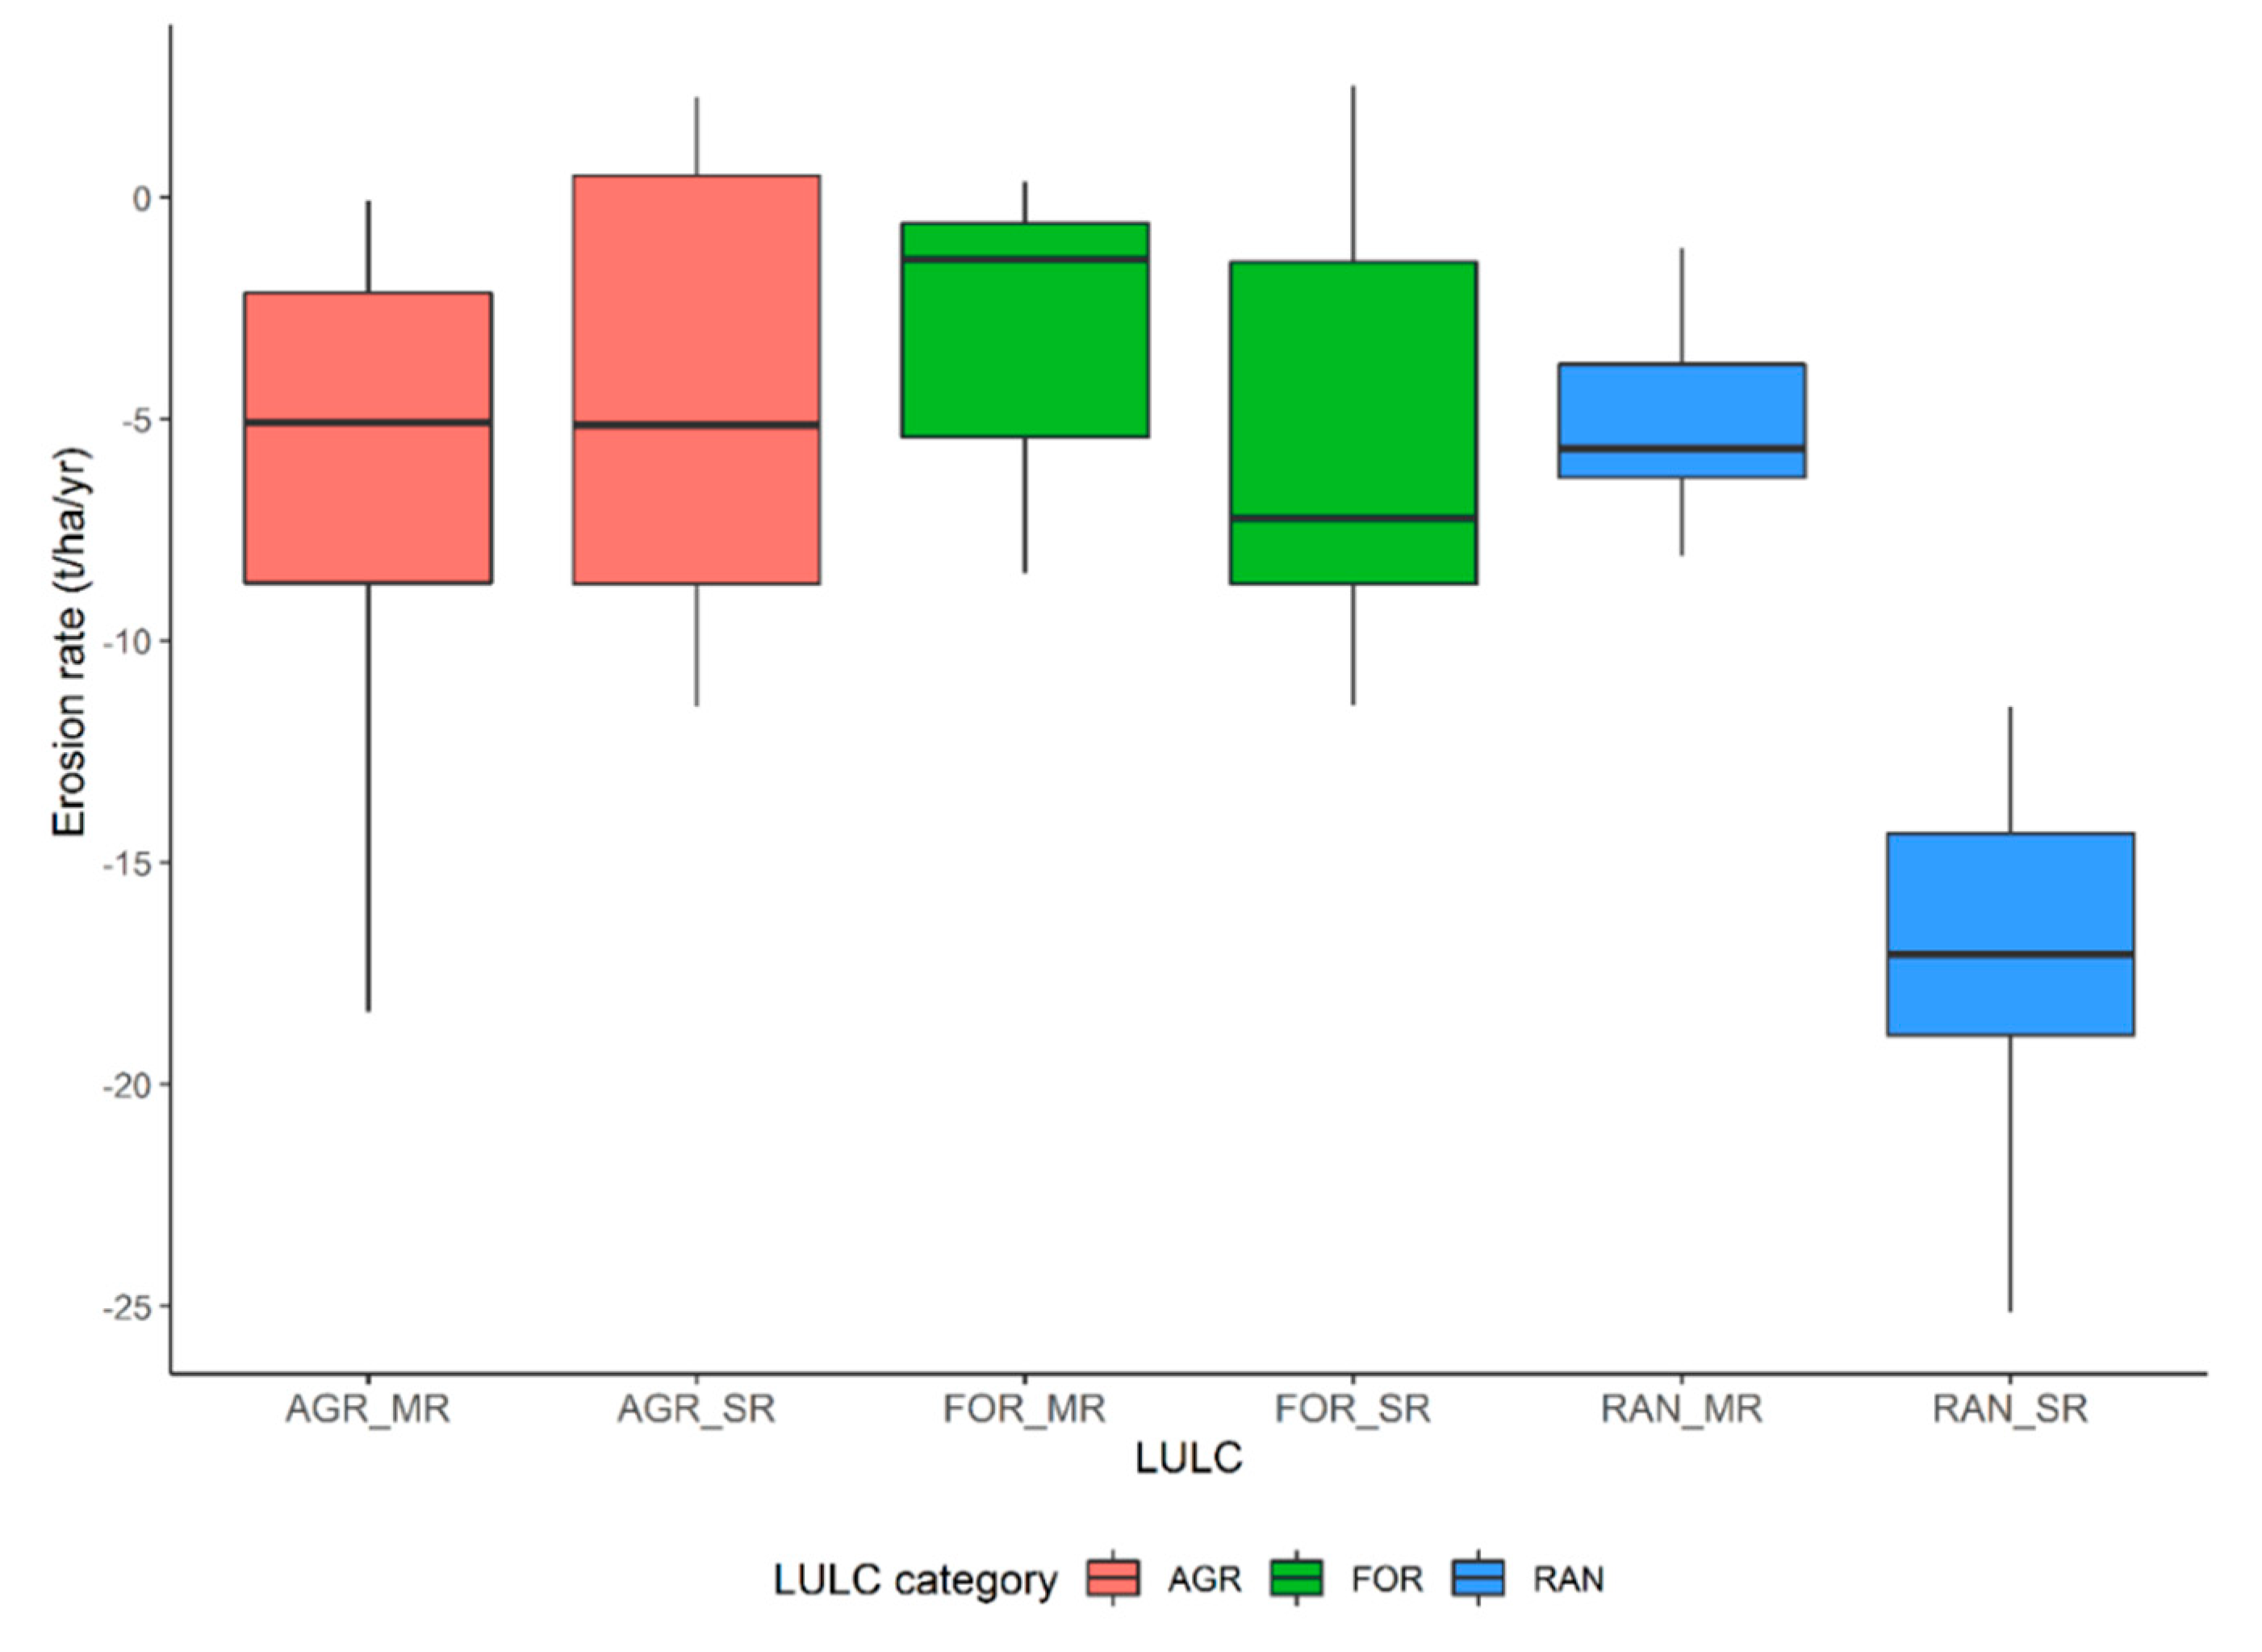
3.2. Effect of Land Use Types on Initial Abstraction, Final Infiltration, Runoff and Soil Erosion Rate

The Shapiro–Wilk normality test was performed and the results are presented in Table A1 and Table A2, effectively verifying that the distribution was normal (p < 0.05). As for the test of homogeneity of variance, the Levene test was performed. The results are presented in Table A3. The test of the homogeneity of the variance was verified (p < 0.05).
Table 7 presents the results of the ANOVA test of the effect of LULC on the different parameters (Pi, If, Kr, Er), at a probability threshold of 5%. The ANOVA table reveals that LULC had a very highly significant effect on Pi, If, Kr and Er (p < 0.001). The lithology factor did not have a significant effect on Pi, If, Kr and Er. Similarly, the interaction between LULC and lithology had no significant effect on the studied variables.
Table A4, Table A5, Table A6 and Table A7 present a comparison of the different land use types and their impact on the different parameters (Pi, If, Kr, Er) based on the Tukey test at p < 0.05.
There was a generally non-significant (p < 0.05) difference between land uses in their effects on Pi (Table A4). However, the influence of dense forests on Pi was the most notable. Indeed, very highly significant differences (p < 0.001) were observed between dense forests (DFO) and cultivated terraces (ARB, CER). The role of terraces in improving surface conditions is highlighted by the fact that Pi was significantly lower (p < 0.05) on cultivated terraces on sedimentary bedrock (CER_SR) than on woodlands (WLA_SR) and rangelands (RAN).
Table A5 presents a comparison between the different land use types in their role in influencing infiltration. Generally, land use types had a major influence on If, with very highly significant differences (p < 0.001) between them observed. Highly significant differences (p < 0.01) were recorded between dense forests and terraces with fruit trees on magmatic bedrock (ARB_MR), with highest If values observed under the forests. The role of forests is further underlined in their comparison with terraces with cereal crops (CER), with very highly significant differences (p < 0.001) observed between dense forests and CER. Additionally, moderately dense forests on magmatic (MDF_MR) and sedimentary (MDF_SR) bedrocks very significantly (p < 0.01) and significantly (p < 0.05) favor infiltration, respectively, compared to CER. The role of cultivated terraces is well illustrated here. Indeed, except for dense and moderately dense forests, If was for the most part highly to very highly superior on agricultural terraces compared to other land uses. This is expected, as the infiltration capacity of soils, particularly in arid zones, has been shown to be influenced by state of the soil surface [31]. Indeed, forest cover, including their accompanying undergrowth, provide conditions that reduce runoff and erosion while favoring infiltration. This is also observed under agricultural terraces, with crops through their root systems facilitating soil and water conservation.
A comparison between the different land use types with respect to their effects on runoff coefficient (Kr) is presented in Table A6. Rangeland, woodland, reforested land, and land dominated by upland thorny xerophytes were all characterized by significantly very high Kr (p < 0.001) compared to agricultural terraces. This was anticipated, as these land use types are generally poor in vegetative cover, as well as being characterized by compact soils, particularly in the case of rangelands. This provides favorable conditions for runoff while reducing infiltration. Surprisingly, there was no significant difference (p < 0.05) in Kr between dense forests and terraces with fruit trees and cereals on magmatic bedrock. This shows that terraces can serve a similarly important role in curbing runoff. In addition, farmers in the region, including the high altitude valleys of the High Atlas (Ourika, Nfis, Rerhaya), are turning to techniques such as deep manual subsoiling, partitioned ridging and mulching. These techniques have proven to be an important factor in limiting runoff while promoting infiltration and subsequent water storage and soil productivity in cultivated terraces compared to abandoned terraces that have been converted into rangelands (RAN), fallows (FAL) and other barren non-forested areas. The pairwise comparison between land uses with respect to their effect on soil loss (Table A7) showed that there was a generally non-significant difference (p < 0.05). Nevertheless, there was a highly significant difference (p < 0.01) in Er between terraced cropland and rangeland on sedimentary bedrock (RAN_SR), highlighting the role of terraces in reducing soil loss in the watershed. Soil erosion rate was low in rangeland on magmatic bedrock (RAN_MR) because the soil was very rocky and there were very few small soil particles to be carried by runoff, which was very high. Rangelands are generally characterized by very little vegetative cover and very compacted and crusted soil, which promotes conditions that lead to soil loss. Interestingly, there was a non-significant difference between soil erosion rates under forests compared to cultivated terraces. This reveals the important role played by agricultural terraces in reducing water erosion in the Ourika watershed, compared to forests and rangelands.

4. Discussion

Land degradation in the mountains of Morocco is not a simple natural phenomenon depending exclusively on physical factors. It is also a product of human interaction and involvement, which through their multiple actions including clear-cutting of forests, cultivation on steep slopes, uncontrolled grazing, generates and aggravates the various land degradation processes such as soil erosion. Terraced farming has been one of the best methods of mitigating soil loss in mountainous landscapes because it serves to attenuate processes such as runoff and sediment production along the slopes while promoting infiltration.
In this study, we looked to evaluate the role of terraces in controlling processes such as erosion, runoff and infiltration and consequently floods risks in the Ourika watershed in the High Atlas region of Morocco. Rainfall simulation tests were conducted to study the processes including initial abstraction, final infiltration and runoff while the Cesium-137 isotope technique was adopted to quantify soil erosion.
Our findings highlighted dense forests, followed by cultivated terraces as being the most effective in promoting infiltration while reducing runoff, flood risks and sediment loss. This is in agreement with several studies including those by Cammeraat et al. [32], Araya et al. [33] and Sabir [25]. By fulfilling their soil and water conservation role, as highlighted in this study, cultivated terraces in the Ourika watershed can improve the livelihoods of the population. Indeed, if properly developed and maintained, they have the potential to generate income for local population of the Atlas Mountains through the marketing of agricultural products. In addition, terraces often serve as a tourist attraction because of their spectacular appearance. This has been reported in China [34,35] and coincides with the development of local infrastructure.
The results of this study also showed the importance of preserving terraced fields. Indeed, abandoned terraces in the Ourika watershed showed a reduced infiltration capacity, while promoting runoff and erosion compared to cultivated terraces. This is in agreement with the study conducted by Sabir [25] in the Anti-Atlas region of Morocco, where abandonment resulted in a reduction in infiltration, with an increased risk of runoff also noted. Similarly, Brandolini et al. [36] in a study in Italy found that the slopes of abandoned terraces were affected by a greater amount of mobilized debris volumes than cultivated terraces.
Our study provided strong evidence of the value and importance of agricultural terraces in ecosystem conservation and human well-being in the high mountains, especially in arid and semi-arid areas. We identified approaches relevant to studying and monitoring the evolution of soil processes that dominate the region. Nevertheless, in order to improve the monitoring of the evolution of terraced landscapes, in-depth studies can be proposed based on data from remote sensing techniques. These allow for easy recognition of topographic features of terraces, even in areas covered by vegetation and can be useful for mapping abandoned and vegetated terraces. This would provide a basis for management and development work on these systems.

5. Conclusions

This study highlights the impact of agricultural terraces in mitigating phenomena such as runoff, soil erosion and flood risks in the mountainous areas of the Ourika watershed in Morocco. The results of this research demonstrate the ability of terraced systems to promote processes such as initial abstraction and infiltration, thereby reducing soil erosion and surface runoff on agricultural lands. Forests remain the ultimate barriers against land degradation processes such as runoff and erosion while promoting infiltration, as indicated in our findings. Nevertheless, agricultural terraces offer an intriguing alternative due to not only their ecosystem conservation value, but also their potential to improve the livelihoods of the local population. This was emphasized in this study, as they showed the greatest capacity outside of forests to limit runoff and erosion. Their promotion of infiltration also facilitates water storage in the systems, thus improving the agricultural potential of the area.
Degradation and the subsequent abandonment of terraces has the potential to accentuate problematic issues already plaguing the region. Thus, the proper maintenance of terraced systems in the Moroccan High Atlas is of paramount importance, especially for a region known for soil erosion and flooding. This will limit these risks while maintaining and even improving the agricultural potential of the already limited space available to the local population, especially in an ever-changing climate.

Author Contributions

Conceptualization, M.M.; data curation, M.M.; formal analysis, M.M.; funding acquisition, A.K.; investigation, M.M.; methodology, M.M. and A.N.; project administration, A.K.; resources, A.K.; software, M.M. and A.N.; supervision, A.K. and A.N.; validation, M.M. and A.N.; visualization, M.M.; writing—original draft, M.M. and C.A.O.; writing—review and editing, M.M. and C.A.O. All authors have read and agreed to the published version of the manuscript.

Funding

Research funded by International Development Research Centre (107644-001).

Institutional Review Board Statement

Not applicable.

Informed Consent Statement

Not applicable.

Data Availability Statement

Data is contained within the article.

Acknowledgments

The International Development Research Centre (IDRC), Canada, funded the field works of this study through GIREPSE project (2014–2018).

Conflicts of Interest

The authors declare no conflict of interest. The funders (IDRC) funded the field works part of this study.

Appendix A

Figure A1. Boxplot of initial abstraction by LULC.
Earth 02 00044 g0a1
Figure A2. Boxplot of infiltration by LULC.
Earth 02 00044 g0a2
Figure A3. Boxplot of runoff coefficient by LULC.
Earth 02 00044 g0a3
Figure A4. Boxplot of erosion rate by LULC.
Earth 02 00044 g0a4
Table A1. Shapiro–Wilk test for normality test for Pi, If and Kr.
Sampling Units CodeStatisticp-Value
PiIfKrPiIfKr
ARB_MR1.000.960.901.000.610.40
CER_MR0.870.950.860.300.550.27
CER_SR0.840.930.980.220.490.70
DFO_MR0.890.891.000.360.361.00
DFO_SR0.890.891.000.360.361.00
FAL_MR1.001.000.981.000.940.75
FAL_SR0.890.930.850.350.470.25
MDF_MR1.000.960.920.980.600.44
MDF_SR0.780.880.920.070.310.45
RAN_MR0.710.880.960.010.290.82
RAN_SR0.860.940.960.270.530.63
REF_SR0.970.830.910.690.190.42
SPS_MR0.781.000.780.080.970.06
WLA_MR0.890.980.790.340.740.09
WLA_SR0.680.950.950.000.780.78
Table A2. Shapiro–Wilk test for normality test for soil erosion rate.
Sampling Units CodeStatisticp-Value
AGR_MR0.910.42
AGR_SR0.900.38
FOR_MR0.890.30
FOR_SR0.940.69
RAN_MR0.960.82
RAN_SR0.970.87
Table A3. Levene Test for homogeneity of the variance test.
Variabledf1df2Statisticp-Value
Pi14440.760.70
If14441.360.22
Kr14441.340.23
Er5301.090.39
Table A4. Comparison of land use types and their effect on initial abstraction.
Group1Group2EstimateConf.lowConf.highp.adjp.adj.signif
ARB_MRDFO_MR74.2869.3179.250.00****
ARB_MRDFO_SR74.2869.3179.250.00****
ARB_MRFAL_MR4.44−0.539.410.12ns
ARB_MRCER_SR3.14−1.838.110.60ns
ARB_MRFAL_SR2.97−2.007.950.68ns
ARB_MRMDF_SR2.96−2.017.940.69ns
ARB_MRRAN_MR−1.83−6.142.480.96ns
ARB_MRRAN_SR−1.92−6.893.050.98ns
ARB_MRWLA_SR−1.62−5.922.690.99ns
ARB_MRCER_MR1.81−3.166.790.99ns
ARB_MRSPS_MR−1.59−6.563.381.00ns
ARB_MRMDF_MR1.30−3.676.281.00ns
ARB_MRREF_SR0.69−4.285.671.00ns
ARB_MRWLA_MR0.56−4.415.531.00ns
CER_MRDFO_MR72.4767.4977.440.00****
CER_MRDFO_SR72.4767.4977.440.00****
CER_MRRAN_MR−3.64−7.950.660.17ns
CER_MRWLA_SR−3.43−7.730.880.25ns
CER_MRRAN_SR−3.73−8.711.240.33ns
CER_MRSPS_MR−3.40−8.381.570.47ns
CER_MRFAL_MR2.63−2.357.600.83ns
CER_MRCER_SR1.33−3.656.301.00ns
CER_MRFAL_SR1.16−3.816.131.00ns
CER_MRMDF_MR−0.51−5.484.461.00ns
CER_MRMDF_SR1.15−3.826.121.00ns
CER_MRREF_SR−1.12−6.093.851.00ns
CER_MRWLA_MR−1.25−6.233.721.00ns
CER_SRDFO_MR71.1466.1776.110.00****
CER_SRDFO_SR71.1466.1776.110.00****
CER_SRRAN_MR−4.97−9.28−0.660.01*
CER_SRWLA_SR−4.76−9.06−0.450.02*
CER_SRRAN_SR−5.06−10.03−0.090.04*
CER_SRSPS_MR−4.73−9.700.240.08ns
CER_SRWLA_MR−2.58−7.552.390.85ns
CER_SRREF_SR−2.45−7.422.530.89ns
CER_SRMDF_MR−1.84−6.813.140.99ns
CER_SRFAL_MR1.30−3.676.271.00ns
CER_SRFAL_SR−0.17−5.144.811.00ns
CER_SRMDF_SR−0.18−5.154.801.00ns
****: Extremely significant; *: Significant; ns: Not significant.
Table A5. Comparison of land use types and their effect on final infiltration.
Group1Group2EstimateConf.lowConf.highp.adjp.adj.signif
ARB_MRRAN_MR−31.25−36.71−25.800.00****
ARB_MRRAN_SR−43.25−49.55−36.950.00****
ARB_MRSPS_MR−25.93−32.23−19.630.00****
ARB_MRWLA_SR−23.14−28.60−17.680.00****
ARB_MRWLA_MR−18.29−24.59−11.990.00****
ARB_MRREF_SR−15.51−21.81−9.210.00****
ARB_MRFAL_SR−12.56−18.86−6.260.00****
ARB_MRFAL_MR−9.52−15.82−3.220.00***
ARB_MRDFO_MR7.641.3413.940.01**
ARB_MRDFO_SR7.641.3413.940.01**
ARB_MRCER_SR−7.51−13.81−1.210.01**
ARB_MRCER_MR−5.35−11.650.950.17ns
ARB_MRMDF_MR2.48−3.828.780.98ns
ARB_MRMDF_SR1.58−4.727.881.00ns
CER_MRRAN_MR−25.90−31.36−20.440.00****
CER_MRRAN_SR−37.89−44.19−31.590.00****
CER_MRSPS_MR−20.57−26.87−14.270.00****
CER_MRWLA_SR−17.79−23.24−12.330.00****
CER_MRDFO_MR12.996.6919.290.00****
CER_MRDFO_SR12.996.6919.290.00****
CER_MRWLA_MR−12.94−19.24−6.640.00****
CER_MRREF_SR−10.15−16.46−3.850.00****
CER_MRMDF_MR7.831.5314.130.00**
CER_MRFAL_SR−7.20−13.50−0.900.01*
CER_MRMDF_SR6.930.6313.230.02*
CER_MRFAL_MR−4.17−10.472.130.53ns
CER_MRCER_SR−2.15−8.454.150.99ns
CER_SRRAN_MR−23.75−29.20−18.290.00****
CER_SRRAN_SR−35.74−42.04−29.440.00****
CER_SRSPS_MR−18.42−24.72−12.120.00****
CER_SRWLA_SR−15.63−21.09−10.180.00****
CER_SRDFO_MR15.148.8421.440.00****
CER_SRDFO_SR15.148.8421.440.00****
CER_SRWLA_MR−10.78−17.08−4.480.00****
CER_SRMDF_MR9.993.6916.290.00***
CER_SRMDF_SR9.082.7815.380.00***
CER_SRREF_SR−8.00−14.30−1.700.00**
CER_SRFAL_SR−5.05−11.351.250.24ns
CER_SRFAL_MR−2.02−8.324.281.00ns
****: Extremely significant; ***: Extremely significant; **: Very significant; *: Significant; ns: Not significant.
Table A6. Comparison of land use types and their effect on runoff coefficient.
Group1Group2EstimateConf.lowConf.highp.adjp.adj.signif
ARB_MRCER_MR−0.27−9.398.861.00ns
ARB_MRCER_SR6.76−2.3715.890.35ns
ARB_MRDFO_MR−7.39−16.521.740.23ns
ARB_MRDFO_SR−7.39−16.521.740.23ns
ARB_MRFAL_MR13.544.4122.670.00***
ARB_MRFAL_SR13.184.0522.310.00***
ARB_MRMDF_MR−5.18−14.313.950.75ns
ARB_MRMDF_SR−3.69−12.825.440.97ns
ARB_MRRAN_MR38.6930.7846.590.00****
ARB_MRRAN_SR54.3345.2063.450.00****
ARB_MRREF_SR19.1910.0628.310.00****
ARB_MRSPS_MR31.4622.3440.590.00****
ARB_MRWLA_MR21.8512.7230.970.00****
ARB_MRWLA_SR27.3119.4135.220.00****
CER_MRCER_SR7.02−2.1016.150.29ns
CER_MRDFO_MR−7.12−16.252.010.27ns
CER_MRDFO_SR−7.12−16.252.010.27ns
CER_MRFAL_MR13.814.6822.940.00***
CER_MRFAL_SR13.444.3222.570.00***
CER_MRMDF_MR−4.91−14.044.220.81ns
CER_MRMDF_SR−3.43−12.555.700.99ns
CER_MRRAN_MR38.9531.0546.860.00****
CER_MRRAN_SR54.5945.4663.720.00****
CER_MRREF_SR19.4510.3228.580.00****
CER_MRSPS_MR31.7322.6040.860.00****
CER_MRWLA_MR22.1112.9831.240.00****
CER_MRWLA_SR27.5819.6735.490.00****
CER_SRDFO_MR−14.15−23.27−5.020.00***
CER_SRDFO_SR−14.15−23.27−5.020.00***
CER_SRFAL_MR6.78−2.3515.910.34ns
CER_SRFAL_SR6.42−2.7115.550.43ns
CER_SRMDF_MR−11.94−21.06−2.810.00**
CER_SRMDF_SR−10.45−19.58−1.320.01*
CER_SRRAN_MR31.9324.0239.830.00****
CER_SRRAN_SR47.5738.4456.700.00****
CER_SRREF_SR12.433.3021.560.00**
CER_SRSPS_MR24.7115.5833.840.00****
CER_SRWLA_MR15.095.9624.220.00****
CER_SRWLA_SR20.5612.6528.460.00****
****: Extremely significant; ***: Extremely significant; **: Very significant; *: Significant; ns: Not significant.
Table A7. Comparison of land use types and their effect on erosion rate.
Group1Group2EstimateConf.lowConf.highp.adjp.adj.signif
AGR_MRRAN_SR−10.68−19.34−2.020.01**
AGR_MRFOR_MR3.54−4.8111.890.79ns
AGR_MRAGR_SR2.10−6.5610.760.98ns
AGR_MRRAN_MR1.57−7.0910.230.99ns
AGR_MRFOR_SR1.34−7.7510.421.00ns
AGR_SRRAN_SR−12.78−21.44−4.120.00**
AGR_SRFOR_MR1.44−6.919.781.00ns
AGR_SRFOR_SR−0.76−9.858.321.00ns
AGR_SRRAN_MR−0.53−9.198.131.00ns
**: Very significant; ns: Not significant.

References

  1. Bruins, H.J. Ancient desert agriculture in the Negev and climate-zone boundary changes during average, wet and drought years. J. Arid Environ. 2012, 86, 28–42. [Google Scholar] [CrossRef]
  2. Tarolli, P.; Preti, F.; Romano, N. Terraced landscapes: From an old best practice to a potential hazard for soil degradation due to land abandonment. Anthropocene 2014, 6, 10–25. [Google Scholar] [CrossRef]
  3. Stavi, I.; Rahamim, S.; Gidon, R.; Judith, L. Ancient to Recent-Past Runoff Harvesting Agriculture in Recharge Playas of the Hyper-Arid Southern Israel. Water 2017, 9, 991. [Google Scholar] [CrossRef] [Green Version]
  4. Wei, W.; Chen, D.; Wang, L.; Daryanto, S.; Chen, L.; Yu, Y. Global synthesis of the classifications, distributions, benefits and issues of terracing. Earth-Sci. Rev. 2016, 159, e388–e403. [Google Scholar] [CrossRef] [Green Version]
  5. Arnáez, J.; Lana-Renault, N.; Lasanta, T.; Ruiz-Flaño, P.; Castroviejo, J. Effects of farming terraces on hydrological and geomorphological processes. A review. Catena 2015, 128, 122–134. [Google Scholar] [CrossRef] [Green Version]
  6. Jiao, Y.; Liang, L.; Takeuchi, K.; Okuro, T.; Zhang, D.; Sun, L. Indigenous ecological knowledge and natural resource management in the cultural landscape of China’s Hani Terraces. Ecol. Res. 2012, 27, 247–263. [Google Scholar] [CrossRef]
  7. Li, J.; Min, Q.; Li, W.; Bai, Y.; Lun, Y.; Bijaya, G.C.D. Evaluation of water resources conserved by forests in the Hani Rice Terraces System of Honghe County, Yunnan, China: An application of the fuzzy comprehensive evaluation model. J. Mt. Sci. 2016, 13, 744–753. [Google Scholar] [CrossRef]
  8. Miao, J.; Yang, W.; Yang, B.; Ma, Y.; Huang, G. Evaluating the ecosystem services of Chongyi Hakka Terraces in Gannan, Jiangxi Province. J. Nat. Res. 2016, 31, 1817–1831. [Google Scholar]
  9. Chen, D.; Wei, W.; Chen, L.; Yun, Y. Progress of the ecosystem services and management of terraces. J. Mt. Sci. 2016, 34, 374–384. [Google Scholar]
  10. Kosmowski, F. Soil water management practices (terraces) helped to mitigate the 2015 drought in Ethiopia. Agric. Water Manag. 2018, 204, 11–16. [Google Scholar] [CrossRef]
  11. Petit, C.; Konold, W.; Höchtl, F. Historic terraced vineyards: Impressive witnesses of vernacular architecture. Landsc. Hist. 2012, 33, 5–28. [Google Scholar] [CrossRef]
  12. Varotto, M.; Bonardi, L.; Tarolli, P. World Terraced Landscapes: History, Environment, Quality of Life; Springer: Cham, Switzerland, 2019; pp. 1–357. [Google Scholar] [CrossRef]
  13. Verheijen, F.G.A.; Jones, R.J.A.; Rickson, R.J.; Smith, C.J. Tolerable versus actual soil erosion rates in Europe. Earth-Sci. Rev. 2009, 94, 23–38. [Google Scholar] [CrossRef] [Green Version]
  14. Peng, T.; Wang, S.J. Effects of land use, land cover and rainfall regimes on the surface runoff and soil loss on karst slopes in southwest China. Catena 2012, 90, 53–62. [Google Scholar] [CrossRef]
  15. Zhang, L.; Wang, J.M.; Bai, Z.K.; Lv, C. Effects of vegetation on runoff and soil erosion on reclaimed land in an opencast coalmine dump in a loess area. Catena 2015, 128, 44–53. [Google Scholar] [CrossRef]
  16. Wen, Y.; Kasielke, T.; Li, H.; Zhang, B.; Zepp, H. May agricultural terraces induce gully erosion? A case study from the Black soil region of northeast China. Sci. Total Environ. 2020, 750, 141715. [Google Scholar] [CrossRef] [PubMed]
  17. Liu, S.L.; Dong, Y.H.; Li, D.; Liu, Q.; Wang, J.; Zhang, X.L. Effects of different terrace protection measures in a sloping land consolidation project targeting soil erosion at the slope scale. Ecol. Eng. 2013, 53, 46–53. [Google Scholar] [CrossRef]
  18. Moraetis, D.; Nikolaidis, N.P.; Paranychianakis, N.; Rousseva, S.; Kercheva, M.; Nenov, M. Soil genesis, evolution, and properties in the koiliaris river watershedcritical zone observatory. J. Soil Sediment. 2015, 15, 347–364. [Google Scholar] [CrossRef]
  19. Ziyadi, M.; Dahbi, A.; Aitlhaj, A.; El Ouahrani, A.; El Ouahidi, A.; Achtak, H. Terraced Agroforestry Systems in West Anti-Atlas (Morocco): Incidence of Climate Change and Prospects for Sustainable Development. Climate Change-Resilient Agriculture and Agroforestry; Springer: Berlin/Heidelberg, Germany, 2019; pp. 1–19. [Google Scholar] [CrossRef]
  20. Piccarreta, M.; Pasini, A.; Capolongo, D.; Lazzari, M. Changes in daily precipitation extremes in the Mediterranean from 1951 to 2010: The Basilicata region, southern Italy. Int. J. Climatol. 2013, 33, 3229–3248. [Google Scholar] [CrossRef]
  21. Cevasco, A.; Brandolini, P. Rapid debris volume estimation by LiDAR data derived DEMs: Applications to the 25 October 2011 debris flood event at Vernazza (Cinque Terre, Italy). Rend. Online Della Soc. Geol. Ital. 2015, 35, 62–65. [Google Scholar] [CrossRef]
  22. Piccarreta, M.; Capolongo, D.; Boenzi, F.; Bentivenga, M. Implications of decadal changes in precipitation and land use policy to soil erosion in Basilicata, Italy. Catena 2006, 65, 138–151. [Google Scholar] [CrossRef]
  23. Vergari, F.; Della Seta, M.; Del Monte, M.; Fredi, P.; Lupia Palmieri, E. Long- and short-term evolution of several Mediterranean denudation hot spots: The role of rainfall variations and human impact. Geomorphology 2013, 183, 14–27. [Google Scholar] [CrossRef]
  24. Salvati, L.; Bajocco, S. Land sensitivity to desertification across Italy. Past, present and future. Appl. Geogr. 2011, 31, 223–231. [Google Scholar] [CrossRef]
  25. Sabir, M. The Terraces of the Anti-Atlas: From Abandonment to the Risk of Degradation of a Landscape Heritage. Water 2021, 13, 510. [Google Scholar] [CrossRef]
  26. Modeste, M.; Abdellatif, K.; Nadia, M.; Zhang, H. Cartographie Des Risques De L’érosion Hydrique Par L’équation Universelle Révisée Des Pertes En Sols, La Télédétection Et Les SIG Dans Le Bassin Versant De L’ourika (Haut Atlas, Maroc). Eur. Sci. J. ESJ 2016, 12, 277. [Google Scholar] [CrossRef] [Green Version]
  27. Roose, E. Méthodes de mesure des états de surface du sol, de la rugosité et des autres caractéristiques qui peuvent aider au diagnostic de terrain des risques de ruissellement et d’érosion, en particulier sur les versants cultivés des montagnes. Bull Réseau Eros. 1996, 16, 87–97. [Google Scholar]
  28. Modeste, M.; Nouira, A.; Benmansour, M.; Boulmane, M.; Khattabi, A.; Mhammdi, N.; Benkdad, A. Assessment of soil erosion rates in a Mediterranean cultivated and uncultivated soils using fallout 137Cs. J. Environ. Radioact. 2019, 208–209, 106021. [Google Scholar] [CrossRef]
  29. Walling, D.E.; He, Q.; Zhang, Y. Conversion models and related software. In Guidelines for Using Fallout Radionuclides to Assess Erosion and Effectiveness of Soil Conservation Strategies. IAEA-TECDOC-1741; IAEA Publication: Vienna, Austria, 2014; pp. 125–148. [Google Scholar]
  30. Walling, D.E.; He, Q.; Appleby, P.G. Conversion models for use in soilerosion, soilredistribution and sedimentation investigations. In Handbook for the Assessment of Soil Erosion and Sedimentation Using Environmental Radionuclides; Zapata, F., Ed.; Kluwer: Dordrecht, The Netherlands, 2002; pp. 111–164. [Google Scholar]
  31. Sabir, M.; Barthès, B.; Roose, E. Recherche d’indicateurs des risques de ruissellement et d’érosion sur les principaux sols des montagnes méditerranéennes du rif occidental (Maroc). Sécheresse 2004, 15, 105–110. [Google Scholar]
  32. Cammeraat, E.; van Beek, R.; Kooijman, A. Vegetation succession and its consequences for slope stability in SE Spain. Plant Soil 2005, 278, 135–147. [Google Scholar] [CrossRef]
  33. Araya, T.; Cornelis, W.M.; Nyssen, J.; Govaerts, B.; Bauer, H.; Gebreegziabher, T.; Oicha, T.; Raes, D.; Sayre, K.D.; Haile, M.; et al. Effects of conservation agriculture on runoff, soil loss and crop yield under rainfed conditions in Tigray, Northern Ethiopia. Soil Use Manag. 2011, 27, 404–414. [Google Scholar] [CrossRef]
  34. Tian, M.; Min, Q.; Jiao, W.; Yuan, Z.; Fuller, A.M.; Yang, L.; Zhang, Y.; Zhou, J.; Cheng, B. Agricultural Heritage Systems Tourism: Definition, characteristics and development framework. J. Mt. Sci. 2016, 13, 440–454. [Google Scholar] [CrossRef]
  35. Zhang, Q.; Song, C.; Chen, X. Effects of China’s payment for ecosystem services programs on cropland abandonment: A case study in Tiantangzhai Township, Anhui. China. Land Use Policy 2018, 73, 239–248. [Google Scholar] [CrossRef]
  36. Brandolini, P.; Cevasco, A.; Capolongo, D.; Pepe, G.; Lovergine, F.; Del Monte, M. Response of Terraced Slopes to a Very Intense Rainfall Event and Relationships with Land Abandonment: A Case Study from Cinque Terre (Italy). Land Degrad. Dev. 2017, 29, 630–642. [Google Scholar] [CrossRef]
Figure 1. Location of the study area in the High Atlas region of Morocco.
Earth 02 00044 g001
Figure 2. (a,b) Examples of cultivated terraced landscapes upstream of the Ourika watershed; (c) Flooding at a tourist spot downstream of the Ourika watershed; (d) Riverbed downstream of the Ourika watershed following a flood event (all photos by GIREPSE project).
Earth 02 00044 g002aEarth 02 00044 g002b
Table 1. Sampling units for the corresponding land use/land cover (LULC) types.
LULCGeologySampling Units CodeNumber of Samples
Agriculture (AGR)ArboricultureMagmatic rockARB_MR3
Cereal farmingMagmatic rockCER_MR3
Cereal farmingSedimentary rockCER_SR3
Forest (FOR)Dense forestMagmatic rockDFO_MR5
Dense forestSedimentary rockDFO_SR5
Fallow (FAL)FallowMagmatic rockFAL_MR3
FallowSedimentary rockFAL_SR3
Forest (FOR)Moderately dense forestMagmatic rockMDF_MR5
Moderately dense forestSedimentary rockMDF_SR5
Rangeland (RAN)RangelandMagmatic rockRAN_MR3
RangelandSedimentary rockRAN_SR6
Reforestation (REF)ReforestationSedimentary rockREF_SR3
Rangeland (RAN)Spiny high-mountain xerophytesMagmatic rockSPS_MR3
Forest (FOR)Wood landMagmatic rockWLA_MR3
Wood landSedimentary rockWLA_SR6
Table 2. Soil samples collected from the different land uses in the Ourika watershed.
LULCGeologySampling Units CodeNumber of Samples
Agriculture (AGR)Magmatic rockAGR_MR6
Sedimentary rockAGR_SR6
Forest (FOR)Magmatic rockFOR_MR7
Sedimentary rockFOR_SR5
Rangeland (RAN)Magmatic rockRAN_MR6
Sedimentary rockRAN_SR6
Table 3. Descriptive statistics of initial abstraction (mm) under different LULC.
Sampling Units CodenMinMaxMedianInterquartile RangeMeanSD
ARB_MR32.484.963.721.243.721.24
CER_MR34.806.005.800.605.530.64
CER_SR33.608.828.162.616.862.84
DFO_MR575.0080.0079.002.5078.002.65
DFO_SR575.0080.0079.002.5078.002.65
FAL_MR36.809.528.161.368.161.36
FAL_SR32.409.528.163.566.693.78
MDF_MR53.786.255.041.245.021.24
MDF_SR56.257.506.300.636.680.71
RAN_MR61.252.541.901.241.890.68
RAN_SR31.302.601.500.651.800.70
REF_SR32.526.704.022.094.412.12
SPS_MR31.252.602.540.682.130.76
WLA_MR33.785.044.020.634.280.67
WLA_SR61.202.602.520.972.110.68
Table 4. Descriptive statistics of final infiltration (mm/h) under different LULC.
Sampling Units CodenMinMaxMedianInterquartile RangeMeanSD
ARB_MR369.7570.8570.500.5570.360.56
CER_MR364.8265.2764.950.2365.010.23
CER_SR361.8864.2062.491.1662.861.20
DFO_MR575.0080.0079.002.5078.002.65
DFO_SR575.0080.0079.002.5078.002.65
FAL_MR360.2761.3960.860.5660.840.56
FAL_SR355.4959.4758.461.9957.812.07
MDF_MR571.7773.6973.080.9672.850.98
MDF_SR571.4772.6871.680.6171.940.65
RAN_MR633.7943.9040.505.7439.114.11
RAN_SR324.7830.2526.332.7427.122.82
REF_SR354.4555.1055.030.3354.860.36
SPS_MR344.2344.6544.430.2244.440.22
WLA_MR350.3854.0651.791.8452.081.86
WLA_SR645.2449.6947.121.0947.231.49
Table 5. Descriptive statistics for runoff coefficient (%) under different LULC.
Sampling Units CodenMinMaxMedianInterquartile RangeMeanSD
ARB_MR37.748.838.590.548.390.57
CER_MR37.888.278.210.208.120.21
CER_SR310.7020.4814.264.8915.154.95
DFO_MR50.002.001.001.001.001.00
DFO_SR50.002.001.001.001.001.00
FAL_MR321.2622.7121.820.7321.930.73
FAL_SR317.6423.9823.083.1721.573.43
MDF_MR52.514.202.920.853.210.88
MDF_SR54.445.064.590.314.700.33
RAN_MR640.0954.1146.055.8947.075.12
RAN_SR358.8865.7663.503.4462.713.51
REF_SR324.6529.6128.472.4827.572.60
SPS_MR335.9241.9341.713.0139.853.41
WLA_MR329.4730.6530.580.5930.230.67
WLA_SR631.5441.2335.204.7735.703.67
Table 6. Descriptive statistics soil erosion rate (t/ha/year) under different LULC.
Sampling Units CodenMinMaxMedianInterquartile RangeMeanSD
AGR_MR6−18.36−0.06−5.076.54−6.616.67
AGR_SR6−11.482.27−5.139.20−4.505.77
FOR_MR7−8.460.36−1.404.83−3.073.36
FOR_SR5−11.462.52−7.227.26−5.275.68
RAN_MR6−8.08−1.14−5.662.56−5.042.47
RAN_SR6−25.15−11.49−17.074.55−17.284.76
Table 7. ANOVA table.
VariableDFnDFdFp-Value
Pi1444738.4617.02 × 10−40
If1444169.2821.75 × 10−28
Kr1444126.5532.91 × 10−26
Er5306.7330.000258
Publisher’s Note: MDPI stays neutral with regard to jurisdictional claims in published maps and institutional affiliations.

